Midvale, UT Map & Demographics
Midvale Map
Midvale Overview
$36,500
PER CAPITA INCOME
$79,281
AVG FAMILY INCOME
$70,742
AVG HOUSEHOLD INCOME
16.6%
WAGE / INCOME GAP [ % ]
83.4¢/ $1
WAGE / INCOME GAP [ $ ]
0.41
INEQUALITY / GINI INDEX
35,609
TOTAL POPULATION
18,190
MALE POPULATION
17,419
FEMALE POPULATION
104.43
MALES / 100 FEMALES
95.76
FEMALES / 100 MALES
32.7
MEDIAN AGE
3.0
AVG FAMILY SIZE
2.4
AVG HOUSEHOLD SIZE
21,449
LABOR FORCE [ PEOPLE ]
75.3%
PERCENT IN LABOR FORCE
3.0%
UNEMPLOYMENT RATE
Midvale Zip Codes
Midvale Area Codes
Income in Midvale
Income Overview in Midvale
Per Capita Income in Midvale is $36,500, while median incomes of families and households are $79,281 and $70,742 respectively.
| Characteristic | Number | Measure |
| Per Capita Income | 35,609 | $36,500 |
| Median Family Income | 8,804 | $79,281 |
| Mean Family Income | 8,804 | $101,233 |
| Median Household Income | 14,871 | $70,742 |
| Mean Household Income | 14,871 | $86,158 |
| Income Deficit | 8,804 | $0 |
| Wage / Income Gap (%) | 35,609 | 16.58% |
| Wage / Income Gap ($) | 35,609 | 83.42¢ per $1 |
| Gini / Inequality Index | 35,609 | 0.41 |
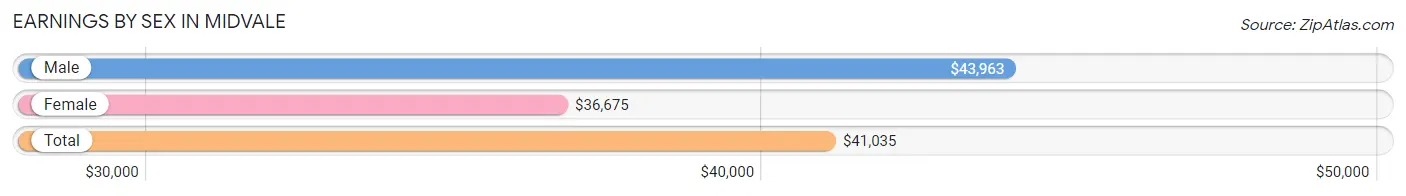
Earnings by Sex in Midvale
Average Earnings in Midvale are $41,035, $43,963 for men and $36,675 for women, a difference of 16.6%.
| Sex | Number | Average Earnings |
| Male | 12,154 (54.7%) | $43,963 |
| Female | 10,079 (45.3%) | $36,675 |
| Total | 22,233 (100.0%) | $41,035 |
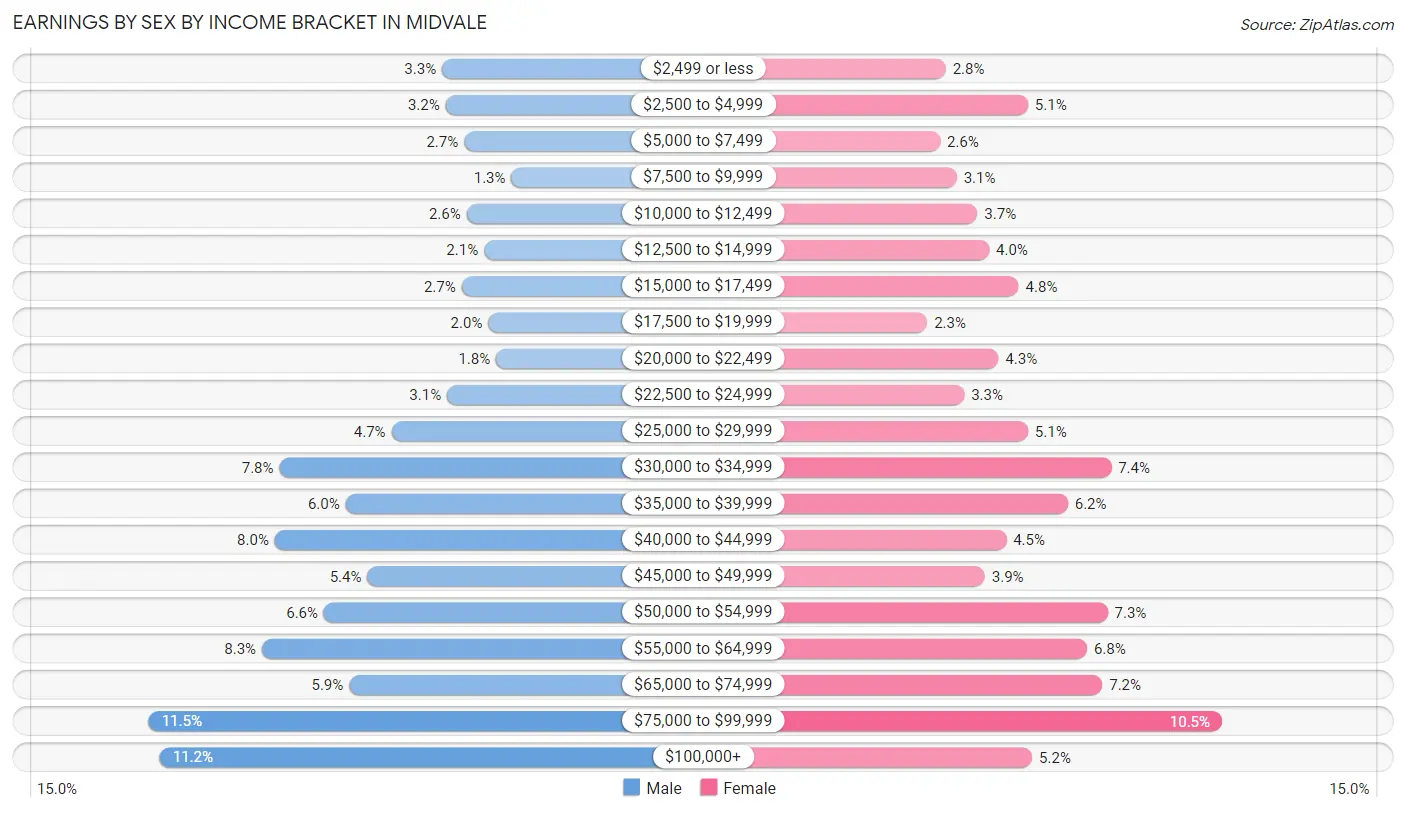
Earnings by Sex by Income Bracket in Midvale
The most common earnings brackets in Midvale are $75,000 to $99,999 for men (1,399 | 11.5%) and $75,000 to $99,999 for women (1,062 | 10.5%).
| Income | Male | Female |
| $2,499 or less | 398 (3.3%) | 280 (2.8%) |
| $2,500 to $4,999 | 385 (3.2%) | 513 (5.1%) |
| $5,000 to $7,499 | 322 (2.6%) | 264 (2.6%) |
| $7,500 to $9,999 | 160 (1.3%) | 311 (3.1%) |
| $10,000 to $12,499 | 313 (2.6%) | 370 (3.7%) |
| $12,500 to $14,999 | 254 (2.1%) | 403 (4.0%) |
| $15,000 to $17,499 | 330 (2.7%) | 487 (4.8%) |
| $17,500 to $19,999 | 239 (2.0%) | 228 (2.3%) |
| $20,000 to $22,499 | 213 (1.8%) | 429 (4.3%) |
| $22,500 to $24,999 | 380 (3.1%) | 333 (3.3%) |
| $25,000 to $29,999 | 570 (4.7%) | 513 (5.1%) |
| $30,000 to $34,999 | 953 (7.8%) | 749 (7.4%) |
| $35,000 to $39,999 | 727 (6.0%) | 626 (6.2%) |
| $40,000 to $44,999 | 969 (8.0%) | 452 (4.5%) |
| $45,000 to $49,999 | 653 (5.4%) | 391 (3.9%) |
| $50,000 to $54,999 | 801 (6.6%) | 739 (7.3%) |
| $55,000 to $64,999 | 1,012 (8.3%) | 680 (6.8%) |
| $65,000 to $74,999 | 715 (5.9%) | 724 (7.2%) |
| $75,000 to $99,999 | 1,399 (11.5%) | 1,062 (10.5%) |
| $100,000+ | 1,361 (11.2%) | 525 (5.2%) |
| Total | 12,154 (100.0%) | 10,079 (100.0%) |
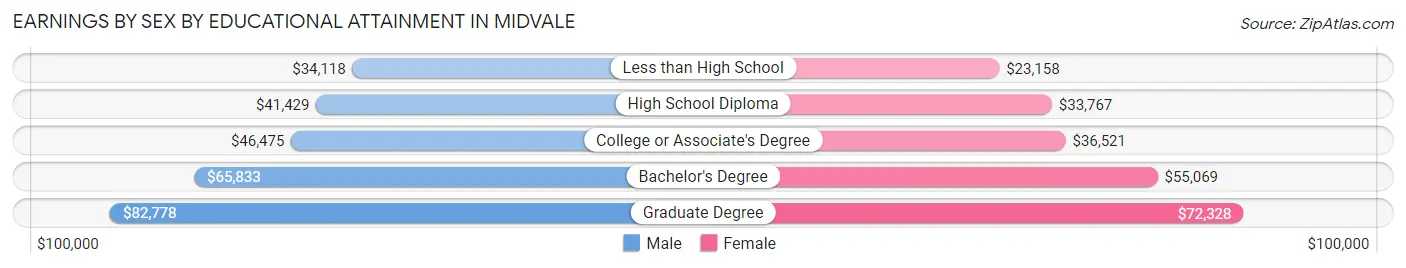
Earnings by Sex by Educational Attainment in Midvale
Average earnings in Midvale are $49,063 for men and $42,238 for women, a difference of 13.9%. Men with an educational attainment of graduate degree enjoy the highest average annual earnings of $82,778, while those with less than high school education earn the least with $34,118. Women with an educational attainment of graduate degree earn the most with the average annual earnings of $72,328, while those with less than high school education have the smallest earnings of $23,158.
| Educational Attainment | Male Income | Female Income |
| Less than High School | $34,118 | $23,158 |
| High School Diploma | $41,429 | $33,767 |
| College or Associate's Degree | $46,475 | $36,521 |
| Bachelor's Degree | $65,833 | $55,069 |
| Graduate Degree | $82,778 | $72,328 |
| Total | $49,063 | $42,238 |
Family Income in Midvale
Family Income Brackets in Midvale
According to the Midvale family income data, there are 1,787 families falling into the $50,000 to $74,999 income range, which is the most common income bracket and makes up 20.3% of all families. Conversely, the $10,000 to $14,999 income bracket is the least frequent group with only 158 families (1.8%) belonging to this category.
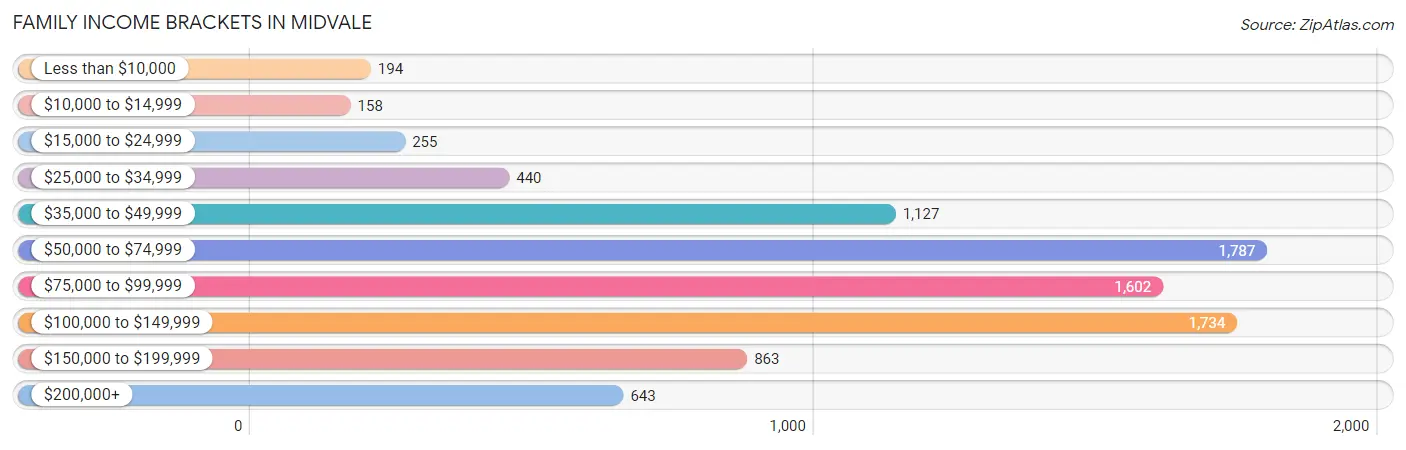
| Income Bracket | # Families | % Families |
| Less than $10,000 | 194 | 2.2% |
| $10,000 to $14,999 | 158 | 1.8% |
| $15,000 to $24,999 | 255 | 2.9% |
| $25,000 to $34,999 | 440 | 5.0% |
| $35,000 to $49,999 | 1,127 | 12.8% |
| $50,000 to $74,999 | 1,787 | 20.3% |
| $75,000 to $99,999 | 1,602 | 18.2% |
| $100,000 to $149,999 | 1,734 | 19.7% |
| $150,000 to $199,999 | 863 | 9.8% |
| $200,000+ | 643 | 7.3% |
Family Income by Famaliy Size in Midvale
6-person families (145 | 1.7%) account for the highest median family income in Midvale with $100,402 per family, while 2-person families (4,255 | 48.3%) have the highest median income of $38,335 per family member.
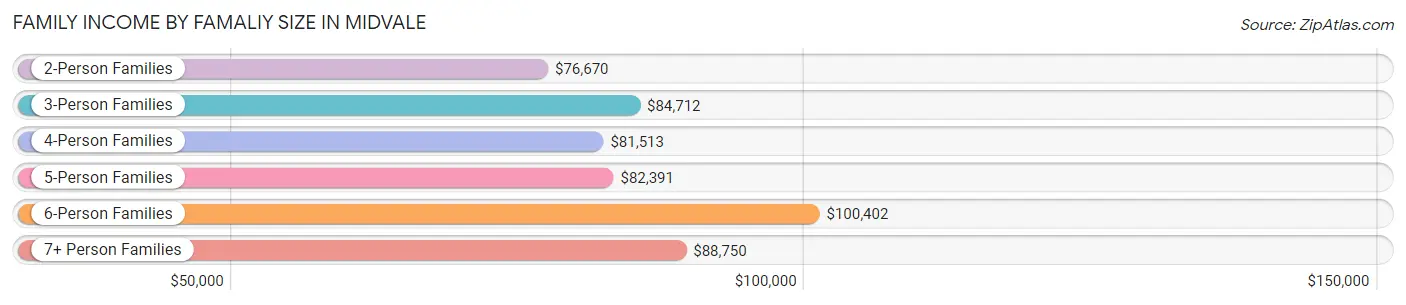
| Income Bracket | # Families | Median Income |
| 2-Person Families | 4,255 (48.3%) | $76,670 |
| 3-Person Families | 1,862 (21.1%) | $84,712 |
| 4-Person Families | 1,713 (19.5%) | $81,513 |
| 5-Person Families | 732 (8.3%) | $82,391 |
| 6-Person Families | 145 (1.7%) | $100,402 |
| 7+ Person Families | 97 (1.1%) | $88,750 |
| Total | 8,804 (100.0%) | $79,281 |
Family Income by Number of Earners in Midvale
The median family income in Midvale is $79,281, with families comprising 3+ earners (1,043) having the highest median family income of $118,355, while families with no earners (561) have the lowest median family income of $34,665, accounting for 11.8% and 6.4% of families, respectively.
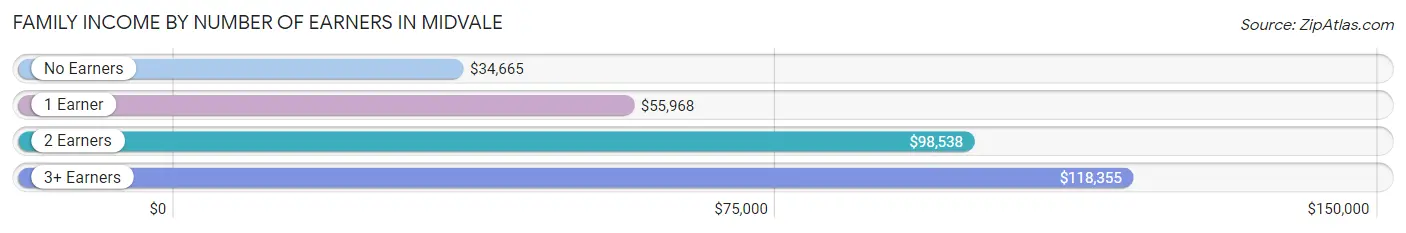
| Number of Earners | # Families | Median Income |
| No Earners | 561 (6.4%) | $34,665 |
| 1 Earner | 3,096 (35.2%) | $55,968 |
| 2 Earners | 4,104 (46.6%) | $98,538 |
| 3+ Earners | 1,043 (11.8%) | $118,355 |
| Total | 8,804 (100.0%) | $79,281 |
Household Income in Midvale
Household Income Brackets in Midvale
With 3,168 households falling in the category, the $50,000 to $74,999 income range is the most frequent in Midvale, accounting for 21.3% of all households. In contrast, only 446 households (3.0%) fall into the $10,000 to $14,999 income bracket, making it the least populous group.
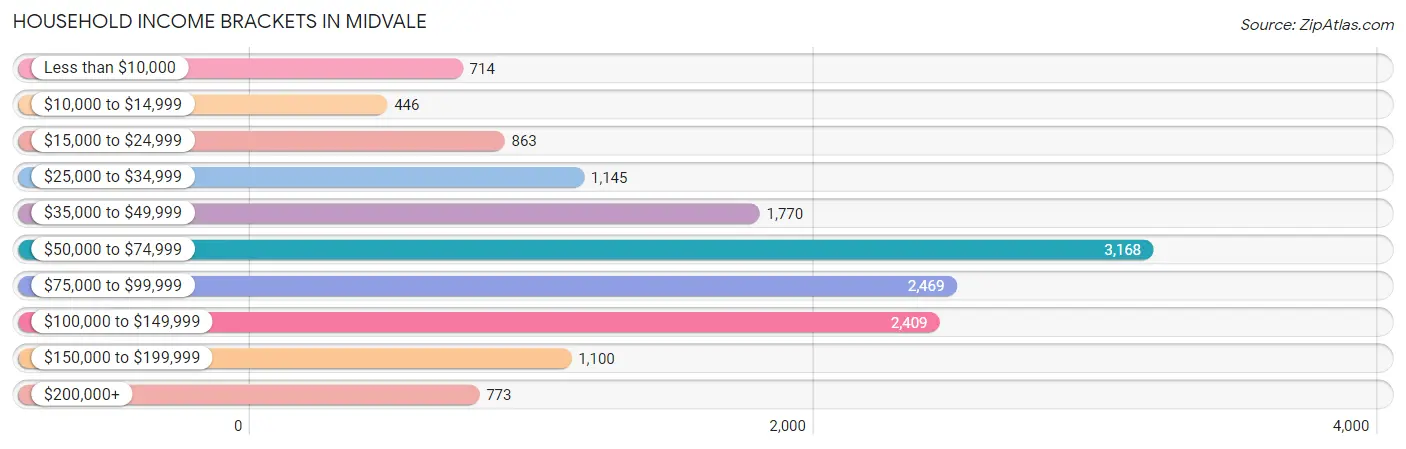
| Income Bracket | # Households | % Households |
| Less than $10,000 | 714 | 4.8% |
| $10,000 to $14,999 | 446 | 3.0% |
| $15,000 to $24,999 | 863 | 5.8% |
| $25,000 to $34,999 | 1,145 | 7.7% |
| $35,000 to $49,999 | 1,770 | 11.9% |
| $50,000 to $74,999 | 3,168 | 21.3% |
| $75,000 to $99,999 | 2,469 | 16.6% |
| $100,000 to $149,999 | 2,409 | 16.2% |
| $150,000 to $199,999 | 1,100 | 7.4% |
| $200,000+ | 773 | 5.2% |
Household Income by Householder Age in Midvale
The median household income in Midvale is $70,742, with the highest median household income of $76,080 found in the 45 to 64 years age bracket for the primary householder. A total of 4,194 households (28.2%) fall into this category. Meanwhile, the 65+ years age bracket for the primary householder has the lowest median household income of $46,108, with 2,469 households (16.6%) in this group.
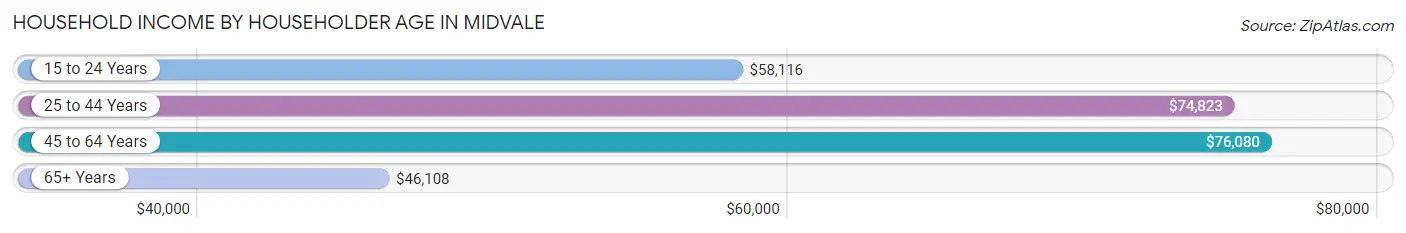
| Income Bracket | # Households | Median Income |
| 15 to 24 Years | 1,091 (7.3%) | $58,116 |
| 25 to 44 Years | 7,117 (47.9%) | $74,823 |
| 45 to 64 Years | 4,194 (28.2%) | $76,080 |
| 65+ Years | 2,469 (16.6%) | $46,108 |
| Total | 14,871 (100.0%) | $70,742 |
Poverty in Midvale
Income Below Poverty by Sex and Age in Midvale
With 9.4% poverty level for males and 11.2% for females among the residents of Midvale, 15 year old males and 5 year old females are the most vulnerable to poverty, with 40 males (34.2%) and 37 females (28.5%) in their respective age groups living below the poverty level.
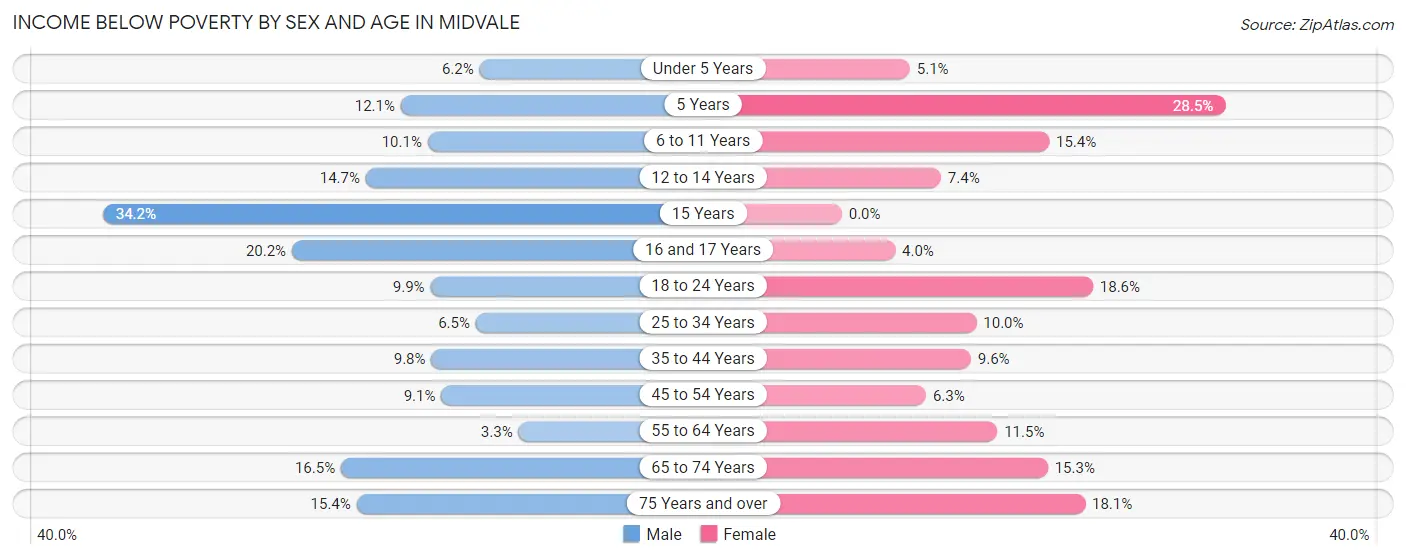
| Age Bracket | Male | Female |
| Under 5 Years | 81 (6.2%) | 60 (5.1%) |
| 5 Years | 56 (12.1%) | 37 (28.5%) |
| 6 to 11 Years | 117 (10.1%) | 207 (15.4%) |
| 12 to 14 Years | 104 (14.7%) | 39 (7.4%) |
| 15 Years | 40 (34.2%) | 0 (0.0%) |
| 16 and 17 Years | 79 (20.2%) | 21 (4.0%) |
| 18 to 24 Years | 193 (9.9%) | 310 (18.6%) |
| 25 to 34 Years | 275 (6.5%) | 379 (10.0%) |
| 35 to 44 Years | 269 (9.8%) | 277 (9.6%) |
| 45 to 54 Years | 170 (9.1%) | 86 (6.2%) |
| 55 to 64 Years | 51 (3.3%) | 219 (11.5%) |
| 65 to 74 Years | 198 (16.5%) | 207 (15.3%) |
| 75 Years and over | 74 (15.3%) | 95 (18.1%) |
| Total | 1,707 (9.4%) | 1,937 (11.2%) |
Income Above Poverty by Sex and Age in Midvale
According to the poverty statistics in Midvale, males aged 55 to 64 years and females aged 15 years are the age groups that are most secure financially, with 96.7% of males and 100.0% of females in these age groups living above the poverty line.
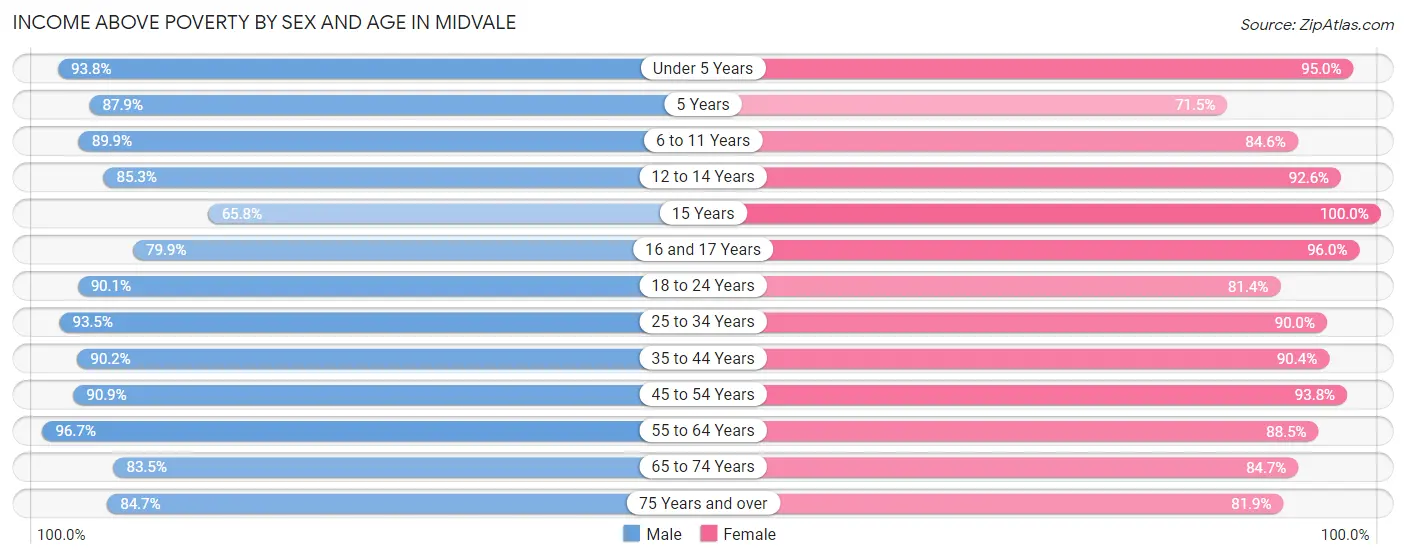
| Age Bracket | Male | Female |
| Under 5 Years | 1,222 (93.8%) | 1,128 (95.0%) |
| 5 Years | 408 (87.9%) | 93 (71.5%) |
| 6 to 11 Years | 1,045 (89.9%) | 1,138 (84.6%) |
| 12 to 14 Years | 605 (85.3%) | 491 (92.6%) |
| 15 Years | 77 (65.8%) | 129 (100.0%) |
| 16 and 17 Years | 313 (79.8%) | 509 (96.0%) |
| 18 to 24 Years | 1,762 (90.1%) | 1,353 (81.4%) |
| 25 to 34 Years | 3,958 (93.5%) | 3,416 (90.0%) |
| 35 to 44 Years | 2,476 (90.2%) | 2,615 (90.4%) |
| 45 to 54 Years | 1,707 (90.9%) | 1,290 (93.8%) |
| 55 to 64 Years | 1,481 (96.7%) | 1,679 (88.5%) |
| 65 to 74 Years | 1,001 (83.5%) | 1,147 (84.7%) |
| 75 Years and over | 408 (84.7%) | 431 (81.9%) |
| Total | 16,463 (90.6%) | 15,419 (88.8%) |
Income Below Poverty Among Married-Couple Families in Midvale
The poverty statistics for married-couple families in Midvale show that 2.7% or 154 of the total 5,724 families live below the poverty line. Families with 1 or 2 children have the highest poverty rate of 4.3%, comprising of 84 families. On the other hand, families with 3 or 4 children have the lowest poverty rate of 0.0%, which includes 0 families.
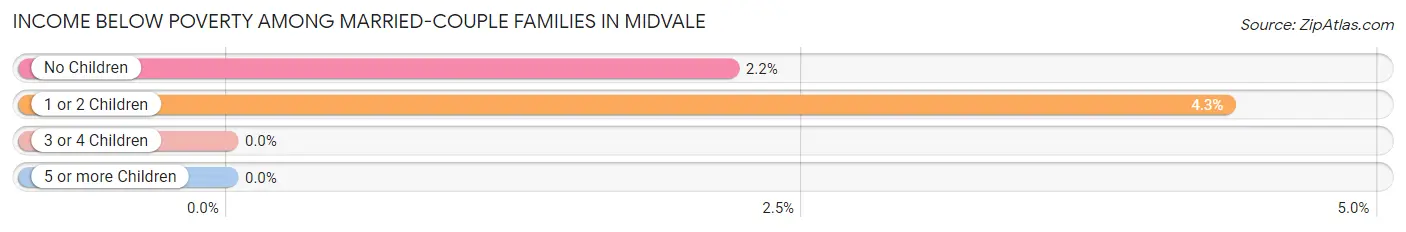
| Children | Above Poverty | Below Poverty |
| No Children | 3,140 (97.8%) | 70 (2.2%) |
| 1 or 2 Children | 1,853 (95.7%) | 84 (4.3%) |
| 3 or 4 Children | 531 (100.0%) | 0 (0.0%) |
| 5 or more Children | 46 (100.0%) | 0 (0.0%) |
| Total | 5,570 (97.3%) | 154 (2.7%) |
Income Below Poverty Among Single-Parent Households in Midvale
According to the poverty data in Midvale, 2.2% or 21 single-father households and 15.1% or 319 single-mother households are living below the poverty line. Among single-father households, those with no children have the highest poverty rate, with 21 households (5.7%) experiencing poverty. Likewise, among single-mother households, those with 5 or more children have the highest poverty rate, with 42 households (100.0%) falling below the poverty line.
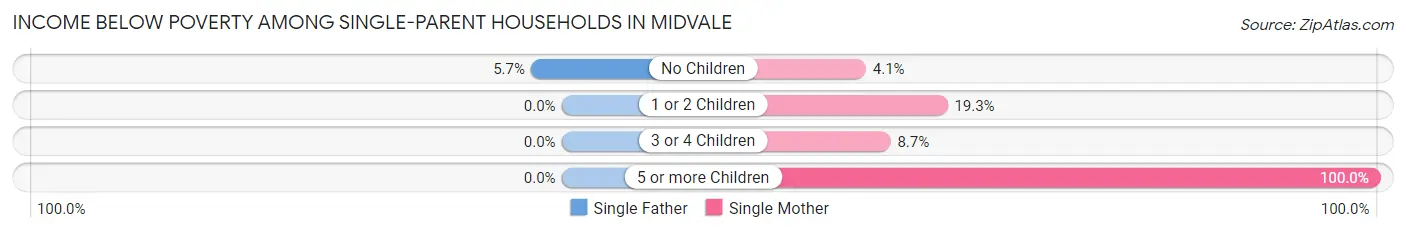
| Children | Single Father | Single Mother |
| No Children | 21 (5.7%) | 25 (4.1%) |
| 1 or 2 Children | 0 (0.0%) | 226 (19.3%) |
| 3 or 4 Children | 0 (0.0%) | 26 (8.7%) |
| 5 or more Children | 0 (0.0%) | 42 (100.0%) |
| Total | 21 (2.2%) | 319 (15.1%) |
Income Below Poverty Among Married-Couple vs Single-Parent Households in Midvale
The poverty data for Midvale shows that 154 of the married-couple family households (2.7%) and 340 of the single-parent households (11.0%) are living below the poverty level. Within the married-couple family households, those with 1 or 2 children have the highest poverty rate, with 84 households (4.3%) falling below the poverty line. Among the single-parent households, those with 5 or more children have the highest poverty rate, with 42 household (100.0%) living below poverty.
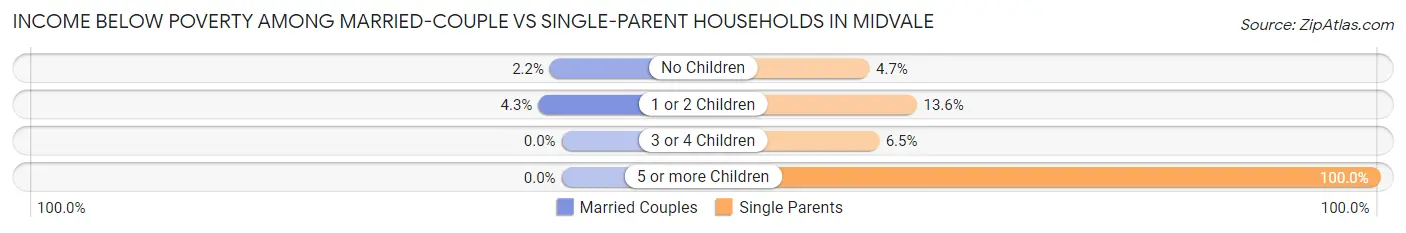
| Children | Married-Couple Families | Single-Parent Households |
| No Children | 70 (2.2%) | 46 (4.7%) |
| 1 or 2 Children | 84 (4.3%) | 226 (13.6%) |
| 3 or 4 Children | 0 (0.0%) | 26 (6.5%) |
| 5 or more Children | 0 (0.0%) | 42 (100.0%) |
| Total | 154 (2.7%) | 340 (11.0%) |
Race in Midvale
The most populous races in Midvale are White / Caucasian (25,796 | 72.4%), Hispanic or Latino (6,215 | 17.4%), and Two or more Races (3,731 | 10.5%).
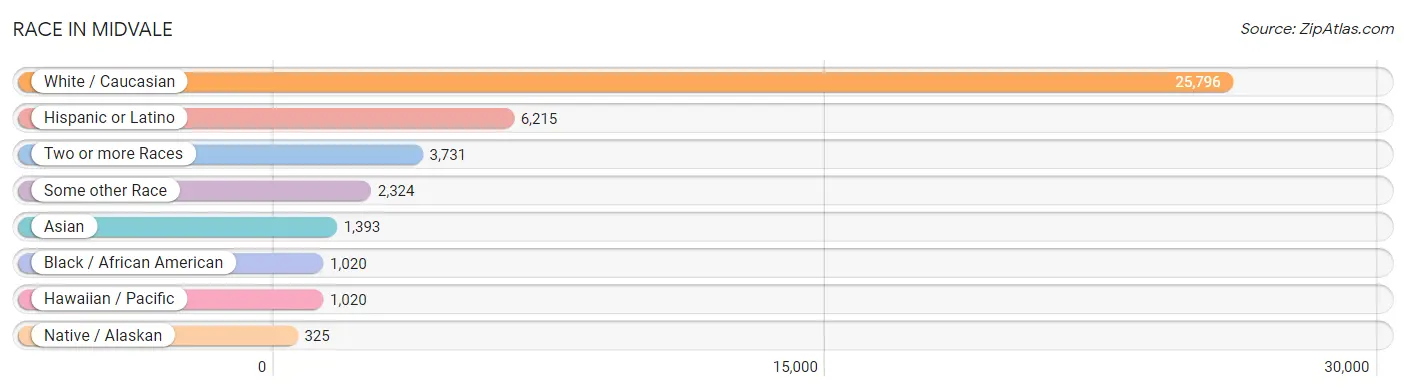
| Race | # Population | % Population |
| Asian | 1,393 | 3.9% |
| Black / African American | 1,020 | 2.9% |
| Hawaiian / Pacific | 1,020 | 2.9% |
| Hispanic or Latino | 6,215 | 17.4% |
| Native / Alaskan | 325 | 0.9% |
| White / Caucasian | 25,796 | 72.4% |
| Two or more Races | 3,731 | 10.5% |
| Some other Race | 2,324 | 6.5% |
| Total | 35,609 | 100.0% |
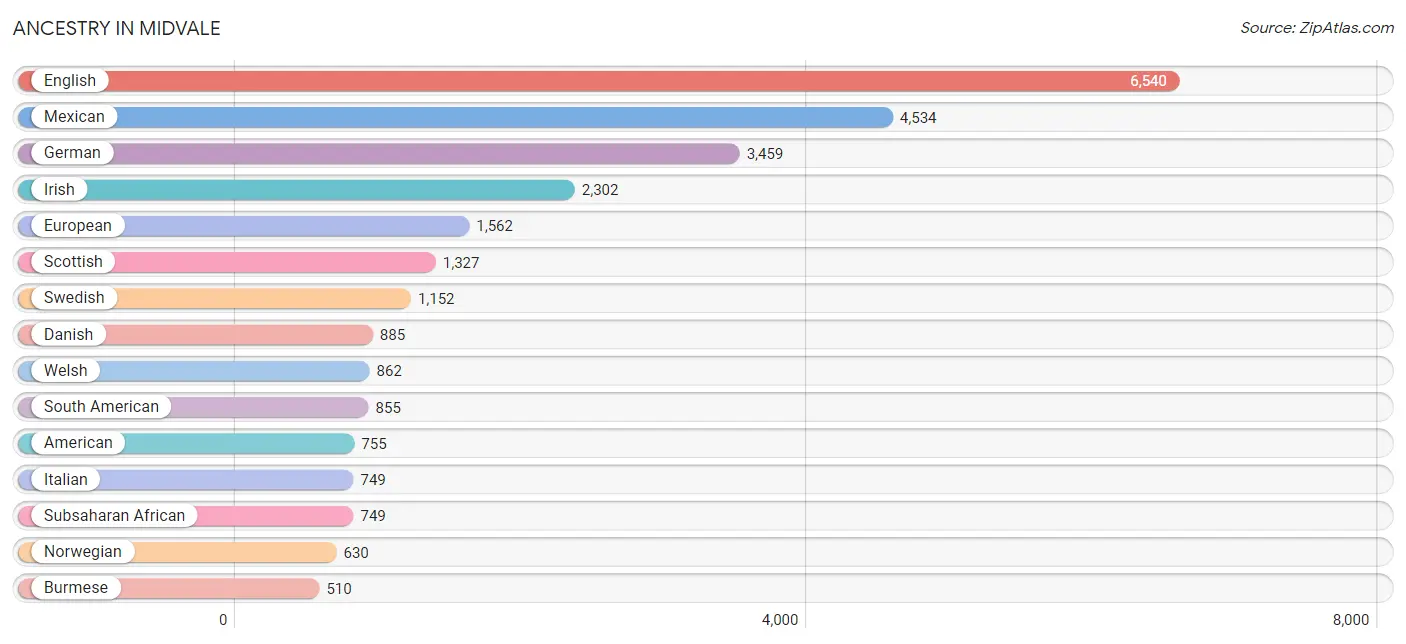
Ancestry in Midvale
The most populous ancestries reported in Midvale are English (6,540 | 18.4%), Mexican (4,534 | 12.7%), German (3,459 | 9.7%), Irish (2,302 | 6.5%), and European (1,562 | 4.4%), together accounting for 51.7% of all Midvale residents.
| Ancestry | # Population | % Population |
| Afghan | 135 | 0.4% |
| African | 381 | 1.1% |
| American | 755 | 2.1% |
| Arab | 262 | 0.7% |
| Argentinean | 58 | 0.2% |
| Armenian | 71 | 0.2% |
| Australian | 12 | 0.0% |
| Austrian | 19 | 0.1% |
| Basque | 107 | 0.3% |
| Bhutanese | 219 | 0.6% |
| Blackfeet | 12 | 0.0% |
| Bolivian | 49 | 0.1% |
| Brazilian | 208 | 0.6% |
| British | 428 | 1.2% |
| Burmese | 510 | 1.4% |
| Cambodian | 36 | 0.1% |
| Canadian | 87 | 0.2% |
| Central American | 350 | 1.0% |
| Cherokee | 75 | 0.2% |
| Chilean | 90 | 0.3% |
| Chippewa | 17 | 0.1% |
| Choctaw | 39 | 0.1% |
| Colombian | 60 | 0.2% |
| Croatian | 54 | 0.2% |
| Cuban | 100 | 0.3% |
| Czech | 26 | 0.1% |
| Danish | 885 | 2.5% |
| Dutch | 472 | 1.3% |
| Eastern European | 193 | 0.5% |
| Ecuadorian | 75 | 0.2% |
| English | 6,540 | 18.4% |
| European | 1,562 | 4.4% |
| Finnish | 60 | 0.2% |
| French | 501 | 1.4% |
| French American Indian | 8 | 0.0% |
| French Canadian | 26 | 0.1% |
| German | 3,459 | 9.7% |
| Greek | 145 | 0.4% |
| Guamanian / Chamorro | 49 | 0.1% |
| Guatemalan | 67 | 0.2% |
| Haitian | 11 | 0.0% |
| Honduran | 68 | 0.2% |
| Hungarian | 166 | 0.5% |
| Icelander | 69 | 0.2% |
| Indian (Asian) | 370 | 1.0% |
| Iraqi | 116 | 0.3% |
| Irish | 2,302 | 6.5% |
| Iroquois | 9 | 0.0% |
| Italian | 749 | 2.1% |
| Jamaican | 27 | 0.1% |
| Jordanian | 59 | 0.2% |
| Korean | 217 | 0.6% |
| Laotian | 46 | 0.1% |
| Lebanese | 41 | 0.1% |
| Malaysian | 151 | 0.4% |
| Mexican | 4,534 | 12.7% |
| Mexican American Indian | 62 | 0.2% |
| Moroccan | 15 | 0.0% |
| Native Hawaiian | 26 | 0.1% |
| Navajo | 240 | 0.7% |
| New Zealander | 34 | 0.1% |
| Northern European | 25 | 0.1% |
| Norwegian | 630 | 1.8% |
| Pakistani | 22 | 0.1% |
| Panamanian | 13 | 0.0% |
| Peruvian | 74 | 0.2% |
| Polish | 278 | 0.8% |
| Portuguese | 83 | 0.2% |
| Potawatomi | 29 | 0.1% |
| Puerto Rican | 20 | 0.1% |
| Romanian | 41 | 0.1% |
| Russian | 417 | 1.2% |
| Salvadoran | 202 | 0.6% |
| Samoan | 268 | 0.7% |
| Scandinavian | 312 | 0.9% |
| Scotch-Irish | 246 | 0.7% |
| Scottish | 1,327 | 3.7% |
| Serbian | 14 | 0.0% |
| Sioux | 33 | 0.1% |
| Slovak | 74 | 0.2% |
| Slovene | 15 | 0.0% |
| South African | 41 | 0.1% |
| South American | 855 | 2.4% |
| South American Indian | 88 | 0.3% |
| Spaniard | 53 | 0.2% |
| Spanish | 139 | 0.4% |
| Sri Lankan | 253 | 0.7% |
| Subsaharan African | 749 | 2.1% |
| Swedish | 1,152 | 3.2% |
| Swiss | 213 | 0.6% |
| Syrian | 42 | 0.1% |
| Thai | 99 | 0.3% |
| Tongan | 428 | 1.2% |
| Ukrainian | 17 | 0.1% |
| Venezuelan | 449 | 1.3% |
| Welsh | 862 | 2.4% |
| Yugoslavian | 312 | 0.9% | View All 97 Rows |
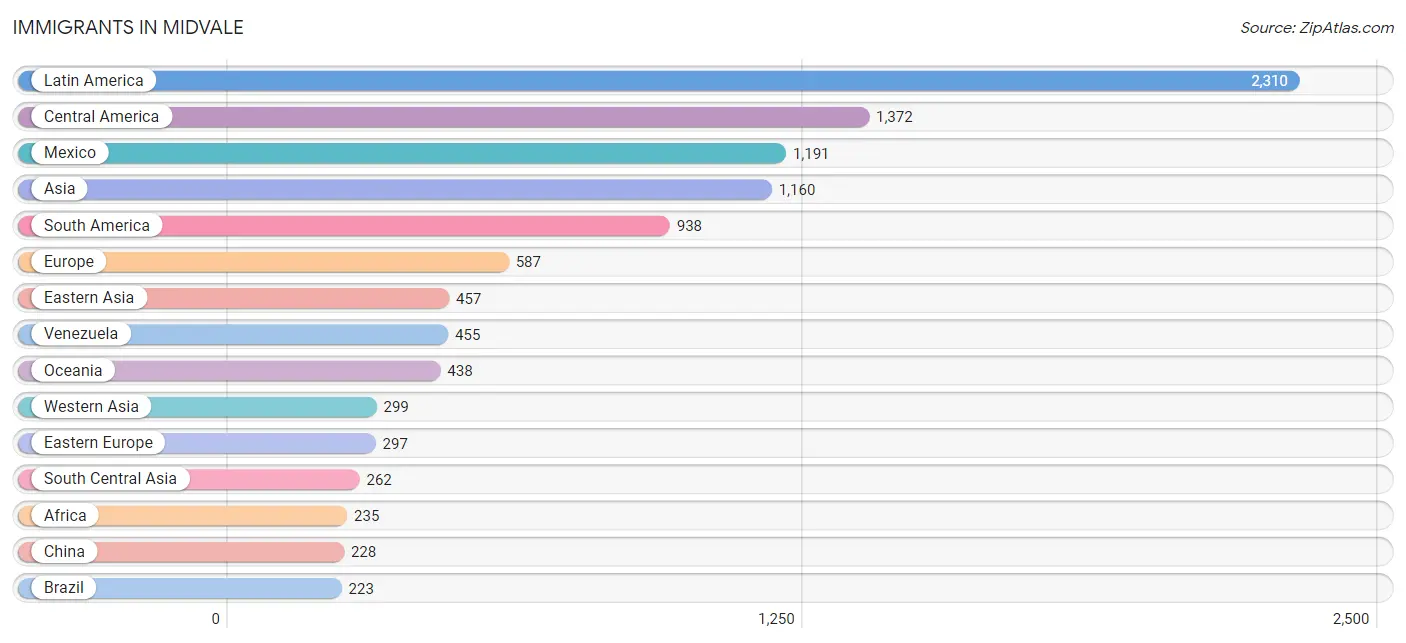
Immigrants in Midvale
The most numerous immigrant groups reported in Midvale came from Latin America (2,310 | 6.5%), Central America (1,372 | 3.8%), Mexico (1,191 | 3.3%), Asia (1,160 | 3.3%), and South America (938 | 2.6%), together accounting for 19.6% of all Midvale residents.
| Immigration Origin | # Population | % Population |
| Afghanistan | 92 | 0.3% |
| Africa | 235 | 0.7% |
| Argentina | 9 | 0.0% |
| Armenia | 25 | 0.1% |
| Asia | 1,160 | 3.3% |
| Australia | 12 | 0.0% |
| Belarus | 55 | 0.2% |
| Bolivia | 23 | 0.1% |
| Bosnia and Herzegovina | 66 | 0.2% |
| Brazil | 223 | 0.6% |
| Canada | 68 | 0.2% |
| Central America | 1,372 | 3.8% |
| Chile | 41 | 0.1% |
| China | 228 | 0.6% |
| Colombia | 63 | 0.2% |
| Congo | 40 | 0.1% |
| Czechoslovakia | 12 | 0.0% |
| Eastern Africa | 114 | 0.3% |
| Eastern Asia | 457 | 1.3% |
| Eastern Europe | 297 | 0.8% |
| Ecuador | 75 | 0.2% |
| El Salvador | 95 | 0.3% |
| Europe | 587 | 1.7% |
| Germany | 42 | 0.1% |
| Guatemala | 39 | 0.1% |
| Honduras | 47 | 0.1% |
| Hong Kong | 9 | 0.0% |
| India | 66 | 0.2% |
| Indonesia | 46 | 0.1% |
| Iran | 13 | 0.0% |
| Iraq | 219 | 0.6% |
| Japan | 42 | 0.1% |
| Korea | 151 | 0.4% |
| Kuwait | 45 | 0.1% |
| Latin America | 2,310 | 6.5% |
| Lithuania | 40 | 0.1% |
| Mexico | 1,191 | 3.3% |
| Micronesia | 187 | 0.5% |
| Middle Africa | 40 | 0.1% |
| Moldova | 15 | 0.0% |
| Morocco | 15 | 0.0% |
| Nepal | 27 | 0.1% |
| Netherlands | 119 | 0.3% |
| Northern Africa | 69 | 0.2% |
| Northern Europe | 58 | 0.2% |
| Norway | 7 | 0.0% |
| Oceania | 438 | 1.2% |
| Pakistan | 33 | 0.1% |
| Peru | 49 | 0.1% |
| Philippines | 37 | 0.1% |
| Poland | 26 | 0.1% |
| Romania | 26 | 0.1% |
| Russia | 11 | 0.0% |
| Scotland | 43 | 0.1% |
| South Africa | 12 | 0.0% |
| South America | 938 | 2.6% |
| South Central Asia | 262 | 0.7% |
| South Eastern Asia | 142 | 0.4% |
| Sri Lanka | 31 | 0.1% |
| Sudan | 54 | 0.2% |
| Syria | 10 | 0.0% |
| Thailand | 22 | 0.1% |
| Venezuela | 455 | 1.3% |
| Vietnam | 37 | 0.1% |
| Western Asia | 299 | 0.8% |
| Western Europe | 161 | 0.4% | View All 66 Rows |
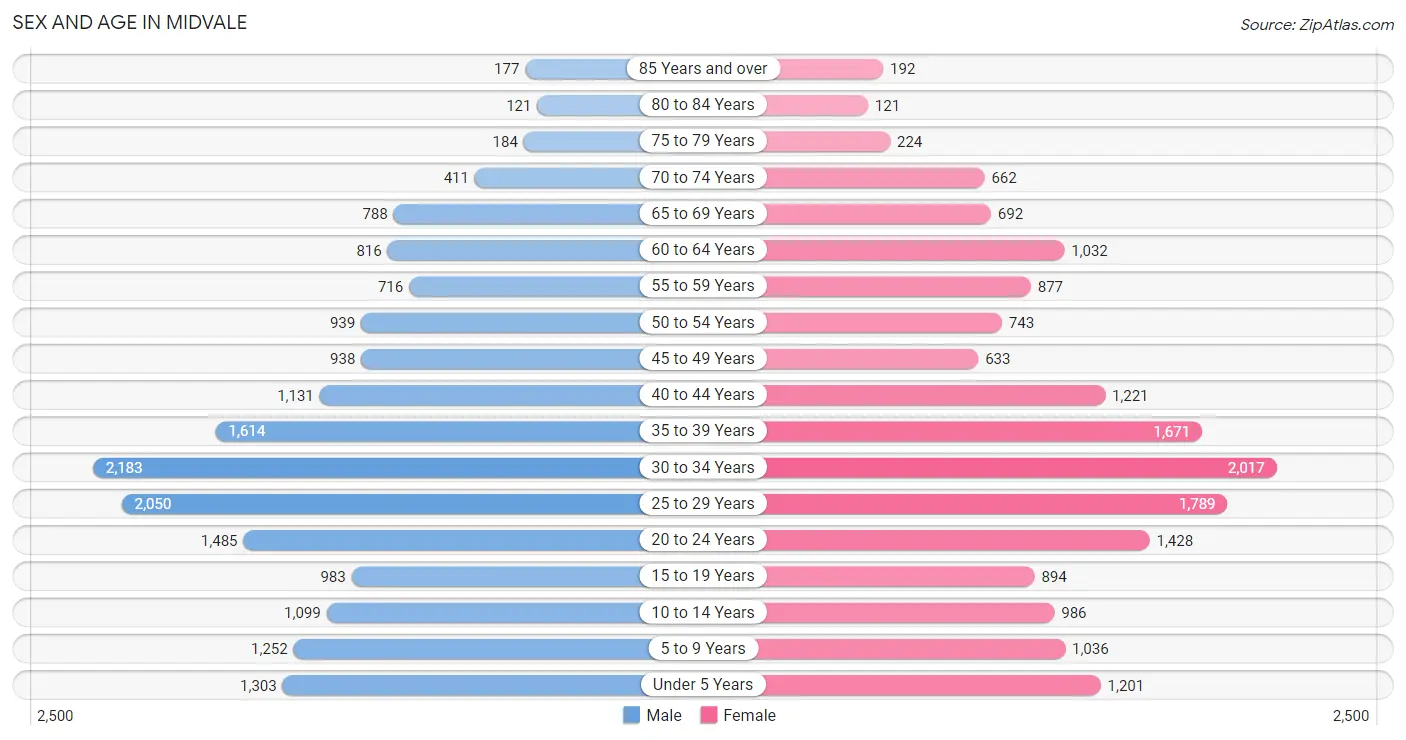
Sex and Age in Midvale
Sex and Age in Midvale
The most populous age groups in Midvale are 30 to 34 Years (2,183 | 12.0%) for men and 30 to 34 Years (2,017 | 11.6%) for women.
| Age Bracket | Male | Female |
| Under 5 Years | 1,303 (7.2%) | 1,201 (6.9%) |
| 5 to 9 Years | 1,252 (6.9%) | 1,036 (5.9%) |
| 10 to 14 Years | 1,099 (6.0%) | 986 (5.7%) |
| 15 to 19 Years | 983 (5.4%) | 894 (5.1%) |
| 20 to 24 Years | 1,485 (8.2%) | 1,428 (8.2%) |
| 25 to 29 Years | 2,050 (11.3%) | 1,789 (10.3%) |
| 30 to 34 Years | 2,183 (12.0%) | 2,017 (11.6%) |
| 35 to 39 Years | 1,614 (8.9%) | 1,671 (9.6%) |
| 40 to 44 Years | 1,131 (6.2%) | 1,221 (7.0%) |
| 45 to 49 Years | 938 (5.2%) | 633 (3.6%) |
| 50 to 54 Years | 939 (5.2%) | 743 (4.3%) |
| 55 to 59 Years | 716 (3.9%) | 877 (5.0%) |
| 60 to 64 Years | 816 (4.5%) | 1,032 (5.9%) |
| 65 to 69 Years | 788 (4.3%) | 692 (4.0%) |
| 70 to 74 Years | 411 (2.3%) | 662 (3.8%) |
| 75 to 79 Years | 184 (1.0%) | 224 (1.3%) |
| 80 to 84 Years | 121 (0.7%) | 121 (0.7%) |
| 85 Years and over | 177 (1.0%) | 192 (1.1%) |
| Total | 18,190 (100.0%) | 17,419 (100.0%) |
Families and Households in Midvale
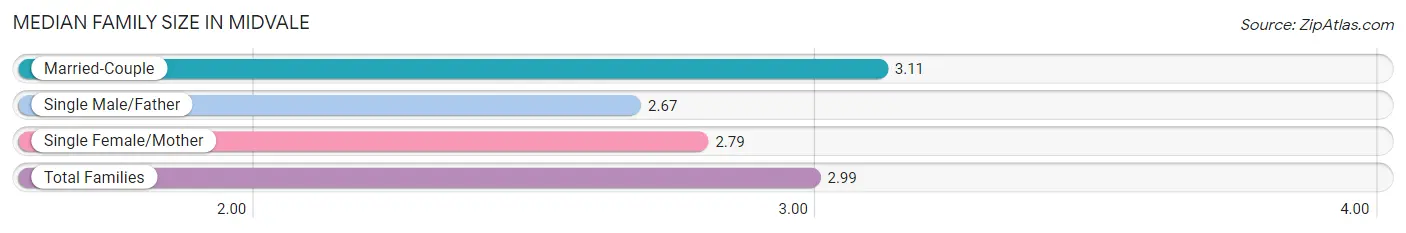
Median Family Size in Midvale
The median family size in Midvale is 2.99 persons per family, with married-couple families (5,724 | 65.0%) accounting for the largest median family size of 3.11 persons per family. On the other hand, single male/father families (966 | 11.0%) represent the smallest median family size with 2.67 persons per family.
| Family Type | # Families | Family Size |
| Married-Couple | 5,724 (65.0%) | 3.11 |
| Single Male/Father | 966 (11.0%) | 2.67 |
| Single Female/Mother | 2,114 (24.0%) | 2.79 |
| Total Families | 8,804 (100.0%) | 2.99 |
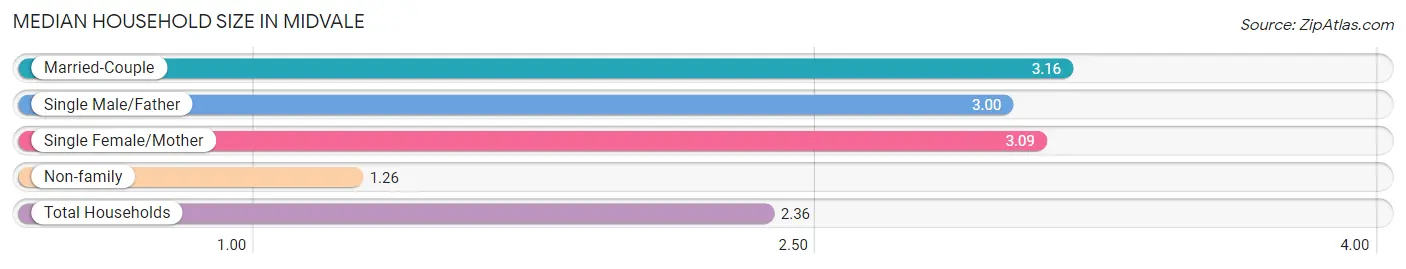
Median Household Size in Midvale
The median household size in Midvale is 2.36 persons per household, with married-couple households (5,724 | 38.5%) accounting for the largest median household size of 3.16 persons per household. non-family households (6,067 | 40.8%) represent the smallest median household size with 1.26 persons per household.
| Household Type | # Households | Household Size |
| Married-Couple | 5,724 (38.5%) | 3.16 |
| Single Male/Father | 966 (6.5%) | 3.00 |
| Single Female/Mother | 2,114 (14.2%) | 3.09 |
| Non-family | 6,067 (40.8%) | 1.26 |
| Total Households | 14,871 (100.0%) | 2.36 |
Household Size by Marriage Status in Midvale
Out of a total of 14,871 households in Midvale, 8,804 (59.2%) are family households, while 6,067 (40.8%) are nonfamily households. The most numerous type of family households are 2-person households, comprising 3,732, and the most common type of nonfamily households are 1-person households, comprising 4,749.
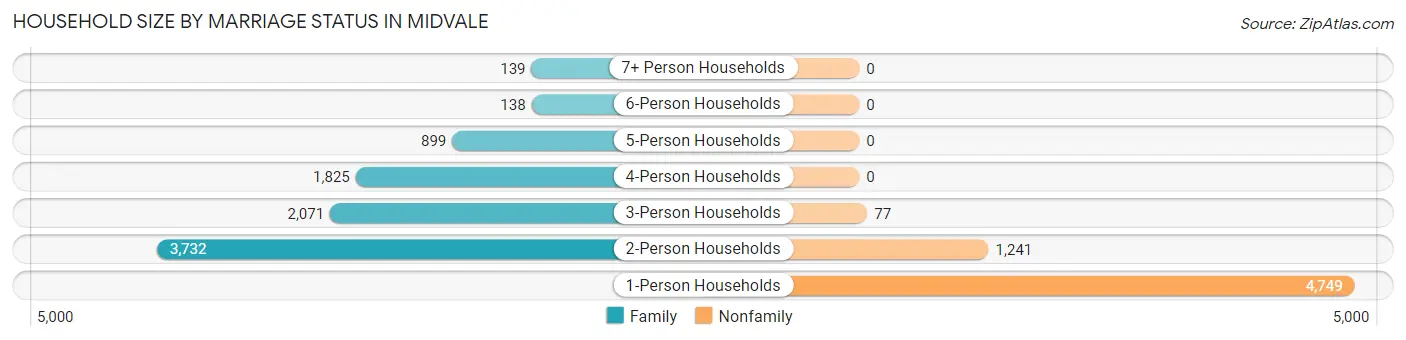
| Household Size | Family Households | Nonfamily Households |
| 1-Person Households | - | 4,749 (31.9%) |
| 2-Person Households | 3,732 (25.1%) | 1,241 (8.4%) |
| 3-Person Households | 2,071 (13.9%) | 77 (0.5%) |
| 4-Person Households | 1,825 (12.3%) | 0 (0.0%) |
| 5-Person Households | 899 (6.0%) | 0 (0.0%) |
| 6-Person Households | 138 (0.9%) | 0 (0.0%) |
| 7+ Person Households | 139 (0.9%) | 0 (0.0%) |
| Total | 8,804 (59.2%) | 6,067 (40.8%) |
Female Fertility in Midvale
Fertility by Age in Midvale
Average fertility rate in Midvale is 43.0 births per 1,000 women. Women in the age bracket of 20 to 34 years have the highest fertility rate with 64.0 births per 1,000 women. Women in the age bracket of 20 to 34 years acount for 79.2% of all women with births.
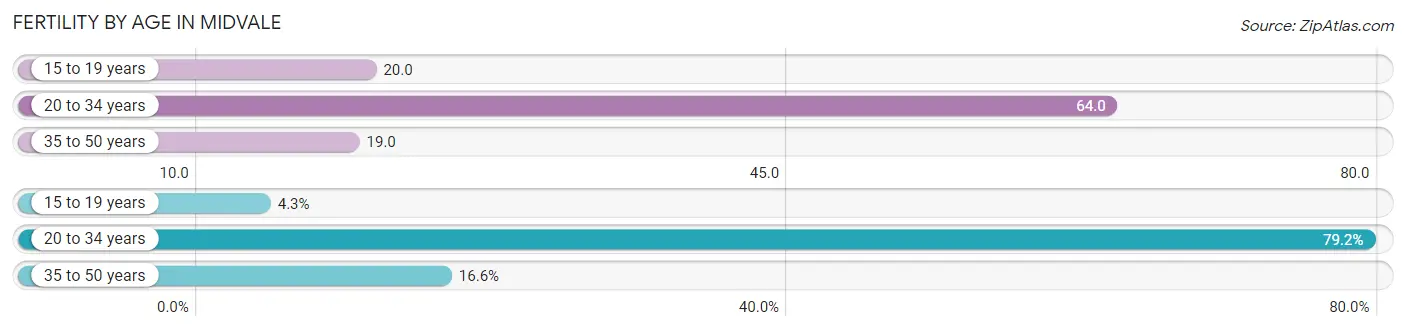
| Age Bracket | Women with Births | Births / 1,000 Women |
| 15 to 19 years | 18 (4.3%) | 20.0 |
| 20 to 34 years | 335 (79.2%) | 64.0 |
| 35 to 50 years | 70 (16.6%) | 19.0 |
| Total | 423 (100.0%) | 43.0 |
Fertility by Age by Marriage Status in Midvale
52.7% of women with births (423) in Midvale are married. The highest percentage of unmarried women with births falls into 15 to 19 years age bracket with 100.0% of them unmarried at the time of birth, while the lowest percentage of unmarried women with births belong to 35 to 50 years age bracket with 35.7% of them unmarried.
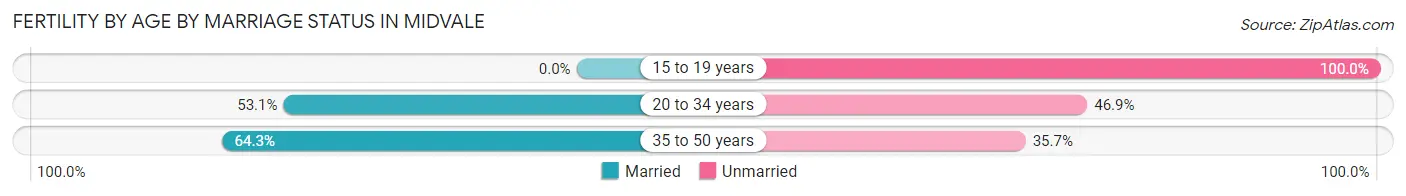
| Age Bracket | Married | Unmarried |
| 15 to 19 years | 0 (0.0%) | 18 (100.0%) |
| 20 to 34 years | 178 (53.1%) | 157 (46.9%) |
| 35 to 50 years | 45 (64.3%) | 25 (35.7%) |
| Total | 223 (52.7%) | 200 (47.3%) |
Fertility by Education in Midvale
Average fertility rate in Midvale is 43.0 births per 1,000 women. Women with the education attainment of bachelor's degree have the highest fertility rate of 68.0 births per 1,000 women, while women with the education attainment of high school diploma have the lowest fertility at 24.0 births per 1,000 women. Women with the education attainment of college or associate's degree represent 38.8% of all women with births.
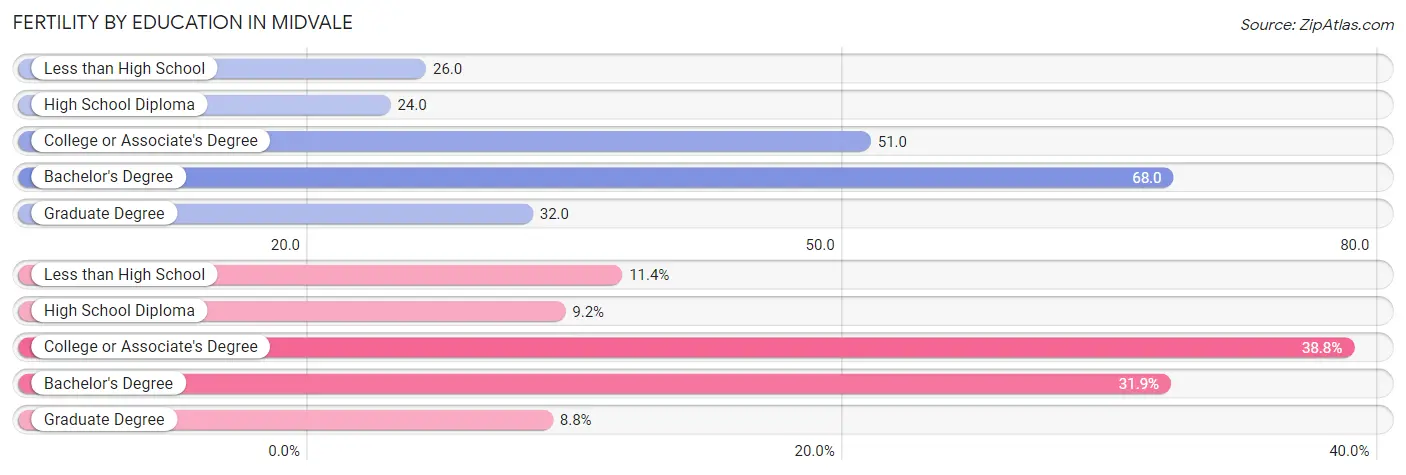
| Educational Attainment | Women with Births | Births / 1,000 Women |
| Less than High School | 48 (11.4%) | 26.0 |
| High School Diploma | 39 (9.2%) | 24.0 |
| College or Associate's Degree | 164 (38.8%) | 51.0 |
| Bachelor's Degree | 135 (31.9%) | 68.0 |
| Graduate Degree | 37 (8.7%) | 32.0 |
| Total | 423 (100.0%) | 43.0 |
Fertility by Education by Marriage Status in Midvale
47.3% of women with births in Midvale are unmarried. Women with the educational attainment of graduate degree are most likely to be married with 100.0% of them married at childbirth, while women with the educational attainment of high school diploma are least likely to be married with 79.5% of them unmarried at childbirth.
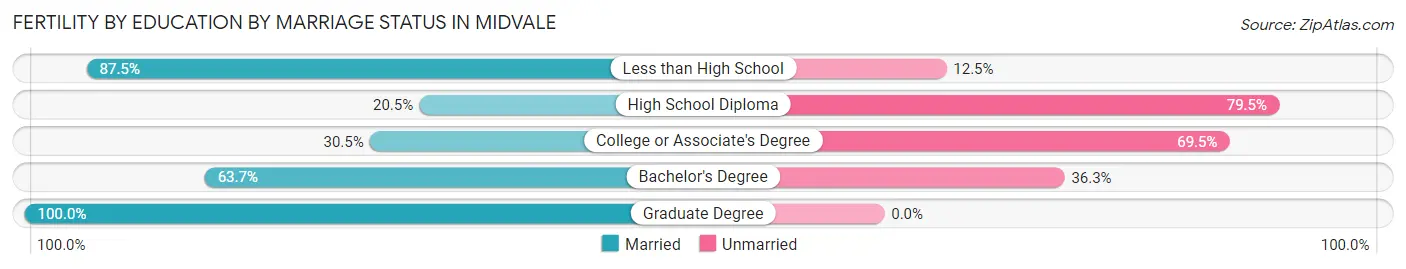
| Educational Attainment | Married | Unmarried |
| Less than High School | 42 (87.5%) | 6 (12.5%) |
| High School Diploma | 8 (20.5%) | 31 (79.5%) |
| College or Associate's Degree | 50 (30.5%) | 114 (69.5%) |
| Bachelor's Degree | 86 (63.7%) | 49 (36.3%) |
| Graduate Degree | 37 (100.0%) | 0 (0.0%) |
| Total | 223 (52.7%) | 200 (47.3%) |
Employment Characteristics in Midvale
Employment by Class of Employer in Midvale
Among the 20,510 employed individuals in Midvale, private company employees (14,431 | 70.4%), not-for-profit organizations (1,691 | 8.2%), and state government employees (1,192 | 5.8%) make up the most common classes of employment.
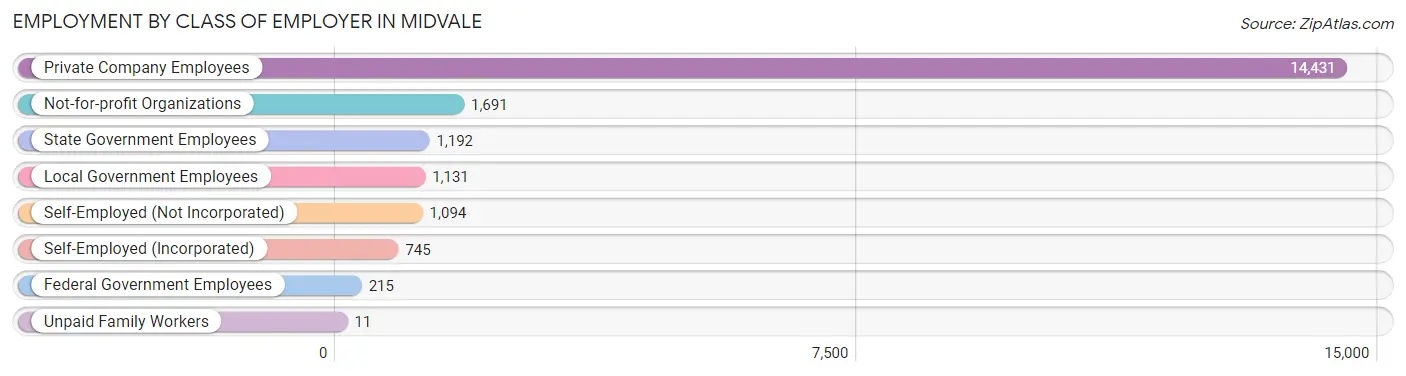
| Employer Class | # Employees | % Employees |
| Private Company Employees | 14,431 | 70.4% |
| Self-Employed (Incorporated) | 745 | 3.6% |
| Self-Employed (Not Incorporated) | 1,094 | 5.3% |
| Not-for-profit Organizations | 1,691 | 8.2% |
| Local Government Employees | 1,131 | 5.5% |
| State Government Employees | 1,192 | 5.8% |
| Federal Government Employees | 215 | 1.1% |
| Unpaid Family Workers | 11 | 0.1% |
| Total | 20,510 | 100.0% |
Employment Status by Age in Midvale
According to the labor force statistics for Midvale, out of the total population over 16 years of age (28,485), 75.3% or 21,449 individuals are in the labor force, with 3.0% or 643 of them unemployed. The age group with the highest labor force participation rate is 45 to 54 years, with 91.1% or 2,963 individuals in the labor force. Within the labor force, the 16 to 19 years age range has the highest percentage of unemployed individuals, with 9.2% or 85 of them being unemployed.
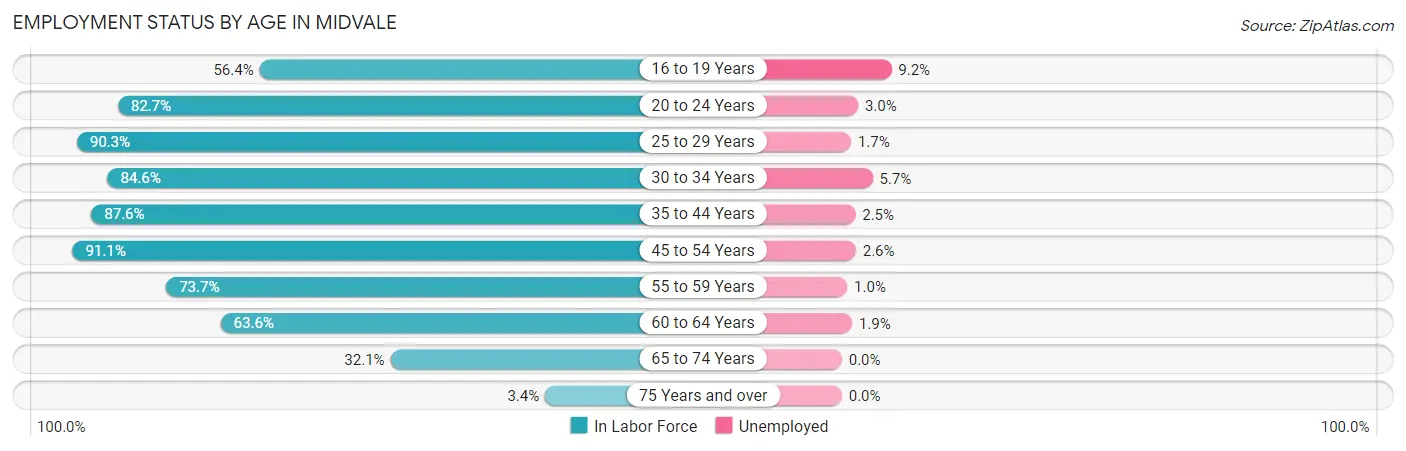
| Age Bracket | In Labor Force | Unemployed |
| 16 to 19 Years | 919 (56.4%) | 85 (9.2%) |
| 20 to 24 Years | 2,409 (82.7%) | 72 (3.0%) |
| 25 to 29 Years | 3,467 (90.3%) | 59 (1.7%) |
| 30 to 34 Years | 3,553 (84.6%) | 203 (5.7%) |
| 35 to 44 Years | 4,938 (87.6%) | 123 (2.5%) |
| 45 to 54 Years | 2,963 (91.1%) | 77 (2.6%) |
| 55 to 59 Years | 1,174 (73.7%) | 12 (1.0%) |
| 60 to 64 Years | 1,175 (63.6%) | 22 (1.9%) |
| 65 to 74 Years | 820 (32.1%) | 0 (0.0%) |
| 75 Years and over | 35 (3.4%) | 0 (0.0%) |
| Total | 21,449 (75.3%) | 643 (3.0%) |
Employment Status by Educational Attainment in Midvale
According to labor force statistics for Midvale, 84.8% of individuals (17,274) out of the total population between 25 and 64 years of age (20,370) are in the labor force, with 2.9% or 501 of them being unemployed. The group with the highest labor force participation rate are those with the educational attainment of college / associate degree, with 89.3% or 6,681 individuals in the labor force. Within the labor force, individuals with high school diploma education have the highest percentage of unemployment, with 4.0% or 142 of them being unemployed.
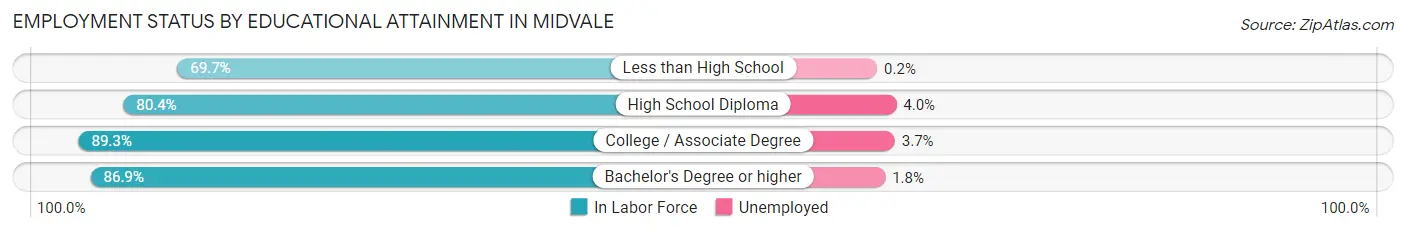
| Educational Attainment | In Labor Force | Unemployed |
| Less than High School | 1,334 (69.7%) | 4 (0.2%) |
| High School Diploma | 3,538 (80.4%) | 176 (4.0%) |
| College / Associate Degree | 6,681 (89.3%) | 277 (3.7%) |
| Bachelor's Degree or higher | 5,714 (86.9%) | 118 (1.8%) |
| Total | 17,274 (84.8%) | 591 (2.9%) |
Employment Occupations by Sex in Midvale
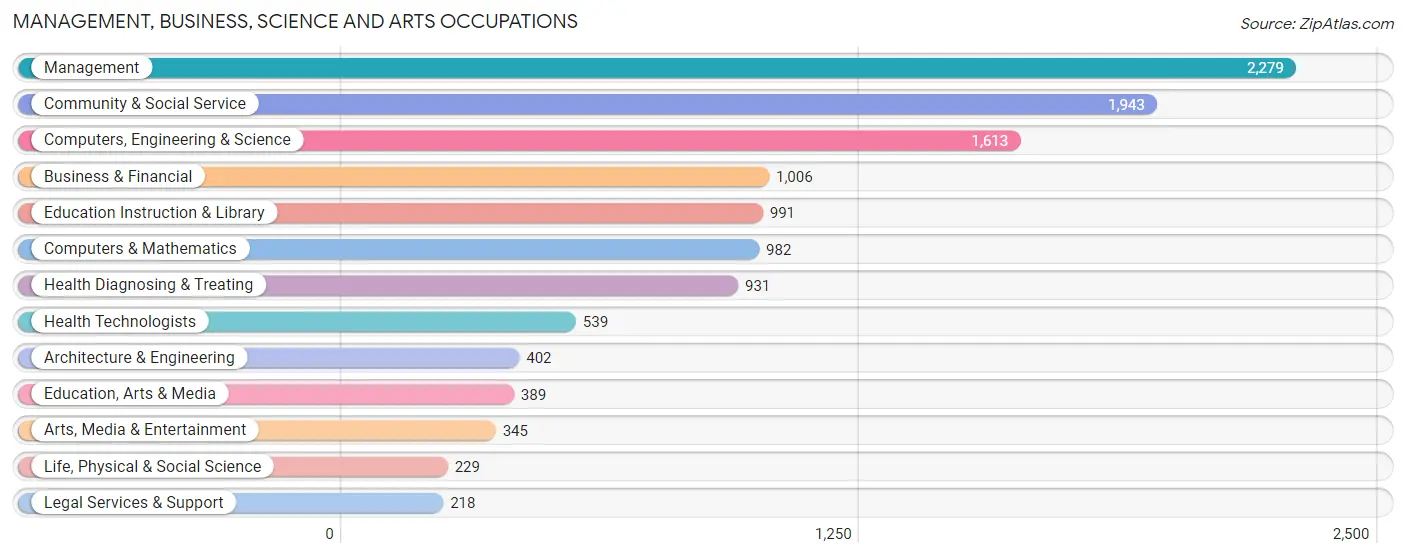
Management, Business, Science and Arts Occupations
The most common Management, Business, Science and Arts occupations in Midvale are Management (2,279 | 11.0%), Community & Social Service (1,943 | 9.3%), Computers, Engineering & Science (1,613 | 7.8%), Business & Financial (1,006 | 4.8%), and Education Instruction & Library (991 | 4.8%).
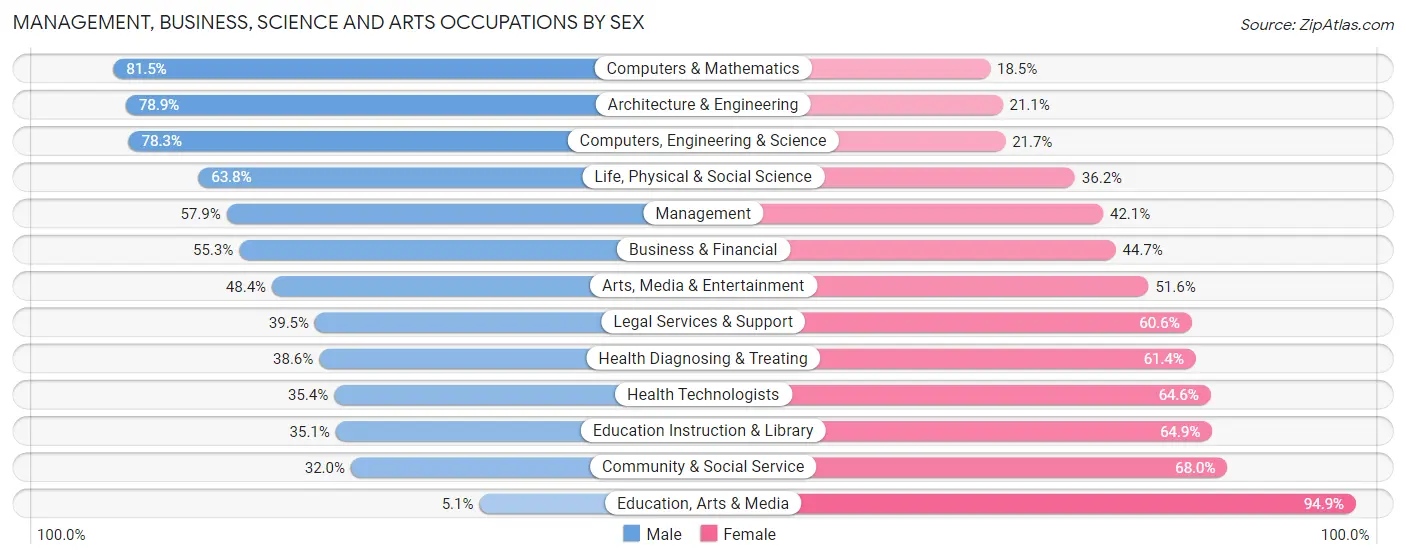
Management, Business, Science and Arts Occupations by Sex
Within the Management, Business, Science and Arts occupations in Midvale, the most male-oriented occupations are Computers & Mathematics (81.5%), Architecture & Engineering (78.9%), and Computers, Engineering & Science (78.3%), while the most female-oriented occupations are Education, Arts & Media (94.9%), Community & Social Service (68.0%), and Education Instruction & Library (64.9%).
| Occupation | Male | Female |
| Management | 1,319 (57.9%) | 960 (42.1%) |
| Business & Financial | 556 (55.3%) | 450 (44.7%) |
| Computers, Engineering & Science | 1,263 (78.3%) | 350 (21.7%) |
| Computers & Mathematics | 800 (81.5%) | 182 (18.5%) |
| Architecture & Engineering | 317 (78.9%) | 85 (21.1%) |
| Life, Physical & Social Science | 146 (63.8%) | 83 (36.2%) |
| Community & Social Service | 621 (32.0%) | 1,322 (68.0%) |
| Education, Arts & Media | 20 (5.1%) | 369 (94.9%) |
| Legal Services & Support | 86 (39.5%) | 132 (60.6%) |
| Education Instruction & Library | 348 (35.1%) | 643 (64.9%) |
| Arts, Media & Entertainment | 167 (48.4%) | 178 (51.6%) |
| Health Diagnosing & Treating | 359 (38.6%) | 572 (61.4%) |
| Health Technologists | 191 (35.4%) | 348 (64.6%) |
| Total (Category) | 4,118 (53.0%) | 3,654 (47.0%) |
| Total (Overall) | 11,375 (54.7%) | 9,417 (45.3%) |
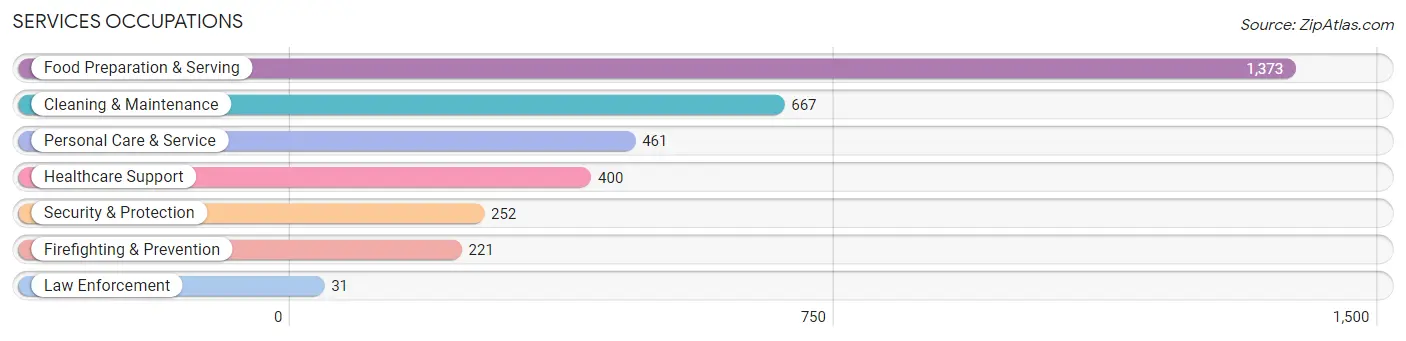
Services Occupations
The most common Services occupations in Midvale are Food Preparation & Serving (1,373 | 6.6%), Cleaning & Maintenance (667 | 3.2%), Personal Care & Service (461 | 2.2%), Healthcare Support (400 | 1.9%), and Security & Protection (252 | 1.2%).
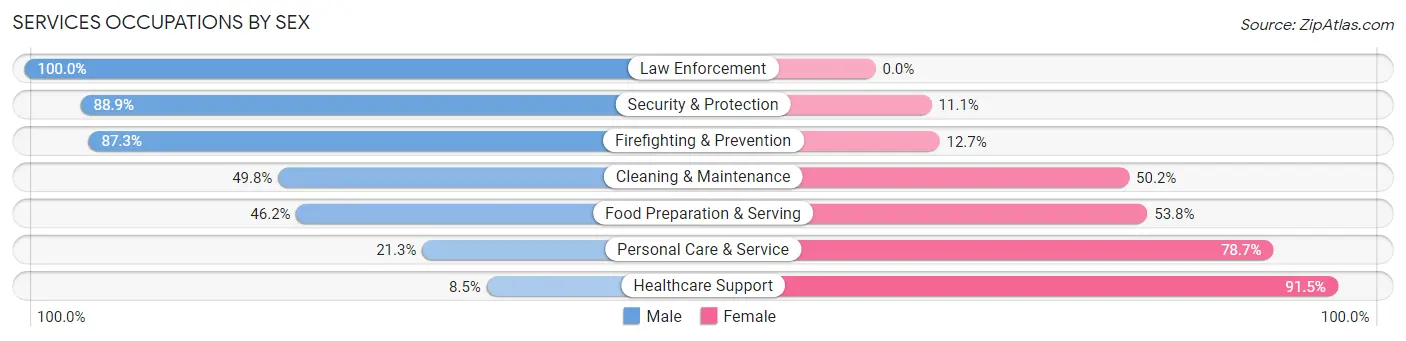
Services Occupations by Sex
Within the Services occupations in Midvale, the most male-oriented occupations are Law Enforcement (100.0%), Security & Protection (88.9%), and Firefighting & Prevention (87.3%), while the most female-oriented occupations are Healthcare Support (91.5%), Personal Care & Service (78.7%), and Food Preparation & Serving (53.8%).
| Occupation | Male | Female |
| Healthcare Support | 34 (8.5%) | 366 (91.5%) |
| Security & Protection | 224 (88.9%) | 28 (11.1%) |
| Firefighting & Prevention | 193 (87.3%) | 28 (12.7%) |
| Law Enforcement | 31 (100.0%) | 0 (0.0%) |
| Food Preparation & Serving | 634 (46.2%) | 739 (53.8%) |
| Cleaning & Maintenance | 332 (49.8%) | 335 (50.2%) |
| Personal Care & Service | 98 (21.3%) | 363 (78.7%) |
| Total (Category) | 1,322 (41.9%) | 1,831 (58.1%) |
| Total (Overall) | 11,375 (54.7%) | 9,417 (45.3%) |
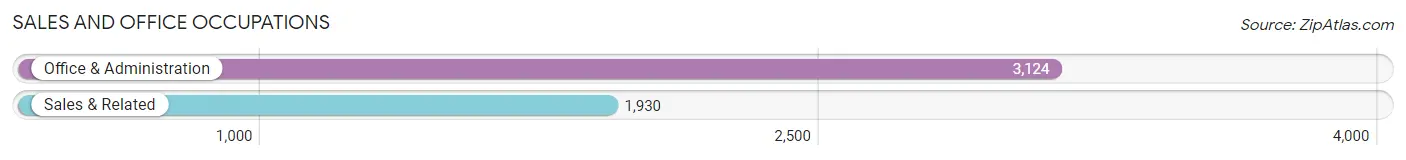
Sales and Office Occupations
The most common Sales and Office occupations in Midvale are Office & Administration (3,124 | 15.0%), and Sales & Related (1,930 | 9.3%).
Sales and Office Occupations by Sex
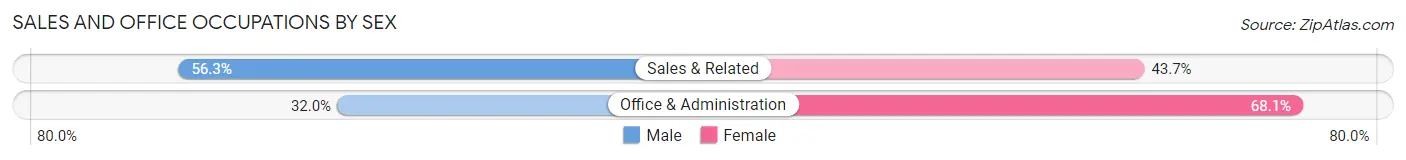
| Occupation | Male | Female |
| Sales & Related | 1,087 (56.3%) | 843 (43.7%) |
| Office & Administration | 998 (32.0%) | 2,126 (68.0%) |
| Total (Category) | 2,085 (41.2%) | 2,969 (58.8%) |
| Total (Overall) | 11,375 (54.7%) | 9,417 (45.3%) |
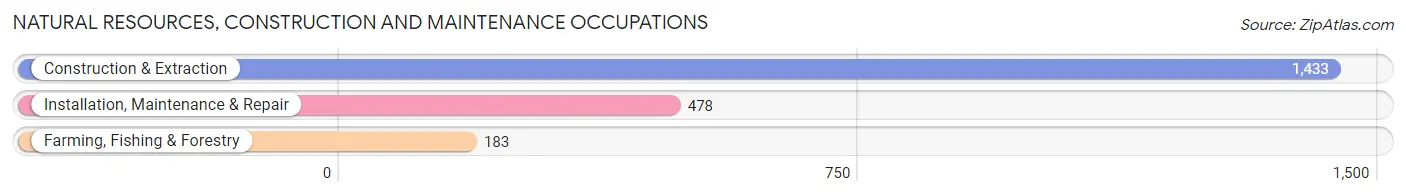
Natural Resources, Construction and Maintenance Occupations
The most common Natural Resources, Construction and Maintenance occupations in Midvale are Construction & Extraction (1,433 | 6.9%), Installation, Maintenance & Repair (478 | 2.3%), and Farming, Fishing & Forestry (183 | 0.9%).
Natural Resources, Construction and Maintenance Occupations by Sex
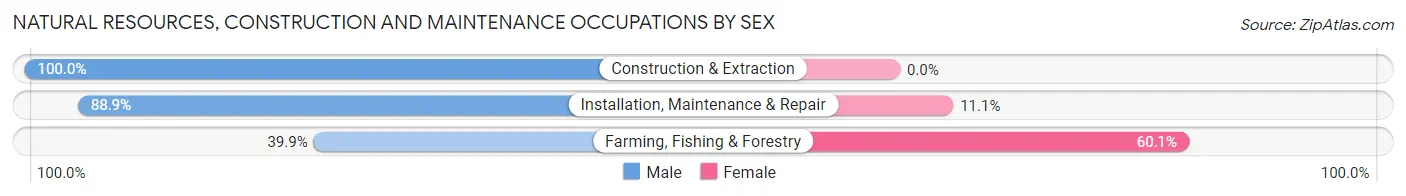
| Occupation | Male | Female |
| Farming, Fishing & Forestry | 73 (39.9%) | 110 (60.1%) |
| Construction & Extraction | 1,433 (100.0%) | 0 (0.0%) |
| Installation, Maintenance & Repair | 425 (88.9%) | 53 (11.1%) |
| Total (Category) | 1,931 (92.2%) | 163 (7.8%) |
| Total (Overall) | 11,375 (54.7%) | 9,417 (45.3%) |
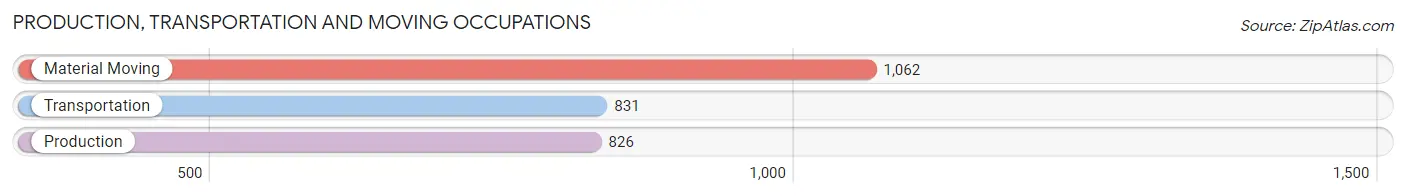
Production, Transportation and Moving Occupations
The most common Production, Transportation and Moving occupations in Midvale are Material Moving (1,062 | 5.1%), Transportation (831 | 4.0%), and Production (826 | 4.0%).
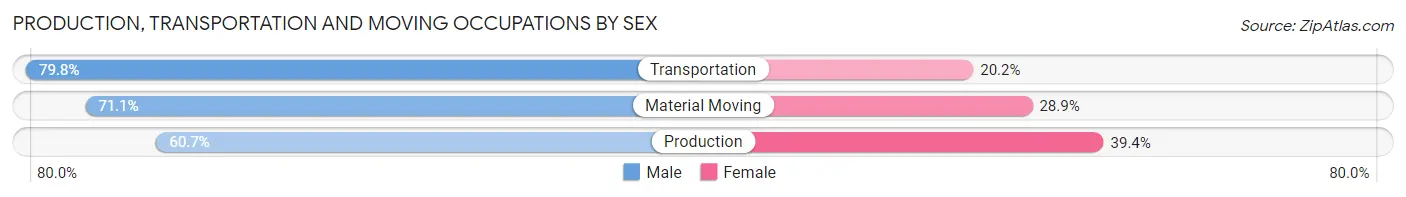
Production, Transportation and Moving Occupations by Sex
| Occupation | Male | Female |
| Production | 501 (60.7%) | 325 (39.4%) |
| Transportation | 663 (79.8%) | 168 (20.2%) |
| Material Moving | 755 (71.1%) | 307 (28.9%) |
| Total (Category) | 1,919 (70.6%) | 800 (29.4%) |
| Total (Overall) | 11,375 (54.7%) | 9,417 (45.3%) |
Employment Industries by Sex in Midvale
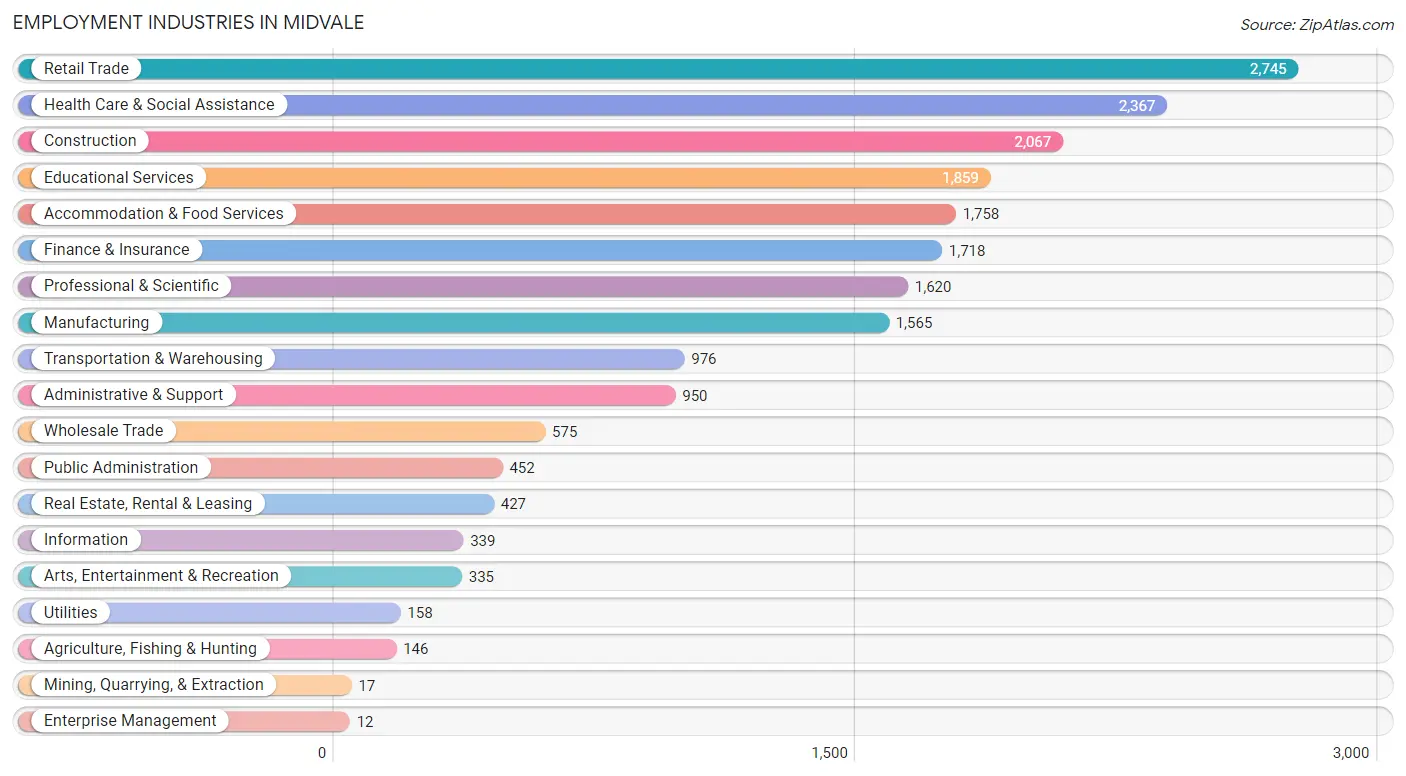
Employment Industries in Midvale
The major employment industries in Midvale include Retail Trade (2,745 | 13.2%), Health Care & Social Assistance (2,367 | 11.4%), Construction (2,067 | 9.9%), Educational Services (1,859 | 8.9%), and Accommodation & Food Services (1,758 | 8.5%).
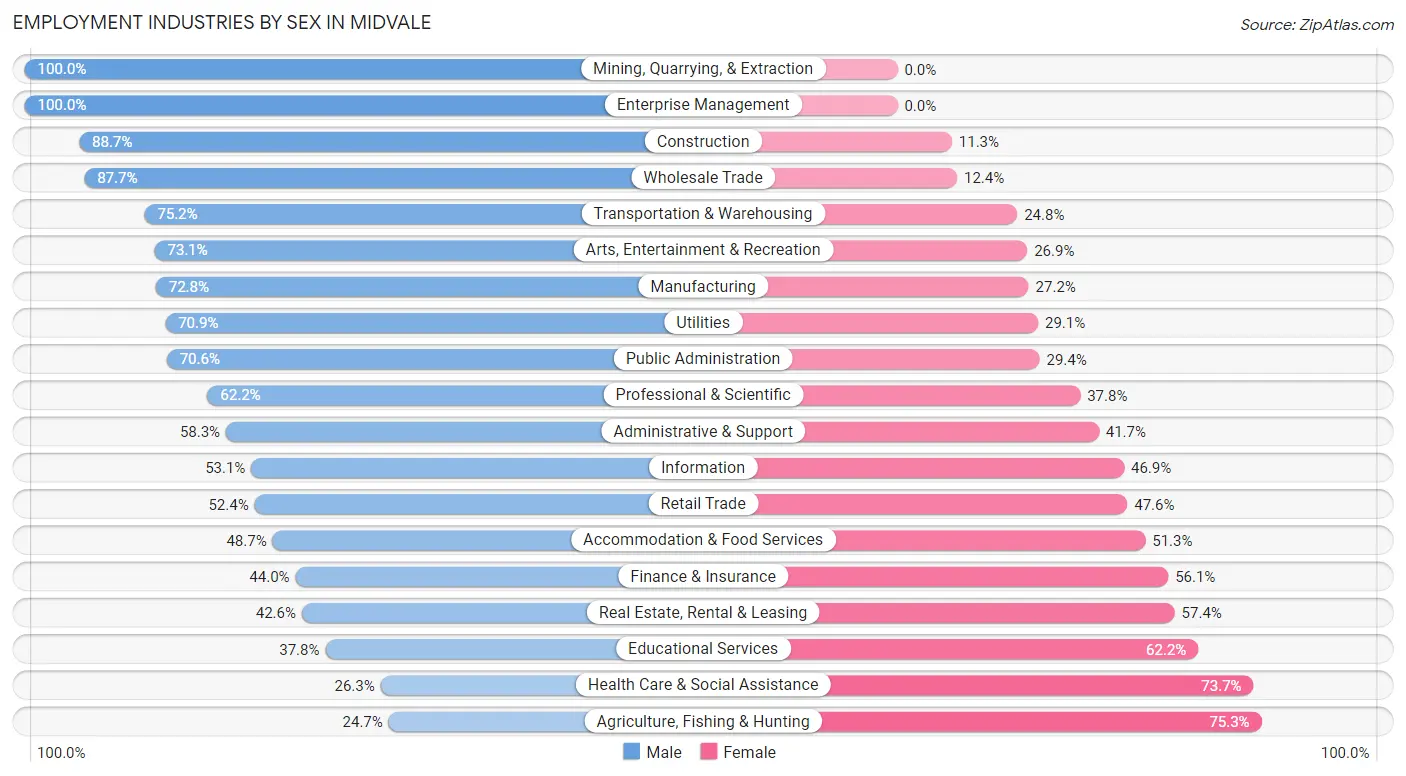
Employment Industries by Sex in Midvale
The Midvale industries that see more men than women are Mining, Quarrying, & Extraction (100.0%), Enterprise Management (100.0%), and Construction (88.7%), whereas the industries that tend to have a higher number of women are Agriculture, Fishing & Hunting (75.3%), Health Care & Social Assistance (73.7%), and Educational Services (62.2%).
| Industry | Male | Female |
| Agriculture, Fishing & Hunting | 36 (24.7%) | 110 (75.3%) |
| Mining, Quarrying, & Extraction | 17 (100.0%) | 0 (0.0%) |
| Construction | 1,834 (88.7%) | 233 (11.3%) |
| Manufacturing | 1,140 (72.8%) | 425 (27.2%) |
| Wholesale Trade | 504 (87.6%) | 71 (12.3%) |
| Retail Trade | 1,439 (52.4%) | 1,306 (47.6%) |
| Transportation & Warehousing | 734 (75.2%) | 242 (24.8%) |
| Utilities | 112 (70.9%) | 46 (29.1%) |
| Information | 180 (53.1%) | 159 (46.9%) |
| Finance & Insurance | 755 (44.0%) | 963 (56.0%) |
| Real Estate, Rental & Leasing | 182 (42.6%) | 245 (57.4%) |
| Professional & Scientific | 1,007 (62.2%) | 613 (37.8%) |
| Enterprise Management | 12 (100.0%) | 0 (0.0%) |
| Administrative & Support | 554 (58.3%) | 396 (41.7%) |
| Educational Services | 702 (37.8%) | 1,157 (62.2%) |
| Health Care & Social Assistance | 623 (26.3%) | 1,744 (73.7%) |
| Arts, Entertainment & Recreation | 245 (73.1%) | 90 (26.9%) |
| Accommodation & Food Services | 856 (48.7%) | 902 (51.3%) |
| Public Administration | 319 (70.6%) | 133 (29.4%) |
| Total | 11,375 (54.7%) | 9,417 (45.3%) |
Education in Midvale
School Enrollment in Midvale
The most common levels of schooling among the 7,731 students in Midvale are high school (1,767 | 22.9%), college / undergraduate (1,577 | 20.4%), and elementary school (1,476 | 19.1%).
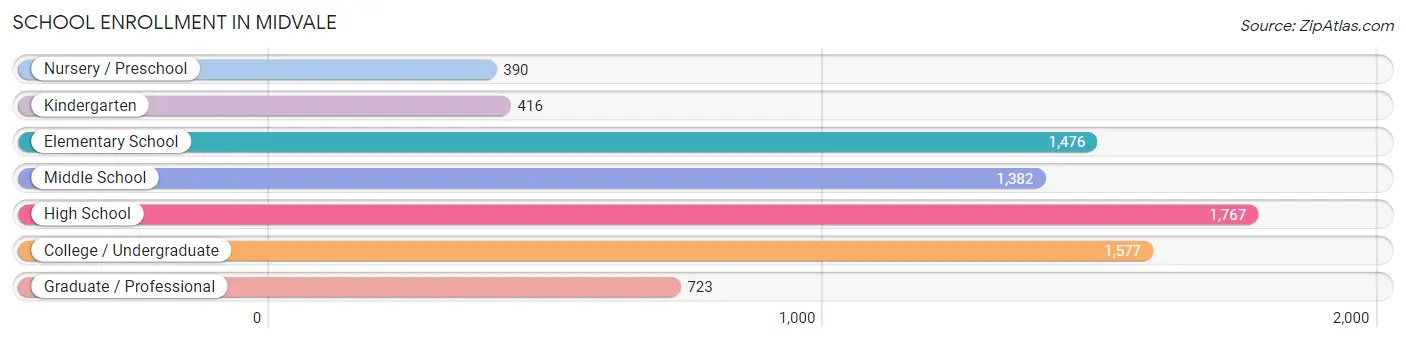
| School Level | # Students | % Students |
| Nursery / Preschool | 390 | 5.0% |
| Kindergarten | 416 | 5.4% |
| Elementary School | 1,476 | 19.1% |
| Middle School | 1,382 | 17.9% |
| High School | 1,767 | 22.9% |
| College / Undergraduate | 1,577 | 20.4% |
| Graduate / Professional | 723 | 9.3% |
| Total | 7,731 | 100.0% |
School Enrollment by Age by Funding Source in Midvale
Out of a total of 7,731 students who are enrolled in schools in Midvale, 843 (10.9%) attend a private institution, while the remaining 6,888 (89.1%) are enrolled in public schools. The age group of 35 years and over has the highest likelihood of being enrolled in private schools, with 231 (52.9% in the age bracket) enrolled. Conversely, the age group of 10 to 14 year olds has the lowest likelihood of being enrolled in a private school, with 1,738 (96.7% in the age bracket) attending a public institution.
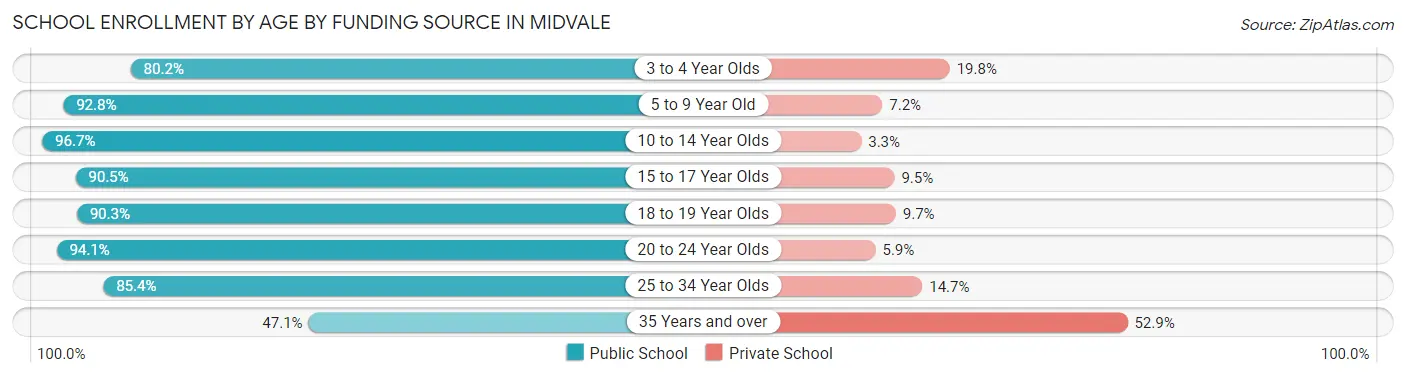
| Age Bracket | Public School | Private School |
| 3 to 4 Year Olds | 264 (80.2%) | 65 (19.8%) |
| 5 to 9 Year Old | 1,650 (92.8%) | 128 (7.2%) |
| 10 to 14 Year Olds | 1,738 (96.7%) | 59 (3.3%) |
| 15 to 17 Year Olds | 967 (90.5%) | 101 (9.5%) |
| 18 to 19 Year Olds | 353 (90.3%) | 38 (9.7%) |
| 20 to 24 Year Olds | 712 (94.1%) | 45 (5.9%) |
| 25 to 34 Year Olds | 1,002 (85.4%) | 172 (14.6%) |
| 35 Years and over | 206 (47.1%) | 231 (52.9%) |
| Total | 6,888 (89.1%) | 843 (10.9%) |
Educational Attainment by Field of Study in Midvale
Business (1,459 | 17.4%), education (900 | 10.7%), science & technology (762 | 9.1%), social sciences (697 | 8.3%), and communications (581 | 6.9%) are the most common fields of study among 8,371 individuals in Midvale who have obtained a bachelor's degree or higher.
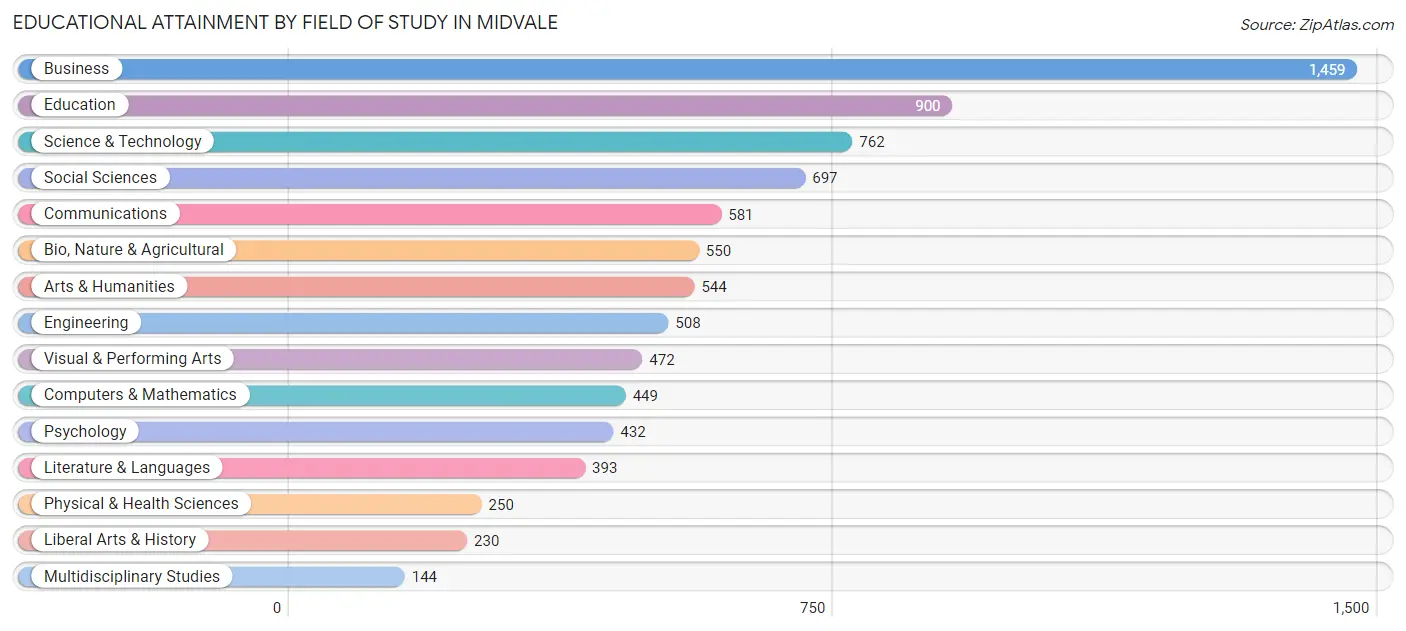
| Field of Study | # Graduates | % Graduates |
| Computers & Mathematics | 449 | 5.4% |
| Bio, Nature & Agricultural | 550 | 6.6% |
| Physical & Health Sciences | 250 | 3.0% |
| Psychology | 432 | 5.2% |
| Social Sciences | 697 | 8.3% |
| Engineering | 508 | 6.1% |
| Multidisciplinary Studies | 144 | 1.7% |
| Science & Technology | 762 | 9.1% |
| Business | 1,459 | 17.4% |
| Education | 900 | 10.7% |
| Literature & Languages | 393 | 4.7% |
| Liberal Arts & History | 230 | 2.8% |
| Visual & Performing Arts | 472 | 5.6% |
| Communications | 581 | 6.9% |
| Arts & Humanities | 544 | 6.5% |
| Total | 8,371 | 100.0% |
Transportation & Commute in Midvale
Vehicle Availability by Sex in Midvale
The most prevalent vehicle ownership categories in Midvale are males with 2 vehicles (5,012, accounting for 45.1%) and females with 2 vehicles (3,862, making up 54.6%).
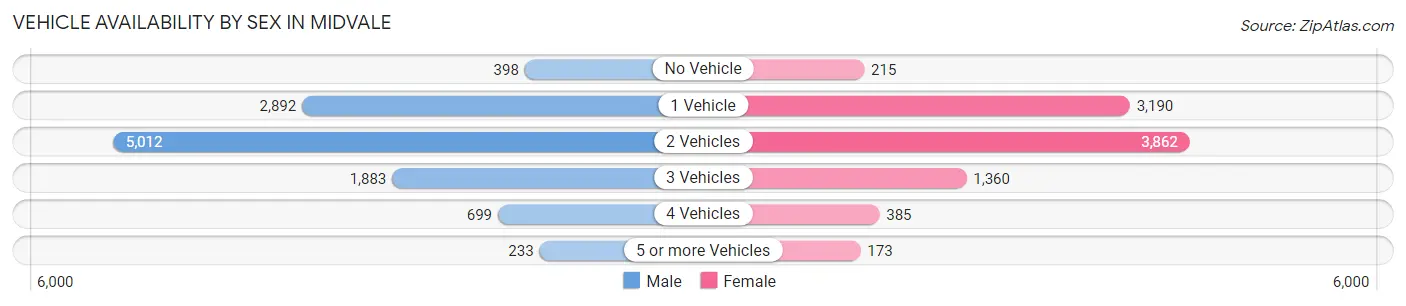
| Vehicles Available | Male | Female |
| No Vehicle | 398 (3.6%) | 215 (2.3%) |
| 1 Vehicle | 2,892 (26.0%) | 3,190 (34.7%) |
| 2 Vehicles | 5,012 (45.1%) | 3,862 (42.0%) |
| 3 Vehicles | 1,883 (16.9%) | 1,360 (14.8%) |
| 4 Vehicles | 699 (6.3%) | 385 (4.2%) |
| 5 or more Vehicles | 233 (2.1%) | 173 (1.9%) |
| Total | 11,117 (100.0%) | 9,185 (100.0%) |
Commute Time in Midvale
The most frequently occuring commute durations in Midvale are 20 to 24 minutes (3,842 commuters, 21.6%), 15 to 19 minutes (3,395 commuters, 19.1%), and 10 to 14 minutes (2,842 commuters, 16.0%).
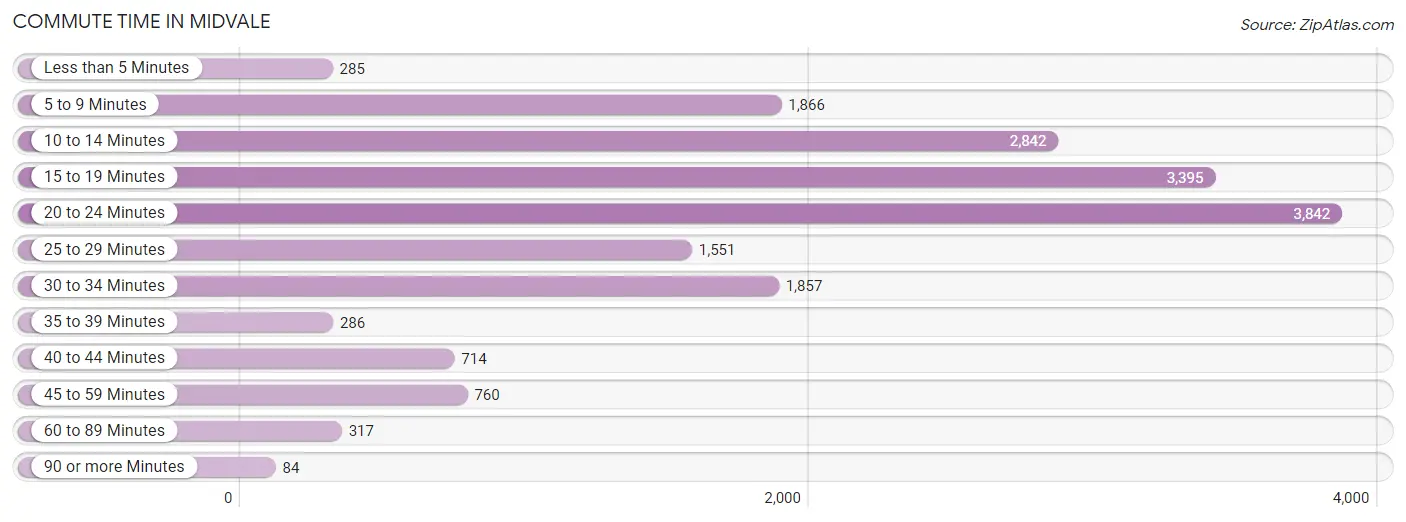
| Commute Time | # Commuters | % Commuters |
| Less than 5 Minutes | 285 | 1.6% |
| 5 to 9 Minutes | 1,866 | 10.5% |
| 10 to 14 Minutes | 2,842 | 16.0% |
| 15 to 19 Minutes | 3,395 | 19.1% |
| 20 to 24 Minutes | 3,842 | 21.6% |
| 25 to 29 Minutes | 1,551 | 8.7% |
| 30 to 34 Minutes | 1,857 | 10.4% |
| 35 to 39 Minutes | 286 | 1.6% |
| 40 to 44 Minutes | 714 | 4.0% |
| 45 to 59 Minutes | 760 | 4.3% |
| 60 to 89 Minutes | 317 | 1.8% |
| 90 or more Minutes | 84 | 0.5% |
Commute Time by Sex in Midvale
The most common commute times in Midvale are 20 to 24 minutes (2,183 commuters, 21.9%) for males and 20 to 24 minutes (1,659 commuters, 21.1%) for females.
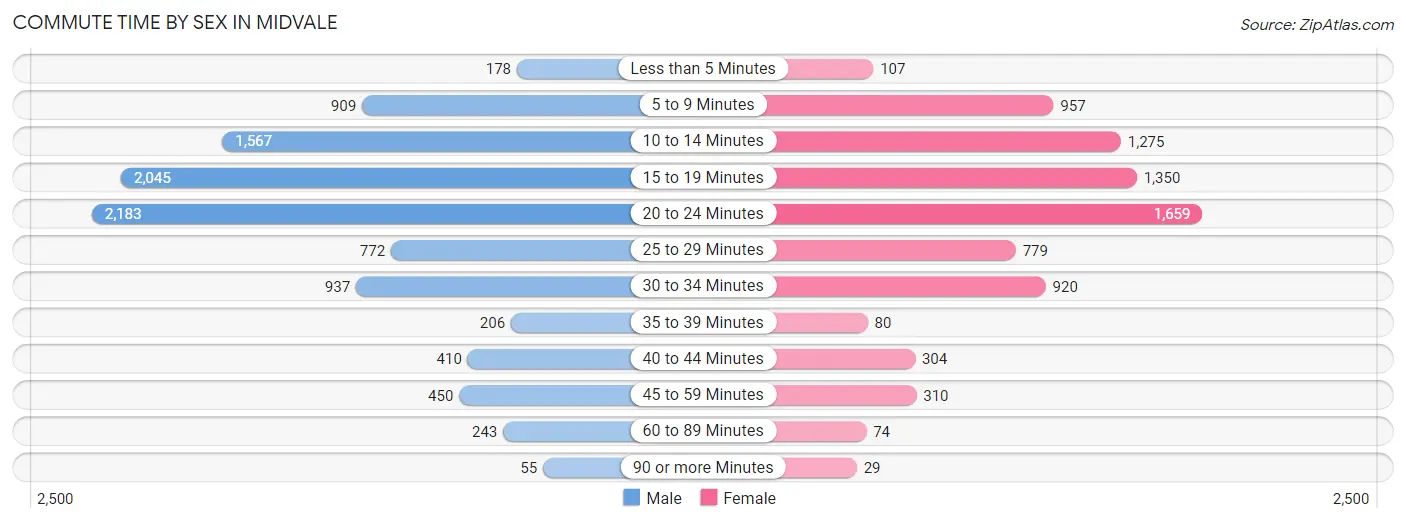
| Commute Time | Male | Female |
| Less than 5 Minutes | 178 (1.8%) | 107 (1.4%) |
| 5 to 9 Minutes | 909 (9.1%) | 957 (12.2%) |
| 10 to 14 Minutes | 1,567 (15.7%) | 1,275 (16.3%) |
| 15 to 19 Minutes | 2,045 (20.5%) | 1,350 (17.2%) |
| 20 to 24 Minutes | 2,183 (21.9%) | 1,659 (21.1%) |
| 25 to 29 Minutes | 772 (7.7%) | 779 (9.9%) |
| 30 to 34 Minutes | 937 (9.4%) | 920 (11.7%) |
| 35 to 39 Minutes | 206 (2.1%) | 80 (1.0%) |
| 40 to 44 Minutes | 410 (4.1%) | 304 (3.9%) |
| 45 to 59 Minutes | 450 (4.5%) | 310 (4.0%) |
| 60 to 89 Minutes | 243 (2.4%) | 74 (0.9%) |
| 90 or more Minutes | 55 (0.5%) | 29 (0.4%) |
Time of Departure to Work by Sex in Midvale
The most frequent times of departure to work in Midvale are 8:00 AM to 8:29 AM (1,456, 14.6%) for males and 8:00 AM to 8:29 AM (1,021, 13.0%) for females.
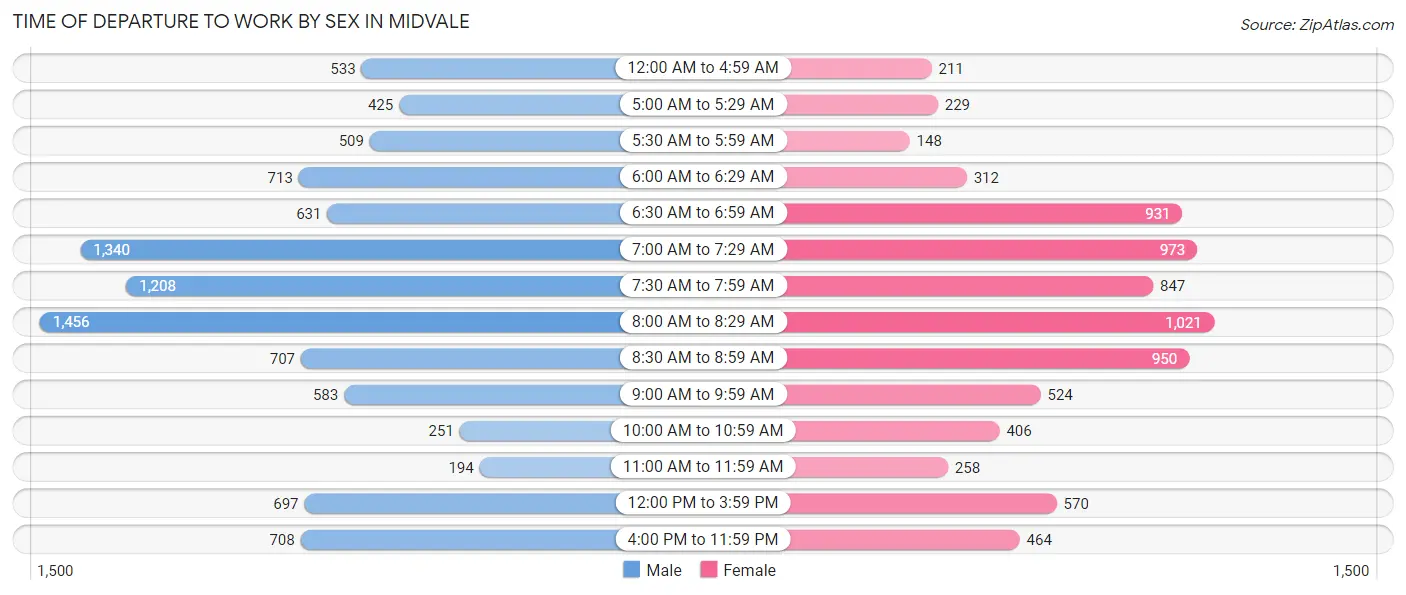
| Time of Departure | Male | Female |
| 12:00 AM to 4:59 AM | 533 (5.3%) | 211 (2.7%) |
| 5:00 AM to 5:29 AM | 425 (4.3%) | 229 (2.9%) |
| 5:30 AM to 5:59 AM | 509 (5.1%) | 148 (1.9%) |
| 6:00 AM to 6:29 AM | 713 (7.2%) | 312 (4.0%) |
| 6:30 AM to 6:59 AM | 631 (6.3%) | 931 (11.9%) |
| 7:00 AM to 7:29 AM | 1,340 (13.5%) | 973 (12.4%) |
| 7:30 AM to 7:59 AM | 1,208 (12.1%) | 847 (10.8%) |
| 8:00 AM to 8:29 AM | 1,456 (14.6%) | 1,021 (13.0%) |
| 8:30 AM to 8:59 AM | 707 (7.1%) | 950 (12.1%) |
| 9:00 AM to 9:59 AM | 583 (5.9%) | 524 (6.7%) |
| 10:00 AM to 10:59 AM | 251 (2.5%) | 406 (5.2%) |
| 11:00 AM to 11:59 AM | 194 (1.9%) | 258 (3.3%) |
| 12:00 PM to 3:59 PM | 697 (7.0%) | 570 (7.3%) |
| 4:00 PM to 11:59 PM | 708 (7.1%) | 464 (5.9%) |
| Total | 9,955 (100.0%) | 7,844 (100.0%) |
Housing Occupancy in Midvale
Occupancy by Ownership in Midvale
Of the total 14,871 dwellings in Midvale, owner-occupied units account for 6,724 (45.2%), while renter-occupied units make up 8,147 (54.8%).
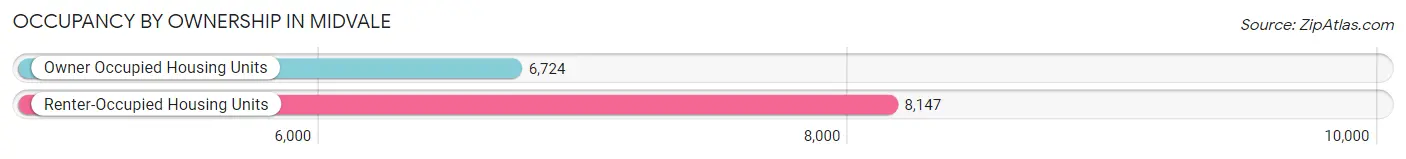
| Occupancy | # Housing Units | % Housing Units |
| Owner Occupied Housing Units | 6,724 | 45.2% |
| Renter-Occupied Housing Units | 8,147 | 54.8% |
| Total Occupied Housing Units | 14,871 | 100.0% |
Occupancy by Household Size in Midvale
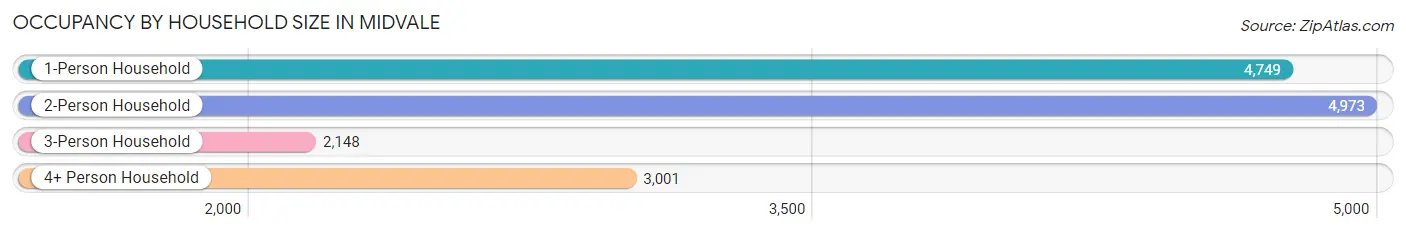
| Household Size | # Housing Units | % Housing Units |
| 1-Person Household | 4,749 | 31.9% |
| 2-Person Household | 4,973 | 33.4% |
| 3-Person Household | 2,148 | 14.4% |
| 4+ Person Household | 3,001 | 20.2% |
| Total Housing Units | 14,871 | 100.0% |
Occupancy by Ownership by Household Size in Midvale
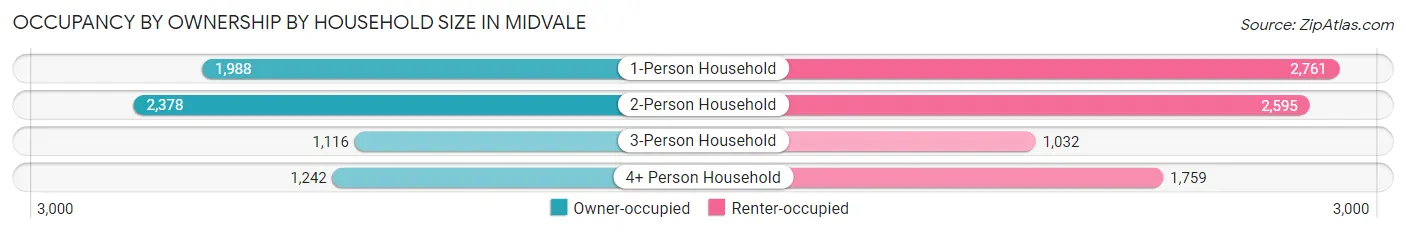
| Household Size | Owner-occupied | Renter-occupied |
| 1-Person Household | 1,988 (41.9%) | 2,761 (58.1%) |
| 2-Person Household | 2,378 (47.8%) | 2,595 (52.2%) |
| 3-Person Household | 1,116 (52.0%) | 1,032 (48.0%) |
| 4+ Person Household | 1,242 (41.4%) | 1,759 (58.6%) |
| Total Housing Units | 6,724 (45.2%) | 8,147 (54.8%) |
Occupancy by Educational Attainment in Midvale
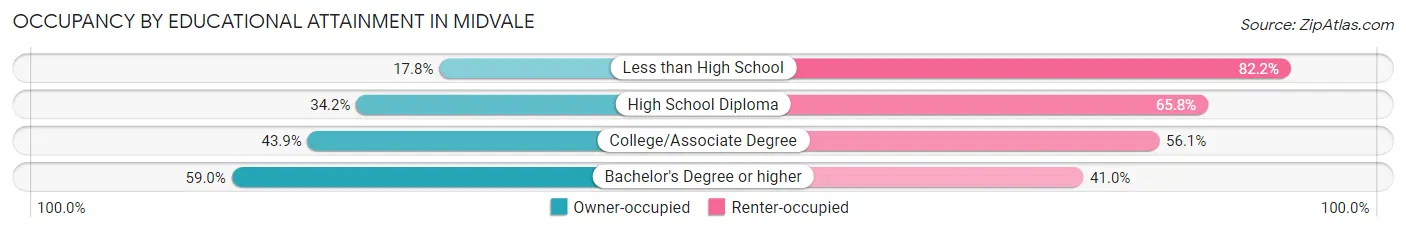
| Household Size | Owner-occupied | Renter-occupied |
| Less than High School | 214 (17.8%) | 989 (82.2%) |
| High School Diploma | 924 (34.2%) | 1,775 (65.8%) |
| College/Associate Degree | 2,569 (43.9%) | 3,283 (56.1%) |
| Bachelor's Degree or higher | 3,017 (59.0%) | 2,100 (41.0%) |
Occupancy by Age of Householder in Midvale
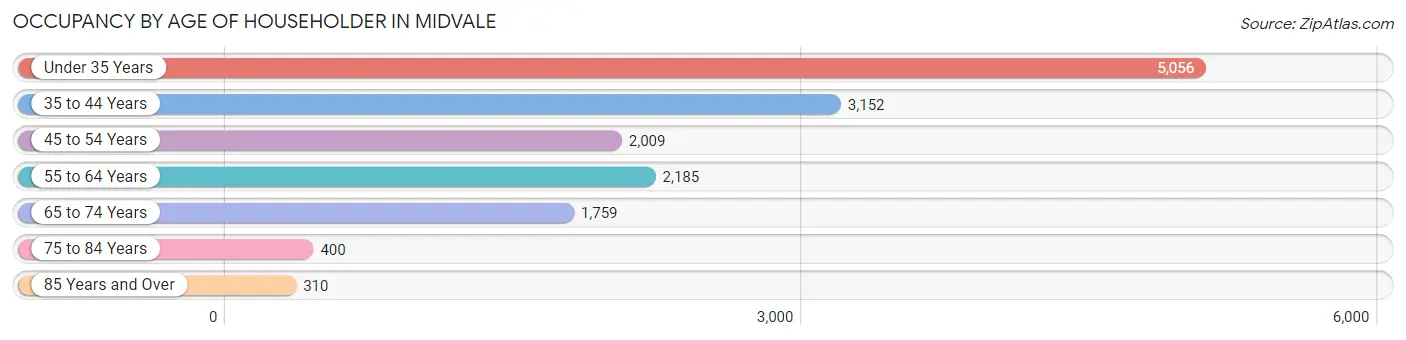
| Age Bracket | # Households | % Households |
| Under 35 Years | 5,056 | 34.0% |
| 35 to 44 Years | 3,152 | 21.2% |
| 45 to 54 Years | 2,009 | 13.5% |
| 55 to 64 Years | 2,185 | 14.7% |
| 65 to 74 Years | 1,759 | 11.8% |
| 75 to 84 Years | 400 | 2.7% |
| 85 Years and Over | 310 | 2.1% |
| Total | 14,871 | 100.0% |
Housing Finances in Midvale
Median Income by Occupancy in Midvale
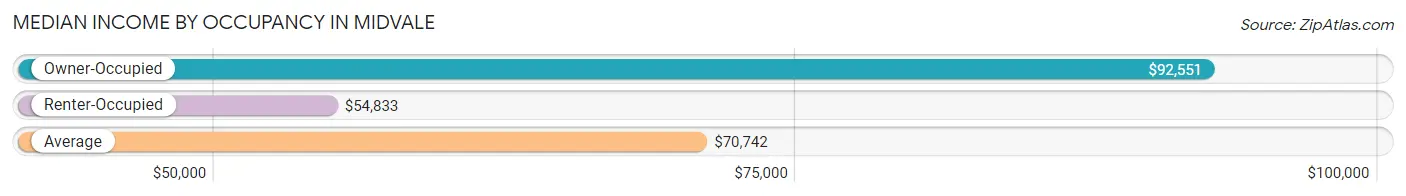
| Occupancy Type | # Households | Median Income |
| Owner-Occupied | 6,724 (45.2%) | $92,551 |
| Renter-Occupied | 8,147 (54.8%) | $54,833 |
| Average | 14,871 (100.0%) | $70,742 |
Occupancy by Householder Income Bracket in Midvale
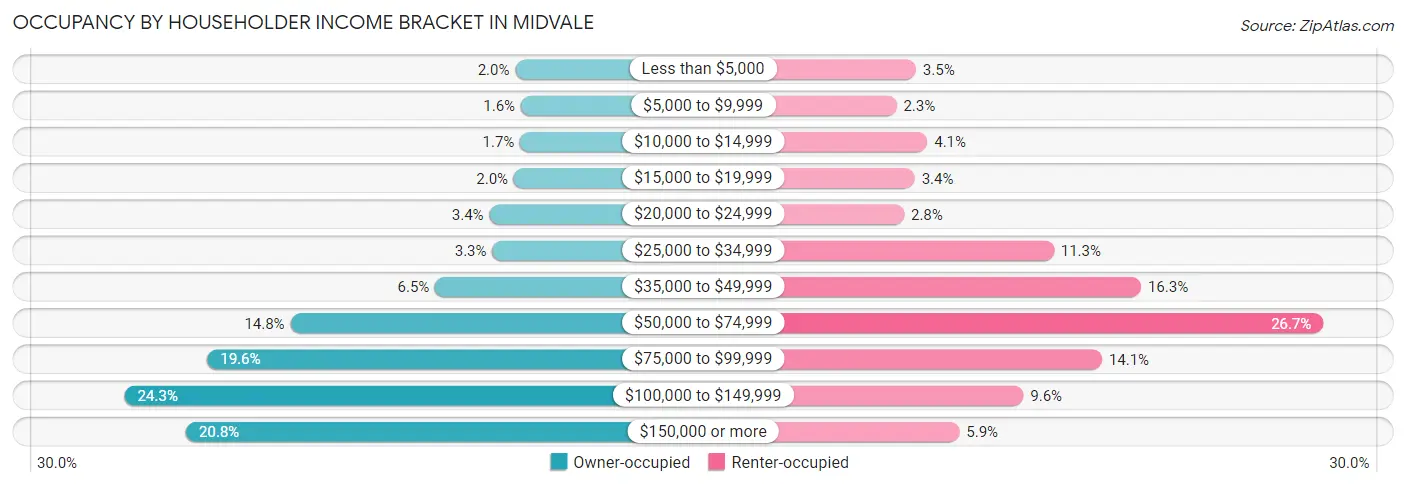
| Income Bracket | Owner-occupied | Renter-occupied |
| Less than $5,000 | 132 (2.0%) | 281 (3.5%) |
| $5,000 to $9,999 | 110 (1.6%) | 191 (2.3%) |
| $10,000 to $14,999 | 113 (1.7%) | 334 (4.1%) |
| $15,000 to $19,999 | 137 (2.0%) | 275 (3.4%) |
| $20,000 to $24,999 | 231 (3.4%) | 226 (2.8%) |
| $25,000 to $34,999 | 220 (3.3%) | 923 (11.3%) |
| $35,000 to $49,999 | 440 (6.5%) | 1,329 (16.3%) |
| $50,000 to $74,999 | 996 (14.8%) | 2,177 (26.7%) |
| $75,000 to $99,999 | 1,315 (19.6%) | 1,147 (14.1%) |
| $100,000 to $149,999 | 1,633 (24.3%) | 781 (9.6%) |
| $150,000 or more | 1,397 (20.8%) | 483 (5.9%) |
| Total | 6,724 (100.0%) | 8,147 (100.0%) |
Monthly Housing Cost Tiers in Midvale
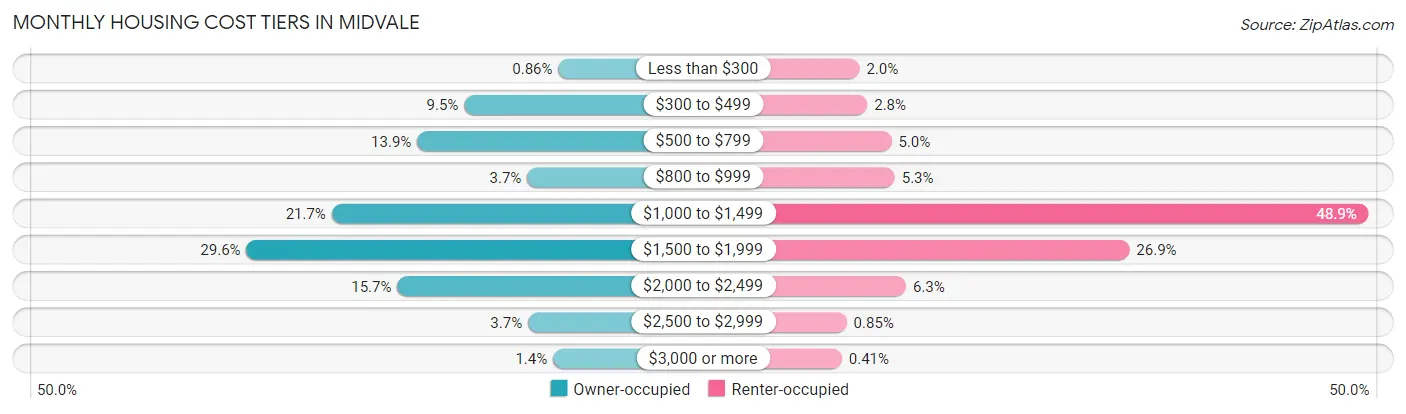
| Monthly Cost | Owner-occupied | Renter-occupied |
| Less than $300 | 58 (0.9%) | 165 (2.0%) |
| $300 to $499 | 641 (9.5%) | 224 (2.8%) |
| $500 to $799 | 932 (13.9%) | 406 (5.0%) |
| $800 to $999 | 251 (3.7%) | 430 (5.3%) |
| $1,000 to $1,499 | 1,461 (21.7%) | 3,984 (48.9%) |
| $1,500 to $1,999 | 1,989 (29.6%) | 2,190 (26.9%) |
| $2,000 to $2,499 | 1,055 (15.7%) | 514 (6.3%) |
| $2,500 to $2,999 | 246 (3.7%) | 69 (0.9%) |
| $3,000 or more | 91 (1.3%) | 33 (0.4%) |
| Total | 6,724 (100.0%) | 8,147 (100.0%) |
Physical Housing Characteristics in Midvale
Housing Structures in Midvale
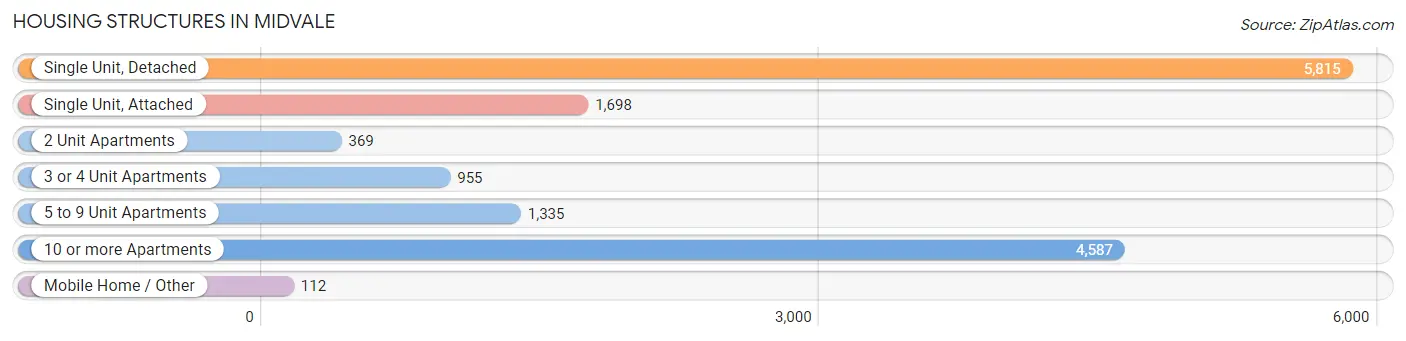
| Structure Type | # Housing Units | % Housing Units |
| Single Unit, Detached | 5,815 | 39.1% |
| Single Unit, Attached | 1,698 | 11.4% |
| 2 Unit Apartments | 369 | 2.5% |
| 3 or 4 Unit Apartments | 955 | 6.4% |
| 5 to 9 Unit Apartments | 1,335 | 9.0% |
| 10 or more Apartments | 4,587 | 30.8% |
| Mobile Home / Other | 112 | 0.7% |
| Total | 14,871 | 100.0% |
Housing Structures by Occupancy in Midvale
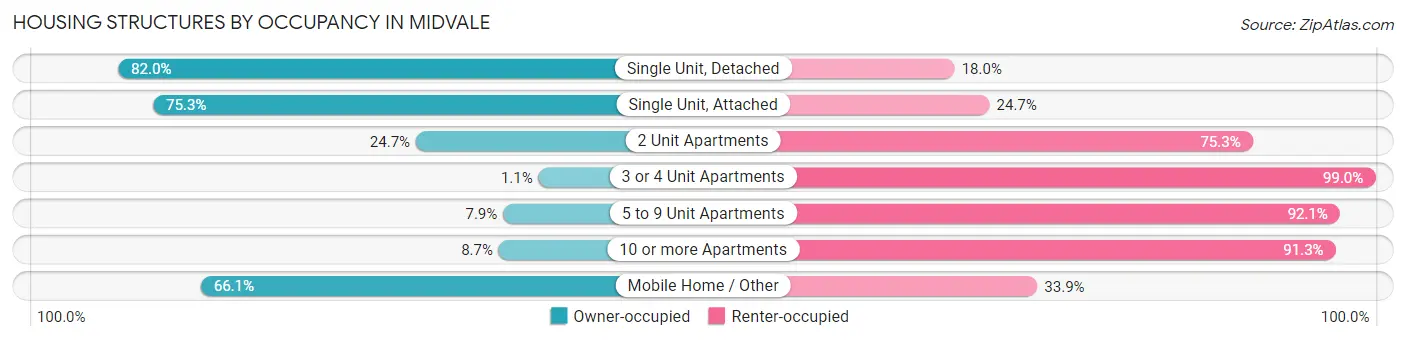
| Structure Type | Owner-occupied | Renter-occupied |
| Single Unit, Detached | 4,767 (82.0%) | 1,048 (18.0%) |
| Single Unit, Attached | 1,278 (75.3%) | 420 (24.7%) |
| 2 Unit Apartments | 91 (24.7%) | 278 (75.3%) |
| 3 or 4 Unit Apartments | 10 (1.1%) | 945 (99.0%) |
| 5 to 9 Unit Apartments | 105 (7.9%) | 1,230 (92.1%) |
| 10 or more Apartments | 399 (8.7%) | 4,188 (91.3%) |
| Mobile Home / Other | 74 (66.1%) | 38 (33.9%) |
| Total | 6,724 (45.2%) | 8,147 (54.8%) |
Housing Structures by Number of Rooms in Midvale
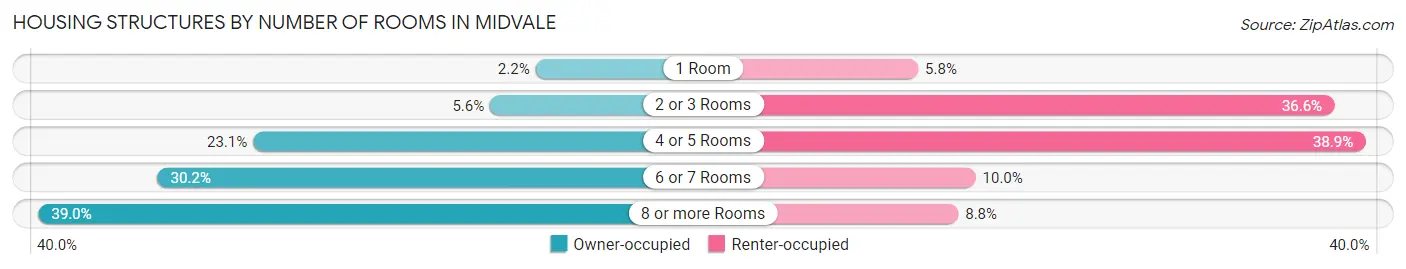
| Number of Rooms | Owner-occupied | Renter-occupied |
| 1 Room | 148 (2.2%) | 472 (5.8%) |
| 2 or 3 Rooms | 374 (5.6%) | 2,978 (36.5%) |
| 4 or 5 Rooms | 1,553 (23.1%) | 3,165 (38.9%) |
| 6 or 7 Rooms | 2,028 (30.2%) | 818 (10.0%) |
| 8 or more Rooms | 2,621 (39.0%) | 714 (8.8%) |
| Total | 6,724 (100.0%) | 8,147 (100.0%) |
Housing Structure by Heating Type in Midvale
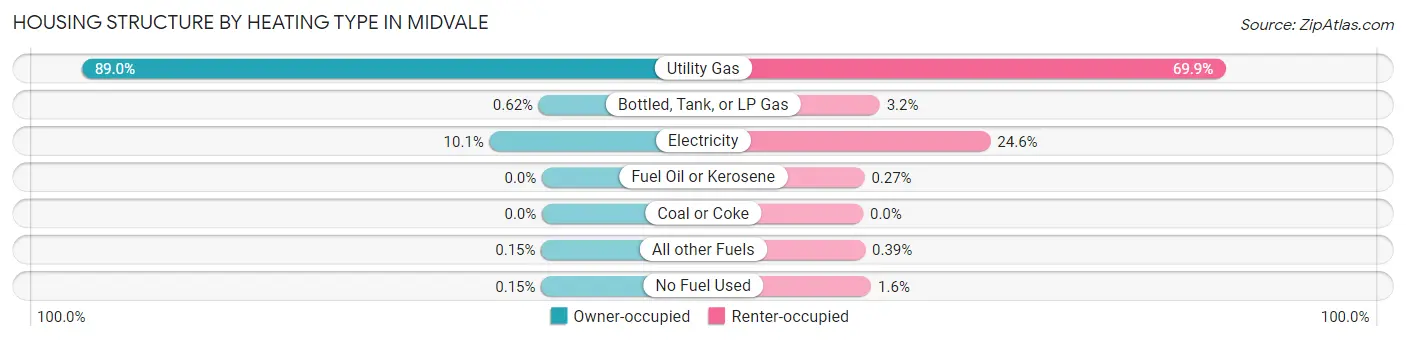
| Heating Type | Owner-occupied | Renter-occupied |
| Utility Gas | 5,981 (88.9%) | 5,698 (69.9%) |
| Bottled, Tank, or LP Gas | 42 (0.6%) | 262 (3.2%) |
| Electricity | 681 (10.1%) | 2,005 (24.6%) |
| Fuel Oil or Kerosene | 0 (0.0%) | 22 (0.3%) |
| Coal or Coke | 0 (0.0%) | 0 (0.0%) |
| All other Fuels | 10 (0.2%) | 32 (0.4%) |
| No Fuel Used | 10 (0.2%) | 128 (1.6%) |
| Total | 6,724 (100.0%) | 8,147 (100.0%) |
Household Vehicle Usage in Midvale
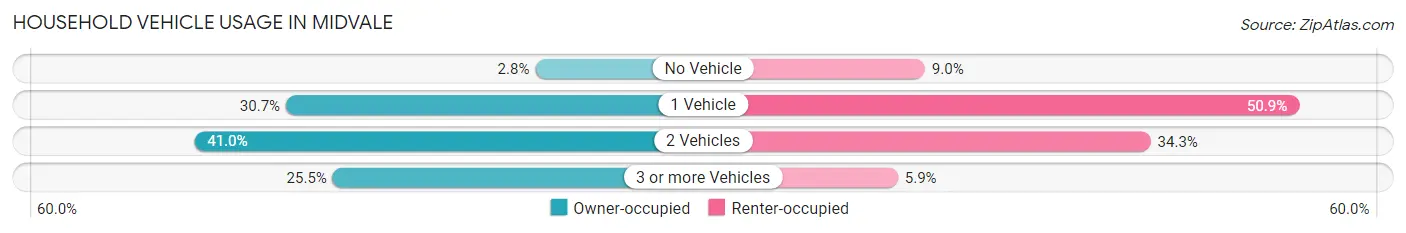
| Vehicles per Household | Owner-occupied | Renter-occupied |
| No Vehicle | 188 (2.8%) | 730 (9.0%) |
| 1 Vehicle | 2,066 (30.7%) | 4,144 (50.9%) |
| 2 Vehicles | 2,756 (41.0%) | 2,790 (34.3%) |
| 3 or more Vehicles | 1,714 (25.5%) | 483 (5.9%) |
| Total | 6,724 (100.0%) | 8,147 (100.0%) |
Real Estate & Mortgages in Midvale
Real Estate and Mortgage Overview in Midvale
| Characteristic | Without Mortgage | With Mortgage |
| Housing Units | 1,636 | 5,088 |
| Median Property Value | $367,500 | $354,800 |
| Median Household Income | $69,100 | $1,164 |
| Monthly Housing Costs | $526 | $91 |
| Real Estate Taxes | $2,434 | $143 |
Property Value by Mortgage Status in Midvale
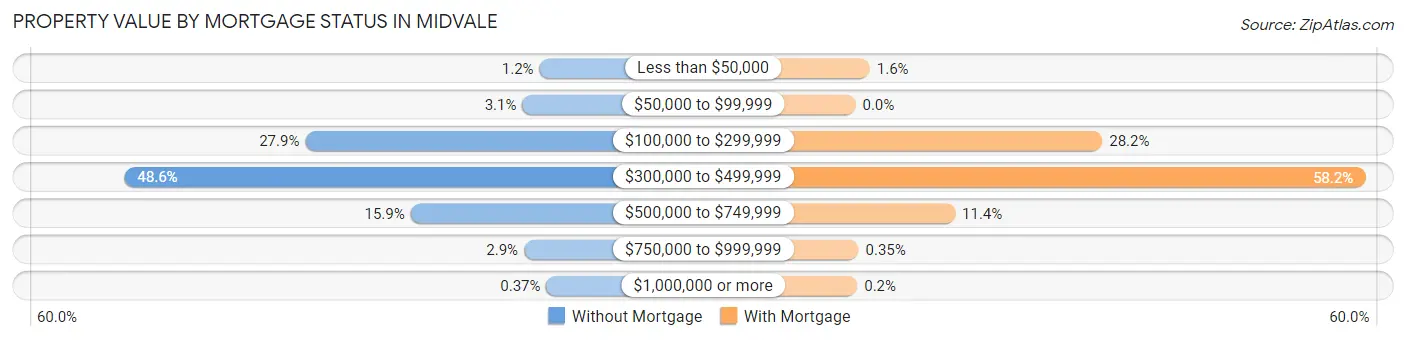
| Property Value | Without Mortgage | With Mortgage |
| Less than $50,000 | 19 (1.2%) | 83 (1.6%) |
| $50,000 to $99,999 | 51 (3.1%) | 0 (0.0%) |
| $100,000 to $299,999 | 457 (27.9%) | 1,435 (28.2%) |
| $300,000 to $499,999 | 795 (48.6%) | 2,963 (58.2%) |
| $500,000 to $749,999 | 260 (15.9%) | 579 (11.4%) |
| $750,000 to $999,999 | 48 (2.9%) | 18 (0.4%) |
| $1,000,000 or more | 6 (0.4%) | 10 (0.2%) |
| Total | 1,636 (100.0%) | 5,088 (100.0%) |
Household Income by Mortgage Status in Midvale
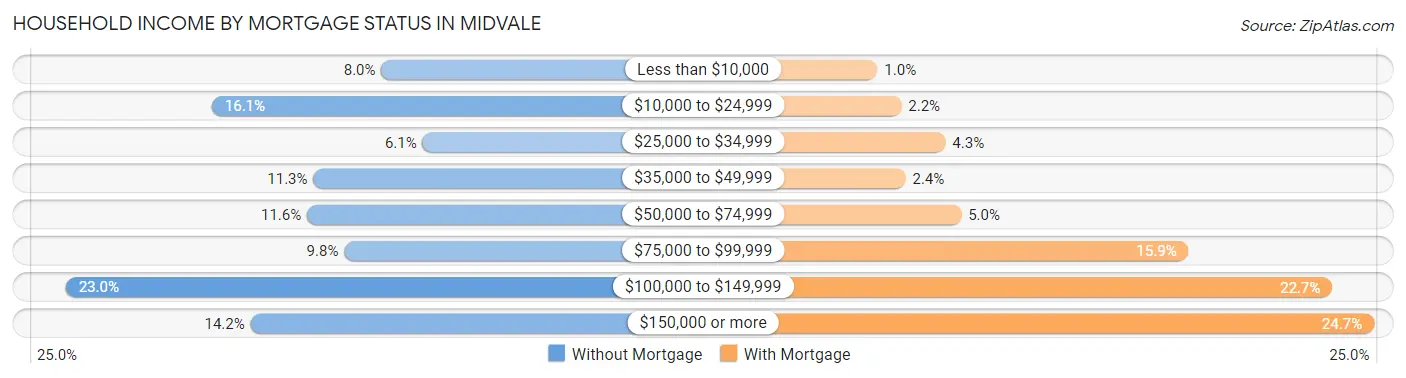
| Household Income | Without Mortgage | With Mortgage |
| Less than $10,000 | 131 (8.0%) | 53 (1.0%) |
| $10,000 to $24,999 | 263 (16.1%) | 111 (2.2%) |
| $25,000 to $34,999 | 99 (6.0%) | 218 (4.3%) |
| $35,000 to $49,999 | 184 (11.3%) | 121 (2.4%) |
| $50,000 to $74,999 | 189 (11.6%) | 256 (5.0%) |
| $75,000 to $99,999 | 160 (9.8%) | 807 (15.9%) |
| $100,000 to $149,999 | 377 (23.0%) | 1,155 (22.7%) |
| $150,000 or more | 233 (14.2%) | 1,256 (24.7%) |
| Total | 1,636 (100.0%) | 5,088 (100.0%) |
Property Value to Household Income Ratio in Midvale
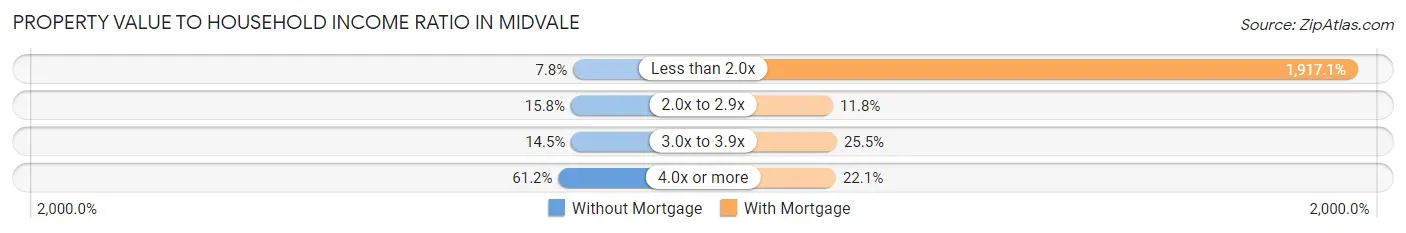
| Value-to-Income Ratio | Without Mortgage | With Mortgage |
| Less than 2.0x | 127 (7.8%) | 97,540 (1,917.1%) |
| 2.0x to 2.9x | 258 (15.8%) | 599 (11.8%) |
| 3.0x to 3.9x | 237 (14.5%) | 1,298 (25.5%) |
| 4.0x or more | 1,001 (61.2%) | 1,122 (22.1%) |
| Total | 1,636 (100.0%) | 5,088 (100.0%) |
Real Estate Taxes by Mortgage Status in Midvale
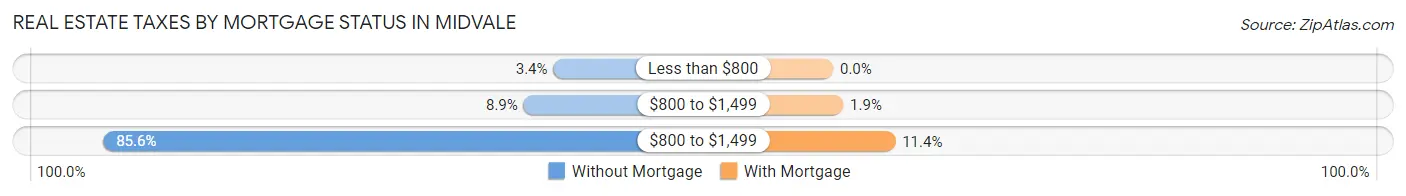
| Property Taxes | Without Mortgage | With Mortgage |
| Less than $800 | 56 (3.4%) | 0 (0.0%) |
| $800 to $1,499 | 145 (8.9%) | 94 (1.8%) |
| $800 to $1,499 | 1,401 (85.6%) | 578 (11.4%) |
| Total | 1,636 (100.0%) | 5,088 (100.0%) |
Health & Disability in Midvale
Health Insurance Coverage by Age in Midvale
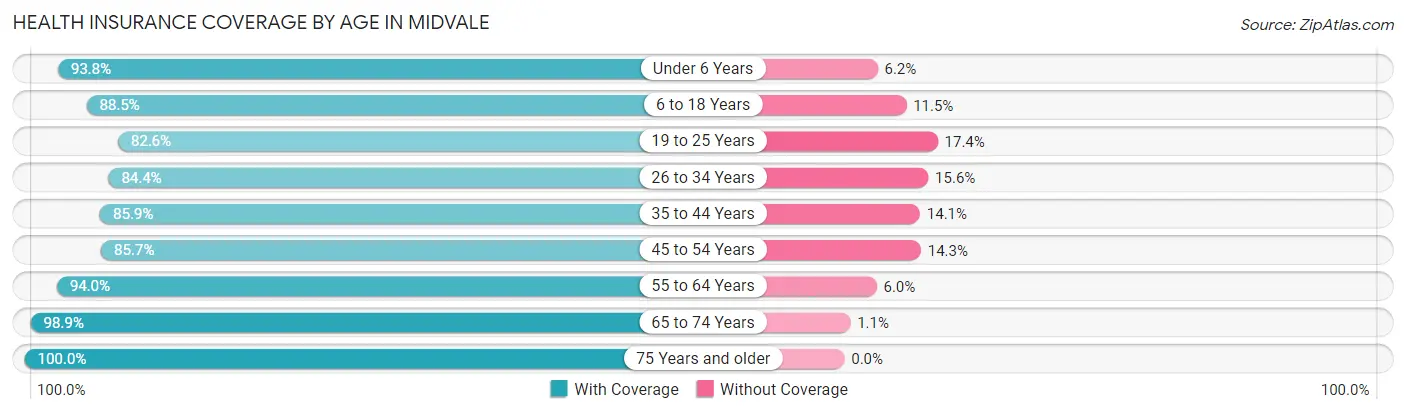
| Age Bracket | With Coverage | Without Coverage |
| Under 6 Years | 2,906 (93.8%) | 192 (6.2%) |
| 6 to 18 Years | 4,592 (88.5%) | 599 (11.5%) |
| 19 to 25 Years | 3,518 (82.6%) | 741 (17.4%) |
| 26 to 34 Years | 6,014 (84.4%) | 1,115 (15.6%) |
| 35 to 44 Years | 4,843 (85.9%) | 794 (14.1%) |
| 45 to 54 Years | 2,789 (85.7%) | 464 (14.3%) |
| 55 to 64 Years | 3,224 (94.0%) | 206 (6.0%) |
| 65 to 74 Years | 2,525 (98.9%) | 28 (1.1%) |
| 75 Years and older | 1,008 (100.0%) | 0 (0.0%) |
| Total | 31,419 (88.4%) | 4,139 (11.6%) |
Health Insurance Coverage by Citizenship Status in Midvale
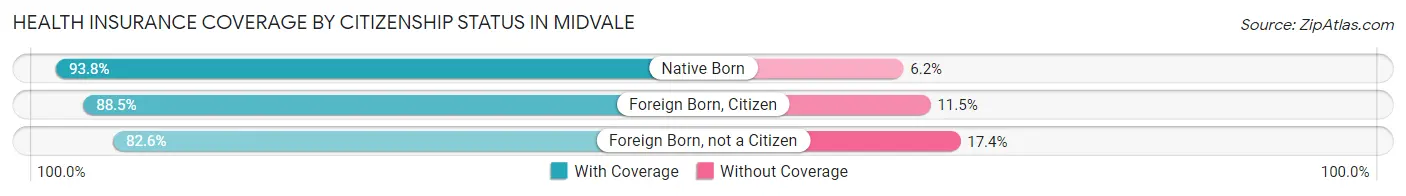
| Citizenship Status | With Coverage | Without Coverage |
| Native Born | 2,906 (93.8%) | 192 (6.2%) |
| Foreign Born, Citizen | 4,592 (88.5%) | 599 (11.5%) |
| Foreign Born, not a Citizen | 3,518 (82.6%) | 741 (17.4%) |
Health Insurance Coverage by Household Income in Midvale
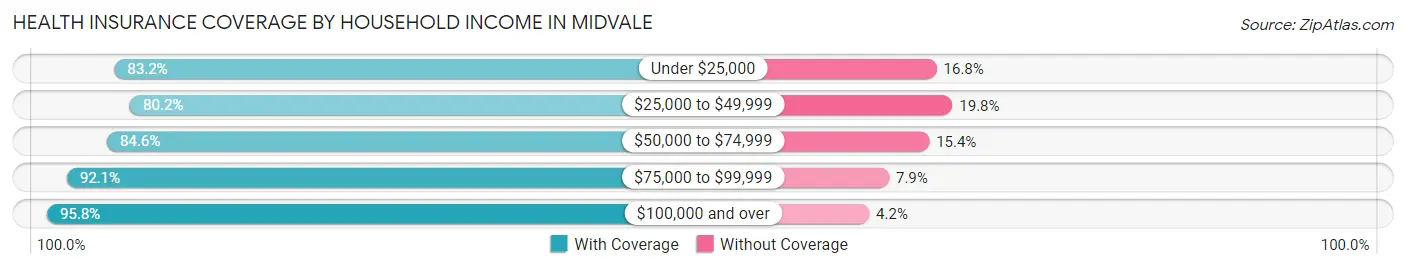
| Household Income | With Coverage | Without Coverage |
| Under $25,000 | 2,535 (83.2%) | 513 (16.8%) |
| $25,000 to $49,999 | 4,710 (80.2%) | 1,161 (19.8%) |
| $50,000 to $74,999 | 6,232 (84.6%) | 1,138 (15.4%) |
| $75,000 to $99,999 | 5,660 (92.1%) | 486 (7.9%) |
| $100,000 and over | 12,160 (95.8%) | 532 (4.2%) |
Public vs Private Health Insurance Coverage by Age in Midvale
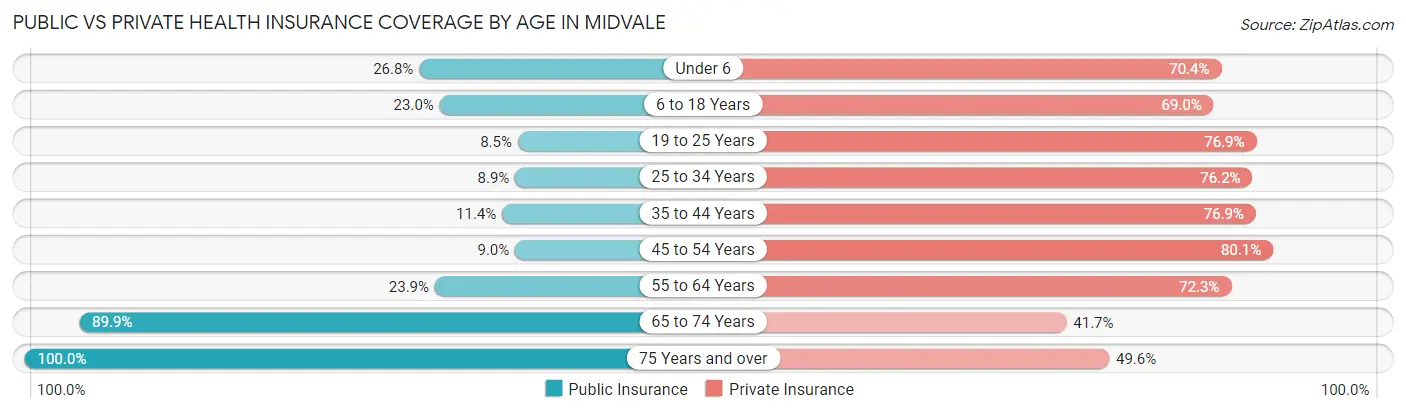
| Age Bracket | Public Insurance | Private Insurance |
| Under 6 | 829 (26.8%) | 2,182 (70.4%) |
| 6 to 18 Years | 1,192 (23.0%) | 3,583 (69.0%) |
| 19 to 25 Years | 360 (8.5%) | 3,277 (76.9%) |
| 25 to 34 Years | 637 (8.9%) | 5,433 (76.2%) |
| 35 to 44 Years | 641 (11.4%) | 4,332 (76.8%) |
| 45 to 54 Years | 291 (8.9%) | 2,604 (80.0%) |
| 55 to 64 Years | 818 (23.8%) | 2,480 (72.3%) |
| 65 to 74 Years | 2,295 (89.9%) | 1,064 (41.7%) |
| 75 Years and over | 1,008 (100.0%) | 500 (49.6%) |
| Total | 8,071 (22.7%) | 25,455 (71.6%) |
Disability Status by Sex by Age in Midvale
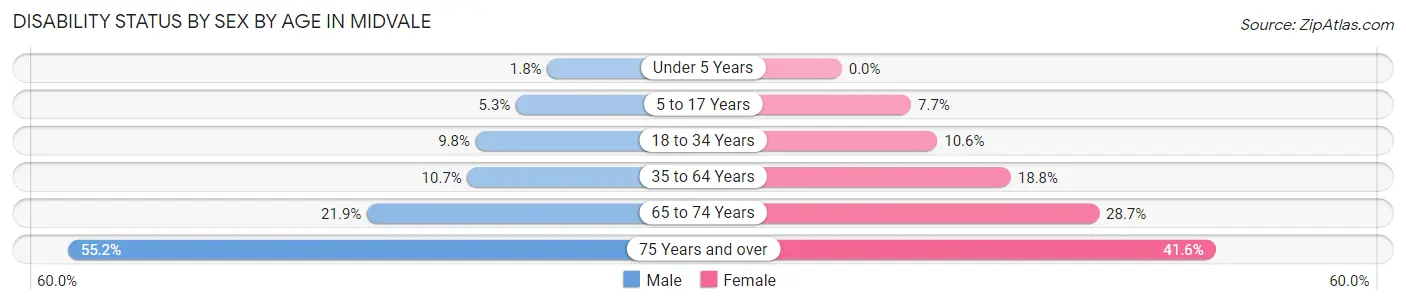
| Age Bracket | Male | Female |
| Under 5 Years | 23 (1.8%) | 0 (0.0%) |
| 5 to 17 Years | 150 (5.2%) | 207 (7.7%) |
| 18 to 34 Years | 602 (9.8%) | 581 (10.6%) |
| 35 to 64 Years | 656 (10.7%) | 1,161 (18.8%) |
| 65 to 74 Years | 262 (21.8%) | 388 (28.7%) |
| 75 Years and over | 266 (55.2%) | 219 (41.6%) |
Disability Class by Sex by Age in Midvale
Disability Class: Hearing Difficulty
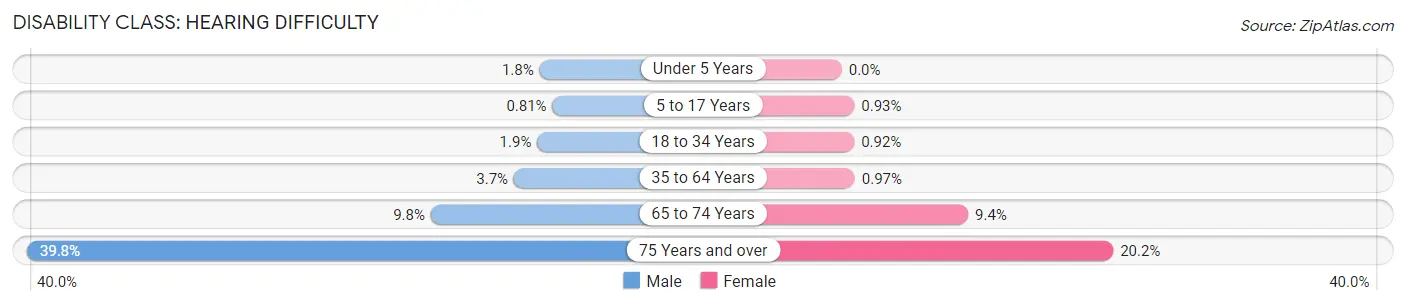
| Age Bracket | Male | Female |
| Under 5 Years | 23 (1.8%) | 0 (0.0%) |
| 5 to 17 Years | 23 (0.8%) | 25 (0.9%) |
| 18 to 34 Years | 120 (1.9%) | 50 (0.9%) |
| 35 to 64 Years | 226 (3.7%) | 60 (1.0%) |
| 65 to 74 Years | 118 (9.8%) | 127 (9.4%) |
| 75 Years and over | 192 (39.8%) | 106 (20.2%) |
Disability Class: Vision Difficulty
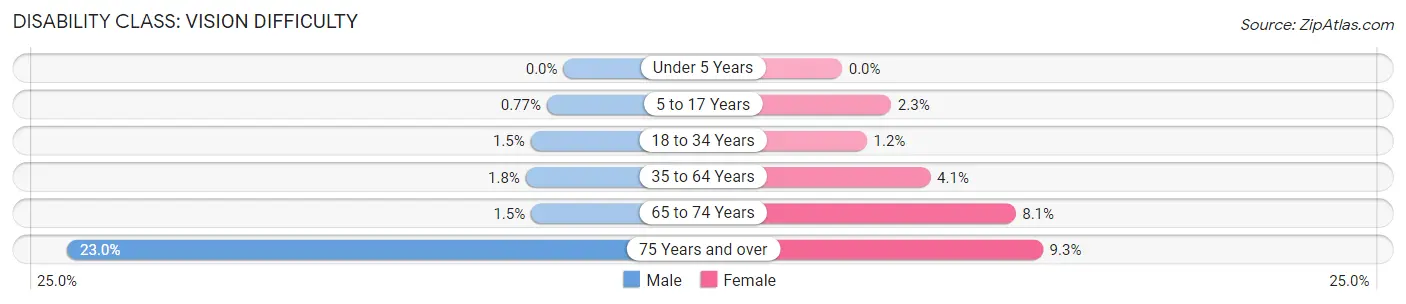
| Age Bracket | Male | Female |
| Under 5 Years | 0 (0.0%) | 0 (0.0%) |
| 5 to 17 Years | 22 (0.8%) | 61 (2.3%) |
| 18 to 34 Years | 94 (1.5%) | 63 (1.1%) |
| 35 to 64 Years | 108 (1.8%) | 253 (4.1%) |
| 65 to 74 Years | 18 (1.5%) | 109 (8.1%) |
| 75 Years and over | 111 (23.0%) | 49 (9.3%) |
Disability Class: Cognitive Difficulty
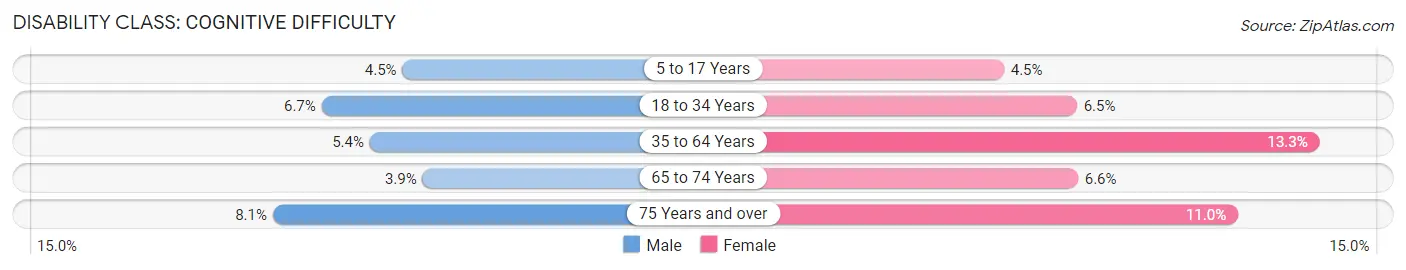
| Age Bracket | Male | Female |
| 5 to 17 Years | 128 (4.5%) | 121 (4.5%) |
| 18 to 34 Years | 416 (6.7%) | 357 (6.5%) |
| 35 to 64 Years | 332 (5.4%) | 820 (13.3%) |
| 65 to 74 Years | 47 (3.9%) | 89 (6.6%) |
| 75 Years and over | 39 (8.1%) | 58 (11.0%) |
Disability Class: Ambulatory Difficulty
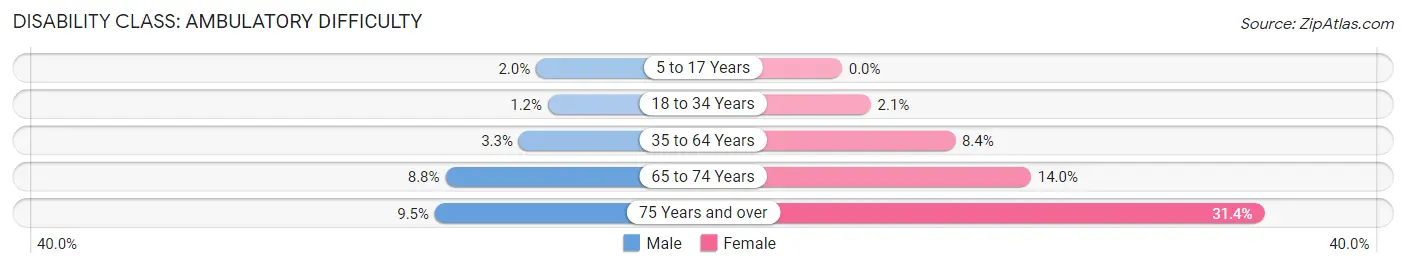
| Age Bracket | Male | Female |
| 5 to 17 Years | 58 (2.0%) | 0 (0.0%) |
| 18 to 34 Years | 71 (1.1%) | 117 (2.1%) |
| 35 to 64 Years | 204 (3.3%) | 518 (8.4%) |
| 65 to 74 Years | 105 (8.8%) | 190 (14.0%) |
| 75 Years and over | 46 (9.5%) | 165 (31.4%) |
Disability Class: Self-Care Difficulty
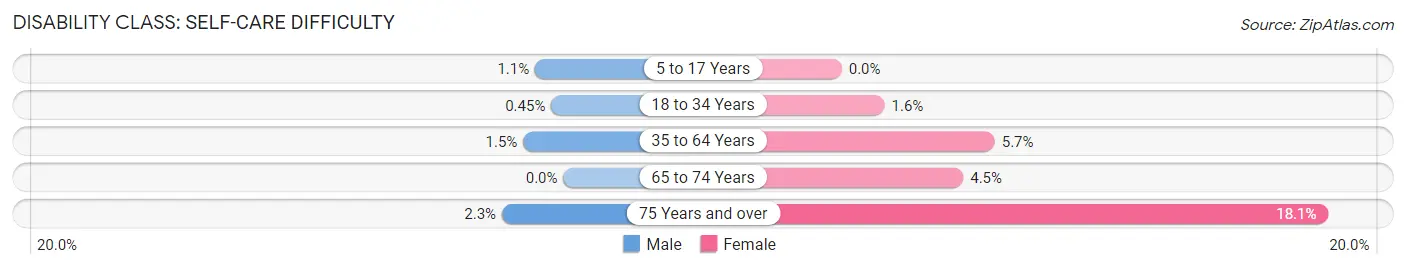
| Age Bracket | Male | Female |
| 5 to 17 Years | 30 (1.1%) | 0 (0.0%) |
| 18 to 34 Years | 28 (0.4%) | 87 (1.6%) |
| 35 to 64 Years | 92 (1.5%) | 350 (5.7%) |
| 65 to 74 Years | 0 (0.0%) | 61 (4.5%) |
| 75 Years and over | 11 (2.3%) | 95 (18.1%) |
Technology Access in Midvale
Computing Device Access in Midvale
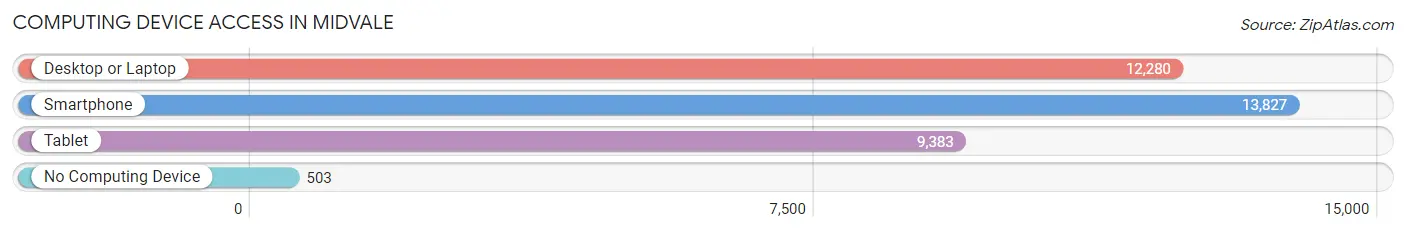
| Device Type | # Households | % Households |
| Desktop or Laptop | 12,280 | 82.6% |
| Smartphone | 13,827 | 93.0% |
| Tablet | 9,383 | 63.1% |
| No Computing Device | 503 | 3.4% |
| Total | 14,871 | 100.0% |
Internet Access in Midvale
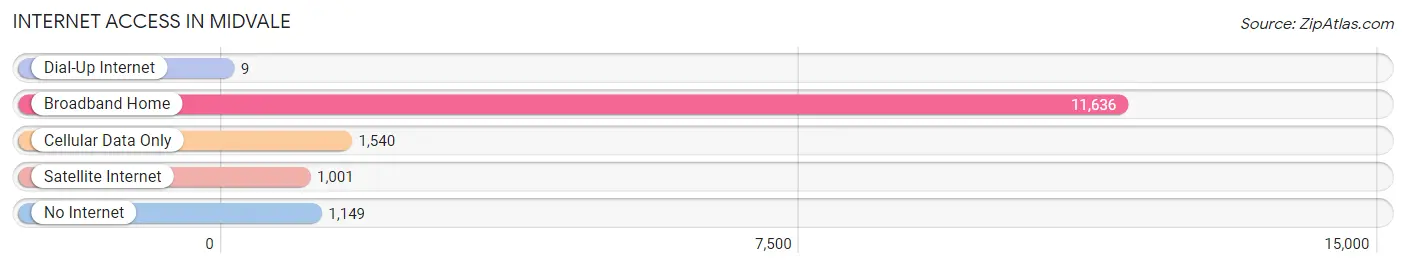
| Internet Type | # Households | % Households |
| Dial-Up Internet | 9 | 0.1% |
| Broadband Home | 11,636 | 78.2% |
| Cellular Data Only | 1,540 | 10.4% |
| Satellite Internet | 1,001 | 6.7% |
| No Internet | 1,149 | 7.7% |
| Total | 14,871 | 100.0% |
Midvale Summary
Midvale, Utah is a city located in Salt Lake County, Utah, United States. It is part of the Salt Lake City metropolitan area. The population was 30,764 at the 2010 census, making it the sixth-largest city in Utah.
History
Midvale was first settled in 1851 by a group of Mormon pioneers led by William Midgley. The town was originally known as Union, but was later renamed Midvale in 1868. The name was chosen to reflect the town's location between Salt Lake City and Sandy.
Midvale was incorporated as a city in 1938. The city has grown steadily since then, and today is home to a diverse population of over 30,000 people.
Geography
Midvale is located in the Salt Lake Valley, at the base of the Wasatch Mountains. The city is bordered by the cities of Sandy to the north, West Jordan to the west, and Murray to the south. The city covers an area of 8.3 square miles, with a population density of 3,717 people per square mile.
The city is served by the Jordan School District, which includes seven elementary schools, two middle schools, and one high school.
Economy
Midvale is home to a variety of businesses, including manufacturing, retail, and service industries. The city is also home to several large employers, including the University of Utah, Intermountain Healthcare, and the Salt Lake City International Airport.
The median household income in Midvale is $50,945, and the median home value is $219,400. The unemployment rate is 4.2%, which is lower than the national average.
Demographics
As of the 2010 census, there were 30,764 people, 11,845 households, and 7,845 families residing in Midvale. The population density was 3,717 people per square mile. The racial makeup of the city was 79.2% White, 4.3% African American, 0.7% Native American, 5.2% Asian, 0.2% Pacific Islander, 6.3% from other races, and 4.1% from two or more races. Hispanic or Latino of any race were 11.7% of the population.
The median age in Midvale was 33.7 years. 22.2% of residents were under the age of 18; 9.2% were between the ages of 18 and 24; 32.2% were from 25 to 44; 24.3% were from 45 to 64; and 12.1% were 65 years of age or older. The gender makeup of the city was 48.7% male and 51.3% female.
Midvale is a diverse city, with a variety of cultures and religions represented. The city is home to a large Mormon population, as well as a growing number of non-Mormons. The city is also home to a large Hispanic population, with over 11% of the population identifying as Hispanic or Latino.
Common Questions
What is Per Capita Income in Midvale?
Per Capita income in Midvale is $36,500.
What is the Median Family Income in Midvale?
Median Family Income in Midvale is $79,281.
What is the Median Household income in Midvale?
Median Household Income in Midvale is $70,742.
What is Income or Wage Gap in Midvale?
Income or Wage Gap in Midvale is 16.6%.
Women in Midvale earn 83.4 cents for every dollar earned by a man.
What is Inequality or Gini Index in Midvale?
Inequality or Gini Index in Midvale is 0.41.
What is the Total Population of Midvale?
Total Population of Midvale is 35,609.
What is the Total Male Population of Midvale?
Total Male Population of Midvale is 18,190.
What is the Total Female Population of Midvale?
Total Female Population of Midvale is 17,419.
What is the Ratio of Males per 100 Females in Midvale?
There are 104.43 Males per 100 Females in Midvale.
What is the Ratio of Females per 100 Males in Midvale?
There are 95.76 Females per 100 Males in Midvale.
What is the Median Population Age in Midvale?
Median Population Age in Midvale is 32.7 Years.
What is the Average Family Size in Midvale
Average Family Size in Midvale is 3.0 People.
What is the Average Household Size in Midvale
Average Household Size in Midvale is 2.4 People.
How Large is the Labor Force in Midvale?
There are 21,449 People in the Labor Forcein in Midvale.
What is the Percentage of People in the Labor Force in Midvale?
75.3% of People are in the Labor Force in Midvale.
What is the Unemployment Rate in Midvale?
Unemployment Rate in Midvale is 3.0%.