Grover Beach, CA Map & Demographics
Grover Beach Map
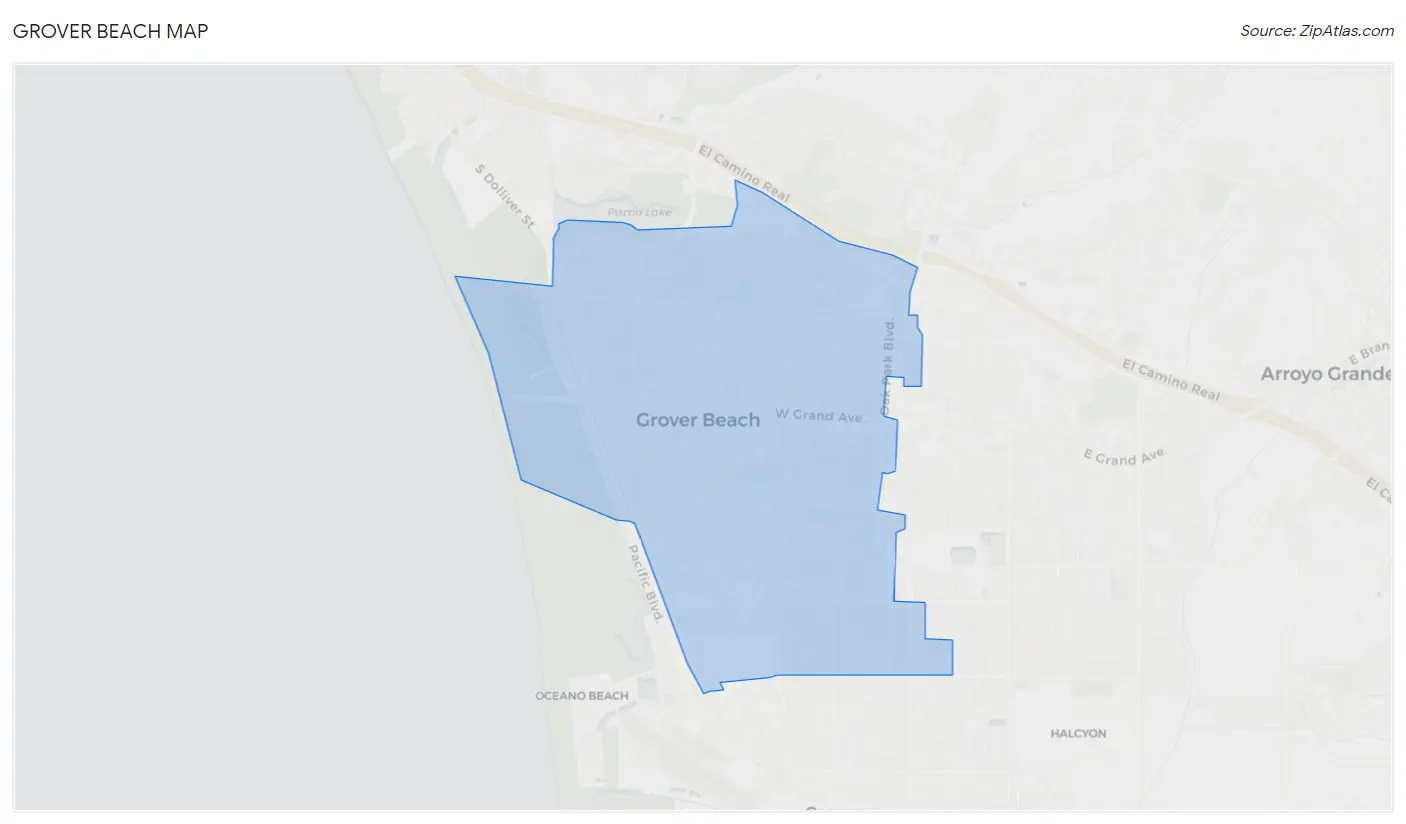
Grover Beach Overview
$40,184
PER CAPITA INCOME
$92,559
AVG FAMILY INCOME
$80,438
AVG HOUSEHOLD INCOME
4.0%
WAGE / INCOME GAP [ % ]
96.0¢/ $1
WAGE / INCOME GAP [ $ ]
0.43
INEQUALITY / GINI INDEX
12,757
TOTAL POPULATION
6,559
MALE POPULATION
6,198
FEMALE POPULATION
105.82
MALES / 100 FEMALES
94.50
FEMALES / 100 MALES
40.3
MEDIAN AGE
3.0
AVG FAMILY SIZE
2.5
AVG HOUSEHOLD SIZE
6,706
LABOR FORCE [ PEOPLE ]
65.2%
PERCENT IN LABOR FORCE
3.1%
UNEMPLOYMENT RATE
Grover Beach Zip Codes
Grover Beach Area Codes
Income in Grover Beach
Income Overview in Grover Beach
Per Capita Income in Grover Beach is $40,184, while median incomes of families and households are $92,559 and $80,438 respectively.
| Characteristic | Number | Measure |
| Per Capita Income | 12,757 | $40,184 |
| Median Family Income | 3,280 | $92,559 |
| Mean Family Income | 3,280 | $112,276 |
| Median Household Income | 5,140 | $80,438 |
| Mean Household Income | 5,140 | $98,068 |
| Income Deficit | 3,280 | $0 |
| Wage / Income Gap (%) | 12,757 | 4.01% |
| Wage / Income Gap ($) | 12,757 | 95.99¢ per $1 |
| Gini / Inequality Index | 12,757 | 0.43 |
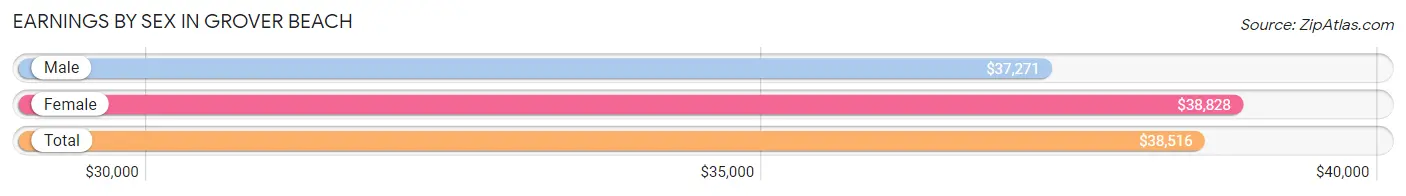
Earnings by Sex in Grover Beach
Average Earnings in Grover Beach are $38,516, $37,271 for men and $38,828 for women, a difference of 4.0%.
| Sex | Number | Average Earnings |
| Male | 3,822 (54.5%) | $37,271 |
| Female | 3,192 (45.5%) | $38,828 |
| Total | 7,014 (100.0%) | $38,516 |
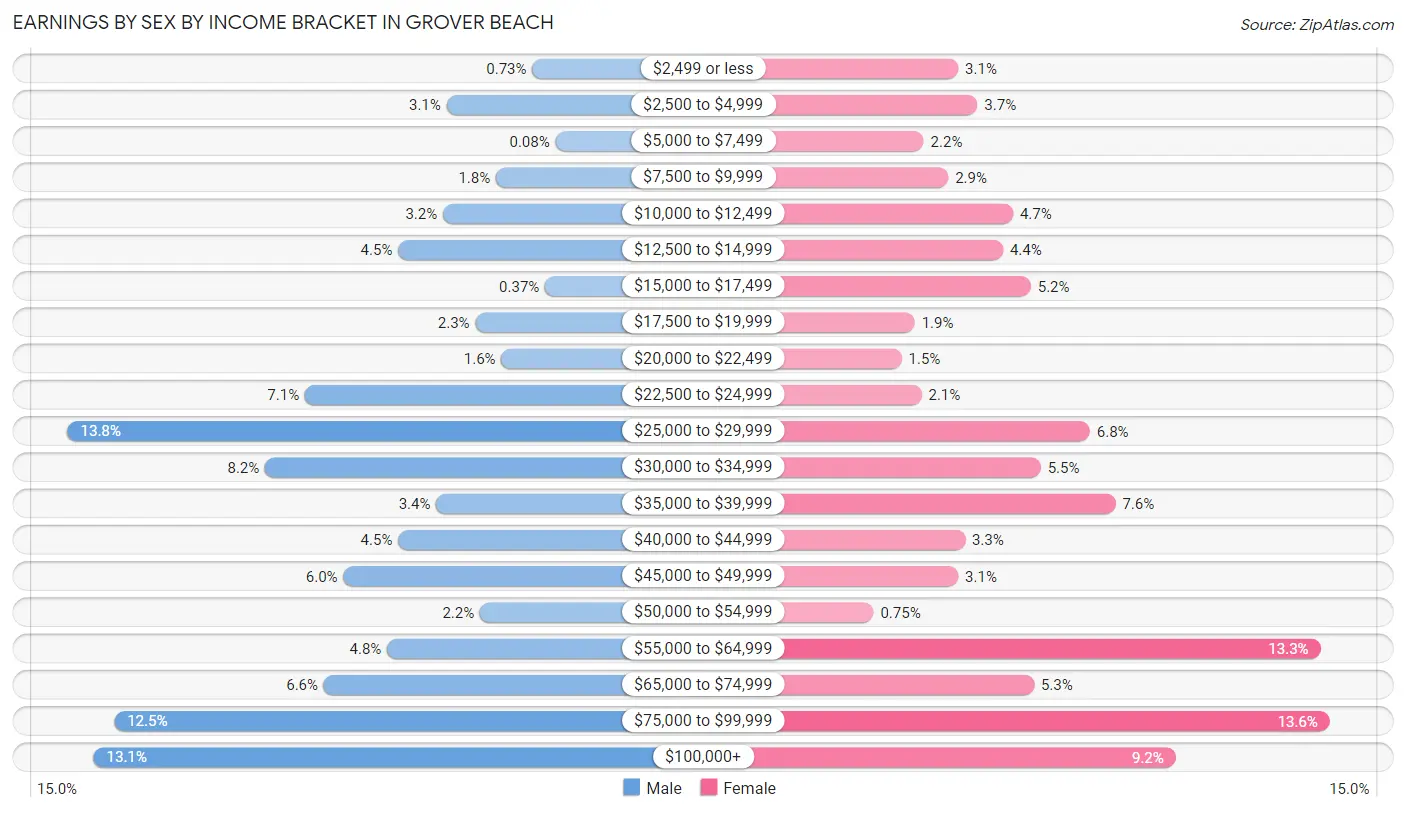
Earnings by Sex by Income Bracket in Grover Beach
The most common earnings brackets in Grover Beach are $25,000 to $29,999 for men (527 | 13.8%) and $75,000 to $99,999 for women (433 | 13.6%).
| Income | Male | Female |
| $2,499 or less | 28 (0.7%) | 100 (3.1%) |
| $2,500 to $4,999 | 120 (3.1%) | 117 (3.7%) |
| $5,000 to $7,499 | 3 (0.1%) | 69 (2.2%) |
| $7,500 to $9,999 | 67 (1.8%) | 91 (2.9%) |
| $10,000 to $12,499 | 124 (3.2%) | 149 (4.7%) |
| $12,500 to $14,999 | 172 (4.5%) | 140 (4.4%) |
| $15,000 to $17,499 | 14 (0.4%) | 165 (5.2%) |
| $17,500 to $19,999 | 89 (2.3%) | 61 (1.9%) |
| $20,000 to $22,499 | 61 (1.6%) | 49 (1.5%) |
| $22,500 to $24,999 | 272 (7.1%) | 67 (2.1%) |
| $25,000 to $29,999 | 527 (13.8%) | 218 (6.8%) |
| $30,000 to $34,999 | 315 (8.2%) | 174 (5.4%) |
| $35,000 to $39,999 | 131 (3.4%) | 241 (7.5%) |
| $40,000 to $44,999 | 172 (4.5%) | 106 (3.3%) |
| $45,000 to $49,999 | 231 (6.0%) | 100 (3.1%) |
| $50,000 to $54,999 | 84 (2.2%) | 24 (0.7%) |
| $55,000 to $64,999 | 184 (4.8%) | 425 (13.3%) |
| $65,000 to $74,999 | 252 (6.6%) | 168 (5.3%) |
| $75,000 to $99,999 | 477 (12.5%) | 433 (13.6%) |
| $100,000+ | 499 (13.1%) | 295 (9.2%) |
| Total | 3,822 (100.0%) | 3,192 (100.0%) |
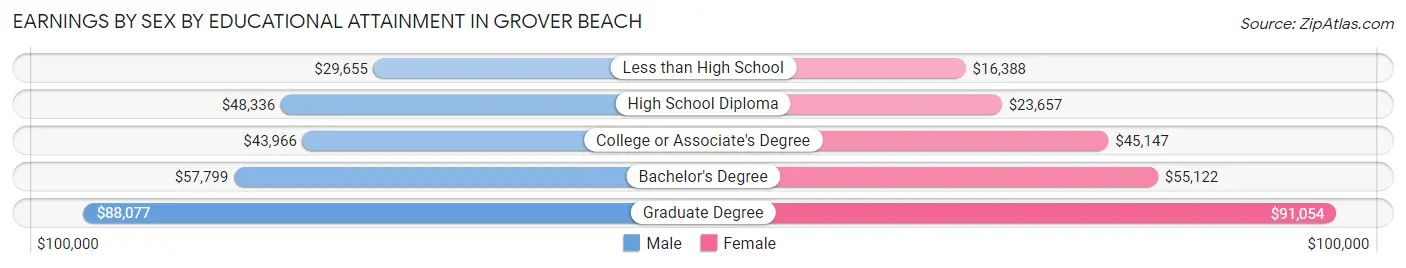
Earnings by Sex by Educational Attainment in Grover Beach
Average earnings in Grover Beach are $45,044 for men and $42,452 for women, a difference of 5.8%. Men with an educational attainment of graduate degree enjoy the highest average annual earnings of $88,077, while those with less than high school education earn the least with $29,655. Women with an educational attainment of graduate degree earn the most with the average annual earnings of $91,054, while those with less than high school education have the smallest earnings of $16,388.
| Educational Attainment | Male Income | Female Income |
| Less than High School | $29,655 | $16,388 |
| High School Diploma | $48,336 | $23,657 |
| College or Associate's Degree | $43,966 | $45,147 |
| Bachelor's Degree | $57,799 | $55,122 |
| Graduate Degree | $88,077 | $91,054 |
| Total | $45,044 | $42,452 |
Family Income in Grover Beach
Family Income Brackets in Grover Beach
According to the Grover Beach family income data, there are 758 families falling into the $100,000 to $149,999 income range, which is the most common income bracket and makes up 23.1% of all families. Conversely, the less than $10,000 income bracket is the least frequent group with only 59 families (1.8%) belonging to this category.
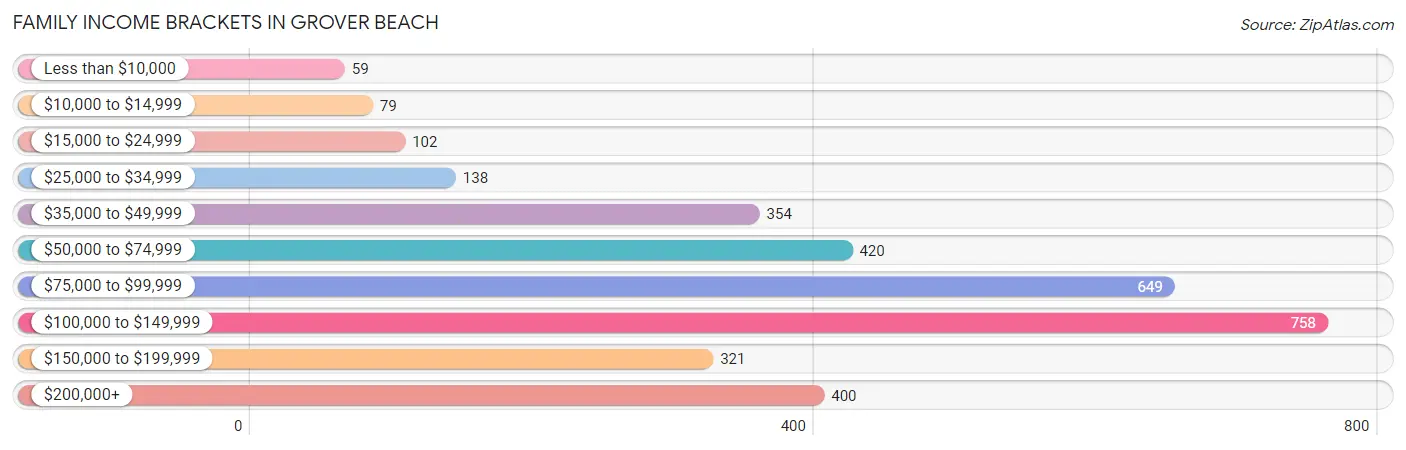
| Income Bracket | # Families | % Families |
| Less than $10,000 | 59 | 1.8% |
| $10,000 to $14,999 | 79 | 2.4% |
| $15,000 to $24,999 | 102 | 3.1% |
| $25,000 to $34,999 | 138 | 4.2% |
| $35,000 to $49,999 | 354 | 10.8% |
| $50,000 to $74,999 | 420 | 12.8% |
| $75,000 to $99,999 | 649 | 19.8% |
| $100,000 to $149,999 | 758 | 23.1% |
| $150,000 to $199,999 | 321 | 9.8% |
| $200,000+ | 400 | 12.2% |
Family Income by Famaliy Size in Grover Beach
4-person families (523 | 16.0%) account for the highest median family income in Grover Beach with $125,030 per family, while 2-person families (1,686 | 51.4%) have the highest median income of $45,483 per family member.
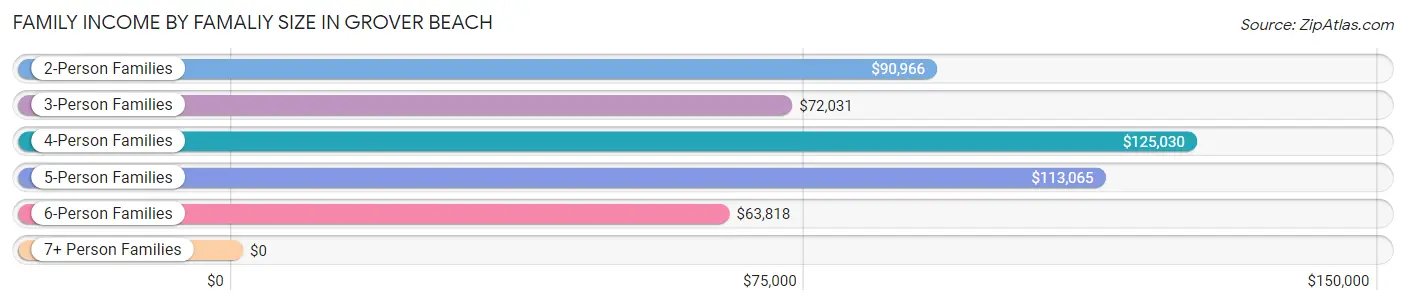
| Income Bracket | # Families | Median Income |
| 2-Person Families | 1,686 (51.4%) | $90,966 |
| 3-Person Families | 793 (24.2%) | $72,031 |
| 4-Person Families | 523 (16.0%) | $125,030 |
| 5-Person Families | 137 (4.2%) | $113,065 |
| 6-Person Families | 104 (3.2%) | $63,818 |
| 7+ Person Families | 37 (1.1%) | $0 |
| Total | 3,280 (100.0%) | $92,559 |
Family Income by Number of Earners in Grover Beach
The median family income in Grover Beach is $92,559, with families comprising 3+ earners (242) having the highest median family income of $172,500, while families with 1 earner (1,343) have the lowest median family income of $60,865, accounting for 7.4% and 40.9% of families, respectively.
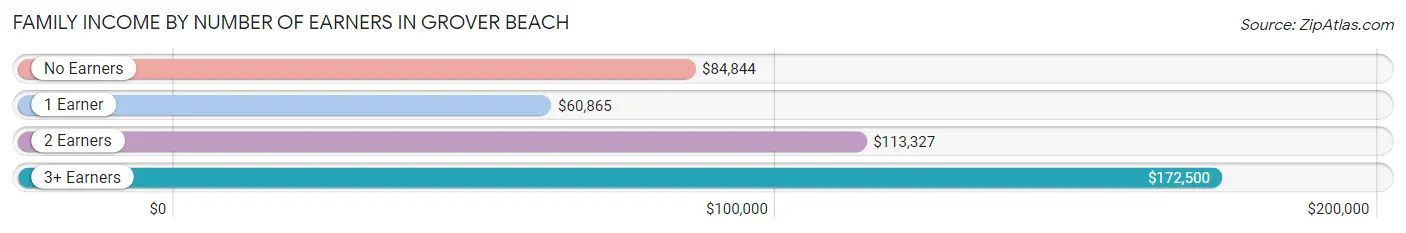
| Number of Earners | # Families | Median Income |
| No Earners | 412 (12.6%) | $84,844 |
| 1 Earner | 1,343 (40.9%) | $60,865 |
| 2 Earners | 1,283 (39.1%) | $113,327 |
| 3+ Earners | 242 (7.4%) | $172,500 |
| Total | 3,280 (100.0%) | $92,559 |
Household Income in Grover Beach
Household Income Brackets in Grover Beach
With 1,038 households falling in the category, the $100,000 to $149,999 income range is the most frequent in Grover Beach, accounting for 20.2% of all households. In contrast, only 180 households (3.5%) fall into the less than $10,000 income bracket, making it the least populous group.
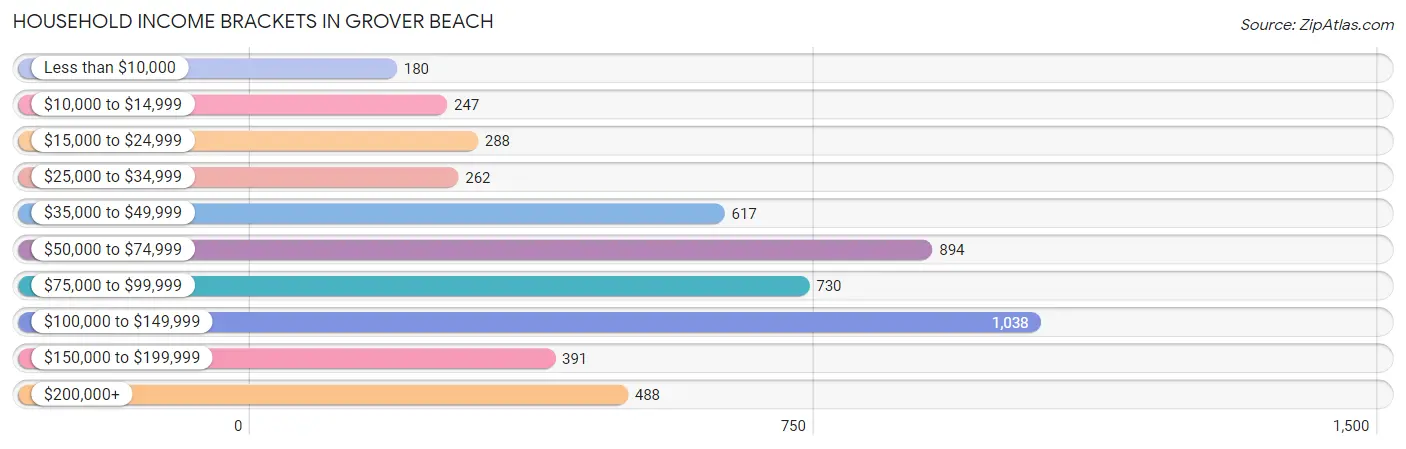
| Income Bracket | # Households | % Households |
| Less than $10,000 | 180 | 3.5% |
| $10,000 to $14,999 | 247 | 4.8% |
| $15,000 to $24,999 | 288 | 5.6% |
| $25,000 to $34,999 | 262 | 5.1% |
| $35,000 to $49,999 | 617 | 12.0% |
| $50,000 to $74,999 | 894 | 17.4% |
| $75,000 to $99,999 | 730 | 14.2% |
| $100,000 to $149,999 | 1,038 | 20.2% |
| $150,000 to $199,999 | 391 | 7.6% |
| $200,000+ | 488 | 9.5% |
Household Income by Householder Age in Grover Beach
The median household income in Grover Beach is $80,438, with the highest median household income of $94,706 found in the 45 to 64 years age bracket for the primary householder. A total of 1,530 households (29.8%) fall into this category. Meanwhile, the 15 to 24 years age bracket for the primary householder has the lowest median household income of $56,732, with 97 households (1.9%) in this group.
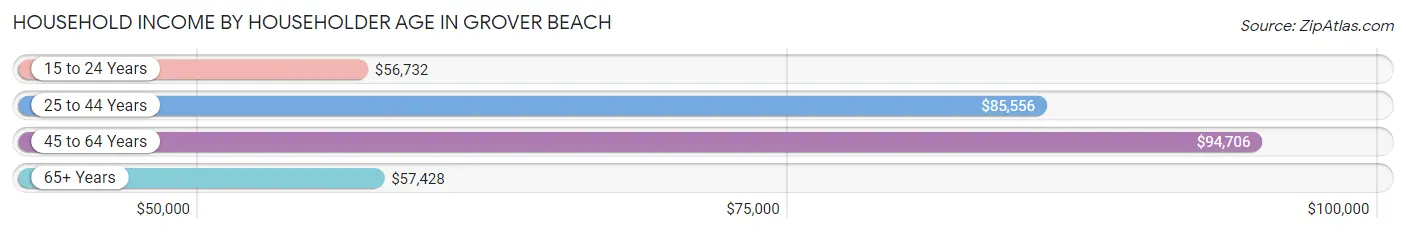
| Income Bracket | # Households | Median Income |
| 15 to 24 Years | 97 (1.9%) | $56,732 |
| 25 to 44 Years | 2,000 (38.9%) | $85,556 |
| 45 to 64 Years | 1,530 (29.8%) | $94,706 |
| 65+ Years | 1,513 (29.4%) | $57,428 |
| Total | 5,140 (100.0%) | $80,438 |
Poverty in Grover Beach
Income Below Poverty by Sex and Age in Grover Beach
With 9.1% poverty level for males and 12.2% for females among the residents of Grover Beach, 15 year old males and 16 and 17 year old females are the most vulnerable to poverty, with 15 males (100.0%) and 51 females (41.5%) in their respective age groups living below the poverty level.
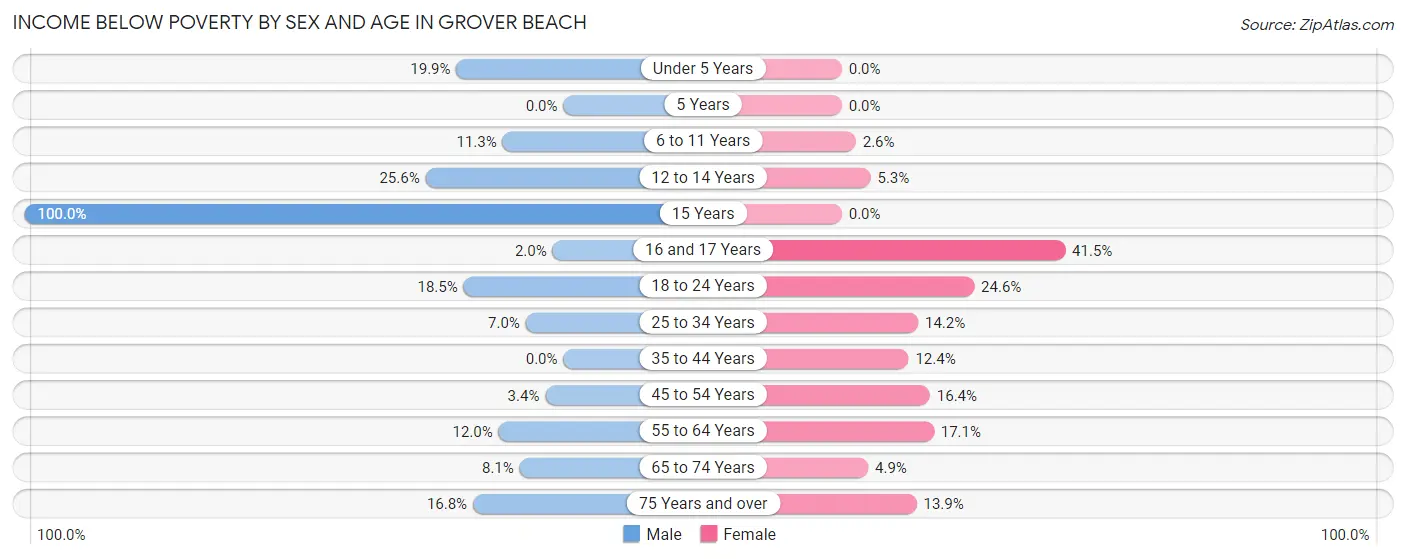
| Age Bracket | Male | Female |
| Under 5 Years | 57 (19.9%) | 0 (0.0%) |
| 5 Years | 0 (0.0%) | 0 (0.0%) |
| 6 to 11 Years | 64 (11.3%) | 10 (2.6%) |
| 12 to 14 Years | 87 (25.6%) | 9 (5.3%) |
| 15 Years | 15 (100.0%) | 0 (0.0%) |
| 16 and 17 Years | 3 (2.0%) | 51 (41.5%) |
| 18 to 24 Years | 60 (18.5%) | 100 (24.6%) |
| 25 to 34 Years | 83 (7.0%) | 101 (14.1%) |
| 35 to 44 Years | 0 (0.0%) | 138 (12.4%) |
| 45 to 54 Years | 19 (3.4%) | 95 (16.4%) |
| 55 to 64 Years | 103 (12.0%) | 132 (17.1%) |
| 65 to 74 Years | 55 (8.1%) | 40 (4.9%) |
| 75 Years and over | 49 (16.8%) | 79 (13.9%) |
| Total | 595 (9.1%) | 755 (12.2%) |
Income Above Poverty by Sex and Age in Grover Beach
According to the poverty statistics in Grover Beach, males aged 5 years and females aged under 5 years are the age groups that are most secure financially, with 100.0% of males and 100.0% of females in these age groups living above the poverty line.
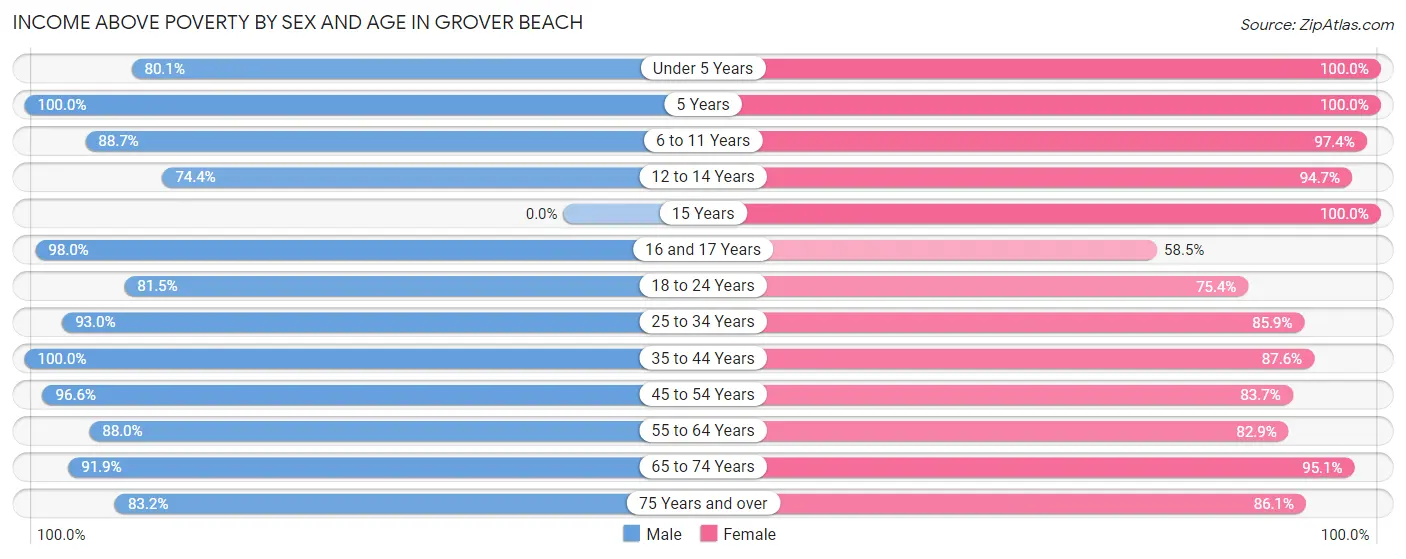
| Age Bracket | Male | Female |
| Under 5 Years | 230 (80.1%) | 412 (100.0%) |
| 5 Years | 152 (100.0%) | 25 (100.0%) |
| 6 to 11 Years | 503 (88.7%) | 375 (97.4%) |
| 12 to 14 Years | 253 (74.4%) | 160 (94.7%) |
| 15 Years | 0 (0.0%) | 105 (100.0%) |
| 16 and 17 Years | 146 (98.0%) | 72 (58.5%) |
| 18 to 24 Years | 264 (81.5%) | 307 (75.4%) |
| 25 to 34 Years | 1,104 (93.0%) | 613 (85.9%) |
| 35 to 44 Years | 1,124 (100.0%) | 977 (87.6%) |
| 45 to 54 Years | 546 (96.6%) | 486 (83.7%) |
| 55 to 64 Years | 753 (88.0%) | 641 (82.9%) |
| 65 to 74 Years | 622 (91.9%) | 780 (95.1%) |
| 75 Years and over | 243 (83.2%) | 490 (86.1%) |
| Total | 5,940 (90.9%) | 5,443 (87.8%) |
Income Below Poverty Among Married-Couple Families in Grover Beach
The poverty statistics for married-couple families in Grover Beach show that 3.9% or 85 of the total 2,157 families live below the poverty line. Families with no children have the highest poverty rate of 4.4%, comprising of 59 families. On the other hand, families with 3 or 4 children have the lowest poverty rate of 0.0%, which includes 0 families.
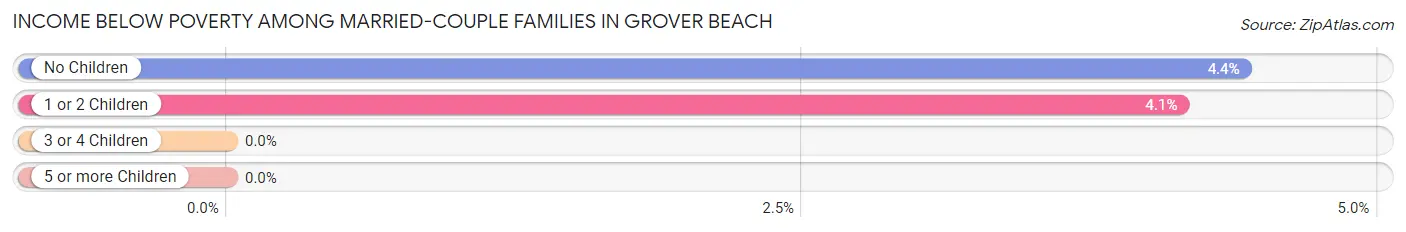
| Children | Above Poverty | Below Poverty |
| No Children | 1,280 (95.6%) | 59 (4.4%) |
| 1 or 2 Children | 602 (95.9%) | 26 (4.1%) |
| 3 or 4 Children | 173 (100.0%) | 0 (0.0%) |
| 5 or more Children | 17 (100.0%) | 0 (0.0%) |
| Total | 2,072 (96.1%) | 85 (3.9%) |
Income Below Poverty Among Single-Parent Households in Grover Beach
According to the poverty data in Grover Beach, 3.7% or 14 single-father households and 21.4% or 159 single-mother households are living below the poverty line. Among single-father households, those with 1 or 2 children have the highest poverty rate, with 14 households (4.8%) experiencing poverty. Likewise, among single-mother households, those with 3 or 4 children have the highest poverty rate, with 7 households (100.0%) falling below the poverty line.
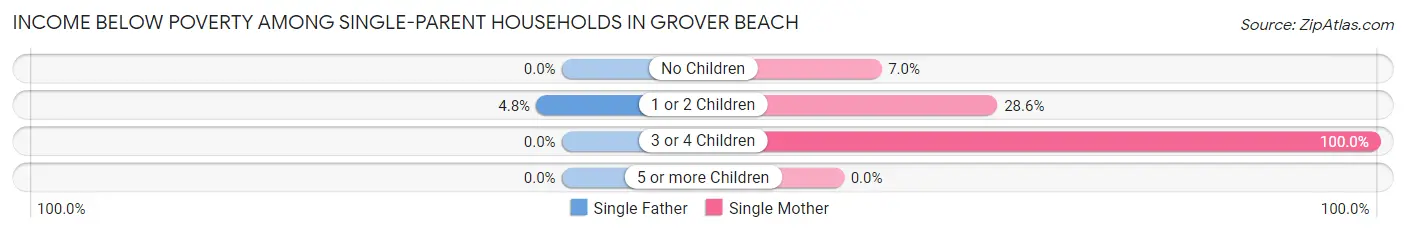
| Children | Single Father | Single Mother |
| No Children | 0 (0.0%) | 19 (7.0%) |
| 1 or 2 Children | 14 (4.8%) | 133 (28.6%) |
| 3 or 4 Children | 0 (0.0%) | 7 (100.0%) |
| 5 or more Children | 0 (0.0%) | 0 (0.0%) |
| Total | 14 (3.7%) | 159 (21.4%) |
Income Below Poverty Among Married-Couple vs Single-Parent Households in Grover Beach
The poverty data for Grover Beach shows that 85 of the married-couple family households (3.9%) and 173 of the single-parent households (15.4%) are living below the poverty level. Within the married-couple family households, those with no children have the highest poverty rate, with 59 households (4.4%) falling below the poverty line. Among the single-parent households, those with 3 or 4 children have the highest poverty rate, with 7 household (100.0%) living below poverty.
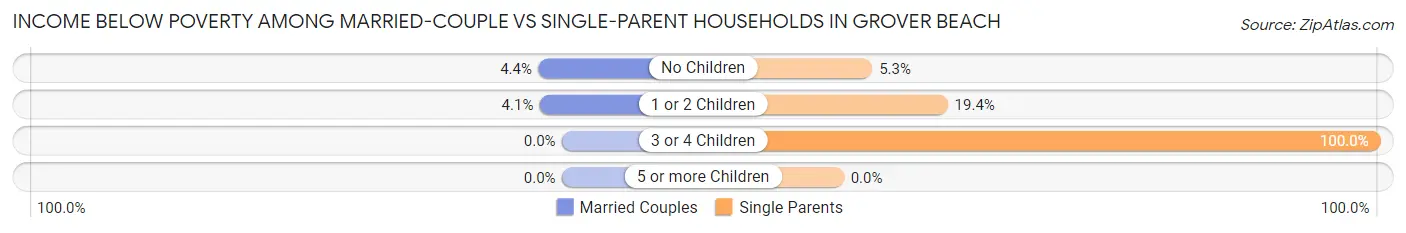
| Children | Married-Couple Families | Single-Parent Households |
| No Children | 59 (4.4%) | 19 (5.3%) |
| 1 or 2 Children | 26 (4.1%) | 147 (19.4%) |
| 3 or 4 Children | 0 (0.0%) | 7 (100.0%) |
| 5 or more Children | 0 (0.0%) | 0 (0.0%) |
| Total | 85 (3.9%) | 173 (15.4%) |
Race in Grover Beach
The most populous races in Grover Beach are White / Caucasian (9,443 | 74.0%), Hispanic or Latino (4,197 | 32.9%), and Two or more Races (2,024 | 15.9%).
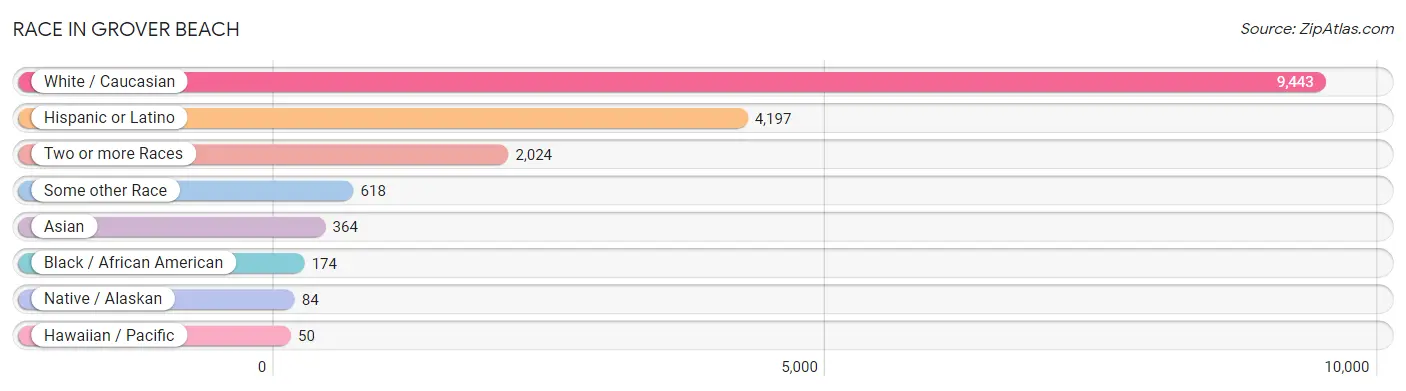
| Race | # Population | % Population |
| Asian | 364 | 2.9% |
| Black / African American | 174 | 1.4% |
| Hawaiian / Pacific | 50 | 0.4% |
| Hispanic or Latino | 4,197 | 32.9% |
| Native / Alaskan | 84 | 0.7% |
| White / Caucasian | 9,443 | 74.0% |
| Two or more Races | 2,024 | 15.9% |
| Some other Race | 618 | 4.8% |
| Total | 12,757 | 100.0% |
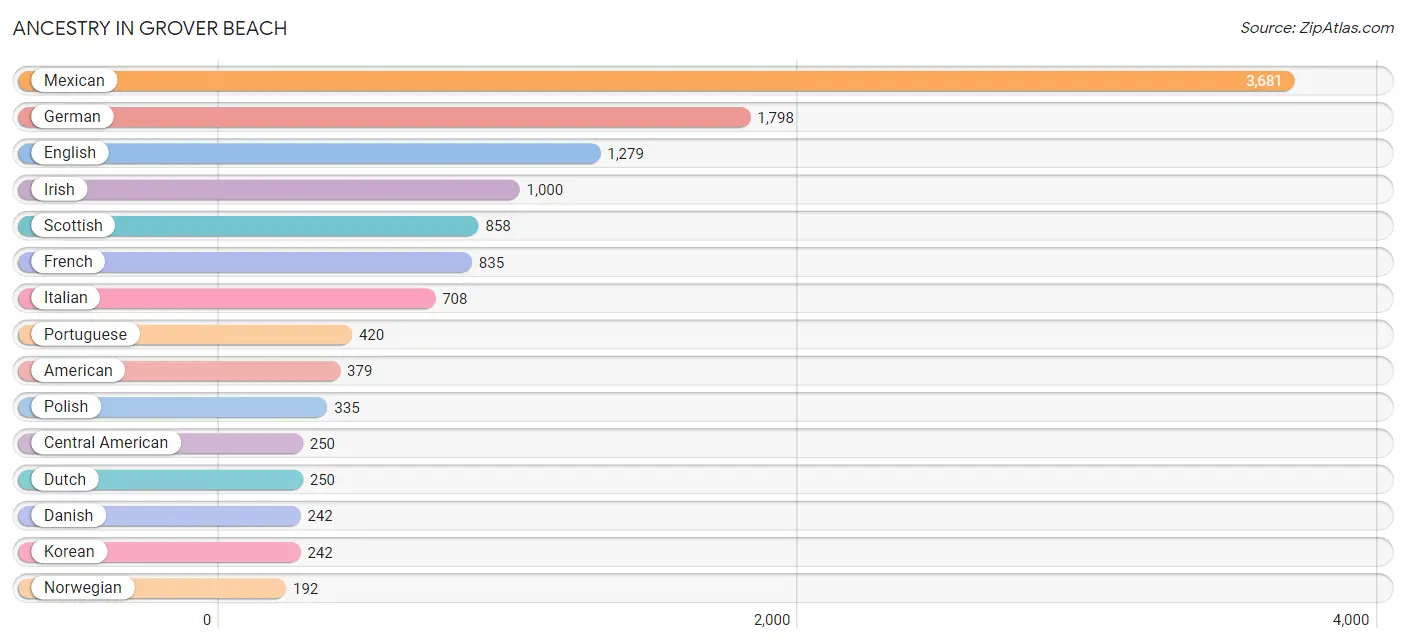
Ancestry in Grover Beach
The most populous ancestries reported in Grover Beach are Mexican (3,681 | 28.8%), German (1,798 | 14.1%), English (1,279 | 10.0%), Irish (1,000 | 7.8%), and Scottish (858 | 6.7%), together accounting for 67.5% of all Grover Beach residents.
| Ancestry | # Population | % Population |
| African | 45 | 0.4% |
| American | 379 | 3.0% |
| Arab | 159 | 1.3% |
| Argentinean | 14 | 0.1% |
| Armenian | 34 | 0.3% |
| Austrian | 16 | 0.1% |
| Basque | 13 | 0.1% |
| Bhutanese | 124 | 1.0% |
| Blackfeet | 37 | 0.3% |
| British | 73 | 0.6% |
| Burmese | 32 | 0.3% |
| Canadian | 13 | 0.1% |
| Celtic | 20 | 0.2% |
| Central American | 250 | 2.0% |
| Cherokee | 12 | 0.1% |
| Choctaw | 14 | 0.1% |
| Croatian | 55 | 0.4% |
| Czech | 21 | 0.2% |
| Danish | 242 | 1.9% |
| Dutch | 250 | 2.0% |
| Eastern European | 30 | 0.2% |
| English | 1,279 | 10.0% |
| European | 161 | 1.3% |
| French | 835 | 6.6% |
| French Canadian | 75 | 0.6% |
| German | 1,798 | 14.1% |
| Guamanian / Chamorro | 35 | 0.3% |
| Honduran | 185 | 1.5% |
| Hungarian | 13 | 0.1% |
| Indian (Asian) | 81 | 0.6% |
| Irish | 1,000 | 7.8% |
| Italian | 708 | 5.6% |
| Japanese | 55 | 0.4% |
| Korean | 242 | 1.9% |
| Mexican | 3,681 | 28.8% |
| Mexican American Indian | 12 | 0.1% |
| Native Hawaiian | 112 | 0.9% |
| New Zealander | 107 | 0.8% |
| Nigerian | 47 | 0.4% |
| Norwegian | 192 | 1.5% |
| Polish | 335 | 2.6% |
| Portuguese | 420 | 3.3% |
| Pueblo | 11 | 0.1% |
| Puerto Rican | 46 | 0.4% |
| Russian | 31 | 0.2% |
| Salvadoran | 65 | 0.5% |
| Scandinavian | 39 | 0.3% |
| Scotch-Irish | 82 | 0.6% |
| Scottish | 858 | 6.7% |
| Slovak | 5 | 0.0% |
| South American | 40 | 0.3% |
| Spaniard | 40 | 0.3% |
| Spanish | 41 | 0.3% |
| Sri Lankan | 32 | 0.3% |
| Subsaharan African | 92 | 0.7% |
| Swedish | 75 | 0.6% |
| Syrian | 159 | 1.3% |
| Venezuelan | 26 | 0.2% |
| Welsh | 79 | 0.6% | View All 59 Rows |
Immigrants in Grover Beach
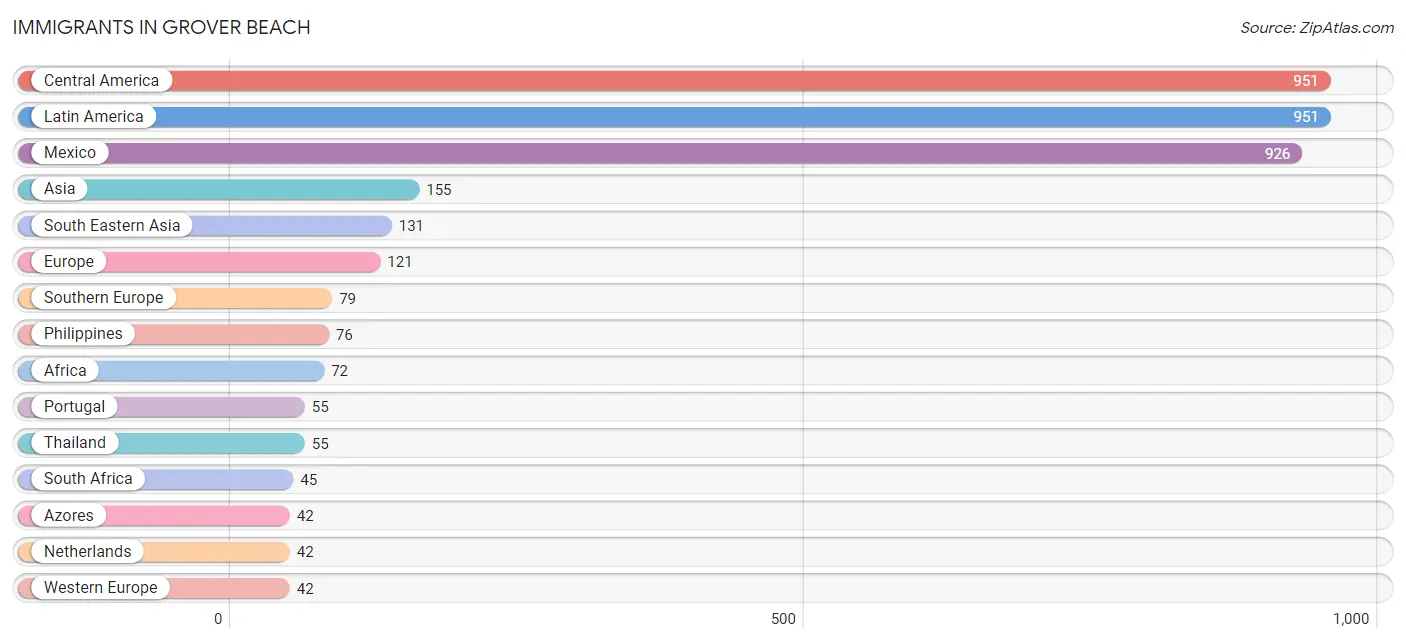
The most numerous immigrant groups reported in Grover Beach came from Central America (951 | 7.4%), Latin America (951 | 7.4%), Mexico (926 | 7.3%), Asia (155 | 1.2%), and South Eastern Asia (131 | 1.0%), together accounting for 24.4% of all Grover Beach residents.
| Immigration Origin | # Population | % Population |
| Africa | 72 | 0.6% |
| Asia | 155 | 1.2% |
| Azores | 42 | 0.3% |
| Canada | 22 | 0.2% |
| Central America | 951 | 7.4% |
| Eastern Asia | 24 | 0.2% |
| El Salvador | 25 | 0.2% |
| Europe | 121 | 0.9% |
| Italy | 24 | 0.2% |
| Japan | 17 | 0.1% |
| Korea | 7 | 0.1% |
| Latin America | 951 | 7.4% |
| Mexico | 926 | 7.3% |
| Netherlands | 42 | 0.3% |
| Nigeria | 27 | 0.2% |
| Philippines | 76 | 0.6% |
| Portugal | 55 | 0.4% |
| South Africa | 45 | 0.4% |
| South Eastern Asia | 131 | 1.0% |
| Southern Europe | 79 | 0.6% |
| Thailand | 55 | 0.4% |
| Western Africa | 27 | 0.2% |
| Western Europe | 42 | 0.3% | View All 23 Rows |
Sex and Age in Grover Beach
Sex and Age in Grover Beach
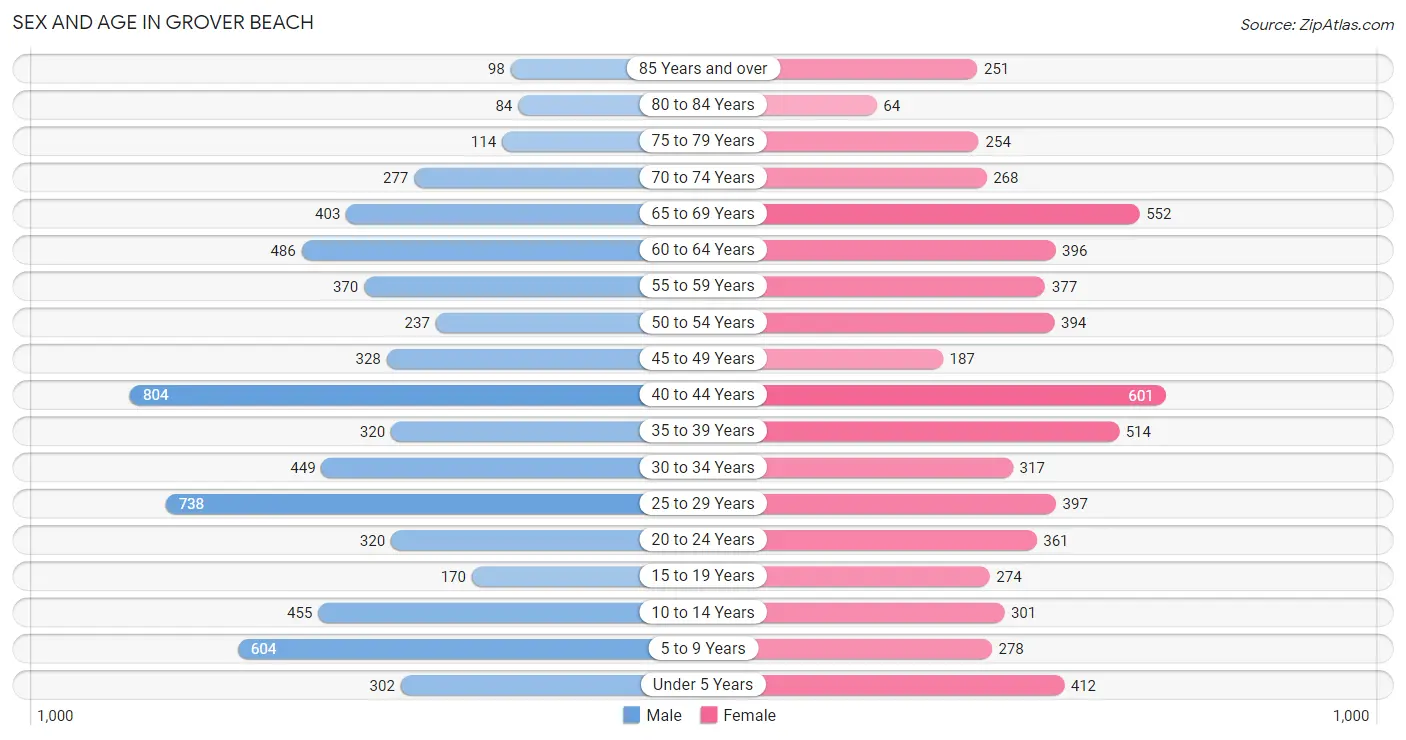
The most populous age groups in Grover Beach are 40 to 44 Years (804 | 12.3%) for men and 40 to 44 Years (601 | 9.7%) for women.
| Age Bracket | Male | Female |
| Under 5 Years | 302 (4.6%) | 412 (6.7%) |
| 5 to 9 Years | 604 (9.2%) | 278 (4.5%) |
| 10 to 14 Years | 455 (6.9%) | 301 (4.9%) |
| 15 to 19 Years | 170 (2.6%) | 274 (4.4%) |
| 20 to 24 Years | 320 (4.9%) | 361 (5.8%) |
| 25 to 29 Years | 738 (11.3%) | 397 (6.4%) |
| 30 to 34 Years | 449 (6.9%) | 317 (5.1%) |
| 35 to 39 Years | 320 (4.9%) | 514 (8.3%) |
| 40 to 44 Years | 804 (12.3%) | 601 (9.7%) |
| 45 to 49 Years | 328 (5.0%) | 187 (3.0%) |
| 50 to 54 Years | 237 (3.6%) | 394 (6.4%) |
| 55 to 59 Years | 370 (5.6%) | 377 (6.1%) |
| 60 to 64 Years | 486 (7.4%) | 396 (6.4%) |
| 65 to 69 Years | 403 (6.1%) | 552 (8.9%) |
| 70 to 74 Years | 277 (4.2%) | 268 (4.3%) |
| 75 to 79 Years | 114 (1.7%) | 254 (4.1%) |
| 80 to 84 Years | 84 (1.3%) | 64 (1.0%) |
| 85 Years and over | 98 (1.5%) | 251 (4.1%) |
| Total | 6,559 (100.0%) | 6,198 (100.0%) |
Families and Households in Grover Beach
Median Family Size in Grover Beach
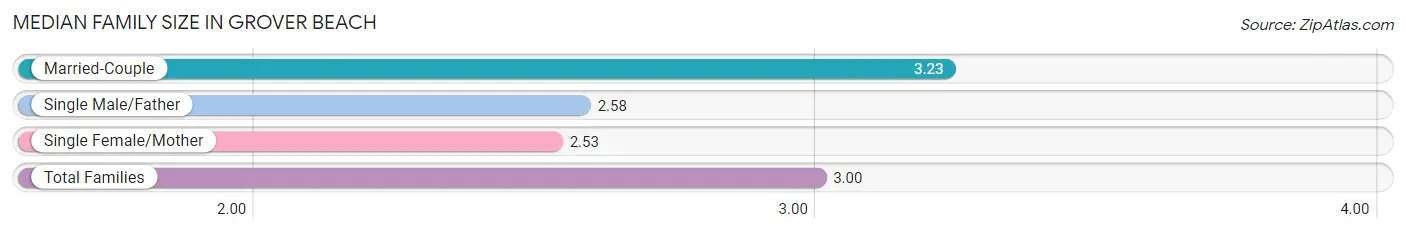
The median family size in Grover Beach is 3.00 persons per family, with married-couple families (2,157 | 65.8%) accounting for the largest median family size of 3.23 persons per family. On the other hand, single female/mother families (744 | 22.7%) represent the smallest median family size with 2.53 persons per family.
| Family Type | # Families | Family Size |
| Married-Couple | 2,157 (65.8%) | 3.23 |
| Single Male/Father | 379 (11.6%) | 2.58 |
| Single Female/Mother | 744 (22.7%) | 2.53 |
| Total Families | 3,280 (100.0%) | 3.00 |
Median Household Size in Grover Beach
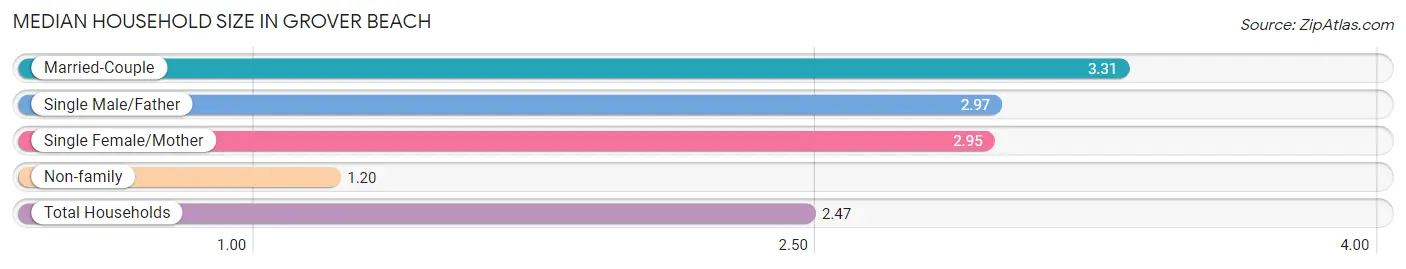
The median household size in Grover Beach is 2.47 persons per household, with married-couple households (2,157 | 42.0%) accounting for the largest median household size of 3.31 persons per household. non-family households (1,860 | 36.2%) represent the smallest median household size with 1.20 persons per household.
| Household Type | # Households | Household Size |
| Married-Couple | 2,157 (42.0%) | 3.31 |
| Single Male/Father | 379 (7.4%) | 2.97 |
| Single Female/Mother | 744 (14.5%) | 2.95 |
| Non-family | 1,860 (36.2%) | 1.20 |
| Total Households | 5,140 (100.0%) | 2.47 |
Household Size by Marriage Status in Grover Beach
Out of a total of 5,140 households in Grover Beach, 3,280 (63.8%) are family households, while 1,860 (36.2%) are nonfamily households. The most numerous type of family households are 2-person households, comprising 1,352, and the most common type of nonfamily households are 1-person households, comprising 1,497.
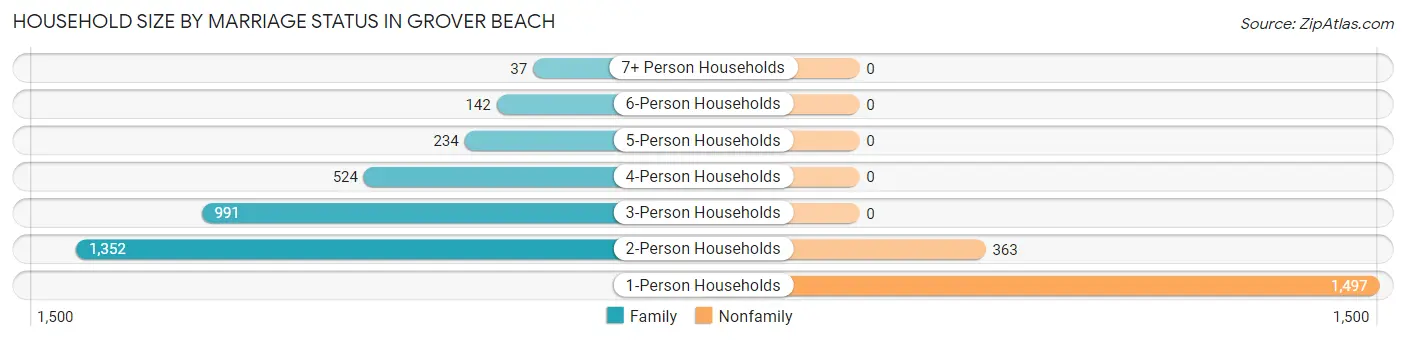
| Household Size | Family Households | Nonfamily Households |
| 1-Person Households | - | 1,497 (29.1%) |
| 2-Person Households | 1,352 (26.3%) | 363 (7.1%) |
| 3-Person Households | 991 (19.3%) | 0 (0.0%) |
| 4-Person Households | 524 (10.2%) | 0 (0.0%) |
| 5-Person Households | 234 (4.5%) | 0 (0.0%) |
| 6-Person Households | 142 (2.8%) | 0 (0.0%) |
| 7+ Person Households | 37 (0.7%) | 0 (0.0%) |
| Total | 3,280 (63.8%) | 1,860 (36.2%) |
Female Fertility in Grover Beach
Fertility by Age in Grover Beach
Average fertility rate in Grover Beach is 49.0 births per 1,000 women. Women in the age bracket of 20 to 34 years have the highest fertility rate with 124.0 births per 1,000 women. Women in the age bracket of 20 to 34 years acount for 100.0% of all women with births.
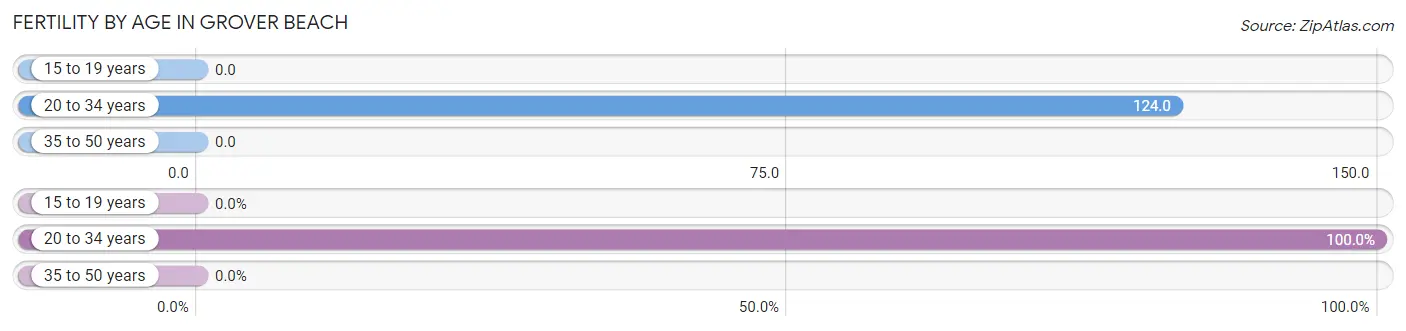
| Age Bracket | Women with Births | Births / 1,000 Women |
| 15 to 19 years | 0 (0.0%) | 0.0 |
| 20 to 34 years | 133 (100.0%) | 124.0 |
| 35 to 50 years | 0 (0.0%) | 0.0 |
| Total | 133 (100.0%) | 49.0 |
Fertility by Age by Marriage Status in Grover Beach
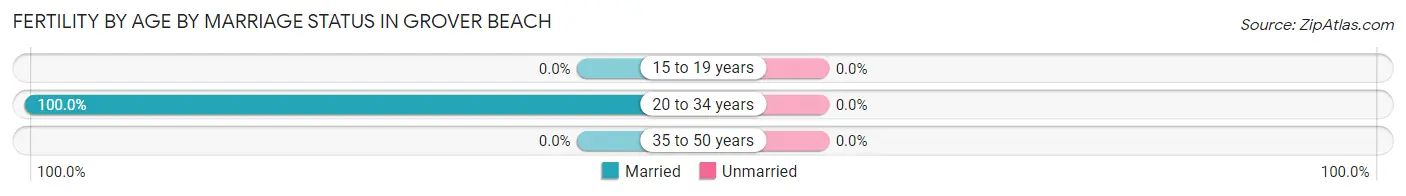
| Age Bracket | Married | Unmarried |
| 15 to 19 years | 0 (0.0%) | 0 (0.0%) |
| 20 to 34 years | 133 (100.0%) | 0 (0.0%) |
| 35 to 50 years | 0 (0.0%) | 0 (0.0%) |
| Total | 133 (100.0%) | 0 (0.0%) |
Fertility by Education in Grover Beach
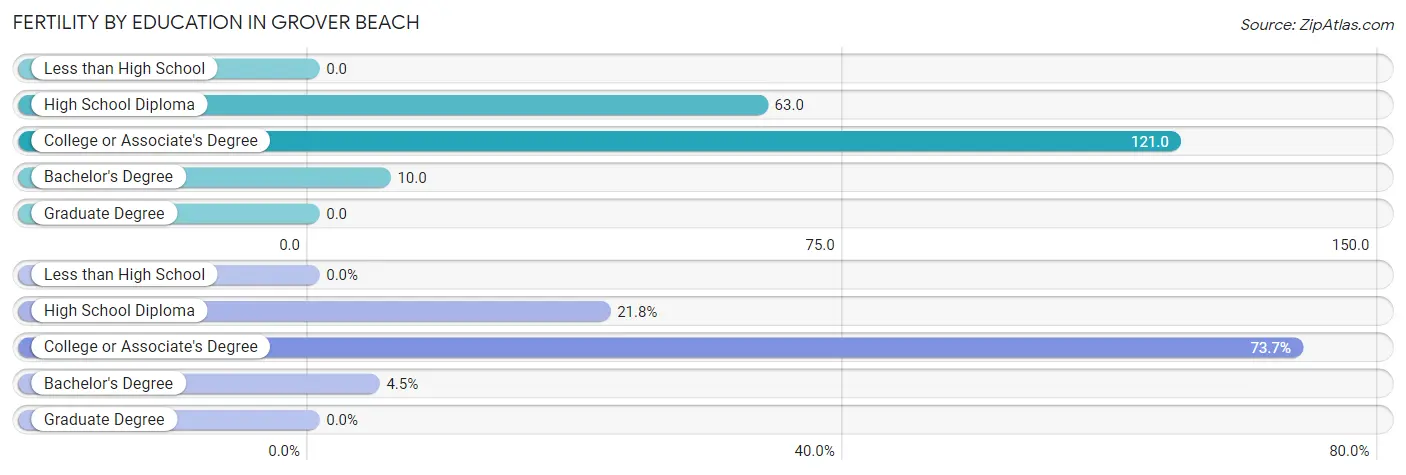
| Educational Attainment | Women with Births | Births / 1,000 Women |
| Less than High School | 0 (0.0%) | 0.0 |
| High School Diploma | 29 (21.8%) | 63.0 |
| College or Associate's Degree | 98 (73.7%) | 121.0 |
| Bachelor's Degree | 6 (4.5%) | 10.0 |
| Graduate Degree | 0 (0.0%) | 0.0 |
| Total | 133 (100.0%) | 49.0 |
Fertility by Education by Marriage Status in Grover Beach
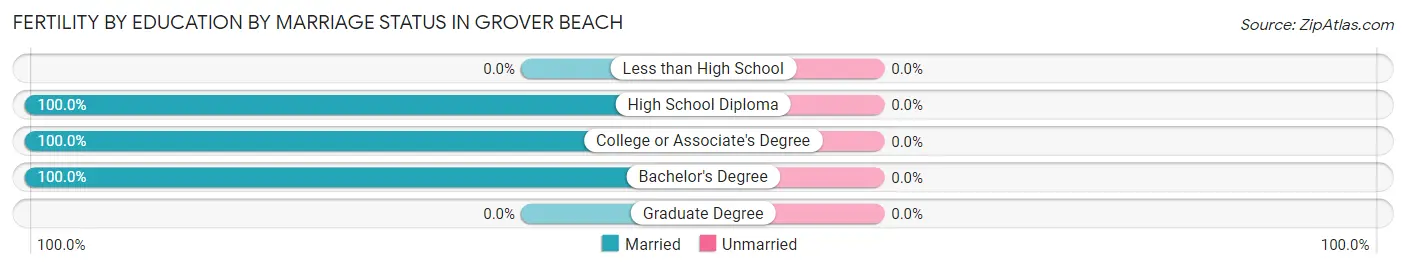
| Educational Attainment | Married | Unmarried |
| Less than High School | 0 (0.0%) | 0 (0.0%) |
| High School Diploma | 29 (100.0%) | 0 (0.0%) |
| College or Associate's Degree | 98 (100.0%) | 0 (0.0%) |
| Bachelor's Degree | 6 (100.0%) | 0 (0.0%) |
| Graduate Degree | 0 (0.0%) | 0 (0.0%) |
| Total | 133 (100.0%) | 0 (0.0%) |
Employment Characteristics in Grover Beach
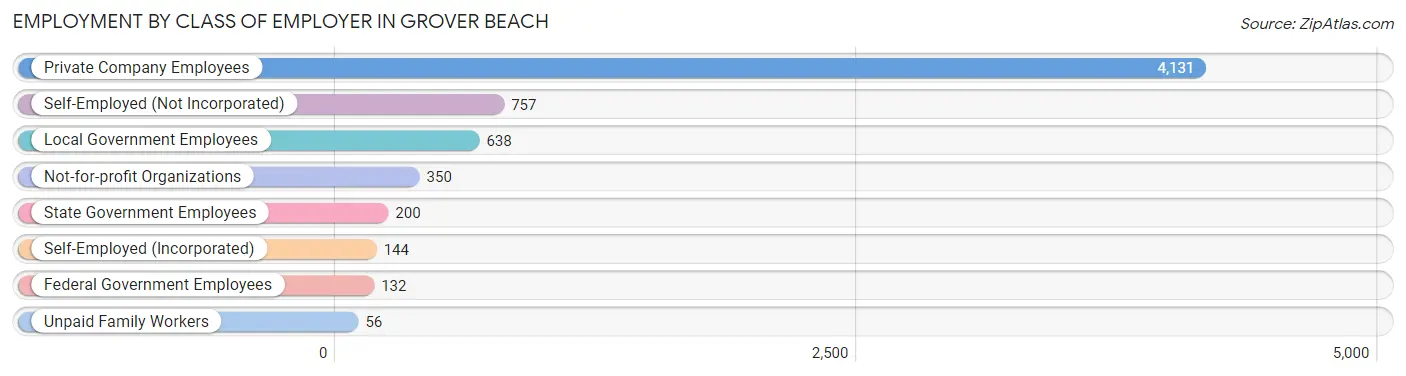
Employment by Class of Employer in Grover Beach
Among the 6,408 employed individuals in Grover Beach, private company employees (4,131 | 64.5%), self-employed (not incorporated) (757 | 11.8%), and local government employees (638 | 10.0%) make up the most common classes of employment.
| Employer Class | # Employees | % Employees |
| Private Company Employees | 4,131 | 64.5% |
| Self-Employed (Incorporated) | 144 | 2.2% |
| Self-Employed (Not Incorporated) | 757 | 11.8% |
| Not-for-profit Organizations | 350 | 5.5% |
| Local Government Employees | 638 | 10.0% |
| State Government Employees | 200 | 3.1% |
| Federal Government Employees | 132 | 2.1% |
| Unpaid Family Workers | 56 | 0.9% |
| Total | 6,408 | 100.0% |
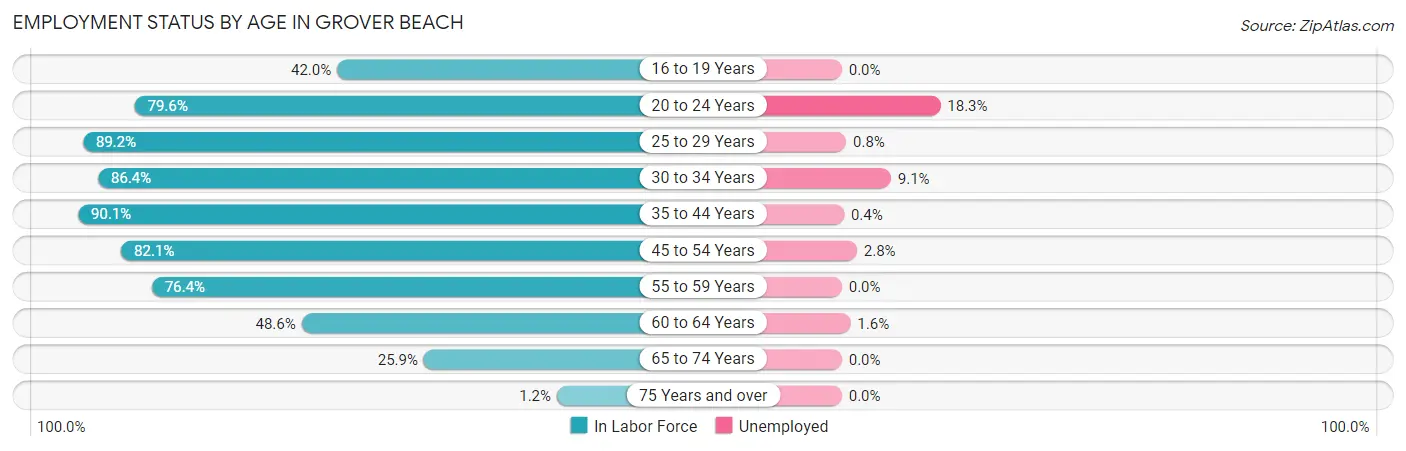
Employment Status by Age in Grover Beach
According to the labor force statistics for Grover Beach, out of the total population over 16 years of age (10,285), 65.2% or 6,706 individuals are in the labor force, with 3.1% or 208 of them unemployed. The age group with the highest labor force participation rate is 35 to 44 years, with 90.1% or 2,017 individuals in the labor force. Within the labor force, the 20 to 24 years age range has the highest percentage of unemployed individuals, with 18.3% or 99 of them being unemployed.
| Age Bracket | In Labor Force | Unemployed |
| 16 to 19 Years | 136 (42.0%) | 0 (0.0%) |
| 20 to 24 Years | 542 (79.6%) | 99 (18.3%) |
| 25 to 29 Years | 1,012 (89.2%) | 8 (0.8%) |
| 30 to 34 Years | 662 (86.4%) | 60 (9.1%) |
| 35 to 44 Years | 2,017 (90.1%) | 8 (0.4%) |
| 45 to 54 Years | 941 (82.1%) | 26 (2.8%) |
| 55 to 59 Years | 571 (76.4%) | 0 (0.0%) |
| 60 to 64 Years | 429 (48.6%) | 7 (1.6%) |
| 65 to 74 Years | 388 (25.9%) | 0 (0.0%) |
| 75 Years and over | 10 (1.2%) | 0 (0.0%) |
| Total | 6,706 (65.2%) | 208 (3.1%) |
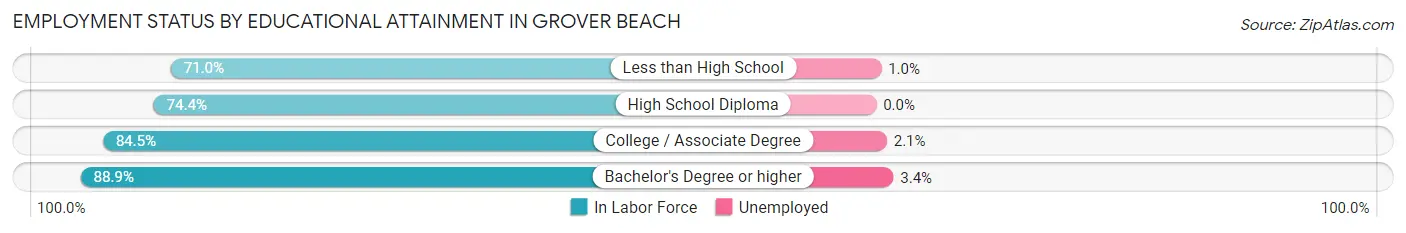
Employment Status by Educational Attainment in Grover Beach
According to labor force statistics for Grover Beach, 81.4% of individuals (5,629) out of the total population between 25 and 64 years of age (6,915) are in the labor force, with 1.9% or 107 of them being unemployed. The group with the highest labor force participation rate are those with the educational attainment of bachelor's degree or higher, with 88.9% or 1,974 individuals in the labor force. Within the labor force, individuals with bachelor's degree or higher education have the highest percentage of unemployment, with 3.4% or 67 of them being unemployed.
| Educational Attainment | In Labor Force | Unemployed |
| Less than High School | 729 (71.0%) | 10 (1.0%) |
| High School Diploma | 1,254 (74.4%) | 0 (0.0%) |
| College / Associate Degree | 1,676 (84.5%) | 42 (2.1%) |
| Bachelor's Degree or higher | 1,974 (88.9%) | 75 (3.4%) |
| Total | 5,629 (81.4%) | 131 (1.9%) |
Employment Occupations by Sex in Grover Beach
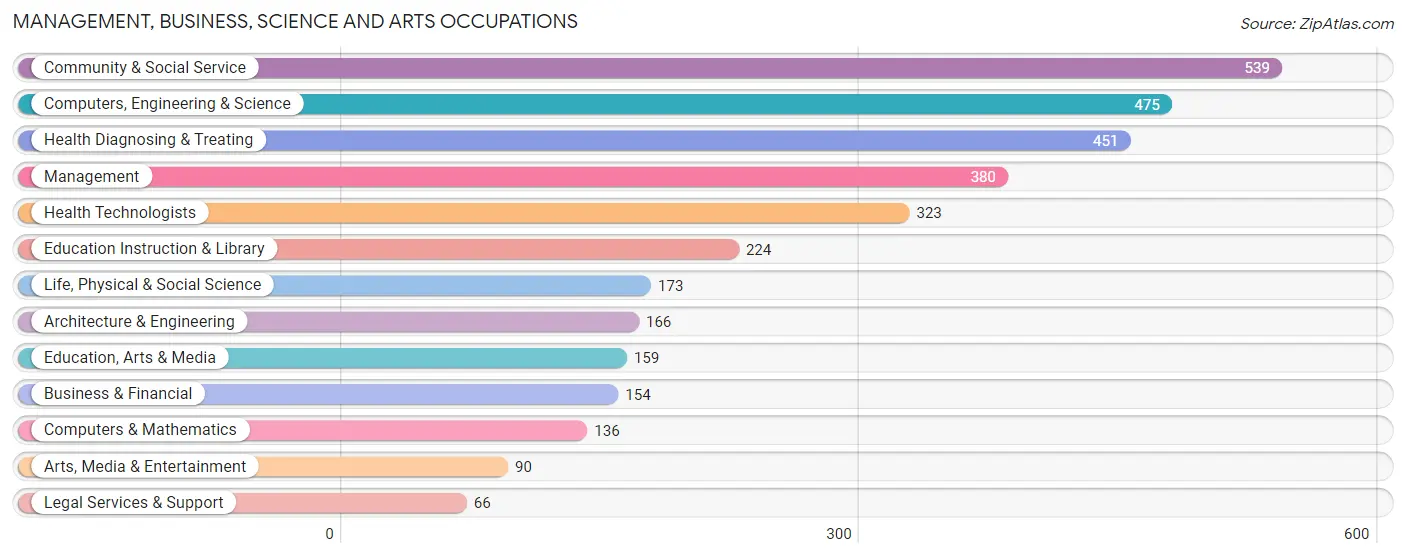
Management, Business, Science and Arts Occupations
The most common Management, Business, Science and Arts occupations in Grover Beach are Community & Social Service (539 | 8.3%), Computers, Engineering & Science (475 | 7.3%), Health Diagnosing & Treating (451 | 6.9%), Management (380 | 5.9%), and Health Technologists (323 | 5.0%).
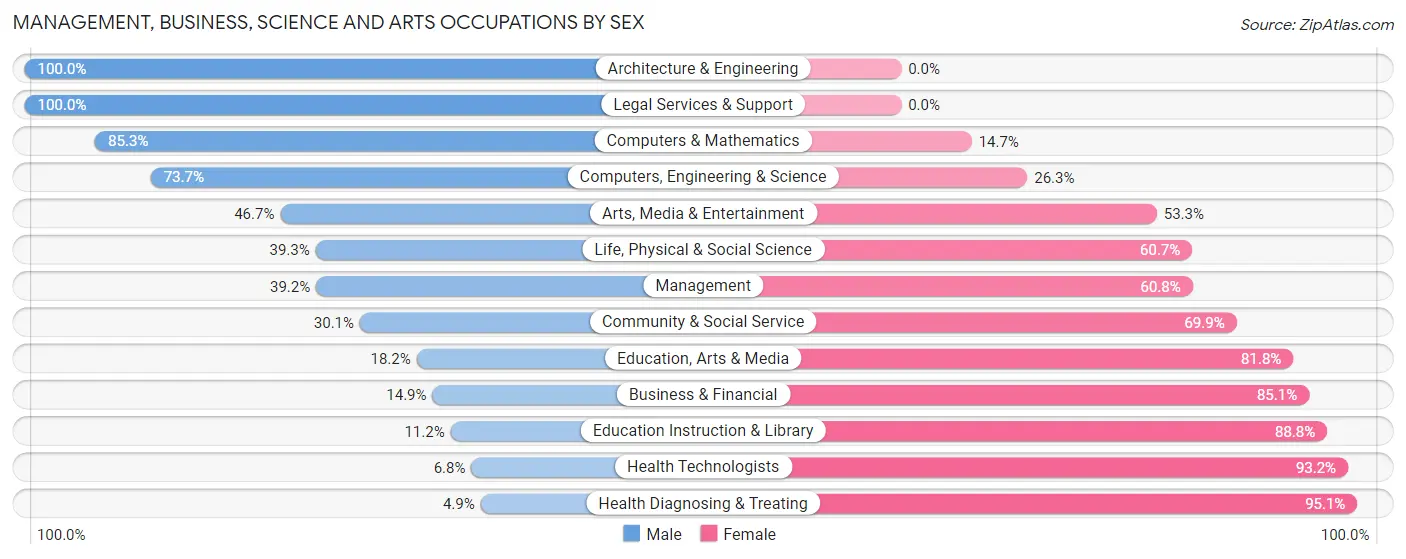
Management, Business, Science and Arts Occupations by Sex
Within the Management, Business, Science and Arts occupations in Grover Beach, the most male-oriented occupations are Architecture & Engineering (100.0%), Legal Services & Support (100.0%), and Computers & Mathematics (85.3%), while the most female-oriented occupations are Health Diagnosing & Treating (95.1%), Health Technologists (93.2%), and Education Instruction & Library (88.8%).
| Occupation | Male | Female |
| Management | 149 (39.2%) | 231 (60.8%) |
| Business & Financial | 23 (14.9%) | 131 (85.1%) |
| Computers, Engineering & Science | 350 (73.7%) | 125 (26.3%) |
| Computers & Mathematics | 116 (85.3%) | 20 (14.7%) |
| Architecture & Engineering | 166 (100.0%) | 0 (0.0%) |
| Life, Physical & Social Science | 68 (39.3%) | 105 (60.7%) |
| Community & Social Service | 162 (30.1%) | 377 (69.9%) |
| Education, Arts & Media | 29 (18.2%) | 130 (81.8%) |
| Legal Services & Support | 66 (100.0%) | 0 (0.0%) |
| Education Instruction & Library | 25 (11.2%) | 199 (88.8%) |
| Arts, Media & Entertainment | 42 (46.7%) | 48 (53.3%) |
| Health Diagnosing & Treating | 22 (4.9%) | 429 (95.1%) |
| Health Technologists | 22 (6.8%) | 301 (93.2%) |
| Total (Category) | 706 (35.3%) | 1,293 (64.7%) |
| Total (Overall) | 3,558 (54.7%) | 2,942 (45.3%) |
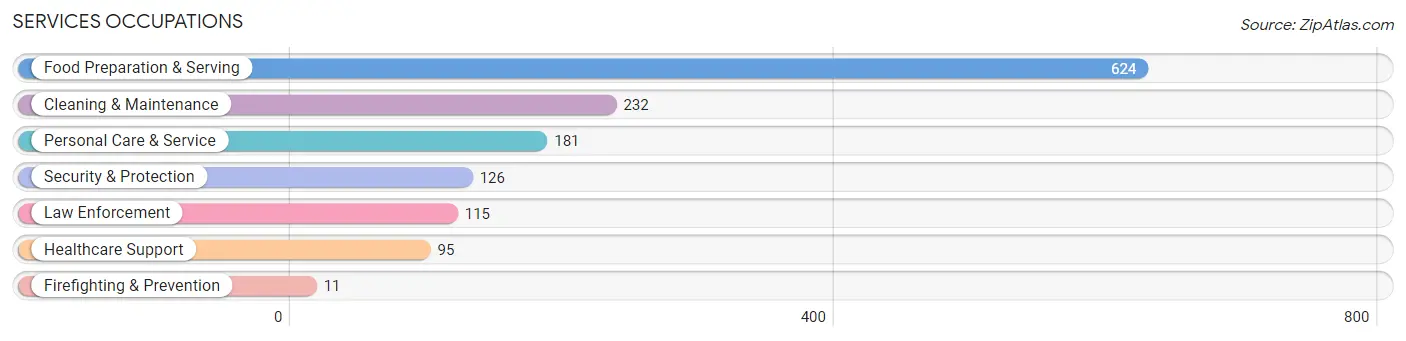
Services Occupations
The most common Services occupations in Grover Beach are Food Preparation & Serving (624 | 9.6%), Cleaning & Maintenance (232 | 3.6%), Personal Care & Service (181 | 2.8%), Security & Protection (126 | 1.9%), and Law Enforcement (115 | 1.8%).
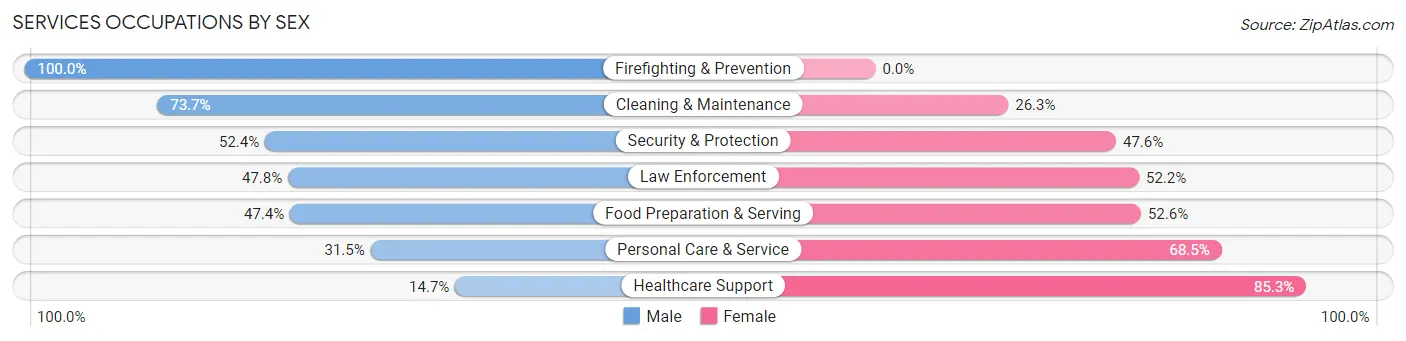
Services Occupations by Sex
Within the Services occupations in Grover Beach, the most male-oriented occupations are Firefighting & Prevention (100.0%), Cleaning & Maintenance (73.7%), and Security & Protection (52.4%), while the most female-oriented occupations are Healthcare Support (85.3%), Personal Care & Service (68.5%), and Food Preparation & Serving (52.6%).
| Occupation | Male | Female |
| Healthcare Support | 14 (14.7%) | 81 (85.3%) |
| Security & Protection | 66 (52.4%) | 60 (47.6%) |
| Firefighting & Prevention | 11 (100.0%) | 0 (0.0%) |
| Law Enforcement | 55 (47.8%) | 60 (52.2%) |
| Food Preparation & Serving | 296 (47.4%) | 328 (52.6%) |
| Cleaning & Maintenance | 171 (73.7%) | 61 (26.3%) |
| Personal Care & Service | 57 (31.5%) | 124 (68.5%) |
| Total (Category) | 604 (48.0%) | 654 (52.0%) |
| Total (Overall) | 3,558 (54.7%) | 2,942 (45.3%) |
Sales and Office Occupations
The most common Sales and Office occupations in Grover Beach are Office & Administration (1,046 | 16.1%), and Sales & Related (558 | 8.6%).
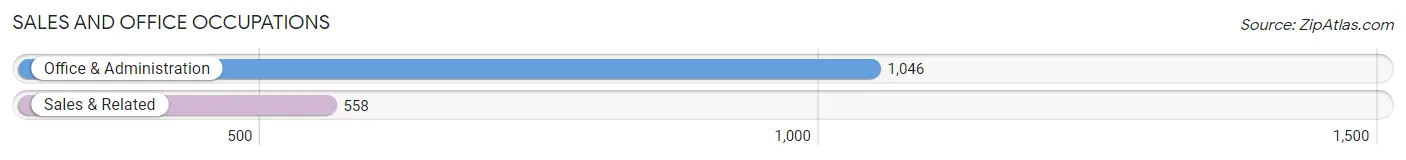
Sales and Office Occupations by Sex
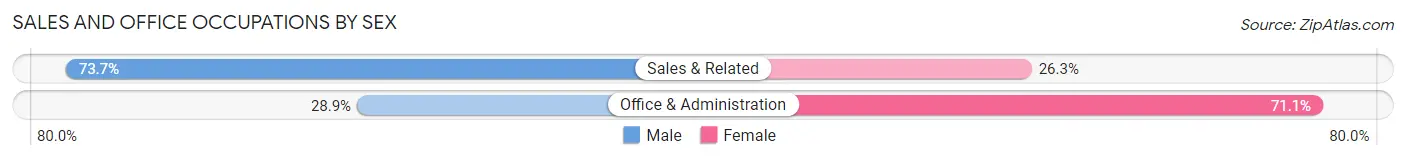
| Occupation | Male | Female |
| Sales & Related | 411 (73.7%) | 147 (26.3%) |
| Office & Administration | 302 (28.9%) | 744 (71.1%) |
| Total (Category) | 713 (44.5%) | 891 (55.5%) |
| Total (Overall) | 3,558 (54.7%) | 2,942 (45.3%) |
Natural Resources, Construction and Maintenance Occupations
The most common Natural Resources, Construction and Maintenance occupations in Grover Beach are Construction & Extraction (850 | 13.1%), Installation, Maintenance & Repair (163 | 2.5%), and Farming, Fishing & Forestry (160 | 2.5%).
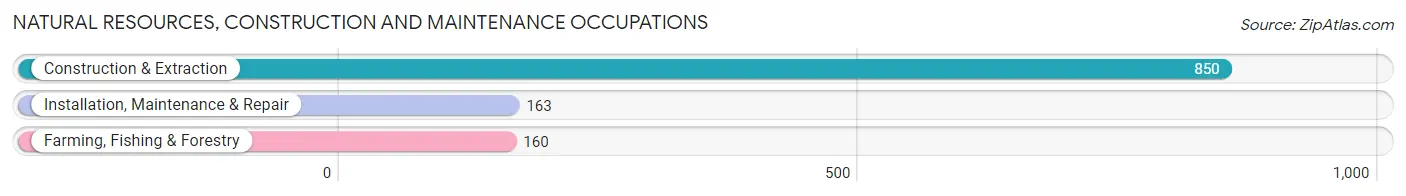
Natural Resources, Construction and Maintenance Occupations by Sex
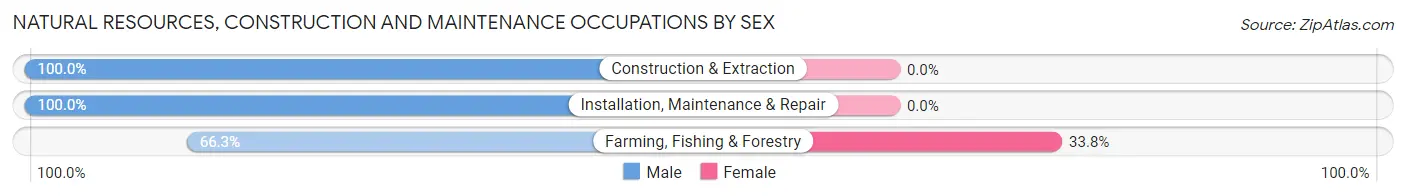
| Occupation | Male | Female |
| Farming, Fishing & Forestry | 106 (66.2%) | 54 (33.8%) |
| Construction & Extraction | 850 (100.0%) | 0 (0.0%) |
| Installation, Maintenance & Repair | 163 (100.0%) | 0 (0.0%) |
| Total (Category) | 1,119 (95.4%) | 54 (4.6%) |
| Total (Overall) | 3,558 (54.7%) | 2,942 (45.3%) |
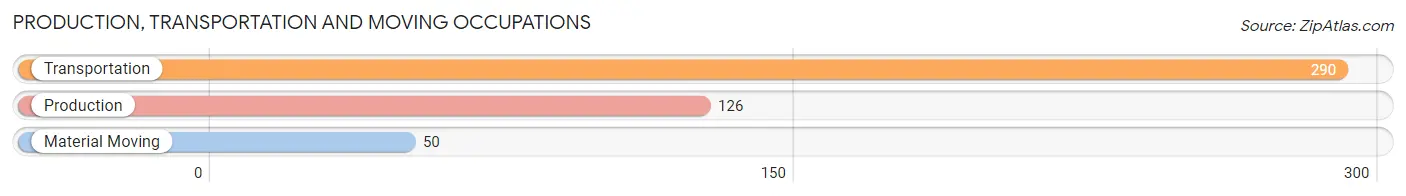
Production, Transportation and Moving Occupations
The most common Production, Transportation and Moving occupations in Grover Beach are Transportation (290 | 4.5%), Production (126 | 1.9%), and Material Moving (50 | 0.8%).
Production, Transportation and Moving Occupations by Sex
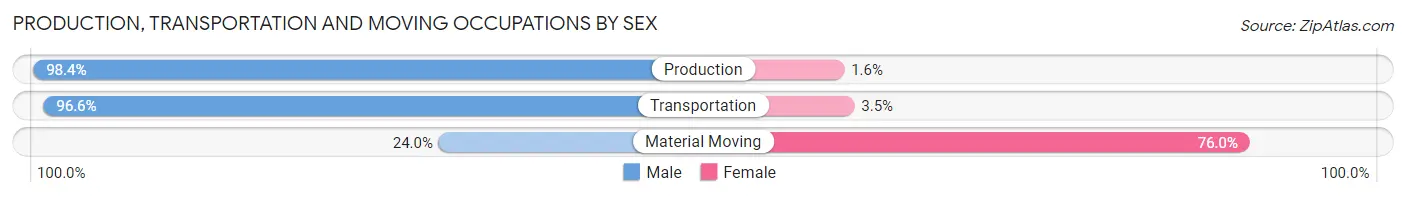
| Occupation | Male | Female |
| Production | 124 (98.4%) | 2 (1.6%) |
| Transportation | 280 (96.6%) | 10 (3.5%) |
| Material Moving | 12 (24.0%) | 38 (76.0%) |
| Total (Category) | 416 (89.3%) | 50 (10.7%) |
| Total (Overall) | 3,558 (54.7%) | 2,942 (45.3%) |
Employment Industries by Sex in Grover Beach
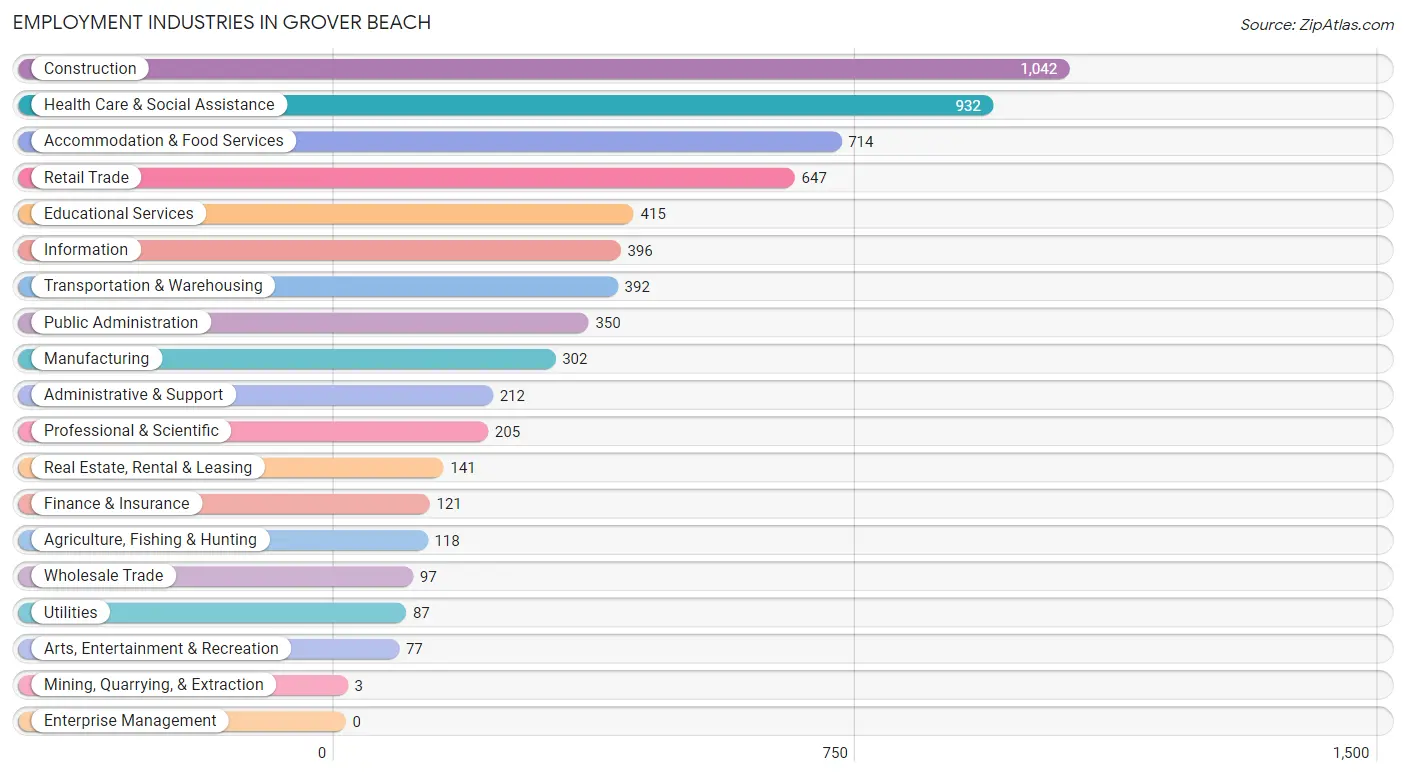
Employment Industries in Grover Beach
The major employment industries in Grover Beach include Construction (1,042 | 16.0%), Health Care & Social Assistance (932 | 14.3%), Accommodation & Food Services (714 | 11.0%), Retail Trade (647 | 10.0%), and Educational Services (415 | 6.4%).
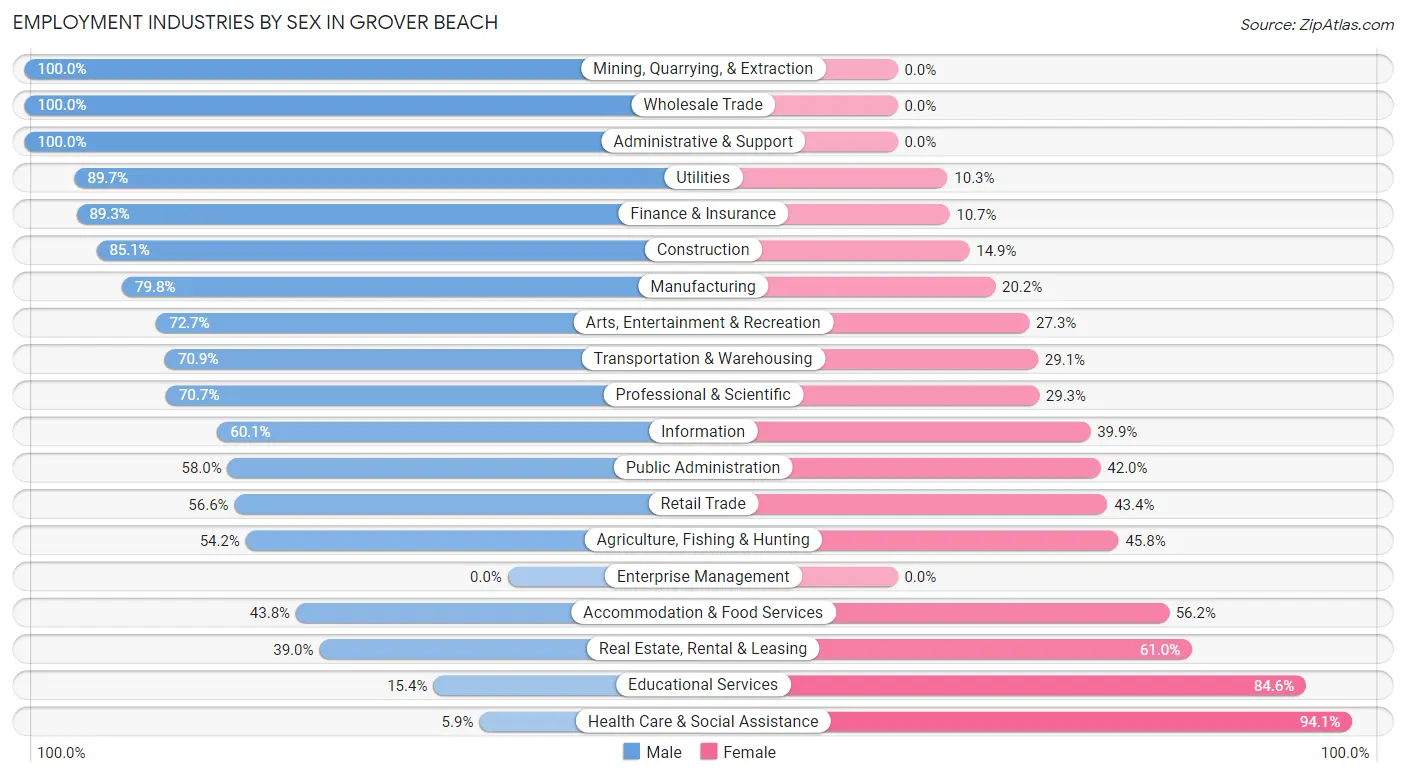
Employment Industries by Sex in Grover Beach
The Grover Beach industries that see more men than women are Mining, Quarrying, & Extraction (100.0%), Wholesale Trade (100.0%), and Administrative & Support (100.0%), whereas the industries that tend to have a higher number of women are Health Care & Social Assistance (94.1%), Educational Services (84.6%), and Real Estate, Rental & Leasing (61.0%).
| Industry | Male | Female |
| Agriculture, Fishing & Hunting | 64 (54.2%) | 54 (45.8%) |
| Mining, Quarrying, & Extraction | 3 (100.0%) | 0 (0.0%) |
| Construction | 887 (85.1%) | 155 (14.9%) |
| Manufacturing | 241 (79.8%) | 61 (20.2%) |
| Wholesale Trade | 97 (100.0%) | 0 (0.0%) |
| Retail Trade | 366 (56.6%) | 281 (43.4%) |
| Transportation & Warehousing | 278 (70.9%) | 114 (29.1%) |
| Utilities | 78 (89.7%) | 9 (10.3%) |
| Information | 238 (60.1%) | 158 (39.9%) |
| Finance & Insurance | 108 (89.3%) | 13 (10.7%) |
| Real Estate, Rental & Leasing | 55 (39.0%) | 86 (61.0%) |
| Professional & Scientific | 145 (70.7%) | 60 (29.3%) |
| Enterprise Management | 0 (0.0%) | 0 (0.0%) |
| Administrative & Support | 212 (100.0%) | 0 (0.0%) |
| Educational Services | 64 (15.4%) | 351 (84.6%) |
| Health Care & Social Assistance | 55 (5.9%) | 877 (94.1%) |
| Arts, Entertainment & Recreation | 56 (72.7%) | 21 (27.3%) |
| Accommodation & Food Services | 313 (43.8%) | 401 (56.2%) |
| Public Administration | 203 (58.0%) | 147 (42.0%) |
| Total | 3,558 (54.7%) | 2,942 (45.3%) |
Education in Grover Beach
School Enrollment in Grover Beach
The most common levels of schooling among the 2,905 students in Grover Beach are elementary school (618 | 21.3%), middle school (595 | 20.5%), and high school (530 | 18.2%).
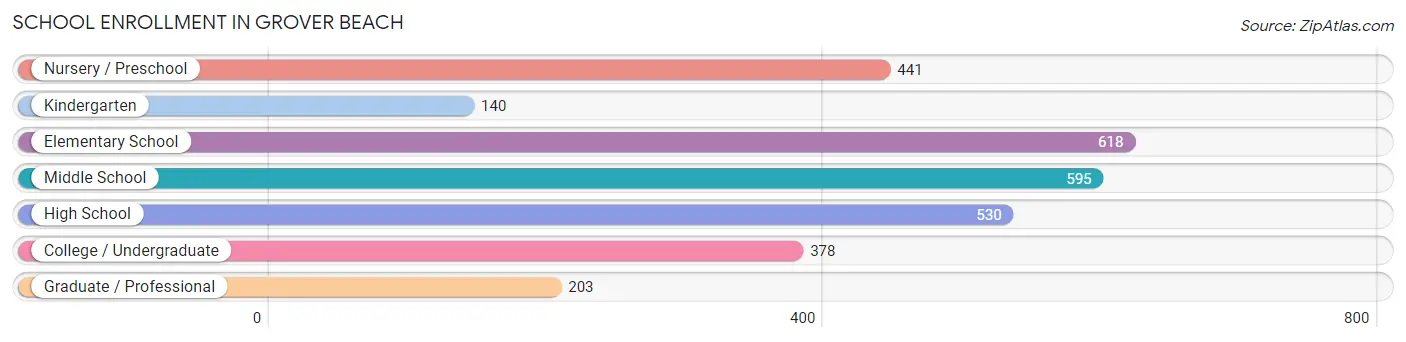
| School Level | # Students | % Students |
| Nursery / Preschool | 441 | 15.2% |
| Kindergarten | 140 | 4.8% |
| Elementary School | 618 | 21.3% |
| Middle School | 595 | 20.5% |
| High School | 530 | 18.2% |
| College / Undergraduate | 378 | 13.0% |
| Graduate / Professional | 203 | 7.0% |
| Total | 2,905 | 100.0% |
School Enrollment by Age by Funding Source in Grover Beach
Out of a total of 2,905 students who are enrolled in schools in Grover Beach, 430 (14.8%) attend a private institution, while the remaining 2,475 (85.2%) are enrolled in public schools. The age group of 25 to 34 year olds has the highest likelihood of being enrolled in private schools, with 180 (73.8% in the age bracket) enrolled. Conversely, the age group of 18 to 19 year olds has the lowest likelihood of being enrolled in a private school, with 44 (100.0% in the age bracket) attending a public institution.
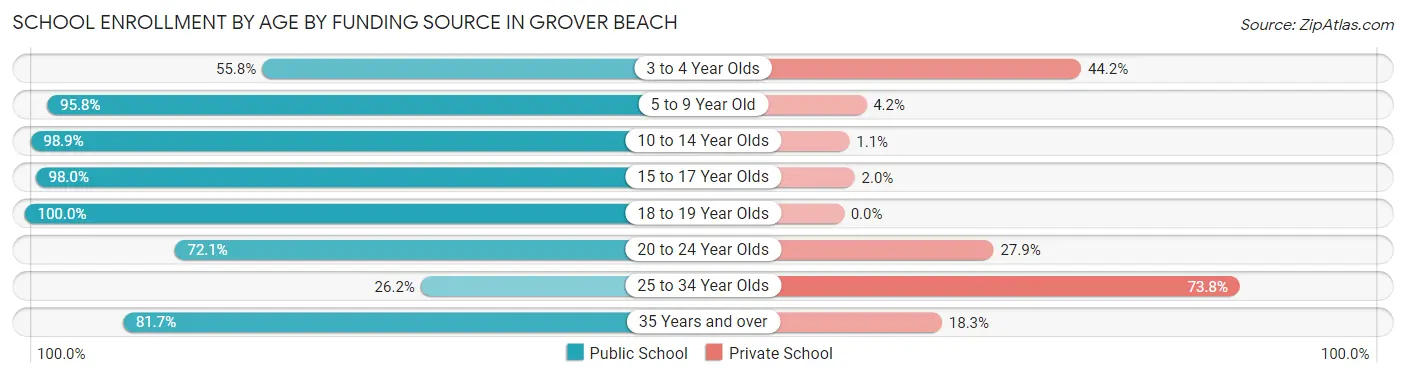
| Age Bracket | Public School | Private School |
| 3 to 4 Year Olds | 164 (55.8%) | 130 (44.2%) |
| 5 to 9 Year Old | 845 (95.8%) | 37 (4.2%) |
| 10 to 14 Year Olds | 748 (98.9%) | 8 (1.1%) |
| 15 to 17 Year Olds | 384 (98.0%) | 8 (2.0%) |
| 18 to 19 Year Olds | 44 (100.0%) | 0 (0.0%) |
| 20 to 24 Year Olds | 93 (72.1%) | 36 (27.9%) |
| 25 to 34 Year Olds | 64 (26.2%) | 180 (73.8%) |
| 35 Years and over | 134 (81.7%) | 30 (18.3%) |
| Total | 2,475 (85.2%) | 430 (14.8%) |
Educational Attainment by Field of Study in Grover Beach
Business (789 | 26.8%), science & technology (394 | 13.4%), visual & performing arts (323 | 11.0%), bio, nature & agricultural (226 | 7.7%), and liberal arts & history (211 | 7.2%) are the most common fields of study among 2,947 individuals in Grover Beach who have obtained a bachelor's degree or higher.
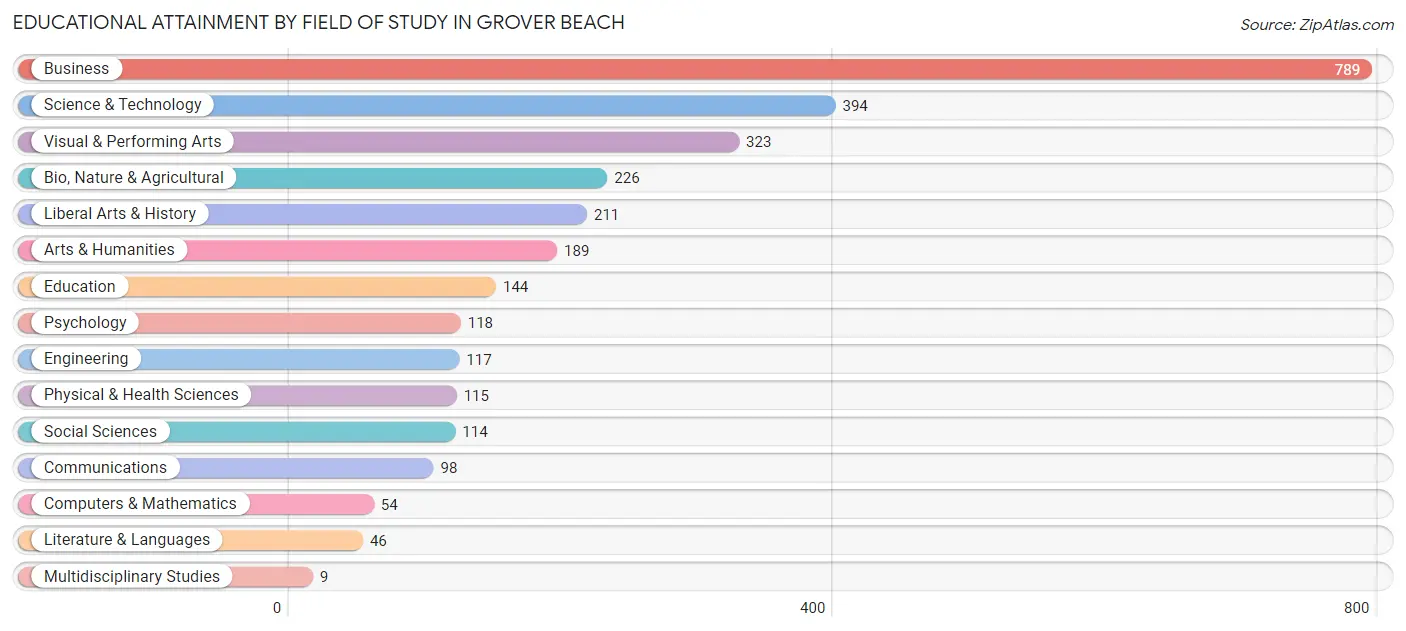
| Field of Study | # Graduates | % Graduates |
| Computers & Mathematics | 54 | 1.8% |
| Bio, Nature & Agricultural | 226 | 7.7% |
| Physical & Health Sciences | 115 | 3.9% |
| Psychology | 118 | 4.0% |
| Social Sciences | 114 | 3.9% |
| Engineering | 117 | 4.0% |
| Multidisciplinary Studies | 9 | 0.3% |
| Science & Technology | 394 | 13.4% |
| Business | 789 | 26.8% |
| Education | 144 | 4.9% |
| Literature & Languages | 46 | 1.6% |
| Liberal Arts & History | 211 | 7.2% |
| Visual & Performing Arts | 323 | 11.0% |
| Communications | 98 | 3.3% |
| Arts & Humanities | 189 | 6.4% |
| Total | 2,947 | 100.0% |
Transportation & Commute in Grover Beach
Vehicle Availability by Sex in Grover Beach
The most prevalent vehicle ownership categories in Grover Beach are males with 2 vehicles (1,273, accounting for 36.1%) and females with 2 vehicles (1,035, making up 44.4%).
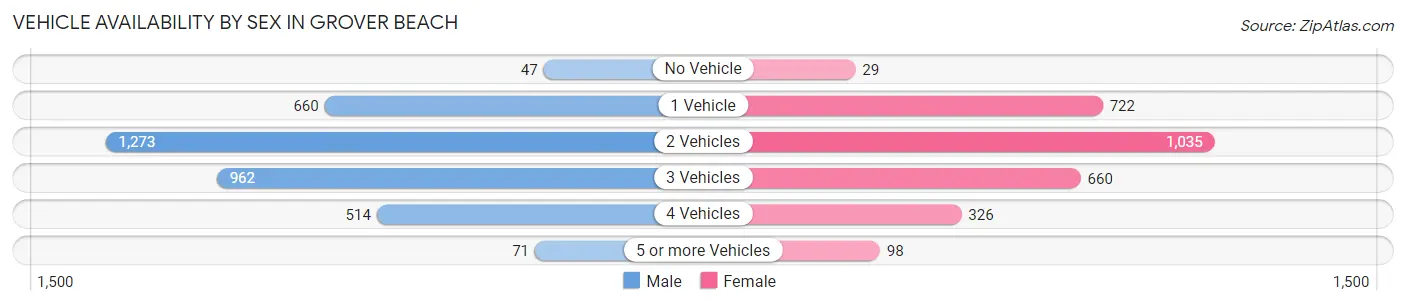
| Vehicles Available | Male | Female |
| No Vehicle | 47 (1.3%) | 29 (1.0%) |
| 1 Vehicle | 660 (18.7%) | 722 (25.2%) |
| 2 Vehicles | 1,273 (36.1%) | 1,035 (36.1%) |
| 3 Vehicles | 962 (27.3%) | 660 (23.0%) |
| 4 Vehicles | 514 (14.6%) | 326 (11.4%) |
| 5 or more Vehicles | 71 (2.0%) | 98 (3.4%) |
| Total | 3,527 (100.0%) | 2,870 (100.0%) |
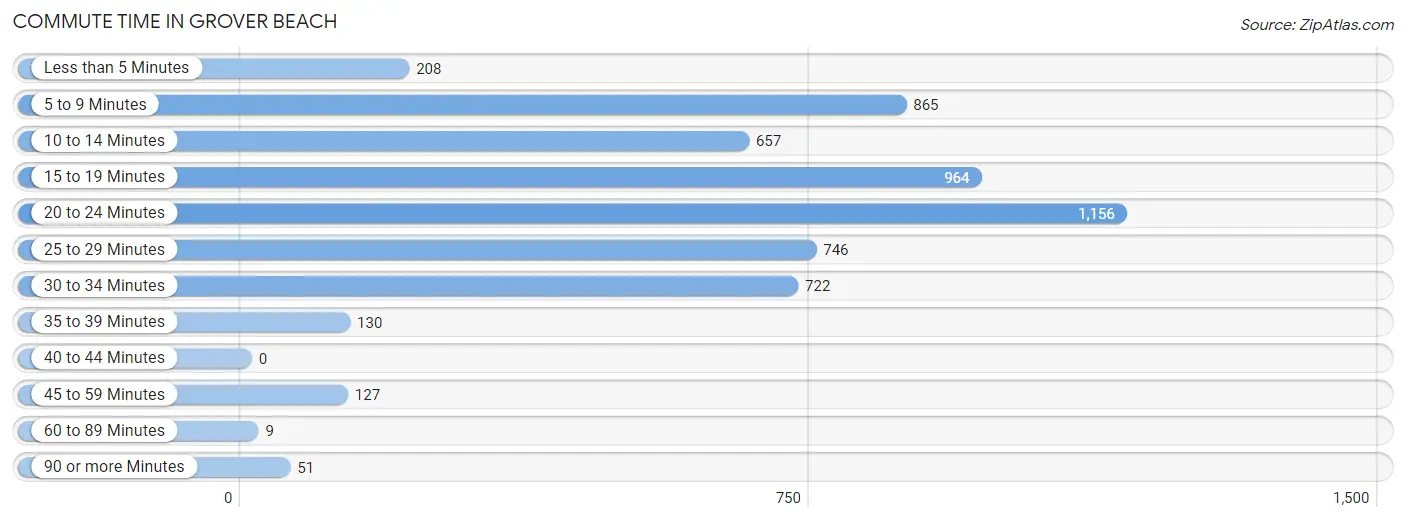
Commute Time in Grover Beach
The most frequently occuring commute durations in Grover Beach are 20 to 24 minutes (1,156 commuters, 20.5%), 15 to 19 minutes (964 commuters, 17.1%), and 5 to 9 minutes (865 commuters, 15.3%).
| Commute Time | # Commuters | % Commuters |
| Less than 5 Minutes | 208 | 3.7% |
| 5 to 9 Minutes | 865 | 15.3% |
| 10 to 14 Minutes | 657 | 11.7% |
| 15 to 19 Minutes | 964 | 17.1% |
| 20 to 24 Minutes | 1,156 | 20.5% |
| 25 to 29 Minutes | 746 | 13.2% |
| 30 to 34 Minutes | 722 | 12.8% |
| 35 to 39 Minutes | 130 | 2.3% |
| 40 to 44 Minutes | 0 | 0.0% |
| 45 to 59 Minutes | 127 | 2.2% |
| 60 to 89 Minutes | 9 | 0.2% |
| 90 or more Minutes | 51 | 0.9% |
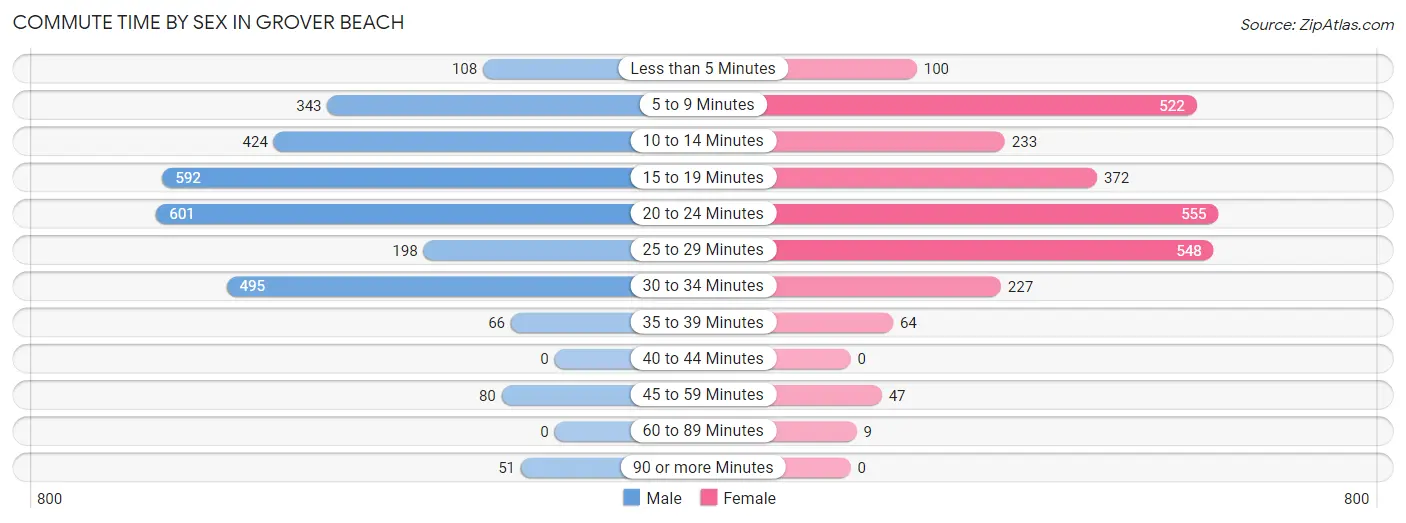
Commute Time by Sex in Grover Beach
The most common commute times in Grover Beach are 20 to 24 minutes (601 commuters, 20.3%) for males and 20 to 24 minutes (555 commuters, 20.7%) for females.
| Commute Time | Male | Female |
| Less than 5 Minutes | 108 (3.6%) | 100 (3.7%) |
| 5 to 9 Minutes | 343 (11.6%) | 522 (19.5%) |
| 10 to 14 Minutes | 424 (14.3%) | 233 (8.7%) |
| 15 to 19 Minutes | 592 (20.0%) | 372 (13.9%) |
| 20 to 24 Minutes | 601 (20.3%) | 555 (20.7%) |
| 25 to 29 Minutes | 198 (6.7%) | 548 (20.5%) |
| 30 to 34 Minutes | 495 (16.7%) | 227 (8.5%) |
| 35 to 39 Minutes | 66 (2.2%) | 64 (2.4%) |
| 40 to 44 Minutes | 0 (0.0%) | 0 (0.0%) |
| 45 to 59 Minutes | 80 (2.7%) | 47 (1.8%) |
| 60 to 89 Minutes | 0 (0.0%) | 9 (0.3%) |
| 90 or more Minutes | 51 (1.7%) | 0 (0.0%) |
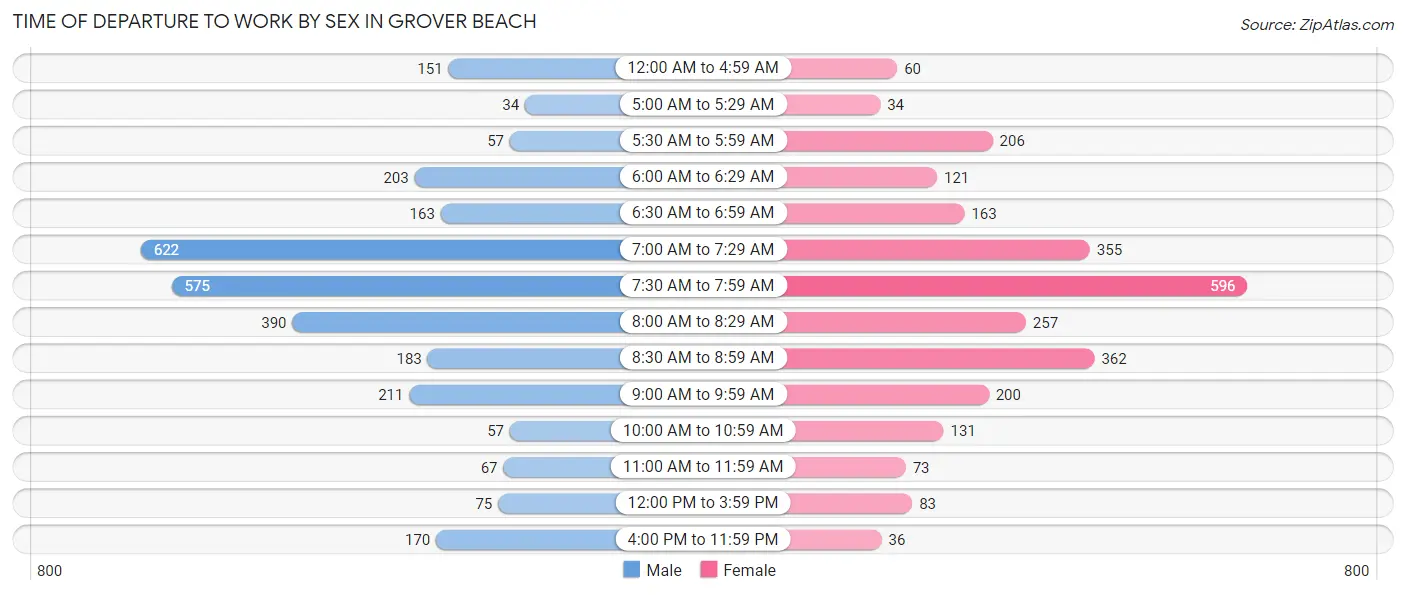
Time of Departure to Work by Sex in Grover Beach
The most frequent times of departure to work in Grover Beach are 7:00 AM to 7:29 AM (622, 21.0%) for males and 7:30 AM to 7:59 AM (596, 22.3%) for females.
| Time of Departure | Male | Female |
| 12:00 AM to 4:59 AM | 151 (5.1%) | 60 (2.2%) |
| 5:00 AM to 5:29 AM | 34 (1.1%) | 34 (1.3%) |
| 5:30 AM to 5:59 AM | 57 (1.9%) | 206 (7.7%) |
| 6:00 AM to 6:29 AM | 203 (6.9%) | 121 (4.5%) |
| 6:30 AM to 6:59 AM | 163 (5.5%) | 163 (6.1%) |
| 7:00 AM to 7:29 AM | 622 (21.0%) | 355 (13.3%) |
| 7:30 AM to 7:59 AM | 575 (19.4%) | 596 (22.3%) |
| 8:00 AM to 8:29 AM | 390 (13.2%) | 257 (9.6%) |
| 8:30 AM to 8:59 AM | 183 (6.2%) | 362 (13.5%) |
| 9:00 AM to 9:59 AM | 211 (7.1%) | 200 (7.5%) |
| 10:00 AM to 10:59 AM | 57 (1.9%) | 131 (4.9%) |
| 11:00 AM to 11:59 AM | 67 (2.3%) | 73 (2.7%) |
| 12:00 PM to 3:59 PM | 75 (2.5%) | 83 (3.1%) |
| 4:00 PM to 11:59 PM | 170 (5.8%) | 36 (1.3%) |
| Total | 2,958 (100.0%) | 2,677 (100.0%) |
Housing Occupancy in Grover Beach
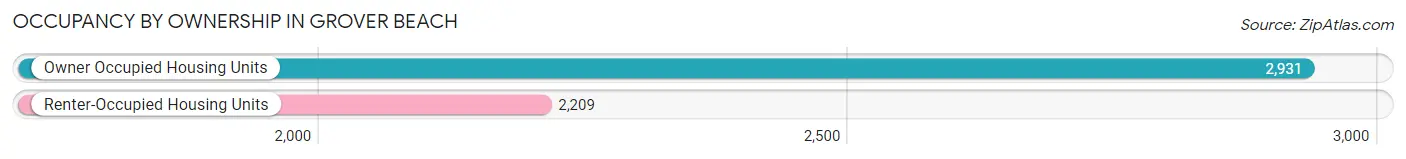
Occupancy by Ownership in Grover Beach
Of the total 5,140 dwellings in Grover Beach, owner-occupied units account for 2,931 (57.0%), while renter-occupied units make up 2,209 (43.0%).
| Occupancy | # Housing Units | % Housing Units |
| Owner Occupied Housing Units | 2,931 | 57.0% |
| Renter-Occupied Housing Units | 2,209 | 43.0% |
| Total Occupied Housing Units | 5,140 | 100.0% |
Occupancy by Household Size in Grover Beach
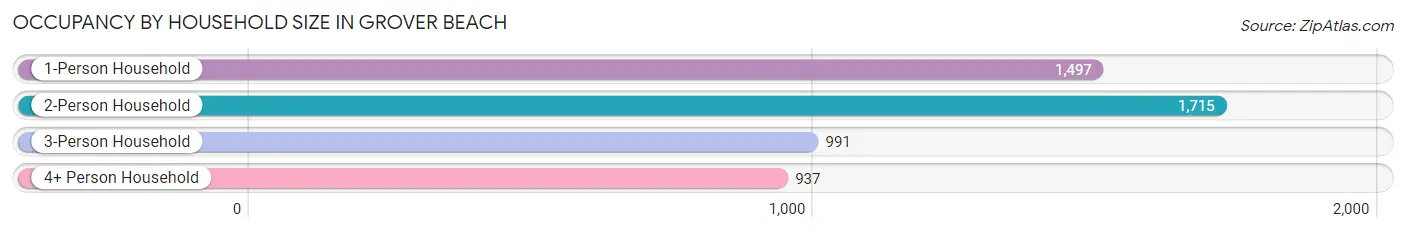
| Household Size | # Housing Units | % Housing Units |
| 1-Person Household | 1,497 | 29.1% |
| 2-Person Household | 1,715 | 33.4% |
| 3-Person Household | 991 | 19.3% |
| 4+ Person Household | 937 | 18.2% |
| Total Housing Units | 5,140 | 100.0% |
Occupancy by Ownership by Household Size in Grover Beach
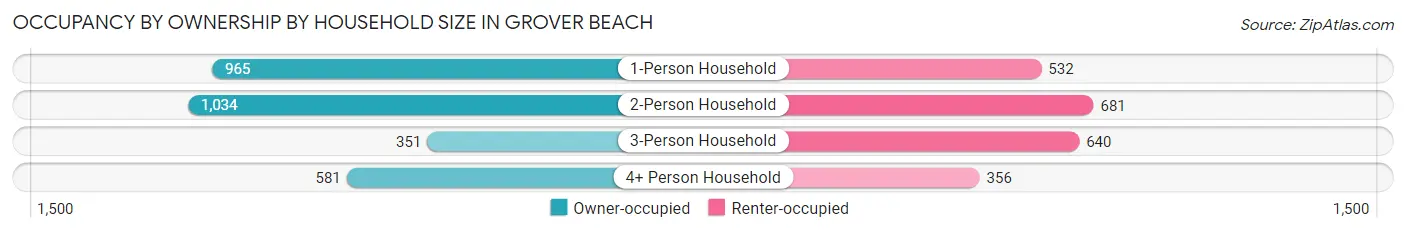
| Household Size | Owner-occupied | Renter-occupied |
| 1-Person Household | 965 (64.5%) | 532 (35.5%) |
| 2-Person Household | 1,034 (60.3%) | 681 (39.7%) |
| 3-Person Household | 351 (35.4%) | 640 (64.6%) |
| 4+ Person Household | 581 (62.0%) | 356 (38.0%) |
| Total Housing Units | 2,931 (57.0%) | 2,209 (43.0%) |
Occupancy by Educational Attainment in Grover Beach
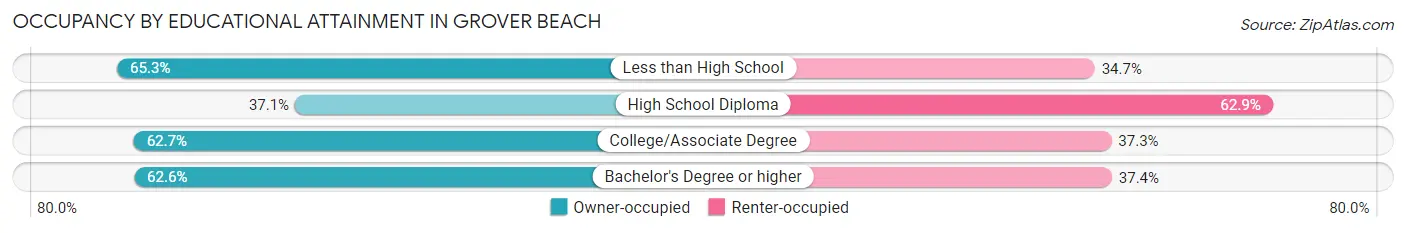
| Household Size | Owner-occupied | Renter-occupied |
| Less than High School | 341 (65.3%) | 181 (34.7%) |
| High School Diploma | 441 (37.1%) | 747 (62.9%) |
| College/Associate Degree | 1,020 (62.7%) | 607 (37.3%) |
| Bachelor's Degree or higher | 1,129 (62.6%) | 674 (37.4%) |
Occupancy by Age of Householder in Grover Beach
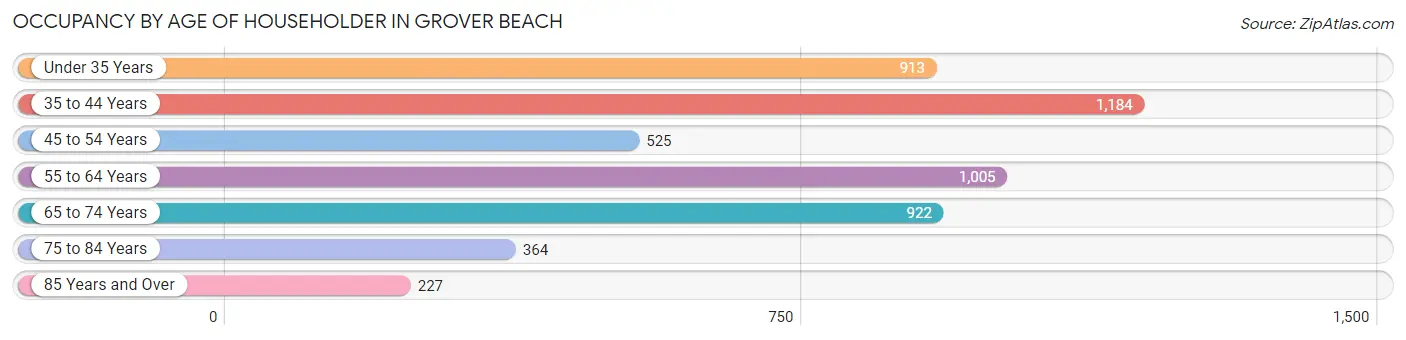
| Age Bracket | # Households | % Households |
| Under 35 Years | 913 | 17.8% |
| 35 to 44 Years | 1,184 | 23.0% |
| 45 to 54 Years | 525 | 10.2% |
| 55 to 64 Years | 1,005 | 19.6% |
| 65 to 74 Years | 922 | 17.9% |
| 75 to 84 Years | 364 | 7.1% |
| 85 Years and Over | 227 | 4.4% |
| Total | 5,140 | 100.0% |
Housing Finances in Grover Beach
Median Income by Occupancy in Grover Beach
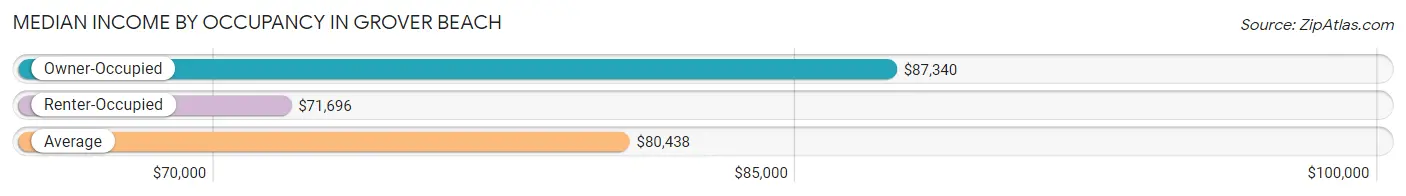
| Occupancy Type | # Households | Median Income |
| Owner-Occupied | 2,931 (57.0%) | $87,340 |
| Renter-Occupied | 2,209 (43.0%) | $71,696 |
| Average | 5,140 (100.0%) | $80,438 |
Occupancy by Householder Income Bracket in Grover Beach
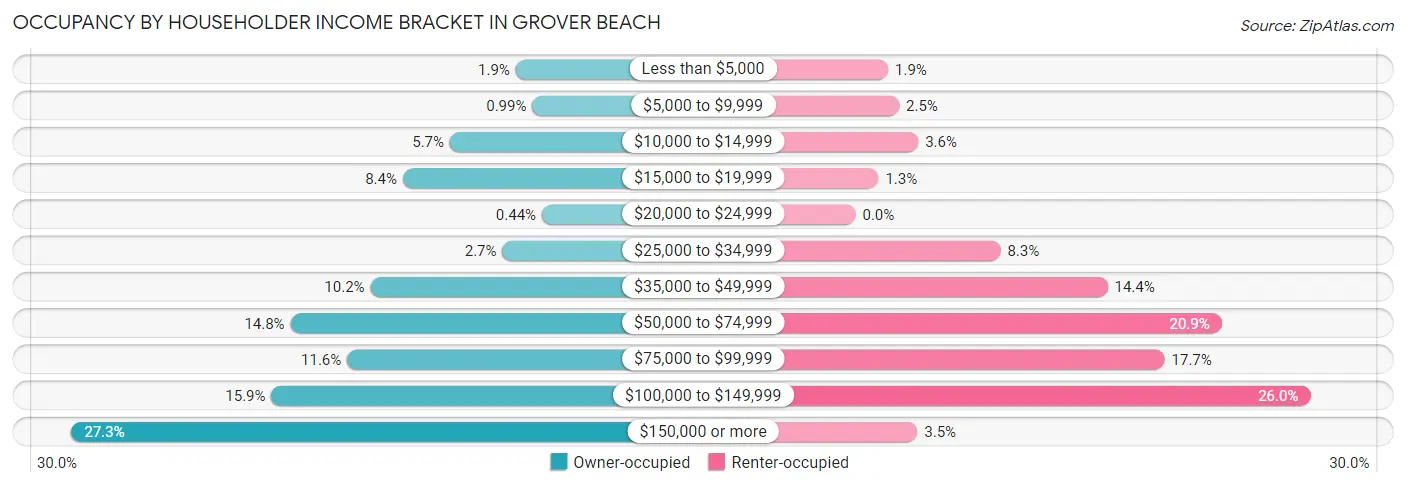
| Income Bracket | Owner-occupied | Renter-occupied |
| Less than $5,000 | 57 (1.9%) | 41 (1.9%) |
| $5,000 to $9,999 | 29 (1.0%) | 55 (2.5%) |
| $10,000 to $14,999 | 167 (5.7%) | 79 (3.6%) |
| $15,000 to $19,999 | 246 (8.4%) | 29 (1.3%) |
| $20,000 to $24,999 | 13 (0.4%) | 0 (0.0%) |
| $25,000 to $34,999 | 79 (2.7%) | 183 (8.3%) |
| $35,000 to $49,999 | 300 (10.2%) | 318 (14.4%) |
| $50,000 to $74,999 | 434 (14.8%) | 462 (20.9%) |
| $75,000 to $99,999 | 339 (11.6%) | 390 (17.7%) |
| $100,000 to $149,999 | 466 (15.9%) | 574 (26.0%) |
| $150,000 or more | 801 (27.3%) | 78 (3.5%) |
| Total | 2,931 (100.0%) | 2,209 (100.0%) |
Monthly Housing Cost Tiers in Grover Beach
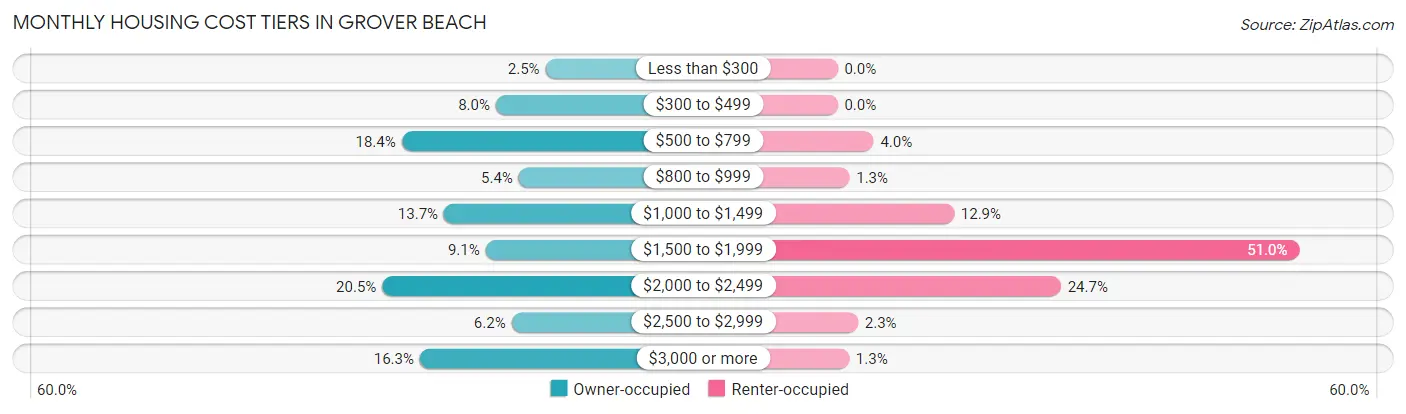
| Monthly Cost | Owner-occupied | Renter-occupied |
| Less than $300 | 72 (2.5%) | 0 (0.0%) |
| $300 to $499 | 233 (8.0%) | 0 (0.0%) |
| $500 to $799 | 538 (18.4%) | 88 (4.0%) |
| $800 to $999 | 159 (5.4%) | 29 (1.3%) |
| $1,000 to $1,499 | 401 (13.7%) | 284 (12.9%) |
| $1,500 to $1,999 | 266 (9.1%) | 1,127 (51.0%) |
| $2,000 to $2,499 | 601 (20.5%) | 545 (24.7%) |
| $2,500 to $2,999 | 182 (6.2%) | 50 (2.3%) |
| $3,000 or more | 479 (16.3%) | 28 (1.3%) |
| Total | 2,931 (100.0%) | 2,209 (100.0%) |
Physical Housing Characteristics in Grover Beach
Housing Structures in Grover Beach
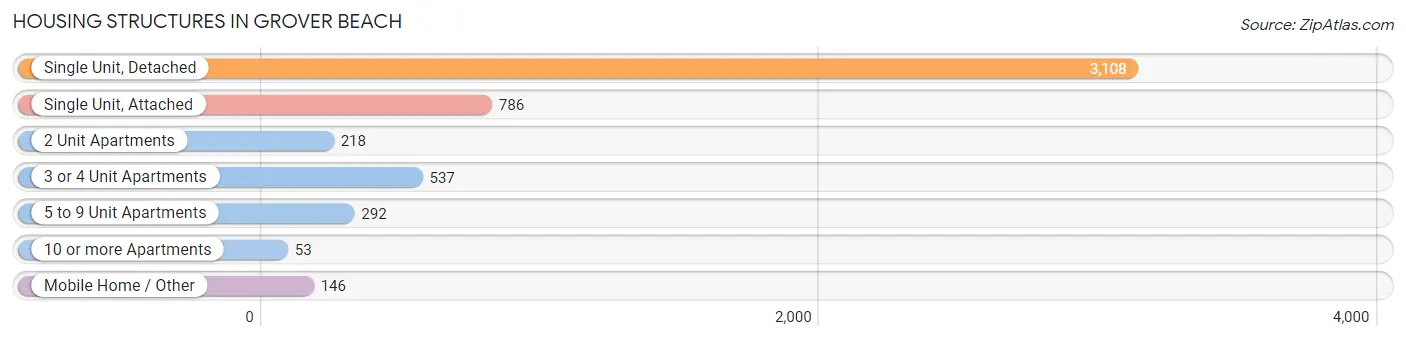
| Structure Type | # Housing Units | % Housing Units |
| Single Unit, Detached | 3,108 | 60.5% |
| Single Unit, Attached | 786 | 15.3% |
| 2 Unit Apartments | 218 | 4.2% |
| 3 or 4 Unit Apartments | 537 | 10.4% |
| 5 to 9 Unit Apartments | 292 | 5.7% |
| 10 or more Apartments | 53 | 1.0% |
| Mobile Home / Other | 146 | 2.8% |
| Total | 5,140 | 100.0% |
Housing Structures by Occupancy in Grover Beach
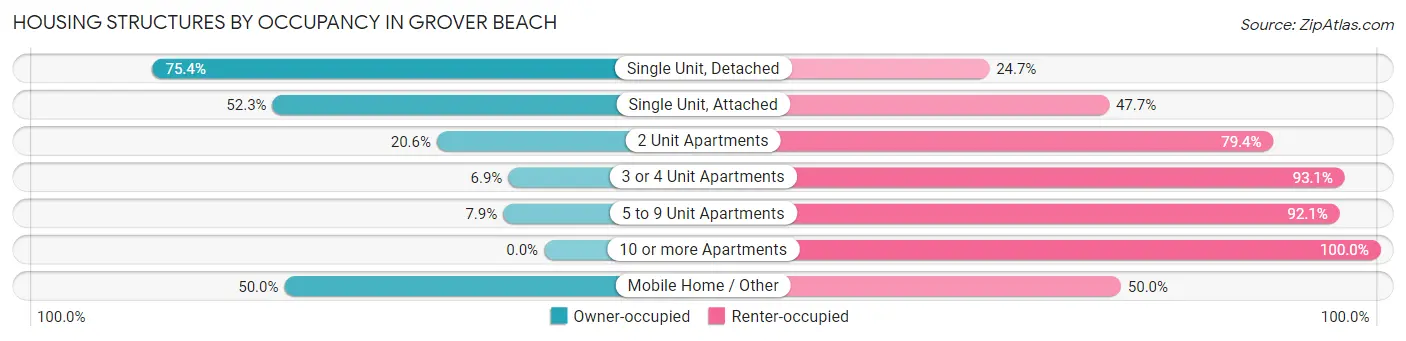
| Structure Type | Owner-occupied | Renter-occupied |
| Single Unit, Detached | 2,342 (75.3%) | 766 (24.6%) |
| Single Unit, Attached | 411 (52.3%) | 375 (47.7%) |
| 2 Unit Apartments | 45 (20.6%) | 173 (79.4%) |
| 3 or 4 Unit Apartments | 37 (6.9%) | 500 (93.1%) |
| 5 to 9 Unit Apartments | 23 (7.9%) | 269 (92.1%) |
| 10 or more Apartments | 0 (0.0%) | 53 (100.0%) |
| Mobile Home / Other | 73 (50.0%) | 73 (50.0%) |
| Total | 2,931 (57.0%) | 2,209 (43.0%) |
Housing Structures by Number of Rooms in Grover Beach
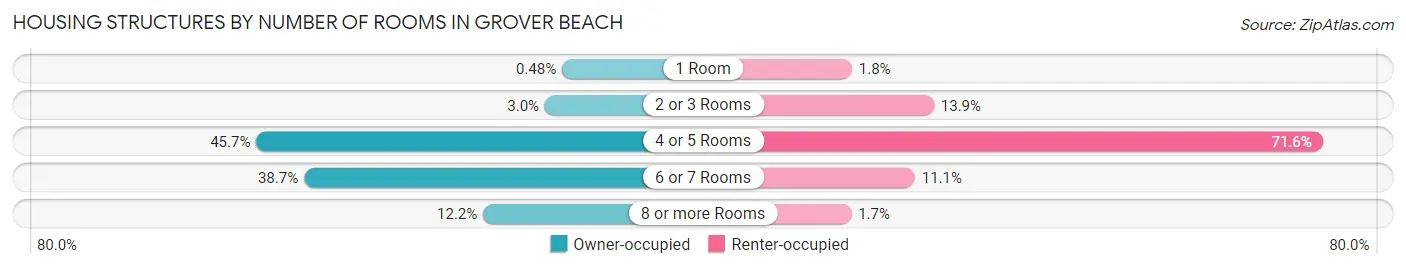
| Number of Rooms | Owner-occupied | Renter-occupied |
| 1 Room | 14 (0.5%) | 39 (1.8%) |
| 2 or 3 Rooms | 88 (3.0%) | 307 (13.9%) |
| 4 or 5 Rooms | 1,340 (45.7%) | 1,581 (71.6%) |
| 6 or 7 Rooms | 1,133 (38.7%) | 245 (11.1%) |
| 8 or more Rooms | 356 (12.1%) | 37 (1.7%) |
| Total | 2,931 (100.0%) | 2,209 (100.0%) |
Housing Structure by Heating Type in Grover Beach
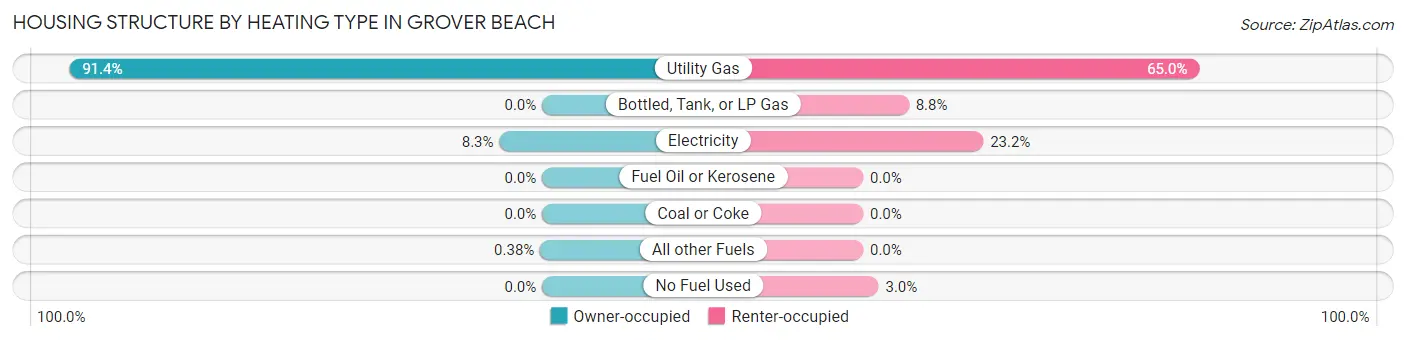
| Heating Type | Owner-occupied | Renter-occupied |
| Utility Gas | 2,678 (91.4%) | 1,435 (65.0%) |
| Bottled, Tank, or LP Gas | 0 (0.0%) | 195 (8.8%) |
| Electricity | 242 (8.3%) | 513 (23.2%) |
| Fuel Oil or Kerosene | 0 (0.0%) | 0 (0.0%) |
| Coal or Coke | 0 (0.0%) | 0 (0.0%) |
| All other Fuels | 11 (0.4%) | 0 (0.0%) |
| No Fuel Used | 0 (0.0%) | 66 (3.0%) |
| Total | 2,931 (100.0%) | 2,209 (100.0%) |
Household Vehicle Usage in Grover Beach
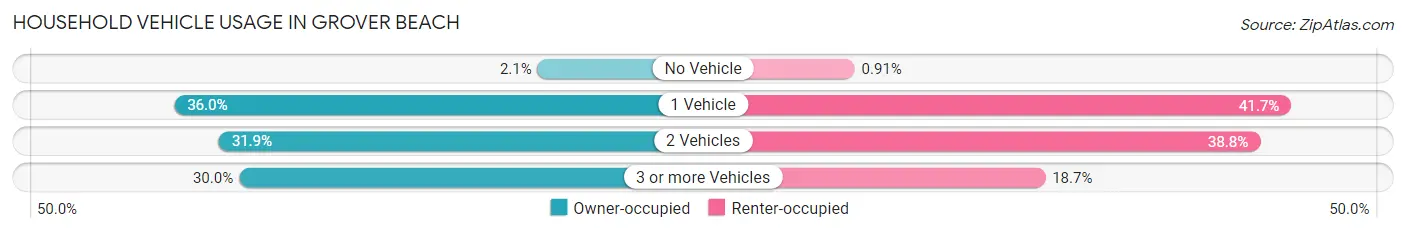
| Vehicles per Household | Owner-occupied | Renter-occupied |
| No Vehicle | 62 (2.1%) | 20 (0.9%) |
| 1 Vehicle | 1,056 (36.0%) | 920 (41.6%) |
| 2 Vehicles | 934 (31.9%) | 856 (38.8%) |
| 3 or more Vehicles | 879 (30.0%) | 413 (18.7%) |
| Total | 2,931 (100.0%) | 2,209 (100.0%) |
Real Estate & Mortgages in Grover Beach
Real Estate and Mortgage Overview in Grover Beach
| Characteristic | Without Mortgage | With Mortgage |
| Housing Units | 966 | 1,965 |
| Median Property Value | $582,700 | $673,000 |
| Median Household Income | $47,692 | $753 |
| Monthly Housing Costs | $578 | $479 |
| Real Estate Taxes | $3,529 | $0 |
Property Value by Mortgage Status in Grover Beach
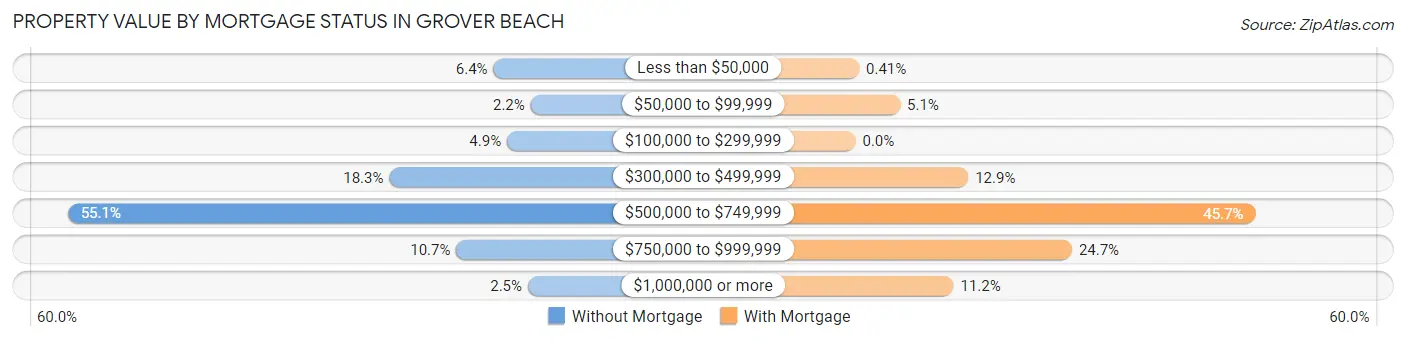
| Property Value | Without Mortgage | With Mortgage |
| Less than $50,000 | 62 (6.4%) | 8 (0.4%) |
| $50,000 to $99,999 | 21 (2.2%) | 100 (5.1%) |
| $100,000 to $299,999 | 47 (4.9%) | 0 (0.0%) |
| $300,000 to $499,999 | 177 (18.3%) | 253 (12.9%) |
| $500,000 to $749,999 | 532 (55.1%) | 898 (45.7%) |
| $750,000 to $999,999 | 103 (10.7%) | 486 (24.7%) |
| $1,000,000 or more | 24 (2.5%) | 220 (11.2%) |
| Total | 966 (100.0%) | 1,965 (100.0%) |
Household Income by Mortgage Status in Grover Beach
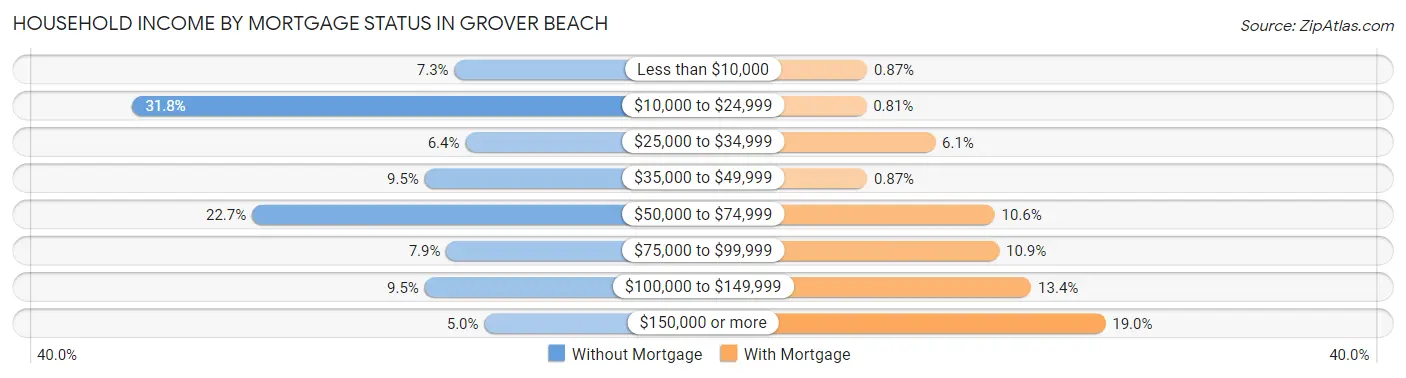
| Household Income | Without Mortgage | With Mortgage |
| Less than $10,000 | 70 (7.2%) | 17 (0.9%) |
| $10,000 to $24,999 | 307 (31.8%) | 16 (0.8%) |
| $25,000 to $34,999 | 62 (6.4%) | 119 (6.1%) |
| $35,000 to $49,999 | 92 (9.5%) | 17 (0.9%) |
| $50,000 to $74,999 | 219 (22.7%) | 208 (10.6%) |
| $75,000 to $99,999 | 76 (7.9%) | 215 (10.9%) |
| $100,000 to $149,999 | 92 (9.5%) | 263 (13.4%) |
| $150,000 or more | 48 (5.0%) | 374 (19.0%) |
| Total | 966 (100.0%) | 1,965 (100.0%) |
Property Value to Household Income Ratio in Grover Beach
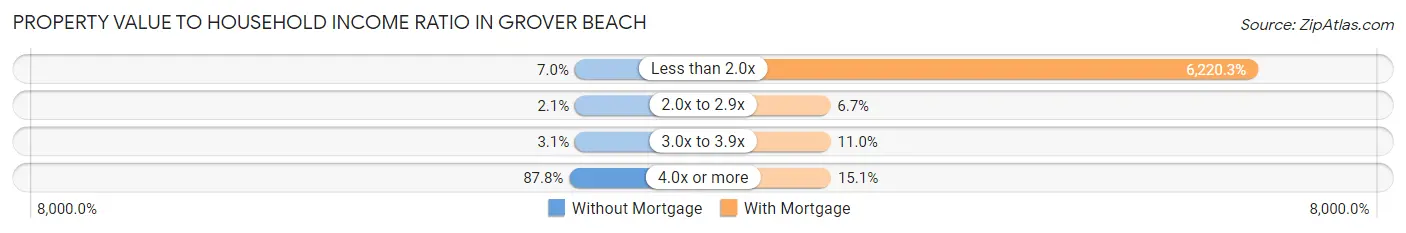
| Value-to-Income Ratio | Without Mortgage | With Mortgage |
| Less than 2.0x | 68 (7.0%) | 122,228 (6,220.3%) |
| 2.0x to 2.9x | 20 (2.1%) | 131 (6.7%) |
| 3.0x to 3.9x | 30 (3.1%) | 216 (11.0%) |
| 4.0x or more | 848 (87.8%) | 296 (15.1%) |
| Total | 966 (100.0%) | 1,965 (100.0%) |
Real Estate Taxes by Mortgage Status in Grover Beach
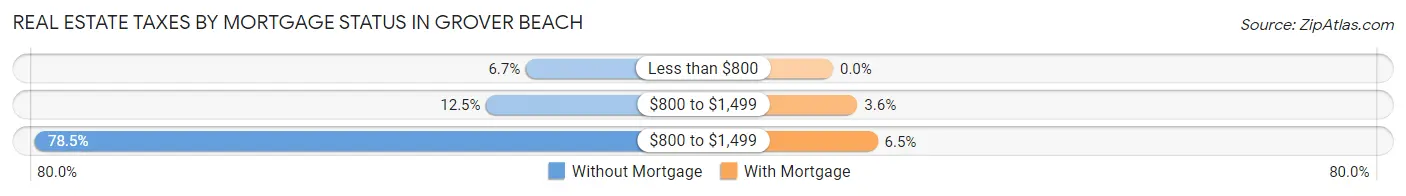
| Property Taxes | Without Mortgage | With Mortgage |
| Less than $800 | 65 (6.7%) | 0 (0.0%) |
| $800 to $1,499 | 121 (12.5%) | 70 (3.6%) |
| $800 to $1,499 | 758 (78.5%) | 128 (6.5%) |
| Total | 966 (100.0%) | 1,965 (100.0%) |
Health & Disability in Grover Beach
Health Insurance Coverage by Age in Grover Beach
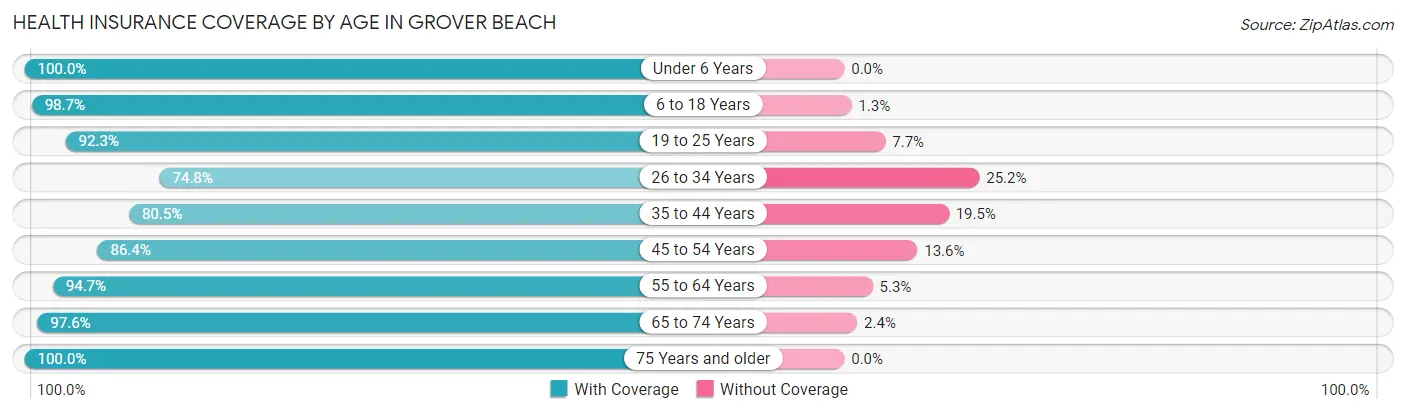
| Age Bracket | With Coverage | Without Coverage |
| Under 6 Years | 891 (100.0%) | 0 (0.0%) |
| 6 to 18 Years | 1,848 (98.7%) | 25 (1.3%) |
| 19 to 25 Years | 771 (92.3%) | 64 (7.7%) |
| 26 to 34 Years | 1,331 (74.8%) | 448 (25.2%) |
| 35 to 44 Years | 1,803 (80.5%) | 436 (19.5%) |
| 45 to 54 Years | 990 (86.4%) | 156 (13.6%) |
| 55 to 64 Years | 1,543 (94.7%) | 86 (5.3%) |
| 65 to 74 Years | 1,461 (97.6%) | 36 (2.4%) |
| 75 Years and older | 861 (100.0%) | 0 (0.0%) |
| Total | 11,499 (90.2%) | 1,251 (9.8%) |
Health Insurance Coverage by Citizenship Status in Grover Beach
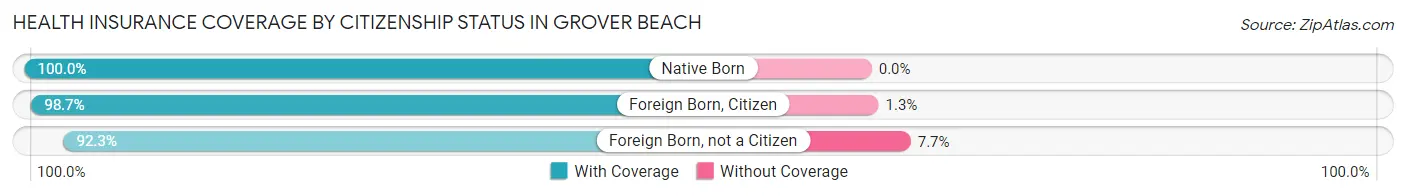
| Citizenship Status | With Coverage | Without Coverage |
| Native Born | 891 (100.0%) | 0 (0.0%) |
| Foreign Born, Citizen | 1,848 (98.7%) | 25 (1.3%) |
| Foreign Born, not a Citizen | 771 (92.3%) | 64 (7.7%) |
Health Insurance Coverage by Household Income in Grover Beach
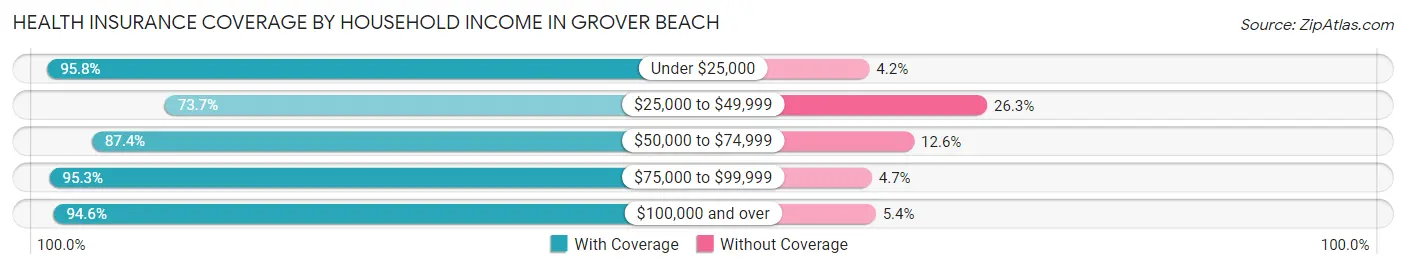
| Household Income | With Coverage | Without Coverage |
| Under $25,000 | 948 (95.8%) | 42 (4.2%) |
| $25,000 to $49,999 | 1,586 (73.7%) | 565 (26.3%) |
| $50,000 to $74,999 | 1,717 (87.4%) | 248 (12.6%) |
| $75,000 to $99,999 | 2,052 (95.3%) | 101 (4.7%) |
| $100,000 and over | 5,148 (94.6%) | 295 (5.4%) |
Public vs Private Health Insurance Coverage by Age in Grover Beach
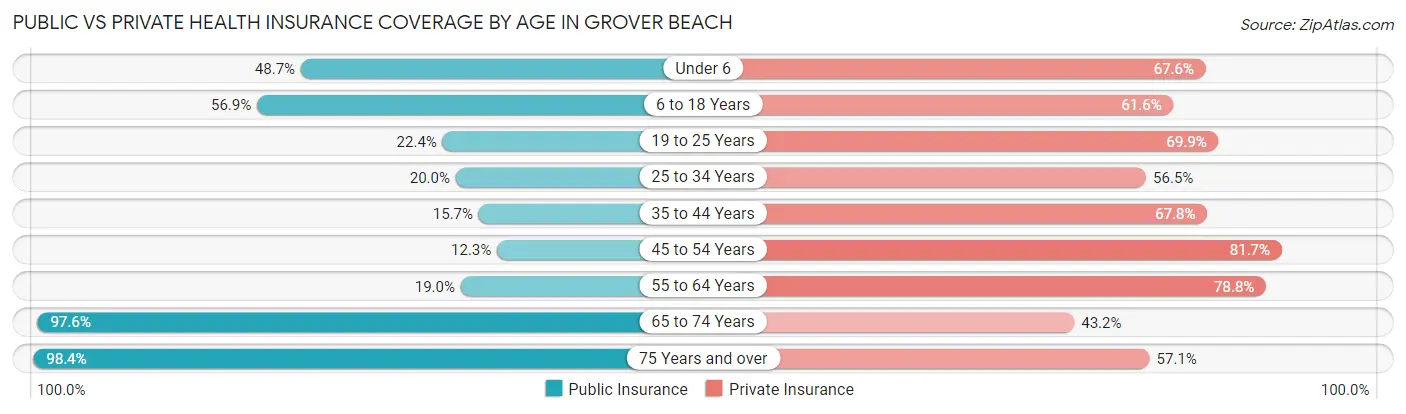
| Age Bracket | Public Insurance | Private Insurance |
| Under 6 | 434 (48.7%) | 602 (67.6%) |
| 6 to 18 Years | 1,065 (56.9%) | 1,153 (61.6%) |
| 19 to 25 Years | 187 (22.4%) | 584 (69.9%) |
| 25 to 34 Years | 355 (20.0%) | 1,005 (56.5%) |
| 35 to 44 Years | 351 (15.7%) | 1,519 (67.8%) |
| 45 to 54 Years | 141 (12.3%) | 936 (81.7%) |
| 55 to 64 Years | 310 (19.0%) | 1,283 (78.8%) |
| 65 to 74 Years | 1,461 (97.6%) | 646 (43.1%) |
| 75 Years and over | 847 (98.4%) | 492 (57.1%) |
| Total | 5,151 (40.4%) | 8,220 (64.5%) |
Disability Status by Sex by Age in Grover Beach
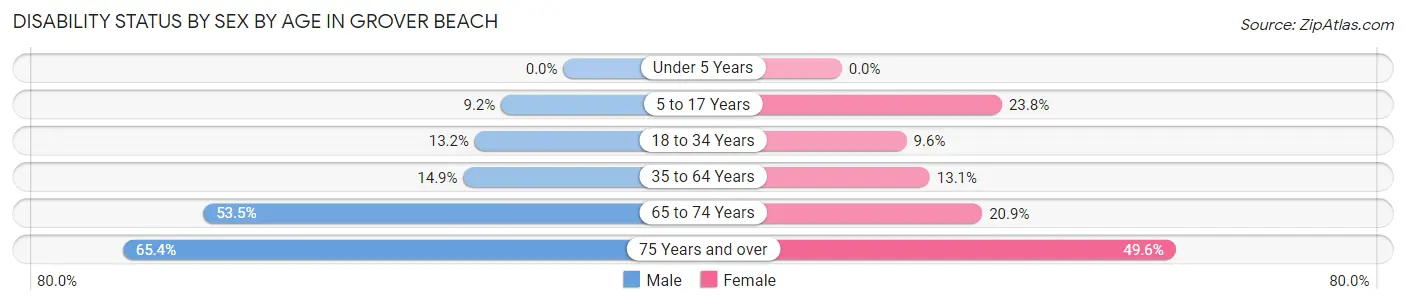
| Age Bracket | Male | Female |
| Under 5 Years | 0 (0.0%) | 0 (0.0%) |
| 5 to 17 Years | 113 (9.2%) | 192 (23.8%) |
| 18 to 34 Years | 199 (13.2%) | 108 (9.6%) |
| 35 to 64 Years | 378 (14.8%) | 323 (13.1%) |
| 65 to 74 Years | 362 (53.5%) | 171 (20.8%) |
| 75 Years and over | 191 (65.4%) | 282 (49.6%) |
Disability Class by Sex by Age in Grover Beach
Disability Class: Hearing Difficulty
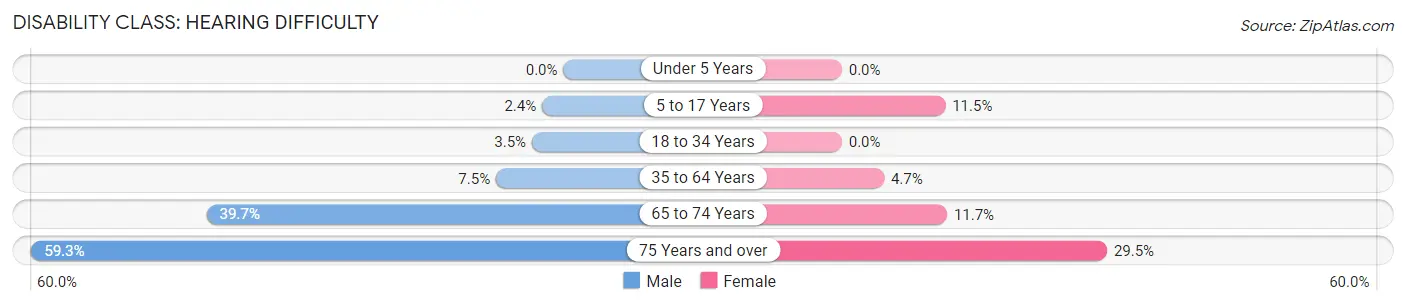
| Age Bracket | Male | Female |
| Under 5 Years | 0 (0.0%) | 0 (0.0%) |
| 5 to 17 Years | 29 (2.4%) | 93 (11.5%) |
| 18 to 34 Years | 53 (3.5%) | 0 (0.0%) |
| 35 to 64 Years | 191 (7.5%) | 116 (4.7%) |
| 65 to 74 Years | 269 (39.7%) | 96 (11.7%) |
| 75 Years and over | 173 (59.3%) | 168 (29.5%) |
Disability Class: Vision Difficulty
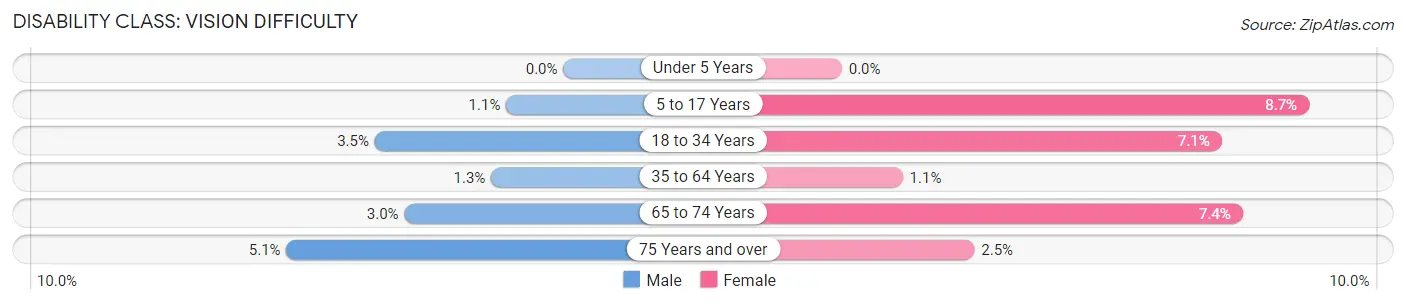
| Age Bracket | Male | Female |
| Under 5 Years | 0 (0.0%) | 0 (0.0%) |
| 5 to 17 Years | 13 (1.1%) | 70 (8.7%) |
| 18 to 34 Years | 53 (3.5%) | 79 (7.0%) |
| 35 to 64 Years | 34 (1.3%) | 28 (1.1%) |
| 65 to 74 Years | 20 (2.9%) | 61 (7.4%) |
| 75 Years and over | 15 (5.1%) | 14 (2.5%) |
Disability Class: Cognitive Difficulty
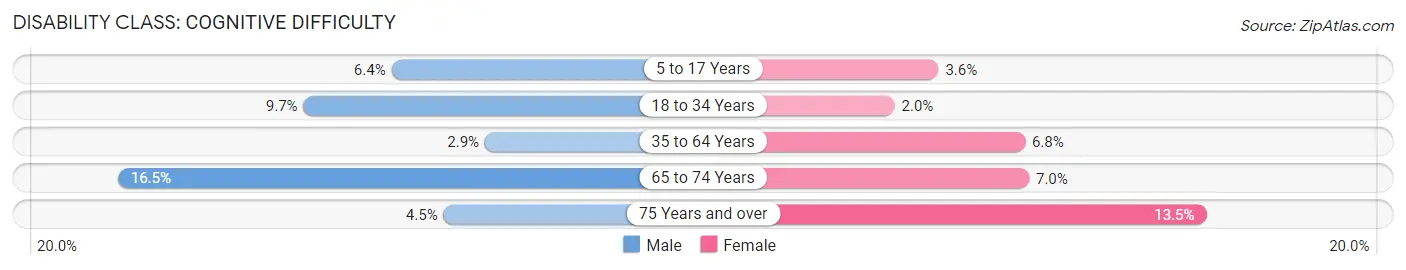
| Age Bracket | Male | Female |
| 5 to 17 Years | 78 (6.4%) | 29 (3.6%) |
| 18 to 34 Years | 146 (9.7%) | 22 (2.0%) |
| 35 to 64 Years | 74 (2.9%) | 168 (6.8%) |
| 65 to 74 Years | 112 (16.5%) | 57 (7.0%) |
| 75 Years and over | 13 (4.4%) | 77 (13.5%) |
Disability Class: Ambulatory Difficulty
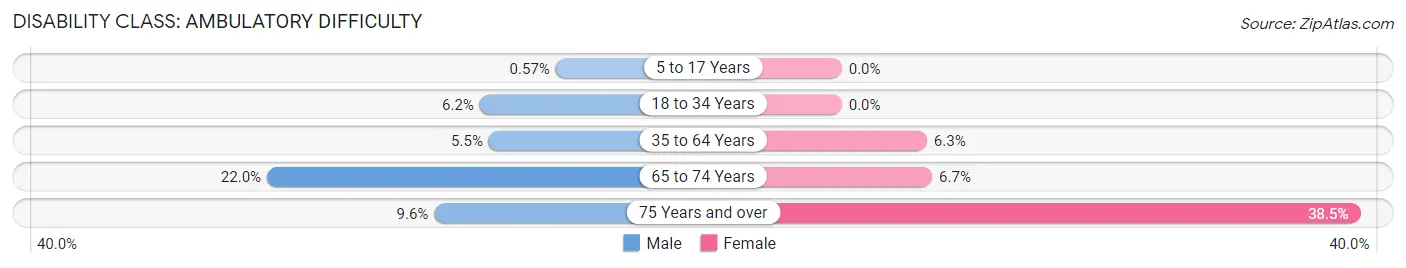
| Age Bracket | Male | Female |
| 5 to 17 Years | 7 (0.6%) | 0 (0.0%) |
| 18 to 34 Years | 94 (6.2%) | 0 (0.0%) |
| 35 to 64 Years | 141 (5.5%) | 156 (6.3%) |
| 65 to 74 Years | 149 (22.0%) | 55 (6.7%) |
| 75 Years and over | 28 (9.6%) | 219 (38.5%) |
Disability Class: Self-Care Difficulty
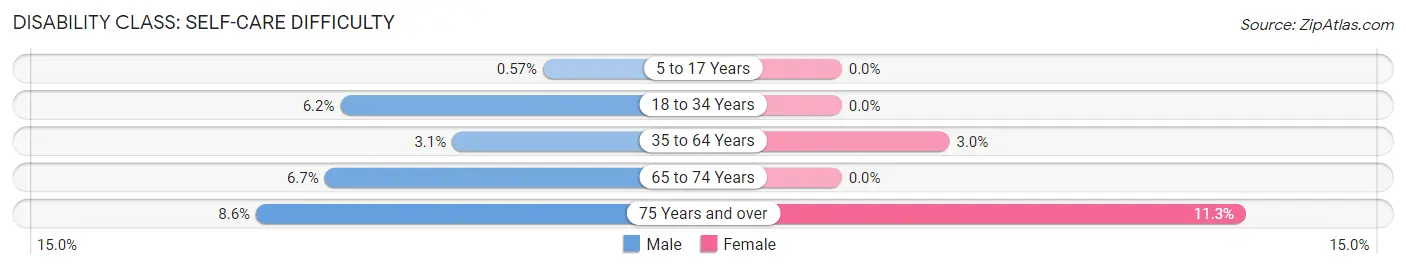
| Age Bracket | Male | Female |
| 5 to 17 Years | 7 (0.6%) | 0 (0.0%) |
| 18 to 34 Years | 94 (6.2%) | 0 (0.0%) |
| 35 to 64 Years | 79 (3.1%) | 74 (3.0%) |
| 65 to 74 Years | 45 (6.7%) | 0 (0.0%) |
| 75 Years and over | 25 (8.6%) | 64 (11.3%) |
Technology Access in Grover Beach
Computing Device Access in Grover Beach
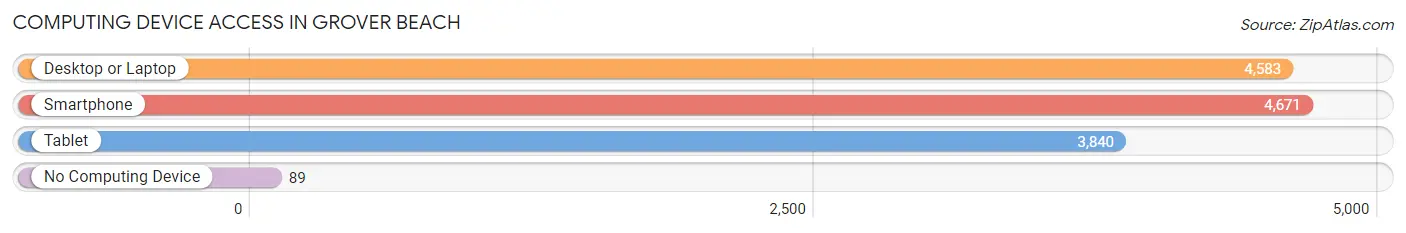
| Device Type | # Households | % Households |
| Desktop or Laptop | 4,583 | 89.2% |
| Smartphone | 4,671 | 90.9% |
| Tablet | 3,840 | 74.7% |
| No Computing Device | 89 | 1.7% |
| Total | 5,140 | 100.0% |
Internet Access in Grover Beach
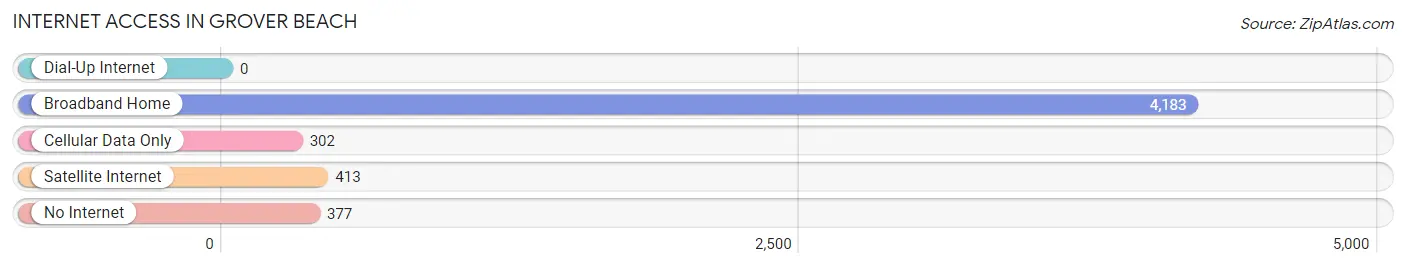
| Internet Type | # Households | % Households |
| Dial-Up Internet | 0 | 0.0% |
| Broadband Home | 4,183 | 81.4% |
| Cellular Data Only | 302 | 5.9% |
| Satellite Internet | 413 | 8.0% |
| No Internet | 377 | 7.3% |
| Total | 5,140 | 100.0% |
Grover Beach Summary
Grover Beach is a city located in San Luis Obispo County, California, United States. It is situated along the Pacific Coast Highway, about halfway between Los Angeles and San Francisco. The city was incorporated in 1959 and has a population of 13,156 as of the 2010 census.
History
The area that is now Grover Beach was originally inhabited by the Chumash people, who lived in the area for thousands of years before the arrival of Europeans. The first Europeans to settle in the area were Spanish missionaries, who established a mission in nearby San Luis Obispo in 1772. The area remained largely undeveloped until the late 19th century, when it was subdivided into small farms and ranches.
In 1887, the area was named Grover City after its first postmaster, W.W. Grover. The name was later changed to Grover Beach in order to avoid confusion with the nearby city of Grover City.
In the early 20th century, the area began to develop as a tourist destination, with the construction of a number of hotels and resorts. The city was officially incorporated in 1959.
Geography
Grover Beach is located at 35°7′25″N 120°37′17″W (35.123611, -120.621389). It is situated along the Pacific Coast Highway, about halfway between Los Angeles and San Francisco. The city has a total area of 4.2 square miles, all of which is land.
The city is bordered by the cities of Arroyo Grande to the north, Oceano to the south, and Pismo Beach to the east. The city is located on a coastal plain, with the Pacific Ocean to the west.
Economy
The economy of Grover Beach is largely based on tourism. The city is home to a number of hotels and resorts, as well as a number of restaurants and shops. The city is also home to a number of light industrial businesses.
Demographics
As of the 2010 census, there were 13,156 people, 5,541 households, and 3,541 families residing in the city. The population density was 3,093.3 people per square mile. There were 5,945 housing units at an average density of 1,420.7 per square mile. The racial makeup of the city was 77.2% White, 0.9% African American, 1.2% Native American, 2.2% Asian, 0.2% Pacific Islander, 14.3% from other races, and 4.1% from two or more races. Hispanic or Latino of any race were 28.2% of the population.
There were 5,541 households, out of which 28.2% had children under the age of 18 living with them, 46.2% were married couples living together, 12.7% had a female householder with no husband present, and 36.2% were non-families. 28.7% of all households were made up of individuals, and 11.2% had someone living alone who was 65 years of age or older. The average household size was 2.36 and the average family size was 2.88.
In the city, the population was spread out, with 22.7% under the age of 18, 8.2% from 18 to 24, 27.2% from 25 to 44, 25.3% from 45 to 64, and 16.6% who were 65 years of age or older. The median age was 39 years. For every 100 females, there were 93.2 males. For every 100 females age 18 and over, there were 90.2 males.
The median income for a household in the city was $45,837, and the median income for a family was $51,919. Males had a median income of $37,813 versus $30,917 for females. The per capita income for the city was $22,945. About 8.2% of families and 11.2% of the population were below the poverty line, including 15.2% of those under age 18 and 6.2% of those age 65 or over.
Common Questions
What is Per Capita Income in Grover Beach?
Per Capita income in Grover Beach is $40,184.
What is the Median Family Income in Grover Beach?
Median Family Income in Grover Beach is $92,559.
What is the Median Household income in Grover Beach?
Median Household Income in Grover Beach is $80,438.
What is Income or Wage Gap in Grover Beach?
Income or Wage Gap in Grover Beach is 4.0%.
Women in Grover Beach earn 96.0 cents for every dollar earned by a man.
What is Inequality or Gini Index in Grover Beach?
Inequality or Gini Index in Grover Beach is 0.43.
What is the Total Population of Grover Beach?
Total Population of Grover Beach is 12,757.
What is the Total Male Population of Grover Beach?
Total Male Population of Grover Beach is 6,559.
What is the Total Female Population of Grover Beach?
Total Female Population of Grover Beach is 6,198.
What is the Ratio of Males per 100 Females in Grover Beach?
There are 105.82 Males per 100 Females in Grover Beach.
What is the Ratio of Females per 100 Males in Grover Beach?
There are 94.50 Females per 100 Males in Grover Beach.
What is the Median Population Age in Grover Beach?
Median Population Age in Grover Beach is 40.3 Years.
What is the Average Family Size in Grover Beach
Average Family Size in Grover Beach is 3.0 People.
What is the Average Household Size in Grover Beach
Average Household Size in Grover Beach is 2.5 People.
How Large is the Labor Force in Grover Beach?
There are 6,706 People in the Labor Forcein in Grover Beach.
What is the Percentage of People in the Labor Force in Grover Beach?
65.2% of People are in the Labor Force in Grover Beach.
What is the Unemployment Rate in Grover Beach?
Unemployment Rate in Grover Beach is 3.1%.