Union Beach borough, NJ Map & Demographics
Union Beach borough Overview
$52,199
PER CAPITA INCOME
$143,077
AVG FAMILY INCOME
$124,828
AVG HOUSEHOLD INCOME
26.3%
WAGE / INCOME GAP [ % ]
73.7¢/ $1
WAGE / INCOME GAP [ $ ]
0.34
INEQUALITY / GINI INDEX
5,751
TOTAL POPULATION
3,043
MALE POPULATION
2,708
FEMALE POPULATION
112.37
MALES / 100 FEMALES
88.99
FEMALES / 100 MALES
43.8
MEDIAN AGE
3.3
AVG FAMILY SIZE
2.9
AVG HOUSEHOLD SIZE
3,718
LABOR FORCE [ PEOPLE ]
76.2%
PERCENT IN LABOR FORCE
3.6%
UNEMPLOYMENT RATE
Income in Union Beach borough
Income Overview in Union Beach borough
Per Capita Income in Union Beach borough is $52,199, while median incomes of families and households are $143,077 and $124,828 respectively.
| Characteristic | Number | Measure |
| Per Capita Income | 5,751 | $52,199 |
| Median Family Income | 1,542 | $143,077 |
| Mean Family Income | 1,542 | $165,320 |
| Median Household Income | 1,987 | $124,828 |
| Mean Household Income | 1,987 | $148,210 |
| Income Deficit | 1,542 | $0 |
| Wage / Income Gap (%) | 5,751 | 26.35% |
| Wage / Income Gap ($) | 5,751 | 73.65¢ per $1 |
| Gini / Inequality Index | 5,751 | 0.34 |
Earnings by Sex in Union Beach borough
Average Earnings in Union Beach borough are $65,625, $69,670 for men and $51,314 for women, a difference of 26.4%.
| Sex | Number | Average Earnings |
| Male | 2,248 (57.8%) | $69,670 |
| Female | 1,643 (42.2%) | $51,314 |
| Total | 3,891 (100.0%) | $65,625 |
Earnings by Sex by Income Bracket in Union Beach borough
The most common earnings brackets in Union Beach borough are $65,000 to $74,999 for men (456 | 20.3%) and $65,000 to $74,999 for women (284 | 17.3%).
| Income | Male | Female |
| $2,499 or less | 65 (2.9%) | 110 (6.7%) |
| $2,500 to $4,999 | 0 (0.0%) | 24 (1.5%) |
| $5,000 to $7,499 | 71 (3.2%) | 0 (0.0%) |
| $7,500 to $9,999 | 0 (0.0%) | 21 (1.3%) |
| $10,000 to $12,499 | 59 (2.6%) | 60 (3.6%) |
| $12,500 to $14,999 | 17 (0.8%) | 13 (0.8%) |
| $15,000 to $17,499 | 98 (4.4%) | 15 (0.9%) |
| $17,500 to $19,999 | 51 (2.3%) | 94 (5.7%) |
| $20,000 to $22,499 | 13 (0.6%) | 47 (2.9%) |
| $22,500 to $24,999 | 0 (0.0%) | 41 (2.5%) |
| $25,000 to $29,999 | 14 (0.6%) | 44 (2.7%) |
| $30,000 to $34,999 | 0 (0.0%) | 131 (8.0%) |
| $35,000 to $39,999 | 28 (1.3%) | 123 (7.5%) |
| $40,000 to $44,999 | 171 (7.6%) | 62 (3.8%) |
| $45,000 to $49,999 | 47 (2.1%) | 16 (1.0%) |
| $50,000 to $54,999 | 101 (4.5%) | 39 (2.4%) |
| $55,000 to $64,999 | 182 (8.1%) | 168 (10.2%) |
| $65,000 to $74,999 | 456 (20.3%) | 284 (17.3%) |
| $75,000 to $99,999 | 426 (19.0%) | 238 (14.5%) |
| $100,000+ | 449 (20.0%) | 113 (6.9%) |
| Total | 2,248 (100.0%) | 1,643 (100.0%) |
Earnings by Sex by Educational Attainment in Union Beach borough
Average earnings in Union Beach borough are $70,949 for men and $58,060 for women, a difference of 18.2%. Men with an educational attainment of less than high school enjoy the highest average annual earnings of $90,417, while those with graduate degree education earn the least with $68,943. Women with an educational attainment of graduate degree earn the most with the average annual earnings of $81,563, while those with high school diploma education have the smallest earnings of $37,872.
| Educational Attainment | Male Income | Female Income |
| Less than High School | $90,417 | $0 |
| High School Diploma | $77,750 | $37,872 |
| College or Associate's Degree | $89,816 | $57,980 |
| Bachelor's Degree | $71,005 | $68,652 |
| Graduate Degree | $68,943 | $81,563 |
| Total | $70,949 | $58,060 |
Family Income in Union Beach borough
Family Income Brackets in Union Beach borough
According to the Union Beach borough family income data, there are 558 families falling into the $200,000+ income range, which is the most common income bracket and makes up 36.2% of all families.
| Income Bracket | # Families | % Families |
| Less than $10,000 | 0 | 0.0% |
| $10,000 to $14,999 | 0 | 0.0% |
| $15,000 to $24,999 | 0 | 0.0% |
| $25,000 to $34,999 | 12 | 0.8% |
| $35,000 to $49,999 | 45 | 2.9% |
| $50,000 to $74,999 | 123 | 8.0% |
| $75,000 to $99,999 | 221 | 14.3% |
| $100,000 to $149,999 | 427 | 27.7% |
| $150,000 to $199,999 | 156 | 10.1% |
| $200,000+ | 558 | 36.2% |
Family Income by Famaliy Size in Union Beach borough
5-person families (44 | 2.9%) account for the highest median family income in Union Beach borough with $193,676 per family, while 2-person families (501 | 32.5%) have the highest median income of $59,114 per family member.
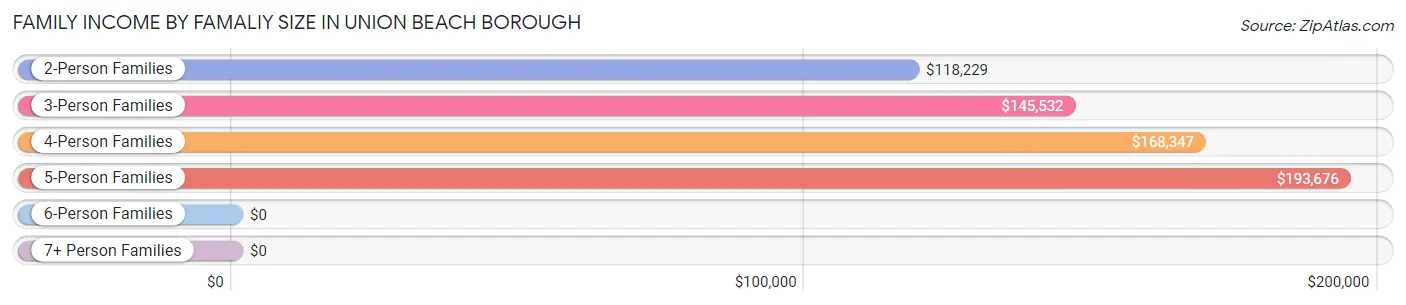
| Income Bracket | # Families | Median Income |
| 2-Person Families | 501 (32.5%) | $118,229 |
| 3-Person Families | 458 (29.7%) | $145,532 |
| 4-Person Families | 488 (31.7%) | $168,347 |
| 5-Person Families | 44 (2.9%) | $193,676 |
| 6-Person Families | 0 (0.0%) | $0 |
| 7+ Person Families | 51 (3.3%) | $0 |
| Total | 1,542 (100.0%) | $143,077 |
Family Income by Number of Earners in Union Beach borough
The median family income in Union Beach borough is $143,077, with families comprising 3+ earners (466) having the highest median family income of $210,760, while families with no earners (36) have the lowest median family income of $45,700, accounting for 30.2% and 2.3% of families, respectively.
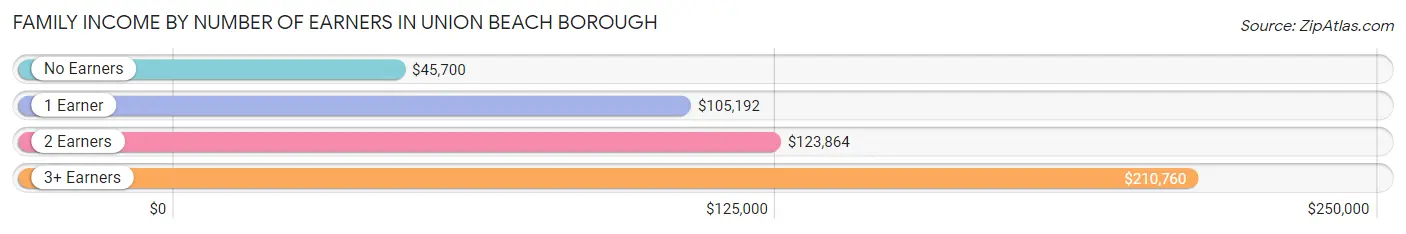
| Number of Earners | # Families | Median Income |
| No Earners | 36 (2.3%) | $45,700 |
| 1 Earner | 268 (17.4%) | $105,192 |
| 2 Earners | 772 (50.1%) | $123,864 |
| 3+ Earners | 466 (30.2%) | $210,760 |
| Total | 1,542 (100.0%) | $143,077 |
Household Income in Union Beach borough
Household Income Brackets in Union Beach borough
With 592 households falling in the category, the $200,000+ income range is the most frequent in Union Beach borough, accounting for 29.8% of all households.
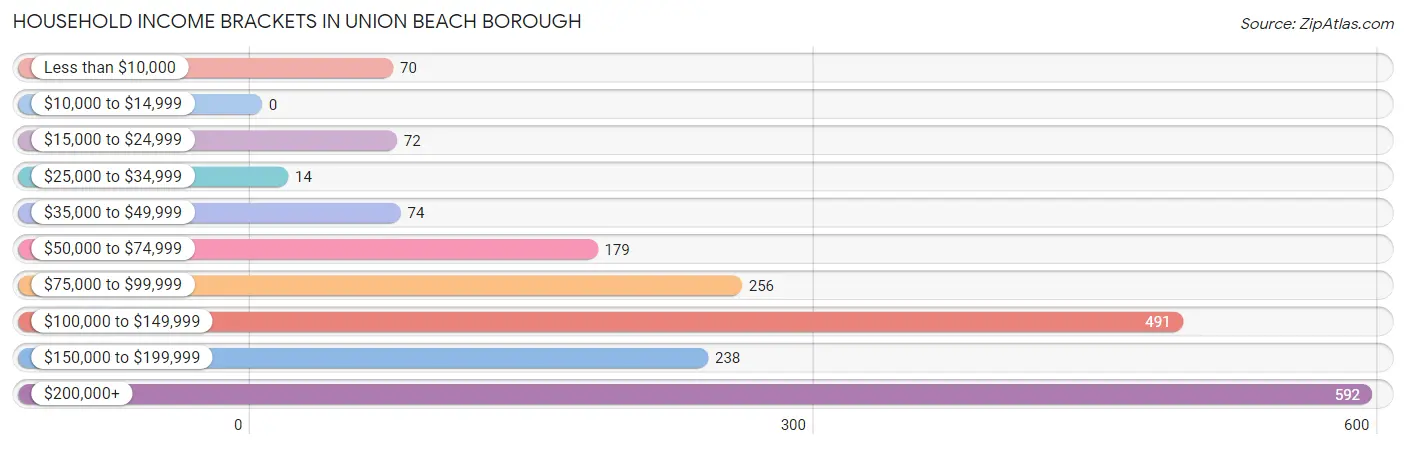
| Income Bracket | # Households | % Households |
| Less than $10,000 | 70 | 3.5% |
| $10,000 to $14,999 | 0 | 0.0% |
| $15,000 to $24,999 | 72 | 3.6% |
| $25,000 to $34,999 | 14 | 0.7% |
| $35,000 to $49,999 | 74 | 3.7% |
| $50,000 to $74,999 | 179 | 9.0% |
| $75,000 to $99,999 | 256 | 12.9% |
| $100,000 to $149,999 | 491 | 24.7% |
| $150,000 to $199,999 | 238 | 12.0% |
| $200,000+ | 592 | 29.8% |
Household Income by Householder Age in Union Beach borough
The median household income in Union Beach borough is $124,828, with the highest median household income of $158,487 found in the 25 to 44 years age bracket for the primary householder. A total of 373 households (18.8%) fall into this category.
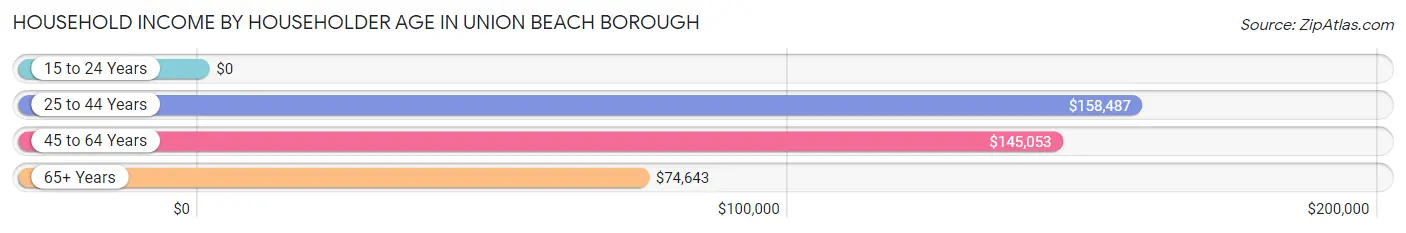
| Income Bracket | # Households | Median Income |
| 15 to 24 Years | 0 (0.0%) | $0 |
| 25 to 44 Years | 373 (18.8%) | $158,487 |
| 45 to 64 Years | 1,210 (60.9%) | $145,053 |
| 65+ Years | 404 (20.3%) | $74,643 |
| Total | 1,987 (100.0%) | $124,828 |
Poverty in Union Beach borough
Income Below Poverty by Sex and Age in Union Beach borough
With 1.3% poverty level for males and 3.0% for females among the residents of Union Beach borough, 75 year old and over males and 65 to 74 year old females are the most vulnerable to poverty, with 12 males (21.4%) and 44 females (16.9%) in their respective age groups living below the poverty level.
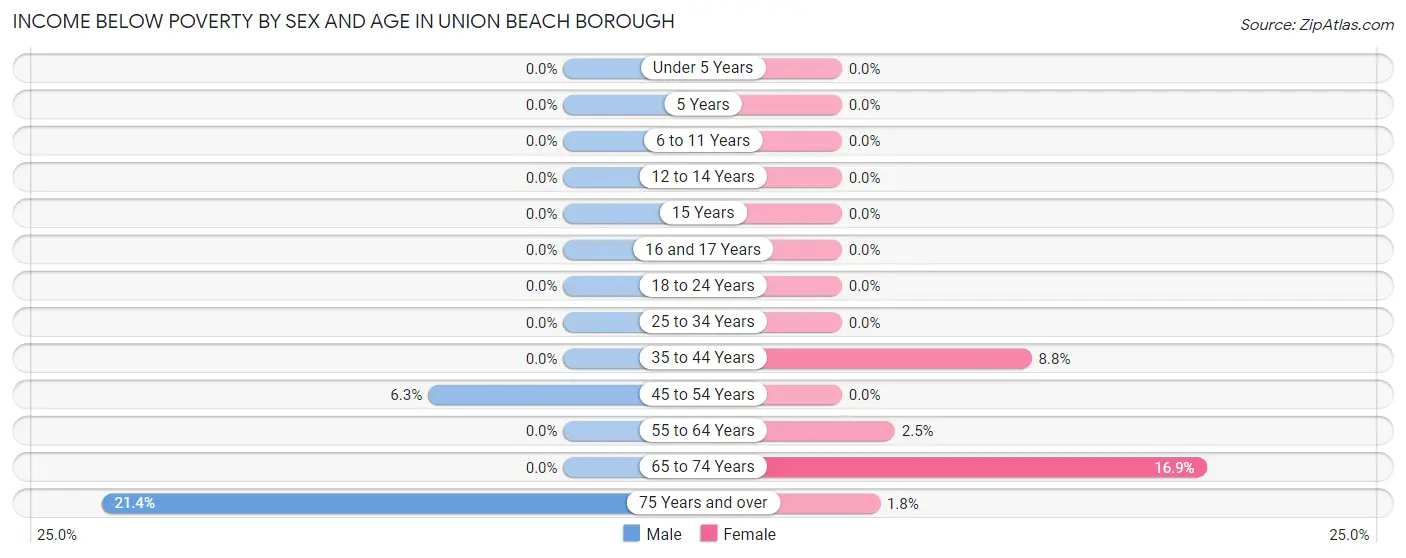
| Age Bracket | Male | Female |
| Under 5 Years | 0 (0.0%) | 0 (0.0%) |
| 5 Years | 0 (0.0%) | 0 (0.0%) |
| 6 to 11 Years | 0 (0.0%) | 0 (0.0%) |
| 12 to 14 Years | 0 (0.0%) | 0 (0.0%) |
| 15 Years | 0 (0.0%) | 0 (0.0%) |
| 16 and 17 Years | 0 (0.0%) | 0 (0.0%) |
| 18 to 24 Years | 0 (0.0%) | 0 (0.0%) |
| 25 to 34 Years | 0 (0.0%) | 0 (0.0%) |
| 35 to 44 Years | 0 (0.0%) | 20 (8.8%) |
| 45 to 54 Years | 26 (6.3%) | 0 (0.0%) |
| 55 to 64 Years | 0 (0.0%) | 15 (2.5%) |
| 65 to 74 Years | 0 (0.0%) | 44 (16.9%) |
| 75 Years and over | 12 (21.4%) | 2 (1.8%) |
| Total | 38 (1.3%) | 81 (3.0%) |
Income Above Poverty by Sex and Age in Union Beach borough
According to the poverty statistics in Union Beach borough, males aged under 5 years and females aged under 5 years are the age groups that are most secure financially, with 100.0% of males and 100.0% of females in these age groups living above the poverty line.
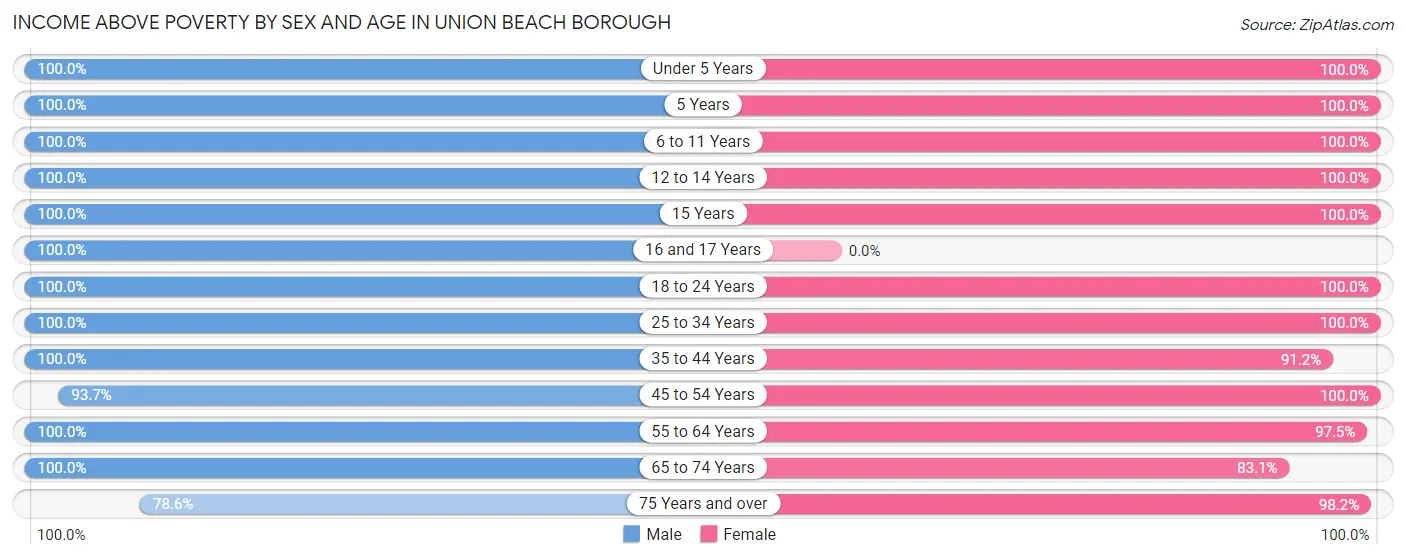
| Age Bracket | Male | Female |
| Under 5 Years | 126 (100.0%) | 170 (100.0%) |
| 5 Years | 44 (100.0%) | 42 (100.0%) |
| 6 to 11 Years | 130 (100.0%) | 141 (100.0%) |
| 12 to 14 Years | 21 (100.0%) | 160 (100.0%) |
| 15 Years | 23 (100.0%) | 15 (100.0%) |
| 16 and 17 Years | 57 (100.0%) | 0 (0.0%) |
| 18 to 24 Years | 346 (100.0%) | 148 (100.0%) |
| 25 to 34 Years | 656 (100.0%) | 312 (100.0%) |
| 35 to 44 Years | 317 (100.0%) | 207 (91.2%) |
| 45 to 54 Years | 388 (93.7%) | 511 (100.0%) |
| 55 to 64 Years | 596 (100.0%) | 594 (97.5%) |
| 65 to 74 Years | 257 (100.0%) | 216 (83.1%) |
| 75 Years and over | 44 (78.6%) | 111 (98.2%) |
| Total | 3,005 (98.8%) | 2,627 (97.0%) |
Income Below Poverty Among Married-Couple Families in Union Beach borough
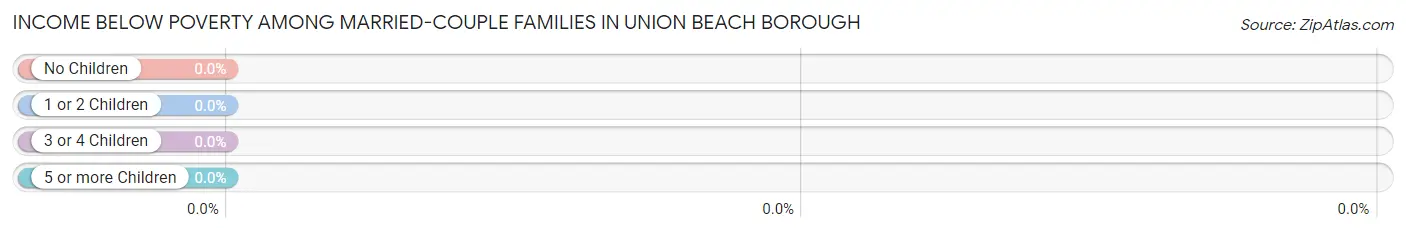
| Children | Above Poverty | Below Poverty |
| No Children | 805 (100.0%) | 0 (0.0%) |
| 1 or 2 Children | 430 (100.0%) | 0 (0.0%) |
| 3 or 4 Children | 51 (100.0%) | 0 (0.0%) |
| 5 or more Children | 0 (0.0%) | 0 (0.0%) |
| Total | 1,286 (100.0%) | 0 (0.0%) |
Income Below Poverty Among Single-Parent Households in Union Beach borough
| Children | Single Father | Single Mother |
| No Children | 0 (0.0%) | 0 (0.0%) |
| 1 or 2 Children | 0 (0.0%) | 0 (0.0%) |
| 3 or 4 Children | 0 (0.0%) | 0 (0.0%) |
| 5 or more Children | 0 (0.0%) | 0 (0.0%) |
| Total | 0 (0.0%) | 0 (0.0%) |
Income Below Poverty Among Married-Couple vs Single-Parent Households in Union Beach borough
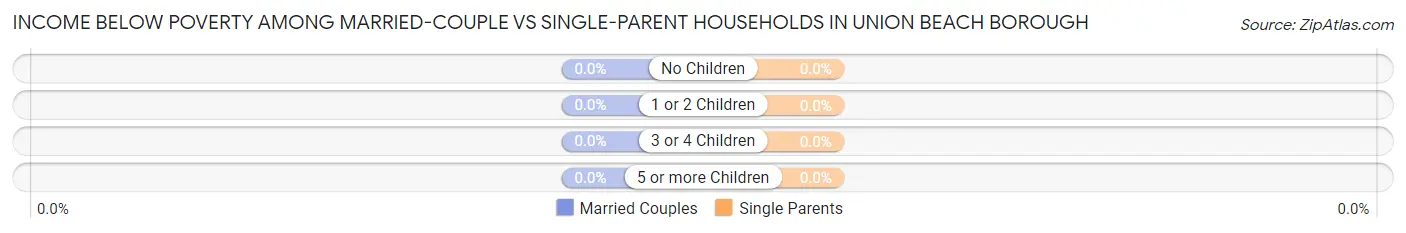
| Children | Married-Couple Families | Single-Parent Households |
| No Children | 0 (0.0%) | 0 (0.0%) |
| 1 or 2 Children | 0 (0.0%) | 0 (0.0%) |
| 3 or 4 Children | 0 (0.0%) | 0 (0.0%) |
| 5 or more Children | 0 (0.0%) | 0 (0.0%) |
| Total | 0 (0.0%) | 0 (0.0%) |
Race in Union Beach borough
The most populous races in Union Beach borough are White / Caucasian (4,831 | 84.0%), Hispanic or Latino (721 | 12.5%), and Two or more Races (365 | 6.4%).
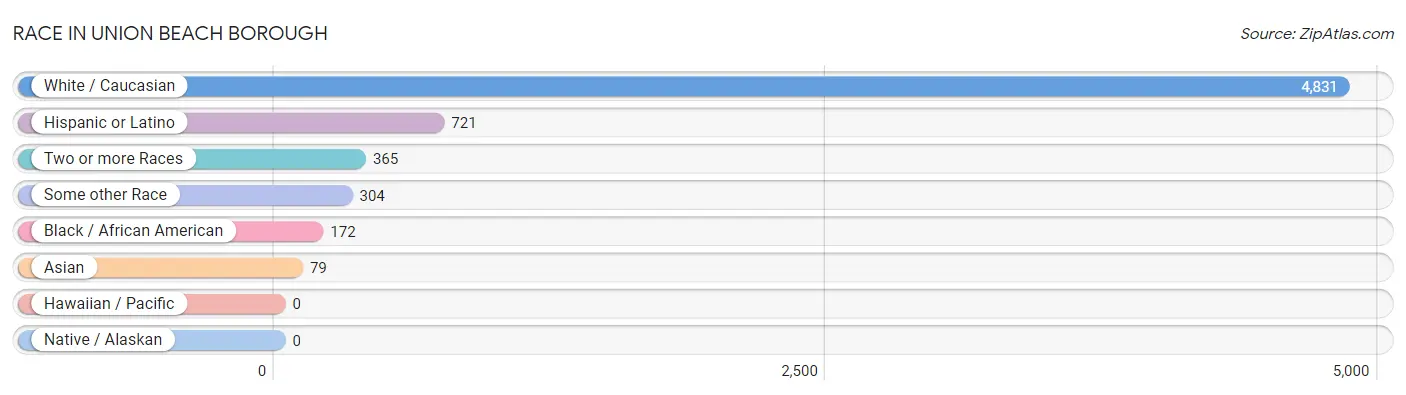
| Race | # Population | % Population |
| Asian | 79 | 1.4% |
| Black / African American | 172 | 3.0% |
| Hawaiian / Pacific | 0 | 0.0% |
| Hispanic or Latino | 721 | 12.5% |
| Native / Alaskan | 0 | 0.0% |
| White / Caucasian | 4,831 | 84.0% |
| Two or more Races | 365 | 6.4% |
| Some other Race | 304 | 5.3% |
| Total | 5,751 | 100.0% |
Ancestry in Union Beach borough
The most populous ancestries reported in Union Beach borough are Italian (1,584 | 27.5%), Irish (1,446 | 25.1%), German (971 | 16.9%), Polish (641 | 11.2%), and Arab (576 | 10.0%), together accounting for 90.7% of all Union Beach borough residents.
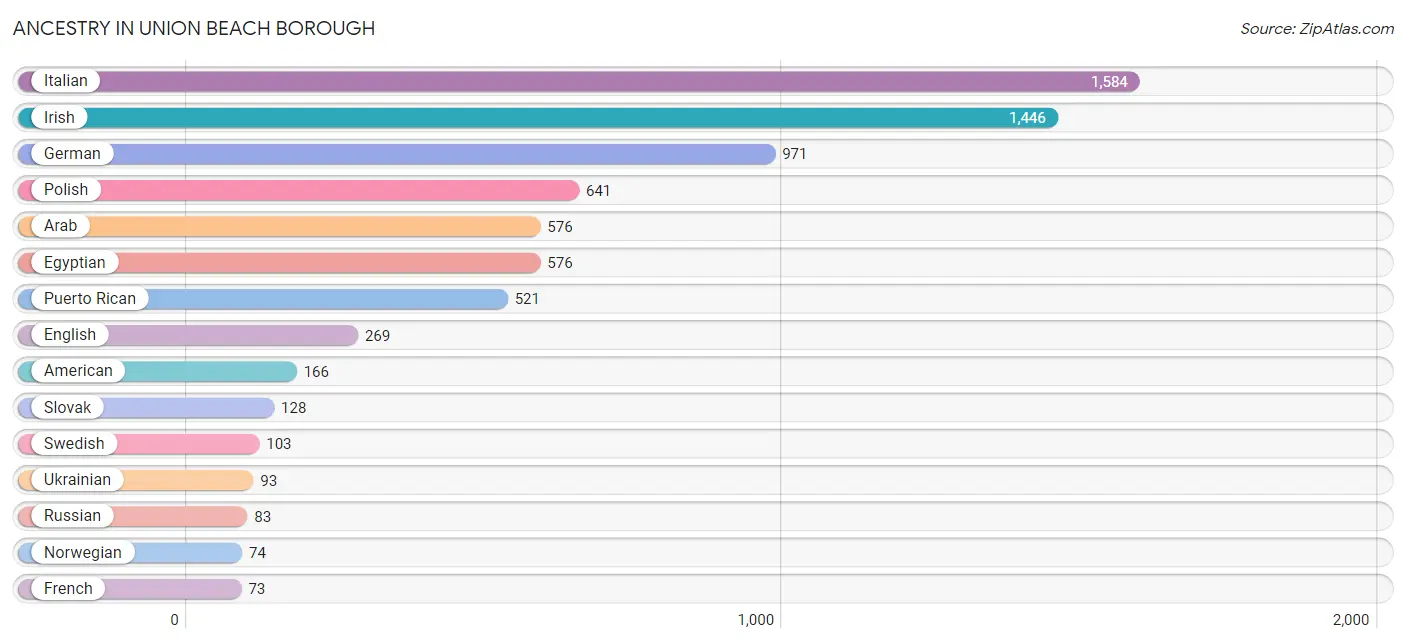
| Ancestry | # Population | % Population |
| American | 166 | 2.9% |
| Arab | 576 | 10.0% |
| British | 31 | 0.5% |
| Burmese | 45 | 0.8% |
| Canadian | 11 | 0.2% |
| Central American | 16 | 0.3% |
| Colombian | 48 | 0.8% |
| Cuban | 15 | 0.3% |
| Czech | 15 | 0.3% |
| Czechoslovakian | 33 | 0.6% |
| Danish | 21 | 0.4% |
| Dominican | 53 | 0.9% |
| Eastern European | 13 | 0.2% |
| Egyptian | 576 | 10.0% |
| English | 269 | 4.7% |
| European | 48 | 0.8% |
| French | 73 | 1.3% |
| German | 971 | 16.9% |
| Irish | 1,446 | 25.1% |
| Israeli | 13 | 0.2% |
| Italian | 1,584 | 27.5% |
| Norwegian | 74 | 1.3% |
| Peruvian | 11 | 0.2% |
| Polish | 641 | 11.2% |
| Puerto Rican | 521 | 9.1% |
| Russian | 83 | 1.4% |
| Salvadoran | 16 | 0.3% |
| Scandinavian | 25 | 0.4% |
| Scottish | 46 | 0.8% |
| Slovak | 128 | 2.2% |
| South American | 59 | 1.0% |
| Spaniard | 57 | 1.0% |
| Swedish | 103 | 1.8% |
| Thai | 34 | 0.6% |
| Trinidadian and Tobagonian | 23 | 0.4% |
| Turkish | 38 | 0.7% |
| Ukrainian | 93 | 1.6% |
| West Indian | 42 | 0.7% | View All 38 Rows |
Immigrants in Union Beach borough
The most numerous immigrant groups reported in Union Beach borough came from Africa (576 | 10.0%), Egypt (576 | 10.0%), Northern Africa (576 | 10.0%), Europe (213 | 3.7%), and Latin America (183 | 3.2%), together accounting for 36.9% of all Union Beach borough residents.
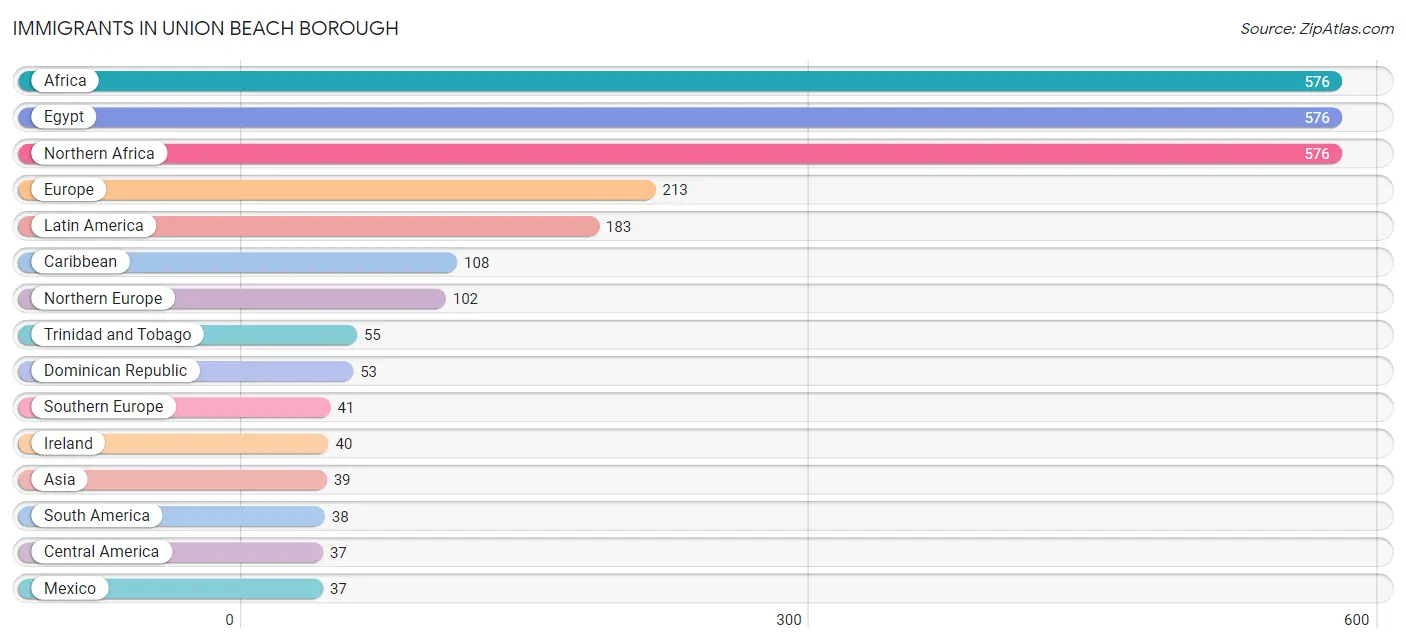
| Immigration Origin | # Population | % Population |
| Africa | 576 | 10.0% |
| Asia | 39 | 0.7% |
| Azores | 12 | 0.2% |
| Caribbean | 108 | 1.9% |
| Central America | 37 | 0.6% |
| Colombia | 27 | 0.5% |
| Dominican Republic | 53 | 0.9% |
| Eastern Europe | 34 | 0.6% |
| Egypt | 576 | 10.0% |
| England | 25 | 0.4% |
| Europe | 213 | 3.7% |
| France | 36 | 0.6% |
| India | 11 | 0.2% |
| Ireland | 40 | 0.7% |
| Italy | 29 | 0.5% |
| Latin America | 183 | 3.2% |
| Mexico | 37 | 0.6% |
| Northern Africa | 576 | 10.0% |
| Northern Europe | 102 | 1.8% |
| Peru | 11 | 0.2% |
| Poland | 34 | 0.6% |
| Portugal | 12 | 0.2% |
| Scotland | 37 | 0.6% |
| South America | 38 | 0.7% |
| South Central Asia | 11 | 0.2% |
| Southern Europe | 41 | 0.7% |
| Trinidad and Tobago | 55 | 1.0% |
| Turkey | 28 | 0.5% |
| Western Asia | 28 | 0.5% |
| Western Europe | 36 | 0.6% | View All 30 Rows |
Sex and Age in Union Beach borough
Sex and Age in Union Beach borough
The most populous age groups in Union Beach borough are 25 to 29 Years (469 | 15.4%) for men and 55 to 59 Years (348 | 12.9%) for women.
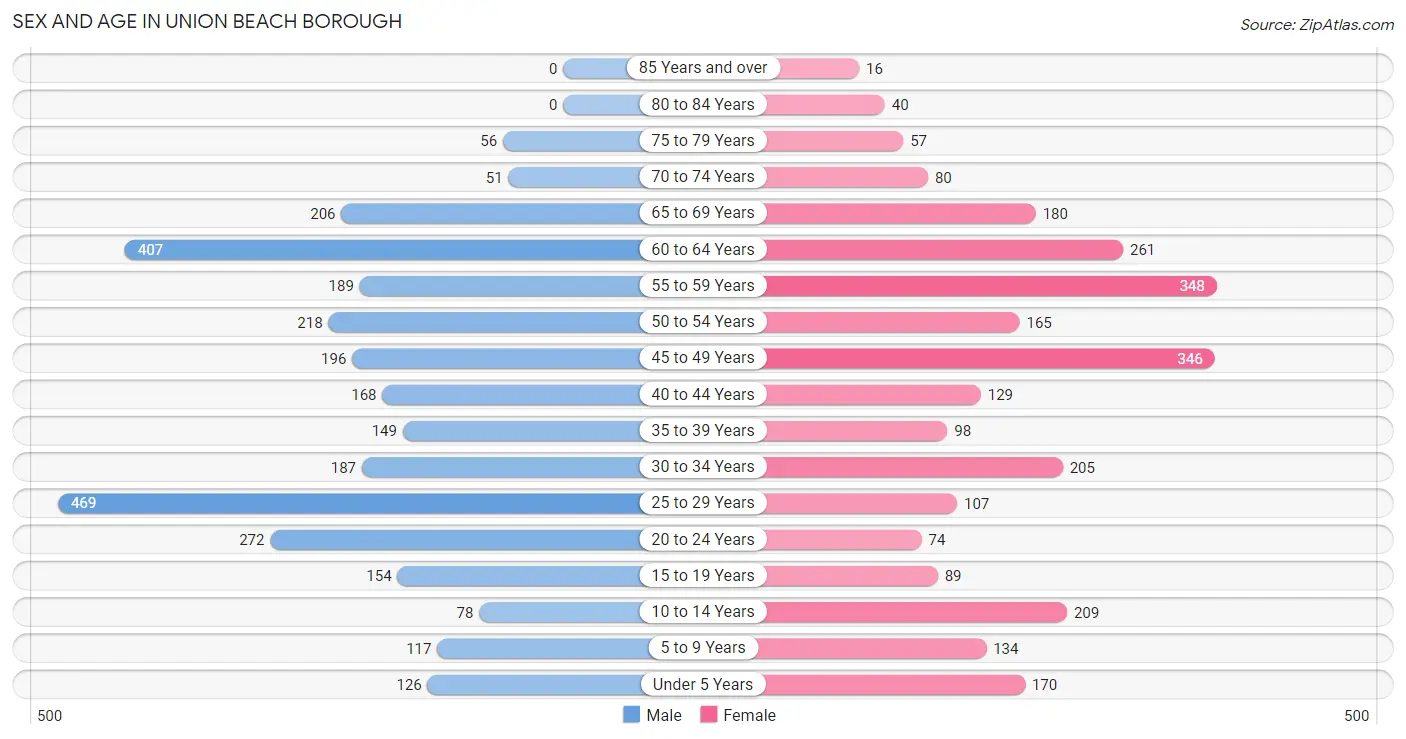
| Age Bracket | Male | Female |
| Under 5 Years | 126 (4.1%) | 170 (6.3%) |
| 5 to 9 Years | 117 (3.8%) | 134 (5.0%) |
| 10 to 14 Years | 78 (2.6%) | 209 (7.7%) |
| 15 to 19 Years | 154 (5.1%) | 89 (3.3%) |
| 20 to 24 Years | 272 (8.9%) | 74 (2.7%) |
| 25 to 29 Years | 469 (15.4%) | 107 (4.0%) |
| 30 to 34 Years | 187 (6.1%) | 205 (7.6%) |
| 35 to 39 Years | 149 (4.9%) | 98 (3.6%) |
| 40 to 44 Years | 168 (5.5%) | 129 (4.8%) |
| 45 to 49 Years | 196 (6.4%) | 346 (12.8%) |
| 50 to 54 Years | 218 (7.2%) | 165 (6.1%) |
| 55 to 59 Years | 189 (6.2%) | 348 (12.9%) |
| 60 to 64 Years | 407 (13.4%) | 261 (9.6%) |
| 65 to 69 Years | 206 (6.8%) | 180 (6.7%) |
| 70 to 74 Years | 51 (1.7%) | 80 (2.9%) |
| 75 to 79 Years | 56 (1.8%) | 57 (2.1%) |
| 80 to 84 Years | 0 (0.0%) | 40 (1.5%) |
| 85 Years and over | 0 (0.0%) | 16 (0.6%) |
| Total | 3,043 (100.0%) | 2,708 (100.0%) |
Families and Households in Union Beach borough
Median Family Size in Union Beach borough
The median family size in Union Beach borough is 3.27 persons per family, with married-couple families (1,286 | 83.4%) accounting for the largest median family size of 3.38 persons per family. On the other hand, single male/father families (59 | 3.8%) represent the smallest median family size with 2.42 persons per family.
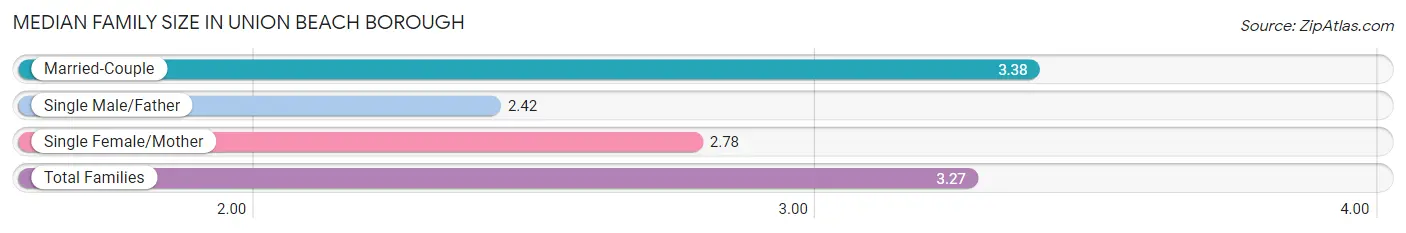
| Family Type | # Families | Family Size |
| Married-Couple | 1,286 (83.4%) | 3.38 |
| Single Male/Father | 59 (3.8%) | 2.42 |
| Single Female/Mother | 197 (12.8%) | 2.78 |
| Total Families | 1,542 (100.0%) | 3.27 |
Median Household Size in Union Beach borough
The median household size in Union Beach borough is 2.89 persons per household, with married-couple households (1,286 | 64.7%) accounting for the largest median household size of 3.4 persons per household. non-family households (445 | 22.4%) represent the smallest median household size with 1.31 persons per household.
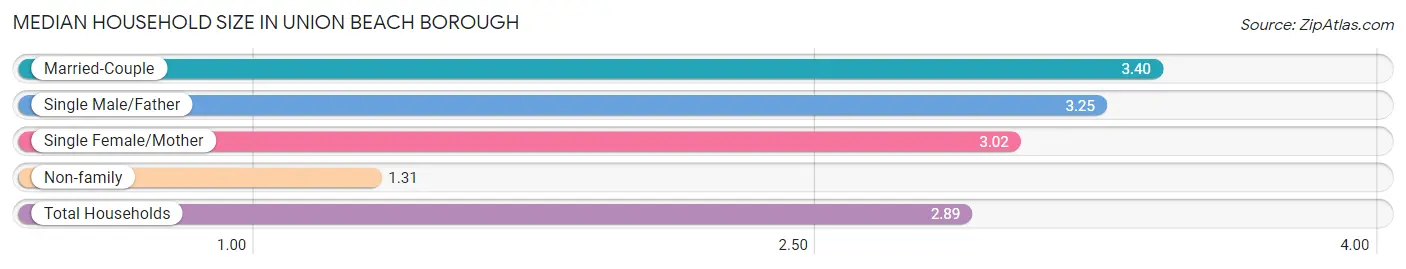
| Household Type | # Households | Household Size |
| Married-Couple | 1,286 (64.7%) | 3.40 |
| Single Male/Father | 59 (3.0%) | 3.25 |
| Single Female/Mother | 197 (9.9%) | 3.02 |
| Non-family | 445 (22.4%) | 1.31 |
| Total Households | 1,987 (100.0%) | 2.89 |
Household Size by Marriage Status in Union Beach borough
Out of a total of 1,987 households in Union Beach borough, 1,542 (77.6%) are family households, while 445 (22.4%) are nonfamily households. The most numerous type of family households are 4-person households, comprising 554, and the most common type of nonfamily households are 1-person households, comprising 310.
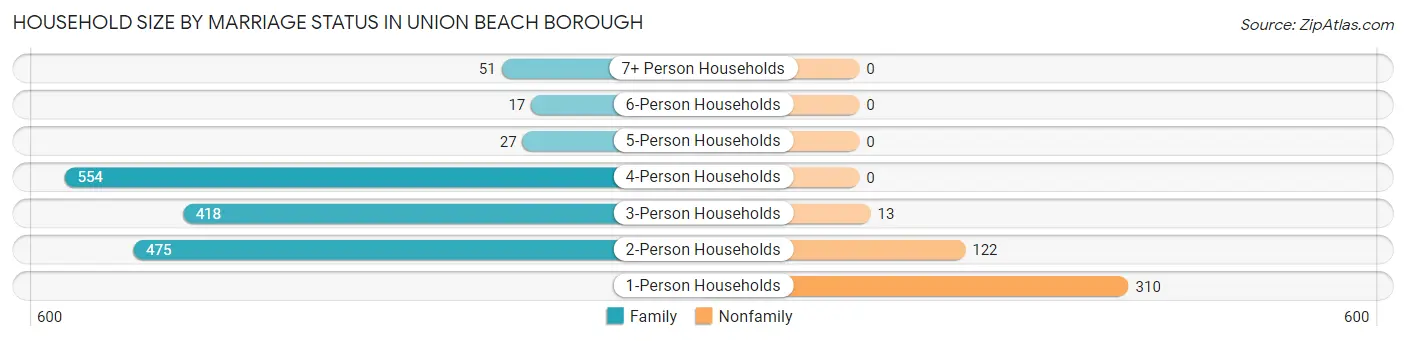
| Household Size | Family Households | Nonfamily Households |
| 1-Person Households | - | 310 (15.6%) |
| 2-Person Households | 475 (23.9%) | 122 (6.1%) |
| 3-Person Households | 418 (21.0%) | 13 (0.6%) |
| 4-Person Households | 554 (27.9%) | 0 (0.0%) |
| 5-Person Households | 27 (1.4%) | 0 (0.0%) |
| 6-Person Households | 17 (0.9%) | 0 (0.0%) |
| 7+ Person Households | 51 (2.6%) | 0 (0.0%) |
| Total | 1,542 (77.6%) | 445 (22.4%) |
Female Fertility in Union Beach borough
Fertility by Age in Union Beach borough
Average fertility rate in Union Beach borough is 45.0 births per 1,000 women. Women in the age bracket of 20 to 34 years have the highest fertility rate with 127.0 births per 1,000 women. Women in the age bracket of 20 to 34 years acount for 100.0% of all women with births.
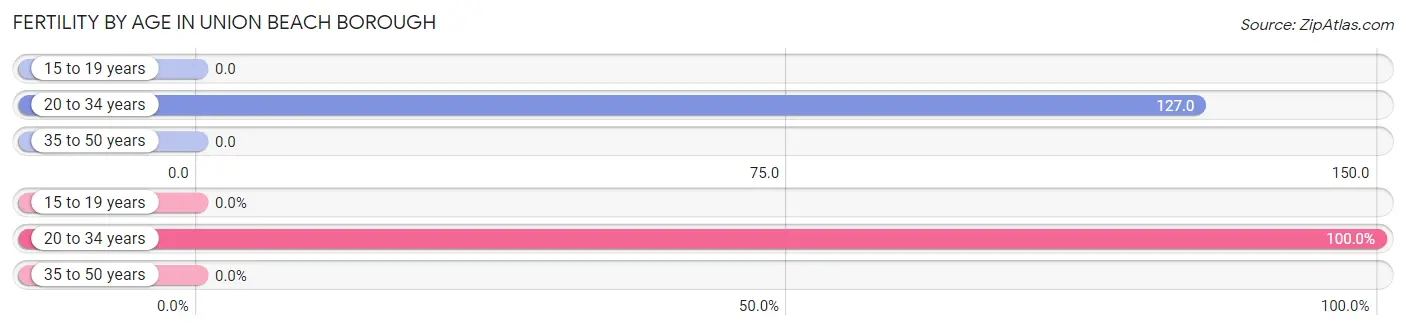
| Age Bracket | Women with Births | Births / 1,000 Women |
| 15 to 19 years | 0 (0.0%) | 0.0 |
| 20 to 34 years | 49 (100.0%) | 127.0 |
| 35 to 50 years | 0 (0.0%) | 0.0 |
| Total | 49 (100.0%) | 45.0 |
Fertility by Age by Marriage Status in Union Beach borough
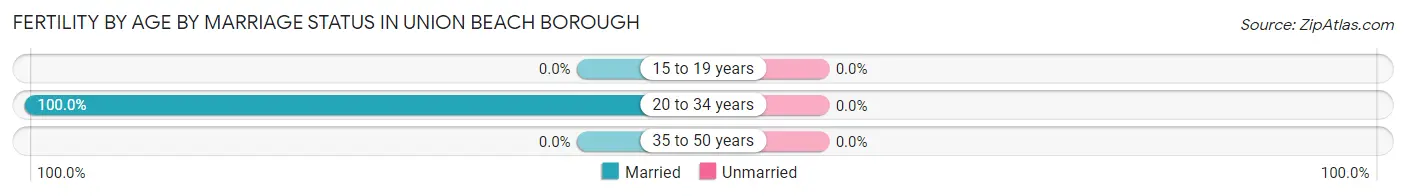
| Age Bracket | Married | Unmarried |
| 15 to 19 years | 0 (0.0%) | 0 (0.0%) |
| 20 to 34 years | 49 (100.0%) | 0 (0.0%) |
| 35 to 50 years | 0 (0.0%) | 0 (0.0%) |
| Total | 49 (100.0%) | 0 (0.0%) |
Fertility by Education in Union Beach borough
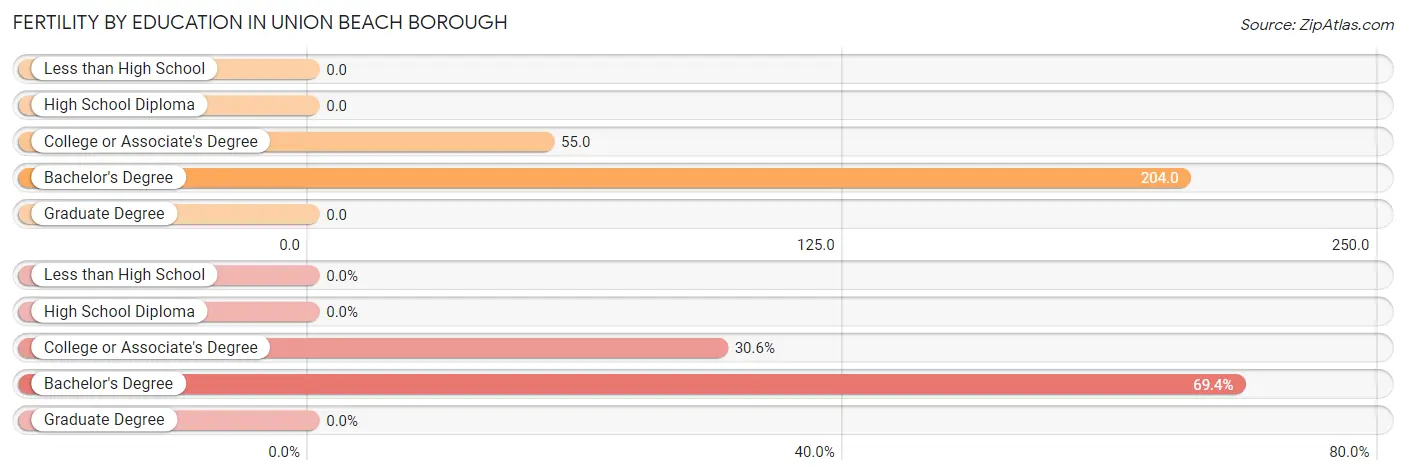
| Educational Attainment | Women with Births | Births / 1,000 Women |
| Less than High School | 0 (0.0%) | 0.0 |
| High School Diploma | 0 (0.0%) | 0.0 |
| College or Associate's Degree | 15 (30.6%) | 55.0 |
| Bachelor's Degree | 34 (69.4%) | 204.0 |
| Graduate Degree | 0 (0.0%) | 0.0 |
| Total | 49 (100.0%) | 45.0 |
Fertility by Education by Marriage Status in Union Beach borough
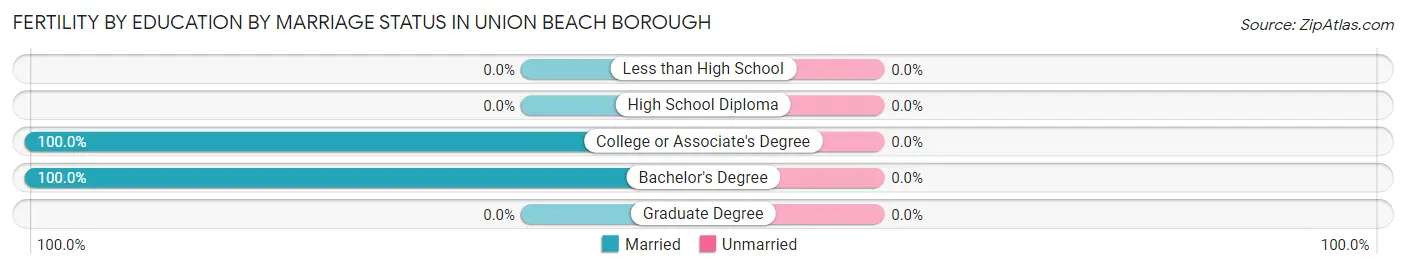
| Educational Attainment | Married | Unmarried |
| Less than High School | 0 (0.0%) | 0 (0.0%) |
| High School Diploma | 0 (0.0%) | 0 (0.0%) |
| College or Associate's Degree | 15 (100.0%) | 0 (0.0%) |
| Bachelor's Degree | 34 (100.0%) | 0 (0.0%) |
| Graduate Degree | 0 (0.0%) | 0 (0.0%) |
| Total | 49 (100.0%) | 0 (0.0%) |
Employment Characteristics in Union Beach borough
Employment by Class of Employer in Union Beach borough
Among the 3,541 employed individuals in Union Beach borough, private company employees (2,727 | 77.0%), local government employees (267 | 7.5%), and state government employees (158 | 4.5%) make up the most common classes of employment.
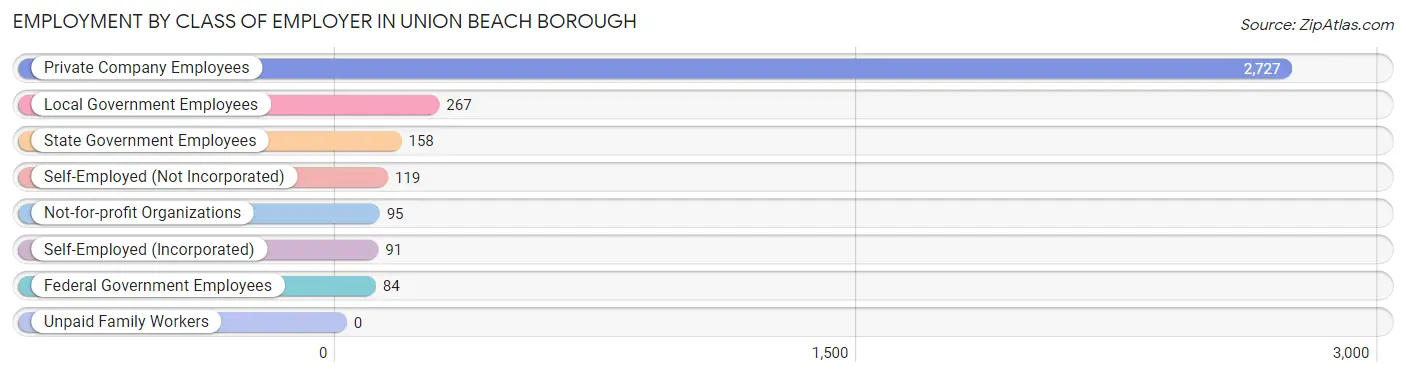
| Employer Class | # Employees | % Employees |
| Private Company Employees | 2,727 | 77.0% |
| Self-Employed (Incorporated) | 91 | 2.6% |
| Self-Employed (Not Incorporated) | 119 | 3.4% |
| Not-for-profit Organizations | 95 | 2.7% |
| Local Government Employees | 267 | 7.5% |
| State Government Employees | 158 | 4.5% |
| Federal Government Employees | 84 | 2.4% |
| Unpaid Family Workers | 0 | 0.0% |
| Total | 3,541 | 100.0% |
Employment Status by Age in Union Beach borough
According to the labor force statistics for Union Beach borough, out of the total population over 16 years of age (4,879), 76.2% or 3,718 individuals are in the labor force, with 3.6% or 134 of them unemployed. The age group with the highest labor force participation rate is 25 to 29 years, with 100.0% or 576 individuals in the labor force. Within the labor force, the 65 to 74 years age range has the highest percentage of unemployed individuals, with 14.2% or 34 of them being unemployed.
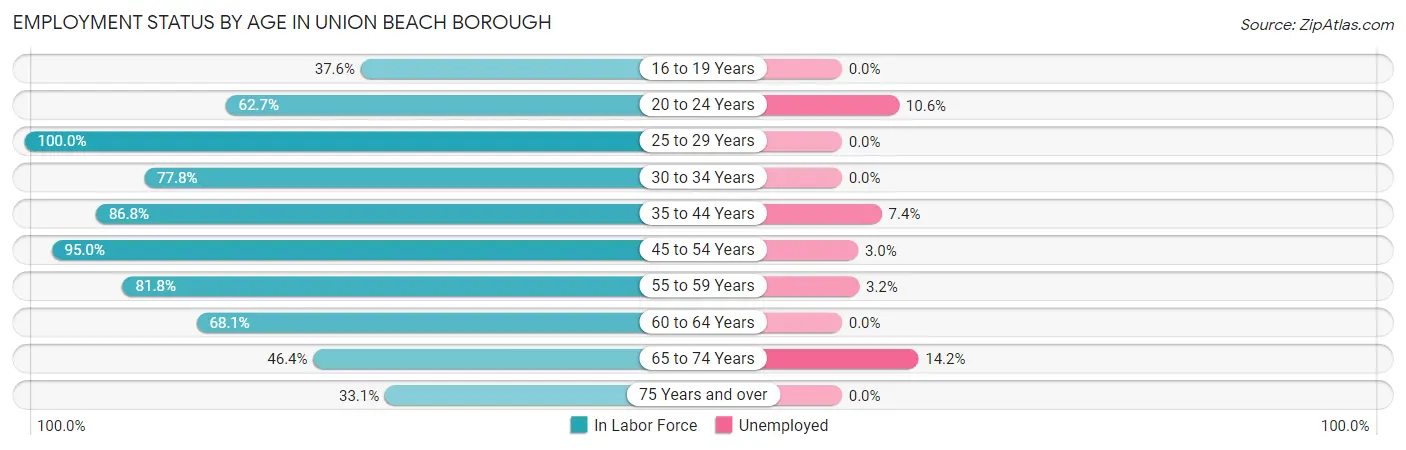
| Age Bracket | In Labor Force | Unemployed |
| 16 to 19 Years | 77 (37.6%) | 0 (0.0%) |
| 20 to 24 Years | 217 (62.7%) | 23 (10.6%) |
| 25 to 29 Years | 576 (100.0%) | 0 (0.0%) |
| 30 to 34 Years | 305 (77.8%) | 0 (0.0%) |
| 35 to 44 Years | 472 (86.8%) | 35 (7.4%) |
| 45 to 54 Years | 879 (95.0%) | 26 (3.0%) |
| 55 to 59 Years | 439 (81.8%) | 14 (3.2%) |
| 60 to 64 Years | 455 (68.1%) | 0 (0.0%) |
| 65 to 74 Years | 240 (46.4%) | 34 (14.2%) |
| 75 Years and over | 56 (33.1%) | 0 (0.0%) |
| Total | 3,718 (76.2%) | 134 (3.6%) |
Employment Status by Educational Attainment in Union Beach borough
According to labor force statistics for Union Beach borough, 85.8% of individuals (3,125) out of the total population between 25 and 64 years of age (3,642) are in the labor force, with 2.4% or 75 of them being unemployed. The group with the highest labor force participation rate are those with the educational attainment of college / associate degree, with 96.4% or 1,020 individuals in the labor force. Within the labor force, individuals with less than high school education have the highest percentage of unemployment, with 31.3% or 40 of them being unemployed.
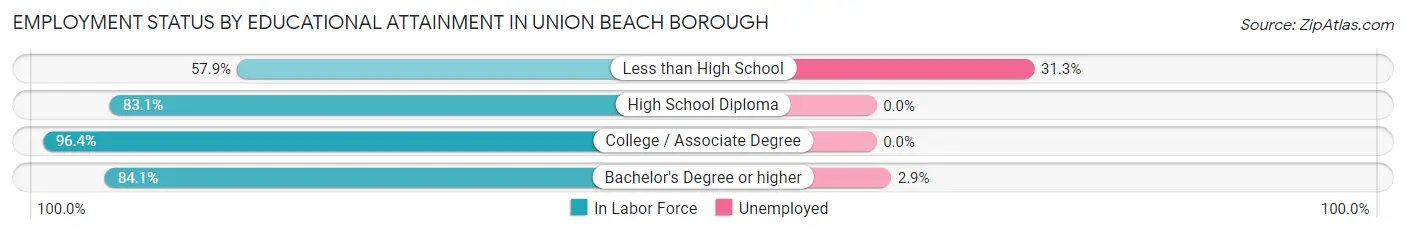
| Educational Attainment | In Labor Force | Unemployed |
| Less than High School | 128 (57.9%) | 69 (31.3%) |
| High School Diploma | 755 (83.1%) | 0 (0.0%) |
| College / Associate Degree | 1,020 (96.4%) | 0 (0.0%) |
| Bachelor's Degree or higher | 1,223 (84.1%) | 42 (2.9%) |
| Total | 3,125 (85.8%) | 87 (2.4%) |
Employment Occupations by Sex in Union Beach borough
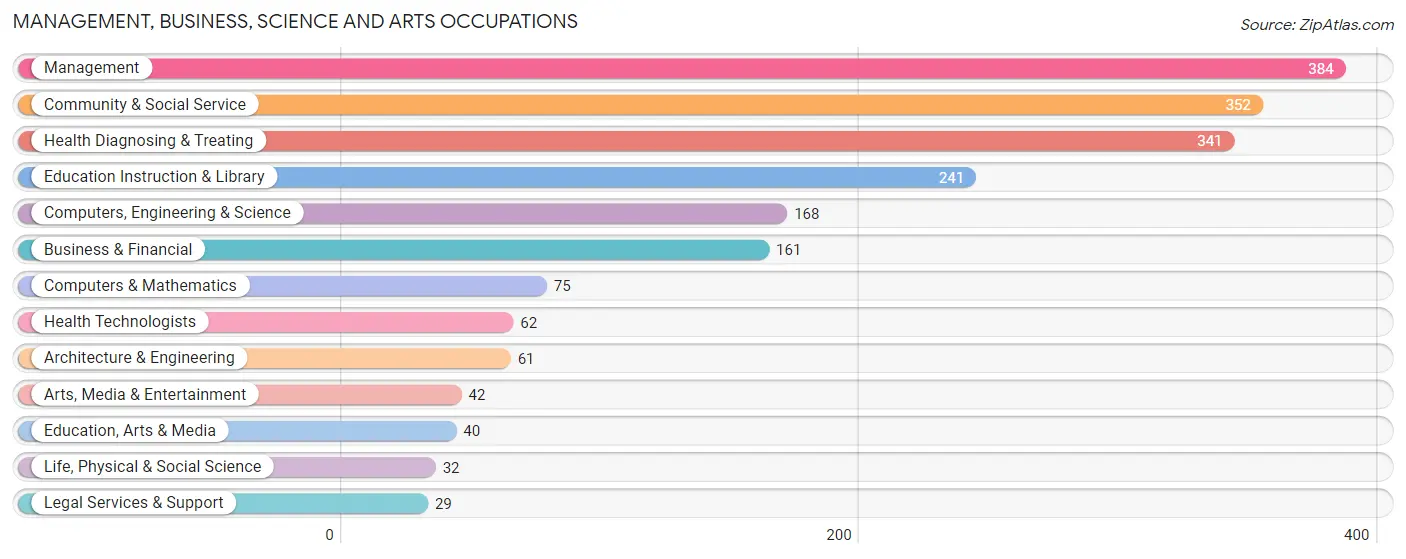
Management, Business, Science and Arts Occupations
The most common Management, Business, Science and Arts occupations in Union Beach borough are Management (384 | 10.7%), Community & Social Service (352 | 9.8%), Health Diagnosing & Treating (341 | 9.5%), Education Instruction & Library (241 | 6.7%), and Computers, Engineering & Science (168 | 4.7%).
Management, Business, Science and Arts Occupations by Sex
Within the Management, Business, Science and Arts occupations in Union Beach borough, the most male-oriented occupations are Architecture & Engineering (100.0%), Computers, Engineering & Science (76.8%), and Computers & Mathematics (74.7%), while the most female-oriented occupations are Arts, Media & Entertainment (100.0%), Health Technologists (100.0%), and Business & Financial (88.2%).
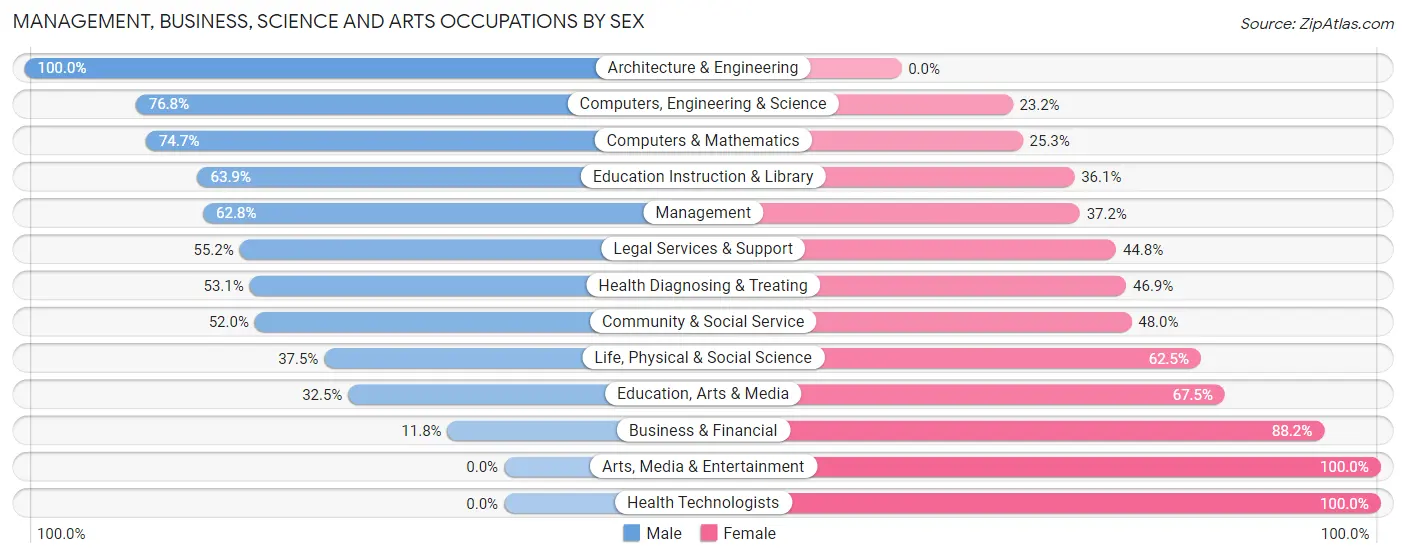
| Occupation | Male | Female |
| Management | 241 (62.8%) | 143 (37.2%) |
| Business & Financial | 19 (11.8%) | 142 (88.2%) |
| Computers, Engineering & Science | 129 (76.8%) | 39 (23.2%) |
| Computers & Mathematics | 56 (74.7%) | 19 (25.3%) |
| Architecture & Engineering | 61 (100.0%) | 0 (0.0%) |
| Life, Physical & Social Science | 12 (37.5%) | 20 (62.5%) |
| Community & Social Service | 183 (52.0%) | 169 (48.0%) |
| Education, Arts & Media | 13 (32.5%) | 27 (67.5%) |
| Legal Services & Support | 16 (55.2%) | 13 (44.8%) |
| Education Instruction & Library | 154 (63.9%) | 87 (36.1%) |
| Arts, Media & Entertainment | 0 (0.0%) | 42 (100.0%) |
| Health Diagnosing & Treating | 181 (53.1%) | 160 (46.9%) |
| Health Technologists | 0 (0.0%) | 62 (100.0%) |
| Total (Category) | 753 (53.6%) | 653 (46.4%) |
| Total (Overall) | 2,109 (58.8%) | 1,475 (41.2%) |
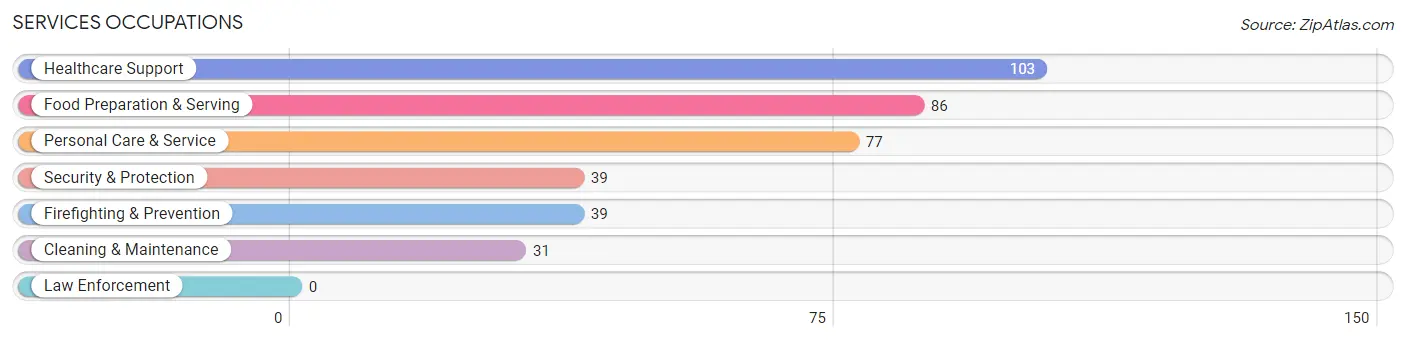
Services Occupations
The most common Services occupations in Union Beach borough are Healthcare Support (103 | 2.9%), Food Preparation & Serving (86 | 2.4%), Personal Care & Service (77 | 2.1%), Security & Protection (39 | 1.1%), and Firefighting & Prevention (39 | 1.1%).
Services Occupations by Sex
Within the Services occupations in Union Beach borough, the most male-oriented occupations are Cleaning & Maintenance (100.0%), Security & Protection (61.5%), and Firefighting & Prevention (61.5%), while the most female-oriented occupations are Healthcare Support (100.0%), Personal Care & Service (57.1%), and Food Preparation & Serving (47.7%).
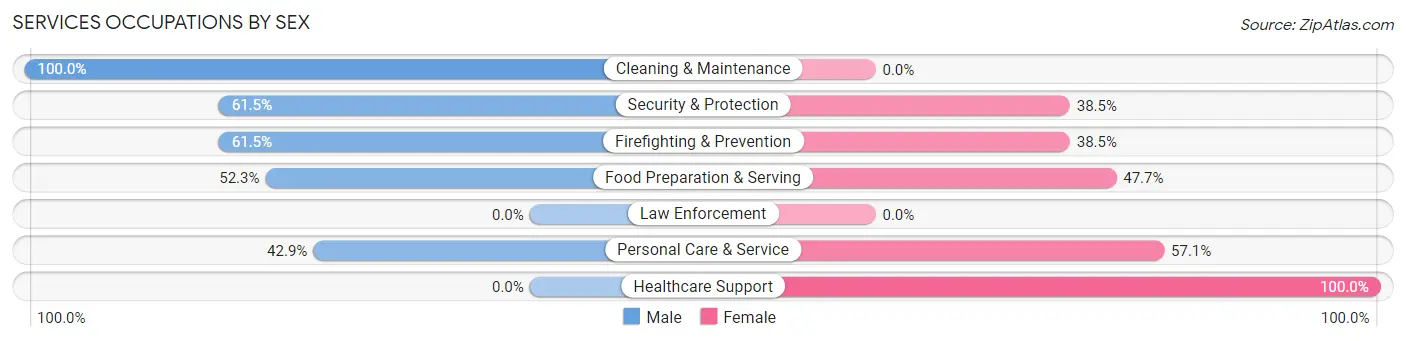
| Occupation | Male | Female |
| Healthcare Support | 0 (0.0%) | 103 (100.0%) |
| Security & Protection | 24 (61.5%) | 15 (38.5%) |
| Firefighting & Prevention | 24 (61.5%) | 15 (38.5%) |
| Law Enforcement | 0 (0.0%) | 0 (0.0%) |
| Food Preparation & Serving | 45 (52.3%) | 41 (47.7%) |
| Cleaning & Maintenance | 31 (100.0%) | 0 (0.0%) |
| Personal Care & Service | 33 (42.9%) | 44 (57.1%) |
| Total (Category) | 133 (39.6%) | 203 (60.4%) |
| Total (Overall) | 2,109 (58.8%) | 1,475 (41.2%) |
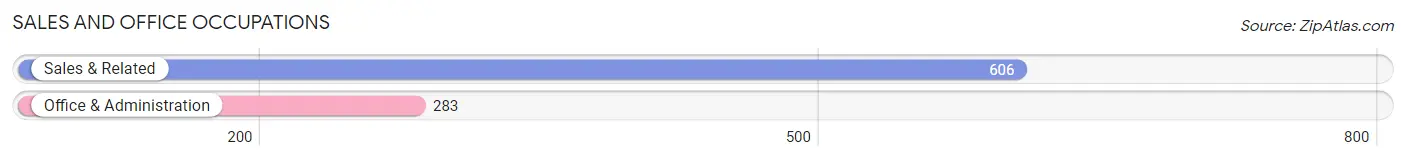
Sales and Office Occupations
The most common Sales and Office occupations in Union Beach borough are Sales & Related (606 | 16.9%), and Office & Administration (283 | 7.9%).
Sales and Office Occupations by Sex
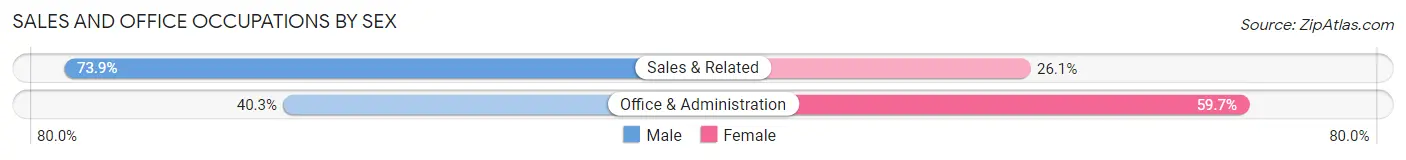
| Occupation | Male | Female |
| Sales & Related | 448 (73.9%) | 158 (26.1%) |
| Office & Administration | 114 (40.3%) | 169 (59.7%) |
| Total (Category) | 562 (63.2%) | 327 (36.8%) |
| Total (Overall) | 2,109 (58.8%) | 1,475 (41.2%) |
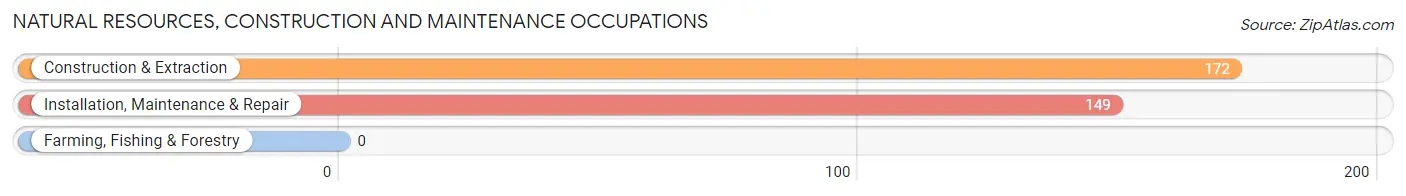
Natural Resources, Construction and Maintenance Occupations
The most common Natural Resources, Construction and Maintenance occupations in Union Beach borough are Construction & Extraction (172 | 4.8%), and Installation, Maintenance & Repair (149 | 4.2%).
Natural Resources, Construction and Maintenance Occupations by Sex
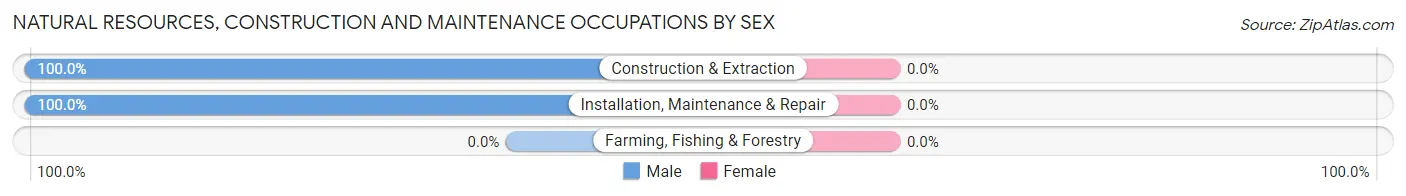
| Occupation | Male | Female |
| Farming, Fishing & Forestry | 0 (0.0%) | 0 (0.0%) |
| Construction & Extraction | 172 (100.0%) | 0 (0.0%) |
| Installation, Maintenance & Repair | 149 (100.0%) | 0 (0.0%) |
| Total (Category) | 321 (100.0%) | 0 (0.0%) |
| Total (Overall) | 2,109 (58.8%) | 1,475 (41.2%) |
Production, Transportation and Moving Occupations
The most common Production, Transportation and Moving occupations in Union Beach borough are Production (310 | 8.6%), Transportation (209 | 5.8%), and Material Moving (113 | 3.2%).
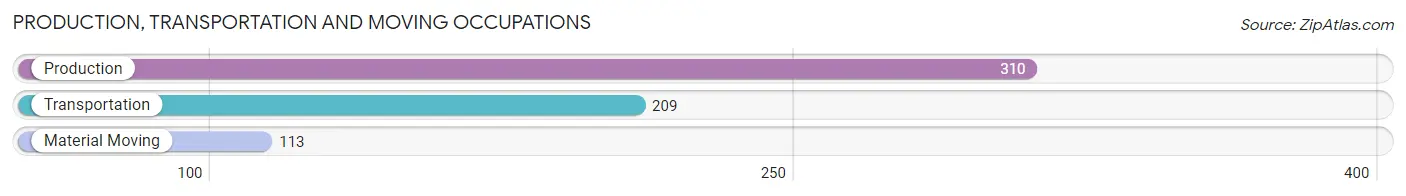
Production, Transportation and Moving Occupations by Sex
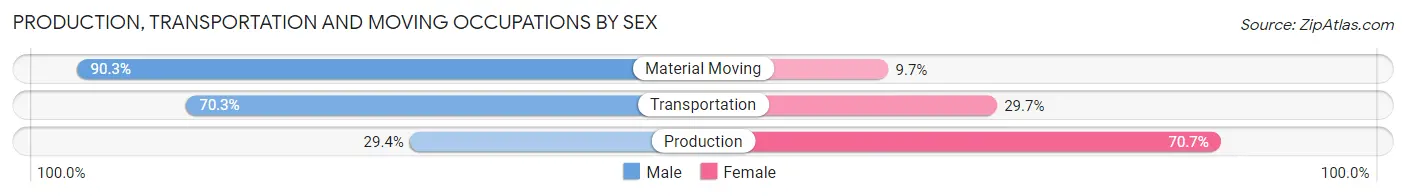
| Occupation | Male | Female |
| Production | 91 (29.3%) | 219 (70.7%) |
| Transportation | 147 (70.3%) | 62 (29.7%) |
| Material Moving | 102 (90.3%) | 11 (9.7%) |
| Total (Category) | 340 (53.8%) | 292 (46.2%) |
| Total (Overall) | 2,109 (58.8%) | 1,475 (41.2%) |
Employment Industries by Sex in Union Beach borough
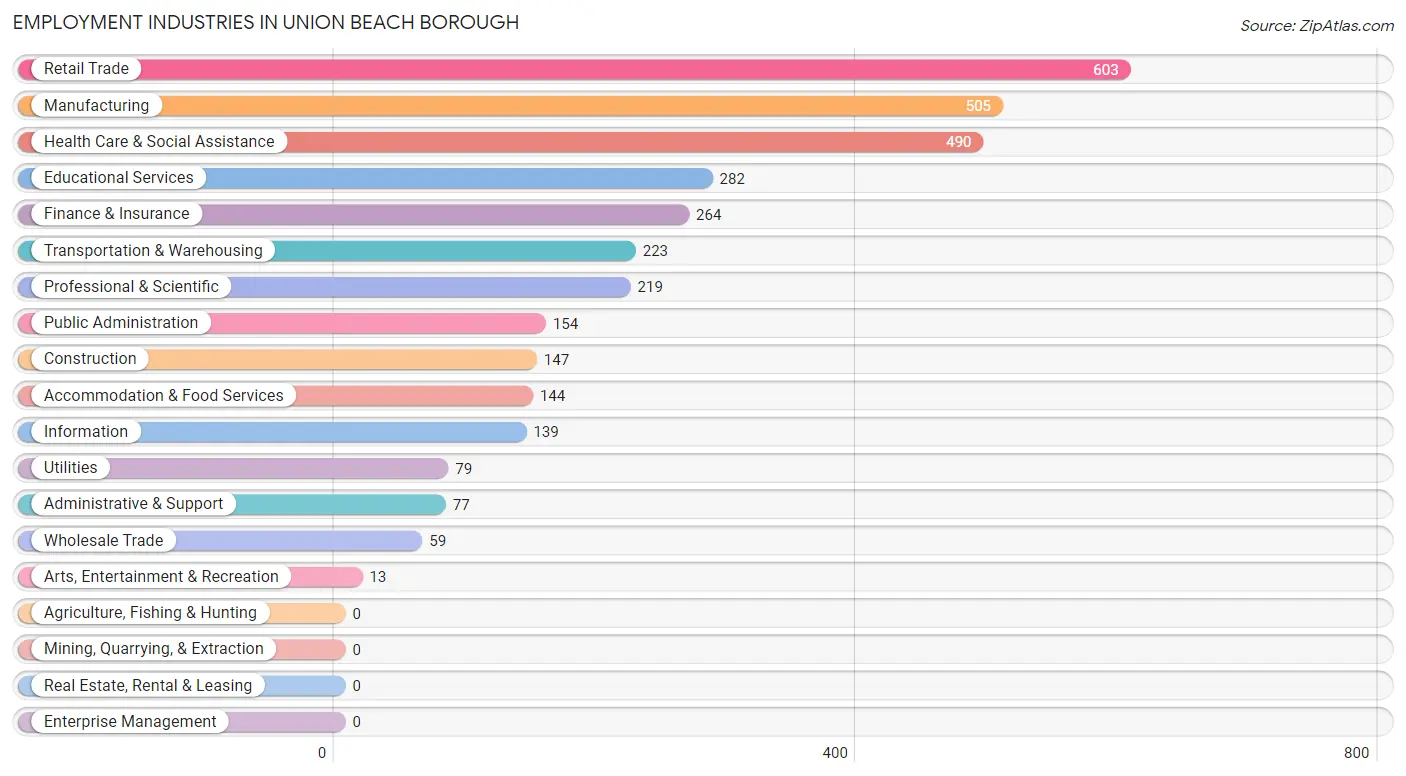
Employment Industries in Union Beach borough
The major employment industries in Union Beach borough include Retail Trade (603 | 16.8%), Manufacturing (505 | 14.1%), Health Care & Social Assistance (490 | 13.7%), Educational Services (282 | 7.9%), and Finance & Insurance (264 | 7.4%).
Employment Industries by Sex in Union Beach borough
The Union Beach borough industries that see more men than women are Construction (100.0%), Arts, Entertainment & Recreation (100.0%), and Information (81.3%), whereas the industries that tend to have a higher number of women are Professional & Scientific (59.8%), Accommodation & Food Services (54.9%), and Manufacturing (53.5%).
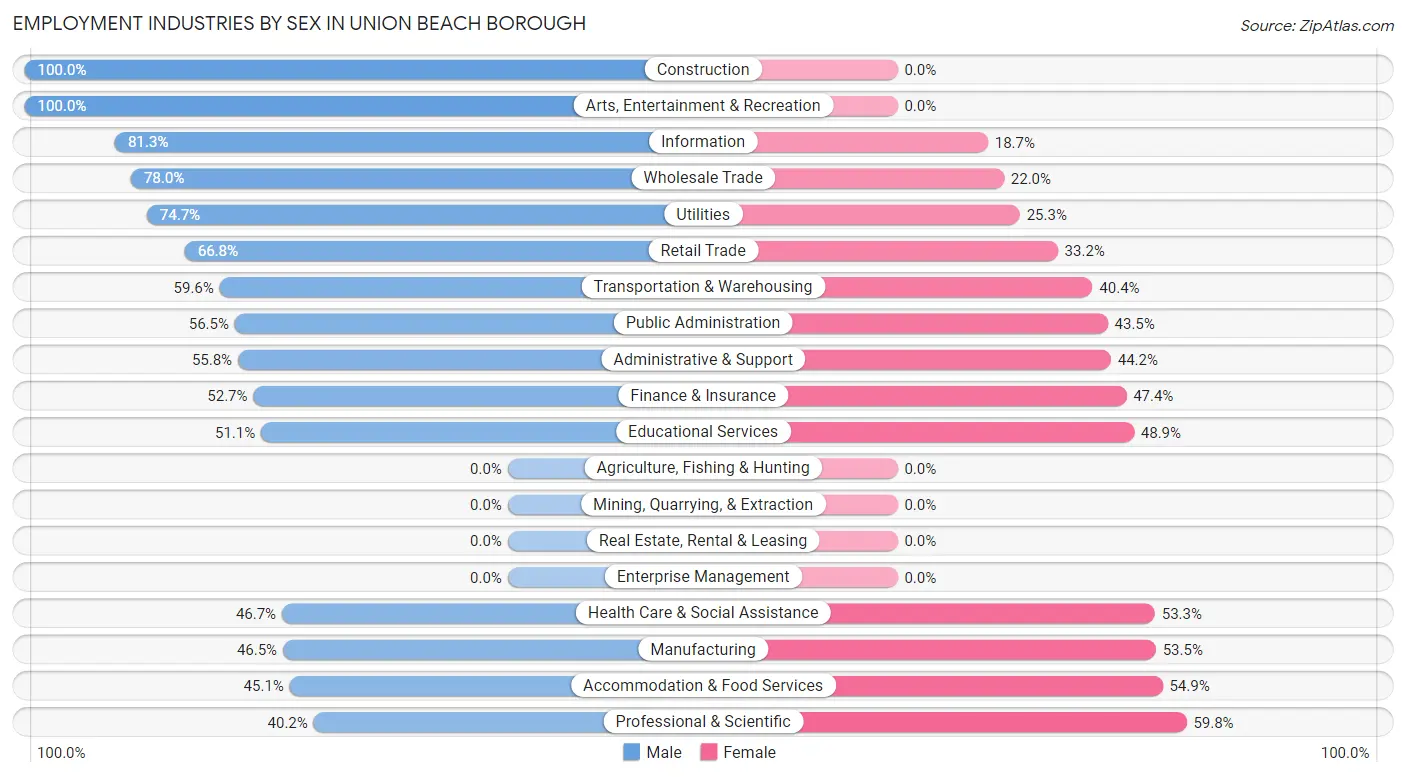
| Industry | Male | Female |
| Agriculture, Fishing & Hunting | 0 (0.0%) | 0 (0.0%) |
| Mining, Quarrying, & Extraction | 0 (0.0%) | 0 (0.0%) |
| Construction | 147 (100.0%) | 0 (0.0%) |
| Manufacturing | 235 (46.5%) | 270 (53.5%) |
| Wholesale Trade | 46 (78.0%) | 13 (22.0%) |
| Retail Trade | 403 (66.8%) | 200 (33.2%) |
| Transportation & Warehousing | 133 (59.6%) | 90 (40.4%) |
| Utilities | 59 (74.7%) | 20 (25.3%) |
| Information | 113 (81.3%) | 26 (18.7%) |
| Finance & Insurance | 139 (52.6%) | 125 (47.3%) |
| Real Estate, Rental & Leasing | 0 (0.0%) | 0 (0.0%) |
| Professional & Scientific | 88 (40.2%) | 131 (59.8%) |
| Enterprise Management | 0 (0.0%) | 0 (0.0%) |
| Administrative & Support | 43 (55.8%) | 34 (44.2%) |
| Educational Services | 144 (51.1%) | 138 (48.9%) |
| Health Care & Social Assistance | 229 (46.7%) | 261 (53.3%) |
| Arts, Entertainment & Recreation | 13 (100.0%) | 0 (0.0%) |
| Accommodation & Food Services | 65 (45.1%) | 79 (54.9%) |
| Public Administration | 87 (56.5%) | 67 (43.5%) |
| Total | 2,109 (58.8%) | 1,475 (41.2%) |
Education in Union Beach borough
School Enrollment in Union Beach borough
The most common levels of schooling among the 1,135 students in Union Beach borough are college / undergraduate (320 | 28.2%), high school (251 | 22.1%), and middle school (185 | 16.3%).
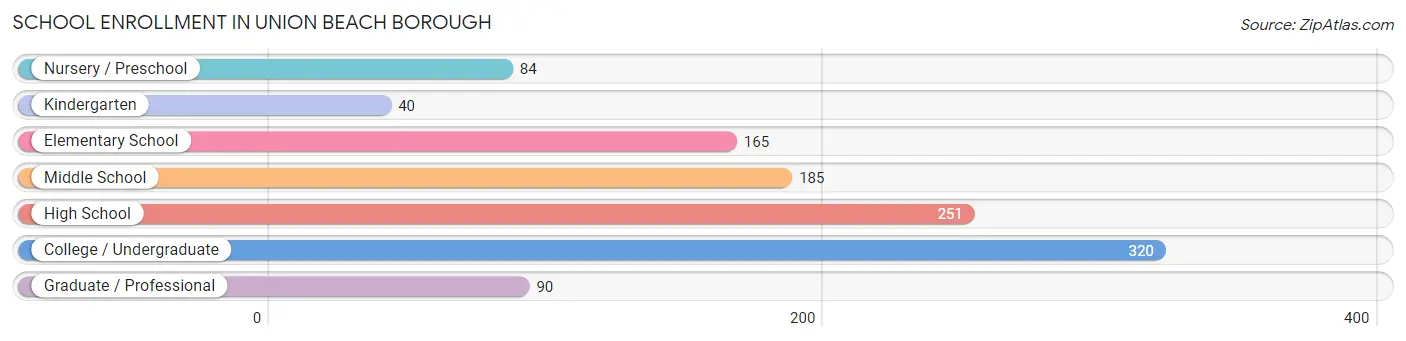
| School Level | # Students | % Students |
| Nursery / Preschool | 84 | 7.4% |
| Kindergarten | 40 | 3.5% |
| Elementary School | 165 | 14.5% |
| Middle School | 185 | 16.3% |
| High School | 251 | 22.1% |
| College / Undergraduate | 320 | 28.2% |
| Graduate / Professional | 90 | 7.9% |
| Total | 1,135 | 100.0% |
School Enrollment by Age by Funding Source in Union Beach borough
Out of a total of 1,135 students who are enrolled in schools in Union Beach borough, 230 (20.3%) attend a private institution, while the remaining 905 (79.7%) are enrolled in public schools. The age group of 20 to 24 year olds has the highest likelihood of being enrolled in private schools, with 84 (100.0% in the age bracket) enrolled. Conversely, the age group of 3 to 4 year olds has the lowest likelihood of being enrolled in a private school, with 38 (100.0% in the age bracket) attending a public institution.
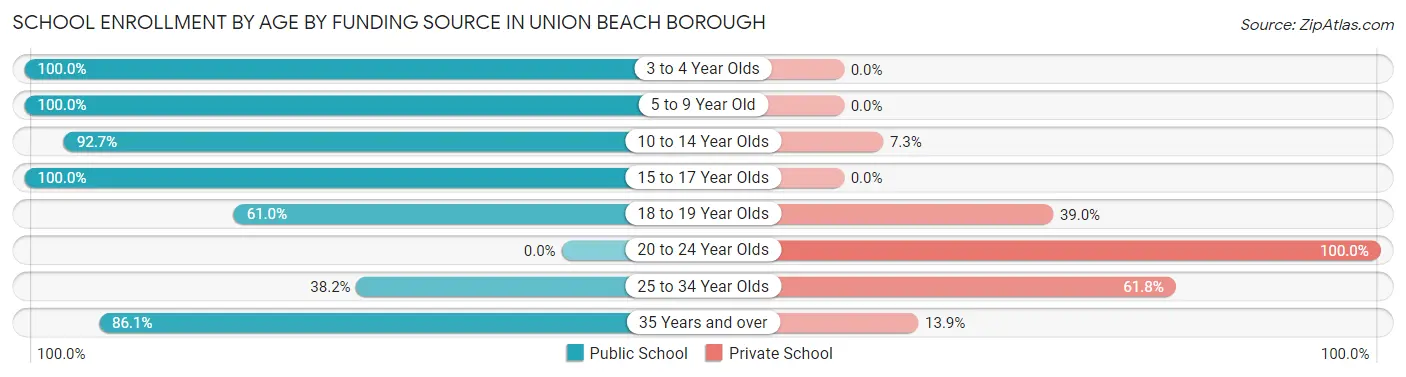
| Age Bracket | Public School | Private School |
| 3 to 4 Year Olds | 38 (100.0%) | 0 (0.0%) |
| 5 to 9 Year Old | 251 (100.0%) | 0 (0.0%) |
| 10 to 14 Year Olds | 266 (92.7%) | 21 (7.3%) |
| 15 to 17 Year Olds | 95 (100.0%) | 0 (0.0%) |
| 18 to 19 Year Olds | 72 (61.0%) | 46 (39.0%) |
| 20 to 24 Year Olds | 0 (0.0%) | 84 (100.0%) |
| 25 to 34 Year Olds | 34 (38.2%) | 55 (61.8%) |
| 35 Years and over | 149 (86.1%) | 24 (13.9%) |
| Total | 905 (79.7%) | 230 (20.3%) |
Educational Attainment by Field of Study in Union Beach borough
Business (600 | 35.2%), physical & health sciences (186 | 10.9%), education (170 | 10.0%), social sciences (124 | 7.3%), and bio, nature & agricultural (75 | 4.4%) are the most common fields of study among 1,702 individuals in Union Beach borough who have obtained a bachelor's degree or higher.
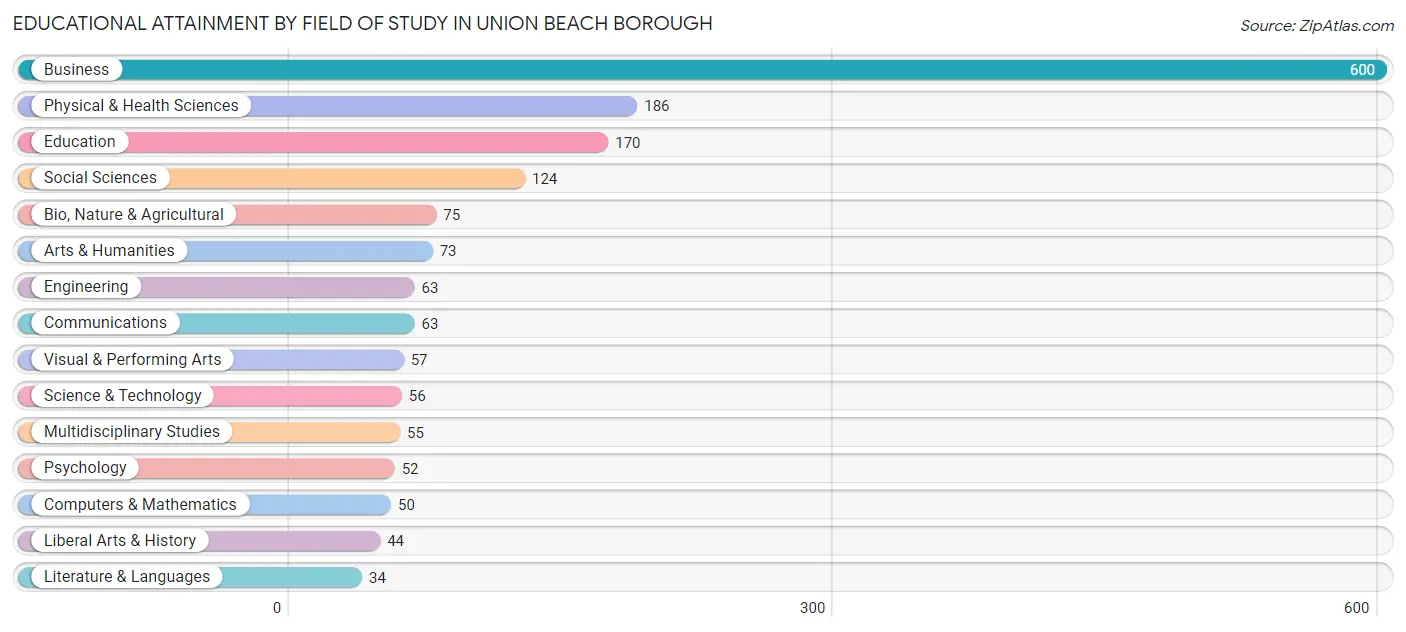
| Field of Study | # Graduates | % Graduates |
| Computers & Mathematics | 50 | 2.9% |
| Bio, Nature & Agricultural | 75 | 4.4% |
| Physical & Health Sciences | 186 | 10.9% |
| Psychology | 52 | 3.1% |
| Social Sciences | 124 | 7.3% |
| Engineering | 63 | 3.7% |
| Multidisciplinary Studies | 55 | 3.2% |
| Science & Technology | 56 | 3.3% |
| Business | 600 | 35.2% |
| Education | 170 | 10.0% |
| Literature & Languages | 34 | 2.0% |
| Liberal Arts & History | 44 | 2.6% |
| Visual & Performing Arts | 57 | 3.4% |
| Communications | 63 | 3.7% |
| Arts & Humanities | 73 | 4.3% |
| Total | 1,702 | 100.0% |
Transportation & Commute in Union Beach borough
Vehicle Availability by Sex in Union Beach borough
The most prevalent vehicle ownership categories in Union Beach borough are males with 3 vehicles (947, accounting for 45.1%) and females with 3 vehicles (394, making up 65.7%).
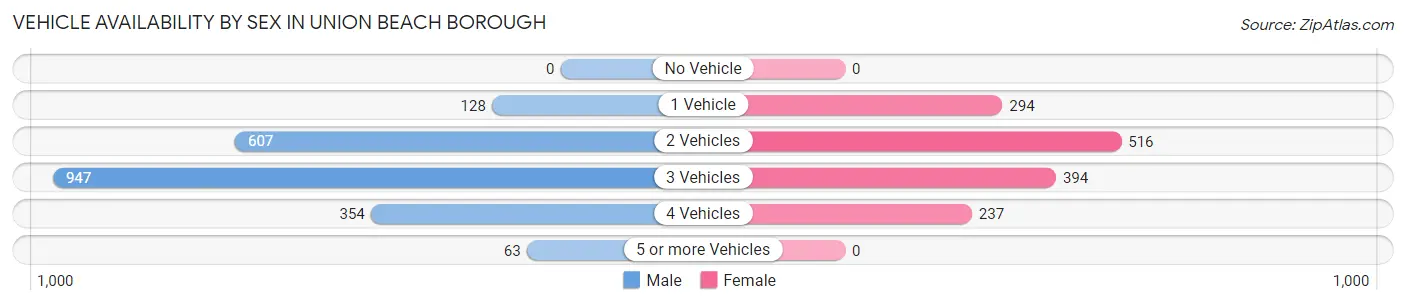
| Vehicles Available | Male | Female |
| No Vehicle | 0 (0.0%) | 0 (0.0%) |
| 1 Vehicle | 128 (6.1%) | 294 (20.4%) |
| 2 Vehicles | 607 (28.9%) | 516 (35.8%) |
| 3 Vehicles | 947 (45.1%) | 394 (27.3%) |
| 4 Vehicles | 354 (16.9%) | 237 (16.5%) |
| 5 or more Vehicles | 63 (3.0%) | 0 (0.0%) |
| Total | 2,099 (100.0%) | 1,441 (100.0%) |
Commute Time in Union Beach borough
The most frequently occuring commute durations in Union Beach borough are 30 to 34 minutes (677 commuters, 20.4%), 45 to 59 minutes (471 commuters, 14.2%), and 10 to 14 minutes (353 commuters, 10.6%).
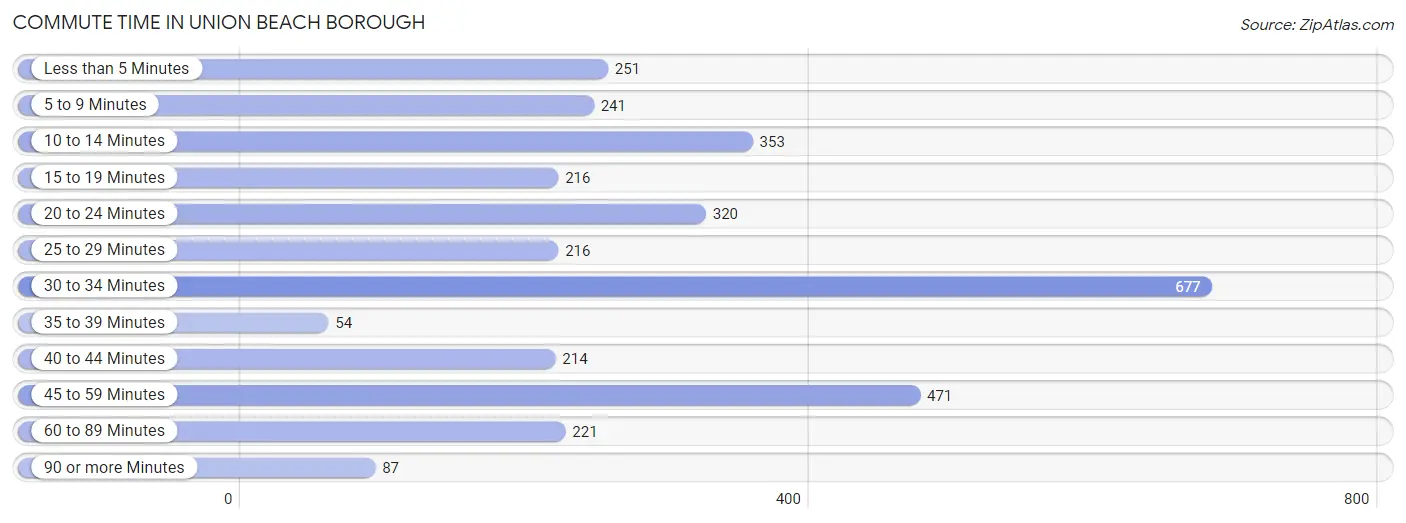
| Commute Time | # Commuters | % Commuters |
| Less than 5 Minutes | 251 | 7.6% |
| 5 to 9 Minutes | 241 | 7.3% |
| 10 to 14 Minutes | 353 | 10.6% |
| 15 to 19 Minutes | 216 | 6.5% |
| 20 to 24 Minutes | 320 | 9.6% |
| 25 to 29 Minutes | 216 | 6.5% |
| 30 to 34 Minutes | 677 | 20.4% |
| 35 to 39 Minutes | 54 | 1.6% |
| 40 to 44 Minutes | 214 | 6.4% |
| 45 to 59 Minutes | 471 | 14.2% |
| 60 to 89 Minutes | 221 | 6.7% |
| 90 or more Minutes | 87 | 2.6% |
Commute Time by Sex in Union Beach borough
The most common commute times in Union Beach borough are 45 to 59 minutes (340 commuters, 16.9%) for males and 30 to 34 minutes (360 commuters, 27.6%) for females.
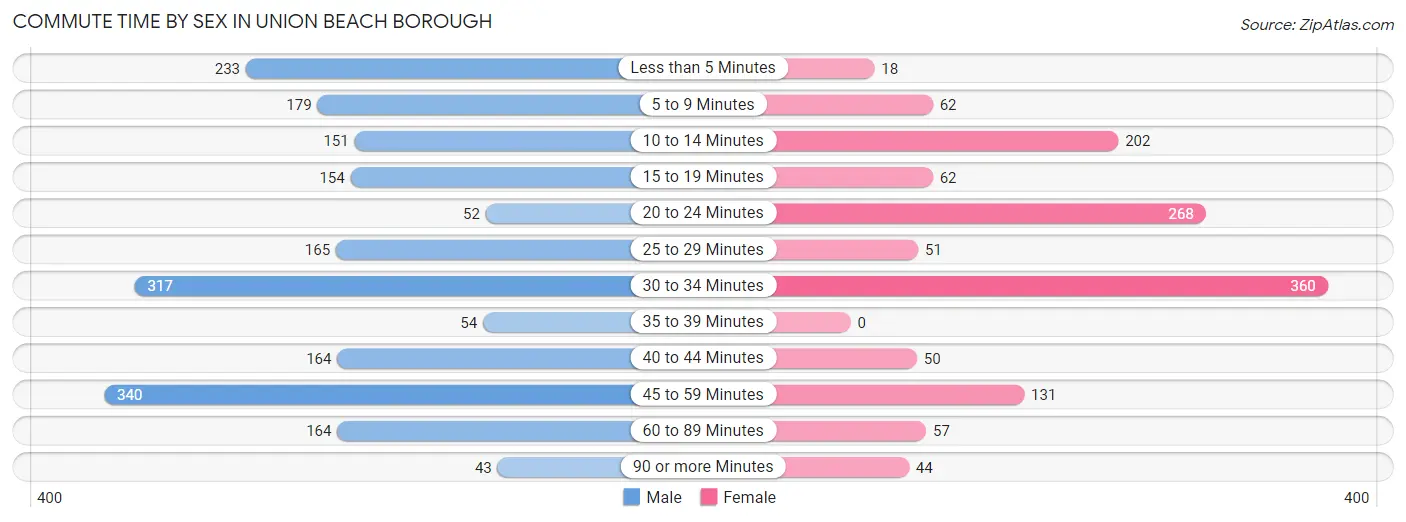
| Commute Time | Male | Female |
| Less than 5 Minutes | 233 (11.6%) | 18 (1.4%) |
| 5 to 9 Minutes | 179 (8.9%) | 62 (4.8%) |
| 10 to 14 Minutes | 151 (7.5%) | 202 (15.5%) |
| 15 to 19 Minutes | 154 (7.6%) | 62 (4.8%) |
| 20 to 24 Minutes | 52 (2.6%) | 268 (20.5%) |
| 25 to 29 Minutes | 165 (8.2%) | 51 (3.9%) |
| 30 to 34 Minutes | 317 (15.7%) | 360 (27.6%) |
| 35 to 39 Minutes | 54 (2.7%) | 0 (0.0%) |
| 40 to 44 Minutes | 164 (8.1%) | 50 (3.8%) |
| 45 to 59 Minutes | 340 (16.9%) | 131 (10.0%) |
| 60 to 89 Minutes | 164 (8.1%) | 57 (4.4%) |
| 90 or more Minutes | 43 (2.1%) | 44 (3.4%) |
Time of Departure to Work by Sex in Union Beach borough
The most frequent times of departure to work in Union Beach borough are 12:00 PM to 3:59 PM (444, 22.0%) for males and 6:00 AM to 6:29 AM (318, 24.4%) for females.
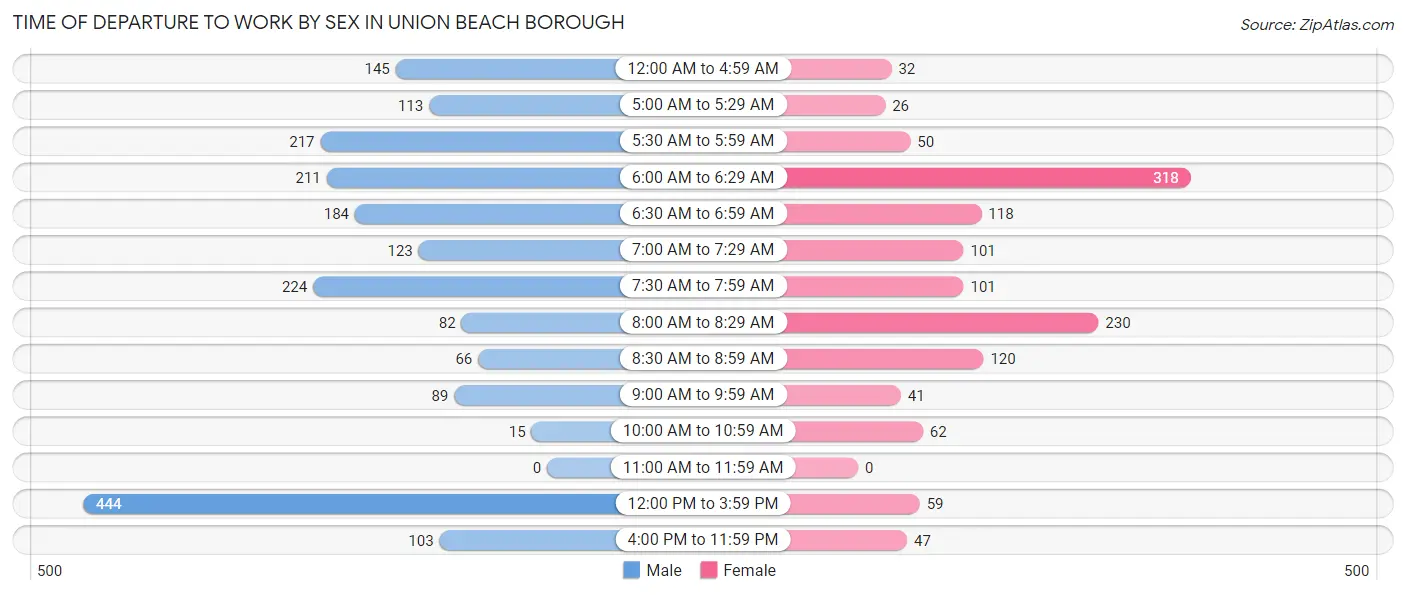
| Time of Departure | Male | Female |
| 12:00 AM to 4:59 AM | 145 (7.2%) | 32 (2.5%) |
| 5:00 AM to 5:29 AM | 113 (5.6%) | 26 (2.0%) |
| 5:30 AM to 5:59 AM | 217 (10.8%) | 50 (3.8%) |
| 6:00 AM to 6:29 AM | 211 (10.5%) | 318 (24.4%) |
| 6:30 AM to 6:59 AM | 184 (9.1%) | 118 (9.0%) |
| 7:00 AM to 7:29 AM | 123 (6.1%) | 101 (7.7%) |
| 7:30 AM to 7:59 AM | 224 (11.1%) | 101 (7.7%) |
| 8:00 AM to 8:29 AM | 82 (4.1%) | 230 (17.6%) |
| 8:30 AM to 8:59 AM | 66 (3.3%) | 120 (9.2%) |
| 9:00 AM to 9:59 AM | 89 (4.4%) | 41 (3.1%) |
| 10:00 AM to 10:59 AM | 15 (0.7%) | 62 (4.8%) |
| 11:00 AM to 11:59 AM | 0 (0.0%) | 0 (0.0%) |
| 12:00 PM to 3:59 PM | 444 (22.0%) | 59 (4.5%) |
| 4:00 PM to 11:59 PM | 103 (5.1%) | 47 (3.6%) |
| Total | 2,016 (100.0%) | 1,305 (100.0%) |
Housing Occupancy in Union Beach borough
Occupancy by Ownership in Union Beach borough
Of the total 1,987 dwellings in Union Beach borough, owner-occupied units account for 1,826 (91.9%), while renter-occupied units make up 161 (8.1%).
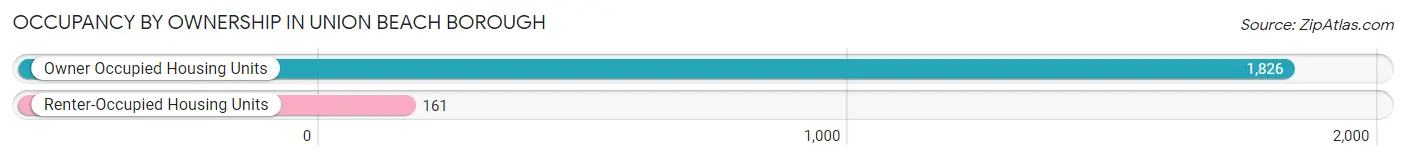
| Occupancy | # Housing Units | % Housing Units |
| Owner Occupied Housing Units | 1,826 | 91.9% |
| Renter-Occupied Housing Units | 161 | 8.1% |
| Total Occupied Housing Units | 1,987 | 100.0% |
Occupancy by Household Size in Union Beach borough
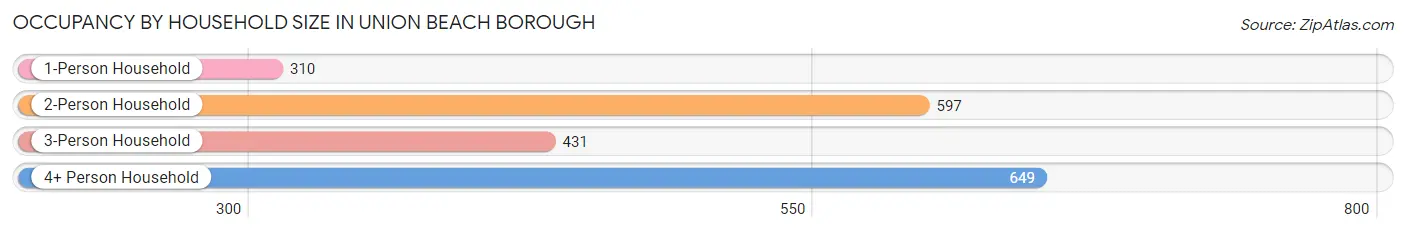
| Household Size | # Housing Units | % Housing Units |
| 1-Person Household | 310 | 15.6% |
| 2-Person Household | 597 | 30.0% |
| 3-Person Household | 431 | 21.7% |
| 4+ Person Household | 649 | 32.7% |
| Total Housing Units | 1,987 | 100.0% |
Occupancy by Ownership by Household Size in Union Beach borough
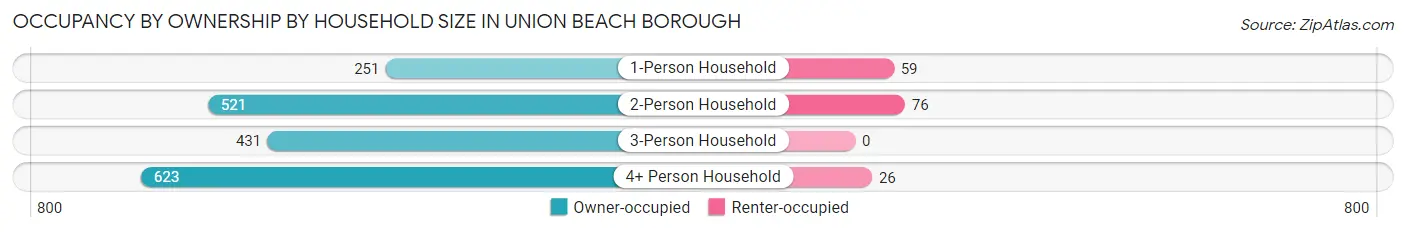
| Household Size | Owner-occupied | Renter-occupied |
| 1-Person Household | 251 (81.0%) | 59 (19.0%) |
| 2-Person Household | 521 (87.3%) | 76 (12.7%) |
| 3-Person Household | 431 (100.0%) | 0 (0.0%) |
| 4+ Person Household | 623 (96.0%) | 26 (4.0%) |
| Total Housing Units | 1,826 (91.9%) | 161 (8.1%) |
Occupancy by Educational Attainment in Union Beach borough
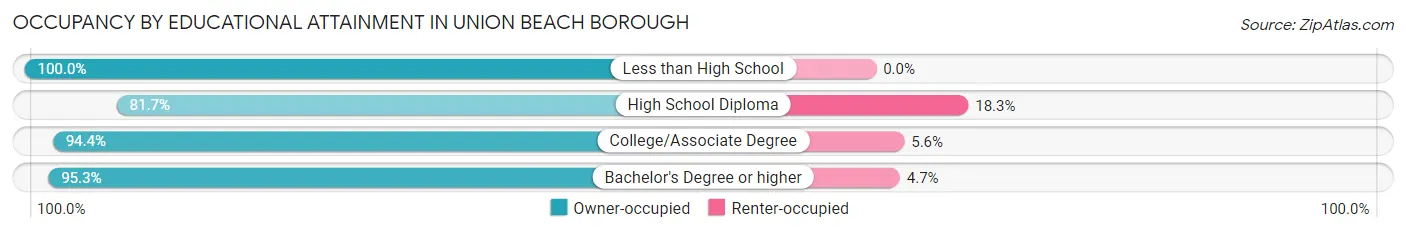
| Household Size | Owner-occupied | Renter-occupied |
| Less than High School | 88 (100.0%) | 0 (0.0%) |
| High School Diploma | 394 (81.7%) | 88 (18.3%) |
| College/Associate Degree | 694 (94.4%) | 41 (5.6%) |
| Bachelor's Degree or higher | 650 (95.3%) | 32 (4.7%) |
Occupancy by Age of Householder in Union Beach borough
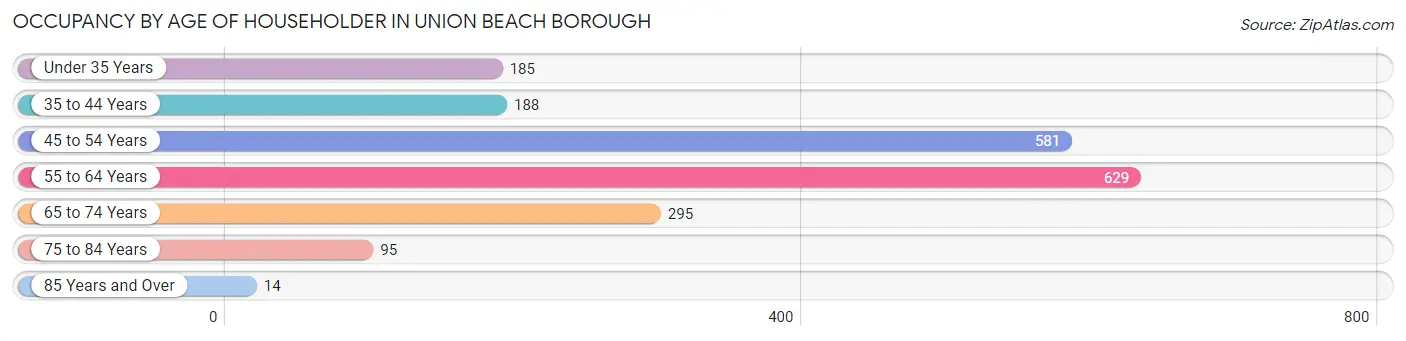
| Age Bracket | # Households | % Households |
| Under 35 Years | 185 | 9.3% |
| 35 to 44 Years | 188 | 9.5% |
| 45 to 54 Years | 581 | 29.2% |
| 55 to 64 Years | 629 | 31.7% |
| 65 to 74 Years | 295 | 14.8% |
| 75 to 84 Years | 95 | 4.8% |
| 85 Years and Over | 14 | 0.7% |
| Total | 1,987 | 100.0% |
Housing Finances in Union Beach borough
Median Income by Occupancy in Union Beach borough
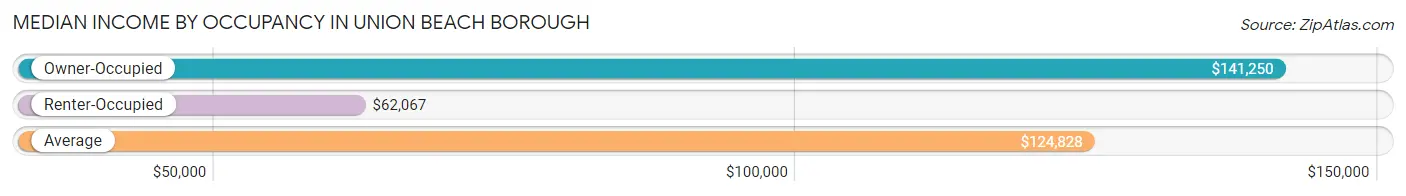
| Occupancy Type | # Households | Median Income |
| Owner-Occupied | 1,826 (91.9%) | $141,250 |
| Renter-Occupied | 161 (8.1%) | $62,067 |
| Average | 1,987 (100.0%) | $124,828 |
Occupancy by Householder Income Bracket in Union Beach borough
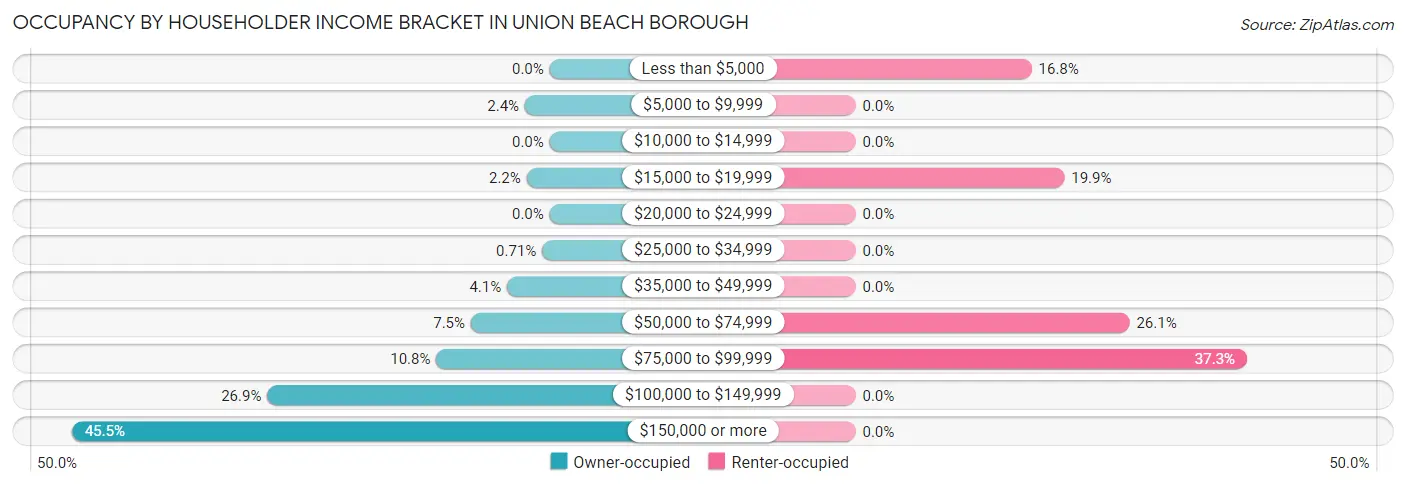
| Income Bracket | Owner-occupied | Renter-occupied |
| Less than $5,000 | 0 (0.0%) | 27 (16.8%) |
| $5,000 to $9,999 | 43 (2.4%) | 0 (0.0%) |
| $10,000 to $14,999 | 0 (0.0%) | 0 (0.0%) |
| $15,000 to $19,999 | 40 (2.2%) | 32 (19.9%) |
| $20,000 to $24,999 | 0 (0.0%) | 0 (0.0%) |
| $25,000 to $34,999 | 13 (0.7%) | 0 (0.0%) |
| $35,000 to $49,999 | 74 (4.1%) | 0 (0.0%) |
| $50,000 to $74,999 | 137 (7.5%) | 42 (26.1%) |
| $75,000 to $99,999 | 197 (10.8%) | 60 (37.3%) |
| $100,000 to $149,999 | 491 (26.9%) | 0 (0.0%) |
| $150,000 or more | 831 (45.5%) | 0 (0.0%) |
| Total | 1,826 (100.0%) | 161 (100.0%) |
Monthly Housing Cost Tiers in Union Beach borough
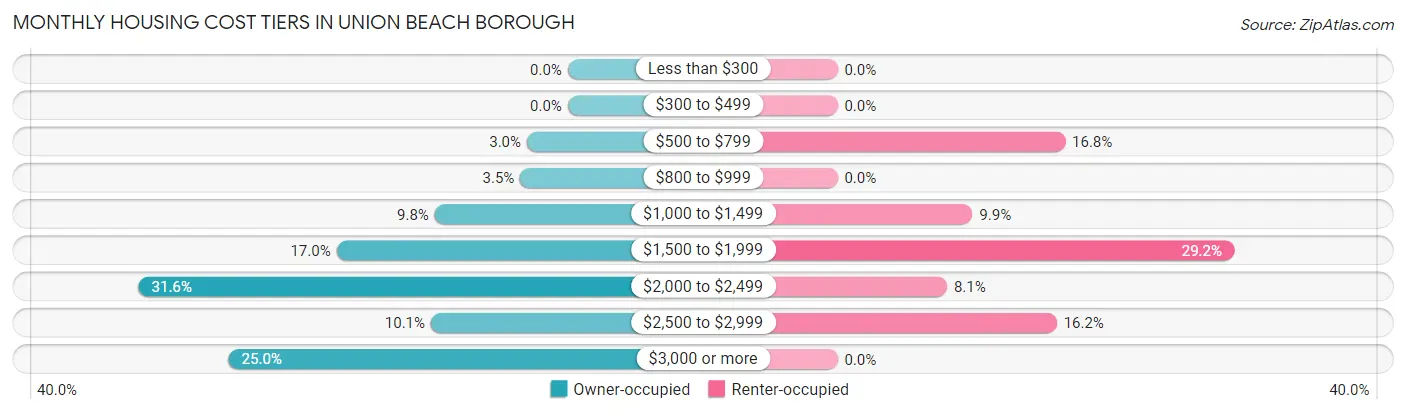
| Monthly Cost | Owner-occupied | Renter-occupied |
| Less than $300 | 0 (0.0%) | 0 (0.0%) |
| $300 to $499 | 0 (0.0%) | 0 (0.0%) |
| $500 to $799 | 55 (3.0%) | 27 (16.8%) |
| $800 to $999 | 64 (3.5%) | 0 (0.0%) |
| $1,000 to $1,499 | 179 (9.8%) | 16 (9.9%) |
| $1,500 to $1,999 | 311 (17.0%) | 47 (29.2%) |
| $2,000 to $2,499 | 577 (31.6%) | 13 (8.1%) |
| $2,500 to $2,999 | 184 (10.1%) | 26 (16.2%) |
| $3,000 or more | 456 (25.0%) | 0 (0.0%) |
| Total | 1,826 (100.0%) | 161 (100.0%) |
Physical Housing Characteristics in Union Beach borough
Housing Structures in Union Beach borough
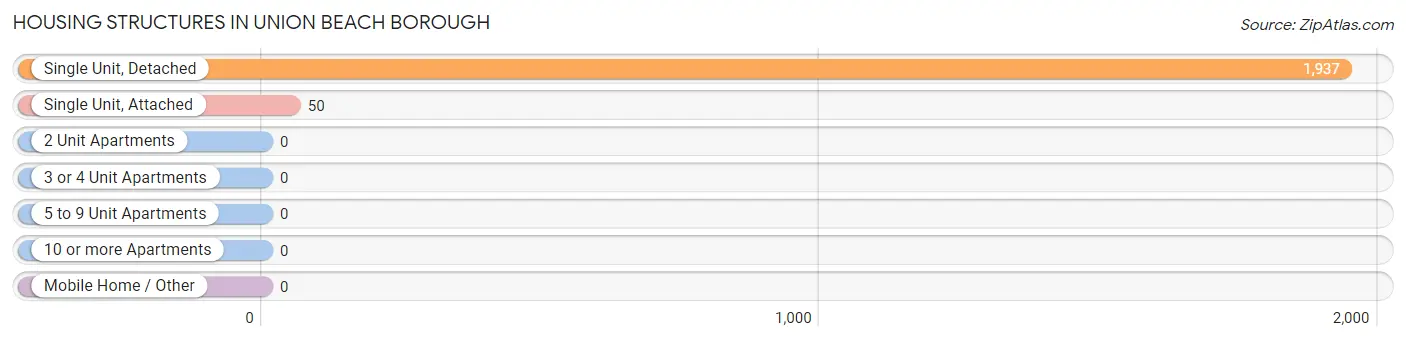
| Structure Type | # Housing Units | % Housing Units |
| Single Unit, Detached | 1,937 | 97.5% |
| Single Unit, Attached | 50 | 2.5% |
| 2 Unit Apartments | 0 | 0.0% |
| 3 or 4 Unit Apartments | 0 | 0.0% |
| 5 to 9 Unit Apartments | 0 | 0.0% |
| 10 or more Apartments | 0 | 0.0% |
| Mobile Home / Other | 0 | 0.0% |
| Total | 1,987 | 100.0% |
Housing Structures by Occupancy in Union Beach borough
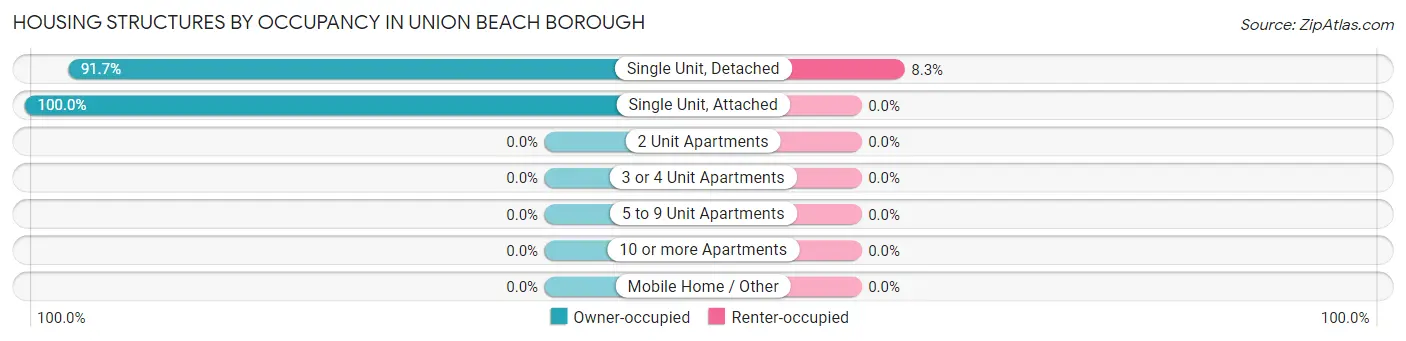
| Structure Type | Owner-occupied | Renter-occupied |
| Single Unit, Detached | 1,776 (91.7%) | 161 (8.3%) |
| Single Unit, Attached | 50 (100.0%) | 0 (0.0%) |
| 2 Unit Apartments | 0 (0.0%) | 0 (0.0%) |
| 3 or 4 Unit Apartments | 0 (0.0%) | 0 (0.0%) |
| 5 to 9 Unit Apartments | 0 (0.0%) | 0 (0.0%) |
| 10 or more Apartments | 0 (0.0%) | 0 (0.0%) |
| Mobile Home / Other | 0 (0.0%) | 0 (0.0%) |
| Total | 1,826 (91.9%) | 161 (8.1%) |
Housing Structures by Number of Rooms in Union Beach borough
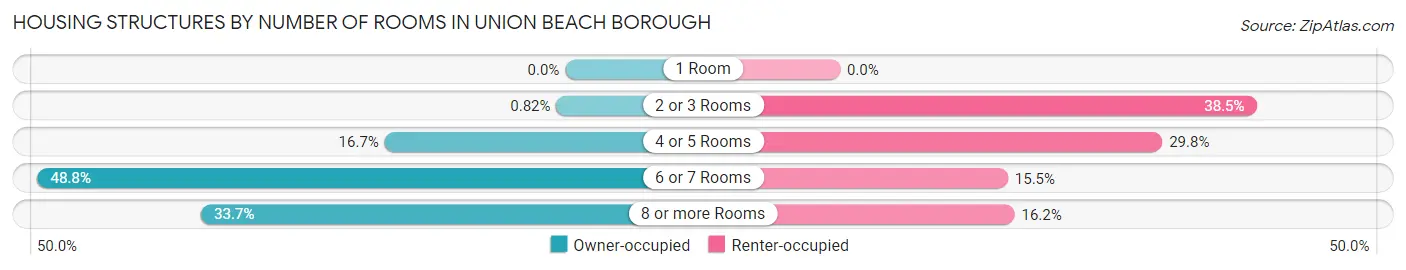
| Number of Rooms | Owner-occupied | Renter-occupied |
| 1 Room | 0 (0.0%) | 0 (0.0%) |
| 2 or 3 Rooms | 15 (0.8%) | 62 (38.5%) |
| 4 or 5 Rooms | 305 (16.7%) | 48 (29.8%) |
| 6 or 7 Rooms | 891 (48.8%) | 25 (15.5%) |
| 8 or more Rooms | 615 (33.7%) | 26 (16.2%) |
| Total | 1,826 (100.0%) | 161 (100.0%) |
Housing Structure by Heating Type in Union Beach borough
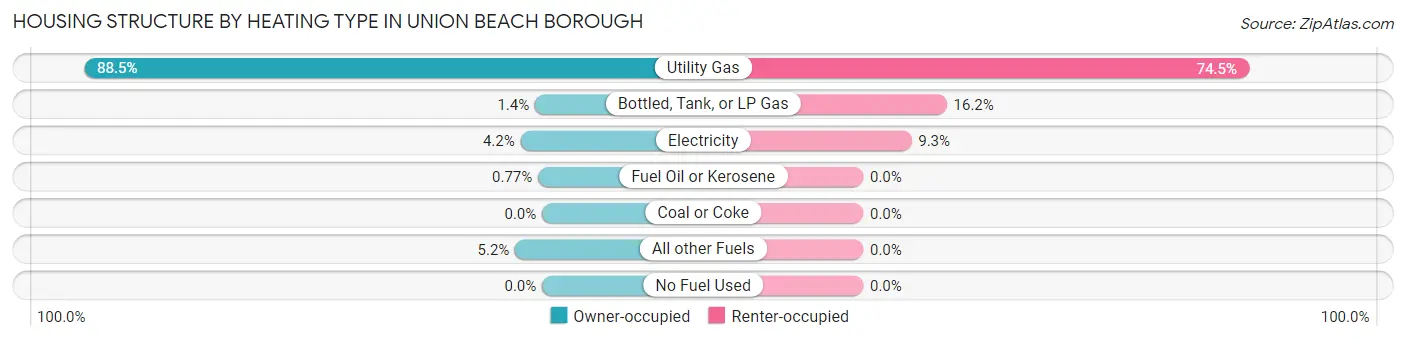
| Heating Type | Owner-occupied | Renter-occupied |
| Utility Gas | 1,616 (88.5%) | 120 (74.5%) |
| Bottled, Tank, or LP Gas | 25 (1.4%) | 26 (16.2%) |
| Electricity | 76 (4.2%) | 15 (9.3%) |
| Fuel Oil or Kerosene | 14 (0.8%) | 0 (0.0%) |
| Coal or Coke | 0 (0.0%) | 0 (0.0%) |
| All other Fuels | 95 (5.2%) | 0 (0.0%) |
| No Fuel Used | 0 (0.0%) | 0 (0.0%) |
| Total | 1,826 (100.0%) | 161 (100.0%) |
Household Vehicle Usage in Union Beach borough
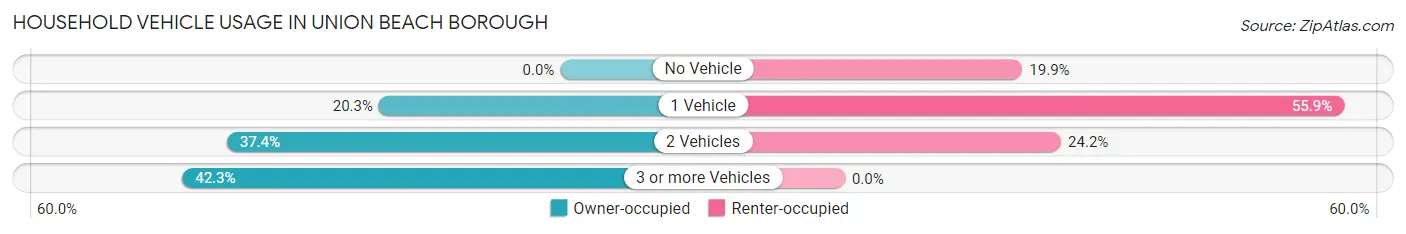
| Vehicles per Household | Owner-occupied | Renter-occupied |
| No Vehicle | 0 (0.0%) | 32 (19.9%) |
| 1 Vehicle | 371 (20.3%) | 90 (55.9%) |
| 2 Vehicles | 682 (37.3%) | 39 (24.2%) |
| 3 or more Vehicles | 773 (42.3%) | 0 (0.0%) |
| Total | 1,826 (100.0%) | 161 (100.0%) |
Real Estate & Mortgages in Union Beach borough
Real Estate and Mortgage Overview in Union Beach borough
| Characteristic | Without Mortgage | With Mortgage |
| Housing Units | 259 | 1,567 |
| Median Property Value | $367,200 | $383,600 |
| Median Household Income | $79,583 | $766 |
| Monthly Housing Costs | $1,072 | $456 |
| Real Estate Taxes | $7,750 | $0 |
Property Value by Mortgage Status in Union Beach borough
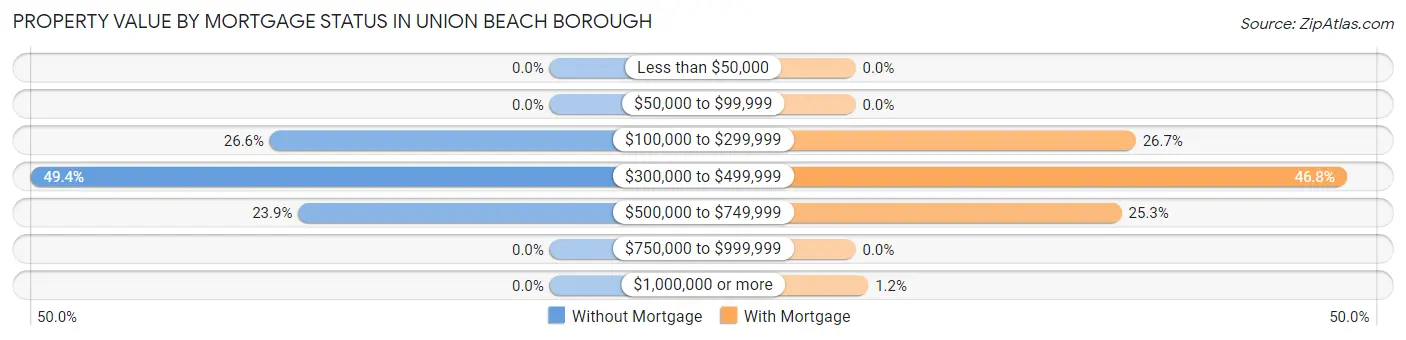
| Property Value | Without Mortgage | With Mortgage |
| Less than $50,000 | 0 (0.0%) | 0 (0.0%) |
| $50,000 to $99,999 | 0 (0.0%) | 0 (0.0%) |
| $100,000 to $299,999 | 69 (26.6%) | 418 (26.7%) |
| $300,000 to $499,999 | 128 (49.4%) | 733 (46.8%) |
| $500,000 to $749,999 | 62 (23.9%) | 397 (25.3%) |
| $750,000 to $999,999 | 0 (0.0%) | 0 (0.0%) |
| $1,000,000 or more | 0 (0.0%) | 19 (1.2%) |
| Total | 259 (100.0%) | 1,567 (100.0%) |
Household Income by Mortgage Status in Union Beach borough
| Household Income | Without Mortgage | With Mortgage |
| Less than $10,000 | 0 (0.0%) | 47 (3.0%) |
| $10,000 to $24,999 | 40 (15.4%) | 43 (2.7%) |
| $25,000 to $34,999 | 13 (5.0%) | 0 (0.0%) |
| $35,000 to $49,999 | 54 (20.8%) | 0 (0.0%) |
| $50,000 to $74,999 | 0 (0.0%) | 20 (1.3%) |
| $75,000 to $99,999 | 59 (22.8%) | 137 (8.7%) |
| $100,000 to $149,999 | 28 (10.8%) | 138 (8.8%) |
| $150,000 or more | 65 (25.1%) | 463 (29.5%) |
| Total | 259 (100.0%) | 1,567 (100.0%) |
Property Value to Household Income Ratio in Union Beach borough
| Value-to-Income Ratio | Without Mortgage | With Mortgage |
| Less than 2.0x | 29 (11.2%) | 146,569 (9,353.5%) |
| 2.0x to 2.9x | 43 (16.6%) | 503 (32.1%) |
| 3.0x to 3.9x | 46 (17.8%) | 478 (30.5%) |
| 4.0x or more | 141 (54.4%) | 224 (14.3%) |
| Total | 259 (100.0%) | 1,567 (100.0%) |
Real Estate Taxes by Mortgage Status in Union Beach borough
| Property Taxes | Without Mortgage | With Mortgage |
| Less than $800 | 0 (0.0%) | 0 (0.0%) |
| $800 to $1,499 | 0 (0.0%) | 0 (0.0%) |
| $800 to $1,499 | 259 (100.0%) | 15 (1.0%) |
| Total | 259 (100.0%) | 1,567 (100.0%) |
Health & Disability in Union Beach borough
Health Insurance Coverage by Age in Union Beach borough
| Age Bracket | With Coverage | Without Coverage |
| Under 6 Years | 343 (89.8%) | 39 (10.2%) |
| 6 to 18 Years | 601 (100.0%) | 0 (0.0%) |
| 19 to 25 Years | 440 (96.7%) | 15 (3.3%) |
| 26 to 34 Years | 825 (86.6%) | 128 (13.4%) |
| 35 to 44 Years | 489 (89.9%) | 55 (10.1%) |
| 45 to 54 Years | 882 (95.4%) | 43 (4.6%) |
| 55 to 64 Years | 1,205 (100.0%) | 0 (0.0%) |
| 65 to 74 Years | 517 (100.0%) | 0 (0.0%) |
| 75 Years and older | 169 (100.0%) | 0 (0.0%) |
| Total | 5,471 (95.1%) | 280 (4.9%) |
Health Insurance Coverage by Citizenship Status in Union Beach borough
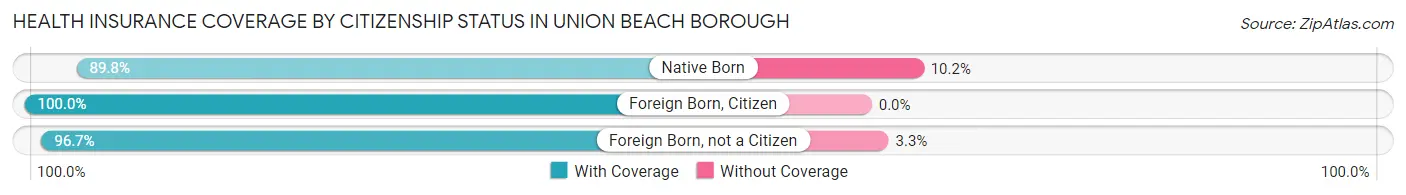
| Citizenship Status | With Coverage | Without Coverage |
| Native Born | 343 (89.8%) | 39 (10.2%) |
| Foreign Born, Citizen | 601 (100.0%) | 0 (0.0%) |
| Foreign Born, not a Citizen | 440 (96.7%) | 15 (3.3%) |
Health Insurance Coverage by Household Income in Union Beach borough
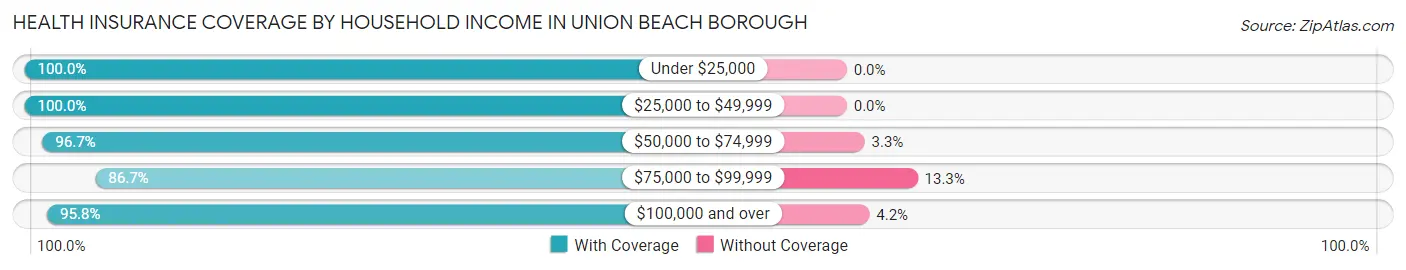
| Household Income | With Coverage | Without Coverage |
| Under $25,000 | 142 (100.0%) | 0 (0.0%) |
| $25,000 to $49,999 | 183 (100.0%) | 0 (0.0%) |
| $50,000 to $74,999 | 405 (96.7%) | 14 (3.3%) |
| $75,000 to $99,999 | 523 (86.7%) | 80 (13.3%) |
| $100,000 and over | 4,213 (95.8%) | 186 (4.2%) |
Public vs Private Health Insurance Coverage by Age in Union Beach borough
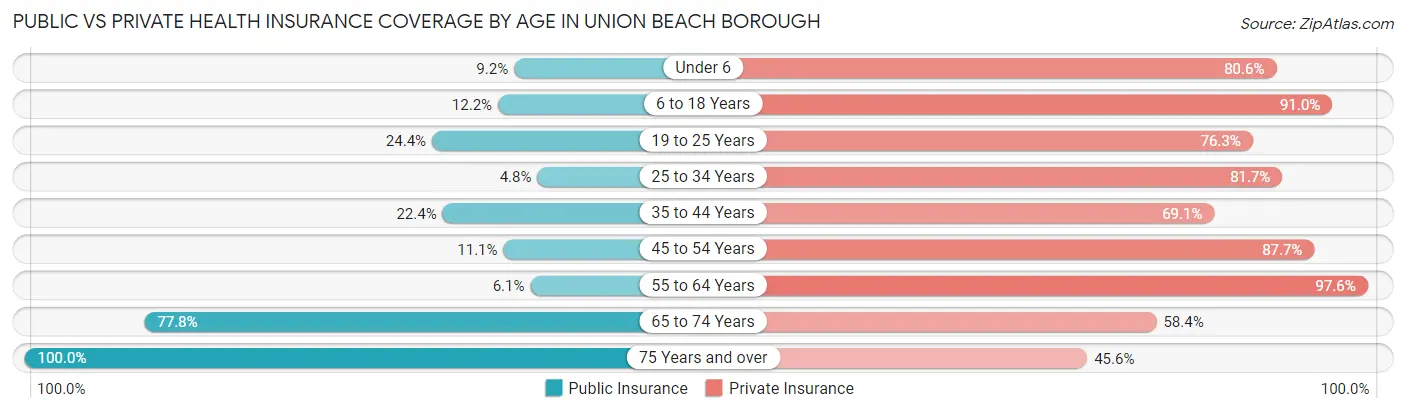
| Age Bracket | Public Insurance | Private Insurance |
| Under 6 | 35 (9.2%) | 308 (80.6%) |
| 6 to 18 Years | 73 (12.1%) | 547 (91.0%) |
| 19 to 25 Years | 111 (24.4%) | 347 (76.3%) |
| 25 to 34 Years | 46 (4.8%) | 779 (81.7%) |
| 35 to 44 Years | 122 (22.4%) | 376 (69.1%) |
| 45 to 54 Years | 103 (11.1%) | 811 (87.7%) |
| 55 to 64 Years | 74 (6.1%) | 1,176 (97.6%) |
| 65 to 74 Years | 402 (77.8%) | 302 (58.4%) |
| 75 Years and over | 169 (100.0%) | 77 (45.6%) |
| Total | 1,135 (19.7%) | 4,723 (82.1%) |
Disability Status by Sex by Age in Union Beach borough
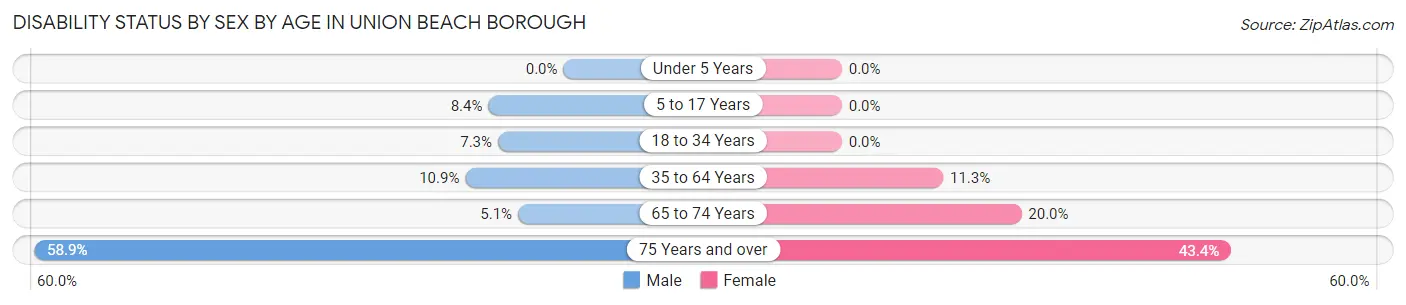
| Age Bracket | Male | Female |
| Under 5 Years | 0 (0.0%) | 0 (0.0%) |
| 5 to 17 Years | 23 (8.4%) | 0 (0.0%) |
| 18 to 34 Years | 73 (7.3%) | 0 (0.0%) |
| 35 to 64 Years | 145 (10.9%) | 152 (11.3%) |
| 65 to 74 Years | 13 (5.1%) | 52 (20.0%) |
| 75 Years and over | 33 (58.9%) | 49 (43.4%) |
Disability Class by Sex by Age in Union Beach borough
Disability Class: Hearing Difficulty
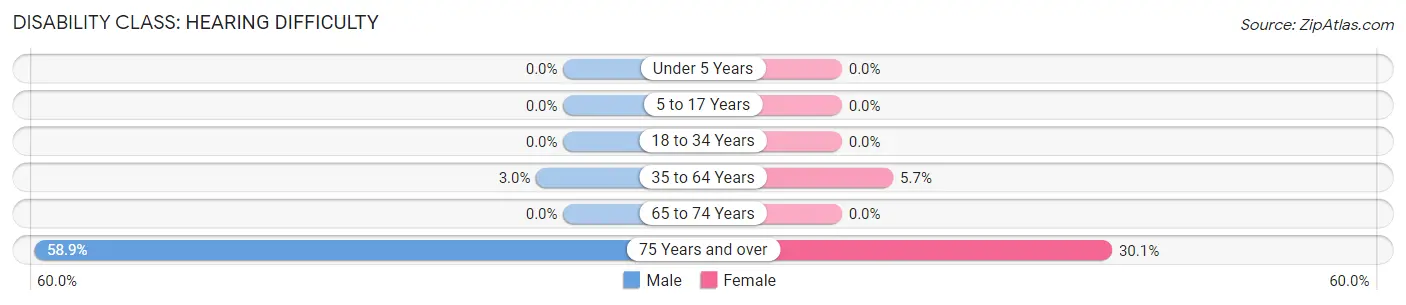
| Age Bracket | Male | Female |
| Under 5 Years | 0 (0.0%) | 0 (0.0%) |
| 5 to 17 Years | 0 (0.0%) | 0 (0.0%) |
| 18 to 34 Years | 0 (0.0%) | 0 (0.0%) |
| 35 to 64 Years | 40 (3.0%) | 77 (5.7%) |
| 65 to 74 Years | 0 (0.0%) | 0 (0.0%) |
| 75 Years and over | 33 (58.9%) | 34 (30.1%) |
Disability Class: Vision Difficulty
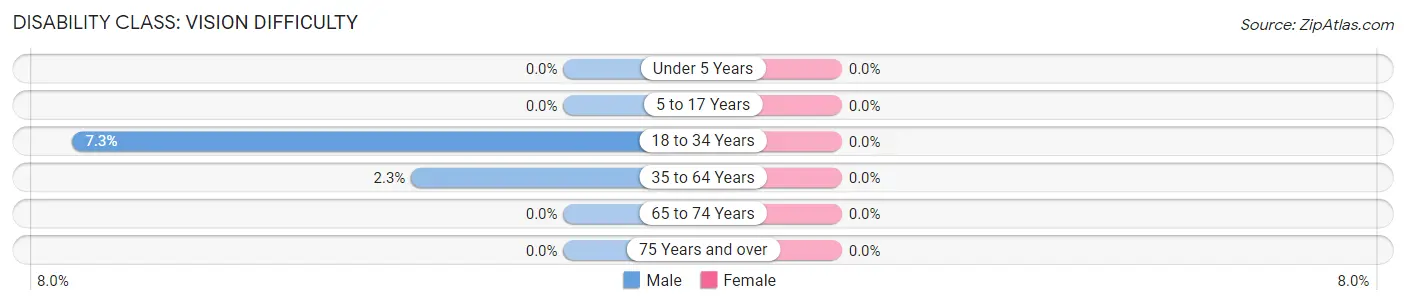
| Age Bracket | Male | Female |
| Under 5 Years | 0 (0.0%) | 0 (0.0%) |
| 5 to 17 Years | 0 (0.0%) | 0 (0.0%) |
| 18 to 34 Years | 73 (7.3%) | 0 (0.0%) |
| 35 to 64 Years | 30 (2.3%) | 0 (0.0%) |
| 65 to 74 Years | 0 (0.0%) | 0 (0.0%) |
| 75 Years and over | 0 (0.0%) | 0 (0.0%) |
Disability Class: Cognitive Difficulty
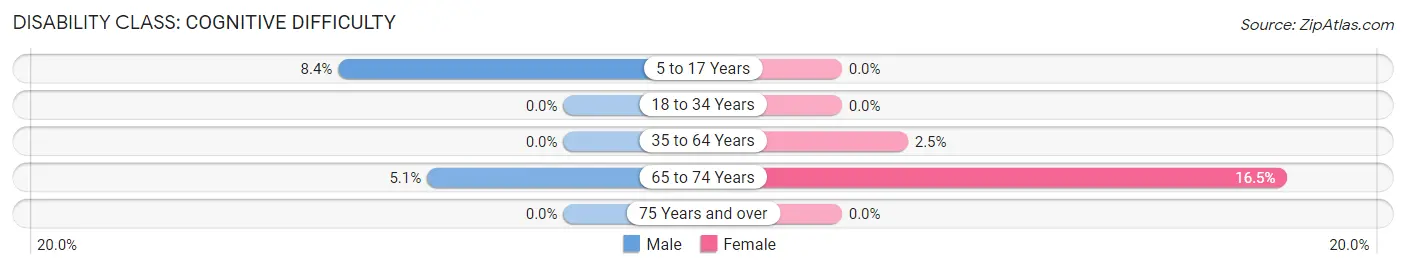
| Age Bracket | Male | Female |
| 5 to 17 Years | 23 (8.4%) | 0 (0.0%) |
| 18 to 34 Years | 0 (0.0%) | 0 (0.0%) |
| 35 to 64 Years | 0 (0.0%) | 33 (2.5%) |
| 65 to 74 Years | 13 (5.1%) | 43 (16.5%) |
| 75 Years and over | 0 (0.0%) | 0 (0.0%) |
Disability Class: Ambulatory Difficulty
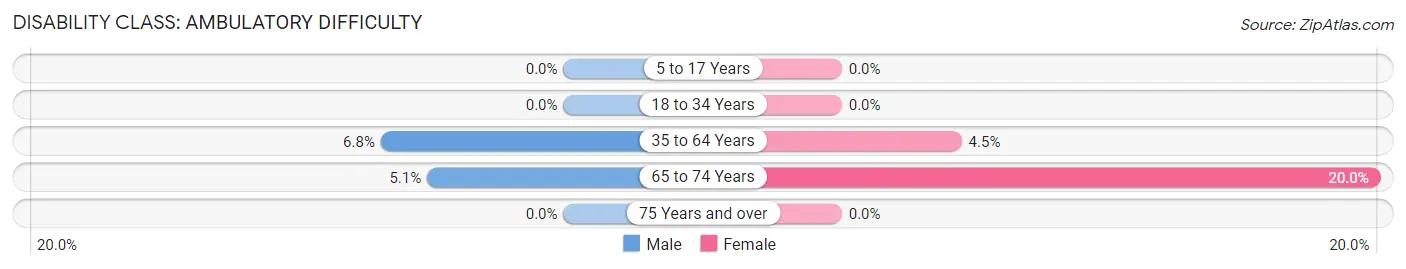
| Age Bracket | Male | Female |
| 5 to 17 Years | 0 (0.0%) | 0 (0.0%) |
| 18 to 34 Years | 0 (0.0%) | 0 (0.0%) |
| 35 to 64 Years | 90 (6.8%) | 60 (4.4%) |
| 65 to 74 Years | 13 (5.1%) | 52 (20.0%) |
| 75 Years and over | 0 (0.0%) | 0 (0.0%) |
Disability Class: Self-Care Difficulty
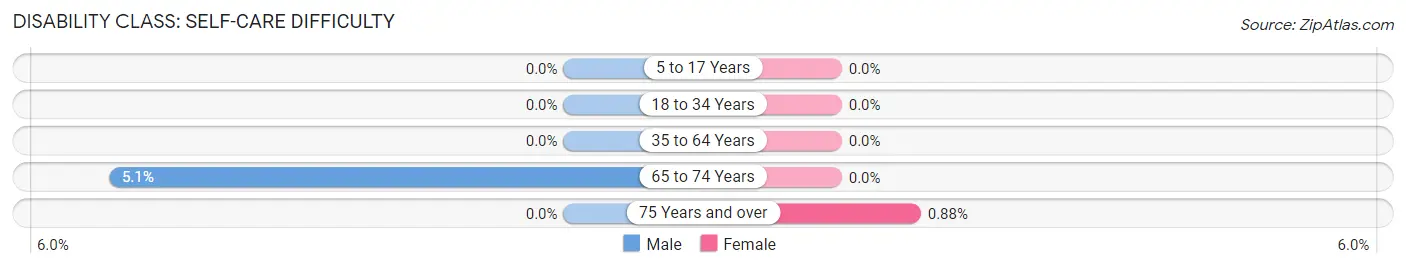
| Age Bracket | Male | Female |
| 5 to 17 Years | 0 (0.0%) | 0 (0.0%) |
| 18 to 34 Years | 0 (0.0%) | 0 (0.0%) |
| 35 to 64 Years | 0 (0.0%) | 0 (0.0%) |
| 65 to 74 Years | 13 (5.1%) | 0 (0.0%) |
| 75 Years and over | 0 (0.0%) | 1 (0.9%) |
Technology Access in Union Beach borough
Computing Device Access in Union Beach borough
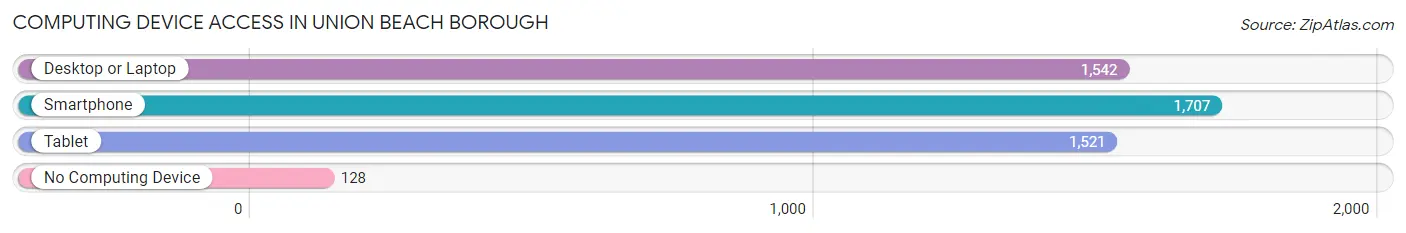
| Device Type | # Households | % Households |
| Desktop or Laptop | 1,542 | 77.6% |
| Smartphone | 1,707 | 85.9% |
| Tablet | 1,521 | 76.5% |
| No Computing Device | 128 | 6.4% |
| Total | 1,987 | 100.0% |
Internet Access in Union Beach borough
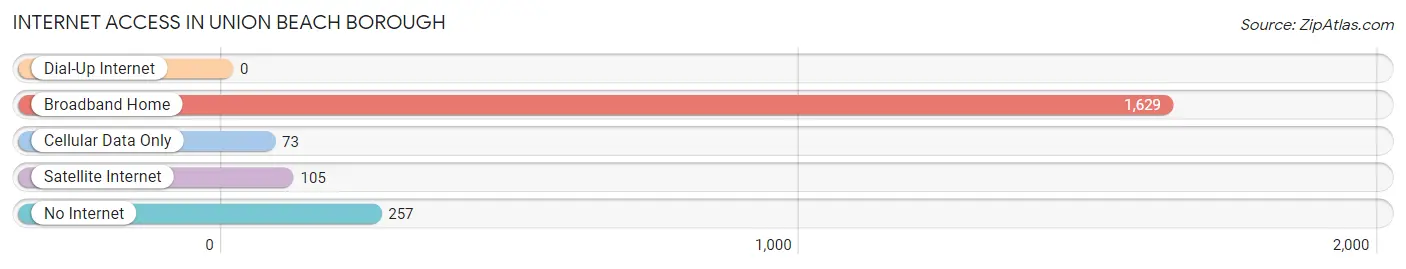
| Internet Type | # Households | % Households |
| Dial-Up Internet | 0 | 0.0% |
| Broadband Home | 1,629 | 82.0% |
| Cellular Data Only | 73 | 3.7% |
| Satellite Internet | 105 | 5.3% |
| No Internet | 257 | 12.9% |
| Total | 1,987 | 100.0% |
Union Beach borough Summary
Introduction
Union Beach Borough is a small borough located in Monmouth County, New Jersey. It is situated on the Raritan Bay, just south of the Raritan River. The borough is part of the Bayshore region of New Jersey, and is home to a population of approximately 6,000 people. The borough is known for its strong sense of community and its commitment to preserving its unique history and culture.
History
Union Beach was originally part of the larger Union Township, which was established in 1798. The area was first settled by Dutch and English settlers in the early 1700s. The area was known as Union Landing until 1867, when it was officially incorporated as Union Beach. The name was chosen to honor the Union soldiers who had fought in the Civil War.
The borough was a popular summer destination for many years, and was home to several large resorts. The resorts attracted many visitors from New York City and Philadelphia, and the area became known as a popular vacation spot.
In the 1950s, the borough began to experience a decline in tourism, and the resorts began to close. The borough was also affected by the construction of the Garden State Parkway, which cut off access to the beachfront. In the 1960s, the borough began to experience a resurgence in popularity, and many new businesses and homes were built.
Geography
Union Beach is located in Monmouth County, New Jersey. It is situated on the Raritan Bay, just south of the Raritan River. The borough is part of the Bayshore region of New Jersey, and is home to a population of approximately 6,000 people.
The borough is bordered by the boroughs of Keansburg and Hazlet to the north, and the townships of Middletown and Holmdel to the south. The borough is located approximately 25 miles south of New York City, and is easily accessible by car or public transportation.
Economy
Union Beach is a small borough, and its economy is largely based on tourism and small businesses. The borough is home to several small businesses, including restaurants, retail stores, and professional services. The borough also has a thriving fishing industry, and is home to several marinas and boatyards.
The borough is also home to several large employers, including the Monmouth County Park System, the Monmouth County Sheriff’s Office, and the Monmouth County Board of Social Services.
Demographics
As of the 2010 census, the population of Union Beach was 6,245. The racial makeup of the borough was 87.3% White, 5.2% African American, 0.3% Native American, 2.2% Asian, and 4.0% from other races. Hispanic or Latino of any race were 8.7% of the population.
The median household income in Union Beach was $60,938, and the median family income was $68,958. The per capita income for the borough was $27,945.
Conclusion
Union Beach is a small borough located in Monmouth County, New Jersey. It is situated on the Raritan Bay, just south of the Raritan River. The borough is part of the Bayshore region of New Jersey, and is home to a population of approximately 6,000 people. The borough is known for its strong sense of community and its commitment to preserving its unique history and culture. The borough’s economy is largely based on tourism and small businesses, and it is home to several large employers. The population of Union Beach is largely white, with a small percentage of African American, Native American, Asian, and other races. The median household income in Union Beach is $60,938, and the median family income is $68,958.
Common Questions
What is Per Capita Income in Union Beach borough?
Per Capita income in Union Beach borough is $52,199.
What is the Median Family Income in Union Beach borough?
Median Family Income in Union Beach borough is $143,077.
What is the Median Household income in Union Beach borough?
Median Household Income in Union Beach borough is $124,828.
What is Income or Wage Gap in Union Beach borough?
Income or Wage Gap in Union Beach borough is 26.3%.
Women in Union Beach borough earn 73.7 cents for every dollar earned by a man.
What is Inequality or Gini Index in Union Beach borough?
Inequality or Gini Index in Union Beach borough is 0.34.
What is the Total Population of Union Beach borough?
Total Population of Union Beach borough is 5,751.
What is the Total Male Population of Union Beach borough?
Total Male Population of Union Beach borough is 3,043.
What is the Total Female Population of Union Beach borough?
Total Female Population of Union Beach borough is 2,708.
What is the Ratio of Males per 100 Females in Union Beach borough?
There are 112.37 Males per 100 Females in Union Beach borough.
What is the Ratio of Females per 100 Males in Union Beach borough?
There are 88.99 Females per 100 Males in Union Beach borough.
What is the Median Population Age in Union Beach borough?
Median Population Age in Union Beach borough is 43.8 Years.
What is the Average Family Size in Union Beach borough
Average Family Size in Union Beach borough is 3.3 People.
What is the Average Household Size in Union Beach borough
Average Household Size in Union Beach borough is 2.9 People.
How Large is the Labor Force in Union Beach borough?
There are 3,718 People in the Labor Forcein in Union Beach borough.
What is the Percentage of People in the Labor Force in Union Beach borough?
76.2% of People are in the Labor Force in Union Beach borough.
What is the Unemployment Rate in Union Beach borough?
Unemployment Rate in Union Beach borough is 3.6%.