Derry, NH Map & Demographics
Derry Map
Derry Overview
$42,114
PER CAPITA INCOME
$95,954
AVG FAMILY INCOME
$83,750
AVG HOUSEHOLD INCOME
41.0%
WAGE / INCOME GAP [ % ]
59.0¢/ $1
WAGE / INCOME GAP [ $ ]
$20,404
FAMILY INCOME DEFICIT
0.43
INEQUALITY / GINI INDEX
23,027
TOTAL POPULATION
10,561
MALE POPULATION
12,466
FEMALE POPULATION
84.72
MALES / 100 FEMALES
118.04
FEMALES / 100 MALES
39.0
MEDIAN AGE
3.0
AVG FAMILY SIZE
2.5
AVG HOUSEHOLD SIZE
12,988
LABOR FORCE [ PEOPLE ]
69.3%
PERCENT IN LABOR FORCE
5.4%
UNEMPLOYMENT RATE
Derry Zip Codes
Derry Area Codes
Income in Derry
Income Overview in Derry
Per Capita Income in Derry is $42,114, while median incomes of families and households are $95,954 and $83,750 respectively.
| Characteristic | Number | Measure |
| Per Capita Income | 23,027 | $42,114 |
| Median Family Income | 6,123 | $95,954 |
| Mean Family Income | 6,123 | $116,614 |
| Median Household Income | 9,275 | $83,750 |
| Mean Household Income | 9,275 | $103,141 |
| Income Deficit | 6,123 | $20,404 |
| Wage / Income Gap (%) | 23,027 | 41.02% |
| Wage / Income Gap ($) | 23,027 | 58.98¢ per $1 |
| Gini / Inequality Index | 23,027 | 0.43 |
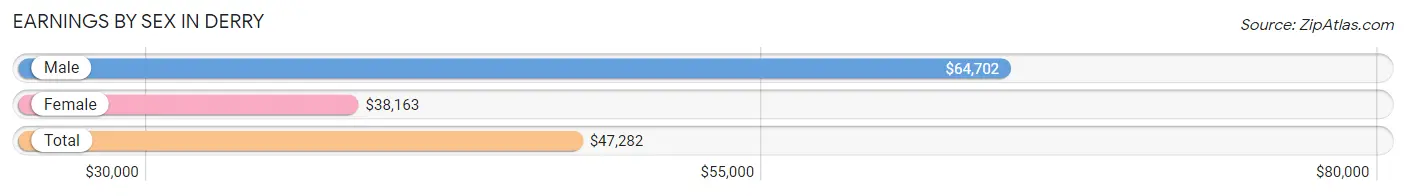
Earnings by Sex in Derry
Average Earnings in Derry are $47,282, $64,702 for men and $38,163 for women, a difference of 41.0%.
| Sex | Number | Average Earnings |
| Male | 6,335 (46.5%) | $64,702 |
| Female | 7,277 (53.5%) | $38,163 |
| Total | 13,612 (100.0%) | $47,282 |
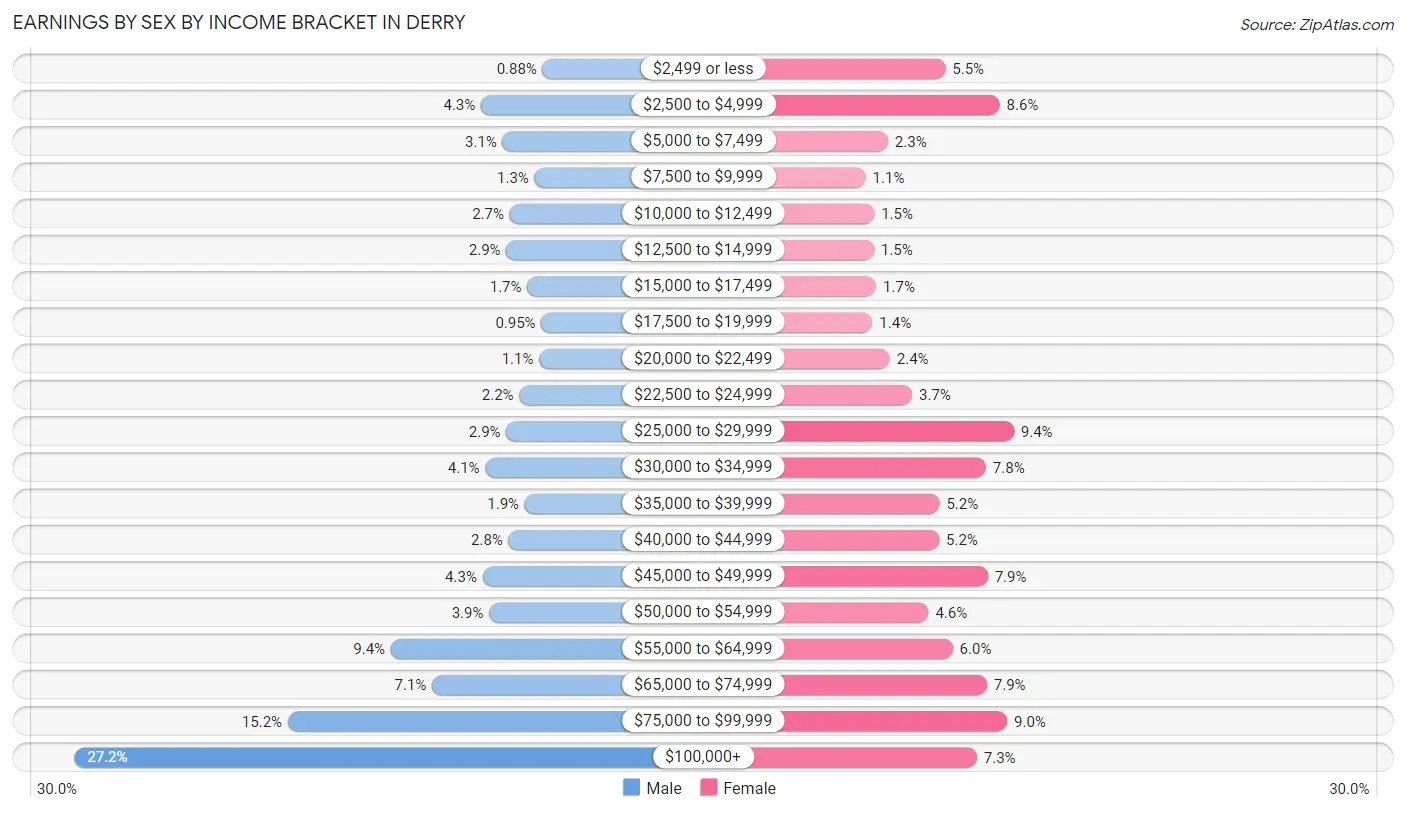
Earnings by Sex by Income Bracket in Derry
The most common earnings brackets in Derry are $100,000+ for men (1,723 | 27.2%) and $25,000 to $29,999 for women (683 | 9.4%).
| Income | Male | Female |
| $2,499 or less | 56 (0.9%) | 403 (5.5%) |
| $2,500 to $4,999 | 275 (4.3%) | 625 (8.6%) |
| $5,000 to $7,499 | 198 (3.1%) | 168 (2.3%) |
| $7,500 to $9,999 | 84 (1.3%) | 77 (1.1%) |
| $10,000 to $12,499 | 173 (2.7%) | 112 (1.5%) |
| $12,500 to $14,999 | 185 (2.9%) | 111 (1.5%) |
| $15,000 to $17,499 | 110 (1.7%) | 120 (1.7%) |
| $17,500 to $19,999 | 60 (0.9%) | 105 (1.4%) |
| $20,000 to $22,499 | 68 (1.1%) | 176 (2.4%) |
| $22,500 to $24,999 | 139 (2.2%) | 267 (3.7%) |
| $25,000 to $29,999 | 185 (2.9%) | 683 (9.4%) |
| $30,000 to $34,999 | 260 (4.1%) | 569 (7.8%) |
| $35,000 to $39,999 | 119 (1.9%) | 379 (5.2%) |
| $40,000 to $44,999 | 177 (2.8%) | 378 (5.2%) |
| $45,000 to $49,999 | 269 (4.3%) | 576 (7.9%) |
| $50,000 to $54,999 | 246 (3.9%) | 334 (4.6%) |
| $55,000 to $64,999 | 596 (9.4%) | 433 (5.9%) |
| $65,000 to $74,999 | 449 (7.1%) | 573 (7.9%) |
| $75,000 to $99,999 | 963 (15.2%) | 656 (9.0%) |
| $100,000+ | 1,723 (27.2%) | 532 (7.3%) |
| Total | 6,335 (100.0%) | 7,277 (100.0%) |
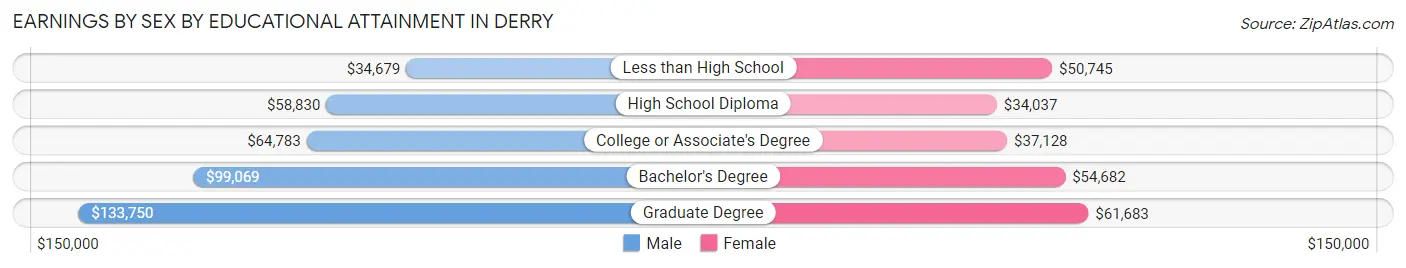
Earnings by Sex by Educational Attainment in Derry
Average earnings in Derry are $71,182 for men and $45,606 for women, a difference of 35.9%. Men with an educational attainment of graduate degree enjoy the highest average annual earnings of $133,750, while those with less than high school education earn the least with $34,679. Women with an educational attainment of graduate degree earn the most with the average annual earnings of $61,683, while those with high school diploma education have the smallest earnings of $34,037.
| Educational Attainment | Male Income | Female Income |
| Less than High School | $34,679 | $50,745 |
| High School Diploma | $58,830 | $34,037 |
| College or Associate's Degree | $64,783 | $37,128 |
| Bachelor's Degree | $99,069 | $54,682 |
| Graduate Degree | $133,750 | $61,683 |
| Total | $71,182 | $45,606 |
Family Income in Derry
Family Income Brackets in Derry
According to the Derry family income data, there are 1,359 families falling into the $100,000 to $149,999 income range, which is the most common income bracket and makes up 22.2% of all families. Conversely, the $10,000 to $14,999 income bracket is the least frequent group with only 73 families (1.2%) belonging to this category.
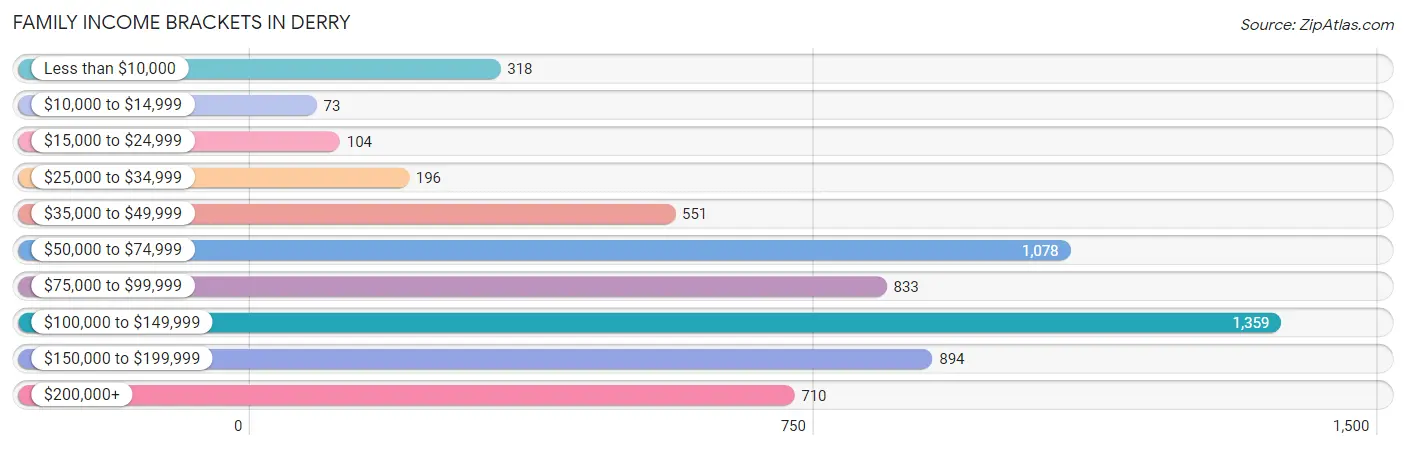
| Income Bracket | # Families | % Families |
| Less than $10,000 | 318 | 5.2% |
| $10,000 to $14,999 | 73 | 1.2% |
| $15,000 to $24,999 | 104 | 1.7% |
| $25,000 to $34,999 | 196 | 3.2% |
| $35,000 to $49,999 | 551 | 9.0% |
| $50,000 to $74,999 | 1,078 | 17.6% |
| $75,000 to $99,999 | 833 | 13.6% |
| $100,000 to $149,999 | 1,359 | 22.2% |
| $150,000 to $199,999 | 894 | 14.6% |
| $200,000+ | 710 | 11.6% |
Family Income by Famaliy Size in Derry
6-person families (104 | 1.7%) account for the highest median family income in Derry with $178,854 per family, while 2-person families (3,115 | 50.9%) have the highest median income of $39,602 per family member.
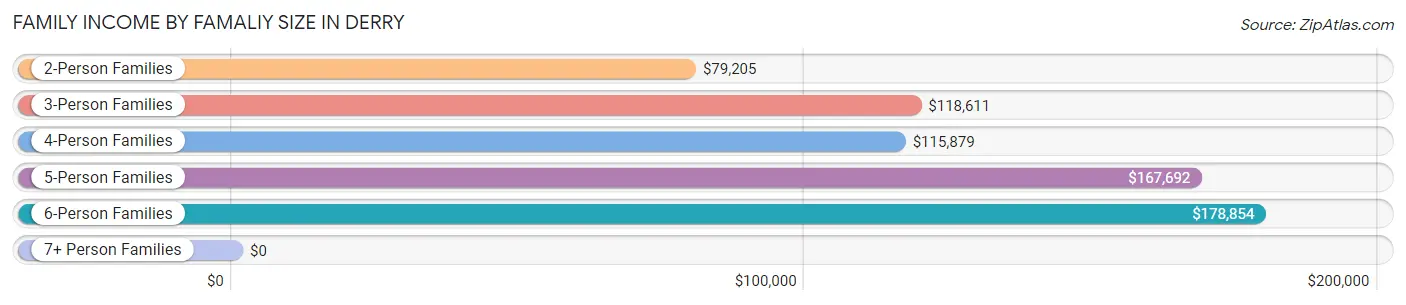
| Income Bracket | # Families | Median Income |
| 2-Person Families | 3,115 (50.9%) | $79,205 |
| 3-Person Families | 1,334 (21.8%) | $118,611 |
| 4-Person Families | 1,086 (17.7%) | $115,879 |
| 5-Person Families | 358 (5.9%) | $167,692 |
| 6-Person Families | 104 (1.7%) | $178,854 |
| 7+ Person Families | 126 (2.1%) | $0 |
| Total | 6,123 (100.0%) | $95,954 |
Family Income by Number of Earners in Derry
The median family income in Derry is $95,954, with families comprising 3+ earners (881) having the highest median family income of $167,620, while families with no earners (792) have the lowest median family income of $48,382, accounting for 14.4% and 12.9% of families, respectively.
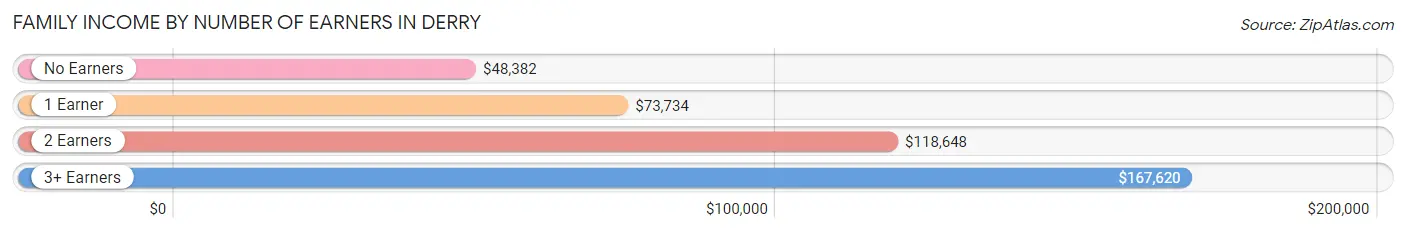
| Number of Earners | # Families | Median Income |
| No Earners | 792 (12.9%) | $48,382 |
| 1 Earner | 1,846 (30.1%) | $73,734 |
| 2 Earners | 2,604 (42.5%) | $118,648 |
| 3+ Earners | 881 (14.4%) | $167,620 |
| Total | 6,123 (100.0%) | $95,954 |
Household Income in Derry
Household Income Brackets in Derry
With 1,790 households falling in the category, the $100,000 to $149,999 income range is the most frequent in Derry, accounting for 19.3% of all households. In contrast, only 380 households (4.1%) fall into the $10,000 to $14,999 income bracket, making it the least populous group.
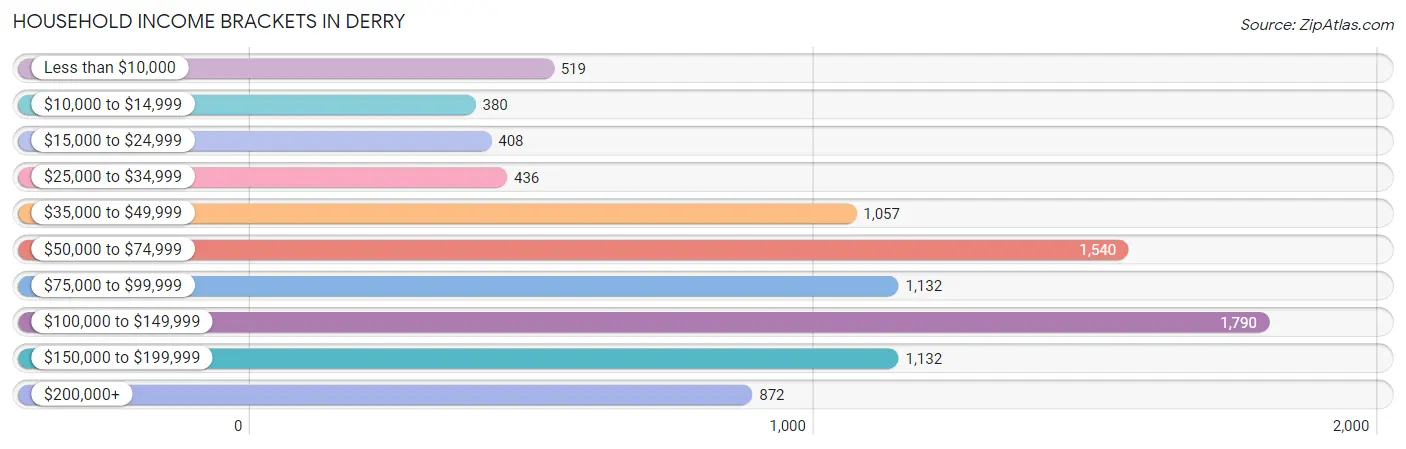
| Income Bracket | # Households | % Households |
| Less than $10,000 | 519 | 5.6% |
| $10,000 to $14,999 | 380 | 4.1% |
| $15,000 to $24,999 | 408 | 4.4% |
| $25,000 to $34,999 | 436 | 4.7% |
| $35,000 to $49,999 | 1,057 | 11.4% |
| $50,000 to $74,999 | 1,540 | 16.6% |
| $75,000 to $99,999 | 1,132 | 12.2% |
| $100,000 to $149,999 | 1,790 | 19.3% |
| $150,000 to $199,999 | 1,132 | 12.2% |
| $200,000+ | 872 | 9.4% |
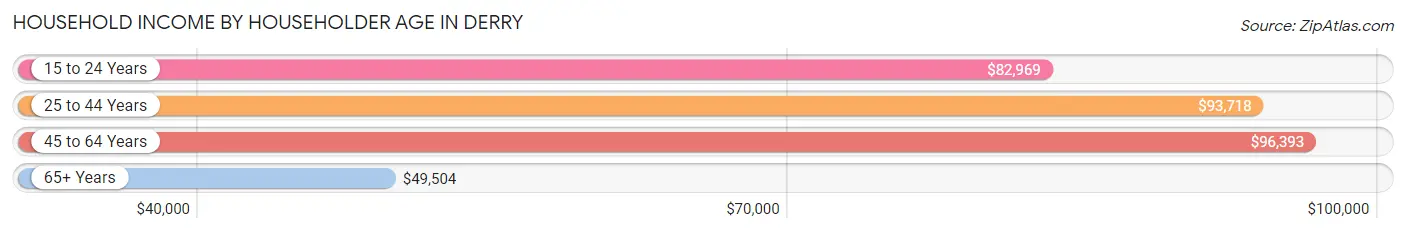
Household Income by Householder Age in Derry
The median household income in Derry is $83,750, with the highest median household income of $96,393 found in the 45 to 64 years age bracket for the primary householder. A total of 3,946 households (42.5%) fall into this category. Meanwhile, the 65+ years age bracket for the primary householder has the lowest median household income of $49,504, with 1,995 households (21.5%) in this group.
| Income Bracket | # Households | Median Income |
| 15 to 24 Years | 150 (1.6%) | $82,969 |
| 25 to 44 Years | 3,184 (34.3%) | $93,718 |
| 45 to 64 Years | 3,946 (42.5%) | $96,393 |
| 65+ Years | 1,995 (21.5%) | $49,504 |
| Total | 9,275 (100.0%) | $83,750 |
Poverty in Derry
Income Below Poverty by Sex and Age in Derry
With 5.9% poverty level for males and 13.3% for females among the residents of Derry, 12 to 14 year old males and 6 to 11 year old females are the most vulnerable to poverty, with 81 males (22.8%) and 373 females (48.9%) in their respective age groups living below the poverty level.
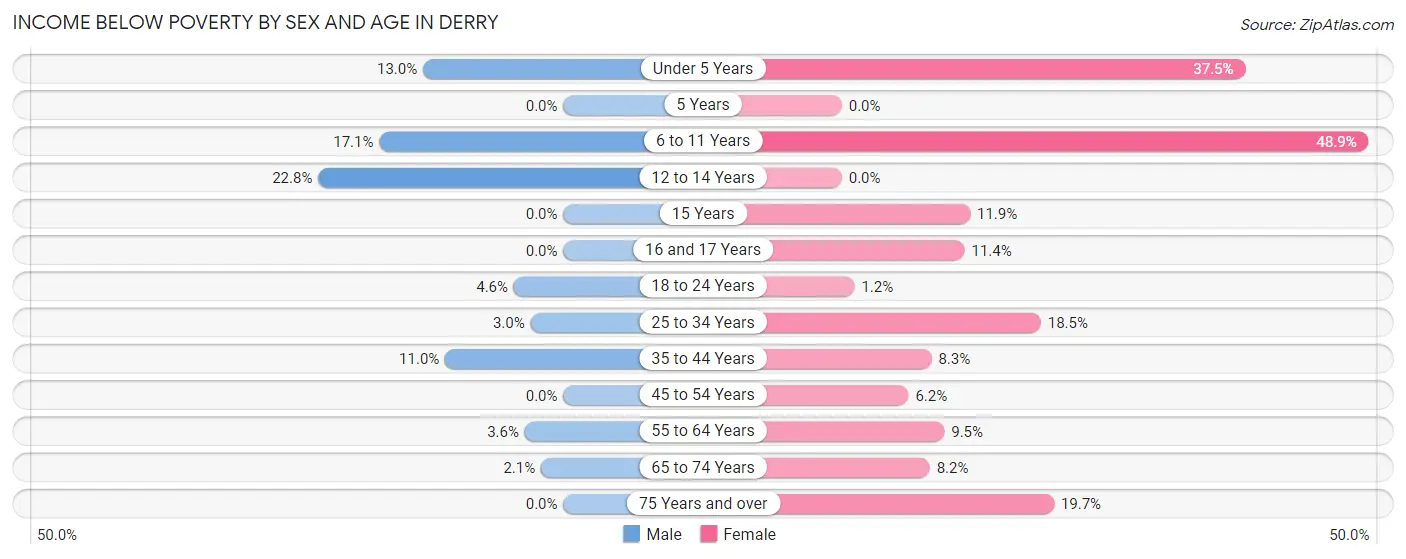
| Age Bracket | Male | Female |
| Under 5 Years | 110 (13.0%) | 188 (37.4%) |
| 5 Years | 0 (0.0%) | 0 (0.0%) |
| 6 to 11 Years | 90 (17.1%) | 373 (48.9%) |
| 12 to 14 Years | 81 (22.8%) | 0 (0.0%) |
| 15 Years | 0 (0.0%) | 25 (11.9%) |
| 16 and 17 Years | 0 (0.0%) | 41 (11.4%) |
| 18 to 24 Years | 32 (4.6%) | 15 (1.2%) |
| 25 to 34 Years | 52 (3.0%) | 335 (18.5%) |
| 35 to 44 Years | 172 (11.0%) | 128 (8.3%) |
| 45 to 54 Years | 0 (0.0%) | 106 (6.2%) |
| 55 to 64 Years | 59 (3.6%) | 181 (9.5%) |
| 65 to 74 Years | 19 (2.1%) | 80 (8.2%) |
| 75 Years and over | 0 (0.0%) | 152 (19.7%) |
| Total | 615 (5.9%) | 1,624 (13.3%) |
Income Above Poverty by Sex and Age in Derry
According to the poverty statistics in Derry, males aged 5 years and females aged 5 years are the age groups that are most secure financially, with 100.0% of males and 100.0% of females in these age groups living above the poverty line.
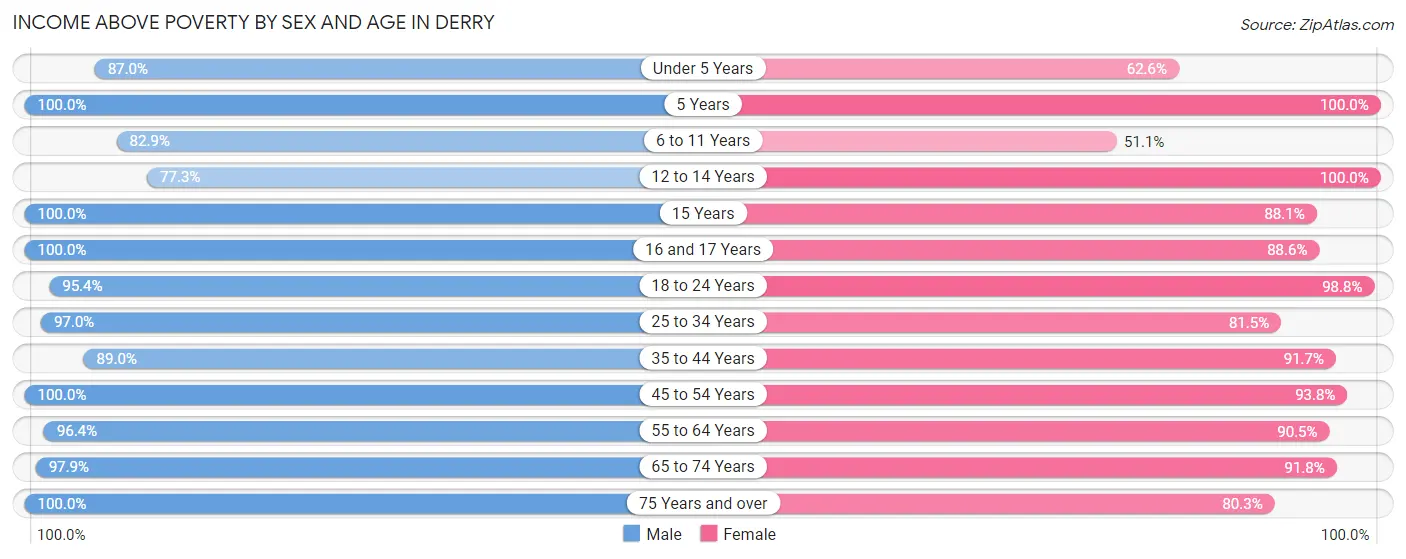
| Age Bracket | Male | Female |
| Under 5 Years | 735 (87.0%) | 314 (62.5%) |
| 5 Years | 56 (100.0%) | 83 (100.0%) |
| 6 to 11 Years | 437 (82.9%) | 390 (51.1%) |
| 12 to 14 Years | 275 (77.2%) | 322 (100.0%) |
| 15 Years | 507 (100.0%) | 185 (88.1%) |
| 16 and 17 Years | 196 (100.0%) | 319 (88.6%) |
| 18 to 24 Years | 665 (95.4%) | 1,253 (98.8%) |
| 25 to 34 Years | 1,656 (97.0%) | 1,479 (81.5%) |
| 35 to 44 Years | 1,396 (89.0%) | 1,411 (91.7%) |
| 45 to 54 Years | 1,152 (100.0%) | 1,606 (93.8%) |
| 55 to 64 Years | 1,587 (96.4%) | 1,723 (90.5%) |
| 65 to 74 Years | 898 (97.9%) | 900 (91.8%) |
| 75 Years and over | 316 (100.0%) | 620 (80.3%) |
| Total | 9,876 (94.1%) | 10,605 (86.7%) |
Income Below Poverty Among Married-Couple Families in Derry
The poverty statistics for married-couple families in Derry show that 2.9% or 122 of the total 4,278 families live below the poverty line. Families with 5 or more children have the highest poverty rate of 100.0%, comprising of 59 families. On the other hand, families with 3 or 4 children have the lowest poverty rate of 0.0%, which includes 0 families.
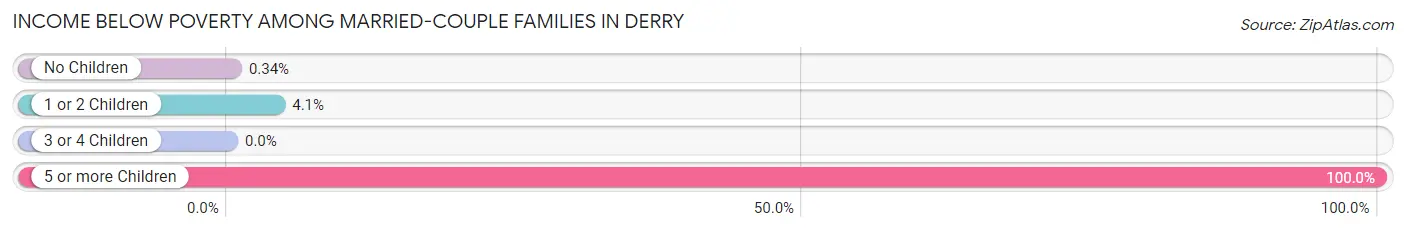
| Children | Above Poverty | Below Poverty |
| No Children | 2,659 (99.7%) | 9 (0.3%) |
| 1 or 2 Children | 1,261 (95.9%) | 54 (4.1%) |
| 3 or 4 Children | 236 (100.0%) | 0 (0.0%) |
| 5 or more Children | 0 (0.0%) | 59 (100.0%) |
| Total | 4,156 (97.2%) | 122 (2.9%) |
Income Below Poverty Among Single-Parent Households in Derry
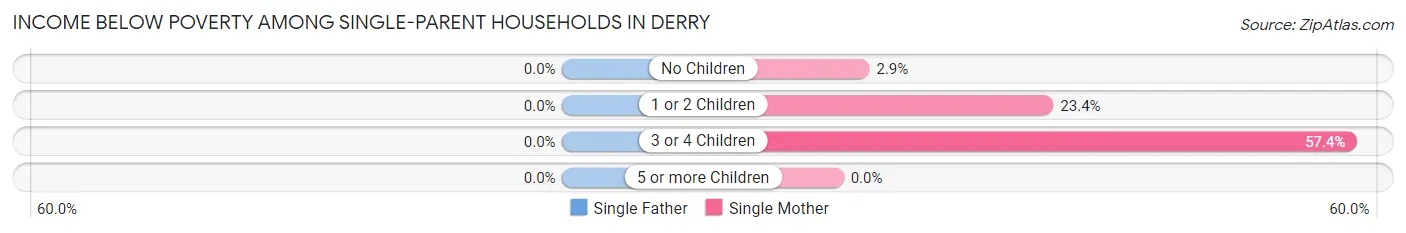
| Children | Single Father | Single Mother |
| No Children | 0 (0.0%) | 10 (2.9%) |
| 1 or 2 Children | 0 (0.0%) | 177 (23.4%) |
| 3 or 4 Children | 0 (0.0%) | 101 (57.4%) |
| 5 or more Children | 0 (0.0%) | 0 (0.0%) |
| Total | 0 (0.0%) | 288 (22.6%) |
Income Below Poverty Among Married-Couple vs Single-Parent Households in Derry
The poverty data for Derry shows that 122 of the married-couple family households (2.9%) and 288 of the single-parent households (15.6%) are living below the poverty level. Within the married-couple family households, those with 5 or more children have the highest poverty rate, with 59 households (100.0%) falling below the poverty line. Among the single-parent households, those with 3 or 4 children have the highest poverty rate, with 101 household (38.7%) living below poverty.
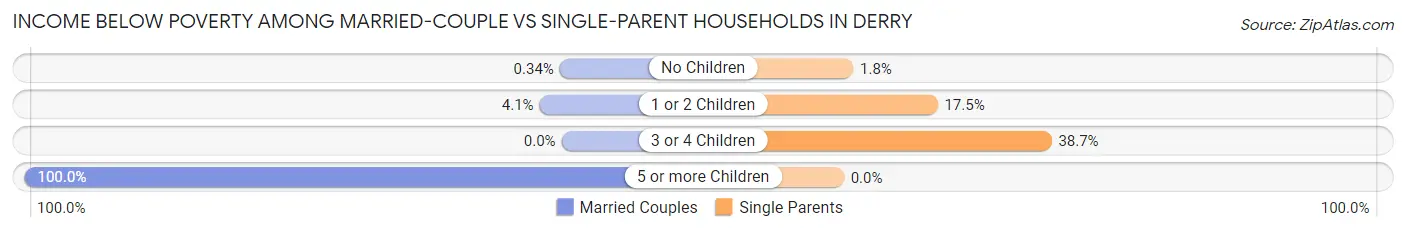
| Children | Married-Couple Families | Single-Parent Households |
| No Children | 9 (0.3%) | 10 (1.8%) |
| 1 or 2 Children | 54 (4.1%) | 177 (17.5%) |
| 3 or 4 Children | 0 (0.0%) | 101 (38.7%) |
| 5 or more Children | 59 (100.0%) | 0 (0.0%) |
| Total | 122 (2.9%) | 288 (15.6%) |
Race in Derry
The most populous races in Derry are White / Caucasian (21,194 | 92.0%), Hispanic or Latino (1,516 | 6.6%), and Two or more Races (805 | 3.5%).
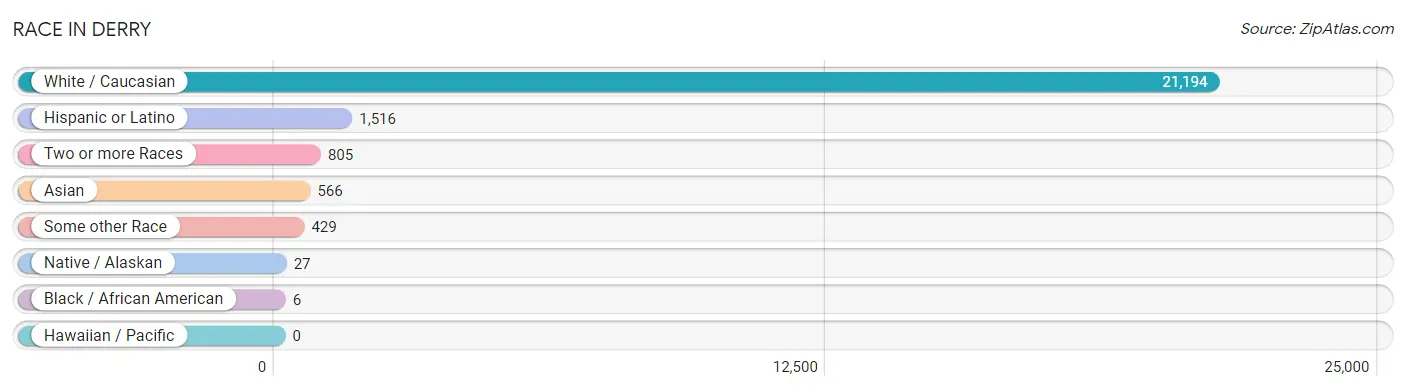
| Race | # Population | % Population |
| Asian | 566 | 2.5% |
| Black / African American | 6 | 0.0% |
| Hawaiian / Pacific | 0 | 0.0% |
| Hispanic or Latino | 1,516 | 6.6% |
| Native / Alaskan | 27 | 0.1% |
| White / Caucasian | 21,194 | 92.0% |
| Two or more Races | 805 | 3.5% |
| Some other Race | 429 | 1.9% |
| Total | 23,027 | 100.0% |
Ancestry in Derry
The most populous ancestries reported in Derry are Irish (6,533 | 28.4%), Italian (3,716 | 16.1%), English (3,515 | 15.3%), French (2,197 | 9.5%), and German (1,779 | 7.7%), together accounting for 77.0% of all Derry residents.
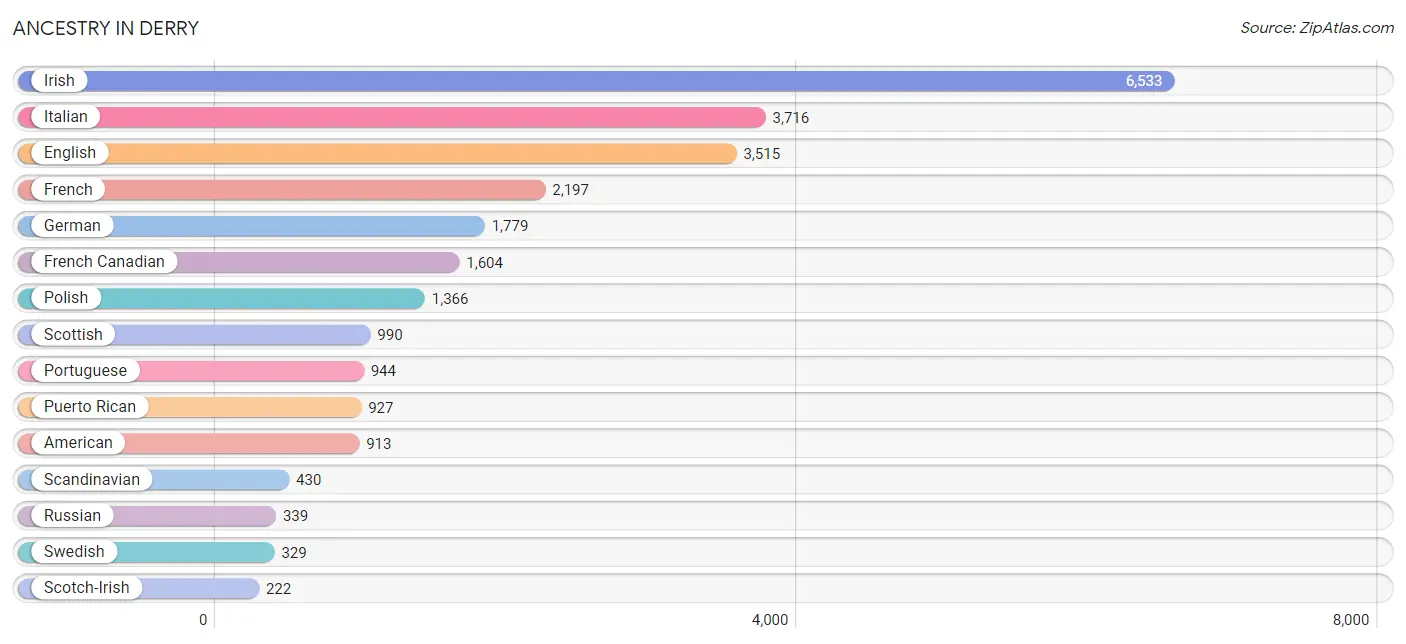
| Ancestry | # Population | % Population |
| American | 913 | 4.0% |
| Arab | 162 | 0.7% |
| Armenian | 154 | 0.7% |
| Austrian | 19 | 0.1% |
| Belgian | 18 | 0.1% |
| Bhutanese | 6 | 0.0% |
| Blackfeet | 14 | 0.1% |
| Brazilian | 83 | 0.4% |
| British | 51 | 0.2% |
| Burmese | 24 | 0.1% |
| Canadian | 171 | 0.7% |
| Central American | 98 | 0.4% |
| Cherokee | 25 | 0.1% |
| Cuban | 41 | 0.2% |
| Czech | 12 | 0.1% |
| Danish | 18 | 0.1% |
| Dominican | 176 | 0.8% |
| Dutch | 21 | 0.1% |
| English | 3,515 | 15.3% |
| Estonian | 13 | 0.1% |
| European | 150 | 0.6% |
| French | 2,197 | 9.5% |
| French Canadian | 1,604 | 7.0% |
| German | 1,779 | 7.7% |
| Greek | 206 | 0.9% |
| Haitian | 138 | 0.6% |
| Hungarian | 50 | 0.2% |
| Indian (Asian) | 214 | 0.9% |
| Iranian | 12 | 0.1% |
| Irish | 6,533 | 28.4% |
| Italian | 3,716 | 16.1% |
| Japanese | 159 | 0.7% |
| Laotian | 1 | 0.0% |
| Lebanese | 139 | 0.6% |
| Lithuanian | 85 | 0.4% |
| Mexican | 103 | 0.4% |
| Native Hawaiian | 20 | 0.1% |
| Nigerian | 1 | 0.0% |
| Northern European | 88 | 0.4% |
| Norwegian | 129 | 0.6% |
| Osage | 14 | 0.1% |
| Pakistani | 14 | 0.1% |
| Polish | 1,366 | 5.9% |
| Portuguese | 944 | 4.1% |
| Puerto Rican | 927 | 4.0% |
| Romanian | 86 | 0.4% |
| Russian | 339 | 1.5% |
| Salvadoran | 98 | 0.4% |
| Scandinavian | 430 | 1.9% |
| Scotch-Irish | 222 | 1.0% |
| Scottish | 990 | 4.3% |
| Spaniard | 19 | 0.1% |
| Spanish | 9 | 0.0% |
| Sri Lankan | 77 | 0.3% |
| Subsaharan African | 5 | 0.0% |
| Swedish | 329 | 1.4% |
| Swiss | 34 | 0.2% |
| Syrian | 74 | 0.3% |
| Thai | 219 | 0.9% |
| Turkish | 98 | 0.4% |
| Ukrainian | 79 | 0.3% |
| Welsh | 143 | 0.6% |
| Zimbabwean | 4 | 0.0% | View All 63 Rows |
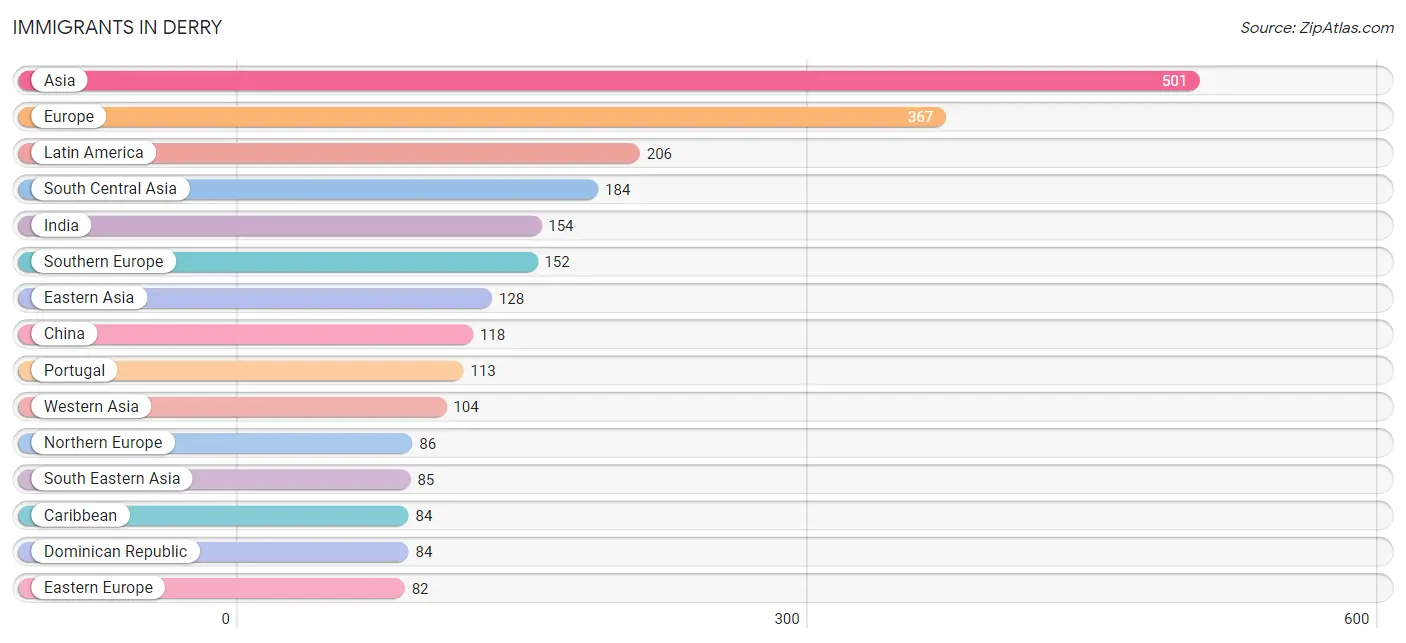
Immigrants in Derry
The most numerous immigrant groups reported in Derry came from Asia (501 | 2.2%), Europe (367 | 1.6%), Latin America (206 | 0.9%), South Central Asia (184 | 0.8%), and India (154 | 0.7%), together accounting for 6.1% of all Derry residents.
| Immigration Origin | # Population | % Population |
| Africa | 5 | 0.0% |
| Asia | 501 | 2.2% |
| Azores | 38 | 0.2% |
| Belgium | 18 | 0.1% |
| Brazil | 44 | 0.2% |
| Canada | 80 | 0.4% |
| Caribbean | 84 | 0.4% |
| Central America | 78 | 0.3% |
| China | 118 | 0.5% |
| Dominican Republic | 84 | 0.4% |
| Eastern Africa | 4 | 0.0% |
| Eastern Asia | 128 | 0.6% |
| Eastern Europe | 82 | 0.4% |
| El Salvador | 78 | 0.3% |
| England | 68 | 0.3% |
| Europe | 367 | 1.6% |
| Germany | 29 | 0.1% |
| Greece | 15 | 0.1% |
| Hong Kong | 14 | 0.1% |
| India | 154 | 0.7% |
| Italy | 5 | 0.0% |
| Japan | 6 | 0.0% |
| Korea | 4 | 0.0% |
| Latin America | 206 | 0.9% |
| Lebanon | 38 | 0.2% |
| Nigeria | 1 | 0.0% |
| Northern Europe | 86 | 0.4% |
| Poland | 28 | 0.1% |
| Portugal | 113 | 0.5% |
| Romania | 38 | 0.2% |
| Scotland | 18 | 0.1% |
| South America | 44 | 0.2% |
| South Central Asia | 184 | 0.8% |
| South Eastern Asia | 85 | 0.4% |
| Southern Europe | 152 | 0.7% |
| Spain | 19 | 0.1% |
| Thailand | 59 | 0.3% |
| Turkey | 66 | 0.3% |
| Ukraine | 16 | 0.1% |
| Uzbekistan | 30 | 0.1% |
| Vietnam | 26 | 0.1% |
| Western Africa | 1 | 0.0% |
| Western Asia | 104 | 0.4% |
| Western Europe | 47 | 0.2% |
| Zimbabwe | 4 | 0.0% | View All 45 Rows |
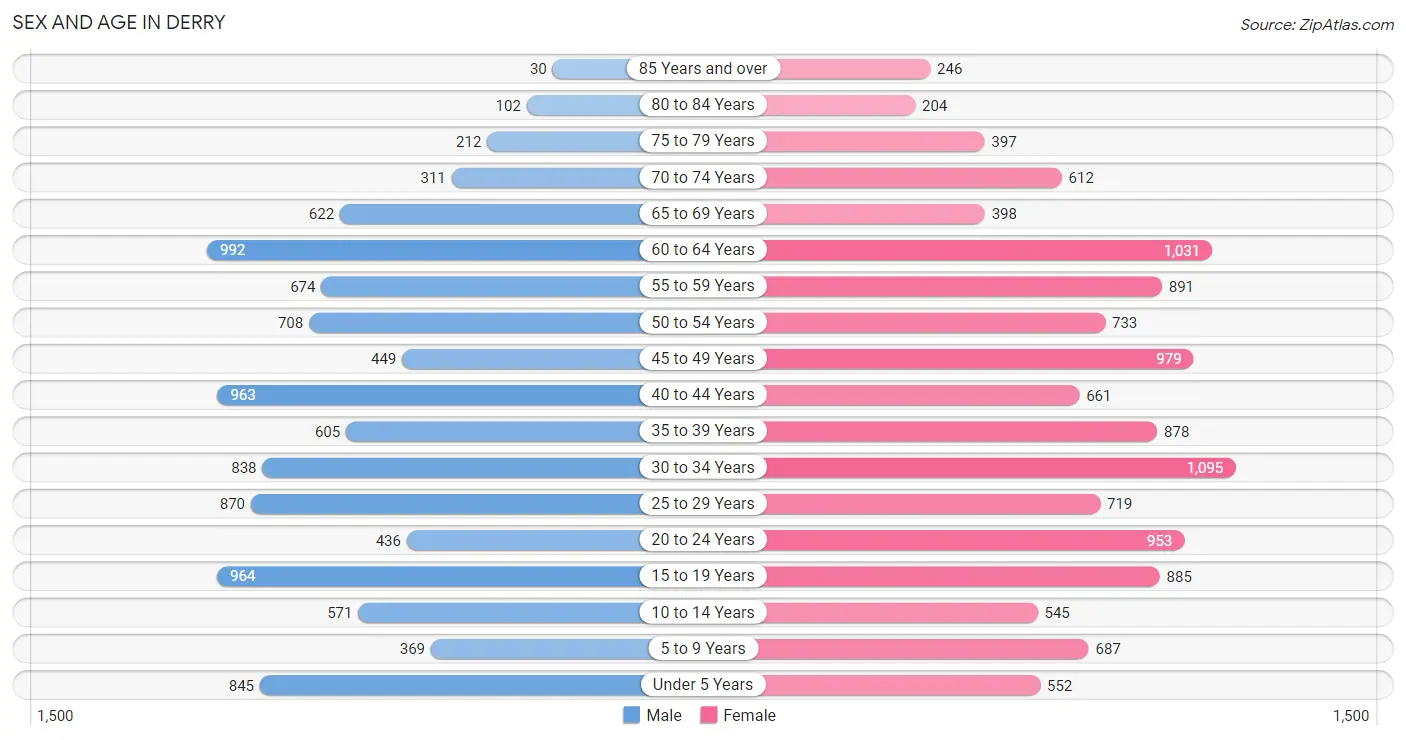
Sex and Age in Derry
Sex and Age in Derry
The most populous age groups in Derry are 60 to 64 Years (992 | 9.4%) for men and 30 to 34 Years (1,095 | 8.8%) for women.
| Age Bracket | Male | Female |
| Under 5 Years | 845 (8.0%) | 552 (4.4%) |
| 5 to 9 Years | 369 (3.5%) | 687 (5.5%) |
| 10 to 14 Years | 571 (5.4%) | 545 (4.4%) |
| 15 to 19 Years | 964 (9.1%) | 885 (7.1%) |
| 20 to 24 Years | 436 (4.1%) | 953 (7.6%) |
| 25 to 29 Years | 870 (8.2%) | 719 (5.8%) |
| 30 to 34 Years | 838 (7.9%) | 1,095 (8.8%) |
| 35 to 39 Years | 605 (5.7%) | 878 (7.0%) |
| 40 to 44 Years | 963 (9.1%) | 661 (5.3%) |
| 45 to 49 Years | 449 (4.3%) | 979 (7.9%) |
| 50 to 54 Years | 708 (6.7%) | 733 (5.9%) |
| 55 to 59 Years | 674 (6.4%) | 891 (7.1%) |
| 60 to 64 Years | 992 (9.4%) | 1,031 (8.3%) |
| 65 to 69 Years | 622 (5.9%) | 398 (3.2%) |
| 70 to 74 Years | 311 (2.9%) | 612 (4.9%) |
| 75 to 79 Years | 212 (2.0%) | 397 (3.2%) |
| 80 to 84 Years | 102 (1.0%) | 204 (1.6%) |
| 85 Years and over | 30 (0.3%) | 246 (2.0%) |
| Total | 10,561 (100.0%) | 12,466 (100.0%) |
Families and Households in Derry
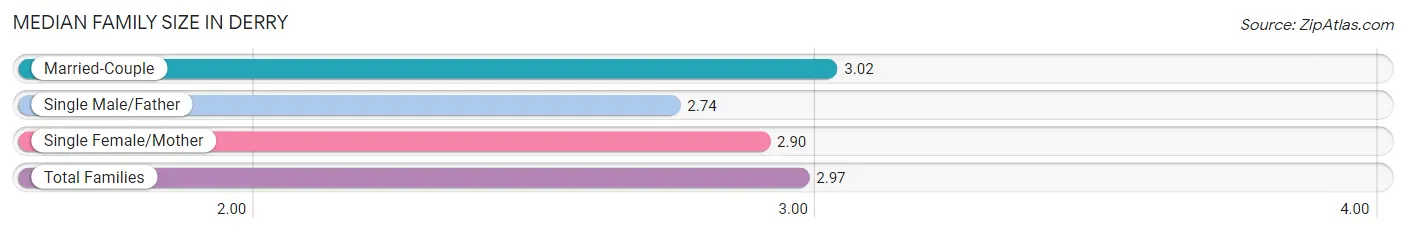
Median Family Size in Derry
The median family size in Derry is 2.97 persons per family, with married-couple families (4,278 | 69.9%) accounting for the largest median family size of 3.02 persons per family. On the other hand, single male/father families (568 | 9.3%) represent the smallest median family size with 2.74 persons per family.
| Family Type | # Families | Family Size |
| Married-Couple | 4,278 (69.9%) | 3.02 |
| Single Male/Father | 568 (9.3%) | 2.74 |
| Single Female/Mother | 1,277 (20.9%) | 2.90 |
| Total Families | 6,123 (100.0%) | 2.97 |
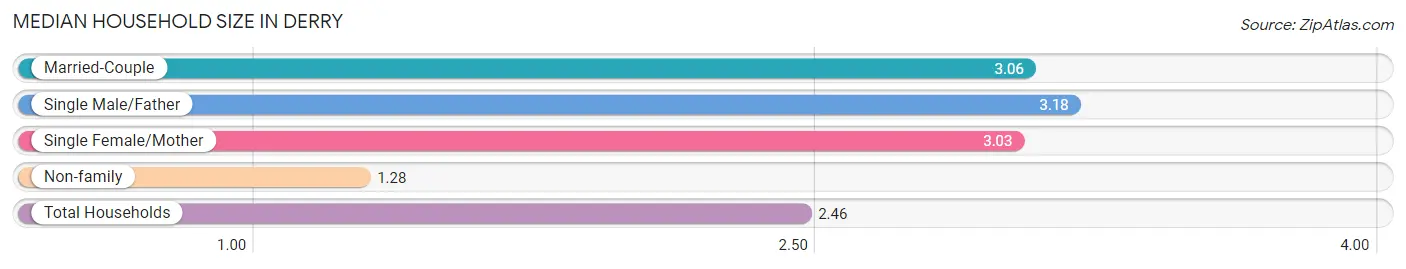
Median Household Size in Derry
The median household size in Derry is 2.46 persons per household, with single male/father households (568 | 6.1%) accounting for the largest median household size of 3.18 persons per household. non-family households (3,152 | 34.0%) represent the smallest median household size with 1.28 persons per household.
| Household Type | # Households | Household Size |
| Married-Couple | 4,278 (46.1%) | 3.06 |
| Single Male/Father | 568 (6.1%) | 3.18 |
| Single Female/Mother | 1,277 (13.8%) | 3.03 |
| Non-family | 3,152 (34.0%) | 1.28 |
| Total Households | 9,275 (100.0%) | 2.46 |
Household Size by Marriage Status in Derry
Out of a total of 9,275 households in Derry, 6,123 (66.0%) are family households, while 3,152 (34.0%) are nonfamily households. The most numerous type of family households are 2-person households, comprising 2,886, and the most common type of nonfamily households are 1-person households, comprising 2,447.
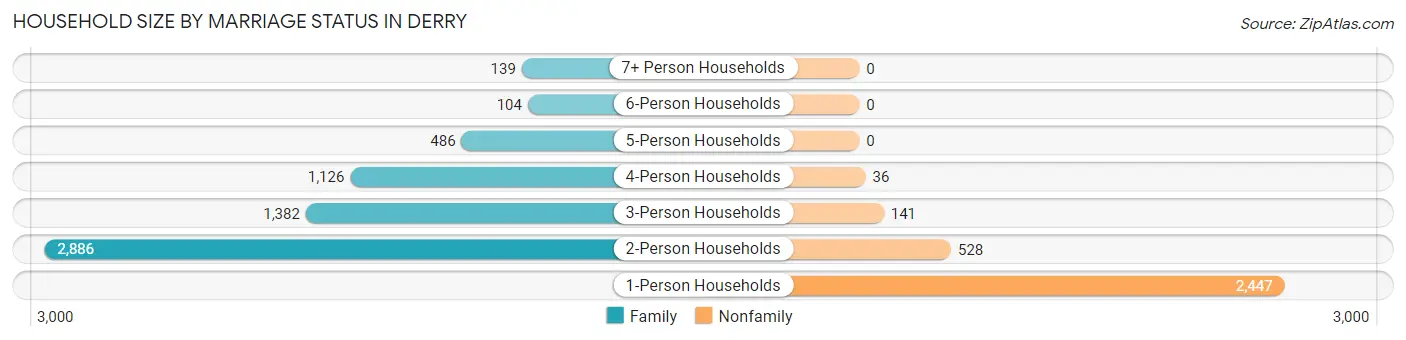
| Household Size | Family Households | Nonfamily Households |
| 1-Person Households | - | 2,447 (26.4%) |
| 2-Person Households | 2,886 (31.1%) | 528 (5.7%) |
| 3-Person Households | 1,382 (14.9%) | 141 (1.5%) |
| 4-Person Households | 1,126 (12.1%) | 36 (0.4%) |
| 5-Person Households | 486 (5.2%) | 0 (0.0%) |
| 6-Person Households | 104 (1.1%) | 0 (0.0%) |
| 7+ Person Households | 139 (1.5%) | 0 (0.0%) |
| Total | 6,123 (66.0%) | 3,152 (34.0%) |
Female Fertility in Derry
Fertility by Age in Derry
Average fertility rate in Derry is 41.0 births per 1,000 women. Women in the age bracket of 20 to 34 years have the highest fertility rate with 55.0 births per 1,000 women. Women in the age bracket of 20 to 34 years acount for 58.7% of all women with births.
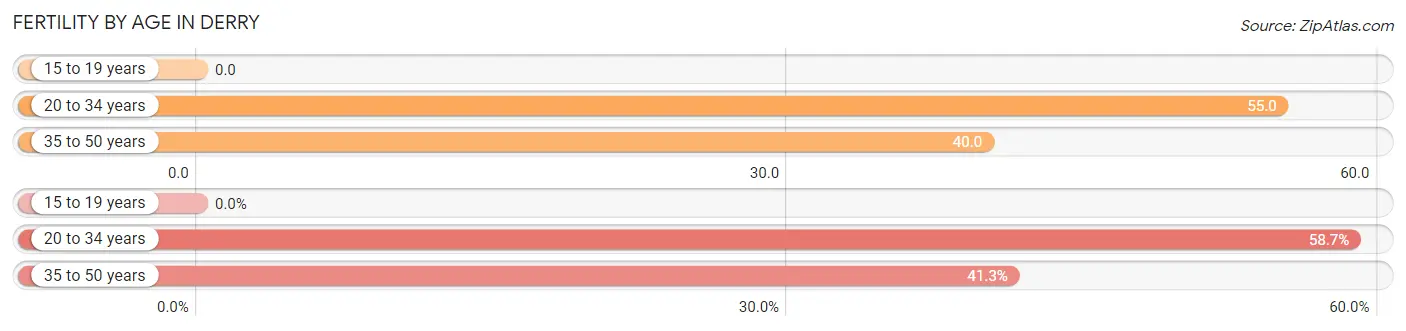
| Age Bracket | Women with Births | Births / 1,000 Women |
| 15 to 19 years | 0 (0.0%) | 0.0 |
| 20 to 34 years | 152 (58.7%) | 55.0 |
| 35 to 50 years | 107 (41.3%) | 40.0 |
| Total | 259 (100.0%) | 41.0 |
Fertility by Age by Marriage Status in Derry
78.0% of women with births (259) in Derry are married. The highest percentage of unmarried women with births falls into 20 to 34 years age bracket with 37.5% of them unmarried at the time of birth, while the lowest percentage of unmarried women with births belong to 35 to 50 years age bracket with 0.0% of them unmarried.
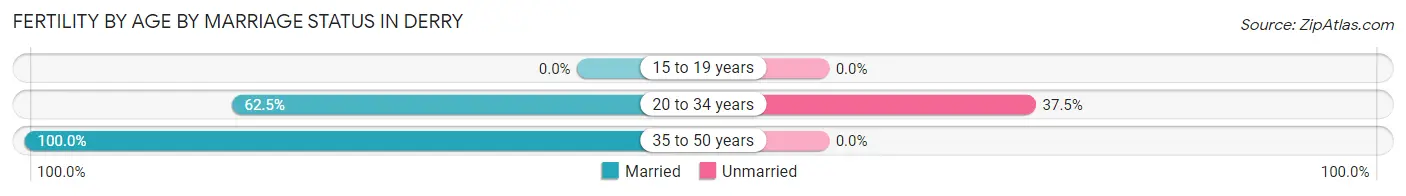
| Age Bracket | Married | Unmarried |
| 15 to 19 years | 0 (0.0%) | 0 (0.0%) |
| 20 to 34 years | 95 (62.5%) | 57 (37.5%) |
| 35 to 50 years | 107 (100.0%) | 0 (0.0%) |
| Total | 202 (78.0%) | 57 (22.0%) |
Fertility by Education in Derry
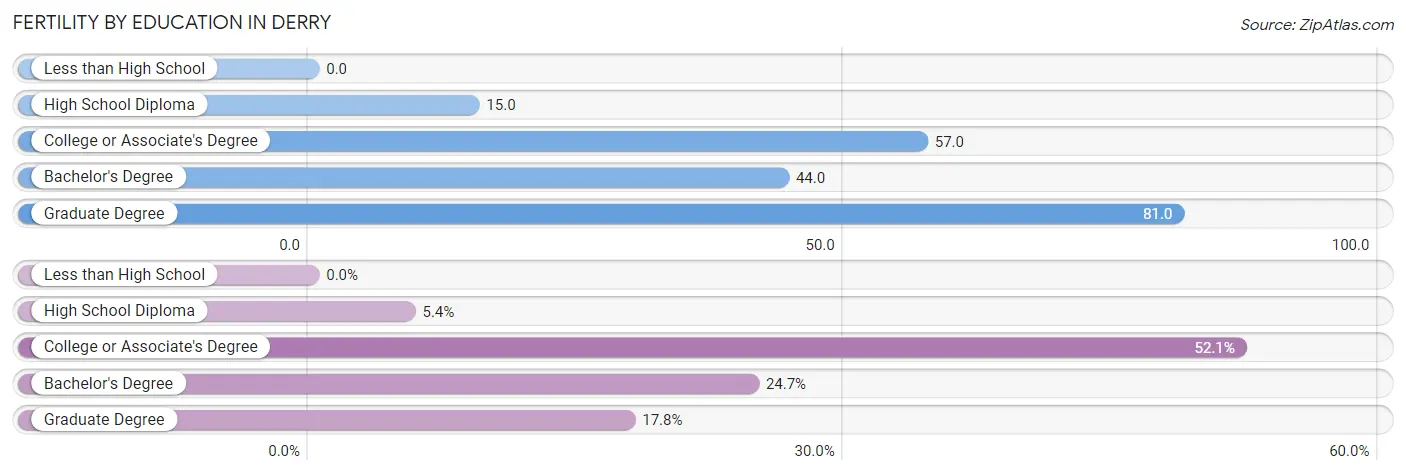
| Educational Attainment | Women with Births | Births / 1,000 Women |
| Less than High School | 0 (0.0%) | 0.0 |
| High School Diploma | 14 (5.4%) | 15.0 |
| College or Associate's Degree | 135 (52.1%) | 57.0 |
| Bachelor's Degree | 64 (24.7%) | 44.0 |
| Graduate Degree | 46 (17.8%) | 81.0 |
| Total | 259 (100.0%) | 41.0 |
Fertility by Education by Marriage Status in Derry
22.0% of women with births in Derry are unmarried. Women with the educational attainment of high school diploma are most likely to be married with 100.0% of them married at childbirth, while women with the educational attainment of college or associate's degree are least likely to be married with 34.8% of them unmarried at childbirth.
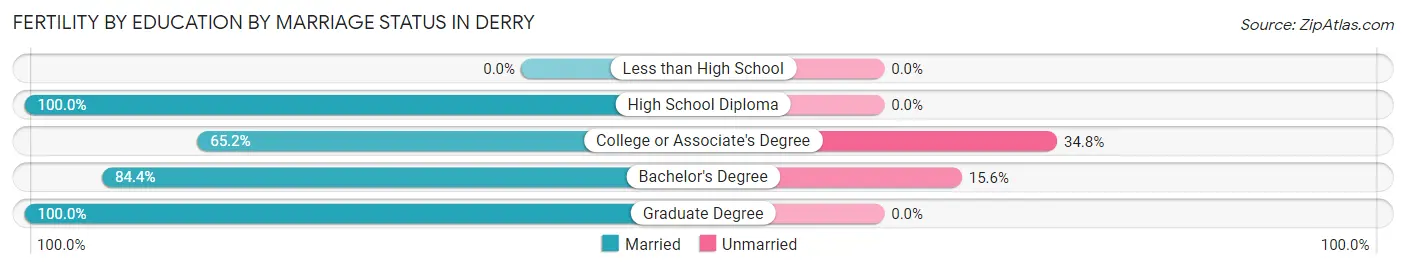
| Educational Attainment | Married | Unmarried |
| Less than High School | 0 (0.0%) | 0 (0.0%) |
| High School Diploma | 14 (100.0%) | 0 (0.0%) |
| College or Associate's Degree | 88 (65.2%) | 47 (34.8%) |
| Bachelor's Degree | 54 (84.4%) | 10 (15.6%) |
| Graduate Degree | 46 (100.0%) | 0 (0.0%) |
| Total | 202 (78.0%) | 57 (22.0%) |
Employment Characteristics in Derry
Employment by Class of Employer in Derry
Among the 12,039 employed individuals in Derry, private company employees (8,556 | 71.1%), not-for-profit organizations (1,073 | 8.9%), and local government employees (772 | 6.4%) make up the most common classes of employment.
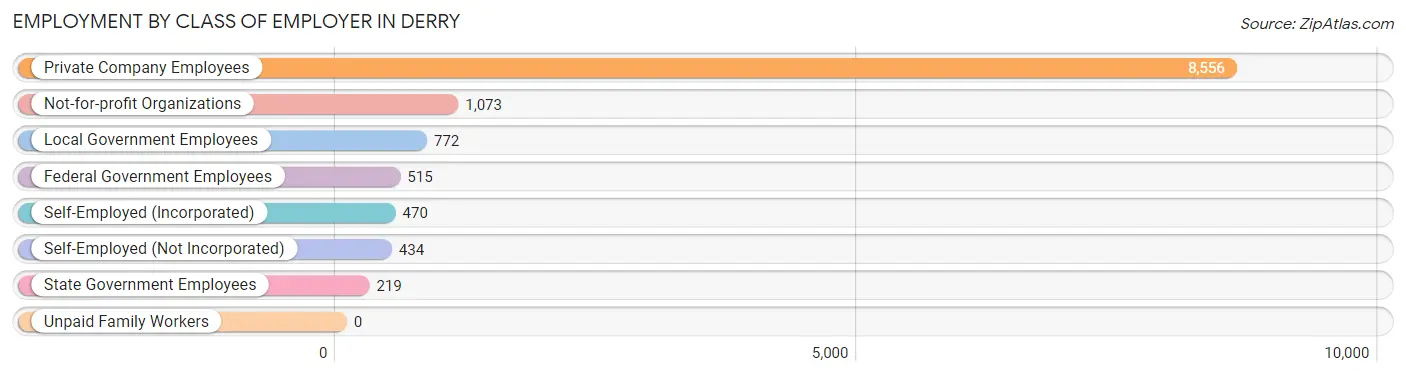
| Employer Class | # Employees | % Employees |
| Private Company Employees | 8,556 | 71.1% |
| Self-Employed (Incorporated) | 470 | 3.9% |
| Self-Employed (Not Incorporated) | 434 | 3.6% |
| Not-for-profit Organizations | 1,073 | 8.9% |
| Local Government Employees | 772 | 6.4% |
| State Government Employees | 219 | 1.8% |
| Federal Government Employees | 515 | 4.3% |
| Unpaid Family Workers | 0 | 0.0% |
| Total | 12,039 | 100.0% |
Employment Status by Age in Derry
According to the labor force statistics for Derry, out of the total population over 16 years of age (18,741), 69.3% or 12,988 individuals are in the labor force, with 5.4% or 701 of them unemployed. The age group with the highest labor force participation rate is 45 to 54 years, with 92.6% or 2,657 individuals in the labor force. Within the labor force, the 75 years and over age range has the highest percentage of unemployed individuals, with 17.6% or 31 of them being unemployed.
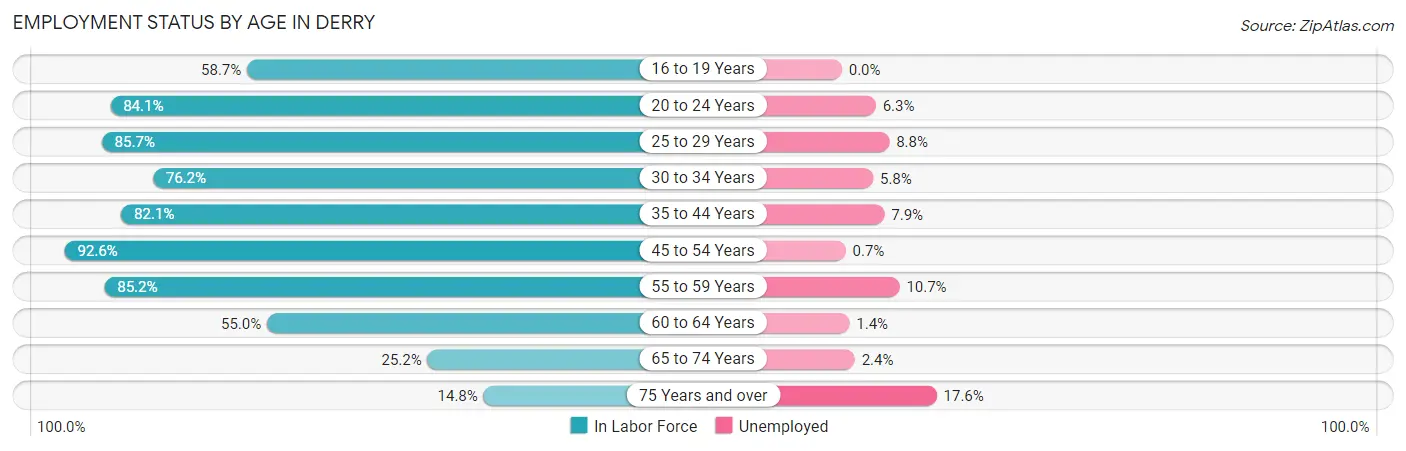
| Age Bracket | In Labor Force | Unemployed |
| 16 to 19 Years | 664 (58.7%) | 0 (0.0%) |
| 20 to 24 Years | 1,168 (84.1%) | 74 (6.3%) |
| 25 to 29 Years | 1,362 (85.7%) | 120 (8.8%) |
| 30 to 34 Years | 1,473 (76.2%) | 85 (5.8%) |
| 35 to 44 Years | 2,551 (82.1%) | 202 (7.9%) |
| 45 to 54 Years | 2,657 (92.6%) | 19 (0.7%) |
| 55 to 59 Years | 1,333 (85.2%) | 143 (10.7%) |
| 60 to 64 Years | 1,113 (55.0%) | 16 (1.4%) |
| 65 to 74 Years | 490 (25.2%) | 12 (2.4%) |
| 75 Years and over | 176 (14.8%) | 31 (17.6%) |
| Total | 12,988 (69.3%) | 701 (5.4%) |
Employment Status by Educational Attainment in Derry
According to labor force statistics for Derry, 80.1% of individuals (10,482) out of the total population between 25 and 64 years of age (13,086) are in the labor force, with 5.5% or 577 of them being unemployed. The group with the highest labor force participation rate are those with the educational attainment of bachelor's degree or higher, with 89.2% or 4,065 individuals in the labor force. Within the labor force, individuals with less than high school education have the highest percentage of unemployment, with 14.2% or 81 of them being unemployed.
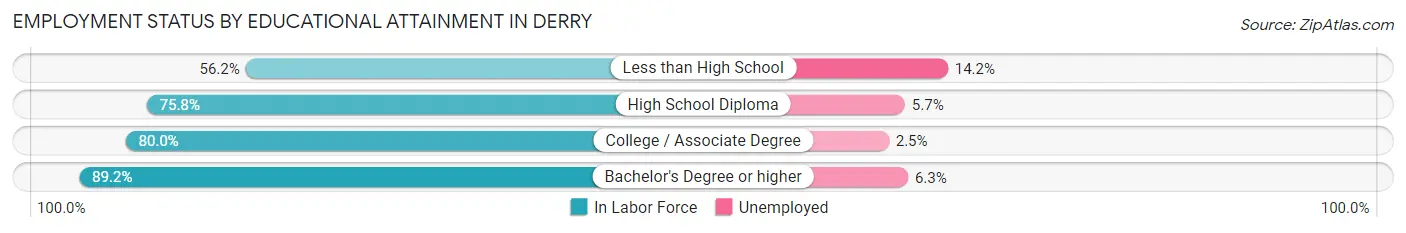
| Educational Attainment | In Labor Force | Unemployed |
| Less than High School | 569 (56.2%) | 144 (14.2%) |
| High School Diploma | 2,875 (75.8%) | 216 (5.7%) |
| College / Associate Degree | 2,978 (80.0%) | 93 (2.5%) |
| Bachelor's Degree or higher | 4,065 (89.2%) | 287 (6.3%) |
| Total | 10,482 (80.1%) | 720 (5.5%) |
Employment Occupations by Sex in Derry
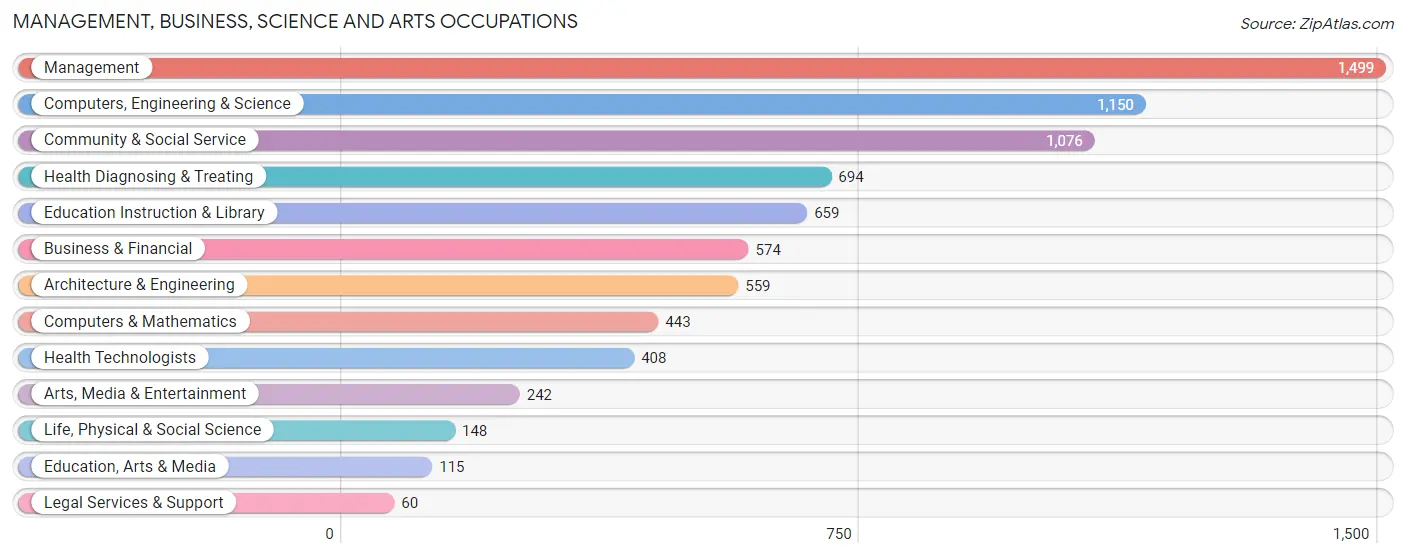
Management, Business, Science and Arts Occupations
The most common Management, Business, Science and Arts occupations in Derry are Management (1,499 | 12.2%), Computers, Engineering & Science (1,150 | 9.4%), Community & Social Service (1,076 | 8.8%), Health Diagnosing & Treating (694 | 5.7%), and Education Instruction & Library (659 | 5.4%).
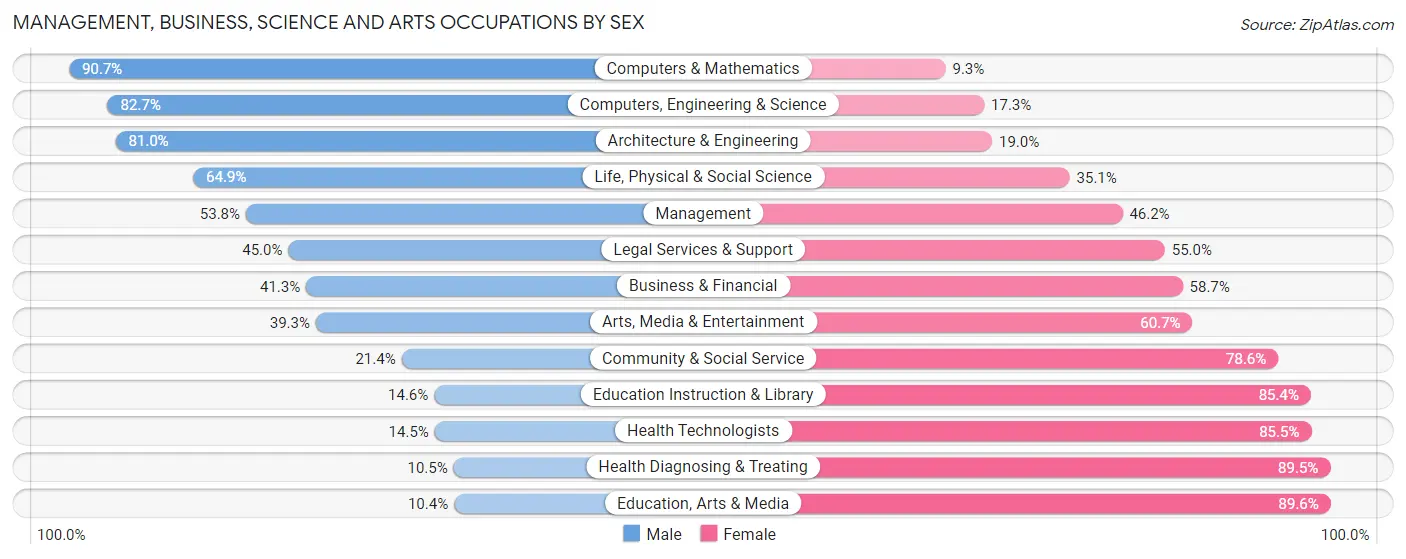
Management, Business, Science and Arts Occupations by Sex
Within the Management, Business, Science and Arts occupations in Derry, the most male-oriented occupations are Computers & Mathematics (90.7%), Computers, Engineering & Science (82.7%), and Architecture & Engineering (81.0%), while the most female-oriented occupations are Education, Arts & Media (89.6%), Health Diagnosing & Treating (89.5%), and Health Technologists (85.5%).
| Occupation | Male | Female |
| Management | 807 (53.8%) | 692 (46.2%) |
| Business & Financial | 237 (41.3%) | 337 (58.7%) |
| Computers, Engineering & Science | 951 (82.7%) | 199 (17.3%) |
| Computers & Mathematics | 402 (90.7%) | 41 (9.3%) |
| Architecture & Engineering | 453 (81.0%) | 106 (19.0%) |
| Life, Physical & Social Science | 96 (64.9%) | 52 (35.1%) |
| Community & Social Service | 230 (21.4%) | 846 (78.6%) |
| Education, Arts & Media | 12 (10.4%) | 103 (89.6%) |
| Legal Services & Support | 27 (45.0%) | 33 (55.0%) |
| Education Instruction & Library | 96 (14.6%) | 563 (85.4%) |
| Arts, Media & Entertainment | 95 (39.3%) | 147 (60.7%) |
| Health Diagnosing & Treating | 73 (10.5%) | 621 (89.5%) |
| Health Technologists | 59 (14.5%) | 349 (85.5%) |
| Total (Category) | 2,298 (46.0%) | 2,695 (54.0%) |
| Total (Overall) | 5,706 (46.6%) | 6,544 (53.4%) |
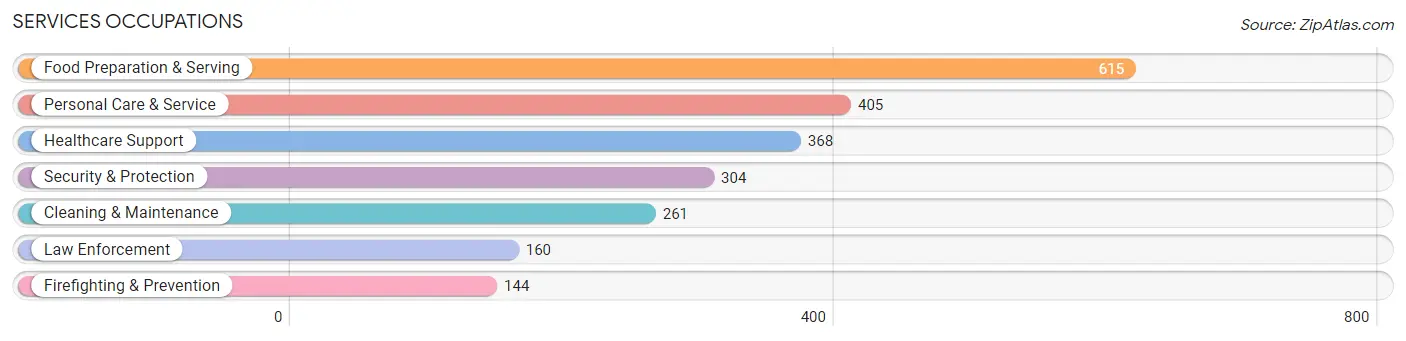
Services Occupations
The most common Services occupations in Derry are Food Preparation & Serving (615 | 5.0%), Personal Care & Service (405 | 3.3%), Healthcare Support (368 | 3.0%), Security & Protection (304 | 2.5%), and Cleaning & Maintenance (261 | 2.1%).
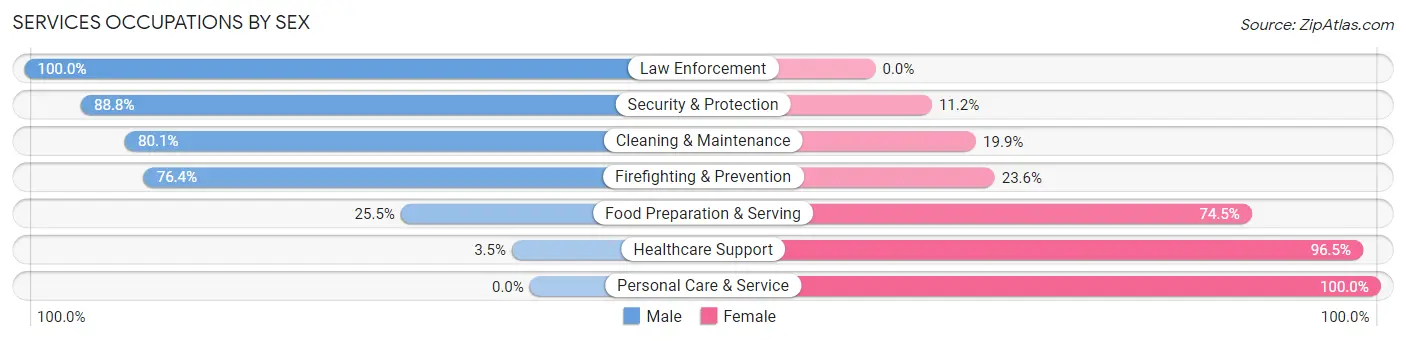
Services Occupations by Sex
Within the Services occupations in Derry, the most male-oriented occupations are Law Enforcement (100.0%), Security & Protection (88.8%), and Cleaning & Maintenance (80.1%), while the most female-oriented occupations are Personal Care & Service (100.0%), Healthcare Support (96.5%), and Food Preparation & Serving (74.5%).
| Occupation | Male | Female |
| Healthcare Support | 13 (3.5%) | 355 (96.5%) |
| Security & Protection | 270 (88.8%) | 34 (11.2%) |
| Firefighting & Prevention | 110 (76.4%) | 34 (23.6%) |
| Law Enforcement | 160 (100.0%) | 0 (0.0%) |
| Food Preparation & Serving | 157 (25.5%) | 458 (74.5%) |
| Cleaning & Maintenance | 209 (80.1%) | 52 (19.9%) |
| Personal Care & Service | 0 (0.0%) | 405 (100.0%) |
| Total (Category) | 649 (33.2%) | 1,304 (66.8%) |
| Total (Overall) | 5,706 (46.6%) | 6,544 (53.4%) |
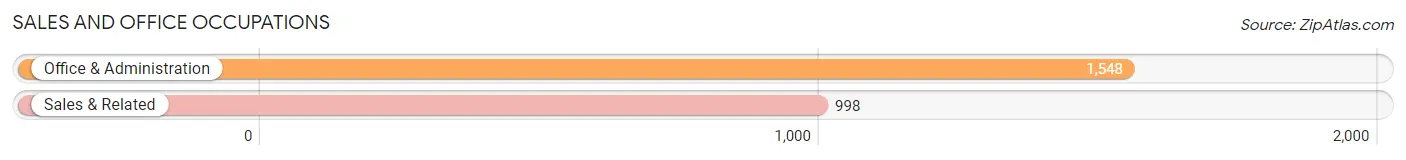
Sales and Office Occupations
The most common Sales and Office occupations in Derry are Office & Administration (1,548 | 12.6%), and Sales & Related (998 | 8.2%).
Sales and Office Occupations by Sex
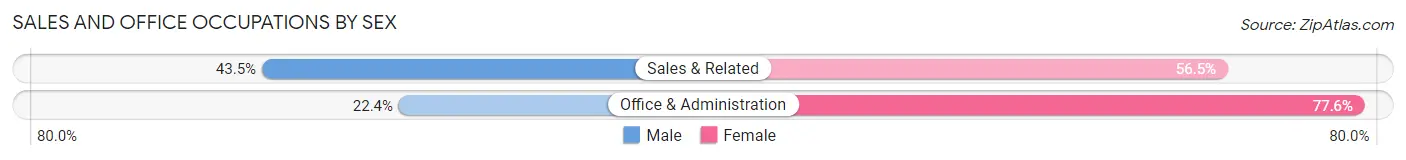
| Occupation | Male | Female |
| Sales & Related | 434 (43.5%) | 564 (56.5%) |
| Office & Administration | 347 (22.4%) | 1,201 (77.6%) |
| Total (Category) | 781 (30.7%) | 1,765 (69.3%) |
| Total (Overall) | 5,706 (46.6%) | 6,544 (53.4%) |
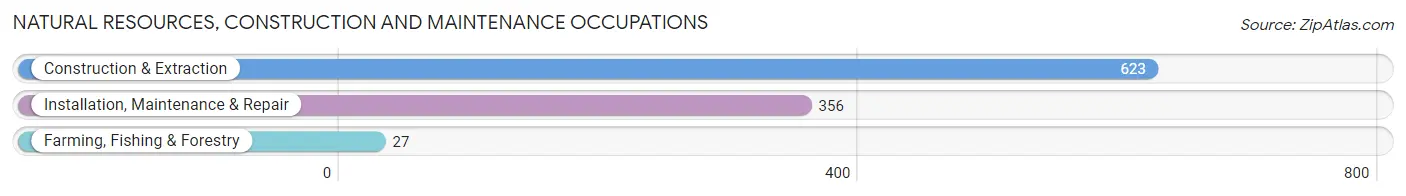
Natural Resources, Construction and Maintenance Occupations
The most common Natural Resources, Construction and Maintenance occupations in Derry are Construction & Extraction (623 | 5.1%), Installation, Maintenance & Repair (356 | 2.9%), and Farming, Fishing & Forestry (27 | 0.2%).
Natural Resources, Construction and Maintenance Occupations by Sex
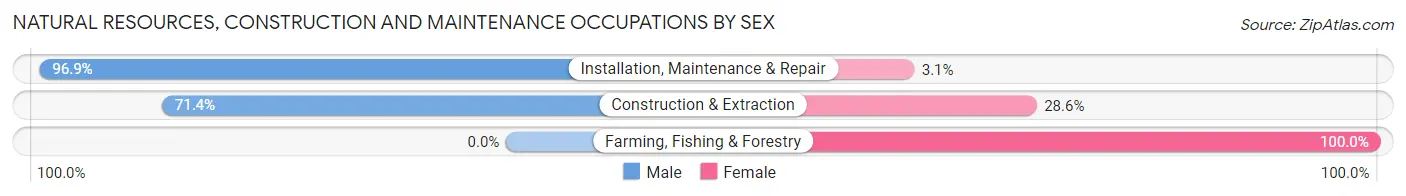
| Occupation | Male | Female |
| Farming, Fishing & Forestry | 0 (0.0%) | 27 (100.0%) |
| Construction & Extraction | 445 (71.4%) | 178 (28.6%) |
| Installation, Maintenance & Repair | 345 (96.9%) | 11 (3.1%) |
| Total (Category) | 790 (78.5%) | 216 (21.5%) |
| Total (Overall) | 5,706 (46.6%) | 6,544 (53.4%) |
Production, Transportation and Moving Occupations
The most common Production, Transportation and Moving occupations in Derry are Production (908 | 7.4%), Transportation (473 | 3.9%), and Material Moving (371 | 3.0%).
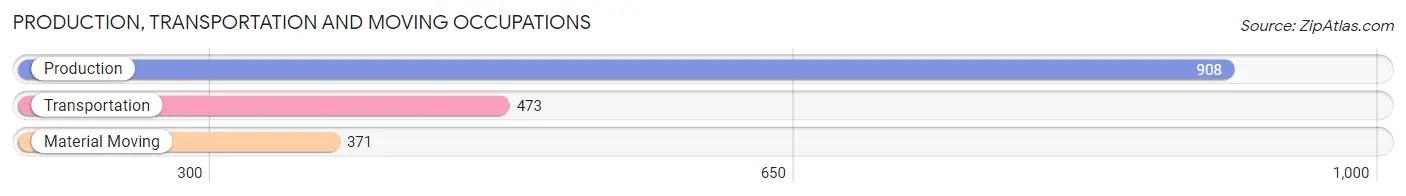
Production, Transportation and Moving Occupations by Sex
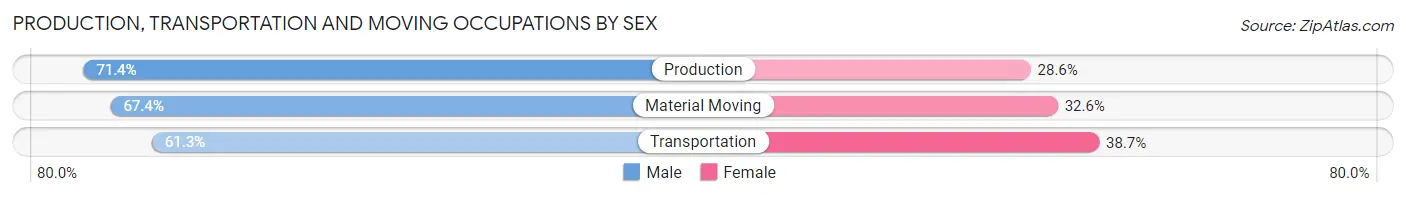
| Occupation | Male | Female |
| Production | 648 (71.4%) | 260 (28.6%) |
| Transportation | 290 (61.3%) | 183 (38.7%) |
| Material Moving | 250 (67.4%) | 121 (32.6%) |
| Total (Category) | 1,188 (67.8%) | 564 (32.2%) |
| Total (Overall) | 5,706 (46.6%) | 6,544 (53.4%) |
Employment Industries by Sex in Derry
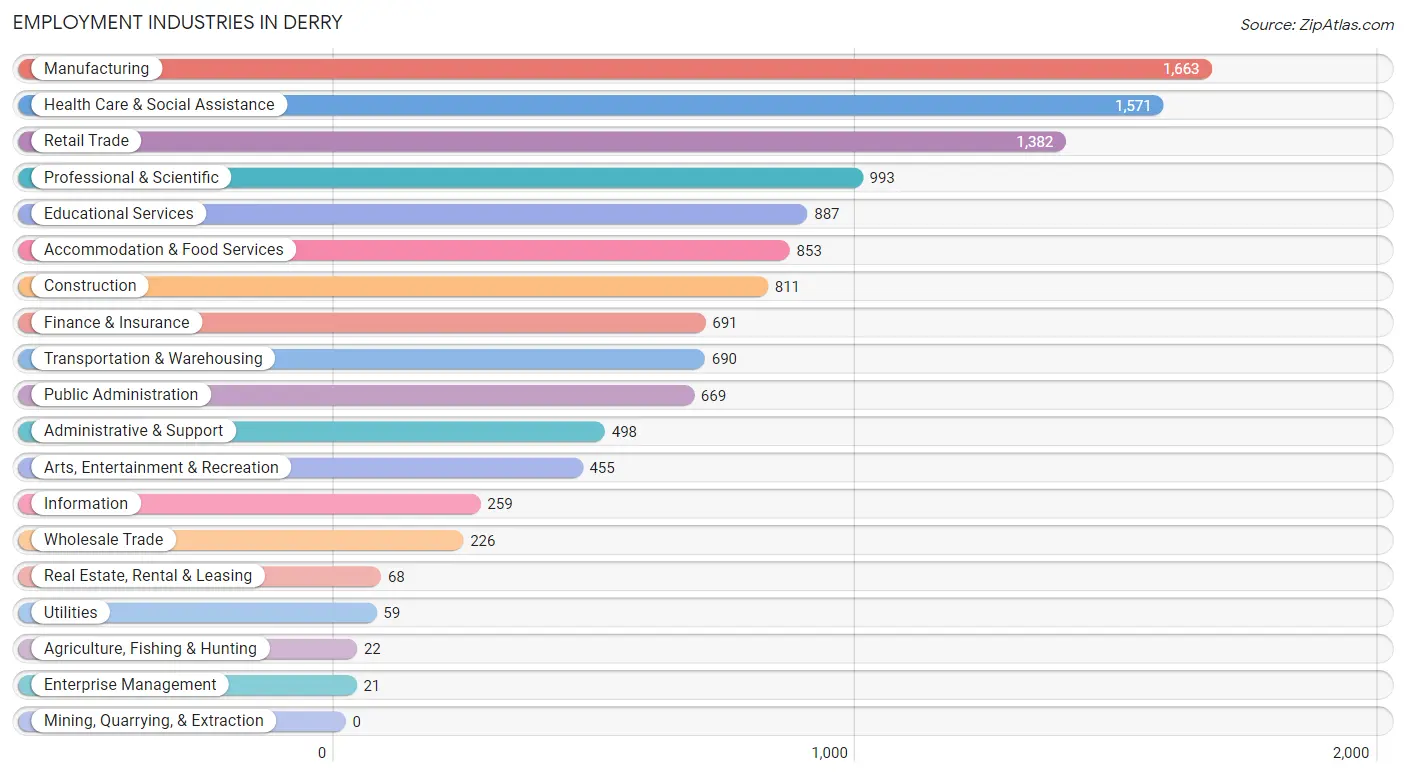
Employment Industries in Derry
The major employment industries in Derry include Manufacturing (1,663 | 13.6%), Health Care & Social Assistance (1,571 | 12.8%), Retail Trade (1,382 | 11.3%), Professional & Scientific (993 | 8.1%), and Educational Services (887 | 7.2%).
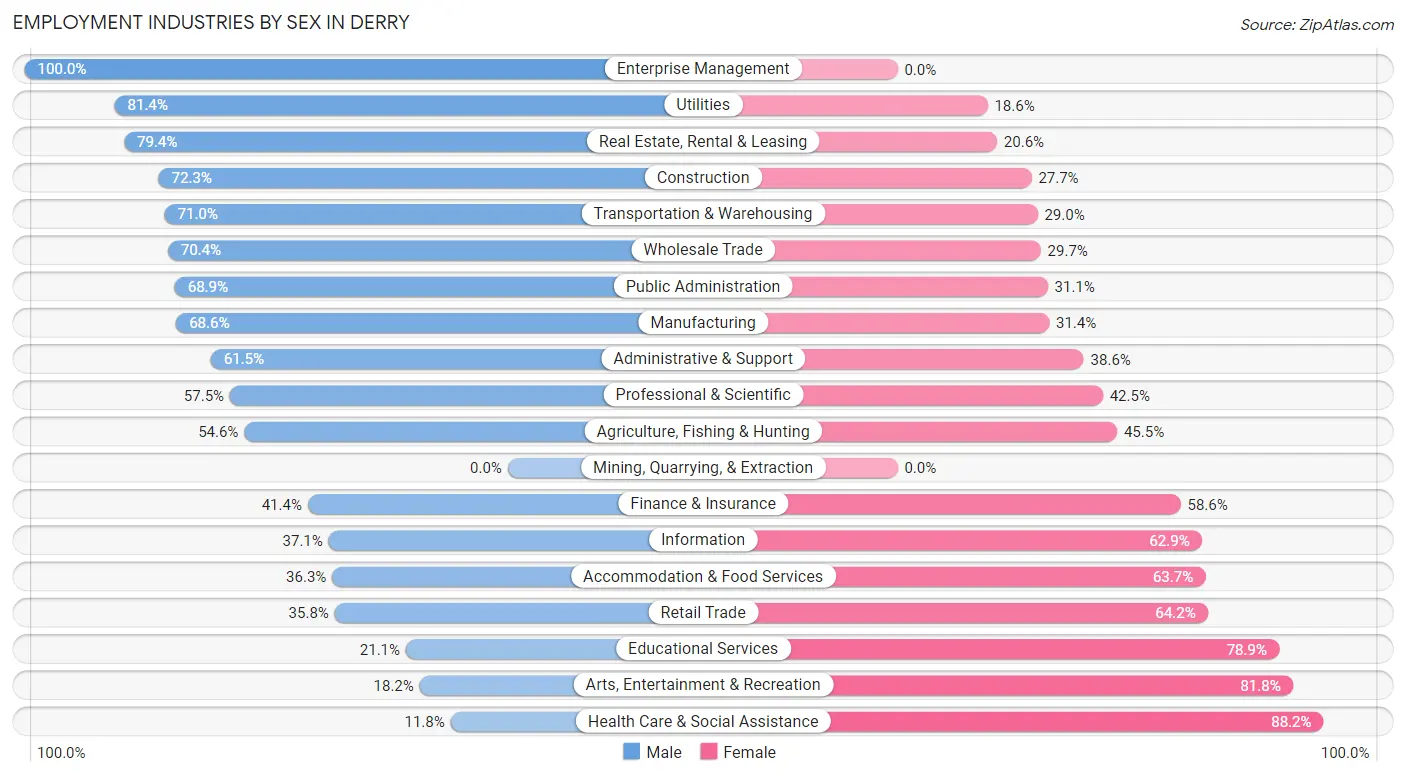
Employment Industries by Sex in Derry
The Derry industries that see more men than women are Enterprise Management (100.0%), Utilities (81.4%), and Real Estate, Rental & Leasing (79.4%), whereas the industries that tend to have a higher number of women are Health Care & Social Assistance (88.2%), Arts, Entertainment & Recreation (81.8%), and Educational Services (78.9%).
| Industry | Male | Female |
| Agriculture, Fishing & Hunting | 12 (54.5%) | 10 (45.5%) |
| Mining, Quarrying, & Extraction | 0 (0.0%) | 0 (0.0%) |
| Construction | 586 (72.3%) | 225 (27.7%) |
| Manufacturing | 1,141 (68.6%) | 522 (31.4%) |
| Wholesale Trade | 159 (70.4%) | 67 (29.6%) |
| Retail Trade | 495 (35.8%) | 887 (64.2%) |
| Transportation & Warehousing | 490 (71.0%) | 200 (29.0%) |
| Utilities | 48 (81.4%) | 11 (18.6%) |
| Information | 96 (37.1%) | 163 (62.9%) |
| Finance & Insurance | 286 (41.4%) | 405 (58.6%) |
| Real Estate, Rental & Leasing | 54 (79.4%) | 14 (20.6%) |
| Professional & Scientific | 571 (57.5%) | 422 (42.5%) |
| Enterprise Management | 21 (100.0%) | 0 (0.0%) |
| Administrative & Support | 306 (61.5%) | 192 (38.6%) |
| Educational Services | 187 (21.1%) | 700 (78.9%) |
| Health Care & Social Assistance | 186 (11.8%) | 1,385 (88.2%) |
| Arts, Entertainment & Recreation | 83 (18.2%) | 372 (81.8%) |
| Accommodation & Food Services | 310 (36.3%) | 543 (63.7%) |
| Public Administration | 461 (68.9%) | 208 (31.1%) |
| Total | 5,706 (46.6%) | 6,544 (53.4%) |
Education in Derry
School Enrollment in Derry
The most common levels of schooling among the 5,330 students in Derry are high school (1,640 | 30.8%), college / undergraduate (1,125 | 21.1%), and middle school (830 | 15.6%).
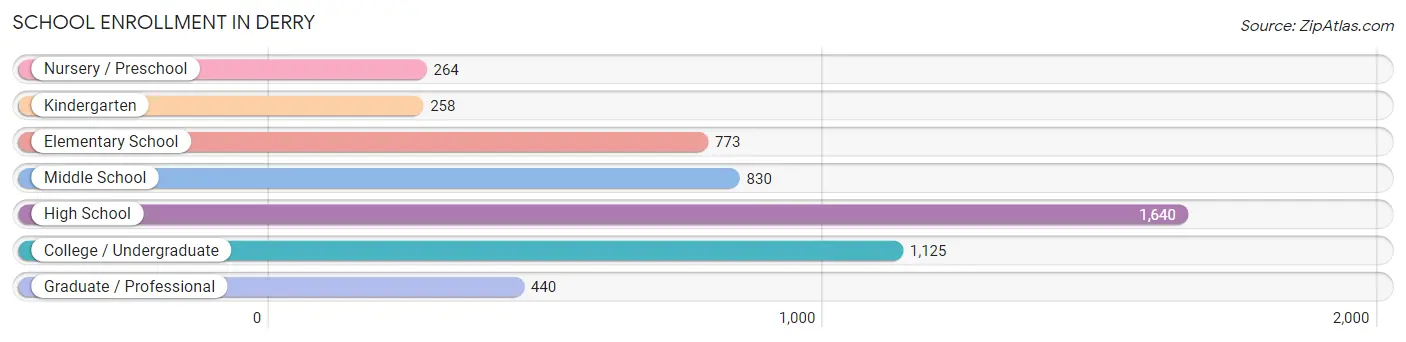
| School Level | # Students | % Students |
| Nursery / Preschool | 264 | 5.0% |
| Kindergarten | 258 | 4.8% |
| Elementary School | 773 | 14.5% |
| Middle School | 830 | 15.6% |
| High School | 1,640 | 30.8% |
| College / Undergraduate | 1,125 | 21.1% |
| Graduate / Professional | 440 | 8.3% |
| Total | 5,330 | 100.0% |
School Enrollment by Age by Funding Source in Derry
Out of a total of 5,330 students who are enrolled in schools in Derry, 1,306 (24.5%) attend a private institution, while the remaining 4,024 (75.5%) are enrolled in public schools. The age group of 35 years and over has the highest likelihood of being enrolled in private schools, with 323 (82.8% in the age bracket) enrolled. Conversely, the age group of 10 to 14 year olds has the lowest likelihood of being enrolled in a private school, with 1,077 (96.5% in the age bracket) attending a public institution.
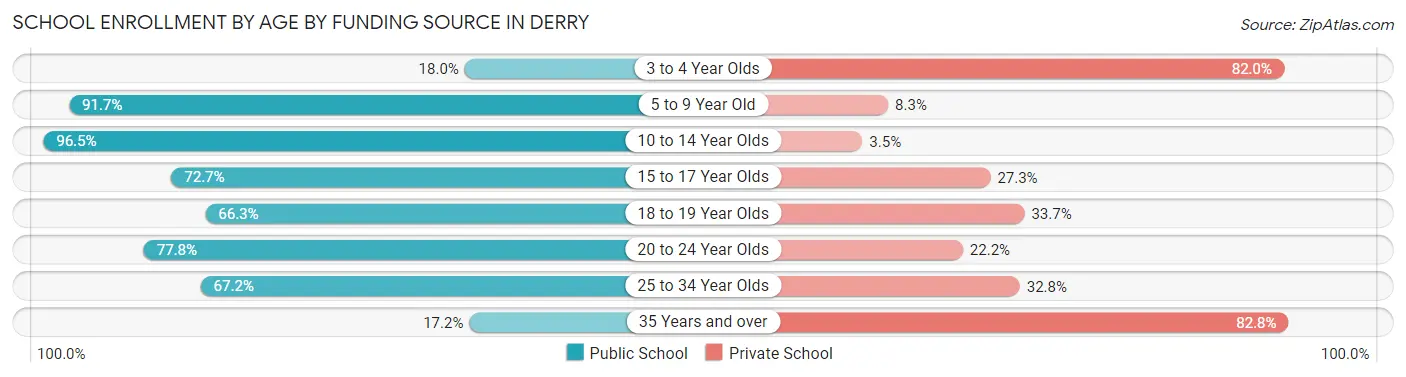
| Age Bracket | Public School | Private School |
| 3 to 4 Year Olds | 33 (18.0%) | 150 (82.0%) |
| 5 to 9 Year Old | 963 (91.7%) | 87 (8.3%) |
| 10 to 14 Year Olds | 1,077 (96.5%) | 39 (3.5%) |
| 15 to 17 Year Olds | 925 (72.7%) | 348 (27.3%) |
| 18 to 19 Year Olds | 128 (66.3%) | 65 (33.7%) |
| 20 to 24 Year Olds | 536 (77.8%) | 153 (22.2%) |
| 25 to 34 Year Olds | 293 (67.2%) | 143 (32.8%) |
| 35 Years and over | 67 (17.2%) | 323 (82.8%) |
| Total | 4,024 (75.5%) | 1,306 (24.5%) |
Educational Attainment by Field of Study in Derry
Business (1,205 | 22.5%), science & technology (615 | 11.5%), engineering (530 | 9.9%), bio, nature & agricultural (446 | 8.3%), and social sciences (402 | 7.5%) are the most common fields of study among 5,364 individuals in Derry who have obtained a bachelor's degree or higher.
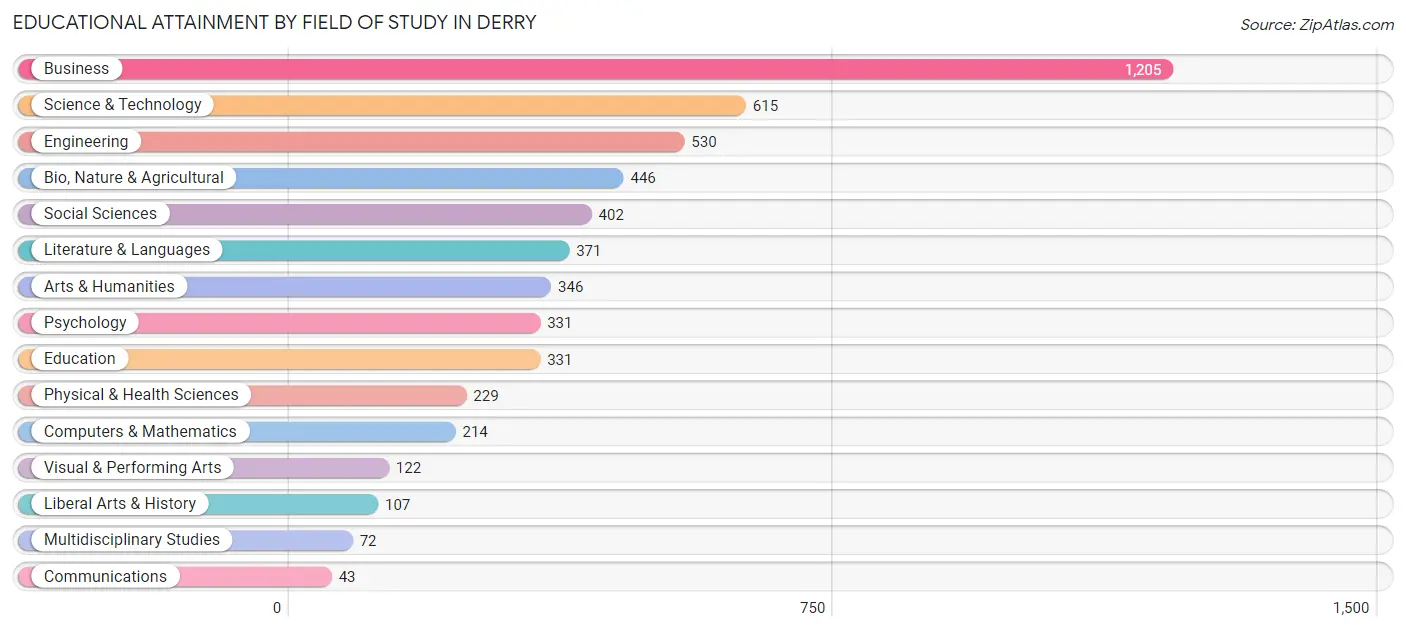
| Field of Study | # Graduates | % Graduates |
| Computers & Mathematics | 214 | 4.0% |
| Bio, Nature & Agricultural | 446 | 8.3% |
| Physical & Health Sciences | 229 | 4.3% |
| Psychology | 331 | 6.2% |
| Social Sciences | 402 | 7.5% |
| Engineering | 530 | 9.9% |
| Multidisciplinary Studies | 72 | 1.3% |
| Science & Technology | 615 | 11.5% |
| Business | 1,205 | 22.5% |
| Education | 331 | 6.2% |
| Literature & Languages | 371 | 6.9% |
| Liberal Arts & History | 107 | 2.0% |
| Visual & Performing Arts | 122 | 2.3% |
| Communications | 43 | 0.8% |
| Arts & Humanities | 346 | 6.5% |
| Total | 5,364 | 100.0% |
Transportation & Commute in Derry
Vehicle Availability by Sex in Derry
The most prevalent vehicle ownership categories in Derry are males with 2 vehicles (2,879, accounting for 50.6%) and females with 2 vehicles (2,836, making up 45.4%).
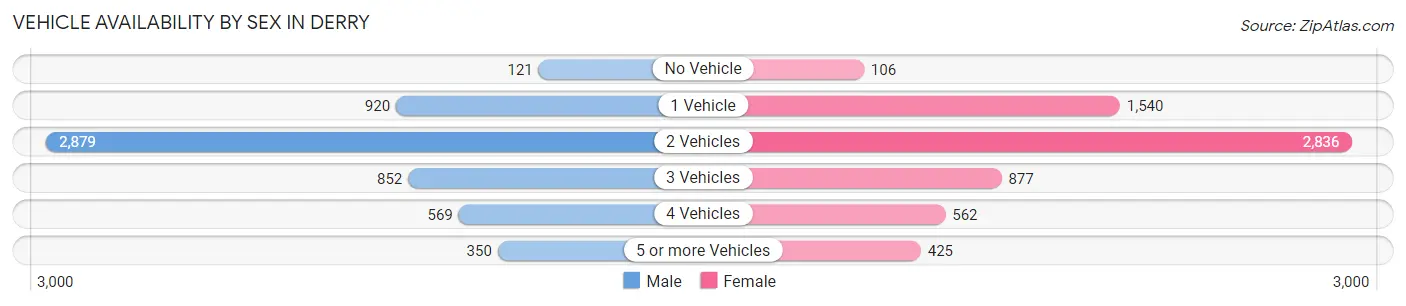
| Vehicles Available | Male | Female |
| No Vehicle | 121 (2.1%) | 106 (1.7%) |
| 1 Vehicle | 920 (16.2%) | 1,540 (24.3%) |
| 2 Vehicles | 2,879 (50.6%) | 2,836 (44.7%) |
| 3 Vehicles | 852 (15.0%) | 877 (13.8%) |
| 4 Vehicles | 569 (10.0%) | 562 (8.9%) |
| 5 or more Vehicles | 350 (6.1%) | 425 (6.7%) |
| Total | 5,691 (100.0%) | 6,346 (100.0%) |
Commute Time in Derry
The most frequently occuring commute durations in Derry are 20 to 24 minutes (1,388 commuters, 13.4%), 5 to 9 minutes (1,382 commuters, 13.3%), and 30 to 34 minutes (1,356 commuters, 13.1%).
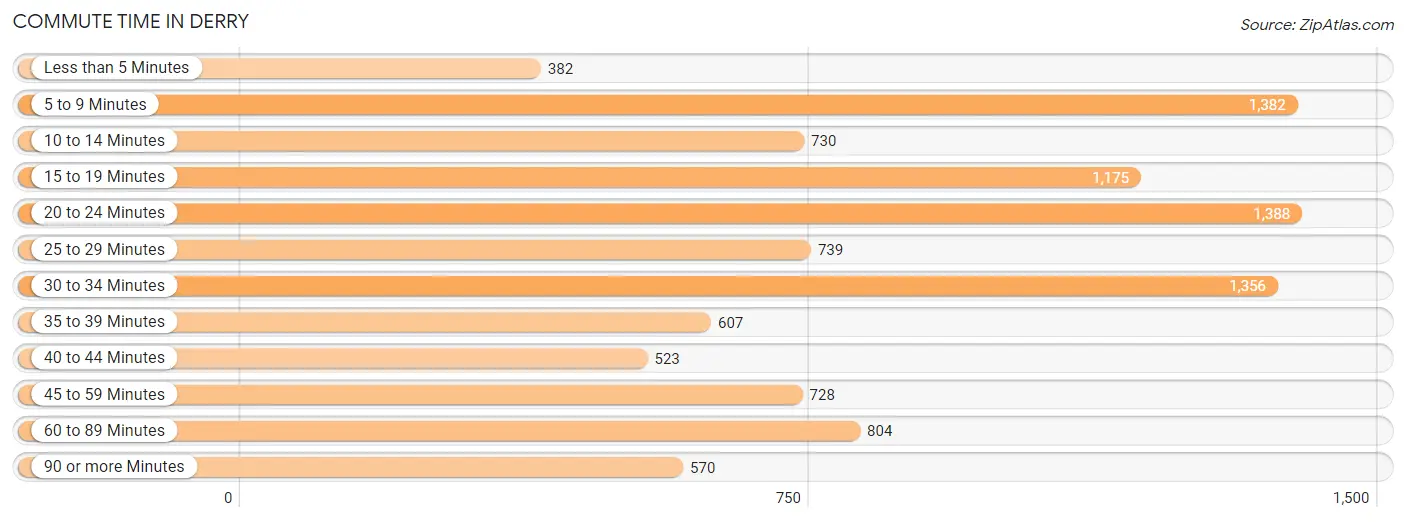
| Commute Time | # Commuters | % Commuters |
| Less than 5 Minutes | 382 | 3.7% |
| 5 to 9 Minutes | 1,382 | 13.3% |
| 10 to 14 Minutes | 730 | 7.0% |
| 15 to 19 Minutes | 1,175 | 11.3% |
| 20 to 24 Minutes | 1,388 | 13.4% |
| 25 to 29 Minutes | 739 | 7.1% |
| 30 to 34 Minutes | 1,356 | 13.1% |
| 35 to 39 Minutes | 607 | 5.9% |
| 40 to 44 Minutes | 523 | 5.0% |
| 45 to 59 Minutes | 728 | 7.0% |
| 60 to 89 Minutes | 804 | 7.7% |
| 90 or more Minutes | 570 | 5.5% |
Commute Time by Sex in Derry
The most common commute times in Derry are 30 to 34 minutes (878 commuters, 17.7%) for males and 5 to 9 minutes (913 commuters, 16.8%) for females.
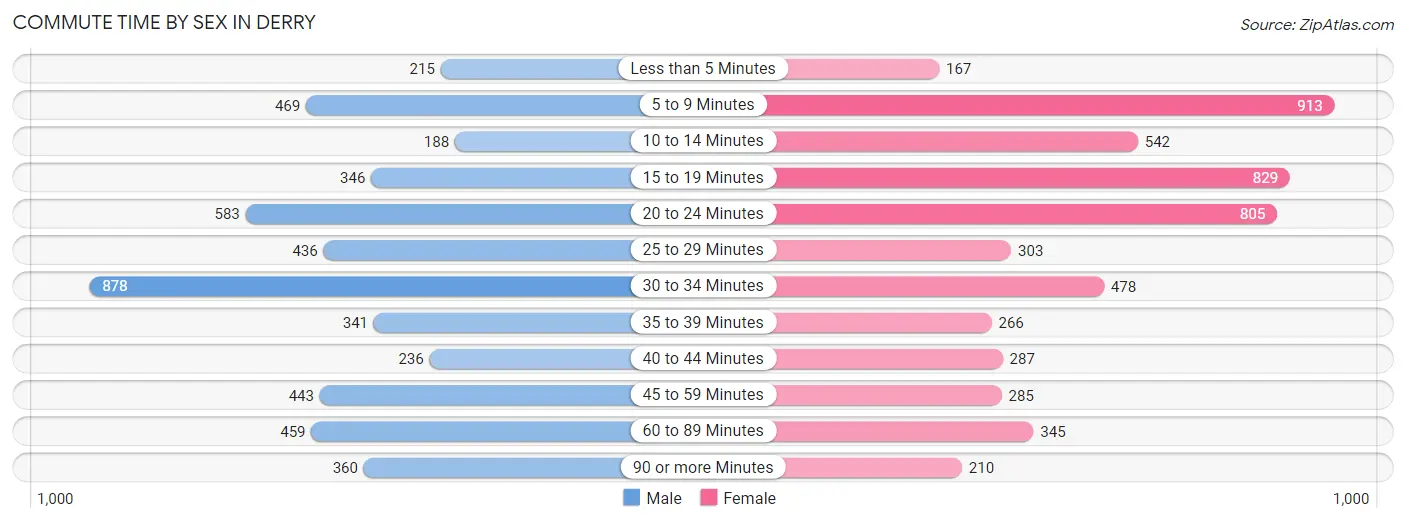
| Commute Time | Male | Female |
| Less than 5 Minutes | 215 (4.3%) | 167 (3.1%) |
| 5 to 9 Minutes | 469 (9.5%) | 913 (16.8%) |
| 10 to 14 Minutes | 188 (3.8%) | 542 (10.0%) |
| 15 to 19 Minutes | 346 (7.0%) | 829 (15.3%) |
| 20 to 24 Minutes | 583 (11.8%) | 805 (14.8%) |
| 25 to 29 Minutes | 436 (8.8%) | 303 (5.6%) |
| 30 to 34 Minutes | 878 (17.7%) | 478 (8.8%) |
| 35 to 39 Minutes | 341 (6.9%) | 266 (4.9%) |
| 40 to 44 Minutes | 236 (4.8%) | 287 (5.3%) |
| 45 to 59 Minutes | 443 (8.9%) | 285 (5.2%) |
| 60 to 89 Minutes | 459 (9.3%) | 345 (6.4%) |
| 90 or more Minutes | 360 (7.3%) | 210 (3.9%) |
Time of Departure to Work by Sex in Derry
The most frequent times of departure to work in Derry are 6:00 AM to 6:29 AM (720, 14.5%) for males and 7:30 AM to 7:59 AM (675, 12.4%) for females.
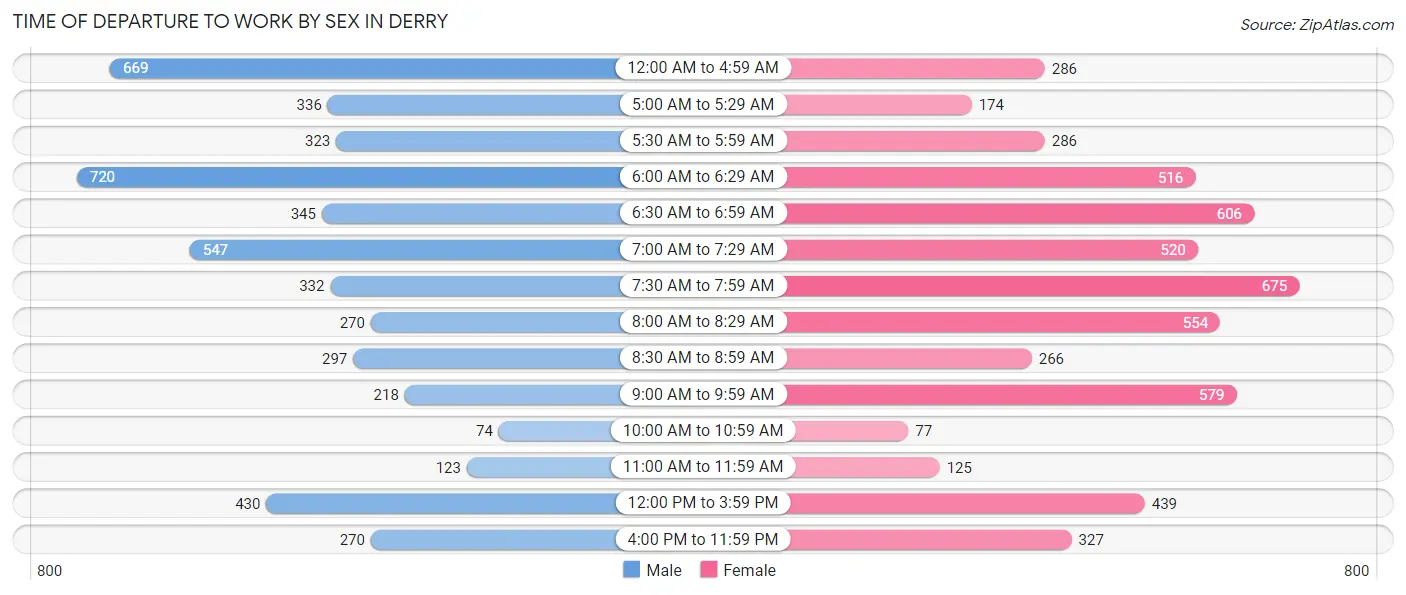
| Time of Departure | Male | Female |
| 12:00 AM to 4:59 AM | 669 (13.5%) | 286 (5.3%) |
| 5:00 AM to 5:29 AM | 336 (6.8%) | 174 (3.2%) |
| 5:30 AM to 5:59 AM | 323 (6.5%) | 286 (5.3%) |
| 6:00 AM to 6:29 AM | 720 (14.5%) | 516 (9.5%) |
| 6:30 AM to 6:59 AM | 345 (7.0%) | 606 (11.2%) |
| 7:00 AM to 7:29 AM | 547 (11.0%) | 520 (9.6%) |
| 7:30 AM to 7:59 AM | 332 (6.7%) | 675 (12.4%) |
| 8:00 AM to 8:29 AM | 270 (5.4%) | 554 (10.2%) |
| 8:30 AM to 8:59 AM | 297 (6.0%) | 266 (4.9%) |
| 9:00 AM to 9:59 AM | 218 (4.4%) | 579 (10.7%) |
| 10:00 AM to 10:59 AM | 74 (1.5%) | 77 (1.4%) |
| 11:00 AM to 11:59 AM | 123 (2.5%) | 125 (2.3%) |
| 12:00 PM to 3:59 PM | 430 (8.7%) | 439 (8.1%) |
| 4:00 PM to 11:59 PM | 270 (5.4%) | 327 (6.0%) |
| Total | 4,954 (100.0%) | 5,430 (100.0%) |
Housing Occupancy in Derry
Occupancy by Ownership in Derry
Of the total 9,275 dwellings in Derry, owner-occupied units account for 5,384 (58.1%), while renter-occupied units make up 3,891 (41.9%).
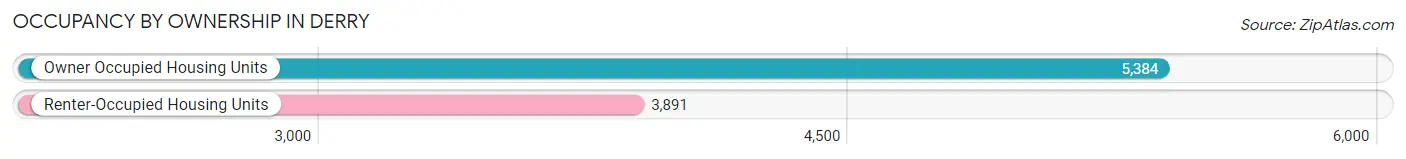
| Occupancy | # Housing Units | % Housing Units |
| Owner Occupied Housing Units | 5,384 | 58.1% |
| Renter-Occupied Housing Units | 3,891 | 41.9% |
| Total Occupied Housing Units | 9,275 | 100.0% |
Occupancy by Household Size in Derry
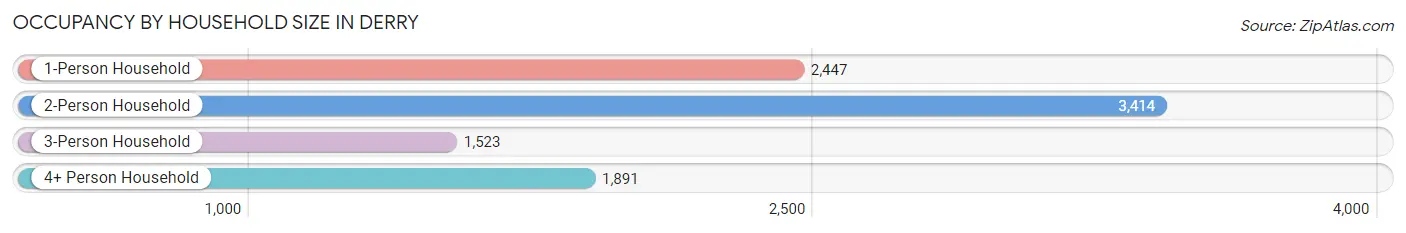
| Household Size | # Housing Units | % Housing Units |
| 1-Person Household | 2,447 | 26.4% |
| 2-Person Household | 3,414 | 36.8% |
| 3-Person Household | 1,523 | 16.4% |
| 4+ Person Household | 1,891 | 20.4% |
| Total Housing Units | 9,275 | 100.0% |
Occupancy by Ownership by Household Size in Derry
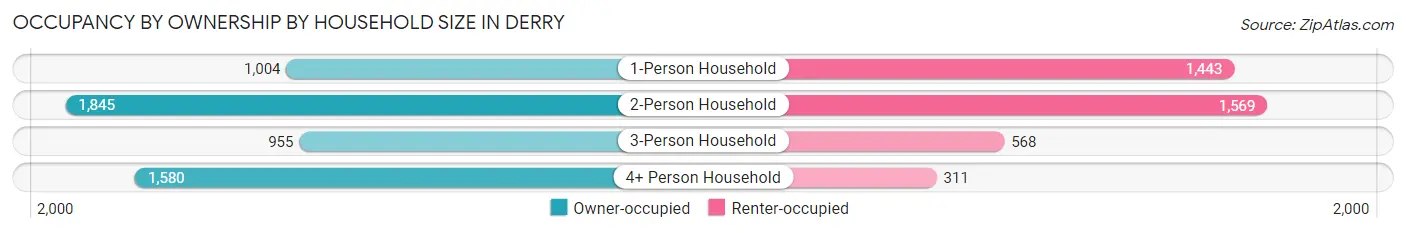
| Household Size | Owner-occupied | Renter-occupied |
| 1-Person Household | 1,004 (41.0%) | 1,443 (59.0%) |
| 2-Person Household | 1,845 (54.0%) | 1,569 (46.0%) |
| 3-Person Household | 955 (62.7%) | 568 (37.3%) |
| 4+ Person Household | 1,580 (83.6%) | 311 (16.5%) |
| Total Housing Units | 5,384 (58.1%) | 3,891 (41.9%) |
Occupancy by Educational Attainment in Derry
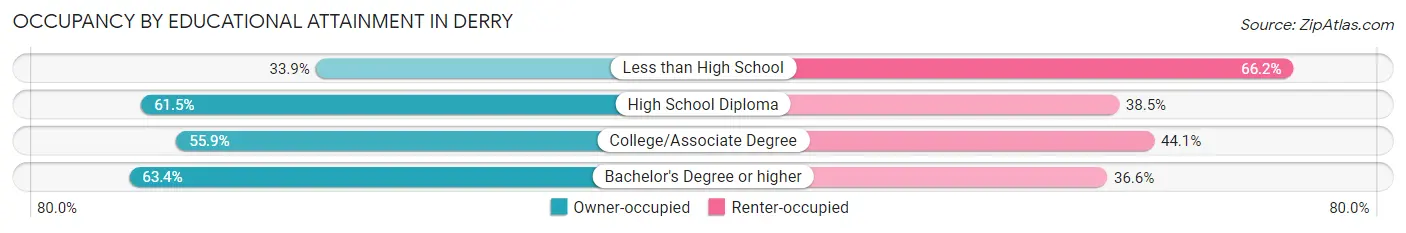
| Household Size | Owner-occupied | Renter-occupied |
| Less than High School | 262 (33.9%) | 512 (66.1%) |
| High School Diploma | 1,398 (61.5%) | 875 (38.5%) |
| College/Associate Degree | 1,675 (55.9%) | 1,320 (44.1%) |
| Bachelor's Degree or higher | 2,049 (63.4%) | 1,184 (36.6%) |
Occupancy by Age of Householder in Derry
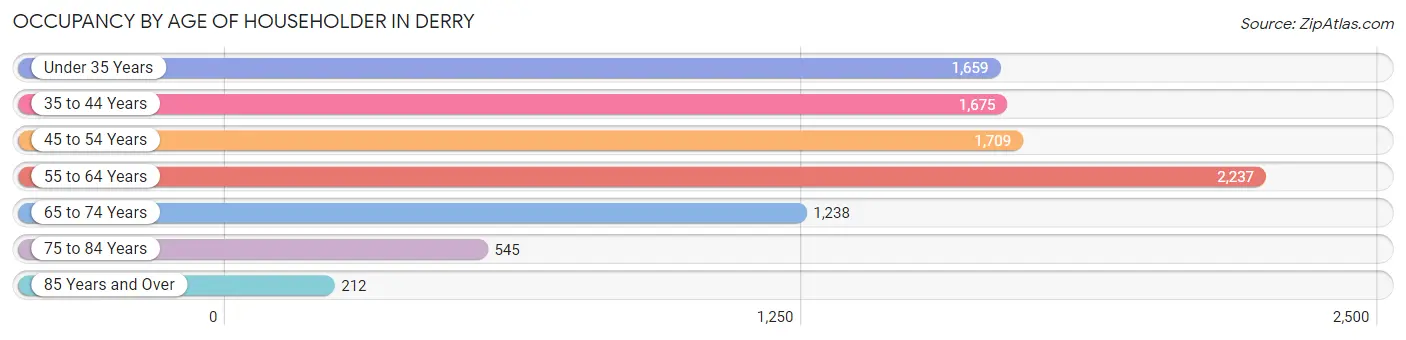
| Age Bracket | # Households | % Households |
| Under 35 Years | 1,659 | 17.9% |
| 35 to 44 Years | 1,675 | 18.1% |
| 45 to 54 Years | 1,709 | 18.4% |
| 55 to 64 Years | 2,237 | 24.1% |
| 65 to 74 Years | 1,238 | 13.4% |
| 75 to 84 Years | 545 | 5.9% |
| 85 Years and Over | 212 | 2.3% |
| Total | 9,275 | 100.0% |
Housing Finances in Derry
Median Income by Occupancy in Derry
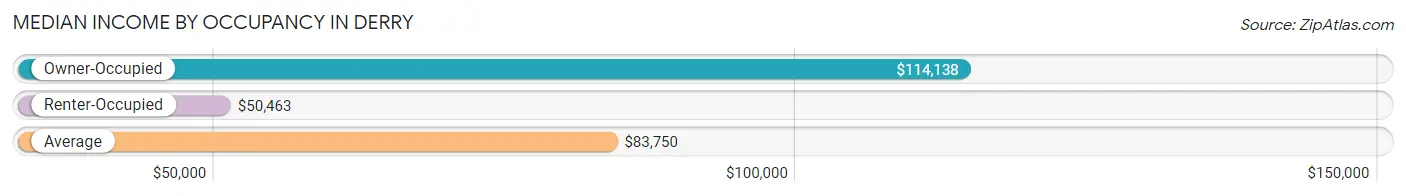
| Occupancy Type | # Households | Median Income |
| Owner-Occupied | 5,384 (58.1%) | $114,138 |
| Renter-Occupied | 3,891 (41.9%) | $50,463 |
| Average | 9,275 (100.0%) | $83,750 |
Occupancy by Householder Income Bracket in Derry
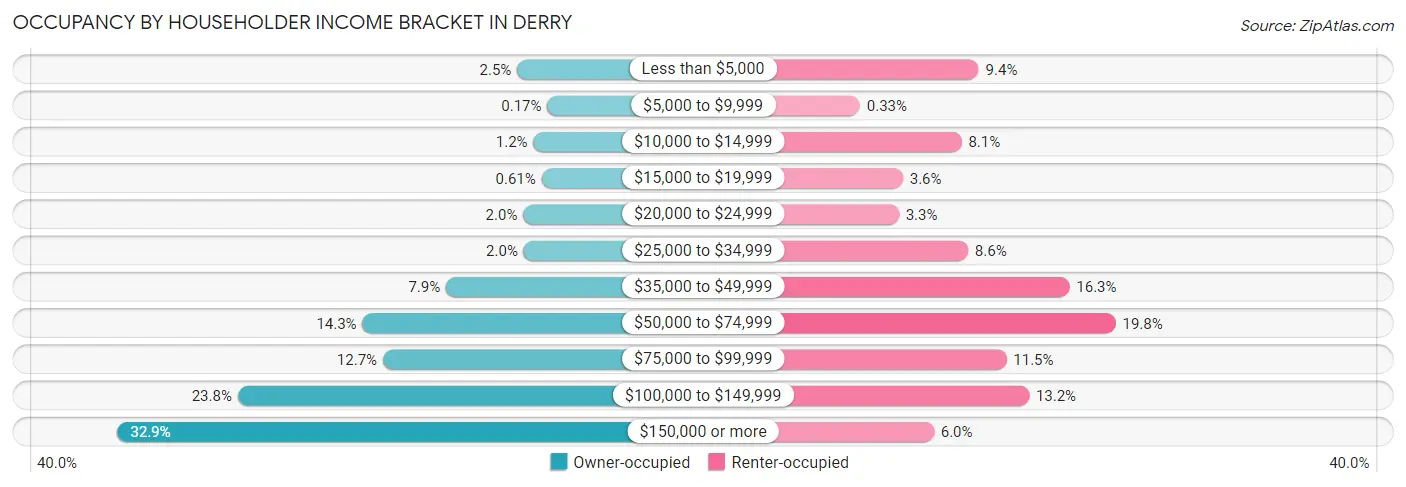
| Income Bracket | Owner-occupied | Renter-occupied |
| Less than $5,000 | 133 (2.5%) | 365 (9.4%) |
| $5,000 to $9,999 | 9 (0.2%) | 13 (0.3%) |
| $10,000 to $14,999 | 66 (1.2%) | 314 (8.1%) |
| $15,000 to $19,999 | 33 (0.6%) | 140 (3.6%) |
| $20,000 to $24,999 | 108 (2.0%) | 128 (3.3%) |
| $25,000 to $34,999 | 106 (2.0%) | 333 (8.6%) |
| $35,000 to $49,999 | 425 (7.9%) | 634 (16.3%) |
| $50,000 to $74,999 | 768 (14.3%) | 771 (19.8%) |
| $75,000 to $99,999 | 684 (12.7%) | 447 (11.5%) |
| $100,000 to $149,999 | 1,279 (23.8%) | 514 (13.2%) |
| $150,000 or more | 1,773 (32.9%) | 232 (6.0%) |
| Total | 5,384 (100.0%) | 3,891 (100.0%) |
Monthly Housing Cost Tiers in Derry
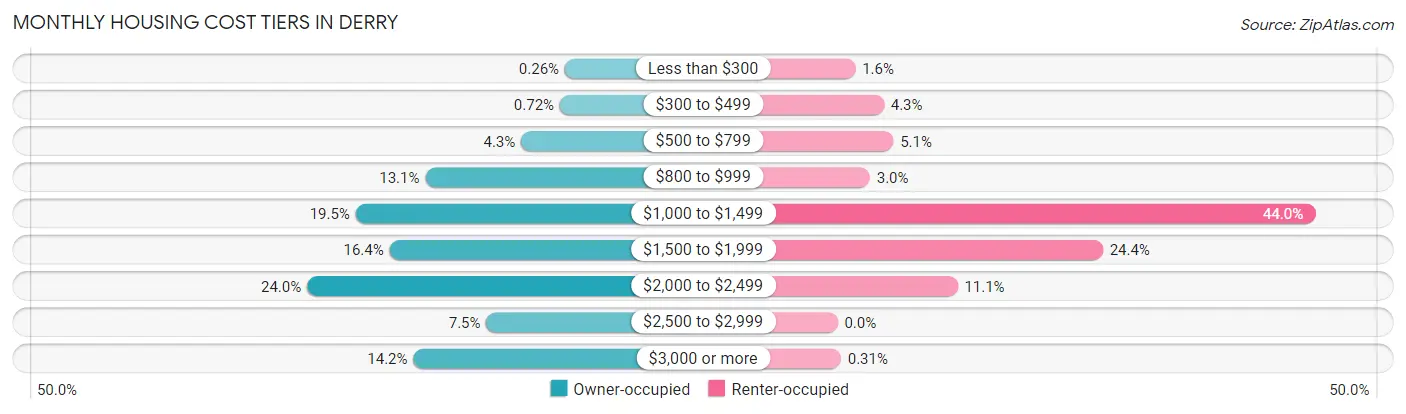
| Monthly Cost | Owner-occupied | Renter-occupied |
| Less than $300 | 14 (0.3%) | 64 (1.6%) |
| $300 to $499 | 39 (0.7%) | 166 (4.3%) |
| $500 to $799 | 231 (4.3%) | 200 (5.1%) |
| $800 to $999 | 706 (13.1%) | 116 (3.0%) |
| $1,000 to $1,499 | 1,051 (19.5%) | 1,711 (44.0%) |
| $1,500 to $1,999 | 883 (16.4%) | 950 (24.4%) |
| $2,000 to $2,499 | 1,292 (24.0%) | 430 (11.1%) |
| $2,500 to $2,999 | 403 (7.5%) | 0 (0.0%) |
| $3,000 or more | 765 (14.2%) | 12 (0.3%) |
| Total | 5,384 (100.0%) | 3,891 (100.0%) |
Physical Housing Characteristics in Derry
Housing Structures in Derry
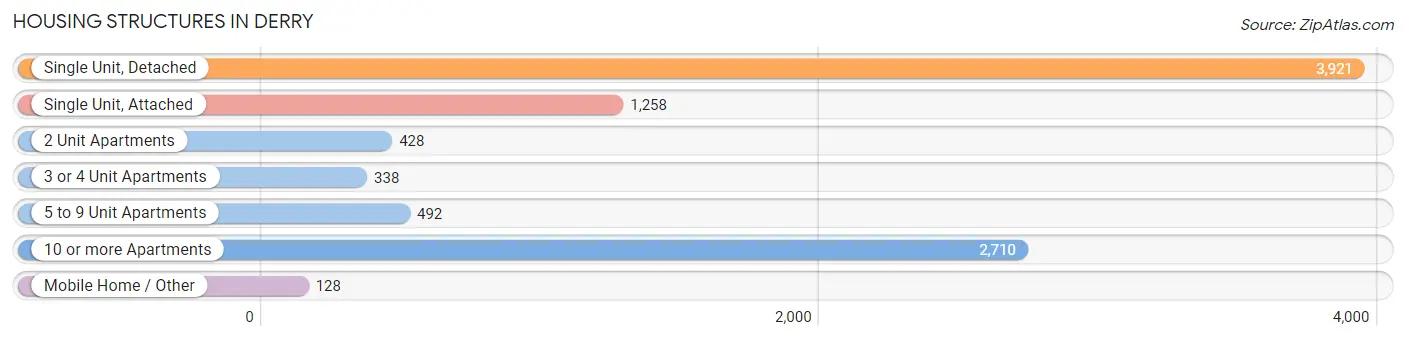
| Structure Type | # Housing Units | % Housing Units |
| Single Unit, Detached | 3,921 | 42.3% |
| Single Unit, Attached | 1,258 | 13.6% |
| 2 Unit Apartments | 428 | 4.6% |
| 3 or 4 Unit Apartments | 338 | 3.6% |
| 5 to 9 Unit Apartments | 492 | 5.3% |
| 10 or more Apartments | 2,710 | 29.2% |
| Mobile Home / Other | 128 | 1.4% |
| Total | 9,275 | 100.0% |
Housing Structures by Occupancy in Derry
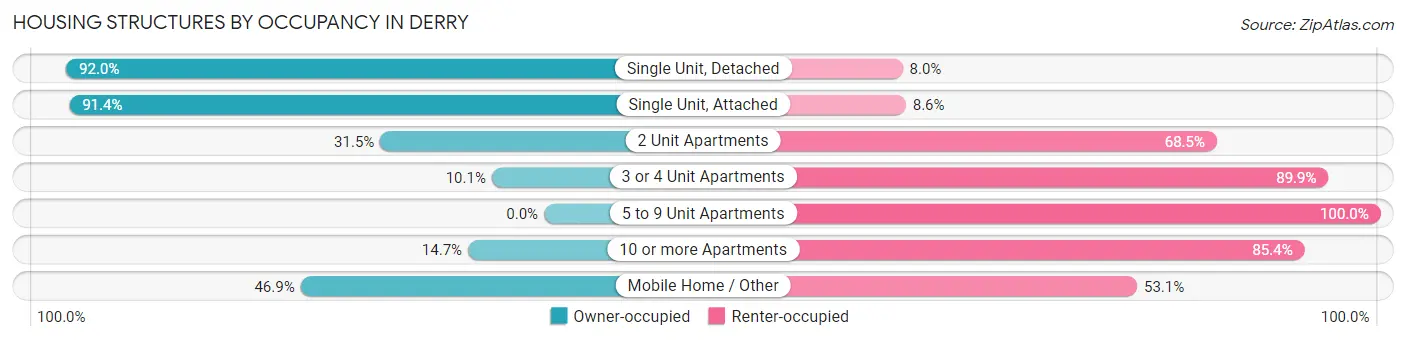
| Structure Type | Owner-occupied | Renter-occupied |
| Single Unit, Detached | 3,608 (92.0%) | 313 (8.0%) |
| Single Unit, Attached | 1,150 (91.4%) | 108 (8.6%) |
| 2 Unit Apartments | 135 (31.5%) | 293 (68.5%) |
| 3 or 4 Unit Apartments | 34 (10.1%) | 304 (89.9%) |
| 5 to 9 Unit Apartments | 0 (0.0%) | 492 (100.0%) |
| 10 or more Apartments | 397 (14.6%) | 2,313 (85.4%) |
| Mobile Home / Other | 60 (46.9%) | 68 (53.1%) |
| Total | 5,384 (58.1%) | 3,891 (41.9%) |
Housing Structures by Number of Rooms in Derry
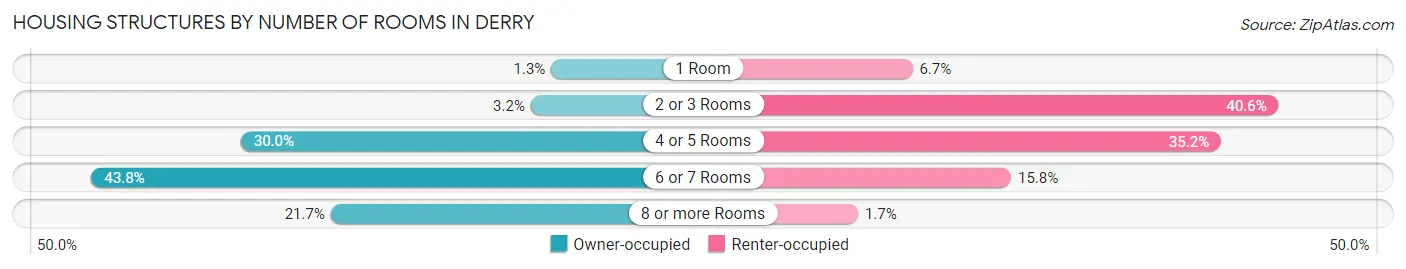
| Number of Rooms | Owner-occupied | Renter-occupied |
| 1 Room | 70 (1.3%) | 261 (6.7%) |
| 2 or 3 Rooms | 172 (3.2%) | 1,578 (40.6%) |
| 4 or 5 Rooms | 1,615 (30.0%) | 1,371 (35.2%) |
| 6 or 7 Rooms | 2,359 (43.8%) | 616 (15.8%) |
| 8 or more Rooms | 1,168 (21.7%) | 65 (1.7%) |
| Total | 5,384 (100.0%) | 3,891 (100.0%) |
Housing Structure by Heating Type in Derry
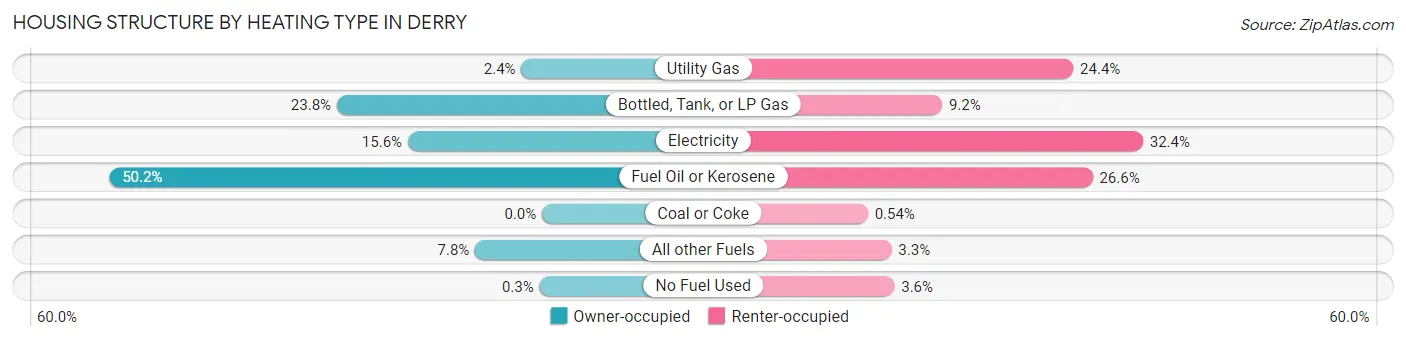
| Heating Type | Owner-occupied | Renter-occupied |
| Utility Gas | 129 (2.4%) | 948 (24.4%) |
| Bottled, Tank, or LP Gas | 1,281 (23.8%) | 356 (9.1%) |
| Electricity | 838 (15.6%) | 1,262 (32.4%) |
| Fuel Oil or Kerosene | 2,702 (50.2%) | 1,035 (26.6%) |
| Coal or Coke | 0 (0.0%) | 21 (0.5%) |
| All other Fuels | 418 (7.8%) | 128 (3.3%) |
| No Fuel Used | 16 (0.3%) | 141 (3.6%) |
| Total | 5,384 (100.0%) | 3,891 (100.0%) |
Household Vehicle Usage in Derry
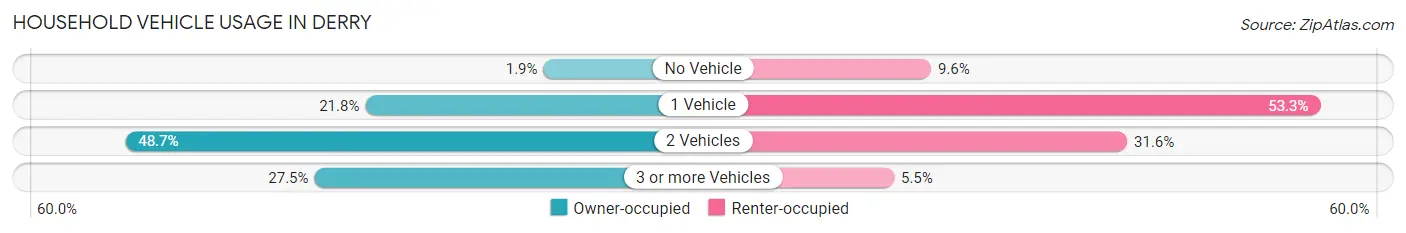
| Vehicles per Household | Owner-occupied | Renter-occupied |
| No Vehicle | 102 (1.9%) | 375 (9.6%) |
| 1 Vehicle | 1,176 (21.8%) | 2,072 (53.2%) |
| 2 Vehicles | 2,623 (48.7%) | 1,230 (31.6%) |
| 3 or more Vehicles | 1,483 (27.5%) | 214 (5.5%) |
| Total | 5,384 (100.0%) | 3,891 (100.0%) |
Real Estate & Mortgages in Derry
Real Estate and Mortgage Overview in Derry
| Characteristic | Without Mortgage | With Mortgage |
| Housing Units | 1,531 | 3,853 |
| Median Property Value | $325,000 | $329,300 |
| Median Household Income | $69,682 | $1,491 |
| Monthly Housing Costs | $957 | $765 |
| Real Estate Taxes | $6,934 | $19 |
Property Value by Mortgage Status in Derry
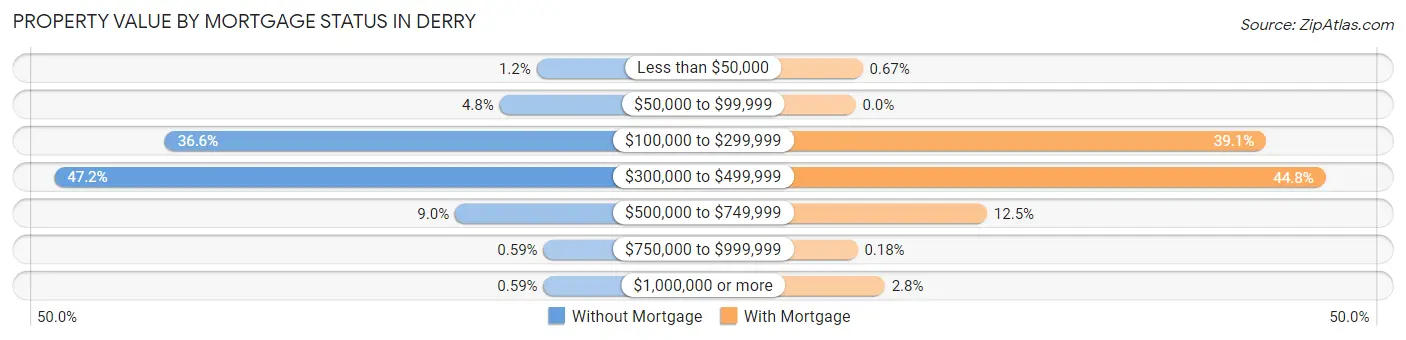
| Property Value | Without Mortgage | With Mortgage |
| Less than $50,000 | 19 (1.2%) | 26 (0.7%) |
| $50,000 to $99,999 | 73 (4.8%) | 0 (0.0%) |
| $100,000 to $299,999 | 561 (36.6%) | 1,506 (39.1%) |
| $300,000 to $499,999 | 722 (47.2%) | 1,725 (44.8%) |
| $500,000 to $749,999 | 138 (9.0%) | 482 (12.5%) |
| $750,000 to $999,999 | 9 (0.6%) | 7 (0.2%) |
| $1,000,000 or more | 9 (0.6%) | 107 (2.8%) |
| Total | 1,531 (100.0%) | 3,853 (100.0%) |
Household Income by Mortgage Status in Derry
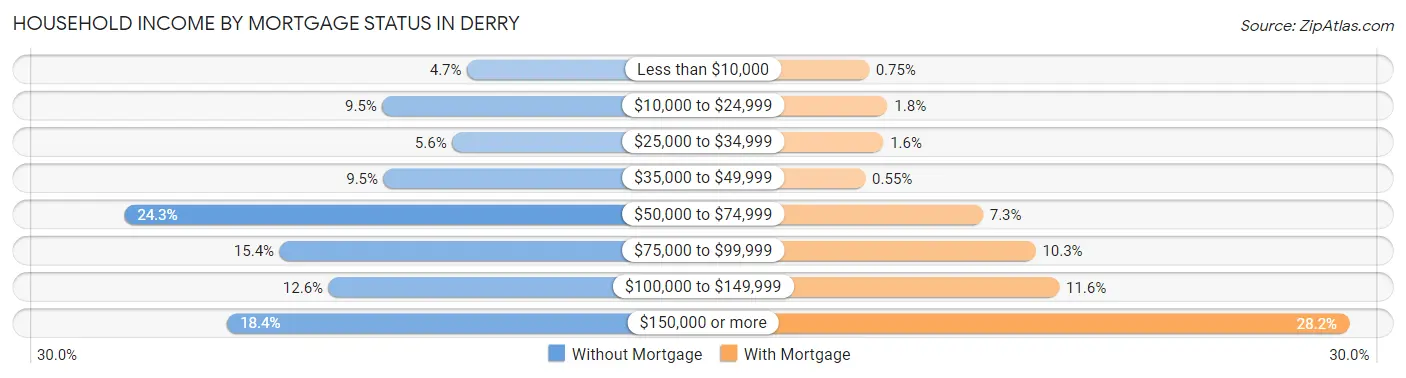
| Household Income | Without Mortgage | With Mortgage |
| Less than $10,000 | 72 (4.7%) | 29 (0.7%) |
| $10,000 to $24,999 | 146 (9.5%) | 70 (1.8%) |
| $25,000 to $34,999 | 85 (5.6%) | 61 (1.6%) |
| $35,000 to $49,999 | 145 (9.5%) | 21 (0.5%) |
| $50,000 to $74,999 | 372 (24.3%) | 280 (7.3%) |
| $75,000 to $99,999 | 236 (15.4%) | 396 (10.3%) |
| $100,000 to $149,999 | 193 (12.6%) | 448 (11.6%) |
| $150,000 or more | 282 (18.4%) | 1,086 (28.2%) |
| Total | 1,531 (100.0%) | 3,853 (100.0%) |
Property Value to Household Income Ratio in Derry
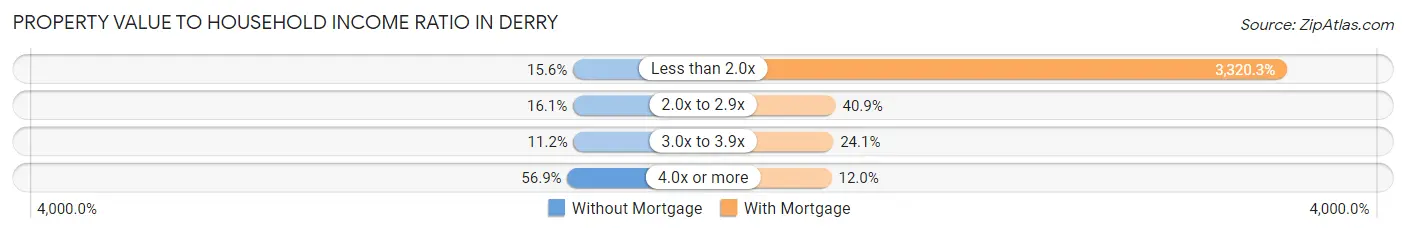
| Value-to-Income Ratio | Without Mortgage | With Mortgage |
| Less than 2.0x | 238 (15.5%) | 127,930 (3,320.3%) |
| 2.0x to 2.9x | 246 (16.1%) | 1,576 (40.9%) |
| 3.0x to 3.9x | 172 (11.2%) | 927 (24.1%) |
| 4.0x or more | 871 (56.9%) | 463 (12.0%) |
| Total | 1,531 (100.0%) | 3,853 (100.0%) |
Real Estate Taxes by Mortgage Status in Derry
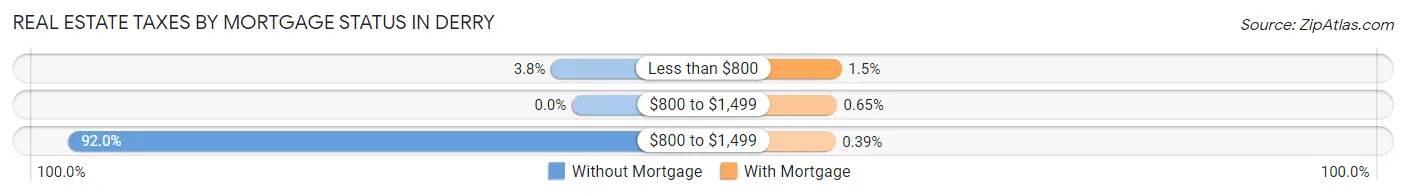
| Property Taxes | Without Mortgage | With Mortgage |
| Less than $800 | 58 (3.8%) | 59 (1.5%) |
| $800 to $1,499 | 0 (0.0%) | 25 (0.6%) |
| $800 to $1,499 | 1,409 (92.0%) | 15 (0.4%) |
| Total | 1,531 (100.0%) | 3,853 (100.0%) |
Health & Disability in Derry
Health Insurance Coverage by Age in Derry
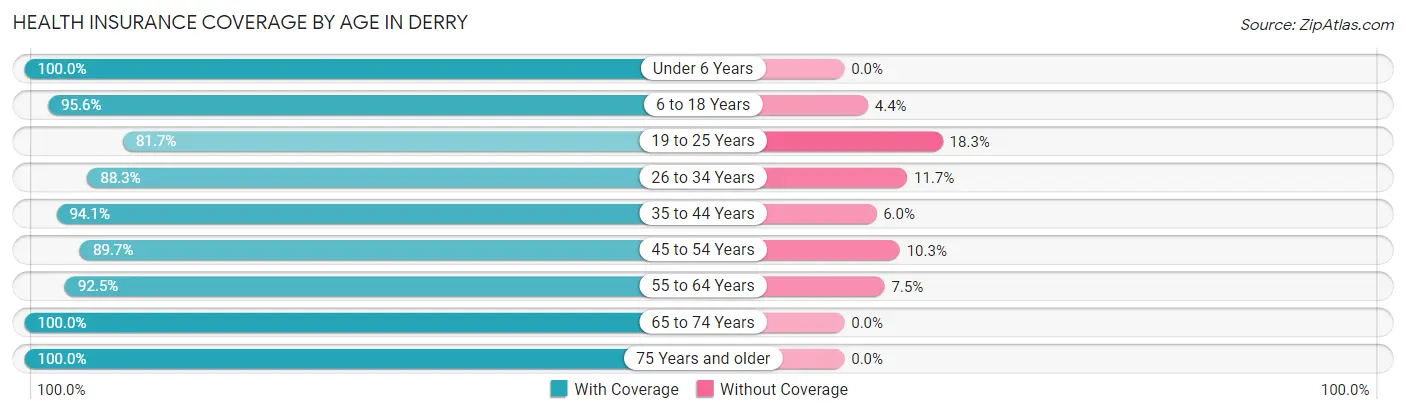
| Age Bracket | With Coverage | Without Coverage |
| Under 6 Years | 1,583 (100.0%) | 0 (0.0%) |
| 6 to 18 Years | 3,308 (95.6%) | 152 (4.4%) |
| 19 to 25 Years | 1,594 (81.7%) | 358 (18.3%) |
| 26 to 34 Years | 2,909 (88.3%) | 386 (11.7%) |
| 35 to 44 Years | 2,922 (94.1%) | 185 (5.9%) |
| 45 to 54 Years | 2,568 (89.7%) | 296 (10.3%) |
| 55 to 64 Years | 3,283 (92.5%) | 267 (7.5%) |
| 65 to 74 Years | 1,897 (100.0%) | 0 (0.0%) |
| 75 Years and older | 1,088 (100.0%) | 0 (0.0%) |
| Total | 21,152 (92.8%) | 1,644 (7.2%) |
Health Insurance Coverage by Citizenship Status in Derry
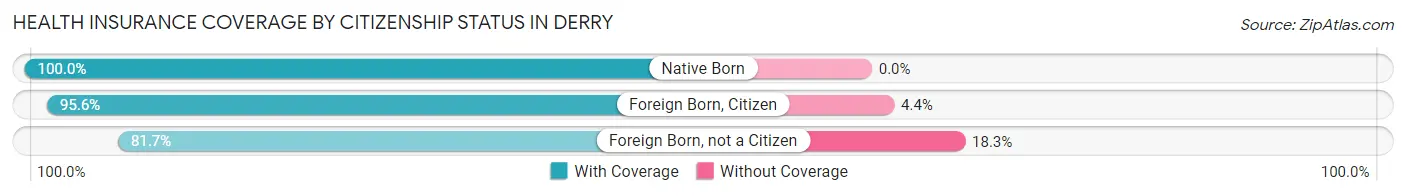
| Citizenship Status | With Coverage | Without Coverage |
| Native Born | 1,583 (100.0%) | 0 (0.0%) |
| Foreign Born, Citizen | 3,308 (95.6%) | 152 (4.4%) |
| Foreign Born, not a Citizen | 1,594 (81.7%) | 358 (18.3%) |
Health Insurance Coverage by Household Income in Derry
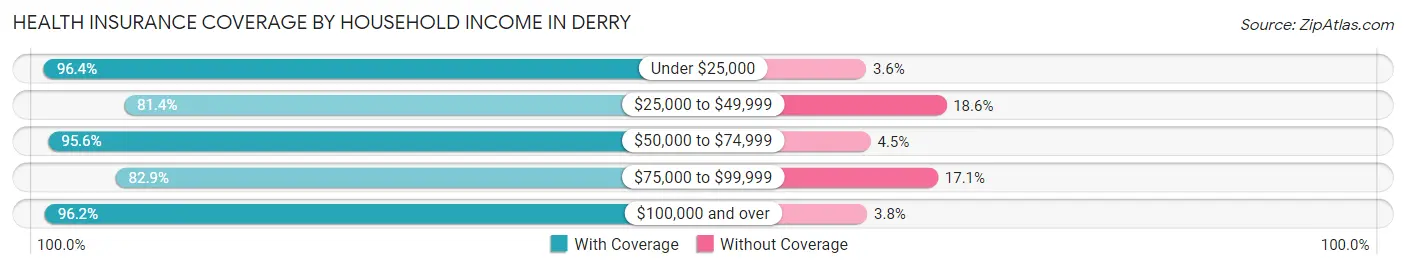
| Household Income | With Coverage | Without Coverage |
| Under $25,000 | 2,381 (96.4%) | 89 (3.6%) |
| $25,000 to $49,999 | 2,119 (81.4%) | 485 (18.6%) |
| $50,000 to $74,999 | 2,942 (95.6%) | 137 (4.4%) |
| $75,000 to $99,999 | 2,349 (82.9%) | 483 (17.1%) |
| $100,000 and over | 11,349 (96.2%) | 448 (3.8%) |
Public vs Private Health Insurance Coverage by Age in Derry
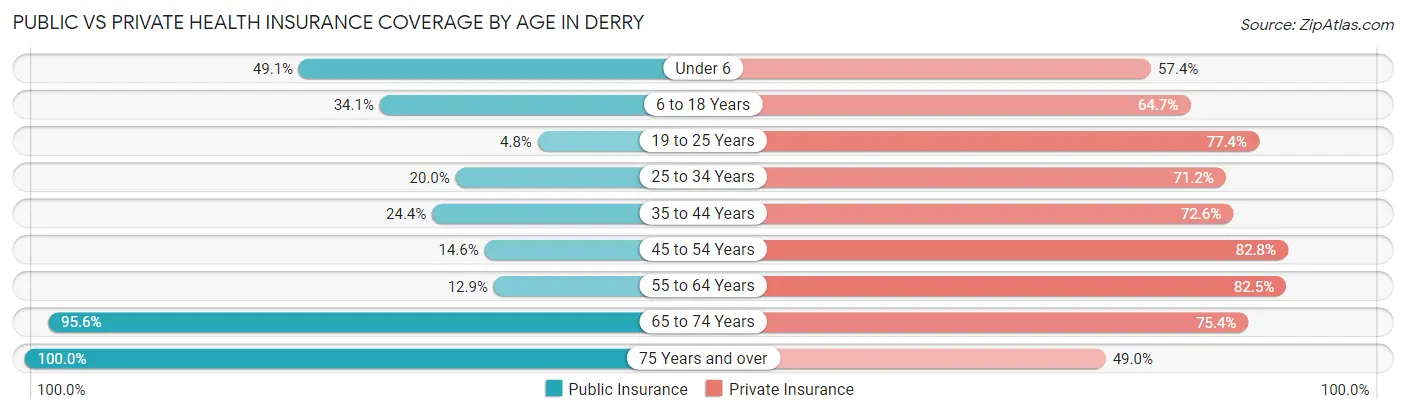
| Age Bracket | Public Insurance | Private Insurance |
| Under 6 | 777 (49.1%) | 909 (57.4%) |
| 6 to 18 Years | 1,179 (34.1%) | 2,237 (64.6%) |
| 19 to 25 Years | 93 (4.8%) | 1,511 (77.4%) |
| 25 to 34 Years | 659 (20.0%) | 2,347 (71.2%) |
| 35 to 44 Years | 757 (24.4%) | 2,256 (72.6%) |
| 45 to 54 Years | 419 (14.6%) | 2,371 (82.8%) |
| 55 to 64 Years | 459 (12.9%) | 2,927 (82.5%) |
| 65 to 74 Years | 1,814 (95.6%) | 1,431 (75.4%) |
| 75 Years and over | 1,088 (100.0%) | 533 (49.0%) |
| Total | 7,245 (31.8%) | 16,522 (72.5%) |
Disability Status by Sex by Age in Derry
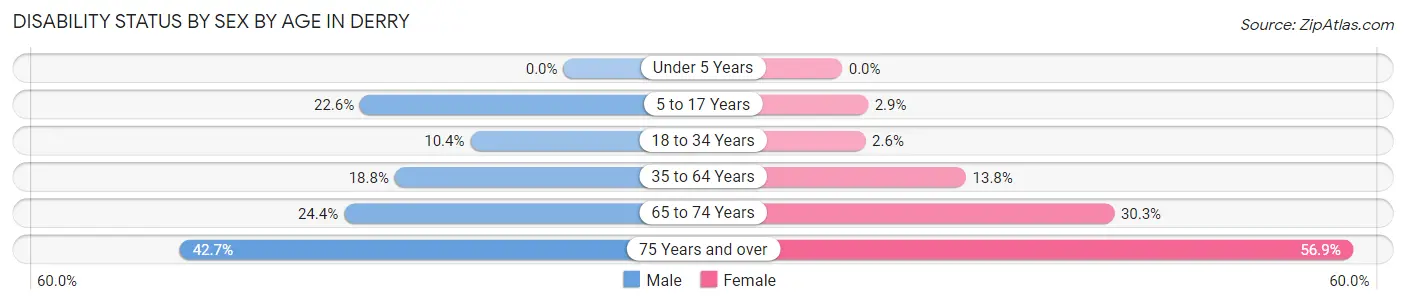
| Age Bracket | Male | Female |
| Under 5 Years | 0 (0.0%) | 0 (0.0%) |
| 5 to 17 Years | 372 (22.6%) | 52 (2.9%) |
| 18 to 34 Years | 245 (10.4%) | 80 (2.6%) |
| 35 to 64 Years | 820 (18.8%) | 711 (13.8%) |
| 65 to 74 Years | 224 (24.4%) | 297 (30.3%) |
| 75 Years and over | 135 (42.7%) | 439 (56.9%) |
Disability Class by Sex by Age in Derry
Disability Class: Hearing Difficulty
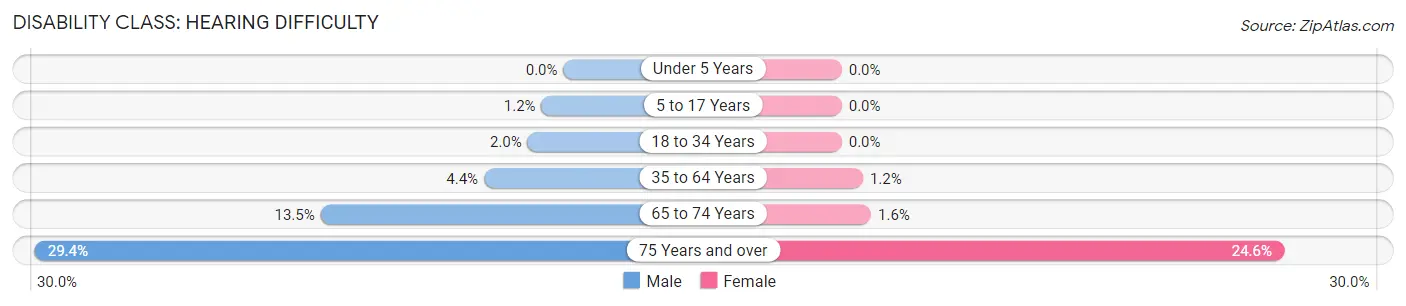
| Age Bracket | Male | Female |
| Under 5 Years | 0 (0.0%) | 0 (0.0%) |
| 5 to 17 Years | 20 (1.2%) | 0 (0.0%) |
| 18 to 34 Years | 47 (2.0%) | 0 (0.0%) |
| 35 to 64 Years | 193 (4.4%) | 61 (1.2%) |
| 65 to 74 Years | 124 (13.5%) | 16 (1.6%) |
| 75 Years and over | 93 (29.4%) | 190 (24.6%) |
Disability Class: Vision Difficulty
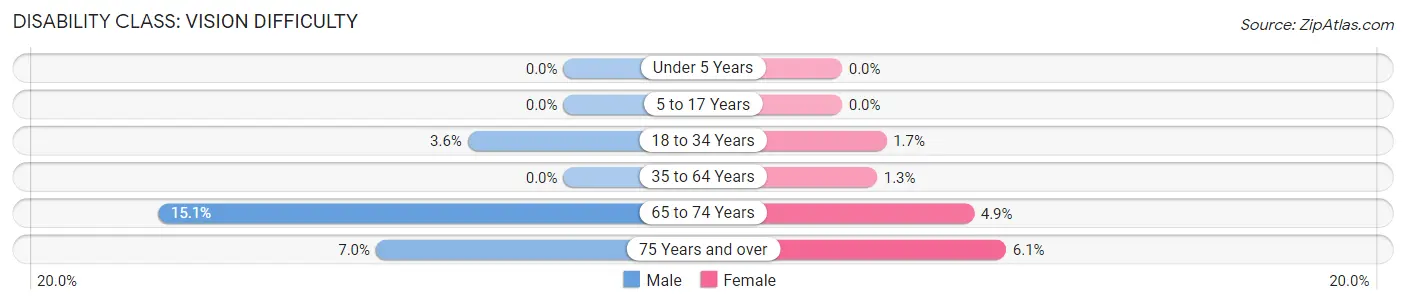
| Age Bracket | Male | Female |
| Under 5 Years | 0 (0.0%) | 0 (0.0%) |
| 5 to 17 Years | 0 (0.0%) | 0 (0.0%) |
| 18 to 34 Years | 84 (3.5%) | 51 (1.7%) |
| 35 to 64 Years | 0 (0.0%) | 67 (1.3%) |
| 65 to 74 Years | 138 (15.0%) | 48 (4.9%) |
| 75 Years and over | 22 (7.0%) | 47 (6.1%) |
Disability Class: Cognitive Difficulty
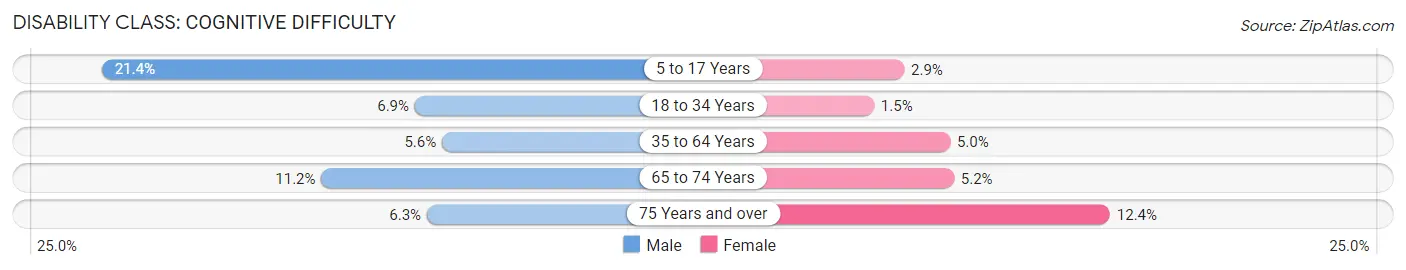
| Age Bracket | Male | Female |
| 5 to 17 Years | 352 (21.4%) | 52 (2.9%) |
| 18 to 34 Years | 163 (6.9%) | 46 (1.5%) |
| 35 to 64 Years | 246 (5.6%) | 259 (5.0%) |
| 65 to 74 Years | 103 (11.2%) | 51 (5.2%) |
| 75 Years and over | 20 (6.3%) | 96 (12.4%) |
Disability Class: Ambulatory Difficulty
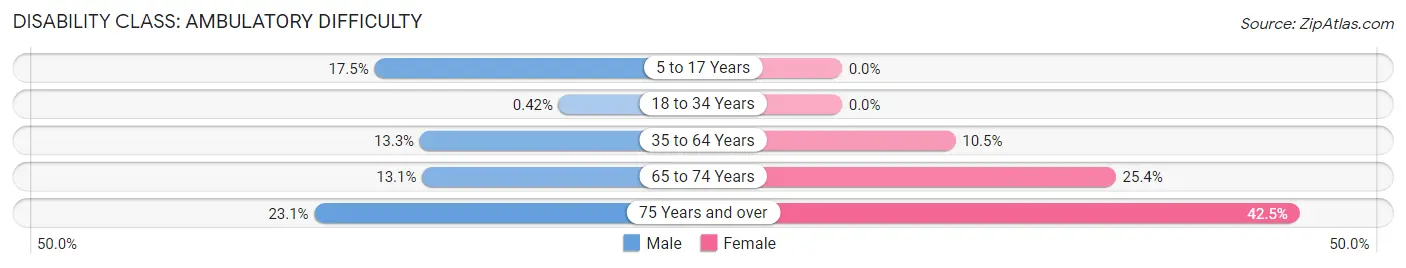
| Age Bracket | Male | Female |
| 5 to 17 Years | 288 (17.5%) | 0 (0.0%) |
| 18 to 34 Years | 10 (0.4%) | 0 (0.0%) |
| 35 to 64 Years | 581 (13.3%) | 543 (10.5%) |
| 65 to 74 Years | 120 (13.1%) | 249 (25.4%) |
| 75 Years and over | 73 (23.1%) | 328 (42.5%) |
Disability Class: Self-Care Difficulty
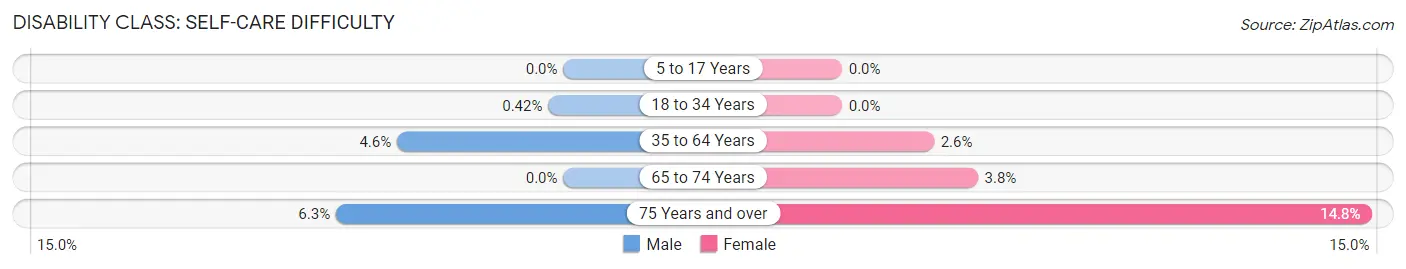
| Age Bracket | Male | Female |
| 5 to 17 Years | 0 (0.0%) | 0 (0.0%) |
| 18 to 34 Years | 10 (0.4%) | 0 (0.0%) |
| 35 to 64 Years | 202 (4.6%) | 132 (2.6%) |
| 65 to 74 Years | 0 (0.0%) | 37 (3.8%) |
| 75 Years and over | 20 (6.3%) | 114 (14.8%) |
Technology Access in Derry
Computing Device Access in Derry
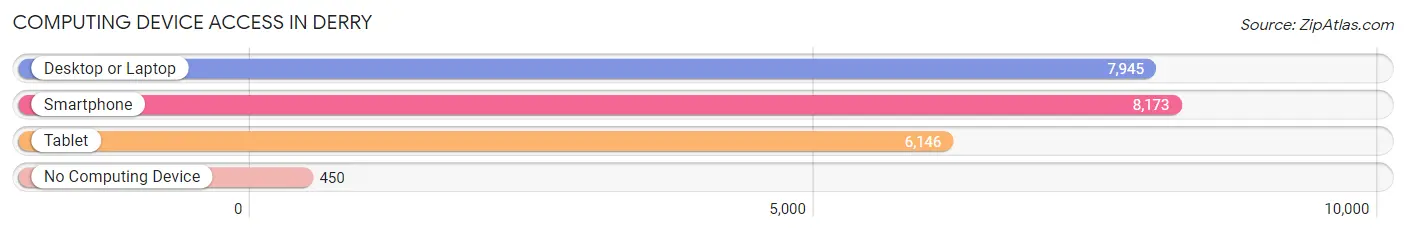
| Device Type | # Households | % Households |
| Desktop or Laptop | 7,945 | 85.7% |
| Smartphone | 8,173 | 88.1% |
| Tablet | 6,146 | 66.3% |
| No Computing Device | 450 | 4.9% |
| Total | 9,275 | 100.0% |
Internet Access in Derry
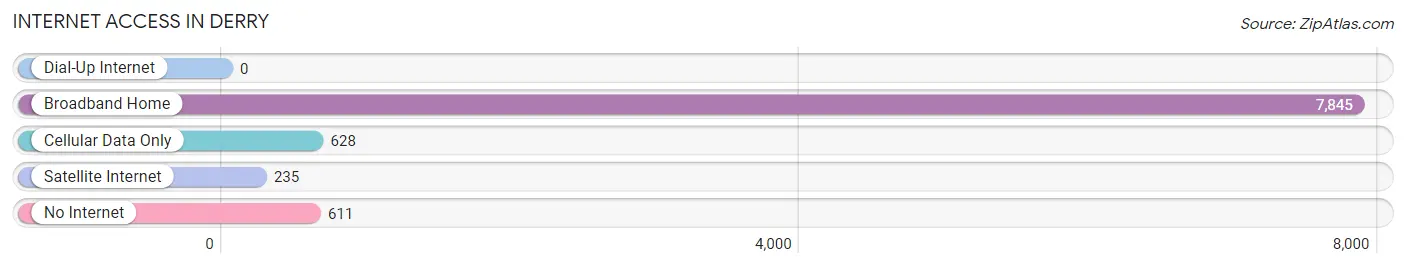
| Internet Type | # Households | % Households |
| Dial-Up Internet | 0 | 0.0% |
| Broadband Home | 7,845 | 84.6% |
| Cellular Data Only | 628 | 6.8% |
| Satellite Internet | 235 | 2.5% |
| No Internet | 611 | 6.6% |
| Total | 9,275 | 100.0% |
Derry Summary
Derry is a town located in Rockingham County, New Hampshire, United States. The town is situated in the southeastern part of the state, approximately 25 miles from the Massachusetts border. As of the 2010 census, the town had a population of 33,109, making it the fifth largest municipality in the state.
Geography
Derry is located in southeastern New Hampshire, approximately 25 miles from the Massachusetts border. The town is bordered by the towns of Londonderry to the north, Windham to the east, Salem to the south, and Hudson to the west. The town is situated in the Merrimack Valley region of the state, and is located along the eastern bank of the Merrimack River. The town is home to several small lakes, including Beaver Lake, Crystal Lake, and Hood Pond.
The town has a total area of 33.2 square miles, of which 32.9 square miles is land and 0.3 square miles is water. The highest point in the town is located at the summit of Bald Hill, which has an elevation of 590 feet above sea level.
History
The area that is now Derry was originally inhabited by the Pennacook Native American tribe. The first European settlers arrived in the area in 1719, and the town was officially incorporated in 1827. The town was named after the city of Derry in Northern Ireland, and was the first town in the United States to be named after the city.
The town was an agricultural community for much of its history, and was known for its apple orchards. The town was also home to several mills, including a paper mill, a cotton mill, and a woolen mill.
Economy
The economy of Derry is largely based on manufacturing and retail. The town is home to several large companies, including Autodesk, Inc., Fidelity Investments, and Stonyfield Farm. The town is also home to several retail stores, including Walmart, Home Depot, and Lowe’s.
Demographics
As of the 2010 census, there were 33,109 people, 12,845 households, and 8,845 families residing in the town. The population density was 995.3 people per square mile. The racial makeup of the town was 94.2% White, 1.3% African American, 0.3% Native American, 1.9% Asian, 0.1% Pacific Islander, 0.9% from other races, and 1.3% from two or more races. Hispanic or Latino of any race were 3.2% of the population.
The median income for a household in the town was $63,945, and the median income for a family was $76,945. The per capita income for the town was $30,945. About 3.2% of families and 4.7% of the population were below the poverty line, including 5.3% of those under age 18 and 4.2% of those age 65 or over.
Common Questions
What is Per Capita Income in Derry?
Per Capita income in Derry is $42,114.
What is the Median Family Income in Derry?
Median Family Income in Derry is $95,954.
What is the Median Household income in Derry?
Median Household Income in Derry is $83,750.
What is Income or Wage Gap in Derry?
Income or Wage Gap in Derry is 41.0%.
Women in Derry earn 59.0 cents for every dollar earned by a man.
What is Family Income Deficit in Derry?
Family Income Deficit in Derry is $20,404.
Families that are below poverty line in Derry earn $20,404 less on average than the poverty threshold level.
What is Inequality or Gini Index in Derry?
Inequality or Gini Index in Derry is 0.43.
What is the Total Population of Derry?
Total Population of Derry is 23,027.
What is the Total Male Population of Derry?
Total Male Population of Derry is 10,561.
What is the Total Female Population of Derry?
Total Female Population of Derry is 12,466.
What is the Ratio of Males per 100 Females in Derry?
There are 84.72 Males per 100 Females in Derry.
What is the Ratio of Females per 100 Males in Derry?
There are 118.04 Females per 100 Males in Derry.
What is the Median Population Age in Derry?
Median Population Age in Derry is 39.0 Years.
What is the Average Family Size in Derry
Average Family Size in Derry is 3.0 People.
What is the Average Household Size in Derry
Average Household Size in Derry is 2.5 People.
How Large is the Labor Force in Derry?
There are 12,988 People in the Labor Forcein in Derry.
What is the Percentage of People in the Labor Force in Derry?
69.3% of People are in the Labor Force in Derry.
What is the Unemployment Rate in Derry?
Unemployment Rate in Derry is 5.4%.