Shasta, CA Map & Demographics
Shasta Map
Shasta Overview
$51,003
PER CAPITA INCOME
$91,500
AVG FAMILY INCOME
$108,438
AVG HOUSEHOLD INCOME
0.46
INEQUALITY / GINI INDEX
1,376
TOTAL POPULATION
770
MALE POPULATION
606
FEMALE POPULATION
127.06
MALES / 100 FEMALES
78.70
FEMALES / 100 MALES
47.2
MEDIAN AGE
2.9
AVG FAMILY SIZE
2.8
AVG HOUSEHOLD SIZE
645
LABOR FORCE [ PEOPLE ]
53.9%
PERCENT IN LABOR FORCE
10.1%
UNEMPLOYMENT RATE
Shasta Zip Codes
Shasta Area Codes
Income in Shasta
Income Overview in Shasta
Per Capita Income in Shasta is $51,003, while median incomes of families and households are $91,500 and $108,438 respectively.
| Characteristic | Number | Measure |
| Per Capita Income | 1,376 | $51,003 |
| Median Family Income | 366 | $91,500 |
| Mean Family Income | 366 | $117,126 |
| Median Household Income | 496 | $108,438 |
| Mean Household Income | 496 | $145,725 |
| Income Deficit | 366 | $0 |
| Wage / Income Gap (%) | 1,376 | 0.00% |
| Wage / Income Gap ($) | 1,376 | 100.00¢ per $1 |
| Gini / Inequality Index | 1,376 | 0.46 |
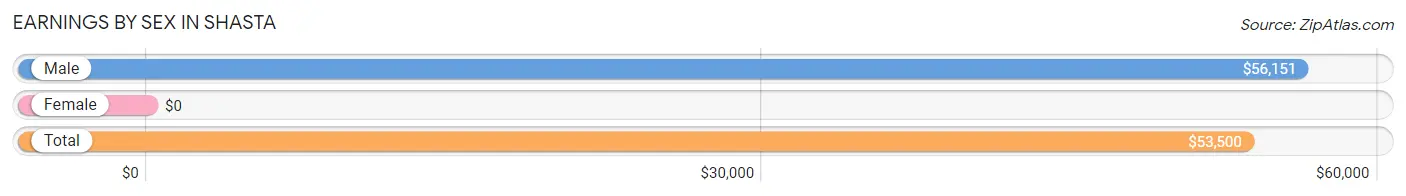
Earnings by Sex in Shasta
| Sex | Number | Average Earnings |
| Male | 323 (50.5%) | $56,151 |
| Female | 317 (49.5%) | $0 |
| Total | 640 (100.0%) | $53,500 |
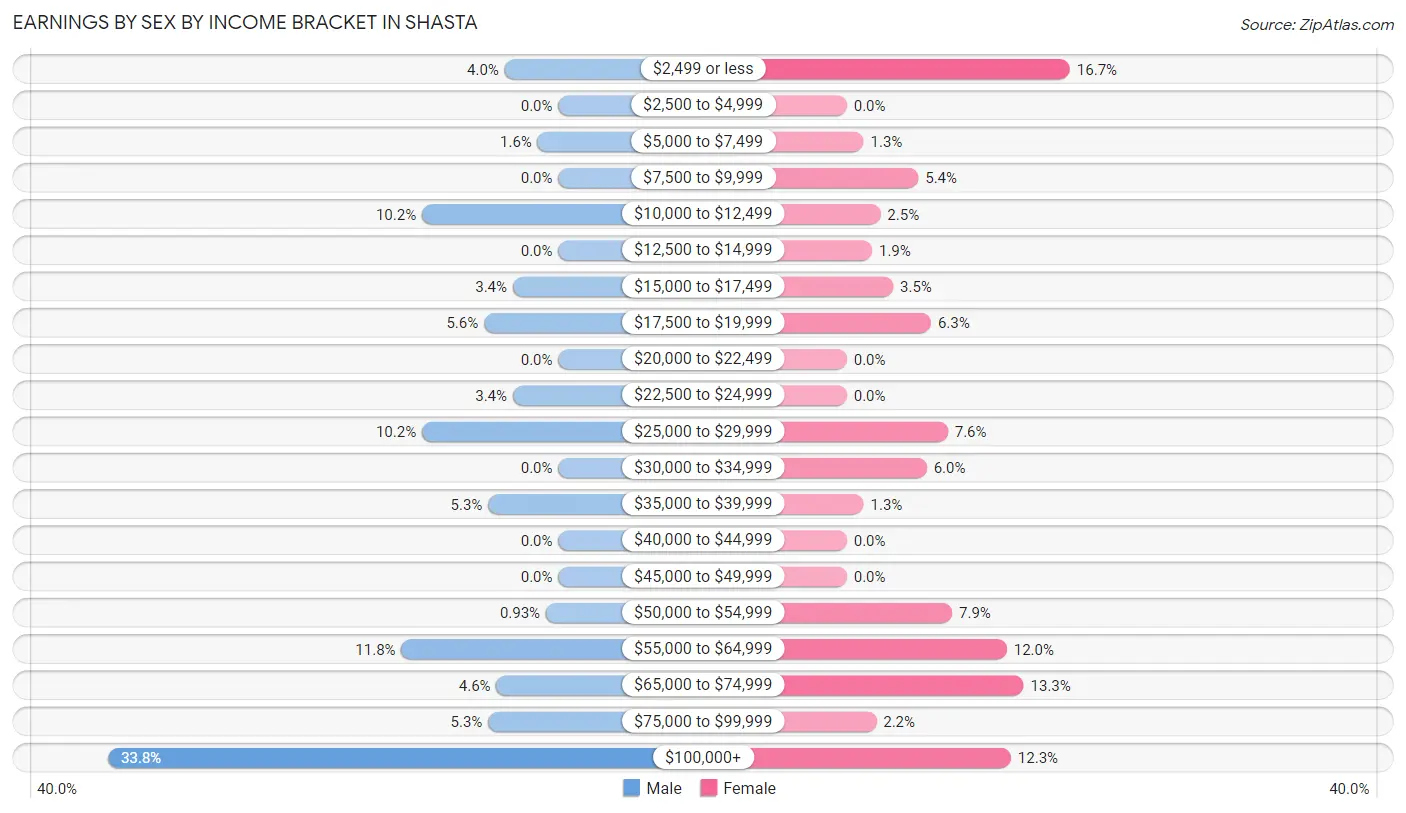
Earnings by Sex by Income Bracket in Shasta
The most common earnings brackets in Shasta are $100,000+ for men (109 | 33.8%) and $2,499 or less for women (53 | 16.7%).
| Income | Male | Female |
| $2,499 or less | 13 (4.0%) | 53 (16.7%) |
| $2,500 to $4,999 | 0 (0.0%) | 0 (0.0%) |
| $5,000 to $7,499 | 5 (1.5%) | 4 (1.3%) |
| $7,500 to $9,999 | 0 (0.0%) | 17 (5.4%) |
| $10,000 to $12,499 | 33 (10.2%) | 8 (2.5%) |
| $12,500 to $14,999 | 0 (0.0%) | 6 (1.9%) |
| $15,000 to $17,499 | 11 (3.4%) | 11 (3.5%) |
| $17,500 to $19,999 | 18 (5.6%) | 20 (6.3%) |
| $20,000 to $22,499 | 0 (0.0%) | 0 (0.0%) |
| $22,500 to $24,999 | 11 (3.4%) | 0 (0.0%) |
| $25,000 to $29,999 | 33 (10.2%) | 24 (7.6%) |
| $30,000 to $34,999 | 0 (0.0%) | 19 (6.0%) |
| $35,000 to $39,999 | 17 (5.3%) | 4 (1.3%) |
| $40,000 to $44,999 | 0 (0.0%) | 0 (0.0%) |
| $45,000 to $49,999 | 0 (0.0%) | 0 (0.0%) |
| $50,000 to $54,999 | 3 (0.9%) | 25 (7.9%) |
| $55,000 to $64,999 | 38 (11.8%) | 38 (12.0%) |
| $65,000 to $74,999 | 15 (4.6%) | 42 (13.3%) |
| $75,000 to $99,999 | 17 (5.3%) | 7 (2.2%) |
| $100,000+ | 109 (33.8%) | 39 (12.3%) |
| Total | 323 (100.0%) | 317 (100.0%) |
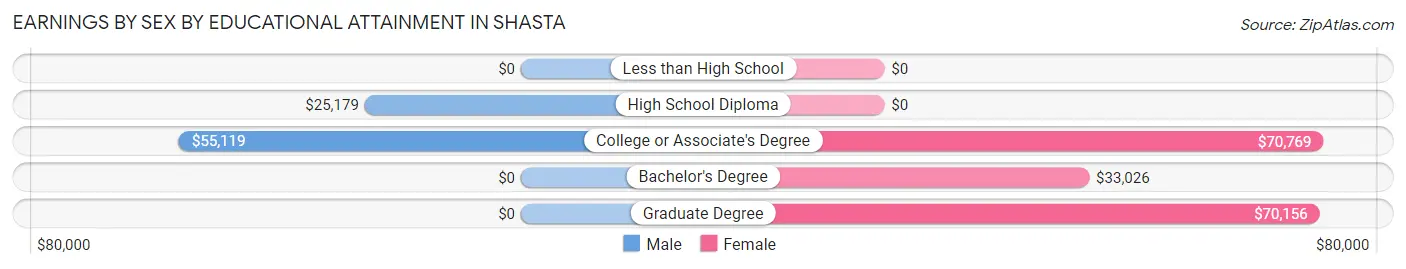
Earnings by Sex by Educational Attainment in Shasta
Average earnings in Shasta are $65,750 for men and $57,548 for women, a difference of 12.5%. Men with an educational attainment of college or associate's degree enjoy the highest average annual earnings of $55,119, while those with high school diploma education earn the least with $25,179. Women with an educational attainment of college or associate's degree earn the most with the average annual earnings of $70,769, while those with bachelor's degree education have the smallest earnings of $33,026.
| Educational Attainment | Male Income | Female Income |
| Less than High School | - | - |
| High School Diploma | $25,179 | $0 |
| College or Associate's Degree | $55,119 | $70,769 |
| Bachelor's Degree | - | - |
| Graduate Degree | - | - |
| Total | $65,750 | $57,548 |
Family Income in Shasta
Family Income Brackets in Shasta
According to the Shasta family income data, there are 83 families falling into the $35,000 to $49,999 income range, which is the most common income bracket and makes up 22.7% of all families.
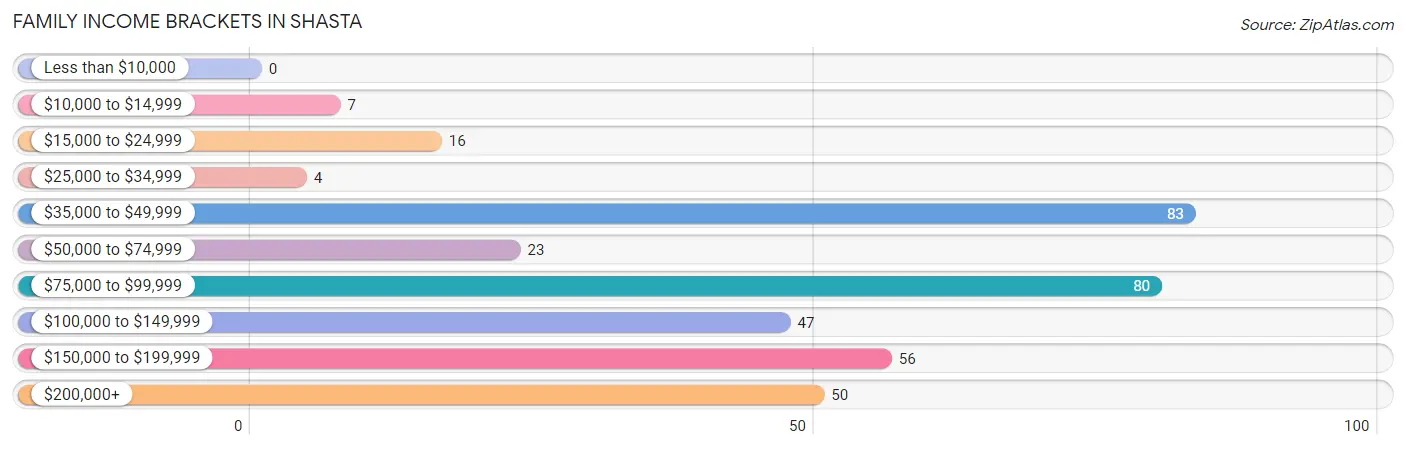
| Income Bracket | # Families | % Families |
| Less than $10,000 | 0 | 0.0% |
| $10,000 to $14,999 | 7 | 1.9% |
| $15,000 to $24,999 | 16 | 4.4% |
| $25,000 to $34,999 | 4 | 1.1% |
| $35,000 to $49,999 | 83 | 22.7% |
| $50,000 to $74,999 | 23 | 6.3% |
| $75,000 to $99,999 | 80 | 21.9% |
| $100,000 to $149,999 | 47 | 12.8% |
| $150,000 to $199,999 | 56 | 15.3% |
| $200,000+ | 50 | 13.7% |
Family Income by Famaliy Size in Shasta
5-person families (26 | 7.1%) account for the highest median family income in Shasta with $168,929 per family, while 2-person families (222 | 60.7%) have the highest median income of $44,062 per family member.
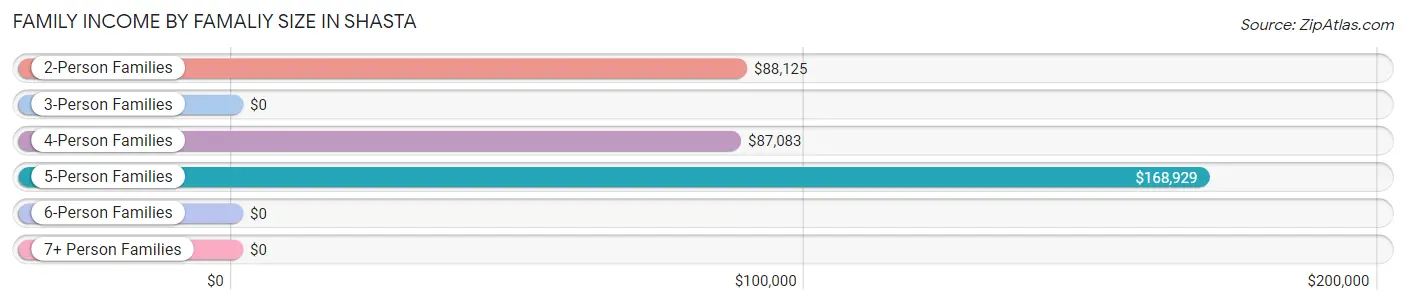
| Income Bracket | # Families | Median Income |
| 2-Person Families | 222 (60.7%) | $88,125 |
| 3-Person Families | 59 (16.1%) | $0 |
| 4-Person Families | 52 (14.2%) | $87,083 |
| 5-Person Families | 26 (7.1%) | $168,929 |
| 6-Person Families | 7 (1.9%) | $0 |
| 7+ Person Families | 0 (0.0%) | $0 |
| Total | 366 (100.0%) | $91,500 |
Family Income by Number of Earners in Shasta
The median family income in Shasta is $91,500, with families comprising 3+ earners (53) having the highest median family income of $170,461, while families with no earners (115) have the lowest median family income of $47,054, accounting for 14.5% and 31.4% of families, respectively.
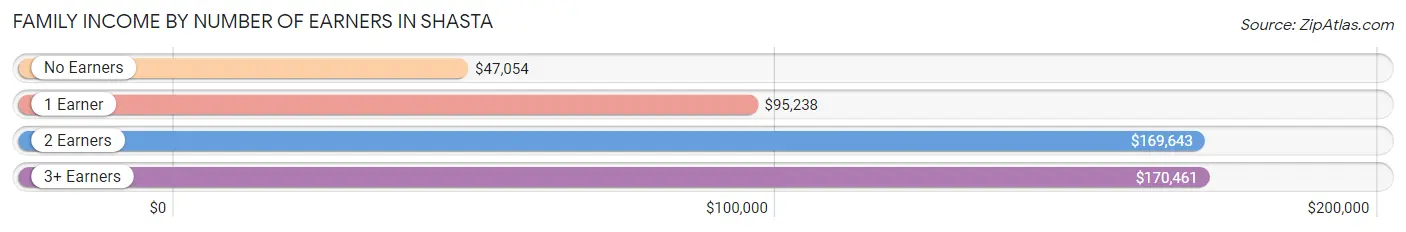
| Number of Earners | # Families | Median Income |
| No Earners | 115 (31.4%) | $47,054 |
| 1 Earner | 112 (30.6%) | $95,238 |
| 2 Earners | 86 (23.5%) | $169,643 |
| 3+ Earners | 53 (14.5%) | $170,461 |
| Total | 366 (100.0%) | $91,500 |
Household Income in Shasta
Household Income Brackets in Shasta
With 116 households falling in the category, the $100,000 to $149,999 income range is the most frequent in Shasta, accounting for 23.4% of all households. In contrast, only 4 households (0.8%) fall into the $25,000 to $34,999 income bracket, making it the least populous group.
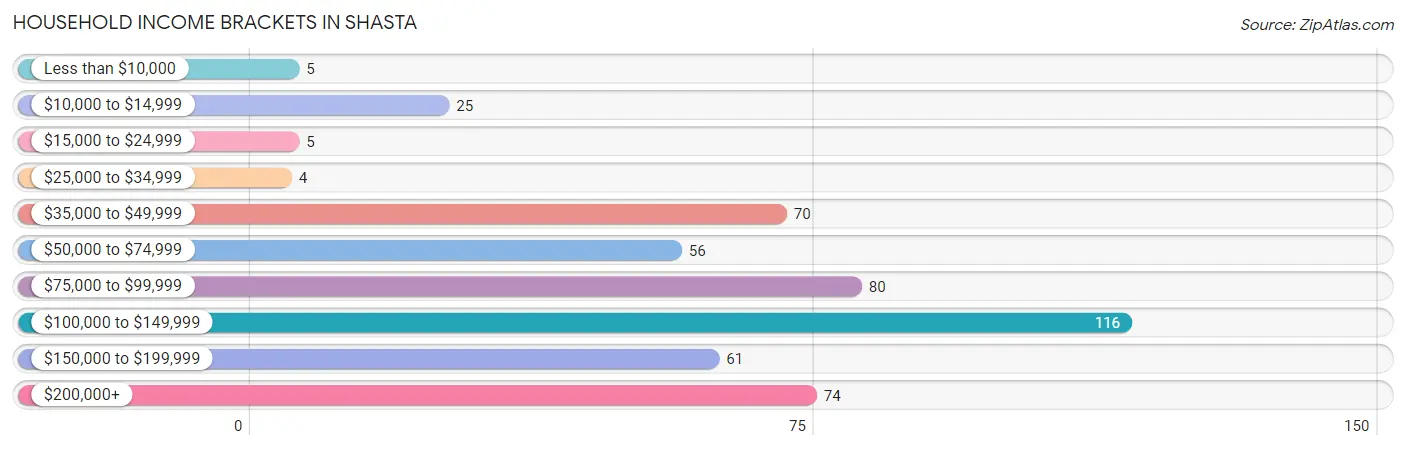
| Income Bracket | # Households | % Households |
| Less than $10,000 | 5 | 1.0% |
| $10,000 to $14,999 | 25 | 5.0% |
| $15,000 to $24,999 | 5 | 1.0% |
| $25,000 to $34,999 | 4 | 0.8% |
| $35,000 to $49,999 | 70 | 14.1% |
| $50,000 to $74,999 | 56 | 11.3% |
| $75,000 to $99,999 | 80 | 16.1% |
| $100,000 to $149,999 | 116 | 23.4% |
| $150,000 to $199,999 | 61 | 12.3% |
| $200,000+ | 74 | 14.9% |
Household Income by Householder Age in Shasta
The median household income in Shasta is $108,438, with the highest median household income of $137,740 found in the 25 to 44 years age bracket for the primary householder. A total of 113 households (22.8%) fall into this category.
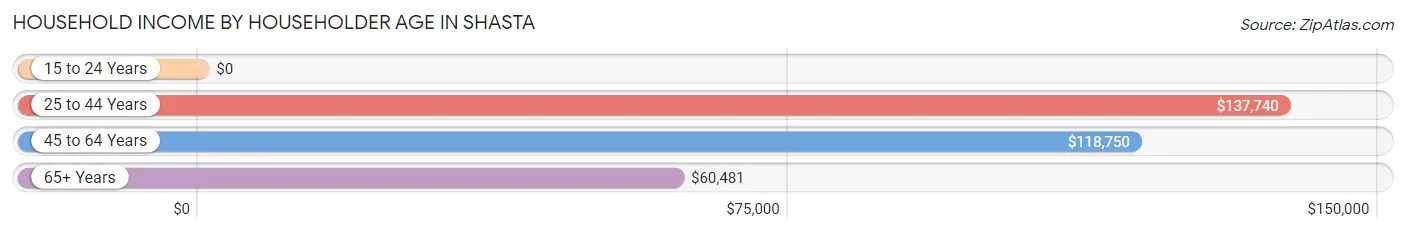
| Income Bracket | # Households | Median Income |
| 15 to 24 Years | 0 (0.0%) | $0 |
| 25 to 44 Years | 113 (22.8%) | $137,740 |
| 45 to 64 Years | 196 (39.5%) | $118,750 |
| 65+ Years | 187 (37.7%) | $60,481 |
| Total | 496 (100.0%) | $108,438 |
Poverty in Shasta
Income Below Poverty by Sex and Age in Shasta
With 11.9% poverty level for males and 9.6% for females among the residents of Shasta, under 5 year old males and 55 to 64 year old females are the most vulnerable to poverty, with 26 males (65.0%) and 20 females (25.0%) in their respective age groups living below the poverty level.
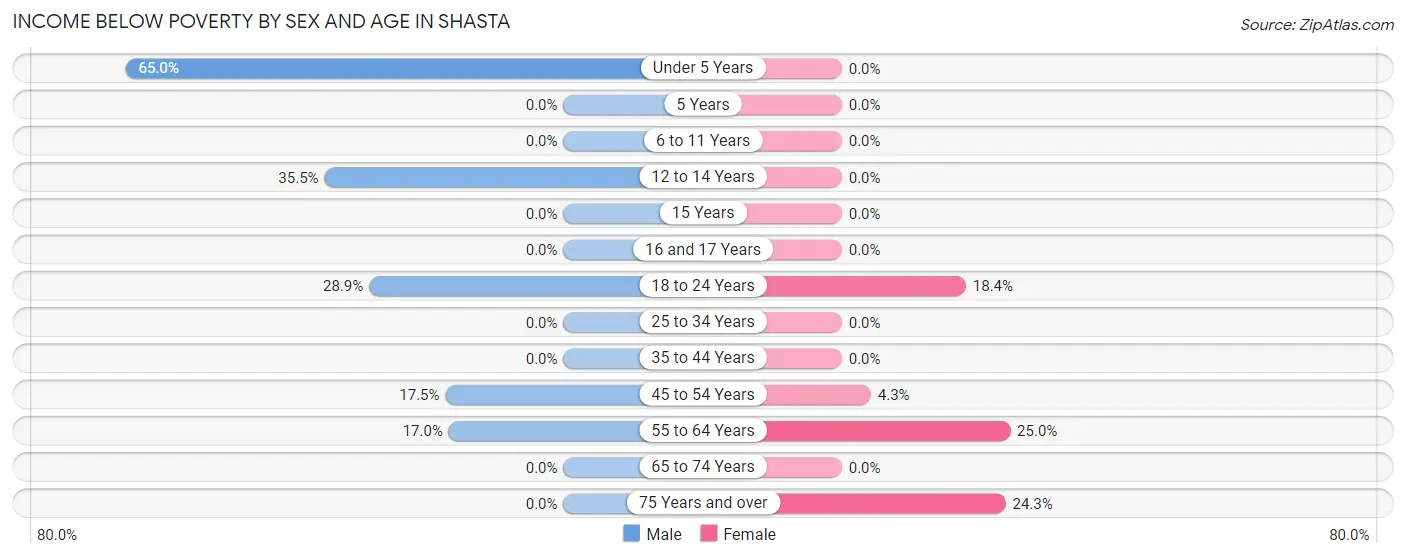
| Age Bracket | Male | Female |
| Under 5 Years | 26 (65.0%) | 0 (0.0%) |
| 5 Years | 0 (0.0%) | 0 (0.0%) |
| 6 to 11 Years | 0 (0.0%) | 0 (0.0%) |
| 12 to 14 Years | 11 (35.5%) | 0 (0.0%) |
| 15 Years | 0 (0.0%) | 0 (0.0%) |
| 16 and 17 Years | 0 (0.0%) | 0 (0.0%) |
| 18 to 24 Years | 15 (28.8%) | 14 (18.4%) |
| 25 to 34 Years | 0 (0.0%) | 0 (0.0%) |
| 35 to 44 Years | 0 (0.0%) | 0 (0.0%) |
| 45 to 54 Years | 24 (17.5%) | 5 (4.3%) |
| 55 to 64 Years | 16 (17.0%) | 20 (25.0%) |
| 65 to 74 Years | 0 (0.0%) | 0 (0.0%) |
| 75 Years and over | 0 (0.0%) | 18 (24.3%) |
| Total | 92 (11.9%) | 57 (9.6%) |
Income Above Poverty by Sex and Age in Shasta
According to the poverty statistics in Shasta, males aged 5 years and females aged 6 to 11 years are the age groups that are most secure financially, with 100.0% of males and 100.0% of females in these age groups living above the poverty line.
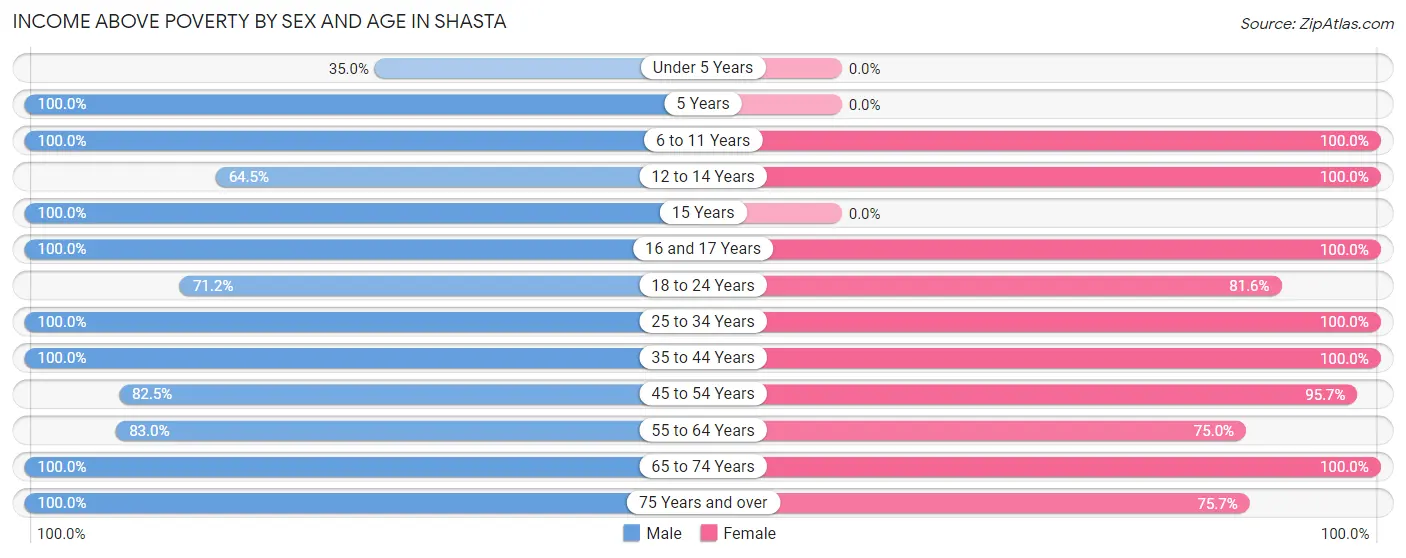
| Age Bracket | Male | Female |
| Under 5 Years | 14 (35.0%) | 0 (0.0%) |
| 5 Years | 20 (100.0%) | 0 (0.0%) |
| 6 to 11 Years | 31 (100.0%) | 29 (100.0%) |
| 12 to 14 Years | 20 (64.5%) | 6 (100.0%) |
| 15 Years | 9 (100.0%) | 0 (0.0%) |
| 16 and 17 Years | 8 (100.0%) | 23 (100.0%) |
| 18 to 24 Years | 37 (71.2%) | 62 (81.6%) |
| 25 to 34 Years | 87 (100.0%) | 61 (100.0%) |
| 35 to 44 Years | 114 (100.0%) | 49 (100.0%) |
| 45 to 54 Years | 113 (82.5%) | 111 (95.7%) |
| 55 to 64 Years | 78 (83.0%) | 60 (75.0%) |
| 65 to 74 Years | 71 (100.0%) | 78 (100.0%) |
| 75 Years and over | 76 (100.0%) | 56 (75.7%) |
| Total | 678 (88.0%) | 535 (90.4%) |
Income Below Poverty Among Married-Couple Families in Shasta
The poverty statistics for married-couple families in Shasta show that 1.5% or 4 of the total 267 families live below the poverty line. Families with no children have the highest poverty rate of 2.0%, comprising of 4 families. On the other hand, families with 1 or 2 children have the lowest poverty rate of 0.0%, which includes 0 families.
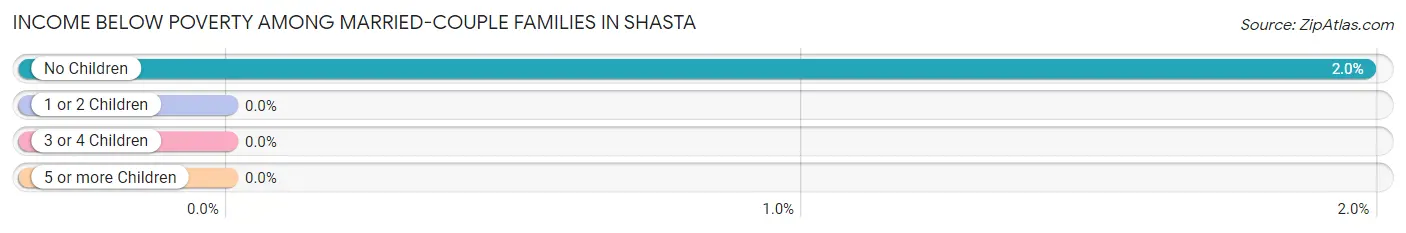
| Children | Above Poverty | Below Poverty |
| No Children | 198 (98.0%) | 4 (2.0%) |
| 1 or 2 Children | 43 (100.0%) | 0 (0.0%) |
| 3 or 4 Children | 22 (100.0%) | 0 (0.0%) |
| 5 or more Children | 0 (0.0%) | 0 (0.0%) |
| Total | 263 (98.5%) | 4 (1.5%) |
Income Below Poverty Among Single-Parent Households in Shasta
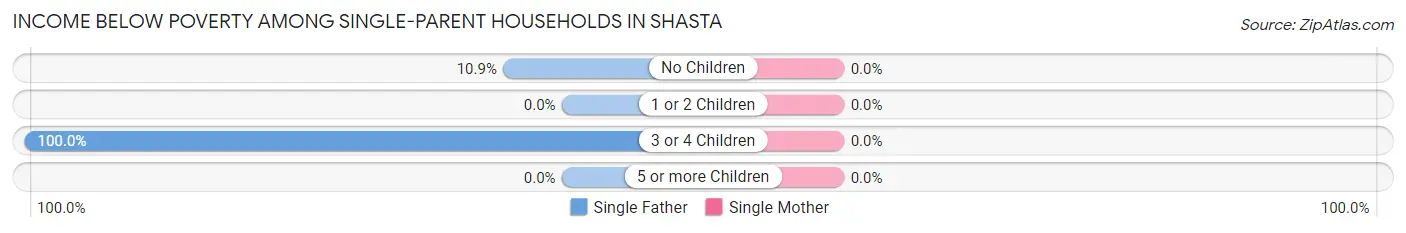
| Children | Single Father | Single Mother |
| No Children | 7 (10.9%) | 0 (0.0%) |
| 1 or 2 Children | 0 (0.0%) | 0 (0.0%) |
| 3 or 4 Children | 11 (100.0%) | 0 (0.0%) |
| 5 or more Children | 0 (0.0%) | 0 (0.0%) |
| Total | 18 (24.0%) | 0 (0.0%) |
Income Below Poverty Among Married-Couple vs Single-Parent Households in Shasta
The poverty data for Shasta shows that 4 of the married-couple family households (1.5%) and 18 of the single-parent households (18.2%) are living below the poverty level. Within the married-couple family households, those with no children have the highest poverty rate, with 4 households (2.0%) falling below the poverty line. Among the single-parent households, those with 3 or 4 children have the highest poverty rate, with 11 household (100.0%) living below poverty.
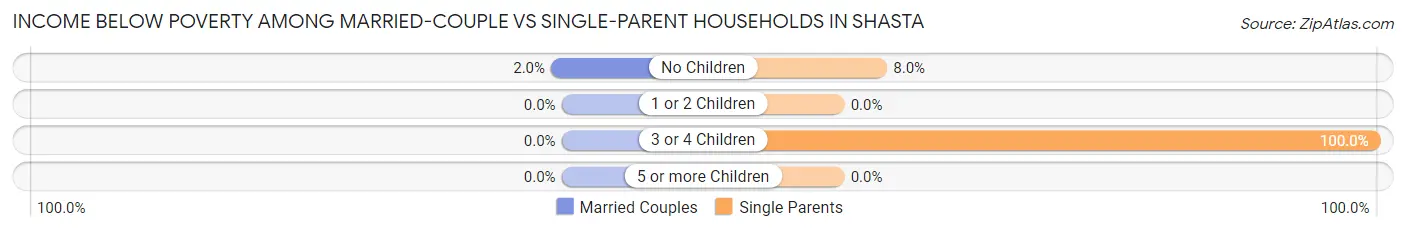
| Children | Married-Couple Families | Single-Parent Households |
| No Children | 4 (2.0%) | 7 (8.0%) |
| 1 or 2 Children | 0 (0.0%) | 0 (0.0%) |
| 3 or 4 Children | 0 (0.0%) | 11 (100.0%) |
| 5 or more Children | 0 (0.0%) | 0 (0.0%) |
| Total | 4 (1.5%) | 18 (18.2%) |
Race in Shasta
The most populous races in Shasta are White / Caucasian (1,203 | 87.4%), Two or more Races (81 | 5.9%), and Asian (35 | 2.5%).
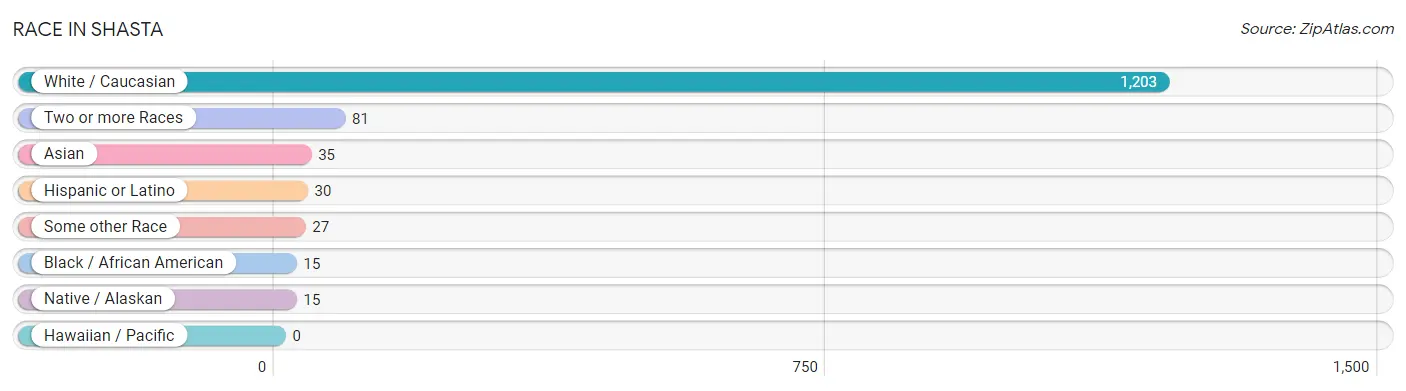
| Race | # Population | % Population |
| Asian | 35 | 2.5% |
| Black / African American | 15 | 1.1% |
| Hawaiian / Pacific | 0 | 0.0% |
| Hispanic or Latino | 30 | 2.2% |
| Native / Alaskan | 15 | 1.1% |
| White / Caucasian | 1,203 | 87.4% |
| Two or more Races | 81 | 5.9% |
| Some other Race | 27 | 2.0% |
| Total | 1,376 | 100.0% |
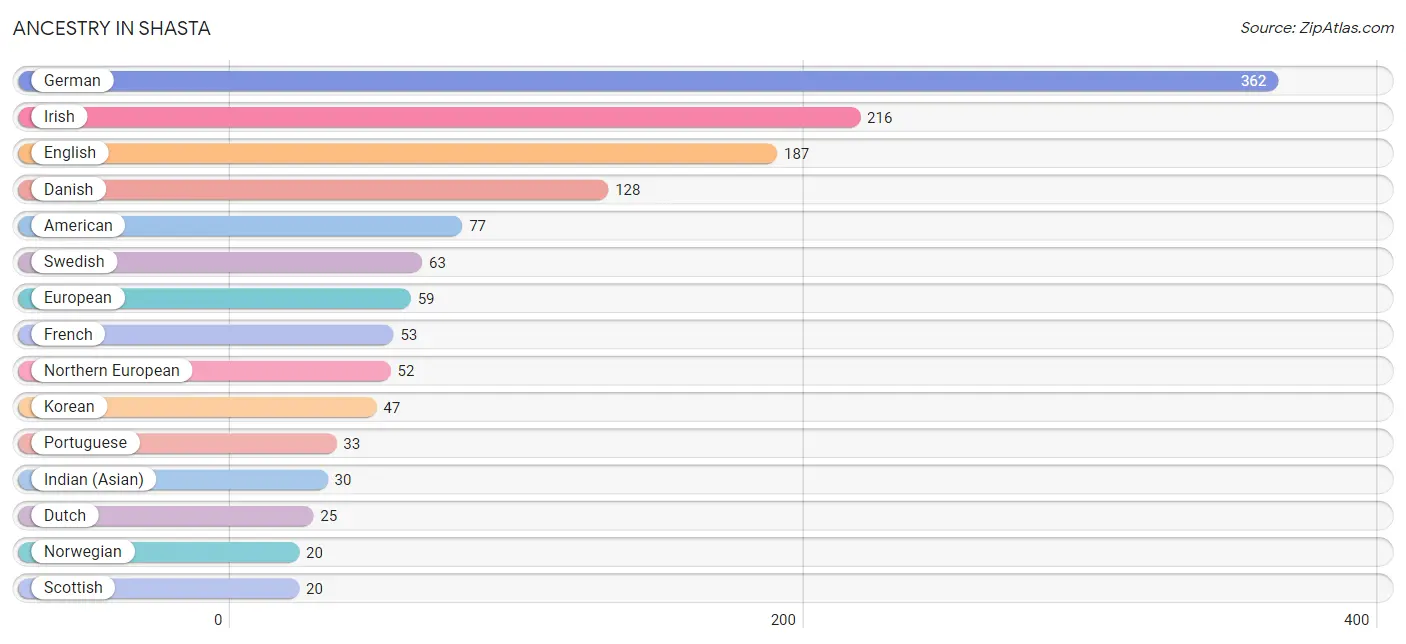
Ancestry in Shasta
The most populous ancestries reported in Shasta are German (362 | 26.3%), Irish (216 | 15.7%), English (187 | 13.6%), Danish (128 | 9.3%), and American (77 | 5.6%), together accounting for 70.5% of all Shasta residents.
| Ancestry | # Population | % Population |
| American | 77 | 5.6% |
| Bangladeshi | 5 | 0.4% |
| Basque | 12 | 0.9% |
| Danish | 128 | 9.3% |
| Dutch | 25 | 1.8% |
| English | 187 | 13.6% |
| European | 59 | 4.3% |
| Finnish | 7 | 0.5% |
| French | 53 | 3.8% |
| German | 362 | 26.3% |
| Indian (Asian) | 30 | 2.2% |
| Irish | 216 | 15.7% |
| Italian | 19 | 1.4% |
| Korean | 47 | 3.4% |
| Mexican | 16 | 1.2% |
| Mexican American Indian | 15 | 1.1% |
| Northern European | 52 | 3.8% |
| Norwegian | 20 | 1.5% |
| Pennsylvania German | 4 | 0.3% |
| Polish | 5 | 0.4% |
| Portuguese | 33 | 2.4% |
| Russian | 5 | 0.4% |
| Scotch-Irish | 4 | 0.3% |
| Scottish | 20 | 1.5% |
| Spanish | 14 | 1.0% |
| Swedish | 63 | 4.6% |
| Welsh | 10 | 0.7% | View All 27 Rows |
Immigrants in Shasta
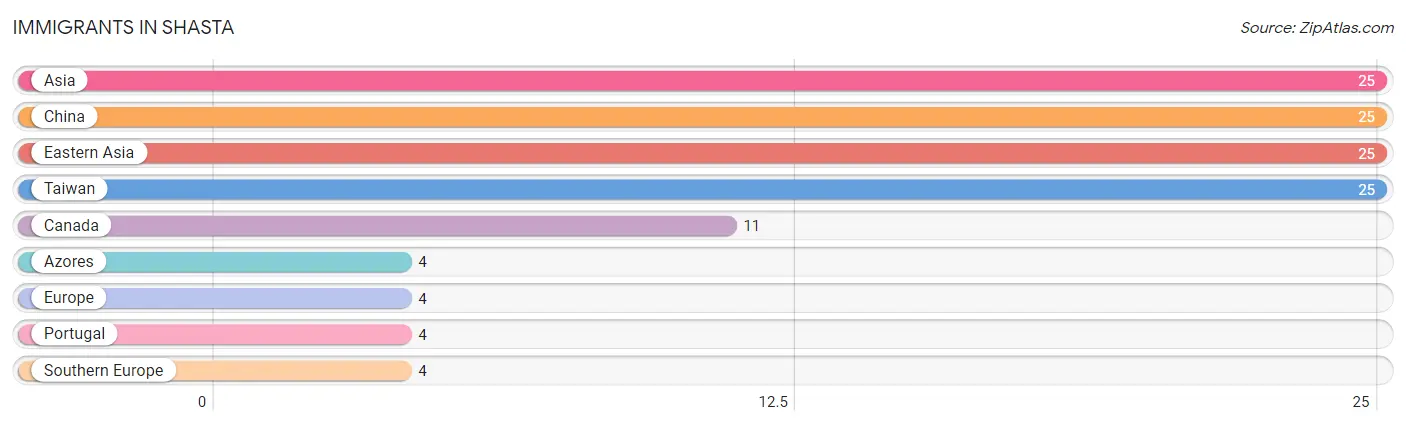
The most numerous immigrant groups reported in Shasta came from Asia (25 | 1.8%), China (25 | 1.8%), Eastern Asia (25 | 1.8%), Taiwan (25 | 1.8%), and Canada (11 | 0.8%), together accounting for 8.1% of all Shasta residents.
| Immigration Origin | # Population | % Population |
| Asia | 25 | 1.8% |
| Azores | 4 | 0.3% |
| Canada | 11 | 0.8% |
| China | 25 | 1.8% |
| Eastern Asia | 25 | 1.8% |
| Europe | 4 | 0.3% |
| Portugal | 4 | 0.3% |
| Southern Europe | 4 | 0.3% |
| Taiwan | 25 | 1.8% | View All 9 Rows |
Sex and Age in Shasta
Sex and Age in Shasta
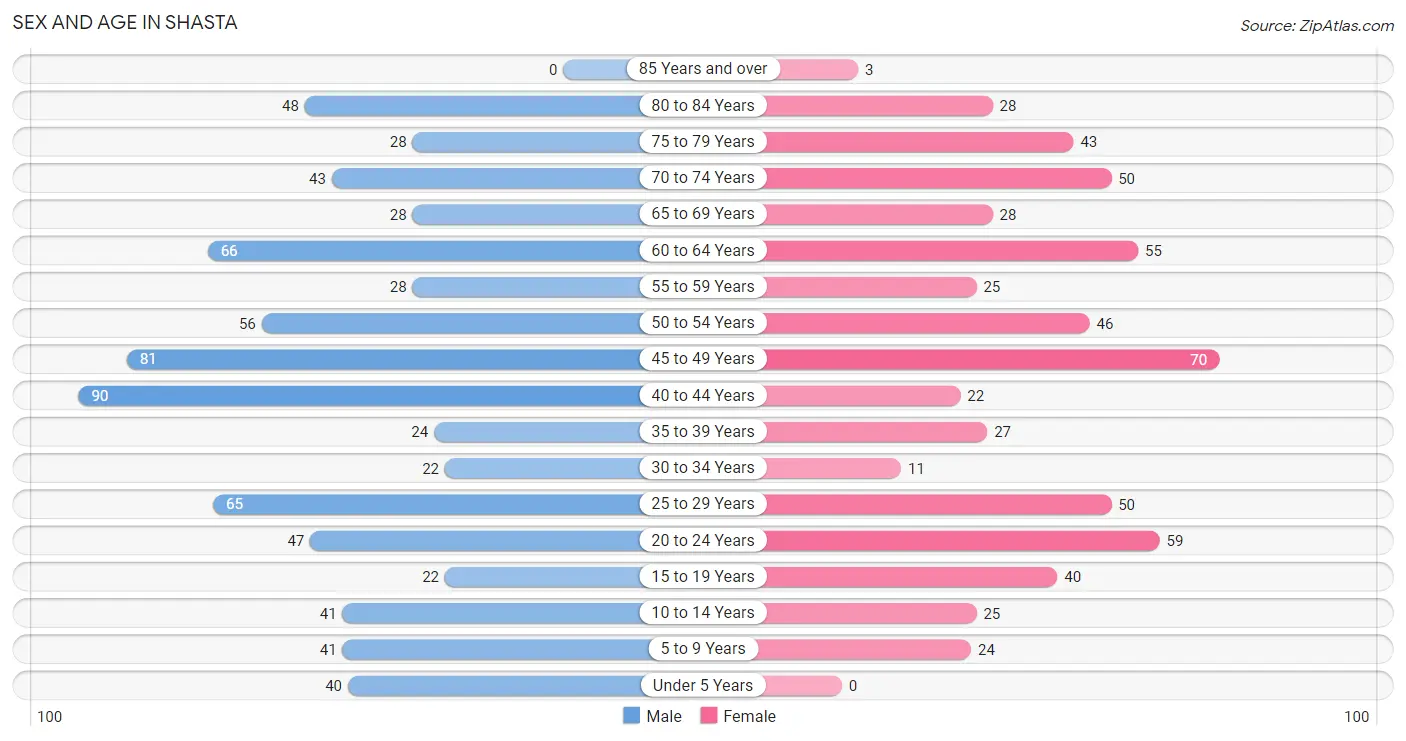
The most populous age groups in Shasta are 40 to 44 Years (90 | 11.7%) for men and 45 to 49 Years (70 | 11.6%) for women.
| Age Bracket | Male | Female |
| Under 5 Years | 40 (5.2%) | 0 (0.0%) |
| 5 to 9 Years | 41 (5.3%) | 24 (4.0%) |
| 10 to 14 Years | 41 (5.3%) | 25 (4.1%) |
| 15 to 19 Years | 22 (2.9%) | 40 (6.6%) |
| 20 to 24 Years | 47 (6.1%) | 59 (9.7%) |
| 25 to 29 Years | 65 (8.4%) | 50 (8.3%) |
| 30 to 34 Years | 22 (2.9%) | 11 (1.8%) |
| 35 to 39 Years | 24 (3.1%) | 27 (4.5%) |
| 40 to 44 Years | 90 (11.7%) | 22 (3.6%) |
| 45 to 49 Years | 81 (10.5%) | 70 (11.6%) |
| 50 to 54 Years | 56 (7.3%) | 46 (7.6%) |
| 55 to 59 Years | 28 (3.6%) | 25 (4.1%) |
| 60 to 64 Years | 66 (8.6%) | 55 (9.1%) |
| 65 to 69 Years | 28 (3.6%) | 28 (4.6%) |
| 70 to 74 Years | 43 (5.6%) | 50 (8.3%) |
| 75 to 79 Years | 28 (3.6%) | 43 (7.1%) |
| 80 to 84 Years | 48 (6.2%) | 28 (4.6%) |
| 85 Years and over | 0 (0.0%) | 3 (0.5%) |
| Total | 770 (100.0%) | 606 (100.0%) |
Families and Households in Shasta
Median Family Size in Shasta
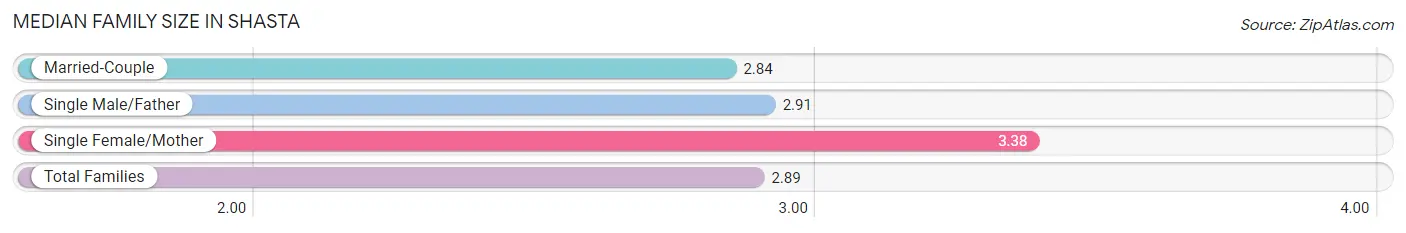
The median family size in Shasta is 2.89 persons per family, with single female/mother families (24 | 6.6%) accounting for the largest median family size of 3.38 persons per family. On the other hand, married-couple families (267 | 73.0%) represent the smallest median family size with 2.84 persons per family.
| Family Type | # Families | Family Size |
| Married-Couple | 267 (73.0%) | 2.84 |
| Single Male/Father | 75 (20.5%) | 2.91 |
| Single Female/Mother | 24 (6.6%) | 3.38 |
| Total Families | 366 (100.0%) | 2.89 |
Median Household Size in Shasta
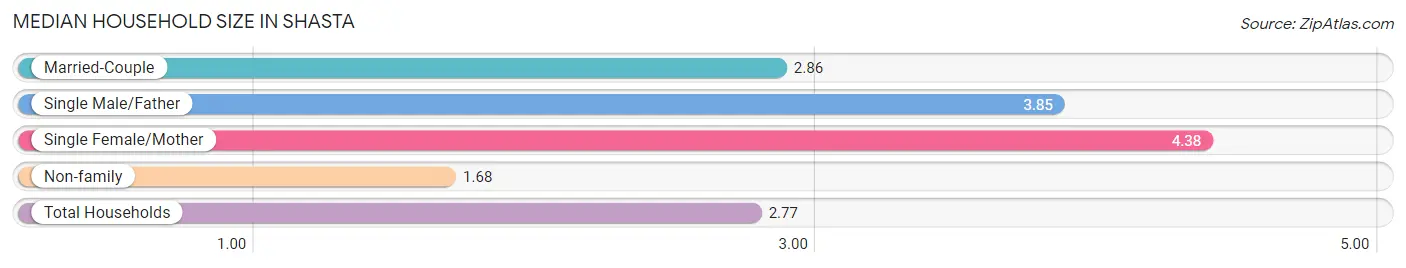
The median household size in Shasta is 2.77 persons per household, with single female/mother households (24 | 4.8%) accounting for the largest median household size of 4.38 persons per household. non-family households (130 | 26.2%) represent the smallest median household size with 1.68 persons per household.
| Household Type | # Households | Household Size |
| Married-Couple | 267 (53.8%) | 2.86 |
| Single Male/Father | 75 (15.1%) | 3.85 |
| Single Female/Mother | 24 (4.8%) | 4.38 |
| Non-family | 130 (26.2%) | 1.68 |
| Total Households | 496 (100.0%) | 2.77 |
Household Size by Marriage Status in Shasta
Out of a total of 496 households in Shasta, 366 (73.8%) are family households, while 130 (26.2%) are nonfamily households. The most numerous type of family households are 2-person households, comprising 203, and the most common type of nonfamily households are 2-person households, comprising 99.
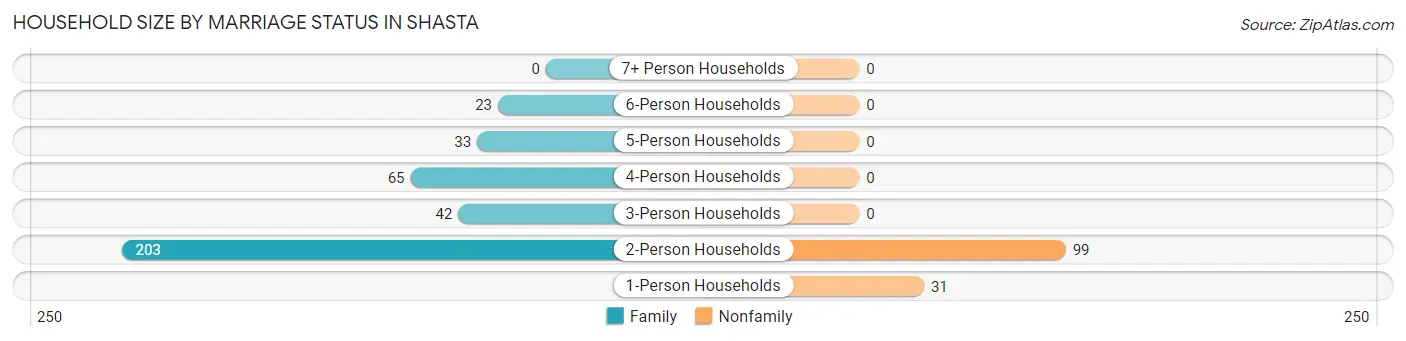
| Household Size | Family Households | Nonfamily Households |
| 1-Person Households | - | 31 (6.2%) |
| 2-Person Households | 203 (40.9%) | 99 (20.0%) |
| 3-Person Households | 42 (8.5%) | 0 (0.0%) |
| 4-Person Households | 65 (13.1%) | 0 (0.0%) |
| 5-Person Households | 33 (6.7%) | 0 (0.0%) |
| 6-Person Households | 23 (4.6%) | 0 (0.0%) |
| 7+ Person Households | 0 (0.0%) | 0 (0.0%) |
| Total | 366 (73.8%) | 130 (26.2%) |
Female Fertility in Shasta
Fertility by Age in Shasta
Average fertility rate in Shasta is 29.0 births per 1,000 women. Women in the age bracket of 35 to 50 years have the highest fertility rate with 67.0 births per 1,000 women. Women in the age bracket of 35 to 50 years acount for 100.0% of all women with births.
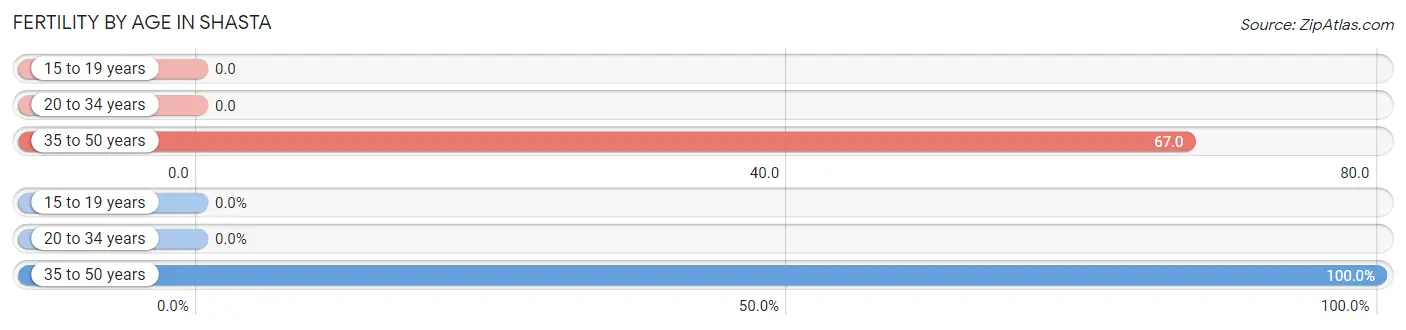
| Age Bracket | Women with Births | Births / 1,000 Women |
| 15 to 19 years | 0 (0.0%) | 0.0 |
| 20 to 34 years | 0 (0.0%) | 0.0 |
| 35 to 50 years | 8 (100.0%) | 67.0 |
| Total | 8 (100.0%) | 29.0 |
Fertility by Age by Marriage Status in Shasta
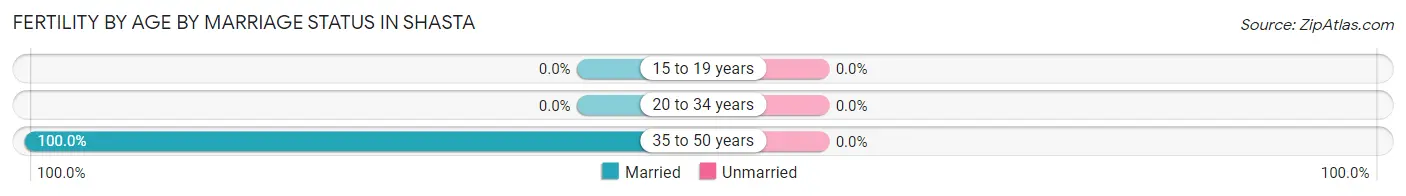
| Age Bracket | Married | Unmarried |
| 15 to 19 years | 0 (0.0%) | 0 (0.0%) |
| 20 to 34 years | 0 (0.0%) | 0 (0.0%) |
| 35 to 50 years | 8 (100.0%) | 0 (0.0%) |
| Total | 8 (100.0%) | 0 (0.0%) |
Fertility by Education in Shasta
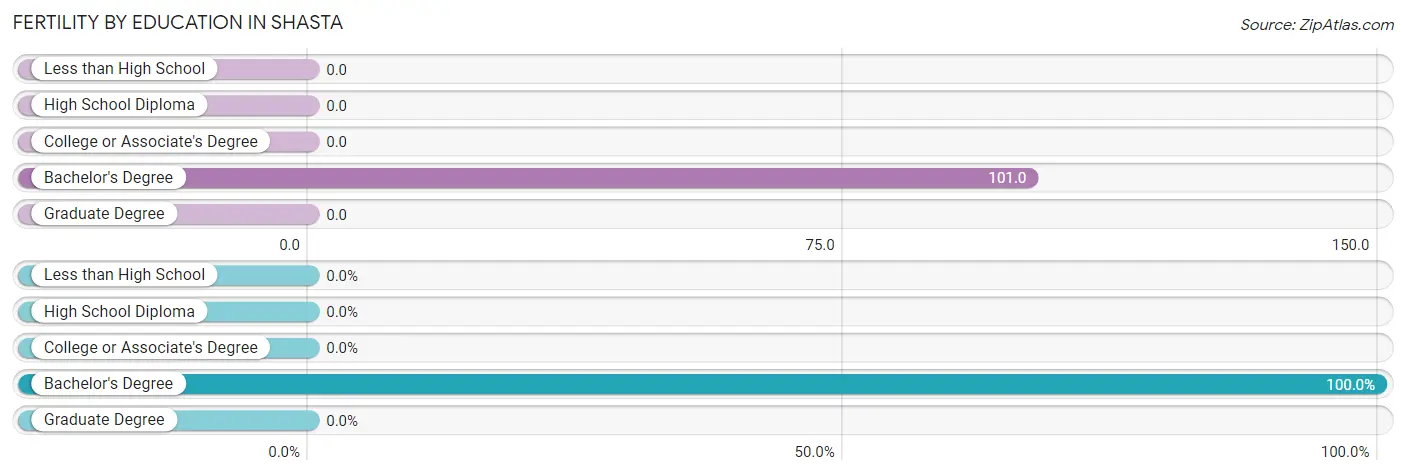
| Educational Attainment | Women with Births | Births / 1,000 Women |
| Less than High School | 0 (0.0%) | 0.0 |
| High School Diploma | 0 (0.0%) | 0.0 |
| College or Associate's Degree | 0 (0.0%) | 0.0 |
| Bachelor's Degree | 8 (100.0%) | 101.0 |
| Graduate Degree | 0 (0.0%) | 0.0 |
| Total | 8 (100.0%) | 29.0 |
Fertility by Education by Marriage Status in Shasta
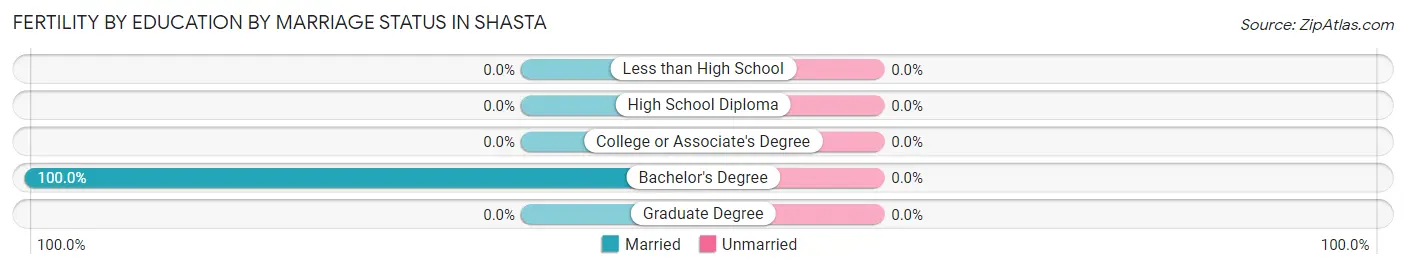
| Educational Attainment | Married | Unmarried |
| Less than High School | 0 (0.0%) | 0 (0.0%) |
| High School Diploma | 0 (0.0%) | 0 (0.0%) |
| College or Associate's Degree | 0 (0.0%) | 0 (0.0%) |
| Bachelor's Degree | 8 (100.0%) | 0 (0.0%) |
| Graduate Degree | 0 (0.0%) | 0 (0.0%) |
| Total | 8 (100.0%) | 0 (0.0%) |
Employment Characteristics in Shasta
Employment by Class of Employer in Shasta
Among the 557 employed individuals in Shasta, private company employees (263 | 47.2%), state government employees (107 | 19.2%), and self-employed (not incorporated) (69 | 12.4%) make up the most common classes of employment.
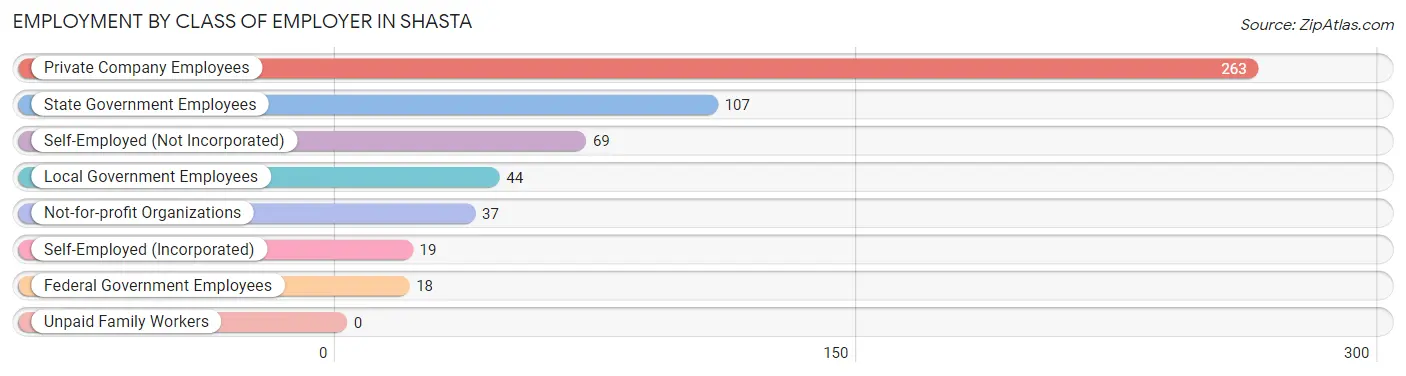
| Employer Class | # Employees | % Employees |
| Private Company Employees | 263 | 47.2% |
| Self-Employed (Incorporated) | 19 | 3.4% |
| Self-Employed (Not Incorporated) | 69 | 12.4% |
| Not-for-profit Organizations | 37 | 6.6% |
| Local Government Employees | 44 | 7.9% |
| State Government Employees | 107 | 19.2% |
| Federal Government Employees | 18 | 3.2% |
| Unpaid Family Workers | 0 | 0.0% |
| Total | 557 | 100.0% |
Employment Status by Age in Shasta
According to the labor force statistics for Shasta, out of the total population over 16 years of age (1,196), 53.9% or 645 individuals are in the labor force, with 10.1% or 65 of them unemployed. The age group with the highest labor force participation rate is 30 to 34 years, with 100.0% or 33 individuals in the labor force. Within the labor force, the 65 to 74 years age range has the highest percentage of unemployed individuals, with 24.5% or 12 of them being unemployed.
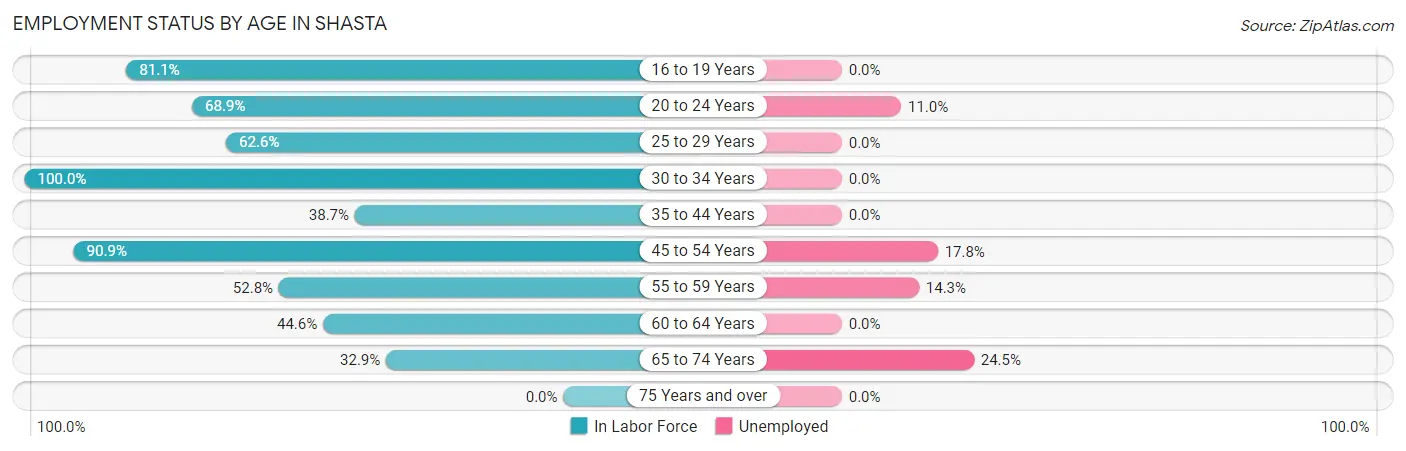
| Age Bracket | In Labor Force | Unemployed |
| 16 to 19 Years | 43 (81.1%) | 0 (0.0%) |
| 20 to 24 Years | 73 (68.9%) | 8 (11.0%) |
| 25 to 29 Years | 72 (62.6%) | 0 (0.0%) |
| 30 to 34 Years | 33 (100.0%) | 0 (0.0%) |
| 35 to 44 Years | 63 (38.7%) | 0 (0.0%) |
| 45 to 54 Years | 230 (90.9%) | 41 (17.8%) |
| 55 to 59 Years | 28 (52.8%) | 4 (14.3%) |
| 60 to 64 Years | 54 (44.6%) | 0 (0.0%) |
| 65 to 74 Years | 49 (32.9%) | 12 (24.5%) |
| 75 Years and over | 0 (0.0%) | 0 (0.0%) |
| Total | 645 (53.9%) | 65 (10.1%) |
Employment Status by Educational Attainment in Shasta
According to labor force statistics for Shasta, 65.0% of individuals (480) out of the total population between 25 and 64 years of age (738) are in the labor force, with 9.4% or 45 of them being unemployed. The group with the highest labor force participation rate are those with the educational attainment of bachelor's degree or higher, with 88.3% or 248 individuals in the labor force. Within the labor force, individuals with high school diploma education have the highest percentage of unemployment, with 34.2% or 27 of them being unemployed.
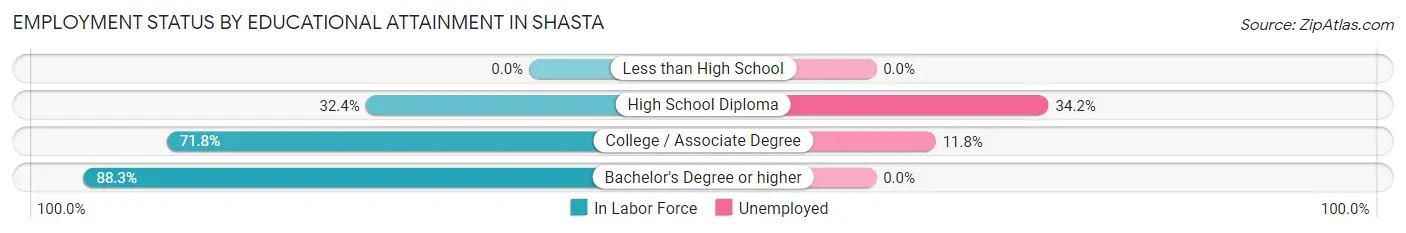
| Educational Attainment | In Labor Force | Unemployed |
| Less than High School | 0 (0.0%) | 0 (0.0%) |
| High School Diploma | 79 (32.4%) | 83 (34.2%) |
| College / Associate Degree | 153 (71.8%) | 25 (11.8%) |
| Bachelor's Degree or higher | 248 (88.3%) | 0 (0.0%) |
| Total | 480 (65.0%) | 69 (9.4%) |
Employment Occupations by Sex in Shasta
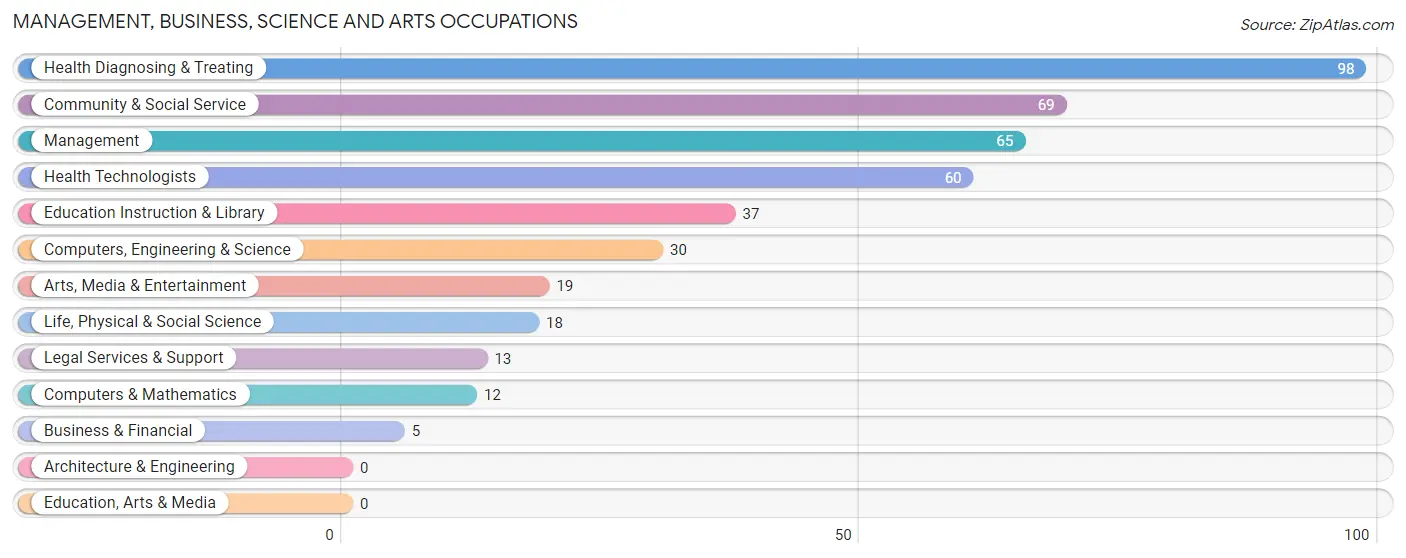
Management, Business, Science and Arts Occupations
The most common Management, Business, Science and Arts occupations in Shasta are Health Diagnosing & Treating (98 | 16.9%), Community & Social Service (69 | 11.9%), Management (65 | 11.2%), Health Technologists (60 | 10.3%), and Education Instruction & Library (37 | 6.4%).
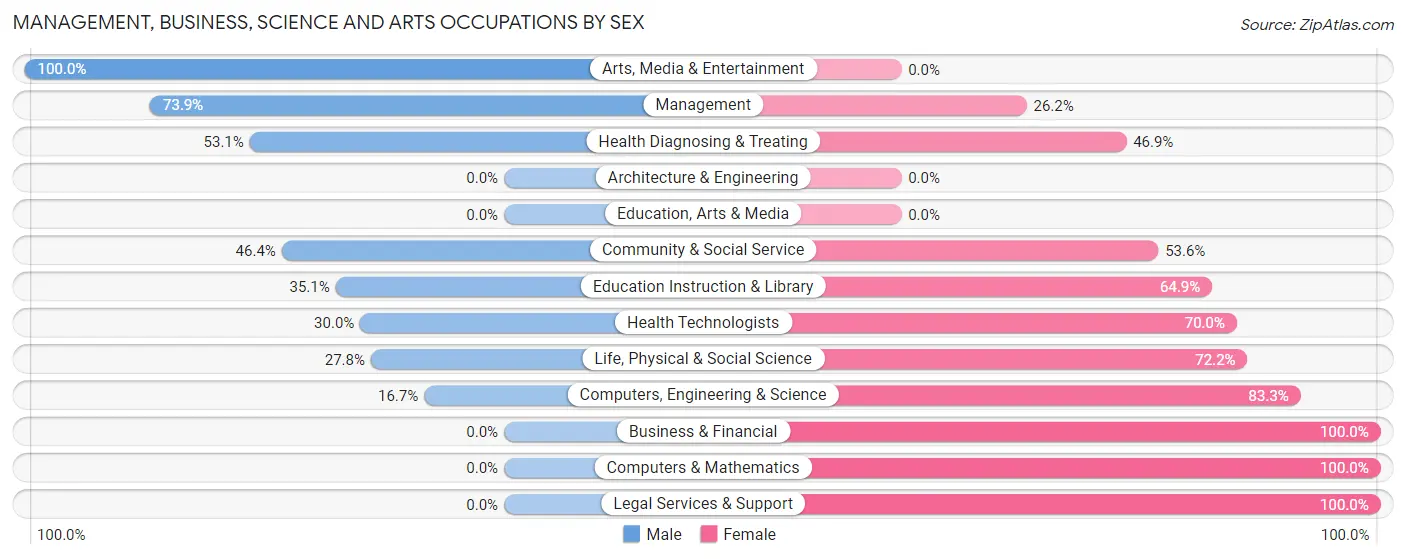
Management, Business, Science and Arts Occupations by Sex
Within the Management, Business, Science and Arts occupations in Shasta, the most male-oriented occupations are Arts, Media & Entertainment (100.0%), Management (73.9%), and Health Diagnosing & Treating (53.1%), while the most female-oriented occupations are Business & Financial (100.0%), Computers & Mathematics (100.0%), and Legal Services & Support (100.0%).
| Occupation | Male | Female |
| Management | 48 (73.9%) | 17 (26.2%) |
| Business & Financial | 0 (0.0%) | 5 (100.0%) |
| Computers, Engineering & Science | 5 (16.7%) | 25 (83.3%) |
| Computers & Mathematics | 0 (0.0%) | 12 (100.0%) |
| Architecture & Engineering | 0 (0.0%) | 0 (0.0%) |
| Life, Physical & Social Science | 5 (27.8%) | 13 (72.2%) |
| Community & Social Service | 32 (46.4%) | 37 (53.6%) |
| Education, Arts & Media | 0 (0.0%) | 0 (0.0%) |
| Legal Services & Support | 0 (0.0%) | 13 (100.0%) |
| Education Instruction & Library | 13 (35.1%) | 24 (64.9%) |
| Arts, Media & Entertainment | 19 (100.0%) | 0 (0.0%) |
| Health Diagnosing & Treating | 52 (53.1%) | 46 (46.9%) |
| Health Technologists | 18 (30.0%) | 42 (70.0%) |
| Total (Category) | 137 (51.3%) | 130 (48.7%) |
| Total (Overall) | 297 (51.2%) | 283 (48.8%) |
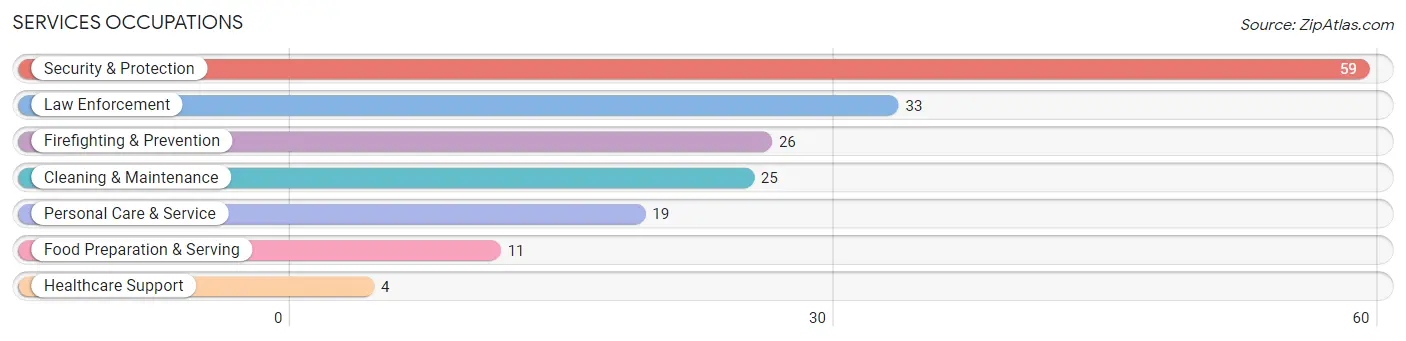
Services Occupations
The most common Services occupations in Shasta are Security & Protection (59 | 10.2%), Law Enforcement (33 | 5.7%), Firefighting & Prevention (26 | 4.5%), Cleaning & Maintenance (25 | 4.3%), and Personal Care & Service (19 | 3.3%).
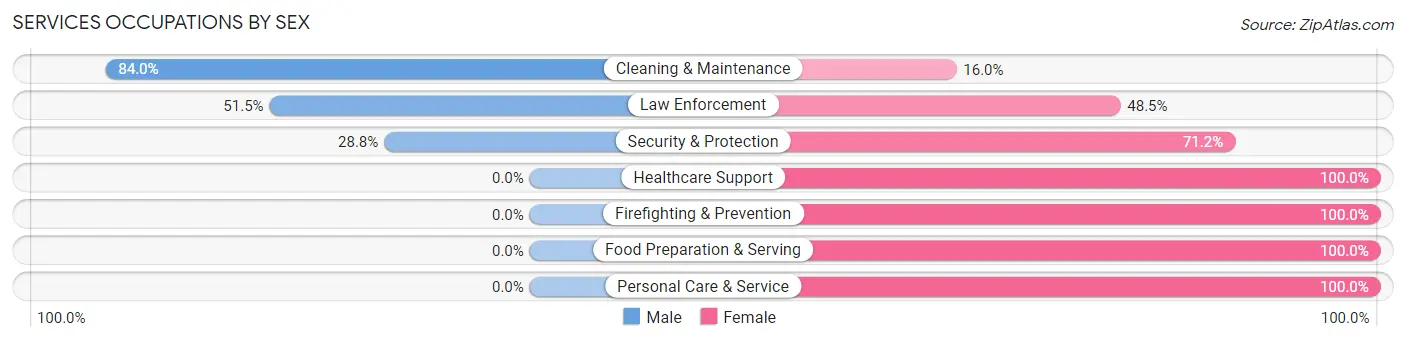
Services Occupations by Sex
Within the Services occupations in Shasta, the most male-oriented occupations are Cleaning & Maintenance (84.0%), Law Enforcement (51.5%), and Security & Protection (28.8%), while the most female-oriented occupations are Healthcare Support (100.0%), Firefighting & Prevention (100.0%), and Food Preparation & Serving (100.0%).
| Occupation | Male | Female |
| Healthcare Support | 0 (0.0%) | 4 (100.0%) |
| Security & Protection | 17 (28.8%) | 42 (71.2%) |
| Firefighting & Prevention | 0 (0.0%) | 26 (100.0%) |
| Law Enforcement | 17 (51.5%) | 16 (48.5%) |
| Food Preparation & Serving | 0 (0.0%) | 11 (100.0%) |
| Cleaning & Maintenance | 21 (84.0%) | 4 (16.0%) |
| Personal Care & Service | 0 (0.0%) | 19 (100.0%) |
| Total (Category) | 38 (32.2%) | 80 (67.8%) |
| Total (Overall) | 297 (51.2%) | 283 (48.8%) |
Sales and Office Occupations
The most common Sales and Office occupations in Shasta are Office & Administration (72 | 12.4%), and Sales & Related (37 | 6.4%).
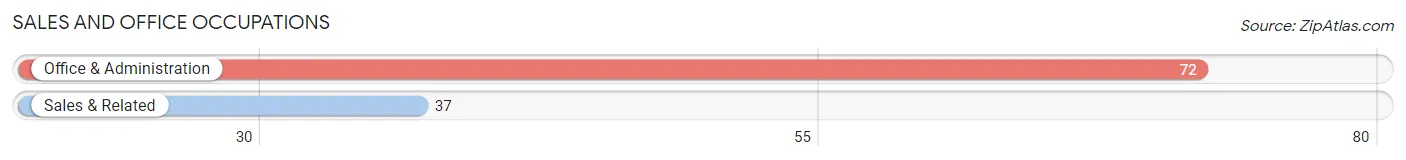
Sales and Office Occupations by Sex
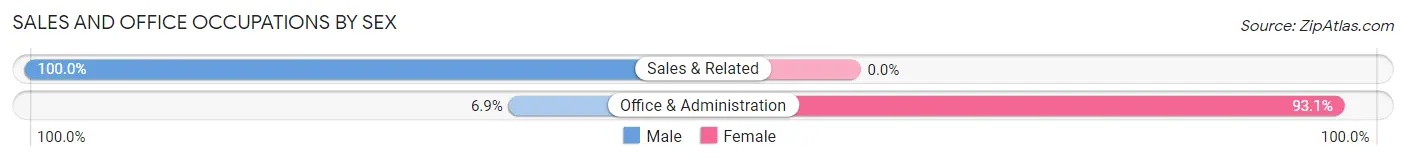
| Occupation | Male | Female |
| Sales & Related | 37 (100.0%) | 0 (0.0%) |
| Office & Administration | 5 (6.9%) | 67 (93.1%) |
| Total (Category) | 42 (38.5%) | 67 (61.5%) |
| Total (Overall) | 297 (51.2%) | 283 (48.8%) |
Natural Resources, Construction and Maintenance Occupations
The most common Natural Resources, Construction and Maintenance occupations in Shasta are Farming, Fishing & Forestry (18 | 3.1%), and Installation, Maintenance & Repair (11 | 1.9%).
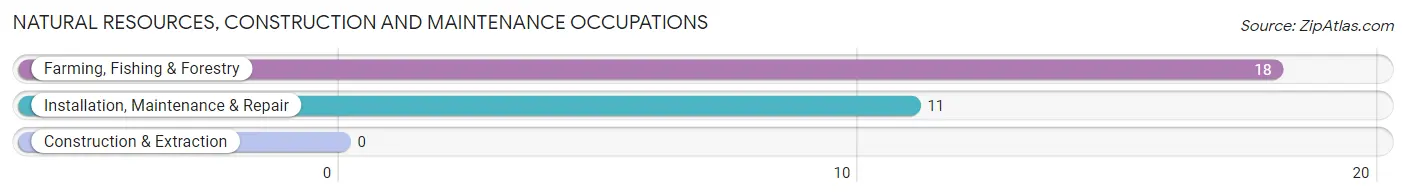
Natural Resources, Construction and Maintenance Occupations by Sex
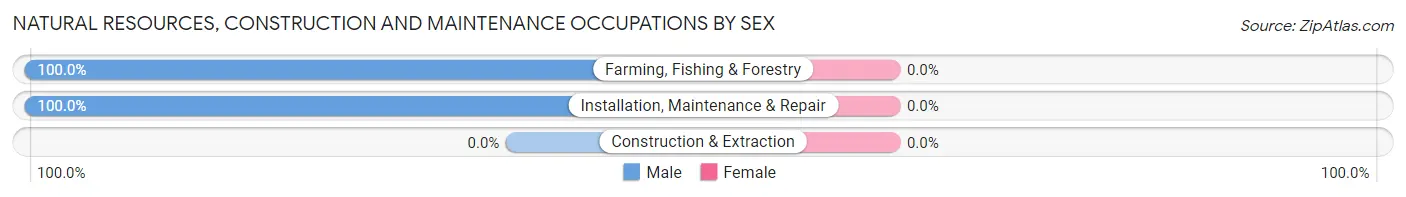
| Occupation | Male | Female |
| Farming, Fishing & Forestry | 18 (100.0%) | 0 (0.0%) |
| Construction & Extraction | 0 (0.0%) | 0 (0.0%) |
| Installation, Maintenance & Repair | 11 (100.0%) | 0 (0.0%) |
| Total (Category) | 29 (100.0%) | 0 (0.0%) |
| Total (Overall) | 297 (51.2%) | 283 (48.8%) |
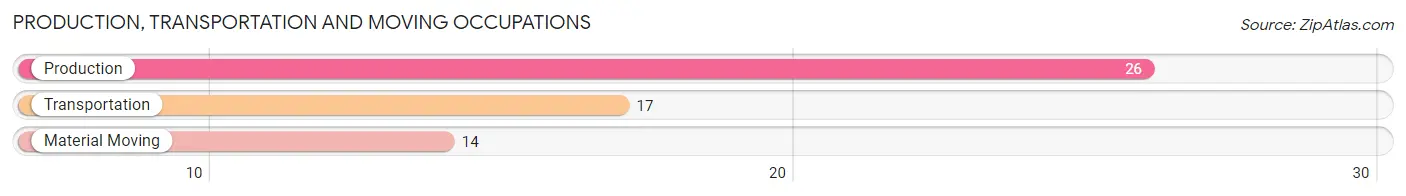
Production, Transportation and Moving Occupations
The most common Production, Transportation and Moving occupations in Shasta are Production (26 | 4.5%), Transportation (17 | 2.9%), and Material Moving (14 | 2.4%).
Production, Transportation and Moving Occupations by Sex
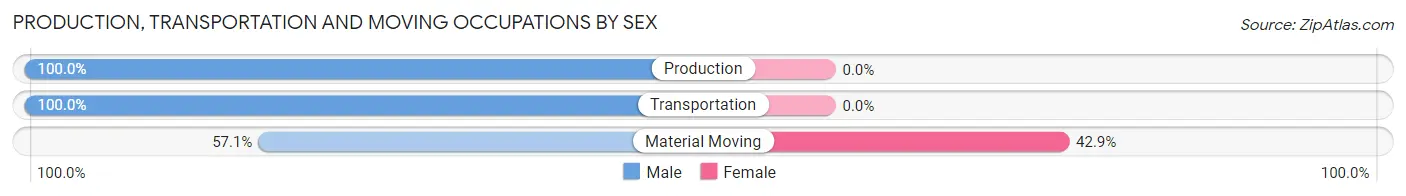
| Occupation | Male | Female |
| Production | 26 (100.0%) | 0 (0.0%) |
| Transportation | 17 (100.0%) | 0 (0.0%) |
| Material Moving | 8 (57.1%) | 6 (42.9%) |
| Total (Category) | 51 (89.5%) | 6 (10.5%) |
| Total (Overall) | 297 (51.2%) | 283 (48.8%) |
Employment Industries by Sex in Shasta
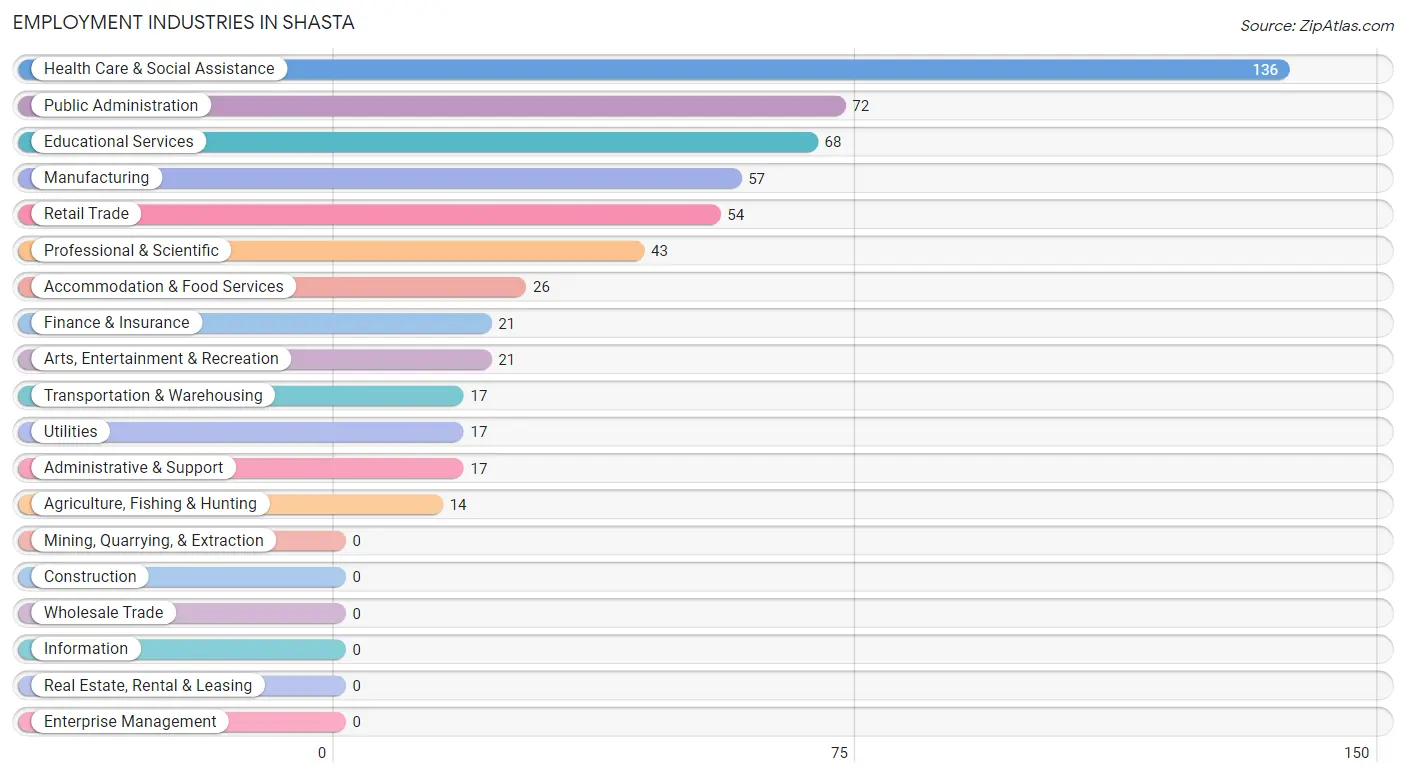
Employment Industries in Shasta
The major employment industries in Shasta include Health Care & Social Assistance (136 | 23.4%), Public Administration (72 | 12.4%), Educational Services (68 | 11.7%), Manufacturing (57 | 9.8%), and Retail Trade (54 | 9.3%).
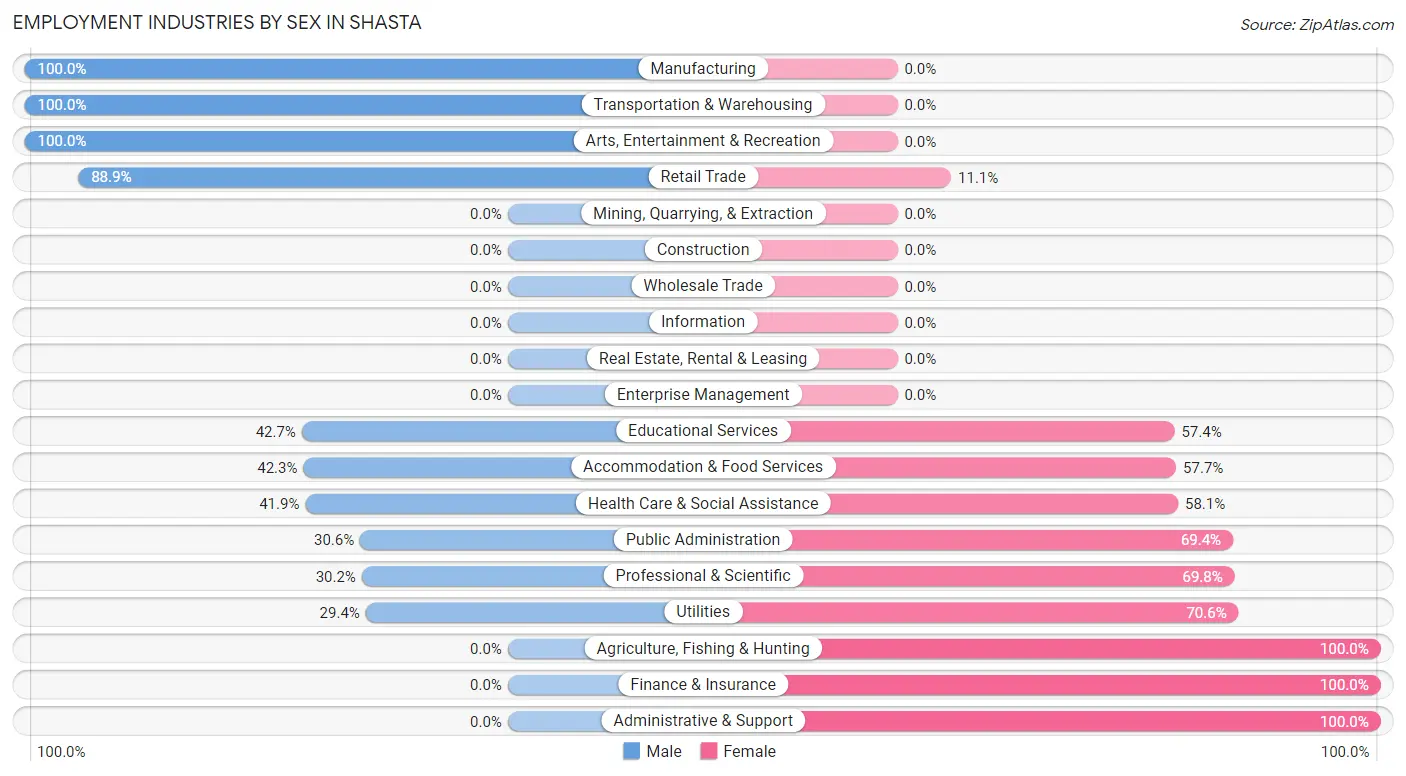
Employment Industries by Sex in Shasta
The Shasta industries that see more men than women are Manufacturing (100.0%), Transportation & Warehousing (100.0%), and Arts, Entertainment & Recreation (100.0%), whereas the industries that tend to have a higher number of women are Agriculture, Fishing & Hunting (100.0%), Finance & Insurance (100.0%), and Administrative & Support (100.0%).
| Industry | Male | Female |
| Agriculture, Fishing & Hunting | 0 (0.0%) | 14 (100.0%) |
| Mining, Quarrying, & Extraction | 0 (0.0%) | 0 (0.0%) |
| Construction | 0 (0.0%) | 0 (0.0%) |
| Manufacturing | 57 (100.0%) | 0 (0.0%) |
| Wholesale Trade | 0 (0.0%) | 0 (0.0%) |
| Retail Trade | 48 (88.9%) | 6 (11.1%) |
| Transportation & Warehousing | 17 (100.0%) | 0 (0.0%) |
| Utilities | 5 (29.4%) | 12 (70.6%) |
| Information | 0 (0.0%) | 0 (0.0%) |
| Finance & Insurance | 0 (0.0%) | 21 (100.0%) |
| Real Estate, Rental & Leasing | 0 (0.0%) | 0 (0.0%) |
| Professional & Scientific | 13 (30.2%) | 30 (69.8%) |
| Enterprise Management | 0 (0.0%) | 0 (0.0%) |
| Administrative & Support | 0 (0.0%) | 17 (100.0%) |
| Educational Services | 29 (42.6%) | 39 (57.4%) |
| Health Care & Social Assistance | 57 (41.9%) | 79 (58.1%) |
| Arts, Entertainment & Recreation | 21 (100.0%) | 0 (0.0%) |
| Accommodation & Food Services | 11 (42.3%) | 15 (57.7%) |
| Public Administration | 22 (30.6%) | 50 (69.4%) |
| Total | 297 (51.2%) | 283 (48.8%) |
Education in Shasta
School Enrollment in Shasta
The most common levels of schooling among the 290 students in Shasta are college / undergraduate (101 | 34.8%), middle school (62 | 21.4%), and elementary school (45 | 15.5%).
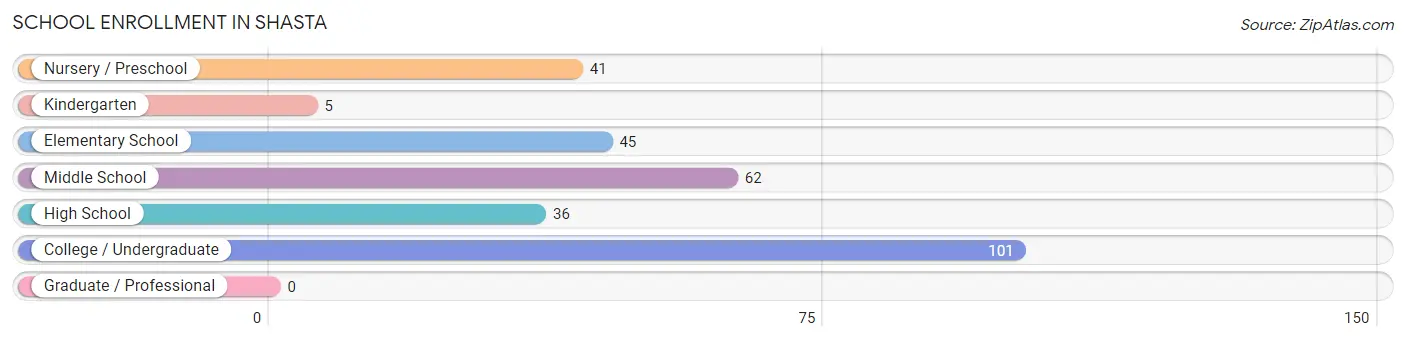
| School Level | # Students | % Students |
| Nursery / Preschool | 41 | 14.1% |
| Kindergarten | 5 | 1.7% |
| Elementary School | 45 | 15.5% |
| Middle School | 62 | 21.4% |
| High School | 36 | 12.4% |
| College / Undergraduate | 101 | 34.8% |
| Graduate / Professional | 0 | 0.0% |
| Total | 290 | 100.0% |
School Enrollment by Age by Funding Source in Shasta
Out of a total of 290 students who are enrolled in schools in Shasta, 75 (25.9%) attend a private institution, while the remaining 215 (74.1%) are enrolled in public schools. The age group of 18 to 19 year olds has the highest likelihood of being enrolled in private schools, with 17 (100.0% in the age bracket) enrolled. Conversely, the age group of 3 to 4 year olds has the lowest likelihood of being enrolled in a private school, with 26 (100.0% in the age bracket) attending a public institution.
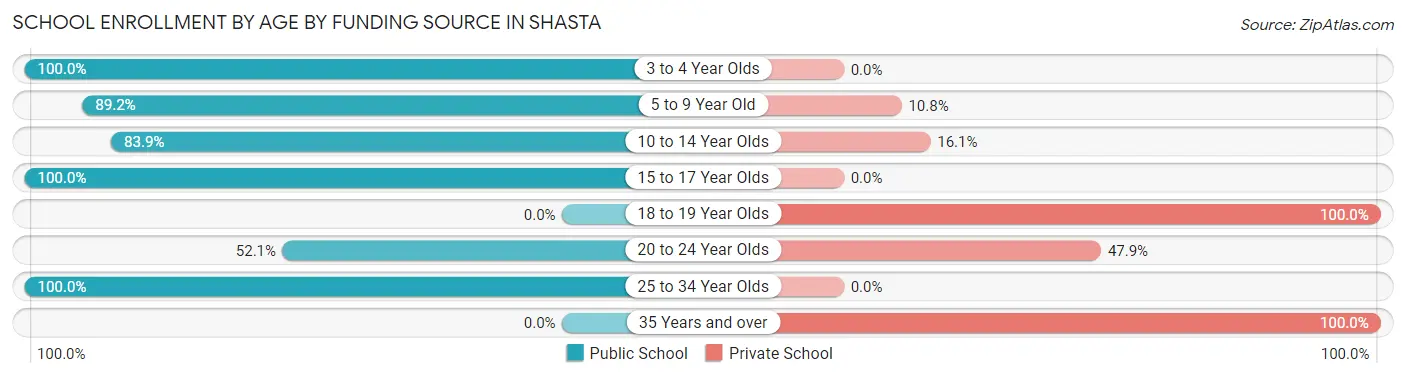
| Age Bracket | Public School | Private School |
| 3 to 4 Year Olds | 26 (100.0%) | 0 (0.0%) |
| 5 to 9 Year Old | 58 (89.2%) | 7 (10.8%) |
| 10 to 14 Year Olds | 52 (83.9%) | 10 (16.1%) |
| 15 to 17 Year Olds | 40 (100.0%) | 0 (0.0%) |
| 18 to 19 Year Olds | 0 (0.0%) | 17 (100.0%) |
| 20 to 24 Year Olds | 25 (52.1%) | 23 (47.9%) |
| 25 to 34 Year Olds | 14 (100.0%) | 0 (0.0%) |
| 35 Years and over | 0 (0.0%) | 18 (100.0%) |
| Total | 215 (74.1%) | 75 (25.9%) |
Educational Attainment by Field of Study in Shasta
Bio, nature & agricultural (84 | 21.4%), social sciences (71 | 18.1%), arts & humanities (42 | 10.7%), science & technology (34 | 8.7%), and literature & languages (28 | 7.1%) are the most common fields of study among 392 individuals in Shasta who have obtained a bachelor's degree or higher.
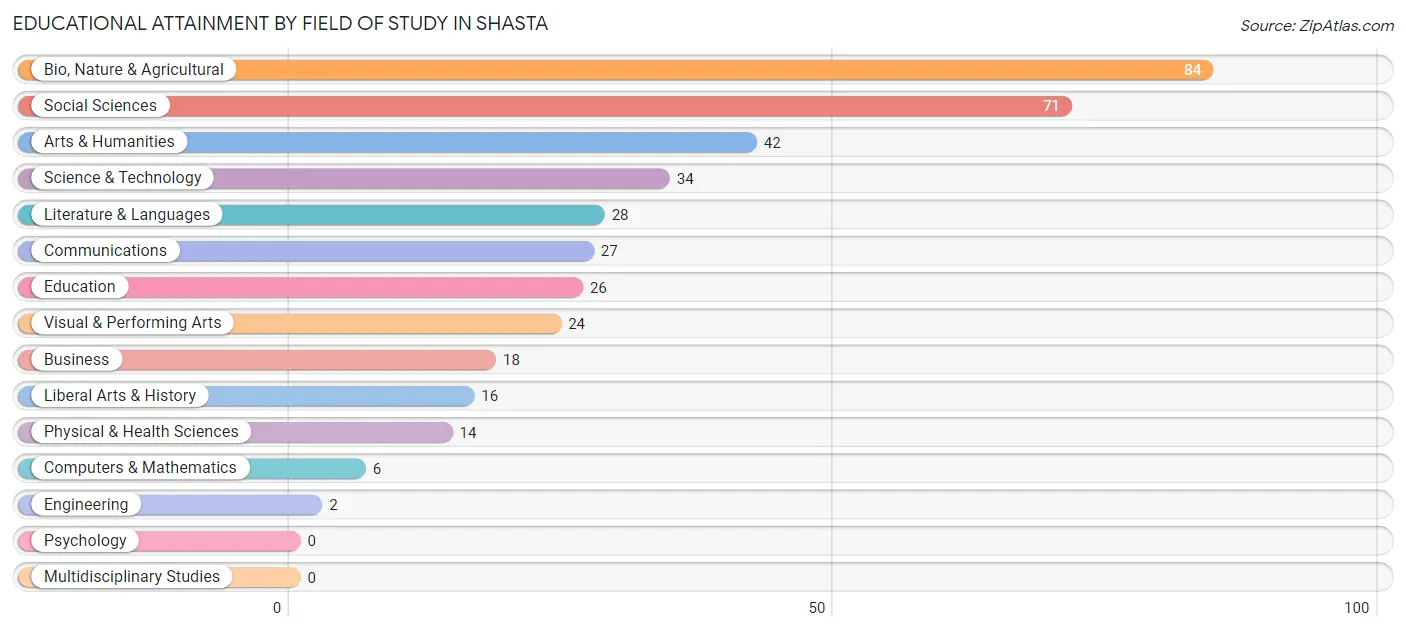
| Field of Study | # Graduates | % Graduates |
| Computers & Mathematics | 6 | 1.5% |
| Bio, Nature & Agricultural | 84 | 21.4% |
| Physical & Health Sciences | 14 | 3.6% |
| Psychology | 0 | 0.0% |
| Social Sciences | 71 | 18.1% |
| Engineering | 2 | 0.5% |
| Multidisciplinary Studies | 0 | 0.0% |
| Science & Technology | 34 | 8.7% |
| Business | 18 | 4.6% |
| Education | 26 | 6.6% |
| Literature & Languages | 28 | 7.1% |
| Liberal Arts & History | 16 | 4.1% |
| Visual & Performing Arts | 24 | 6.1% |
| Communications | 27 | 6.9% |
| Arts & Humanities | 42 | 10.7% |
| Total | 392 | 100.0% |
Transportation & Commute in Shasta
Vehicle Availability by Sex in Shasta
The most prevalent vehicle ownership categories in Shasta are males with 3 vehicles (112, accounting for 39.2%) and females with 3 vehicles (65, making up 41.3%).
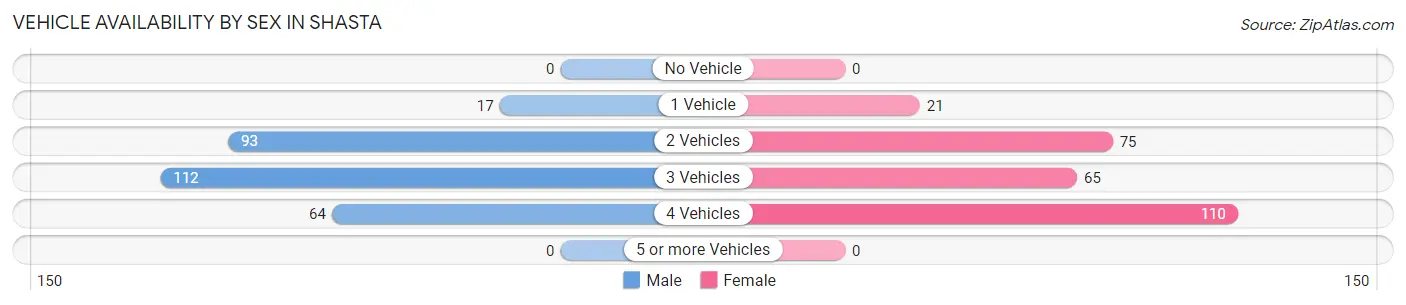
| Vehicles Available | Male | Female |
| No Vehicle | 0 (0.0%) | 0 (0.0%) |
| 1 Vehicle | 17 (5.9%) | 21 (7.7%) |
| 2 Vehicles | 93 (32.5%) | 75 (27.7%) |
| 3 Vehicles | 112 (39.2%) | 65 (24.0%) |
| 4 Vehicles | 64 (22.4%) | 110 (40.6%) |
| 5 or more Vehicles | 0 (0.0%) | 0 (0.0%) |
| Total | 286 (100.0%) | 271 (100.0%) |
Commute Time in Shasta
The most frequently occuring commute durations in Shasta are 20 to 24 minutes (169 commuters, 32.9%), 10 to 14 minutes (111 commuters, 21.6%), and 30 to 34 minutes (42 commuters, 8.2%).
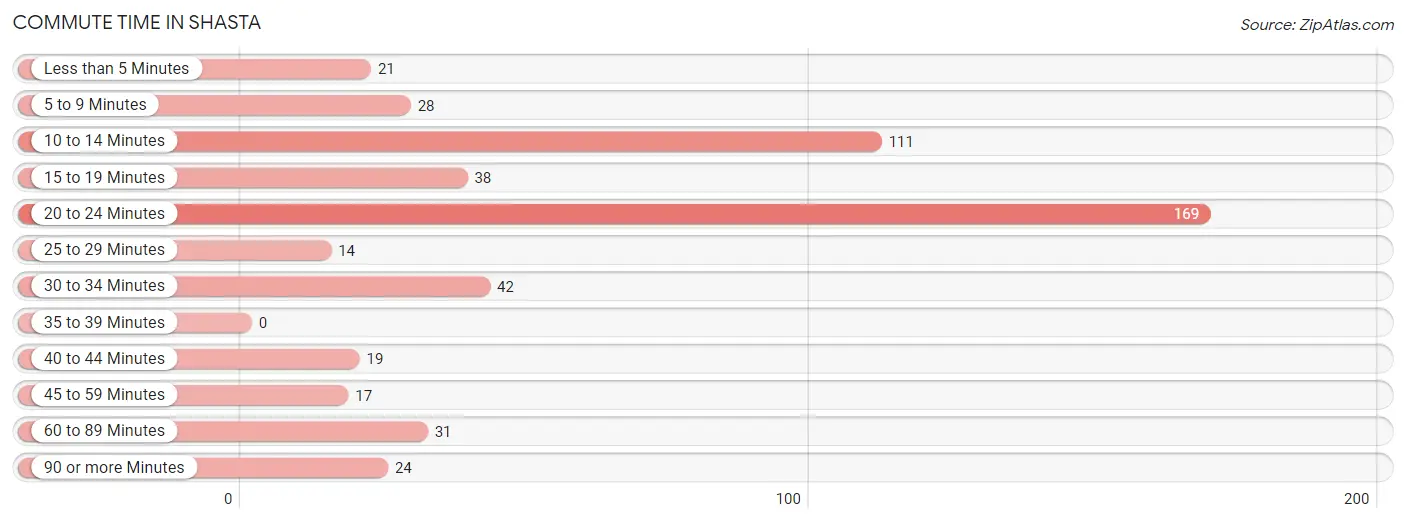
| Commute Time | # Commuters | % Commuters |
| Less than 5 Minutes | 21 | 4.1% |
| 5 to 9 Minutes | 28 | 5.4% |
| 10 to 14 Minutes | 111 | 21.6% |
| 15 to 19 Minutes | 38 | 7.4% |
| 20 to 24 Minutes | 169 | 32.9% |
| 25 to 29 Minutes | 14 | 2.7% |
| 30 to 34 Minutes | 42 | 8.2% |
| 35 to 39 Minutes | 0 | 0.0% |
| 40 to 44 Minutes | 19 | 3.7% |
| 45 to 59 Minutes | 17 | 3.3% |
| 60 to 89 Minutes | 31 | 6.0% |
| 90 or more Minutes | 24 | 4.7% |
Commute Time by Sex in Shasta
The most common commute times in Shasta are 10 to 14 minutes (81 commuters, 30.8%) for males and 20 to 24 minutes (137 commuters, 54.6%) for females.
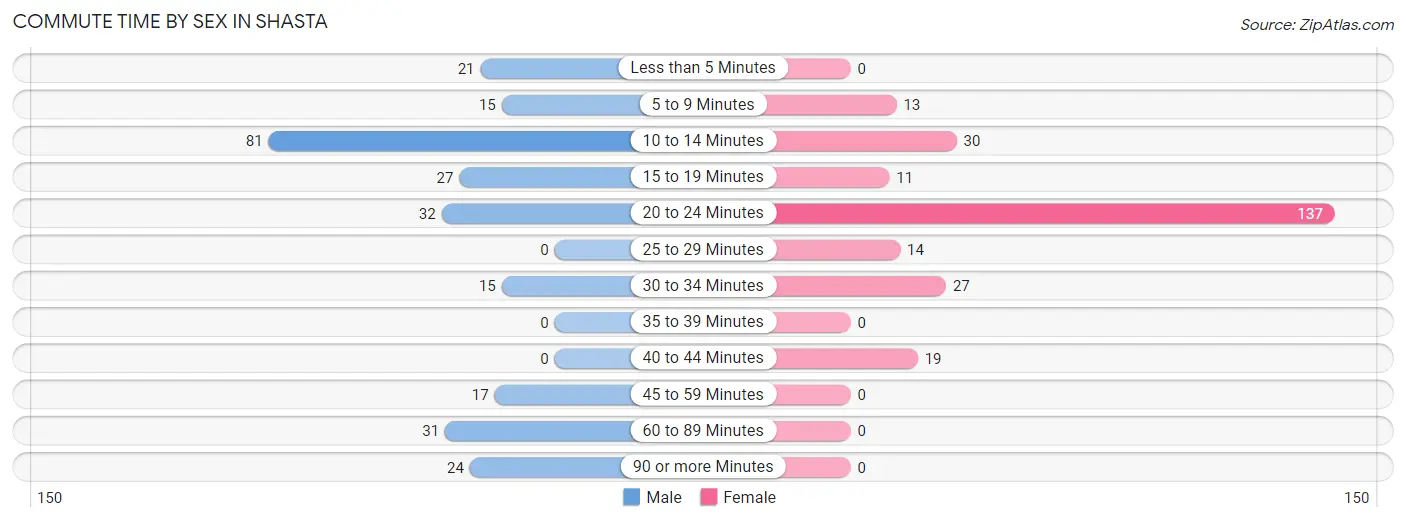
| Commute Time | Male | Female |
| Less than 5 Minutes | 21 (8.0%) | 0 (0.0%) |
| 5 to 9 Minutes | 15 (5.7%) | 13 (5.2%) |
| 10 to 14 Minutes | 81 (30.8%) | 30 (11.9%) |
| 15 to 19 Minutes | 27 (10.3%) | 11 (4.4%) |
| 20 to 24 Minutes | 32 (12.2%) | 137 (54.6%) |
| 25 to 29 Minutes | 0 (0.0%) | 14 (5.6%) |
| 30 to 34 Minutes | 15 (5.7%) | 27 (10.8%) |
| 35 to 39 Minutes | 0 (0.0%) | 0 (0.0%) |
| 40 to 44 Minutes | 0 (0.0%) | 19 (7.6%) |
| 45 to 59 Minutes | 17 (6.5%) | 0 (0.0%) |
| 60 to 89 Minutes | 31 (11.8%) | 0 (0.0%) |
| 90 or more Minutes | 24 (9.1%) | 0 (0.0%) |
Time of Departure to Work by Sex in Shasta
The most frequent times of departure to work in Shasta are 12:00 PM to 3:59 PM (61, 23.2%) for males and 7:30 AM to 7:59 AM (65, 25.9%) for females.
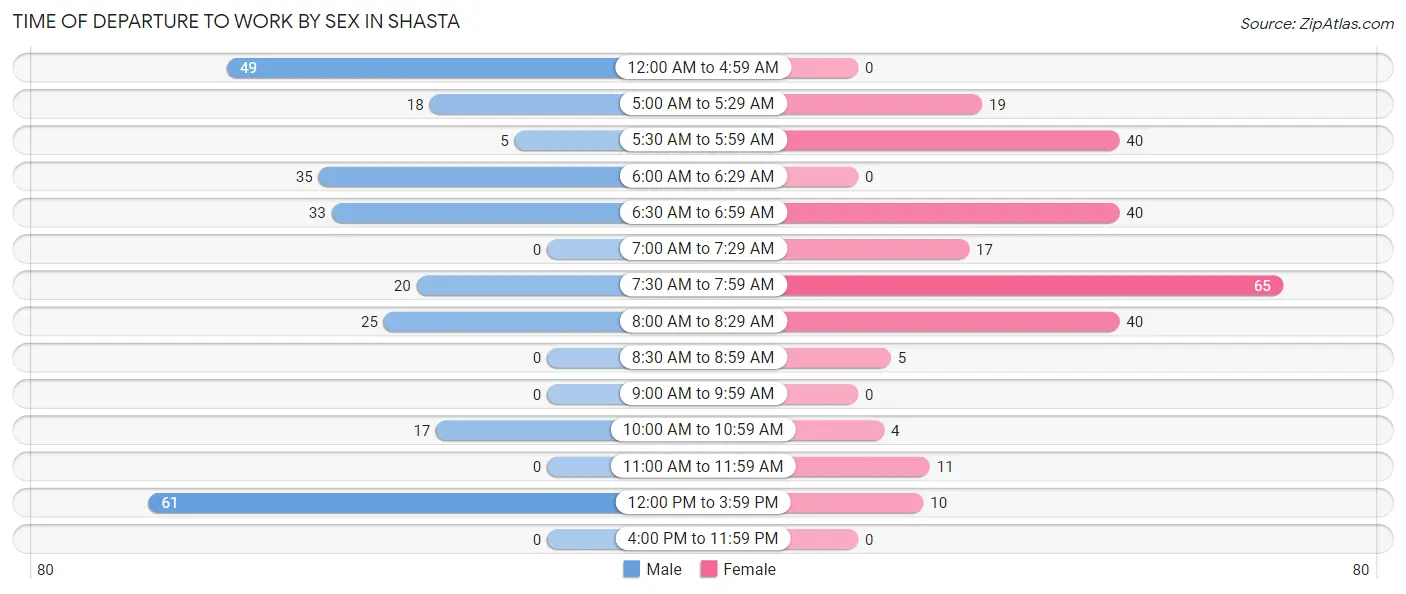
| Time of Departure | Male | Female |
| 12:00 AM to 4:59 AM | 49 (18.6%) | 0 (0.0%) |
| 5:00 AM to 5:29 AM | 18 (6.8%) | 19 (7.6%) |
| 5:30 AM to 5:59 AM | 5 (1.9%) | 40 (15.9%) |
| 6:00 AM to 6:29 AM | 35 (13.3%) | 0 (0.0%) |
| 6:30 AM to 6:59 AM | 33 (12.6%) | 40 (15.9%) |
| 7:00 AM to 7:29 AM | 0 (0.0%) | 17 (6.8%) |
| 7:30 AM to 7:59 AM | 20 (7.6%) | 65 (25.9%) |
| 8:00 AM to 8:29 AM | 25 (9.5%) | 40 (15.9%) |
| 8:30 AM to 8:59 AM | 0 (0.0%) | 5 (2.0%) |
| 9:00 AM to 9:59 AM | 0 (0.0%) | 0 (0.0%) |
| 10:00 AM to 10:59 AM | 17 (6.5%) | 4 (1.6%) |
| 11:00 AM to 11:59 AM | 0 (0.0%) | 11 (4.4%) |
| 12:00 PM to 3:59 PM | 61 (23.2%) | 10 (4.0%) |
| 4:00 PM to 11:59 PM | 0 (0.0%) | 0 (0.0%) |
| Total | 263 (100.0%) | 251 (100.0%) |
Housing Occupancy in Shasta
Occupancy by Ownership in Shasta
Of the total 496 dwellings in Shasta, owner-occupied units account for 440 (88.7%), while renter-occupied units make up 56 (11.3%).
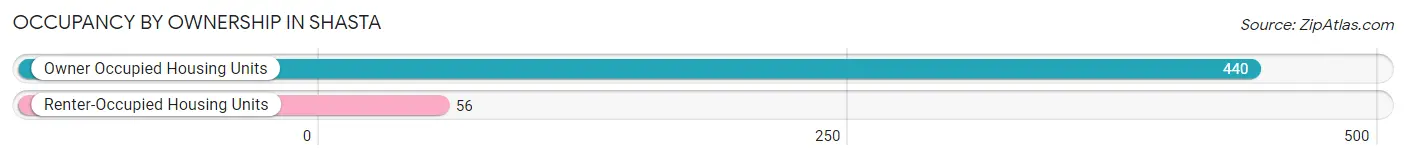
| Occupancy | # Housing Units | % Housing Units |
| Owner Occupied Housing Units | 440 | 88.7% |
| Renter-Occupied Housing Units | 56 | 11.3% |
| Total Occupied Housing Units | 496 | 100.0% |
Occupancy by Household Size in Shasta
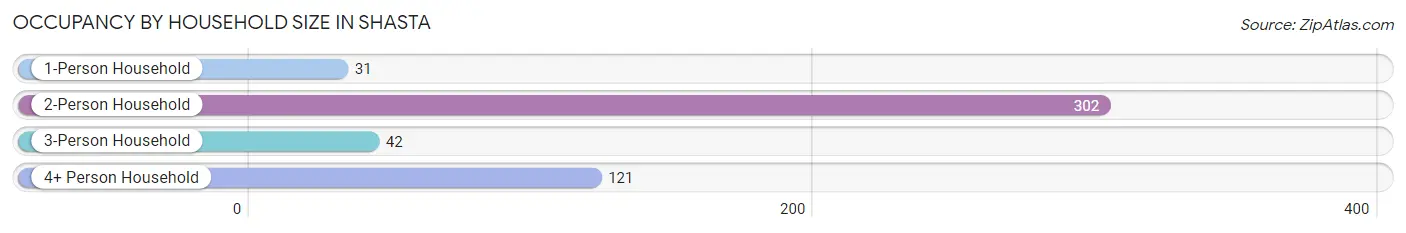
| Household Size | # Housing Units | % Housing Units |
| 1-Person Household | 31 | 6.2% |
| 2-Person Household | 302 | 60.9% |
| 3-Person Household | 42 | 8.5% |
| 4+ Person Household | 121 | 24.4% |
| Total Housing Units | 496 | 100.0% |
Occupancy by Ownership by Household Size in Shasta
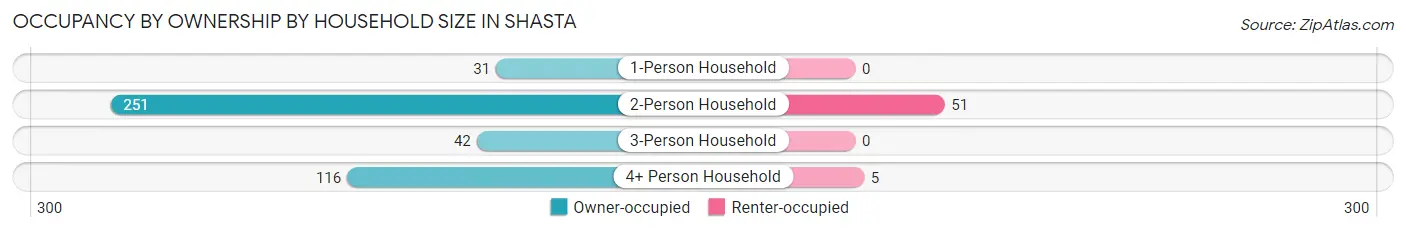
| Household Size | Owner-occupied | Renter-occupied |
| 1-Person Household | 31 (100.0%) | 0 (0.0%) |
| 2-Person Household | 251 (83.1%) | 51 (16.9%) |
| 3-Person Household | 42 (100.0%) | 0 (0.0%) |
| 4+ Person Household | 116 (95.9%) | 5 (4.1%) |
| Total Housing Units | 440 (88.7%) | 56 (11.3%) |
Occupancy by Educational Attainment in Shasta
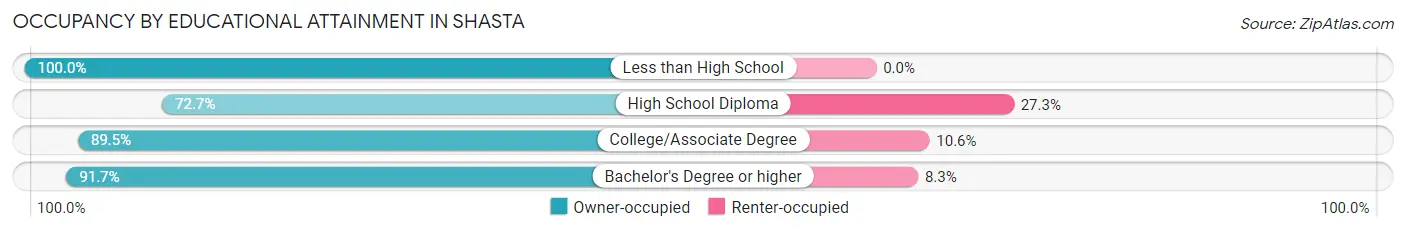
| Household Size | Owner-occupied | Renter-occupied |
| Less than High School | 26 (100.0%) | 0 (0.0%) |
| High School Diploma | 48 (72.7%) | 18 (27.3%) |
| College/Associate Degree | 178 (89.4%) | 21 (10.5%) |
| Bachelor's Degree or higher | 188 (91.7%) | 17 (8.3%) |
Occupancy by Age of Householder in Shasta
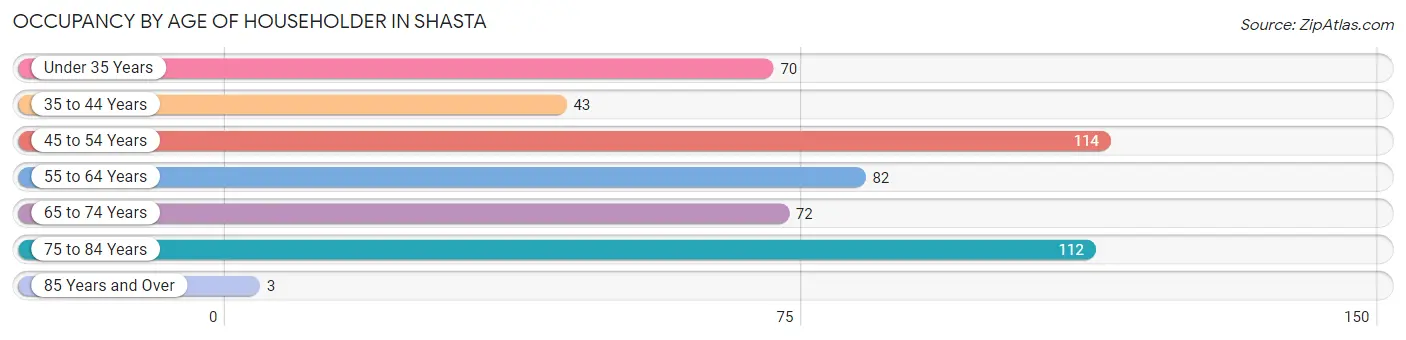
| Age Bracket | # Households | % Households |
| Under 35 Years | 70 | 14.1% |
| 35 to 44 Years | 43 | 8.7% |
| 45 to 54 Years | 114 | 23.0% |
| 55 to 64 Years | 82 | 16.5% |
| 65 to 74 Years | 72 | 14.5% |
| 75 to 84 Years | 112 | 22.6% |
| 85 Years and Over | 3 | 0.6% |
| Total | 496 | 100.0% |
Housing Finances in Shasta
Median Income by Occupancy in Shasta
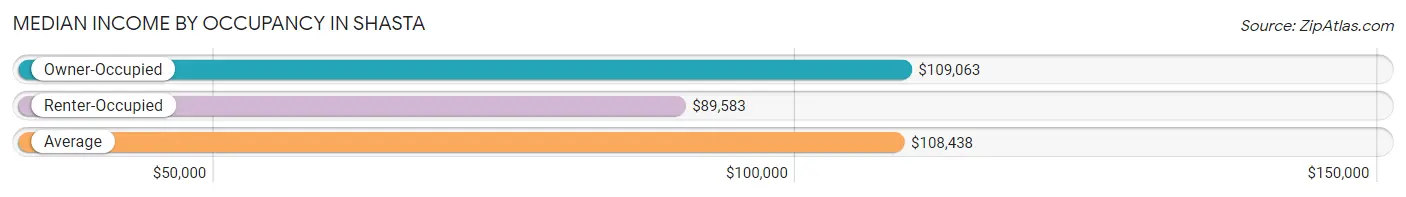
| Occupancy Type | # Households | Median Income |
| Owner-Occupied | 440 (88.7%) | $109,063 |
| Renter-Occupied | 56 (11.3%) | $89,583 |
| Average | 496 (100.0%) | $108,438 |
Occupancy by Householder Income Bracket in Shasta
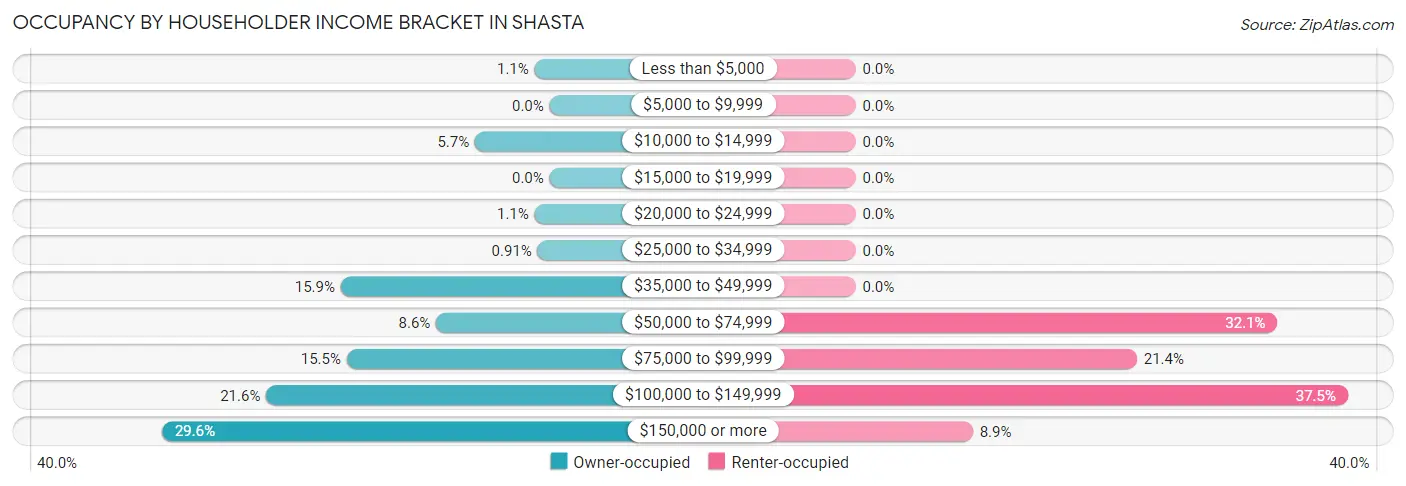
| Income Bracket | Owner-occupied | Renter-occupied |
| Less than $5,000 | 5 (1.1%) | 0 (0.0%) |
| $5,000 to $9,999 | 0 (0.0%) | 0 (0.0%) |
| $10,000 to $14,999 | 25 (5.7%) | 0 (0.0%) |
| $15,000 to $19,999 | 0 (0.0%) | 0 (0.0%) |
| $20,000 to $24,999 | 5 (1.1%) | 0 (0.0%) |
| $25,000 to $34,999 | 4 (0.9%) | 0 (0.0%) |
| $35,000 to $49,999 | 70 (15.9%) | 0 (0.0%) |
| $50,000 to $74,999 | 38 (8.6%) | 18 (32.1%) |
| $75,000 to $99,999 | 68 (15.4%) | 12 (21.4%) |
| $100,000 to $149,999 | 95 (21.6%) | 21 (37.5%) |
| $150,000 or more | 130 (29.5%) | 5 (8.9%) |
| Total | 440 (100.0%) | 56 (100.0%) |
Monthly Housing Cost Tiers in Shasta
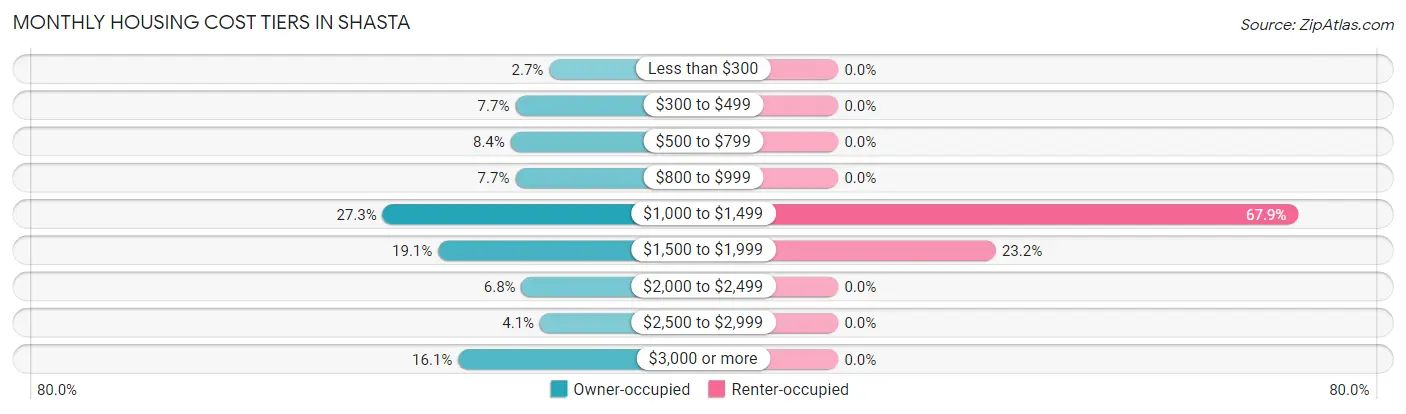
| Monthly Cost | Owner-occupied | Renter-occupied |
| Less than $300 | 12 (2.7%) | 0 (0.0%) |
| $300 to $499 | 34 (7.7%) | 0 (0.0%) |
| $500 to $799 | 37 (8.4%) | 0 (0.0%) |
| $800 to $999 | 34 (7.7%) | 0 (0.0%) |
| $1,000 to $1,499 | 120 (27.3%) | 38 (67.9%) |
| $1,500 to $1,999 | 84 (19.1%) | 13 (23.2%) |
| $2,000 to $2,499 | 30 (6.8%) | 0 (0.0%) |
| $2,500 to $2,999 | 18 (4.1%) | 0 (0.0%) |
| $3,000 or more | 71 (16.1%) | 0 (0.0%) |
| Total | 440 (100.0%) | 56 (100.0%) |
Physical Housing Characteristics in Shasta
Housing Structures in Shasta
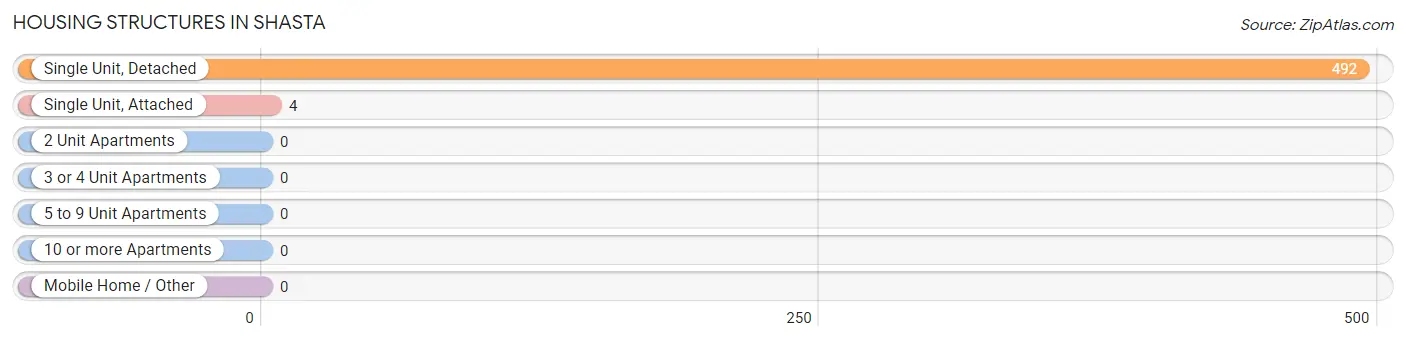
| Structure Type | # Housing Units | % Housing Units |
| Single Unit, Detached | 492 | 99.2% |
| Single Unit, Attached | 4 | 0.8% |
| 2 Unit Apartments | 0 | 0.0% |
| 3 or 4 Unit Apartments | 0 | 0.0% |
| 5 to 9 Unit Apartments | 0 | 0.0% |
| 10 or more Apartments | 0 | 0.0% |
| Mobile Home / Other | 0 | 0.0% |
| Total | 496 | 100.0% |
Housing Structures by Occupancy in Shasta
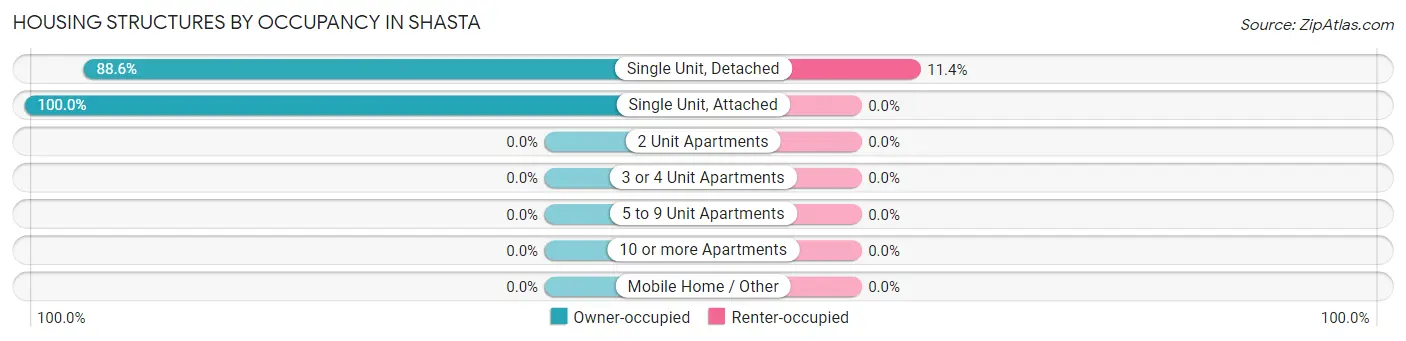
| Structure Type | Owner-occupied | Renter-occupied |
| Single Unit, Detached | 436 (88.6%) | 56 (11.4%) |
| Single Unit, Attached | 4 (100.0%) | 0 (0.0%) |
| 2 Unit Apartments | 0 (0.0%) | 0 (0.0%) |
| 3 or 4 Unit Apartments | 0 (0.0%) | 0 (0.0%) |
| 5 to 9 Unit Apartments | 0 (0.0%) | 0 (0.0%) |
| 10 or more Apartments | 0 (0.0%) | 0 (0.0%) |
| Mobile Home / Other | 0 (0.0%) | 0 (0.0%) |
| Total | 440 (88.7%) | 56 (11.3%) |
Housing Structures by Number of Rooms in Shasta
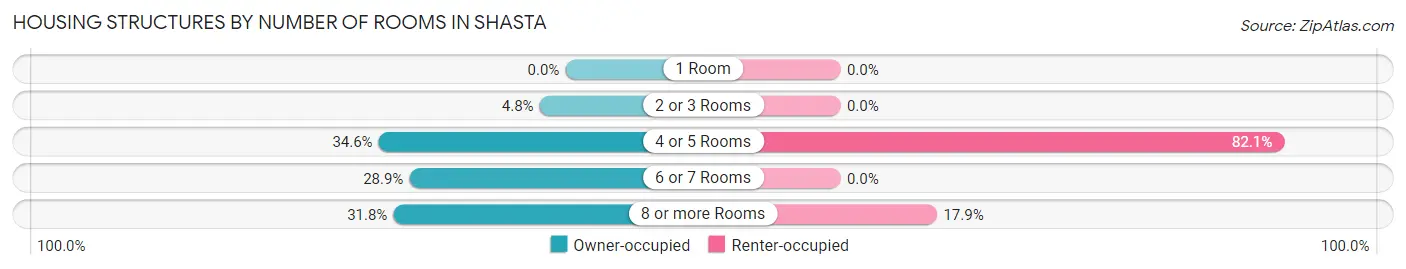
| Number of Rooms | Owner-occupied | Renter-occupied |
| 1 Room | 0 (0.0%) | 0 (0.0%) |
| 2 or 3 Rooms | 21 (4.8%) | 0 (0.0%) |
| 4 or 5 Rooms | 152 (34.5%) | 46 (82.1%) |
| 6 or 7 Rooms | 127 (28.9%) | 0 (0.0%) |
| 8 or more Rooms | 140 (31.8%) | 10 (17.9%) |
| Total | 440 (100.0%) | 56 (100.0%) |
Housing Structure by Heating Type in Shasta
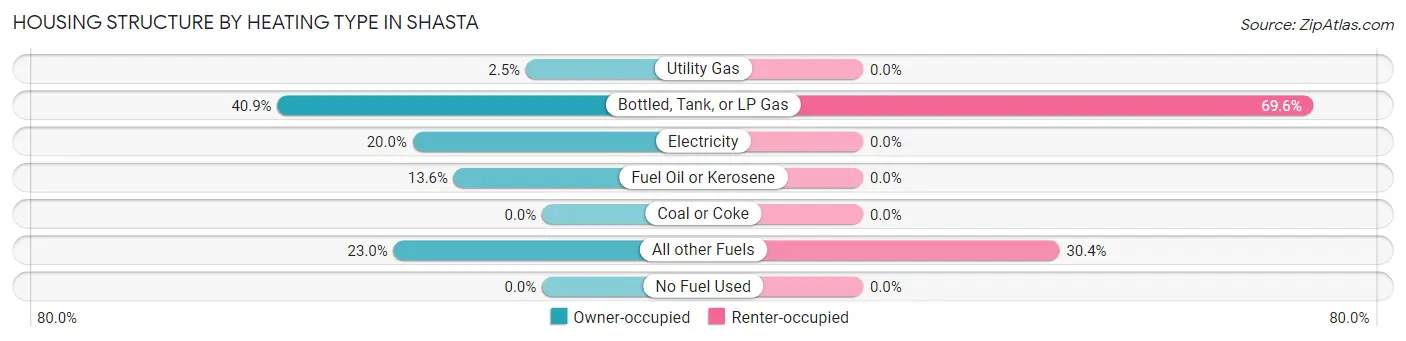
| Heating Type | Owner-occupied | Renter-occupied |
| Utility Gas | 11 (2.5%) | 0 (0.0%) |
| Bottled, Tank, or LP Gas | 180 (40.9%) | 39 (69.6%) |
| Electricity | 88 (20.0%) | 0 (0.0%) |
| Fuel Oil or Kerosene | 60 (13.6%) | 0 (0.0%) |
| Coal or Coke | 0 (0.0%) | 0 (0.0%) |
| All other Fuels | 101 (23.0%) | 17 (30.4%) |
| No Fuel Used | 0 (0.0%) | 0 (0.0%) |
| Total | 440 (100.0%) | 56 (100.0%) |
Household Vehicle Usage in Shasta
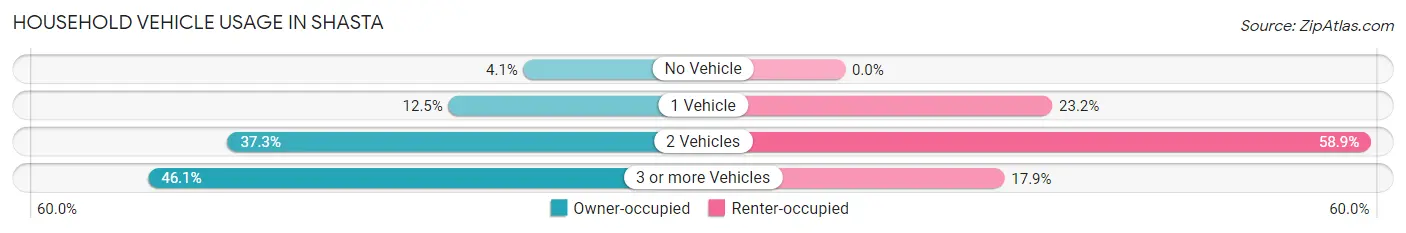
| Vehicles per Household | Owner-occupied | Renter-occupied |
| No Vehicle | 18 (4.1%) | 0 (0.0%) |
| 1 Vehicle | 55 (12.5%) | 13 (23.2%) |
| 2 Vehicles | 164 (37.3%) | 33 (58.9%) |
| 3 or more Vehicles | 203 (46.1%) | 10 (17.9%) |
| Total | 440 (100.0%) | 56 (100.0%) |
Real Estate & Mortgages in Shasta
Real Estate and Mortgage Overview in Shasta
| Characteristic | Without Mortgage | With Mortgage |
| Housing Units | 137 | 303 |
| Median Property Value | $368,300 | $401,000 |
| Median Household Income | $75,521 | $105 |
| Monthly Housing Costs | $719 | $71 |
| Real Estate Taxes | $1,875 | $0 |
Property Value by Mortgage Status in Shasta
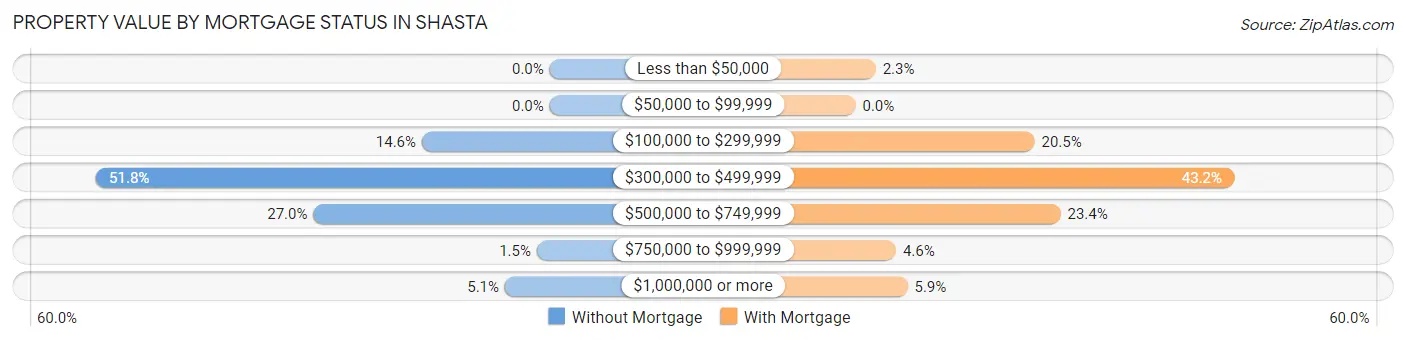
| Property Value | Without Mortgage | With Mortgage |
| Less than $50,000 | 0 (0.0%) | 7 (2.3%) |
| $50,000 to $99,999 | 0 (0.0%) | 0 (0.0%) |
| $100,000 to $299,999 | 20 (14.6%) | 62 (20.5%) |
| $300,000 to $499,999 | 71 (51.8%) | 131 (43.2%) |
| $500,000 to $749,999 | 37 (27.0%) | 71 (23.4%) |
| $750,000 to $999,999 | 2 (1.5%) | 14 (4.6%) |
| $1,000,000 or more | 7 (5.1%) | 18 (5.9%) |
| Total | 137 (100.0%) | 303 (100.0%) |
Household Income by Mortgage Status in Shasta
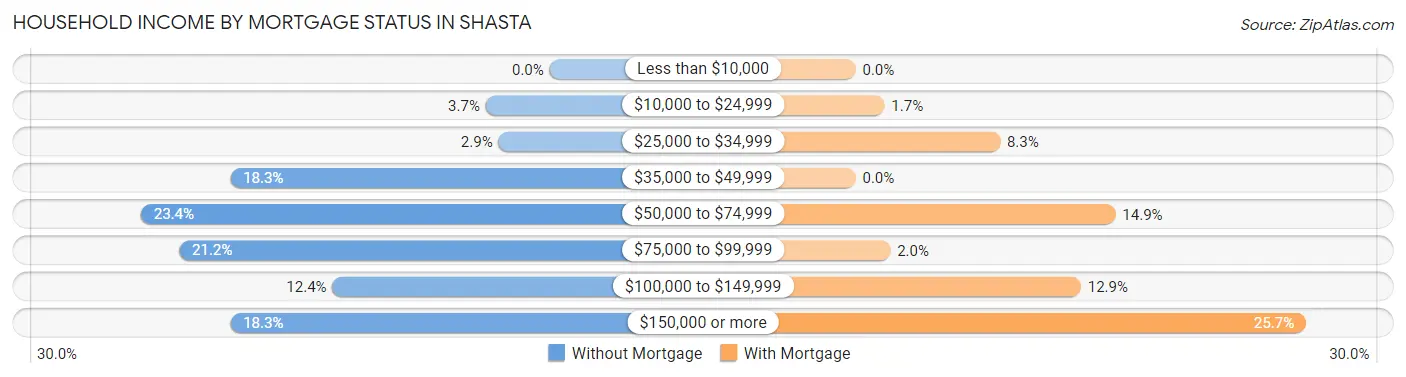
| Household Income | Without Mortgage | With Mortgage |
| Less than $10,000 | 0 (0.0%) | 0 (0.0%) |
| $10,000 to $24,999 | 5 (3.6%) | 5 (1.7%) |
| $25,000 to $34,999 | 4 (2.9%) | 25 (8.3%) |
| $35,000 to $49,999 | 25 (18.2%) | 0 (0.0%) |
| $50,000 to $74,999 | 32 (23.4%) | 45 (14.8%) |
| $75,000 to $99,999 | 29 (21.2%) | 6 (2.0%) |
| $100,000 to $149,999 | 17 (12.4%) | 39 (12.9%) |
| $150,000 or more | 25 (18.2%) | 78 (25.7%) |
| Total | 137 (100.0%) | 303 (100.0%) |
Property Value to Household Income Ratio in Shasta
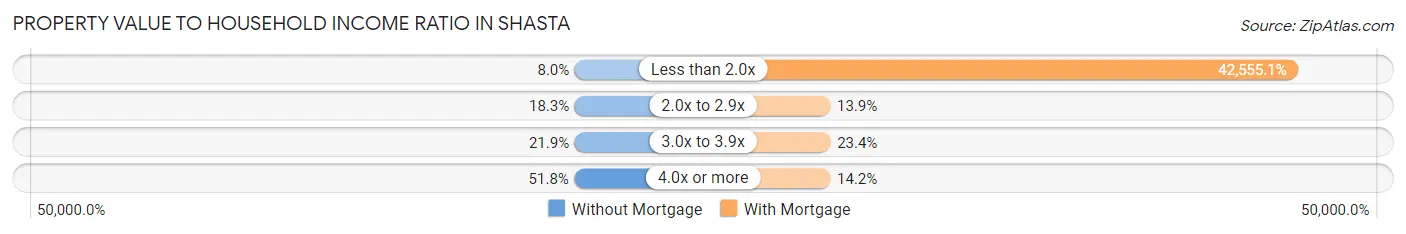
| Value-to-Income Ratio | Without Mortgage | With Mortgage |
| Less than 2.0x | 11 (8.0%) | 128,942 (42,555.1%) |
| 2.0x to 2.9x | 25 (18.2%) | 42 (13.9%) |
| 3.0x to 3.9x | 30 (21.9%) | 71 (23.4%) |
| 4.0x or more | 71 (51.8%) | 43 (14.2%) |
| Total | 137 (100.0%) | 303 (100.0%) |
Real Estate Taxes by Mortgage Status in Shasta
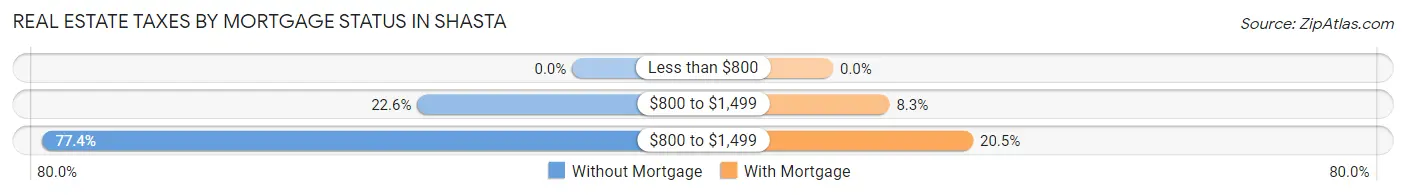
| Property Taxes | Without Mortgage | With Mortgage |
| Less than $800 | 0 (0.0%) | 0 (0.0%) |
| $800 to $1,499 | 31 (22.6%) | 25 (8.3%) |
| $800 to $1,499 | 106 (77.4%) | 62 (20.5%) |
| Total | 137 (100.0%) | 303 (100.0%) |
Health & Disability in Shasta
Health Insurance Coverage by Age in Shasta
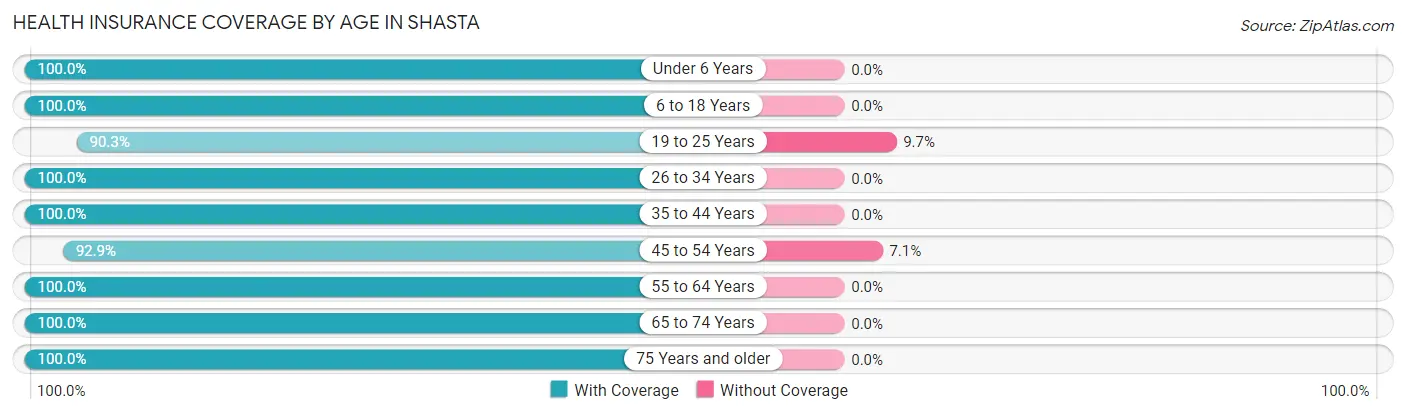
| Age Bracket | With Coverage | Without Coverage |
| Under 6 Years | 60 (100.0%) | 0 (0.0%) |
| 6 to 18 Years | 168 (100.0%) | 0 (0.0%) |
| 19 to 25 Years | 140 (90.3%) | 15 (9.7%) |
| 26 to 34 Years | 104 (100.0%) | 0 (0.0%) |
| 35 to 44 Years | 163 (100.0%) | 0 (0.0%) |
| 45 to 54 Years | 235 (92.9%) | 18 (7.1%) |
| 55 to 64 Years | 174 (100.0%) | 0 (0.0%) |
| 65 to 74 Years | 149 (100.0%) | 0 (0.0%) |
| 75 Years and older | 150 (100.0%) | 0 (0.0%) |
| Total | 1,343 (97.6%) | 33 (2.4%) |
Health Insurance Coverage by Citizenship Status in Shasta
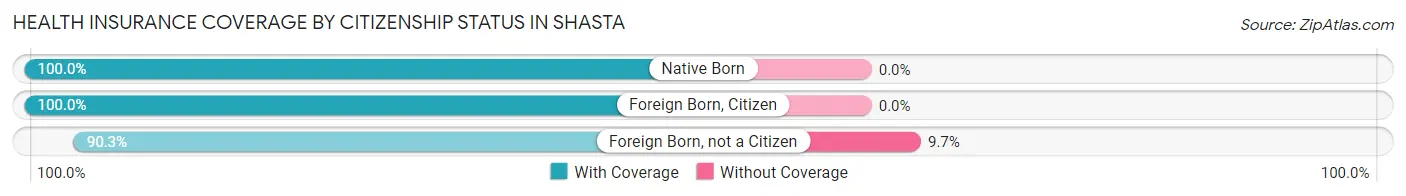
| Citizenship Status | With Coverage | Without Coverage |
| Native Born | 60 (100.0%) | 0 (0.0%) |
| Foreign Born, Citizen | 168 (100.0%) | 0 (0.0%) |
| Foreign Born, not a Citizen | 140 (90.3%) | 15 (9.7%) |
Health Insurance Coverage by Household Income in Shasta
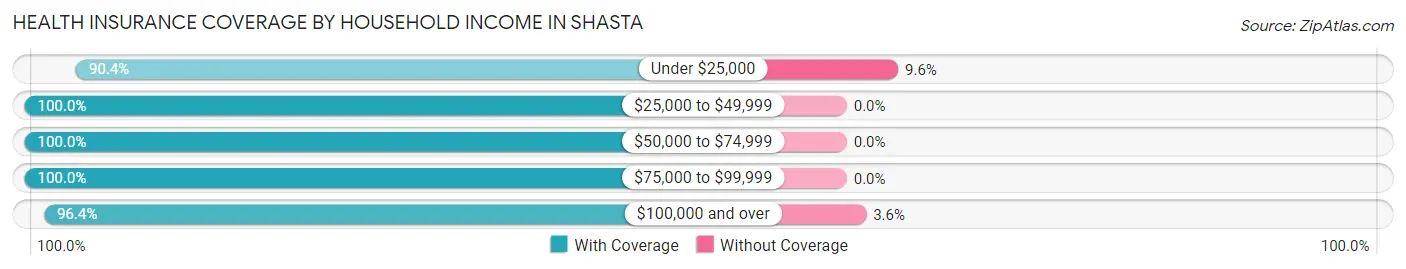
| Household Income | With Coverage | Without Coverage |
| Under $25,000 | 47 (90.4%) | 5 (9.6%) |
| $25,000 to $49,999 | 255 (100.0%) | 0 (0.0%) |
| $50,000 to $74,999 | 113 (100.0%) | 0 (0.0%) |
| $75,000 to $99,999 | 186 (100.0%) | 0 (0.0%) |
| $100,000 and over | 742 (96.4%) | 28 (3.6%) |
Public vs Private Health Insurance Coverage by Age in Shasta
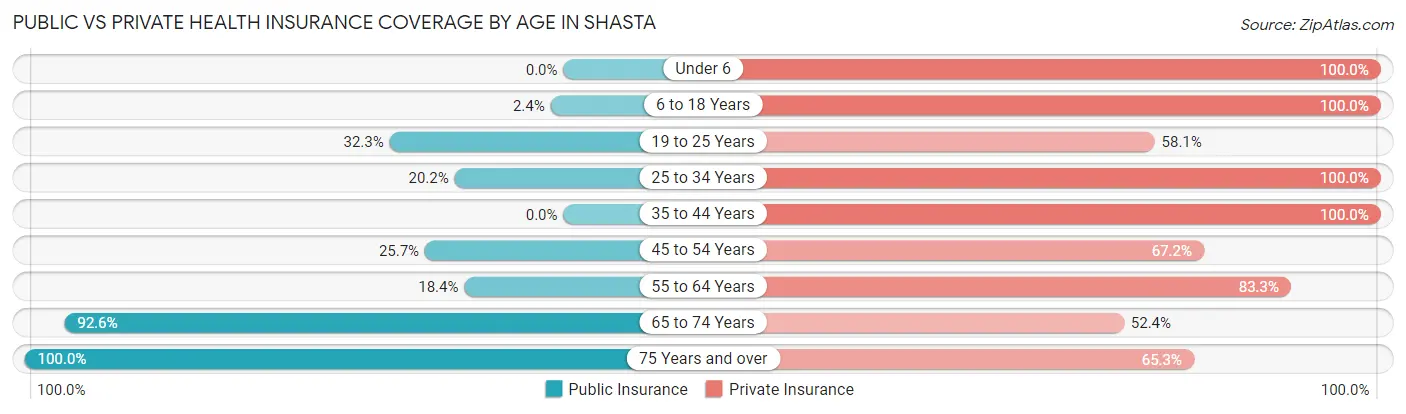
| Age Bracket | Public Insurance | Private Insurance |
| Under 6 | 0 (0.0%) | 60 (100.0%) |
| 6 to 18 Years | 4 (2.4%) | 168 (100.0%) |
| 19 to 25 Years | 50 (32.3%) | 90 (58.1%) |
| 25 to 34 Years | 21 (20.2%) | 104 (100.0%) |
| 35 to 44 Years | 0 (0.0%) | 163 (100.0%) |
| 45 to 54 Years | 65 (25.7%) | 170 (67.2%) |
| 55 to 64 Years | 32 (18.4%) | 145 (83.3%) |
| 65 to 74 Years | 138 (92.6%) | 78 (52.3%) |
| 75 Years and over | 150 (100.0%) | 98 (65.3%) |
| Total | 460 (33.4%) | 1,076 (78.2%) |
Disability Status by Sex by Age in Shasta
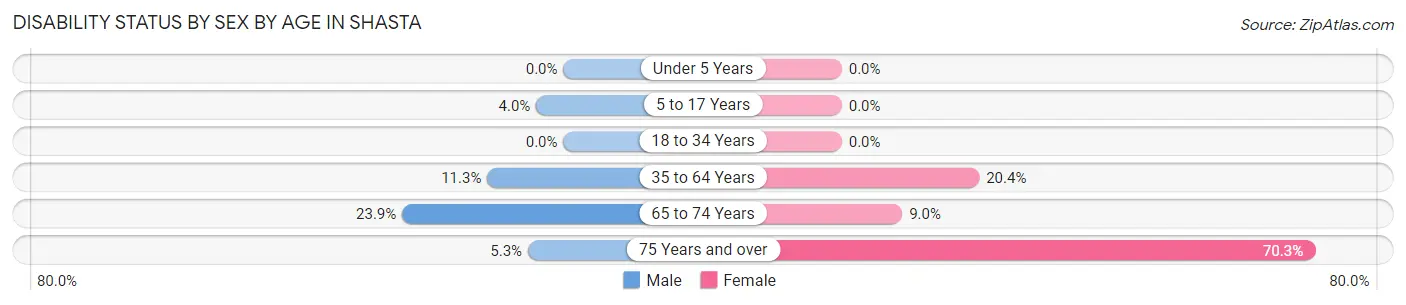
| Age Bracket | Male | Female |
| Under 5 Years | 0 (0.0%) | 0 (0.0%) |
| 5 to 17 Years | 4 (4.0%) | 0 (0.0%) |
| 18 to 34 Years | 0 (0.0%) | 0 (0.0%) |
| 35 to 64 Years | 39 (11.3%) | 50 (20.4%) |
| 65 to 74 Years | 17 (23.9%) | 7 (9.0%) |
| 75 Years and over | 4 (5.3%) | 52 (70.3%) |
Disability Class by Sex by Age in Shasta
Disability Class: Hearing Difficulty
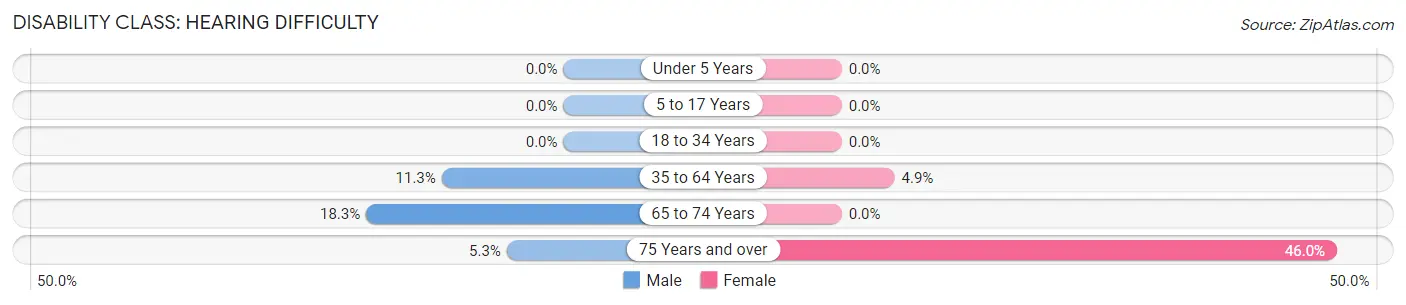
| Age Bracket | Male | Female |
| Under 5 Years | 0 (0.0%) | 0 (0.0%) |
| 5 to 17 Years | 0 (0.0%) | 0 (0.0%) |
| 18 to 34 Years | 0 (0.0%) | 0 (0.0%) |
| 35 to 64 Years | 39 (11.3%) | 12 (4.9%) |
| 65 to 74 Years | 13 (18.3%) | 0 (0.0%) |
| 75 Years and over | 4 (5.3%) | 34 (46.0%) |
Disability Class: Vision Difficulty
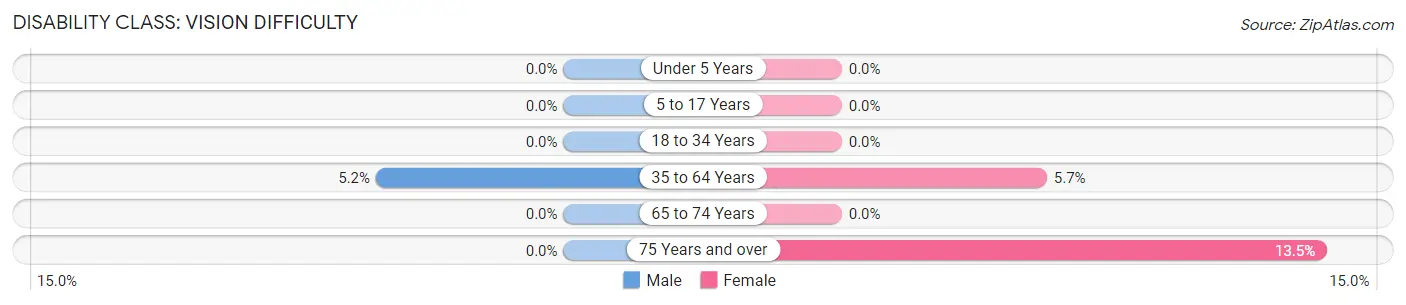
| Age Bracket | Male | Female |
| Under 5 Years | 0 (0.0%) | 0 (0.0%) |
| 5 to 17 Years | 0 (0.0%) | 0 (0.0%) |
| 18 to 34 Years | 0 (0.0%) | 0 (0.0%) |
| 35 to 64 Years | 18 (5.2%) | 14 (5.7%) |
| 65 to 74 Years | 0 (0.0%) | 0 (0.0%) |
| 75 Years and over | 0 (0.0%) | 10 (13.5%) |
Disability Class: Cognitive Difficulty
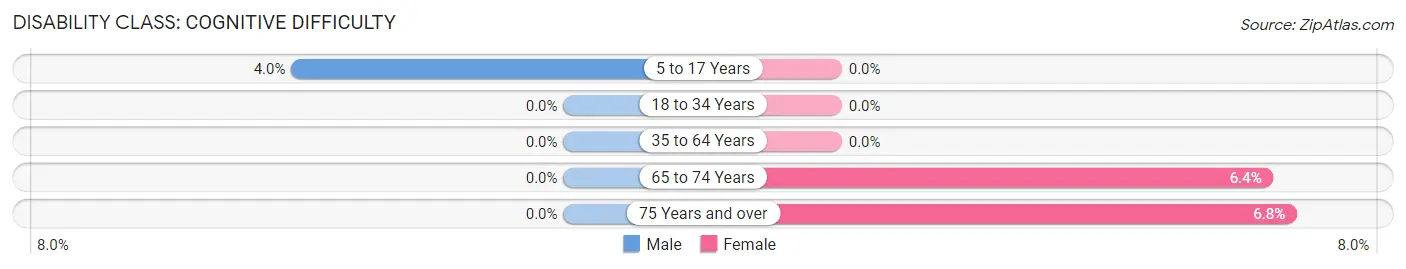
| Age Bracket | Male | Female |
| 5 to 17 Years | 4 (4.0%) | 0 (0.0%) |
| 18 to 34 Years | 0 (0.0%) | 0 (0.0%) |
| 35 to 64 Years | 0 (0.0%) | 0 (0.0%) |
| 65 to 74 Years | 0 (0.0%) | 5 (6.4%) |
| 75 Years and over | 0 (0.0%) | 5 (6.8%) |
Disability Class: Ambulatory Difficulty
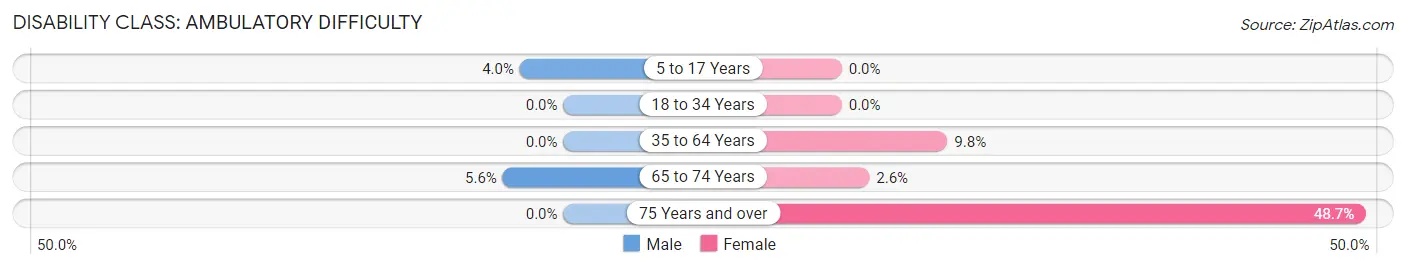
| Age Bracket | Male | Female |
| 5 to 17 Years | 4 (4.0%) | 0 (0.0%) |
| 18 to 34 Years | 0 (0.0%) | 0 (0.0%) |
| 35 to 64 Years | 0 (0.0%) | 24 (9.8%) |
| 65 to 74 Years | 4 (5.6%) | 2 (2.6%) |
| 75 Years and over | 0 (0.0%) | 36 (48.6%) |
Disability Class: Self-Care Difficulty
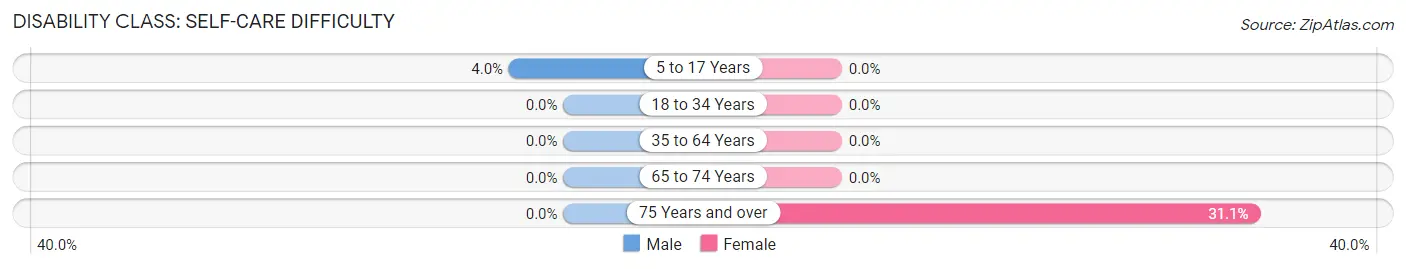
| Age Bracket | Male | Female |
| 5 to 17 Years | 4 (4.0%) | 0 (0.0%) |
| 18 to 34 Years | 0 (0.0%) | 0 (0.0%) |
| 35 to 64 Years | 0 (0.0%) | 0 (0.0%) |
| 65 to 74 Years | 0 (0.0%) | 0 (0.0%) |
| 75 Years and over | 0 (0.0%) | 23 (31.1%) |
Technology Access in Shasta
Computing Device Access in Shasta
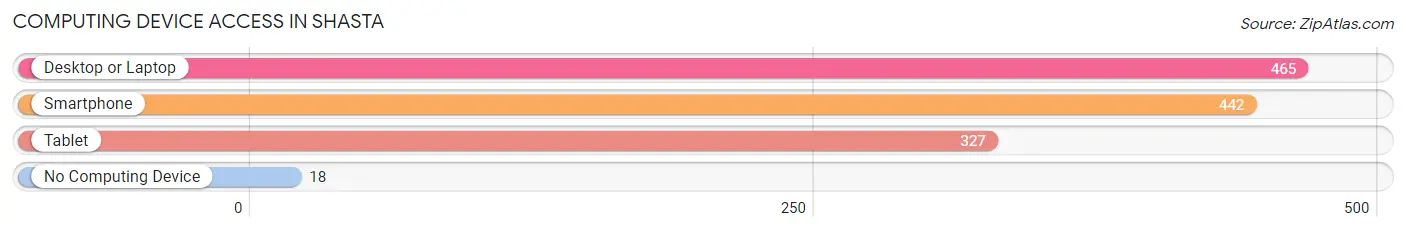
| Device Type | # Households | % Households |
| Desktop or Laptop | 465 | 93.8% |
| Smartphone | 442 | 89.1% |
| Tablet | 327 | 65.9% |
| No Computing Device | 18 | 3.6% |
| Total | 496 | 100.0% |
Internet Access in Shasta
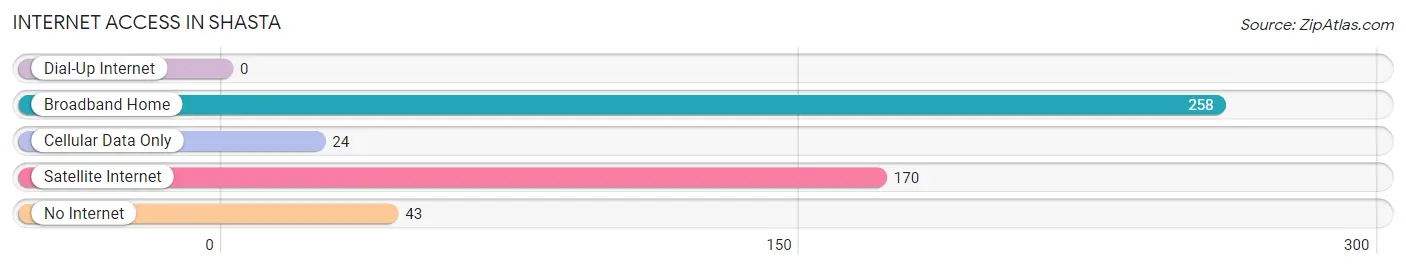
| Internet Type | # Households | % Households |
| Dial-Up Internet | 0 | 0.0% |
| Broadband Home | 258 | 52.0% |
| Cellular Data Only | 24 | 4.8% |
| Satellite Internet | 170 | 34.3% |
| No Internet | 43 | 8.7% |
| Total | 496 | 100.0% |
Shasta Summary
Shasta, California is a small city located in the northern part of the state, in Shasta County. It is situated at the base of Mount Shasta, a 14,179-foot dormant volcano, and is surrounded by the Shasta-Trinity National Forest. The city is home to a population of approximately 10,000 people, and is the county seat of Shasta County.
History
The area that is now Shasta was first inhabited by the Wintu and Achomawi Native American tribes. The first European settlers arrived in the area in the early 1850s, and the town of Shasta was officially founded in 1854. The town was named after Mount Shasta, which was named by explorer Peter Skene Ogden in 1826.
In the late 1800s, Shasta became a popular destination for gold miners, and the town grew rapidly. The city was incorporated in 1887, and the population had grown to over 1,000 by the turn of the century.
In the early 1900s, Shasta was a popular tourist destination, and the city was home to several resorts and hotels. The city also became a popular destination for outdoor recreation, and the nearby Shasta Lake was a popular spot for fishing and boating.
Geography
Shasta is located in the northern part of California, in Shasta County. The city is situated at the base of Mount Shasta, a 14,179-foot dormant volcano, and is surrounded by the Shasta-Trinity National Forest. The city is located at an elevation of 1,890 feet, and has a total area of 4.2 square miles.
The climate in Shasta is classified as a Mediterranean climate, with hot, dry summers and mild, wet winters. The average high temperature in the summer is around 90 degrees Fahrenheit, and the average low temperature in the winter is around 40 degrees Fahrenheit.
Economy
The economy of Shasta is largely based on tourism and outdoor recreation. The city is home to several resorts and hotels, as well as a variety of restaurants and shops. The nearby Shasta Lake is a popular spot for fishing and boating, and the city is also home to several parks and trails.
The city is also home to several manufacturing and industrial businesses, including a paper mill and a lumber mill. The city is also home to a variety of service-based businesses, including medical and legal services.
Demographics
As of the 2010 census, the population of Shasta was 10,164. The racial makeup of the city was 87.3% White, 0.7% African American, 1.2% Native American, 0.7% Asian, 0.1% Pacific Islander, 6.7% from other races, and 3.3% from two or more races. Hispanic or Latino of any race were 11.3% of the population.
The median household income in Shasta was $37,917, and the median family income was $45,938. The per capita income in Shasta was $20,845. About 15.3% of the population was below the poverty line.
Common Questions
What is Per Capita Income in Shasta?
Per Capita income in Shasta is $51,003.
What is the Median Family Income in Shasta?
Median Family Income in Shasta is $91,500.
What is the Median Household income in Shasta?
Median Household Income in Shasta is $108,438.
What is Inequality or Gini Index in Shasta?
Inequality or Gini Index in Shasta is 0.46.
What is the Total Population of Shasta?
Total Population of Shasta is 1,376.
What is the Total Male Population of Shasta?
Total Male Population of Shasta is 770.
What is the Total Female Population of Shasta?
Total Female Population of Shasta is 606.
What is the Ratio of Males per 100 Females in Shasta?
There are 127.06 Males per 100 Females in Shasta.
What is the Ratio of Females per 100 Males in Shasta?
There are 78.70 Females per 100 Males in Shasta.
What is the Median Population Age in Shasta?
Median Population Age in Shasta is 47.2 Years.
What is the Average Family Size in Shasta
Average Family Size in Shasta is 2.9 People.
What is the Average Household Size in Shasta
Average Household Size in Shasta is 2.8 People.
How Large is the Labor Force in Shasta?
There are 645 People in the Labor Forcein in Shasta.
What is the Percentage of People in the Labor Force in Shasta?
53.9% of People are in the Labor Force in Shasta.
What is the Unemployment Rate in Shasta?
Unemployment Rate in Shasta is 10.1%.