Princeton, CA Map & Demographics
Princeton Map
Princeton Overview
$32,332
PER CAPITA INCOME
$98,906
AVG FAMILY INCOME
$71,875
AVG HOUSEHOLD INCOME
0.36
INEQUALITY / GINI INDEX
357
TOTAL POPULATION
178
MALE POPULATION
179
FEMALE POPULATION
99.44
MALES / 100 FEMALES
100.56
FEMALES / 100 MALES
39.9
MEDIAN AGE
3.5
AVG FAMILY SIZE
2.7
AVG HOUSEHOLD SIZE
145
LABOR FORCE [ PEOPLE ]
61.4%
PERCENT IN LABOR FORCE
Princeton Zip Codes
Princeton Area Codes
Income in Princeton
Income Overview in Princeton
Per Capita Income in Princeton is $32,332, while median incomes of families and households are $98,906 and $71,875 respectively.
| Characteristic | Number | Measure |
| Per Capita Income | 357 | $32,332 |
| Median Family Income | 89 | $98,906 |
| Mean Family Income | 89 | $113,793 |
| Median Household Income | 132 | $71,875 |
| Mean Household Income | 132 | $92,552 |
| Income Deficit | 89 | $0 |
| Wage / Income Gap (%) | 357 | 0.00% |
| Wage / Income Gap ($) | 357 | 100.00¢ per $1 |
| Gini / Inequality Index | 357 | 0.36 |
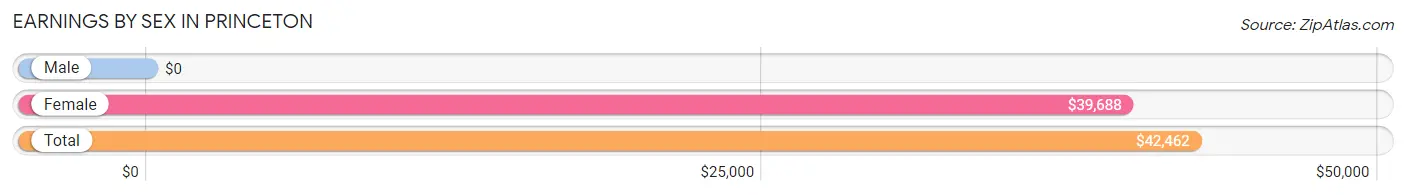
Earnings by Sex in Princeton
| Sex | Number | Average Earnings |
| Male | 76 (51.7%) | $0 |
| Female | 71 (48.3%) | $39,688 |
| Total | 147 (100.0%) | $42,462 |
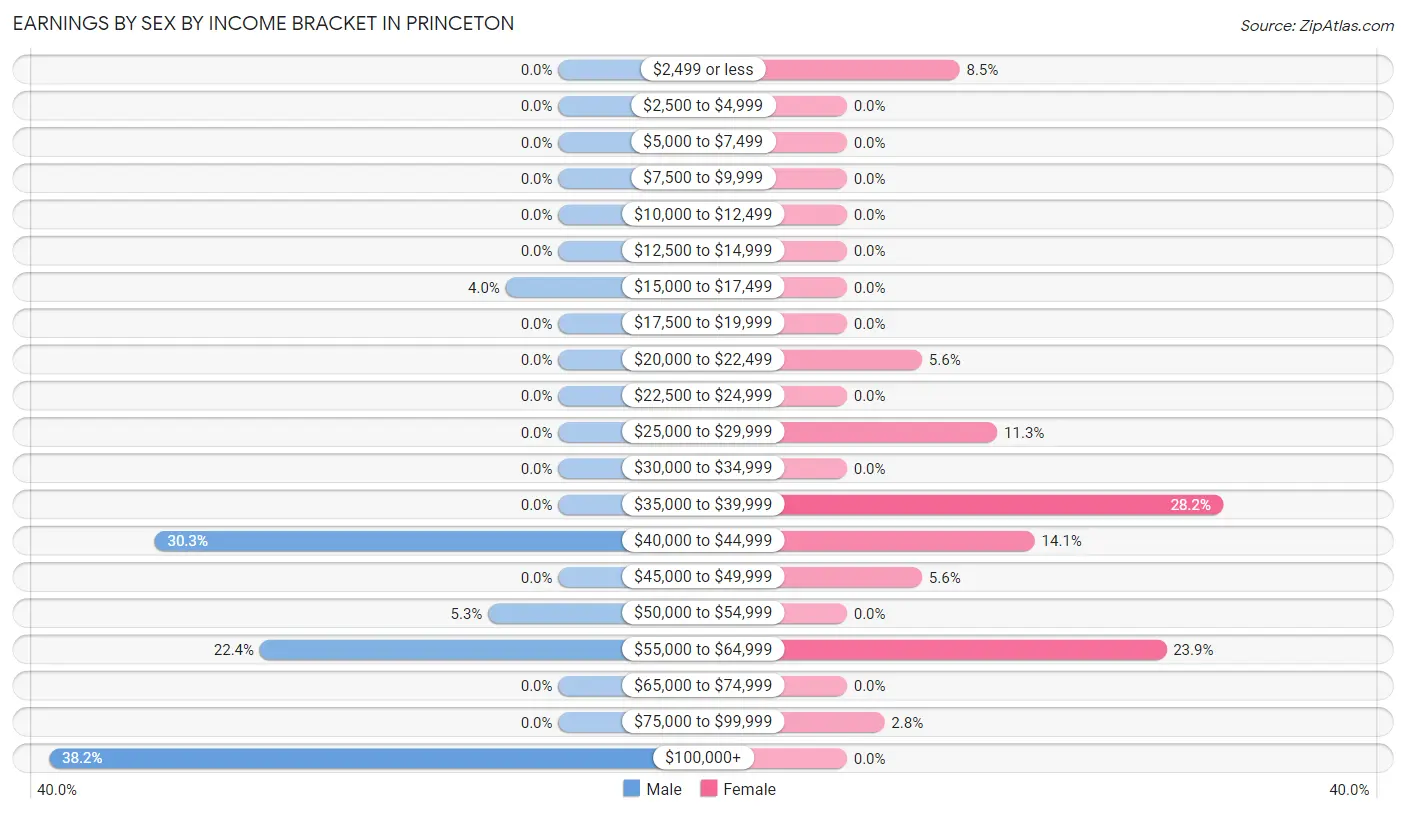
Earnings by Sex by Income Bracket in Princeton
The most common earnings brackets in Princeton are $100,000+ for men (29 | 38.2%) and $35,000 to $39,999 for women (20 | 28.2%).
| Income | Male | Female |
| $2,499 or less | 0 (0.0%) | 6 (8.5%) |
| $2,500 to $4,999 | 0 (0.0%) | 0 (0.0%) |
| $5,000 to $7,499 | 0 (0.0%) | 0 (0.0%) |
| $7,500 to $9,999 | 0 (0.0%) | 0 (0.0%) |
| $10,000 to $12,499 | 0 (0.0%) | 0 (0.0%) |
| $12,500 to $14,999 | 0 (0.0%) | 0 (0.0%) |
| $15,000 to $17,499 | 3 (4.0%) | 0 (0.0%) |
| $17,500 to $19,999 | 0 (0.0%) | 0 (0.0%) |
| $20,000 to $22,499 | 0 (0.0%) | 4 (5.6%) |
| $22,500 to $24,999 | 0 (0.0%) | 0 (0.0%) |
| $25,000 to $29,999 | 0 (0.0%) | 8 (11.3%) |
| $30,000 to $34,999 | 0 (0.0%) | 0 (0.0%) |
| $35,000 to $39,999 | 0 (0.0%) | 20 (28.2%) |
| $40,000 to $44,999 | 23 (30.3%) | 10 (14.1%) |
| $45,000 to $49,999 | 0 (0.0%) | 4 (5.6%) |
| $50,000 to $54,999 | 4 (5.3%) | 0 (0.0%) |
| $55,000 to $64,999 | 17 (22.4%) | 17 (23.9%) |
| $65,000 to $74,999 | 0 (0.0%) | 0 (0.0%) |
| $75,000 to $99,999 | 0 (0.0%) | 2 (2.8%) |
| $100,000+ | 29 (38.2%) | 0 (0.0%) |
| Total | 76 (100.0%) | 71 (100.0%) |
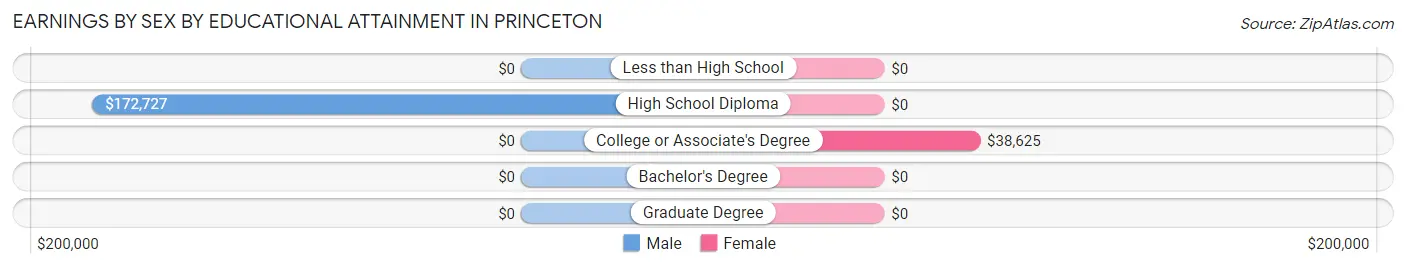
Earnings by Sex by Educational Attainment in Princeton
Average earnings in Princeton are $115,694 for men and $39,688 for women, a difference of 65.7%. Men with an educational attainment of high school diploma enjoy the highest average annual earnings of $172,727, while those with high school diploma education earn the least with $172,727. Women with an educational attainment of college or associate's degree earn the most with the average annual earnings of $38,625, while those with college or associate's degree education have the smallest earnings of $38,625.
| Educational Attainment | Male Income | Female Income |
| Less than High School | - | - |
| High School Diploma | $172,727 | $0 |
| College or Associate's Degree | - | - |
| Bachelor's Degree | - | - |
| Graduate Degree | - | - |
| Total | $115,694 | $39,688 |
Family Income in Princeton
Family Income Brackets in Princeton
According to the Princeton family income data, there are 33 families falling into the $150,000 to $199,999 income range, which is the most common income bracket and makes up 37.1% of all families.
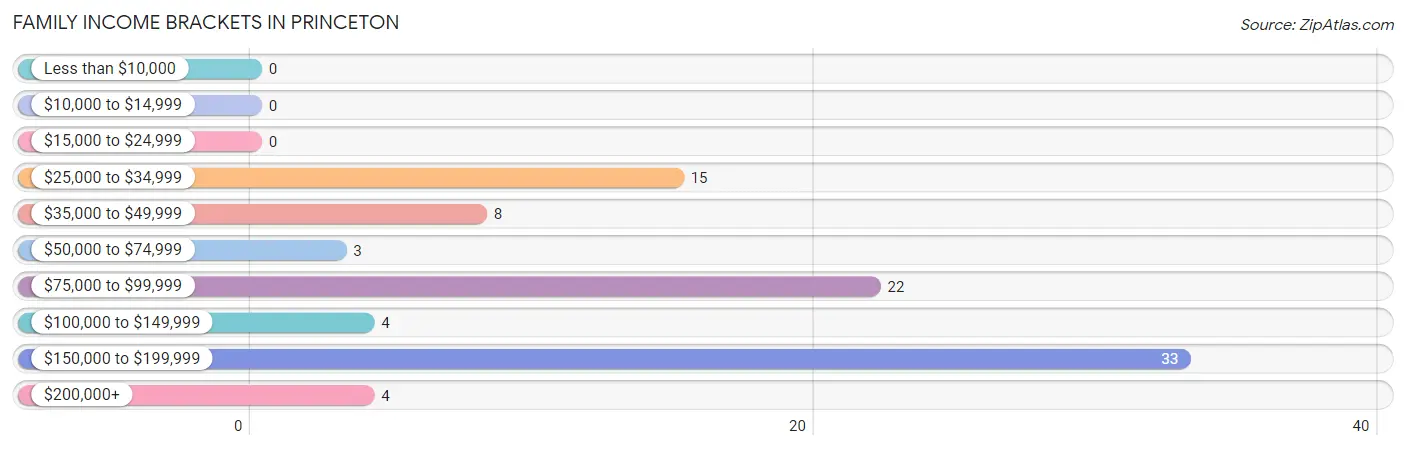
| Income Bracket | # Families | % Families |
| Less than $10,000 | 0 | 0.0% |
| $10,000 to $14,999 | 0 | 0.0% |
| $15,000 to $24,999 | 0 | 0.0% |
| $25,000 to $34,999 | 15 | 16.9% |
| $35,000 to $49,999 | 8 | 9.0% |
| $50,000 to $74,999 | 3 | 3.4% |
| $75,000 to $99,999 | 22 | 24.7% |
| $100,000 to $149,999 | 4 | 4.5% |
| $150,000 to $199,999 | 33 | 37.1% |
| $200,000+ | 4 | 4.5% |
Family Income by Famaliy Size in Princeton
3-person families (18 | 20.2%) account for the highest median family income in Princeton with $173,864 per family, while 3-person families (18 | 20.2%) have the highest median income of $57,955 per family member.
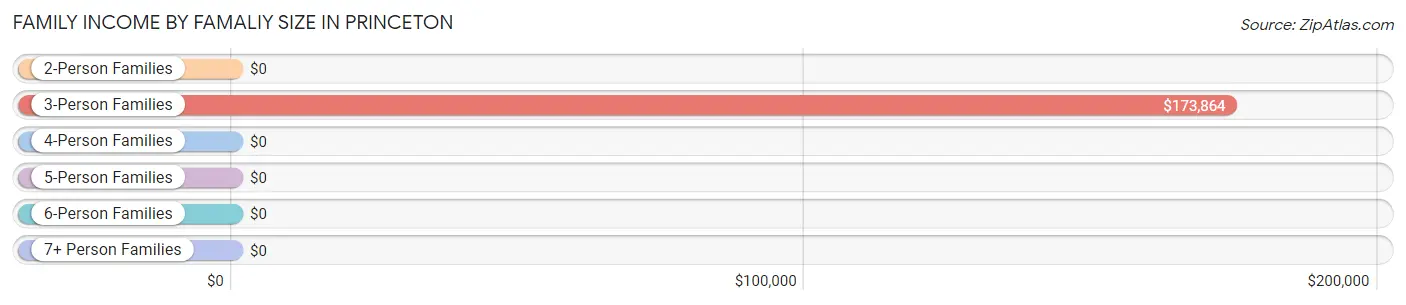
| Income Bracket | # Families | Median Income |
| 2-Person Families | 37 (41.6%) | $0 |
| 3-Person Families | 18 (20.2%) | $173,864 |
| 4-Person Families | 0 (0.0%) | $0 |
| 5-Person Families | 19 (21.3%) | $0 |
| 6-Person Families | 15 (16.9%) | $0 |
| 7+ Person Families | 0 (0.0%) | $0 |
| Total | 89 (100.0%) | $98,906 |
Family Income by Number of Earners in Princeton
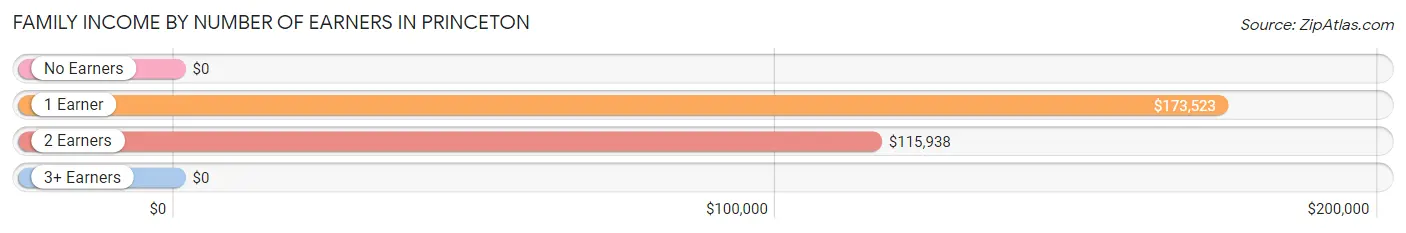
| Number of Earners | # Families | Median Income |
| No Earners | 19 (21.3%) | $0 |
| 1 Earner | 23 (25.8%) | $173,523 |
| 2 Earners | 47 (52.8%) | $115,938 |
| 3+ Earners | 0 (0.0%) | $0 |
| Total | 89 (100.0%) | $98,906 |
Household Income in Princeton
Household Income Brackets in Princeton
With 33 households falling in the category, the $35,000 to $49,999 income range is the most frequent in Princeton, accounting for 25.0% of all households.
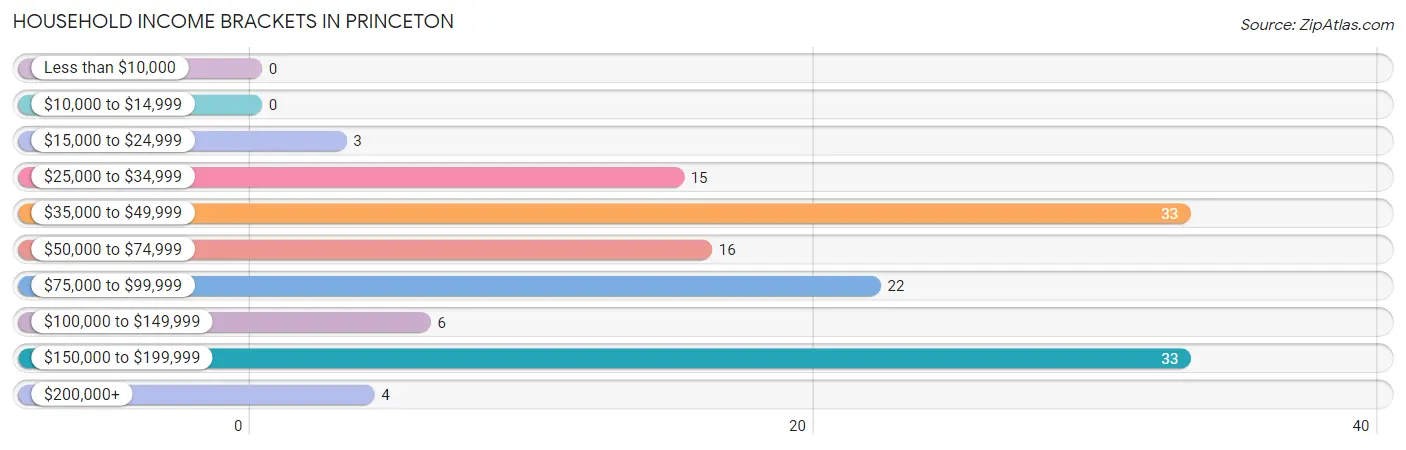
| Income Bracket | # Households | % Households |
| Less than $10,000 | 0 | 0.0% |
| $10,000 to $14,999 | 0 | 0.0% |
| $15,000 to $24,999 | 3 | 2.3% |
| $25,000 to $34,999 | 15 | 11.4% |
| $35,000 to $49,999 | 33 | 25.0% |
| $50,000 to $74,999 | 16 | 12.1% |
| $75,000 to $99,999 | 22 | 16.7% |
| $100,000 to $149,999 | 6 | 4.5% |
| $150,000 to $199,999 | 33 | 25.0% |
| $200,000+ | 4 | 3.0% |
Household Income by Householder Age in Princeton
The median household income in Princeton is $71,875, with the highest median household income of $56,667 found in the 65+ years age bracket for the primary householder. A total of 22 households (16.7%) fall into this category.
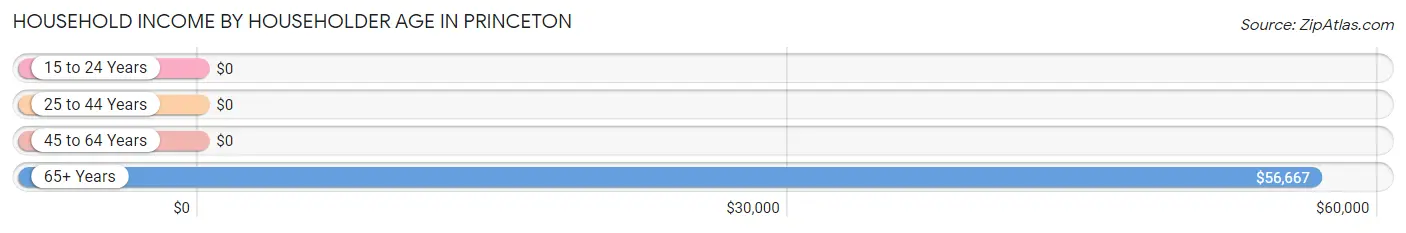
| Income Bracket | # Households | Median Income |
| 15 to 24 Years | 0 (0.0%) | $0 |
| 25 to 44 Years | 19 (14.4%) | $0 |
| 45 to 64 Years | 91 (68.9%) | $0 |
| 65+ Years | 22 (16.7%) | $56,667 |
| Total | 132 (100.0%) | $71,875 |
Poverty in Princeton
Income Below Poverty by Sex and Age in Princeton
With 33.2% poverty level for males and 16.8% for females among the residents of Princeton, 12 to 14 year old males and 6 to 11 year old females are the most vulnerable to poverty, with 29 males (100.0%) and 12 females (100.0%) in their respective age groups living below the poverty level.
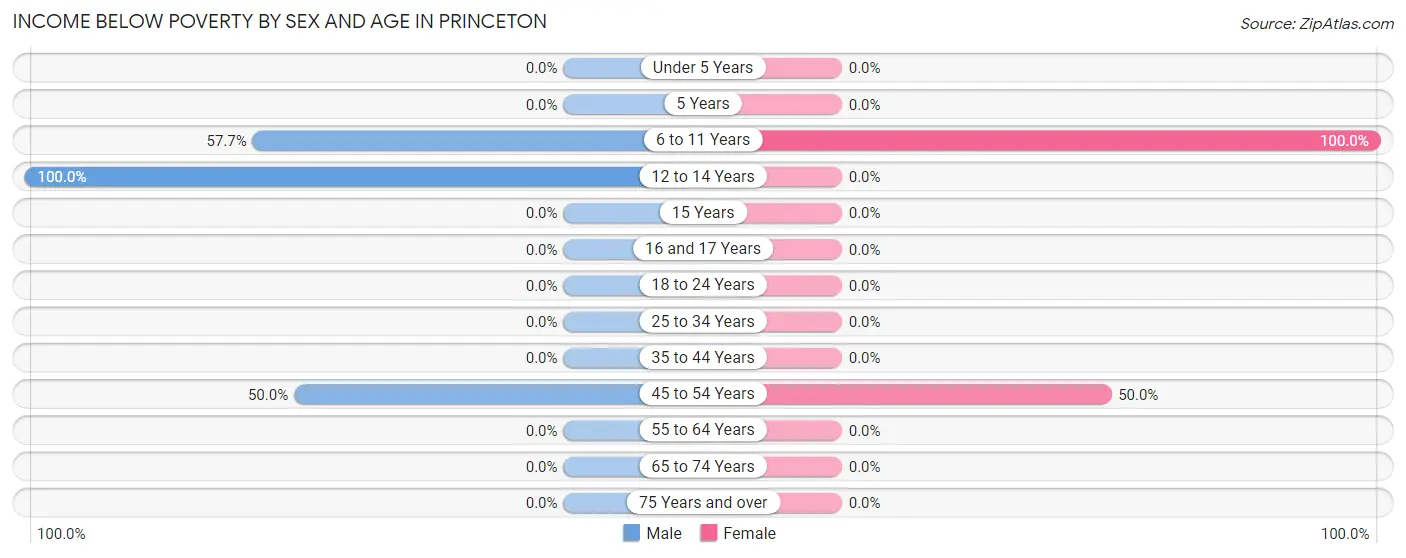
| Age Bracket | Male | Female |
| Under 5 Years | 0 (0.0%) | 0 (0.0%) |
| 5 Years | 0 (0.0%) | 0 (0.0%) |
| 6 to 11 Years | 15 (57.7%) | 12 (100.0%) |
| 12 to 14 Years | 29 (100.0%) | 0 (0.0%) |
| 15 Years | 0 (0.0%) | 0 (0.0%) |
| 16 and 17 Years | 0 (0.0%) | 0 (0.0%) |
| 18 to 24 Years | 0 (0.0%) | 0 (0.0%) |
| 25 to 34 Years | 0 (0.0%) | 0 (0.0%) |
| 35 to 44 Years | 0 (0.0%) | 0 (0.0%) |
| 45 to 54 Years | 15 (50.0%) | 18 (50.0%) |
| 55 to 64 Years | 0 (0.0%) | 0 (0.0%) |
| 65 to 74 Years | 0 (0.0%) | 0 (0.0%) |
| 75 Years and over | 0 (0.0%) | 0 (0.0%) |
| Total | 59 (33.2%) | 30 (16.8%) |
Income Above Poverty by Sex and Age in Princeton
According to the poverty statistics in Princeton, males aged under 5 years and females aged under 5 years are the age groups that are most secure financially, with 100.0% of males and 100.0% of females in these age groups living above the poverty line.
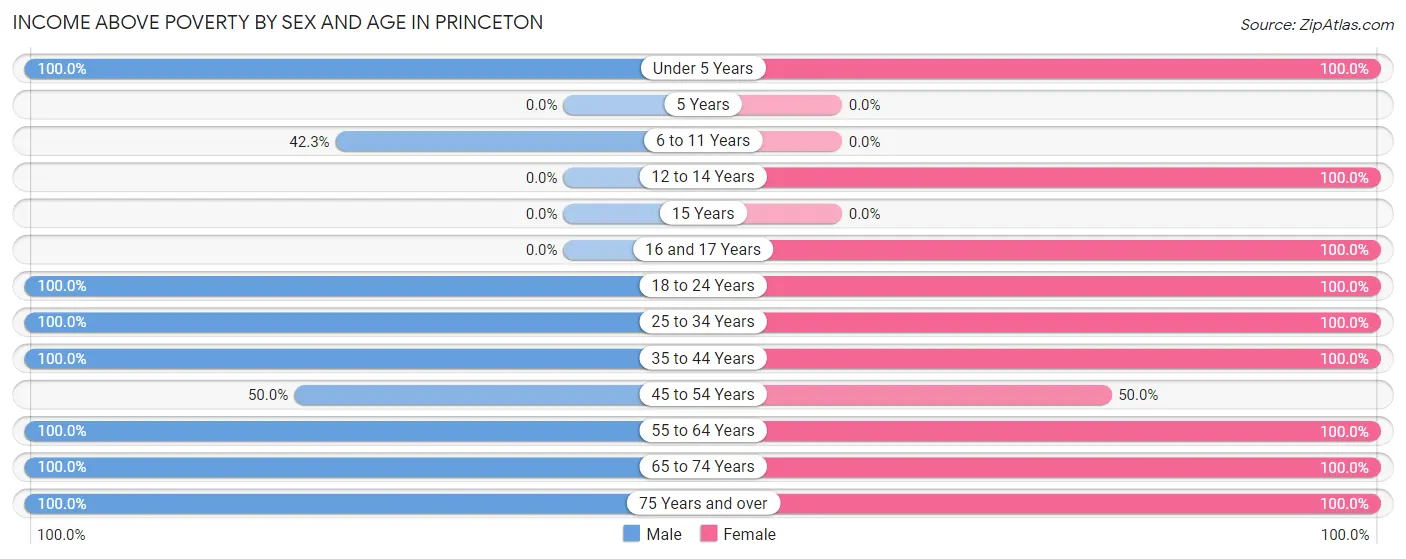
| Age Bracket | Male | Female |
| Under 5 Years | 19 (100.0%) | 31 (100.0%) |
| 5 Years | 0 (0.0%) | 0 (0.0%) |
| 6 to 11 Years | 11 (42.3%) | 0 (0.0%) |
| 12 to 14 Years | 0 (0.0%) | 4 (100.0%) |
| 15 Years | 0 (0.0%) | 0 (0.0%) |
| 16 and 17 Years | 0 (0.0%) | 3 (100.0%) |
| 18 to 24 Years | 23 (100.0%) | 9 (100.0%) |
| 25 to 34 Years | 5 (100.0%) | 14 (100.0%) |
| 35 to 44 Years | 3 (100.0%) | 4 (100.0%) |
| 45 to 54 Years | 15 (50.0%) | 18 (50.0%) |
| 55 to 64 Years | 29 (100.0%) | 41 (100.0%) |
| 65 to 74 Years | 4 (100.0%) | 12 (100.0%) |
| 75 Years and over | 10 (100.0%) | 13 (100.0%) |
| Total | 119 (66.8%) | 149 (83.2%) |
Income Below Poverty Among Married-Couple Families in Princeton
The poverty statistics for married-couple families in Princeton show that 16.9% or 15 of the total 89 families live below the poverty line. Families with 3 or 4 children have the highest poverty rate of 50.0%, comprising of 15 families. On the other hand, families with no children have the lowest poverty rate of 0.0%, which includes 0 families.
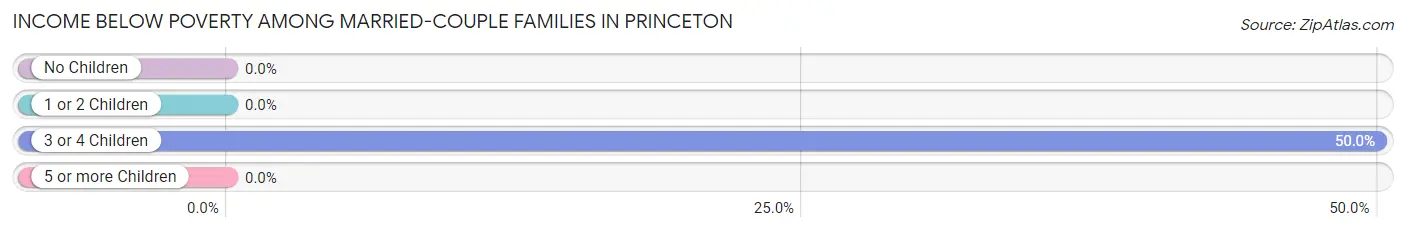
| Children | Above Poverty | Below Poverty |
| No Children | 44 (100.0%) | 0 (0.0%) |
| 1 or 2 Children | 15 (100.0%) | 0 (0.0%) |
| 3 or 4 Children | 15 (50.0%) | 15 (50.0%) |
| 5 or more Children | 0 (0.0%) | 0 (0.0%) |
| Total | 74 (83.2%) | 15 (16.9%) |
Income Below Poverty Among Single-Parent Households in Princeton
| Children | Single Father | Single Mother |
| No Children | 0 (0.0%) | 0 (0.0%) |
| 1 or 2 Children | 0 (0.0%) | 0 (0.0%) |
| 3 or 4 Children | 0 (0.0%) | 0 (0.0%) |
| 5 or more Children | 0 (0.0%) | 0 (0.0%) |
| Total | 0 (0.0%) | 0 (0.0%) |
Income Below Poverty Among Married-Couple vs Single-Parent Households in Princeton
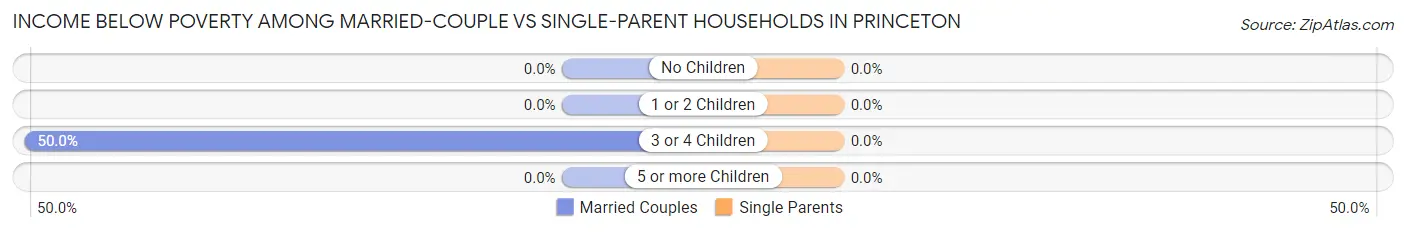
| Children | Married-Couple Families | Single-Parent Households |
| No Children | 0 (0.0%) | 0 (0.0%) |
| 1 or 2 Children | 0 (0.0%) | 0 (0.0%) |
| 3 or 4 Children | 15 (50.0%) | 0 (0.0%) |
| 5 or more Children | 0 (0.0%) | 0 (0.0%) |
| Total | 15 (16.9%) | 0 (0.0%) |
Race in Princeton
The most populous races in Princeton are White / Caucasian (348 | 97.5%), Hispanic or Latino (85 | 23.8%), and Native / Alaskan (4 | 1.1%).
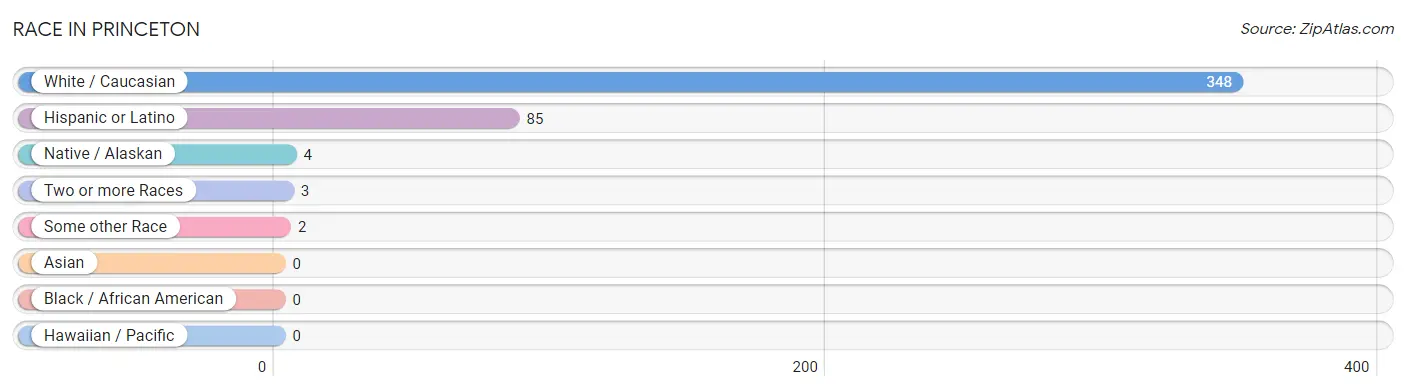
| Race | # Population | % Population |
| Asian | 0 | 0.0% |
| Black / African American | 0 | 0.0% |
| Hawaiian / Pacific | 0 | 0.0% |
| Hispanic or Latino | 85 | 23.8% |
| Native / Alaskan | 4 | 1.1% |
| White / Caucasian | 348 | 97.5% |
| Two or more Races | 3 | 0.8% |
| Some other Race | 2 | 0.6% |
| Total | 357 | 100.0% |
Ancestry in Princeton
The most populous ancestries reported in Princeton are German (106 | 29.7%), Mexican (68 | 19.1%), Portuguese (35 | 9.8%), Irish (33 | 9.2%), and Italian (22 | 6.2%), together accounting for 73.9% of all Princeton residents.
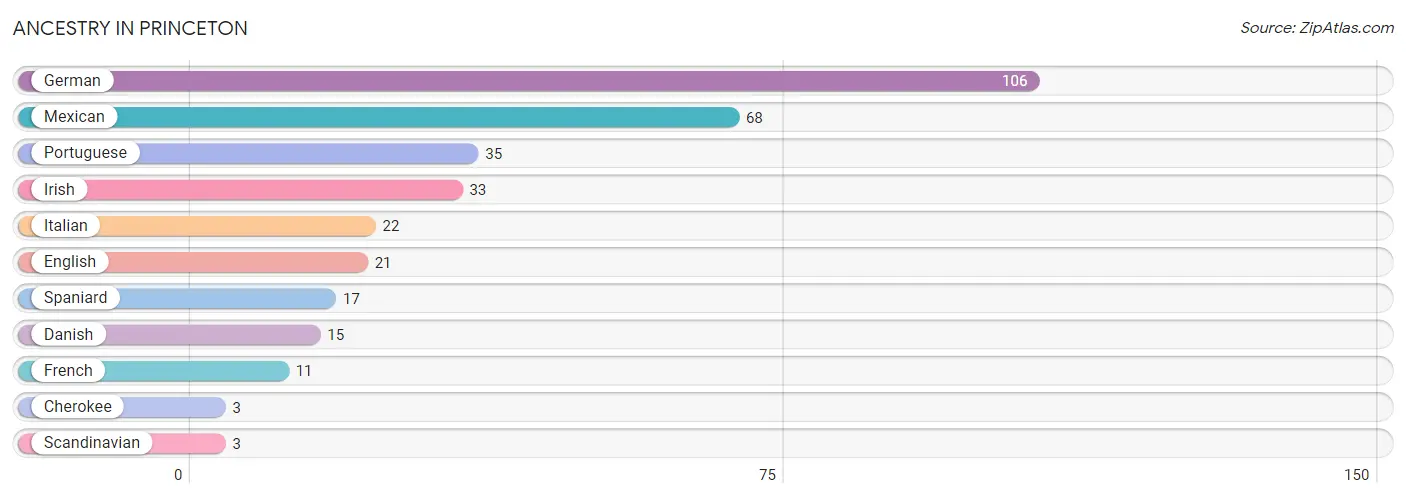
| Ancestry | # Population | % Population |
| Cherokee | 3 | 0.8% |
| Danish | 15 | 4.2% |
| English | 21 | 5.9% |
| French | 11 | 3.1% |
| German | 106 | 29.7% |
| Irish | 33 | 9.2% |
| Italian | 22 | 6.2% |
| Mexican | 68 | 19.1% |
| Portuguese | 35 | 9.8% |
| Scandinavian | 3 | 0.8% |
| Spaniard | 17 | 4.8% | View All 11 Rows |
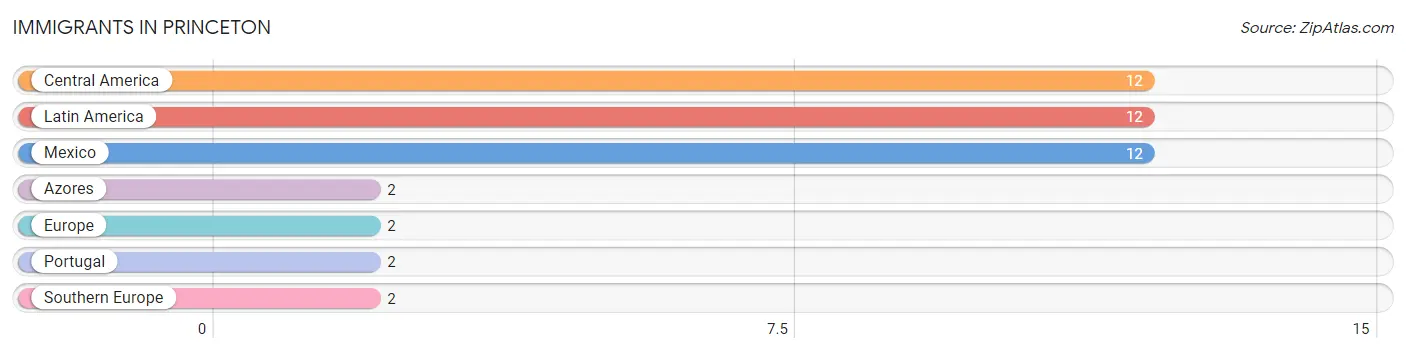
Immigrants in Princeton
The most numerous immigrant groups reported in Princeton came from Central America (12 | 3.4%), Latin America (12 | 3.4%), Mexico (12 | 3.4%), Azores (2 | 0.6%), and Europe (2 | 0.6%), together accounting for 11.2% of all Princeton residents.
| Immigration Origin | # Population | % Population |
| Azores | 2 | 0.6% |
| Central America | 12 | 3.4% |
| Europe | 2 | 0.6% |
| Latin America | 12 | 3.4% |
| Mexico | 12 | 3.4% |
| Portugal | 2 | 0.6% |
| Southern Europe | 2 | 0.6% | View All 7 Rows |
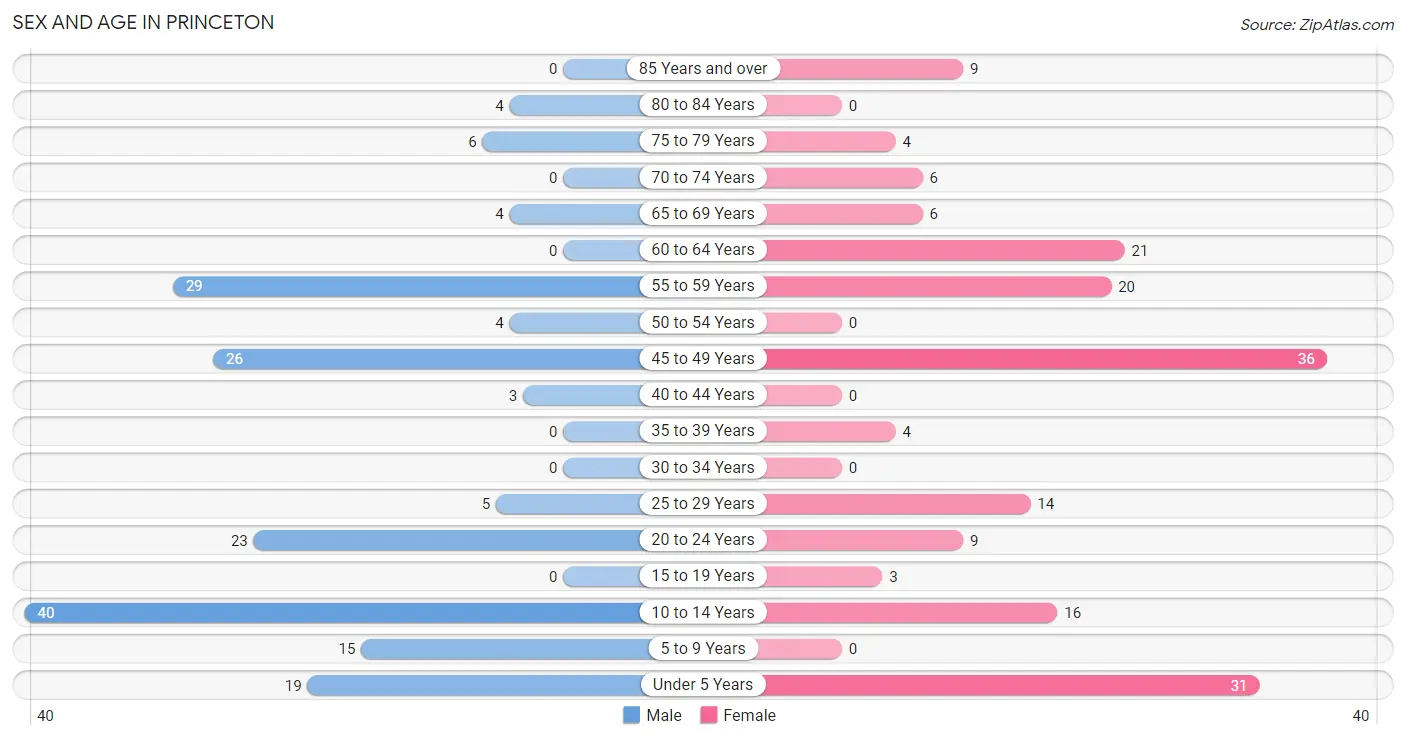
Sex and Age in Princeton
Sex and Age in Princeton
The most populous age groups in Princeton are 10 to 14 Years (40 | 22.5%) for men and 45 to 49 Years (36 | 20.1%) for women.
| Age Bracket | Male | Female |
| Under 5 Years | 19 (10.7%) | 31 (17.3%) |
| 5 to 9 Years | 15 (8.4%) | 0 (0.0%) |
| 10 to 14 Years | 40 (22.5%) | 16 (8.9%) |
| 15 to 19 Years | 0 (0.0%) | 3 (1.7%) |
| 20 to 24 Years | 23 (12.9%) | 9 (5.0%) |
| 25 to 29 Years | 5 (2.8%) | 14 (7.8%) |
| 30 to 34 Years | 0 (0.0%) | 0 (0.0%) |
| 35 to 39 Years | 0 (0.0%) | 4 (2.2%) |
| 40 to 44 Years | 3 (1.7%) | 0 (0.0%) |
| 45 to 49 Years | 26 (14.6%) | 36 (20.1%) |
| 50 to 54 Years | 4 (2.2%) | 0 (0.0%) |
| 55 to 59 Years | 29 (16.3%) | 20 (11.2%) |
| 60 to 64 Years | 0 (0.0%) | 21 (11.7%) |
| 65 to 69 Years | 4 (2.2%) | 6 (3.4%) |
| 70 to 74 Years | 0 (0.0%) | 6 (3.4%) |
| 75 to 79 Years | 6 (3.4%) | 4 (2.2%) |
| 80 to 84 Years | 4 (2.2%) | 0 (0.0%) |
| 85 Years and over | 0 (0.0%) | 9 (5.0%) |
| Total | 178 (100.0%) | 179 (100.0%) |
Families and Households in Princeton
Median Family Size in Princeton
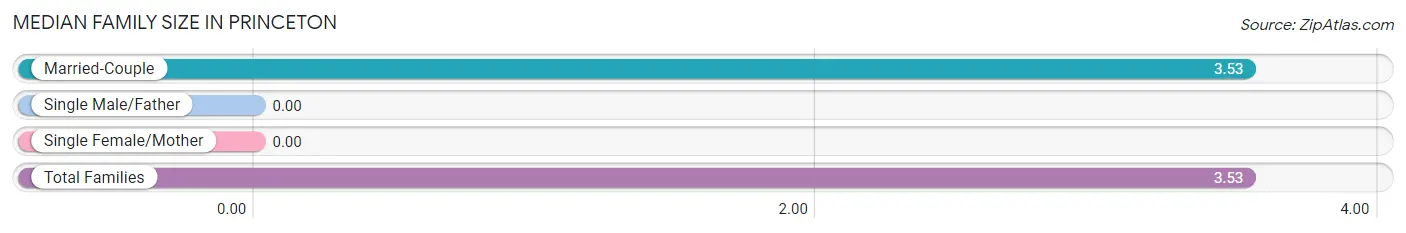
| Family Type | # Families | Family Size |
| Married-Couple | 89 (100.0%) | 3.53 |
| Single Male/Father | 0 (0.0%) | - |
| Single Female/Mother | 0 (0.0%) | - |
| Total Families | 89 (100.0%) | 3.53 |
Median Household Size in Princeton
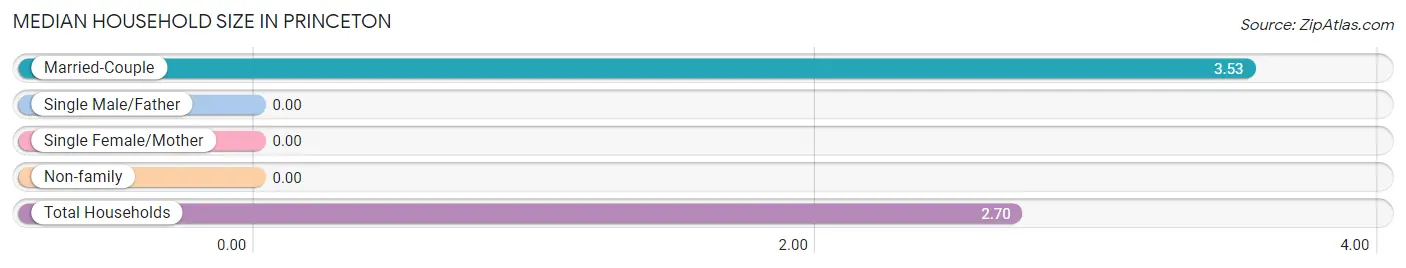
| Household Type | # Households | Household Size |
| Married-Couple | 89 (67.4%) | 3.53 |
| Single Male/Father | 0 (0.0%) | - |
| Single Female/Mother | 0 (0.0%) | - |
| Non-family | 43 (32.6%) | - |
| Total Households | 132 (100.0%) | 2.70 |
Household Size by Marriage Status in Princeton
Out of a total of 132 households in Princeton, 89 (67.4%) are family households, while 43 (32.6%) are nonfamily households. The most numerous type of family households are 2-person households, comprising 37, and the most common type of nonfamily households are 1-person households, comprising 43.
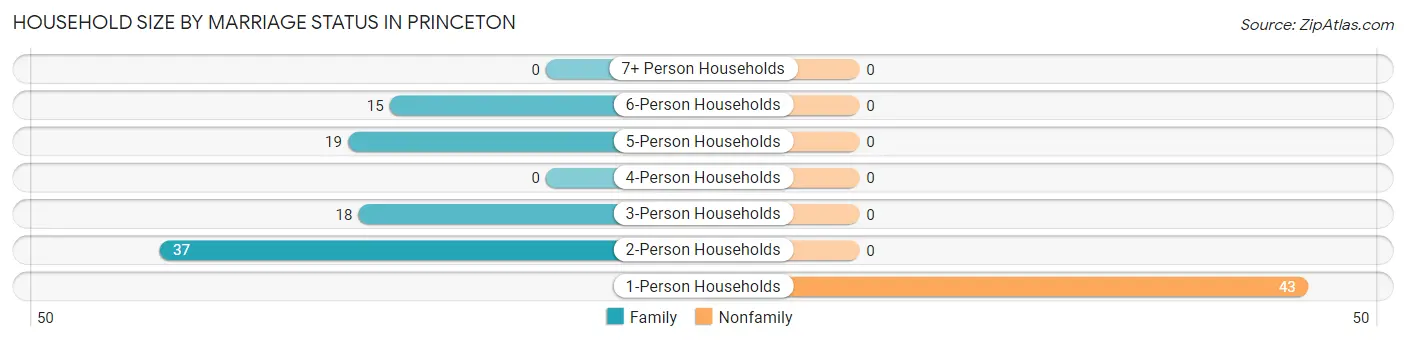
| Household Size | Family Households | Nonfamily Households |
| 1-Person Households | - | 43 (32.6%) |
| 2-Person Households | 37 (28.0%) | 0 (0.0%) |
| 3-Person Households | 18 (13.6%) | 0 (0.0%) |
| 4-Person Households | 0 (0.0%) | 0 (0.0%) |
| 5-Person Households | 19 (14.4%) | 0 (0.0%) |
| 6-Person Households | 15 (11.4%) | 0 (0.0%) |
| 7+ Person Households | 0 (0.0%) | 0 (0.0%) |
| Total | 89 (67.4%) | 43 (32.6%) |
Female Fertility in Princeton
Fertility by Age in Princeton
Average fertility rate in Princeton is 212.0 births per 1,000 women. Women in the age bracket of 20 to 34 years have the highest fertility rate with 609.0 births per 1,000 women. Women in the age bracket of 20 to 34 years acount for 100.0% of all women with births.
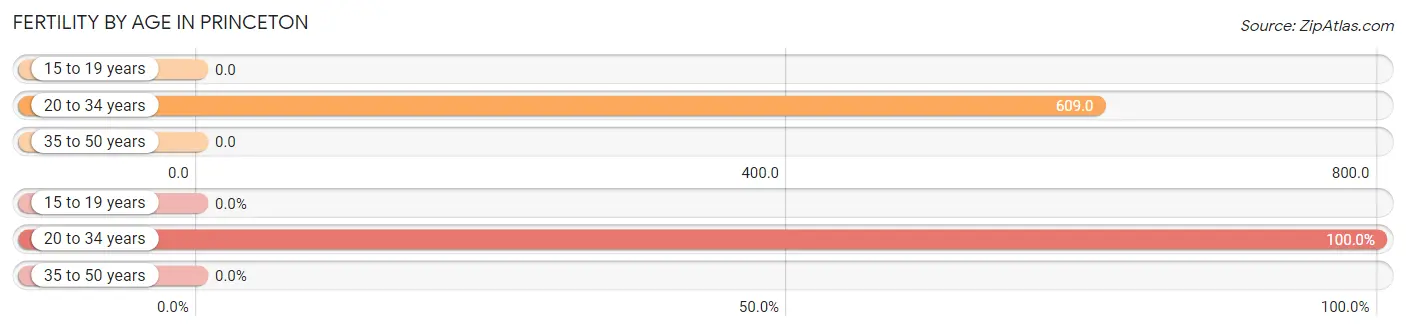
| Age Bracket | Women with Births | Births / 1,000 Women |
| 15 to 19 years | 0 (0.0%) | 0.0 |
| 20 to 34 years | 14 (100.0%) | 609.0 |
| 35 to 50 years | 0 (0.0%) | 0.0 |
| Total | 14 (100.0%) | 212.0 |
Fertility by Age by Marriage Status in Princeton
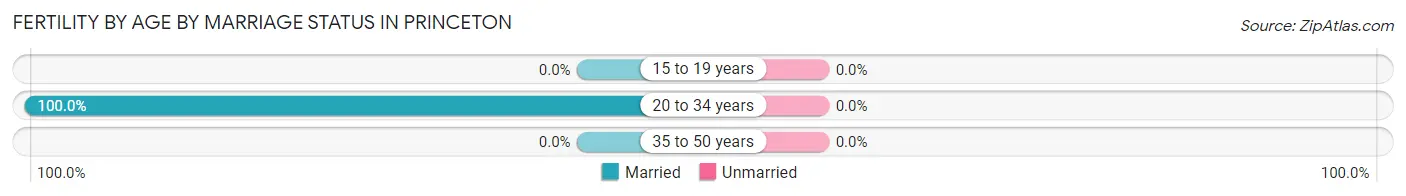
| Age Bracket | Married | Unmarried |
| 15 to 19 years | 0 (0.0%) | 0 (0.0%) |
| 20 to 34 years | 14 (100.0%) | 0 (0.0%) |
| 35 to 50 years | 0 (0.0%) | 0 (0.0%) |
| Total | 14 (100.0%) | 0 (0.0%) |
Fertility by Education in Princeton
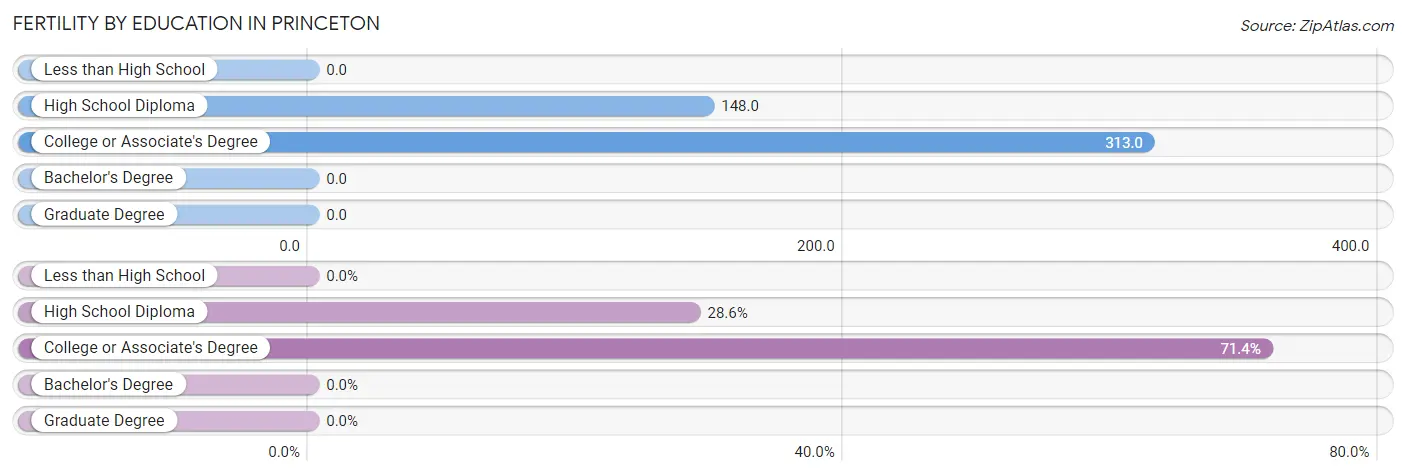
| Educational Attainment | Women with Births | Births / 1,000 Women |
| Less than High School | 0 (0.0%) | 0.0 |
| High School Diploma | 4 (28.6%) | 148.0 |
| College or Associate's Degree | 10 (71.4%) | 313.0 |
| Bachelor's Degree | 0 (0.0%) | 0.0 |
| Graduate Degree | 0 (0.0%) | 0.0 |
| Total | 14 (100.0%) | 212.0 |
Fertility by Education by Marriage Status in Princeton
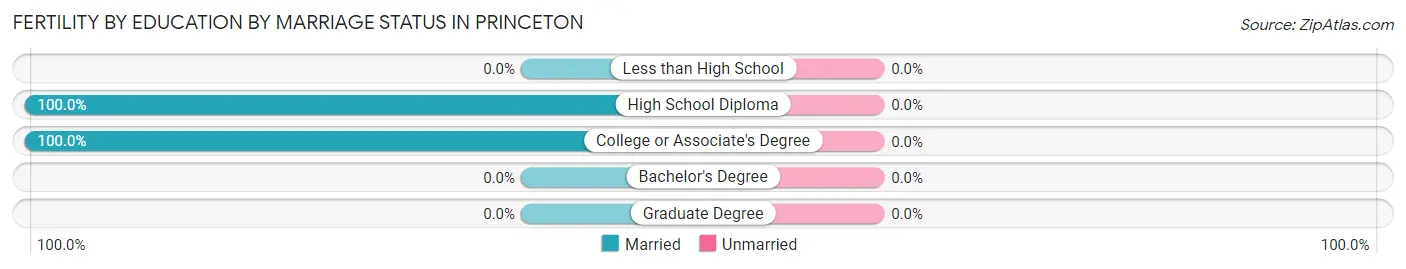
| Educational Attainment | Married | Unmarried |
| Less than High School | 0 (0.0%) | 0 (0.0%) |
| High School Diploma | 4 (100.0%) | 0 (0.0%) |
| College or Associate's Degree | 10 (100.0%) | 0 (0.0%) |
| Bachelor's Degree | 0 (0.0%) | 0 (0.0%) |
| Graduate Degree | 0 (0.0%) | 0 (0.0%) |
| Total | 14 (100.0%) | 0 (0.0%) |
Employment Characteristics in Princeton
Employment by Class of Employer in Princeton
Among the 145 employed individuals in Princeton, private company employees (106 | 73.1%), local government employees (17 | 11.7%), and self-employed (not incorporated) (14 | 9.7%) make up the most common classes of employment.
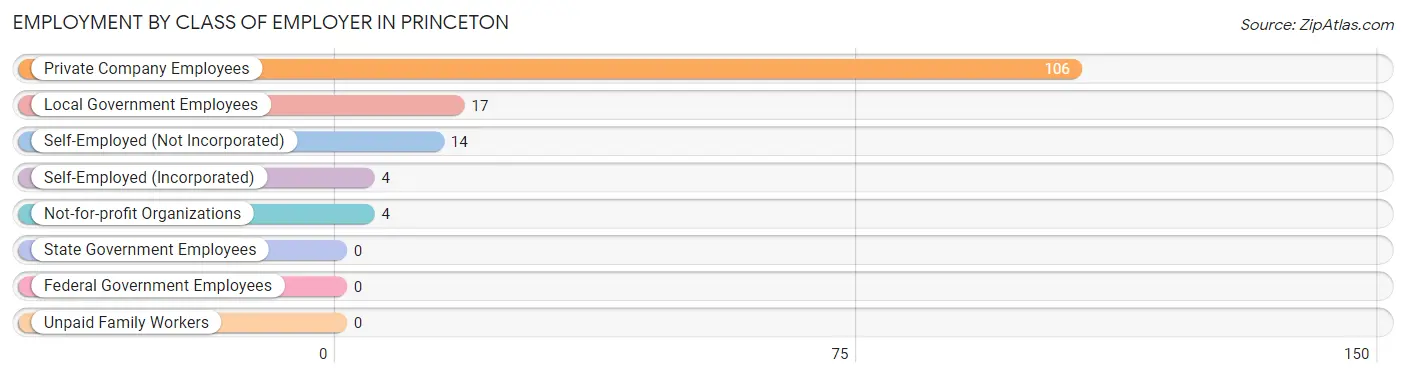
| Employer Class | # Employees | % Employees |
| Private Company Employees | 106 | 73.1% |
| Self-Employed (Incorporated) | 4 | 2.8% |
| Self-Employed (Not Incorporated) | 14 | 9.7% |
| Not-for-profit Organizations | 4 | 2.8% |
| Local Government Employees | 17 | 11.7% |
| State Government Employees | 0 | 0.0% |
| Federal Government Employees | 0 | 0.0% |
| Unpaid Family Workers | 0 | 0.0% |
| Total | 145 | 100.0% |
Employment Status by Age in Princeton
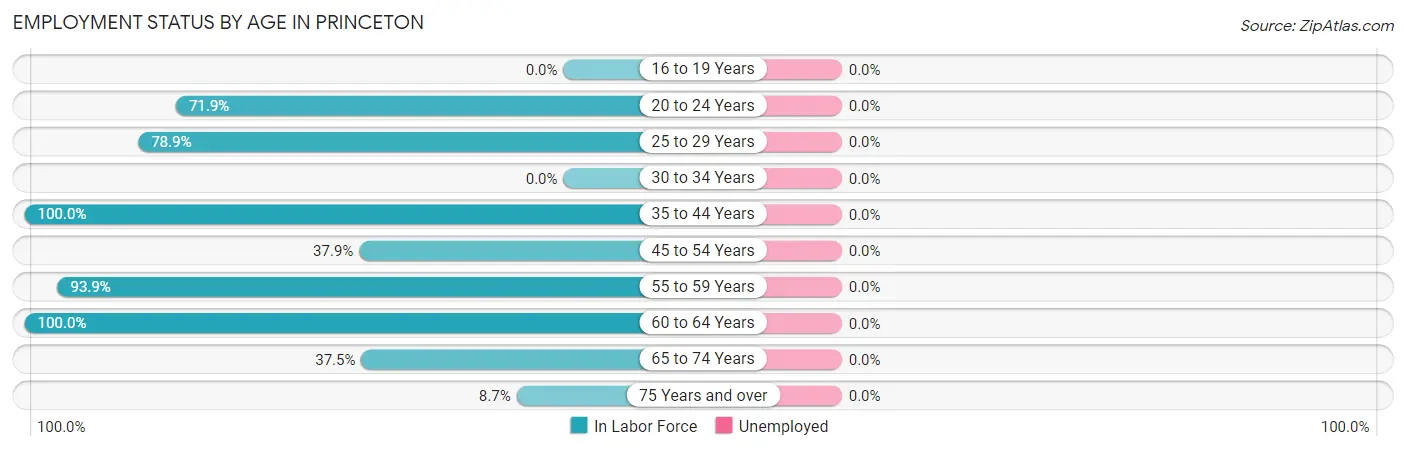
| Age Bracket | In Labor Force | Unemployed |
| 16 to 19 Years | 0 (0.0%) | 0 (0.0%) |
| 20 to 24 Years | 23 (71.9%) | 0 (0.0%) |
| 25 to 29 Years | 15 (78.9%) | 0 (0.0%) |
| 30 to 34 Years | 0 (0.0%) | 0 (0.0%) |
| 35 to 44 Years | 7 (100.0%) | 0 (0.0%) |
| 45 to 54 Years | 25 (37.9%) | 0 (0.0%) |
| 55 to 59 Years | 46 (93.9%) | 0 (0.0%) |
| 60 to 64 Years | 21 (100.0%) | 0 (0.0%) |
| 65 to 74 Years | 6 (37.5%) | 0 (0.0%) |
| 75 Years and over | 2 (8.7%) | 0 (0.0%) |
| Total | 145 (61.4%) | 0 (0.0%) |
Employment Status by Educational Attainment in Princeton
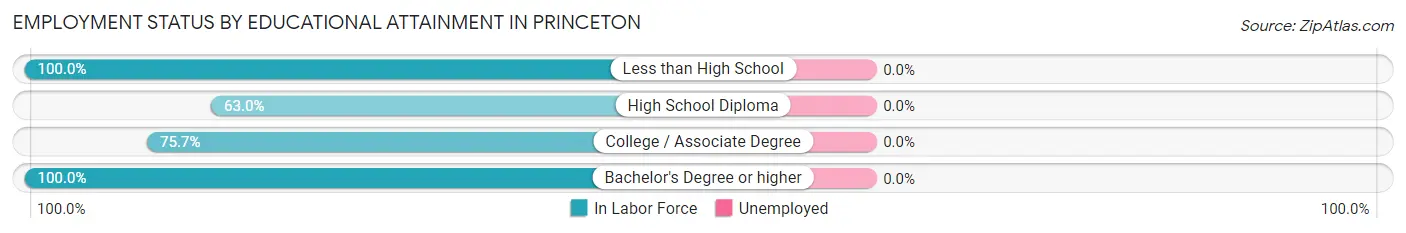
| Educational Attainment | In Labor Force | Unemployed |
| Less than High School | 3 (100.0%) | 0 (0.0%) |
| High School Diploma | 51 (63.0%) | 0 (0.0%) |
| College / Associate Degree | 56 (75.7%) | 0 (0.0%) |
| Bachelor's Degree or higher | 4 (100.0%) | 0 (0.0%) |
| Total | 114 (70.4%) | 0 (0.0%) |
Employment Occupations by Sex in Princeton
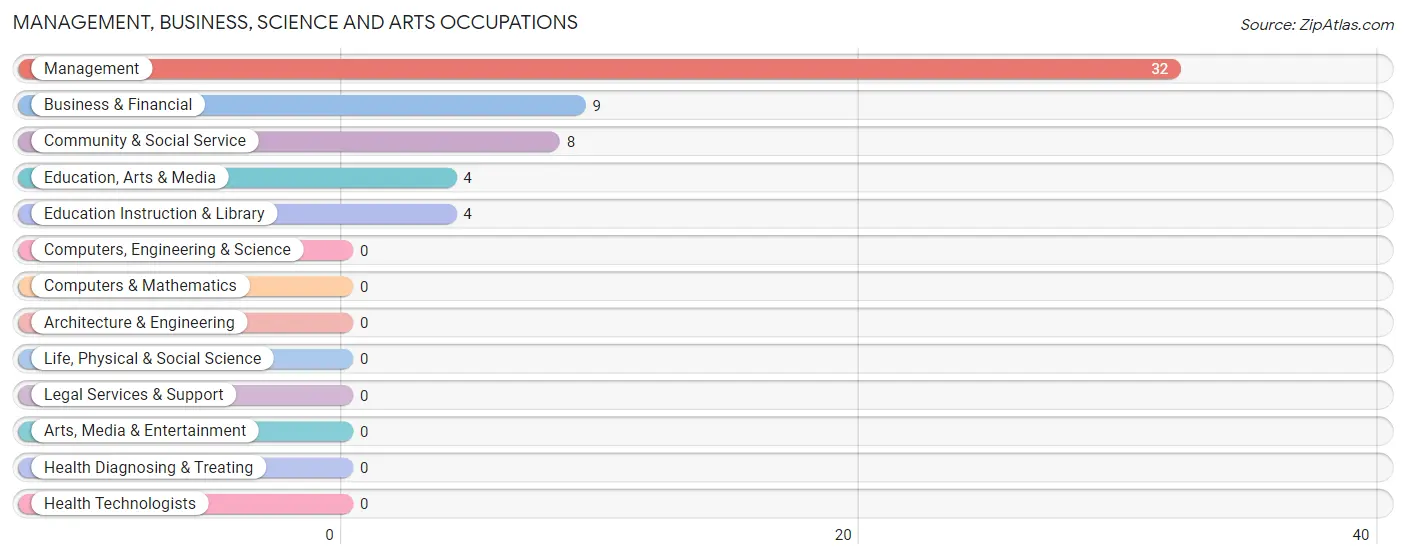
Management, Business, Science and Arts Occupations
The most common Management, Business, Science and Arts occupations in Princeton are Management (32 | 22.1%), Business & Financial (9 | 6.2%), Community & Social Service (8 | 5.5%), Education, Arts & Media (4 | 2.8%), and Education Instruction & Library (4 | 2.8%).
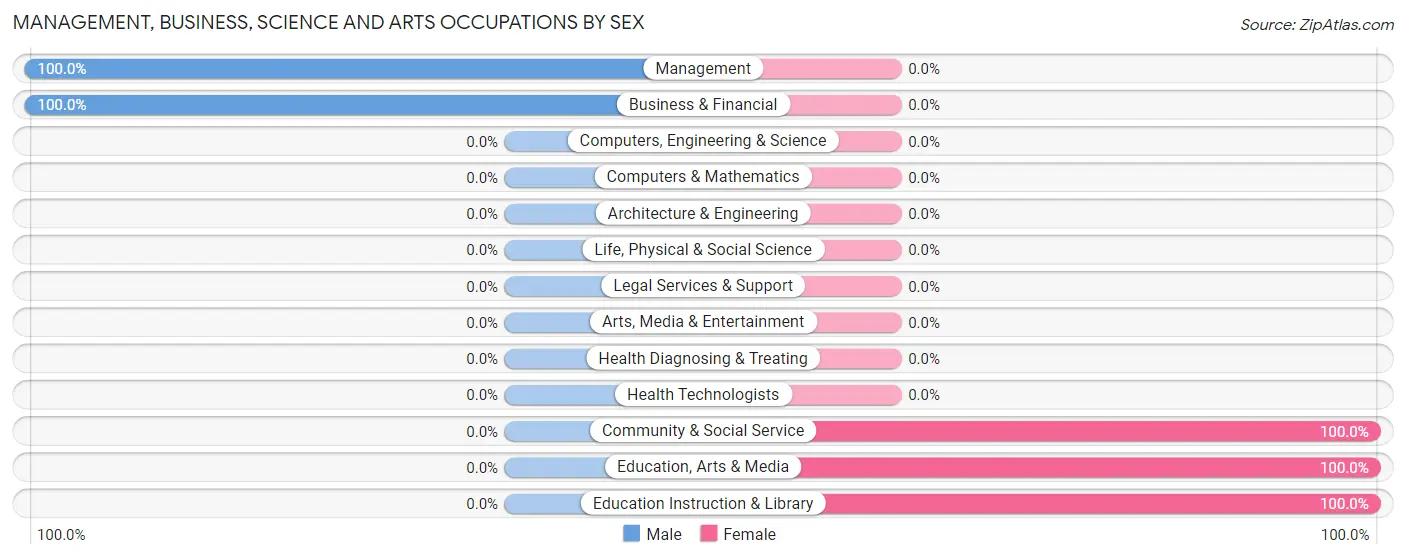
Management, Business, Science and Arts Occupations by Sex
Within the Management, Business, Science and Arts occupations in Princeton, the most male-oriented occupations are Management (100.0%), and Business & Financial (100.0%), while the most female-oriented occupations are Community & Social Service (100.0%), Education, Arts & Media (100.0%), and Education Instruction & Library (100.0%).
| Occupation | Male | Female |
| Management | 32 (100.0%) | 0 (0.0%) |
| Business & Financial | 9 (100.0%) | 0 (0.0%) |
| Computers, Engineering & Science | 0 (0.0%) | 0 (0.0%) |
| Computers & Mathematics | 0 (0.0%) | 0 (0.0%) |
| Architecture & Engineering | 0 (0.0%) | 0 (0.0%) |
| Life, Physical & Social Science | 0 (0.0%) | 0 (0.0%) |
| Community & Social Service | 0 (0.0%) | 8 (100.0%) |
| Education, Arts & Media | 0 (0.0%) | 4 (100.0%) |
| Legal Services & Support | 0 (0.0%) | 0 (0.0%) |
| Education Instruction & Library | 0 (0.0%) | 4 (100.0%) |
| Arts, Media & Entertainment | 0 (0.0%) | 0 (0.0%) |
| Health Diagnosing & Treating | 0 (0.0%) | 0 (0.0%) |
| Health Technologists | 0 (0.0%) | 0 (0.0%) |
| Total (Category) | 41 (83.7%) | 8 (16.3%) |
| Total (Overall) | 76 (52.4%) | 69 (47.6%) |
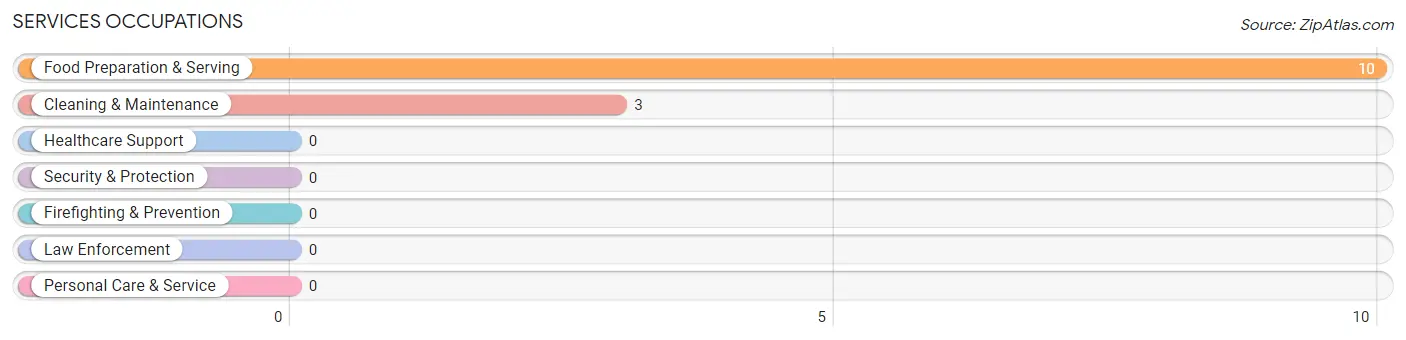
Services Occupations
The most common Services occupations in Princeton are Food Preparation & Serving (10 | 6.9%), and Cleaning & Maintenance (3 | 2.1%).
Services Occupations by Sex
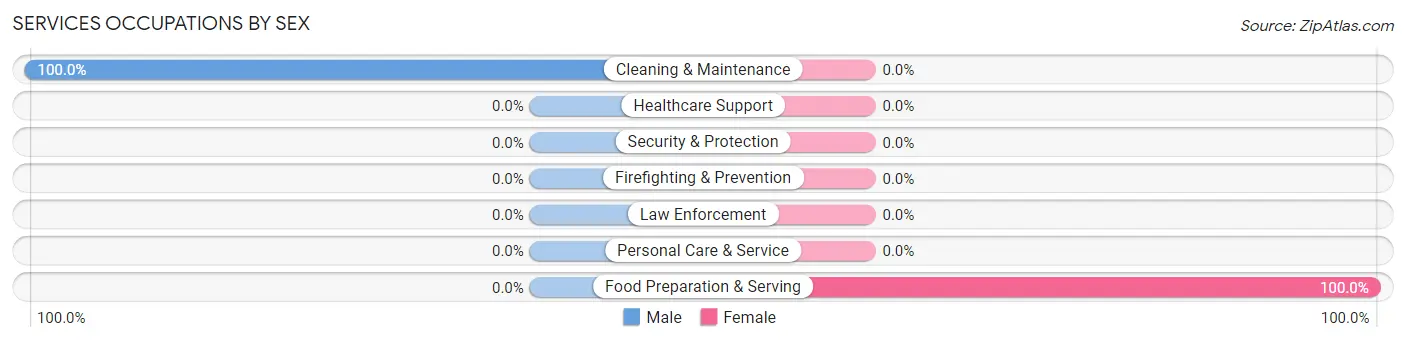
| Occupation | Male | Female |
| Healthcare Support | 0 (0.0%) | 0 (0.0%) |
| Security & Protection | 0 (0.0%) | 0 (0.0%) |
| Firefighting & Prevention | 0 (0.0%) | 0 (0.0%) |
| Law Enforcement | 0 (0.0%) | 0 (0.0%) |
| Food Preparation & Serving | 0 (0.0%) | 10 (100.0%) |
| Cleaning & Maintenance | 3 (100.0%) | 0 (0.0%) |
| Personal Care & Service | 0 (0.0%) | 0 (0.0%) |
| Total (Category) | 3 (23.1%) | 10 (76.9%) |
| Total (Overall) | 76 (52.4%) | 69 (47.6%) |
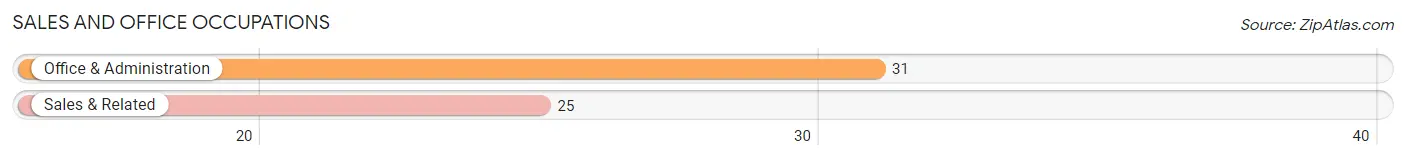
Sales and Office Occupations
The most common Sales and Office occupations in Princeton are Office & Administration (31 | 21.4%), and Sales & Related (25 | 17.2%).
Sales and Office Occupations by Sex
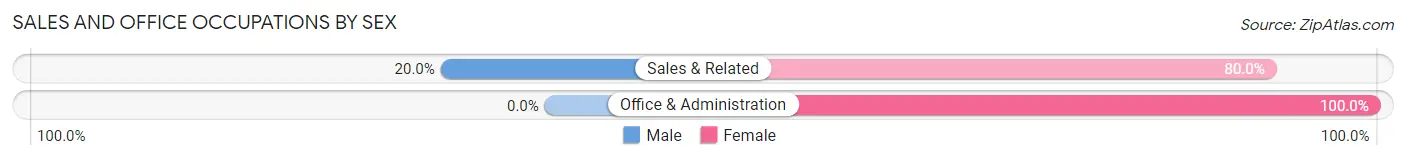
| Occupation | Male | Female |
| Sales & Related | 5 (20.0%) | 20 (80.0%) |
| Office & Administration | 0 (0.0%) | 31 (100.0%) |
| Total (Category) | 5 (8.9%) | 51 (91.1%) |
| Total (Overall) | 76 (52.4%) | 69 (47.6%) |
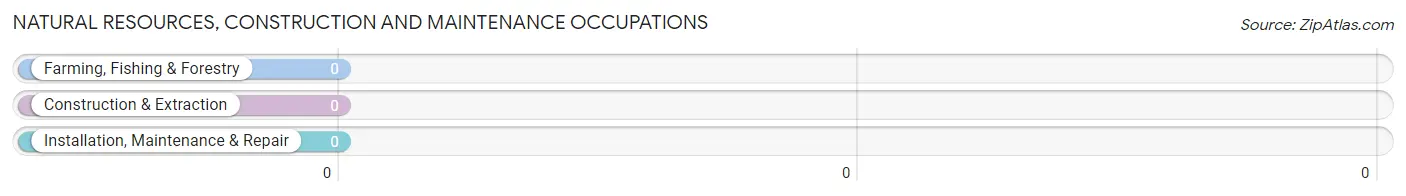
Natural Resources, Construction and Maintenance Occupations
Natural Resources, Construction and Maintenance Occupations by Sex
| Occupation | Male | Female |
| Farming, Fishing & Forestry | 0 (0.0%) | 0 (0.0%) |
| Construction & Extraction | 0 (0.0%) | 0 (0.0%) |
| Installation, Maintenance & Repair | 0 (0.0%) | 0 (0.0%) |
| Total (Category) | 0 (0.0%) | 0 (0.0%) |
| Total (Overall) | 76 (52.4%) | 69 (47.6%) |
Production, Transportation and Moving Occupations
The most common Production, Transportation and Moving occupations in Princeton are , and Production (27 | 18.6%).
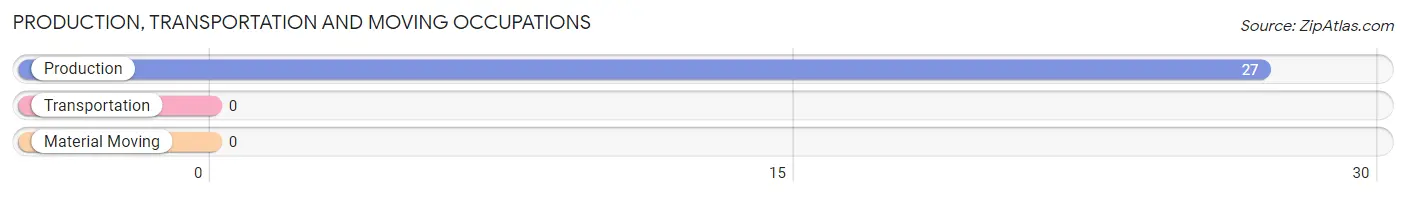
Production, Transportation and Moving Occupations by Sex
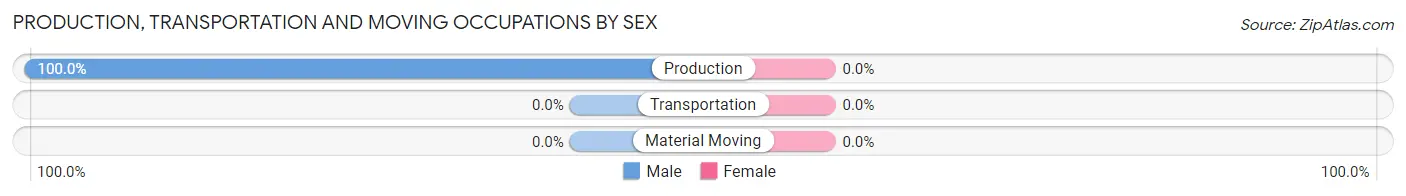
| Occupation | Male | Female |
| Production | 27 (100.0%) | 0 (0.0%) |
| Transportation | 0 (0.0%) | 0 (0.0%) |
| Material Moving | 0 (0.0%) | 0 (0.0%) |
| Total (Category) | 27 (100.0%) | 0 (0.0%) |
| Total (Overall) | 76 (52.4%) | 69 (47.6%) |
Employment Industries by Sex in Princeton
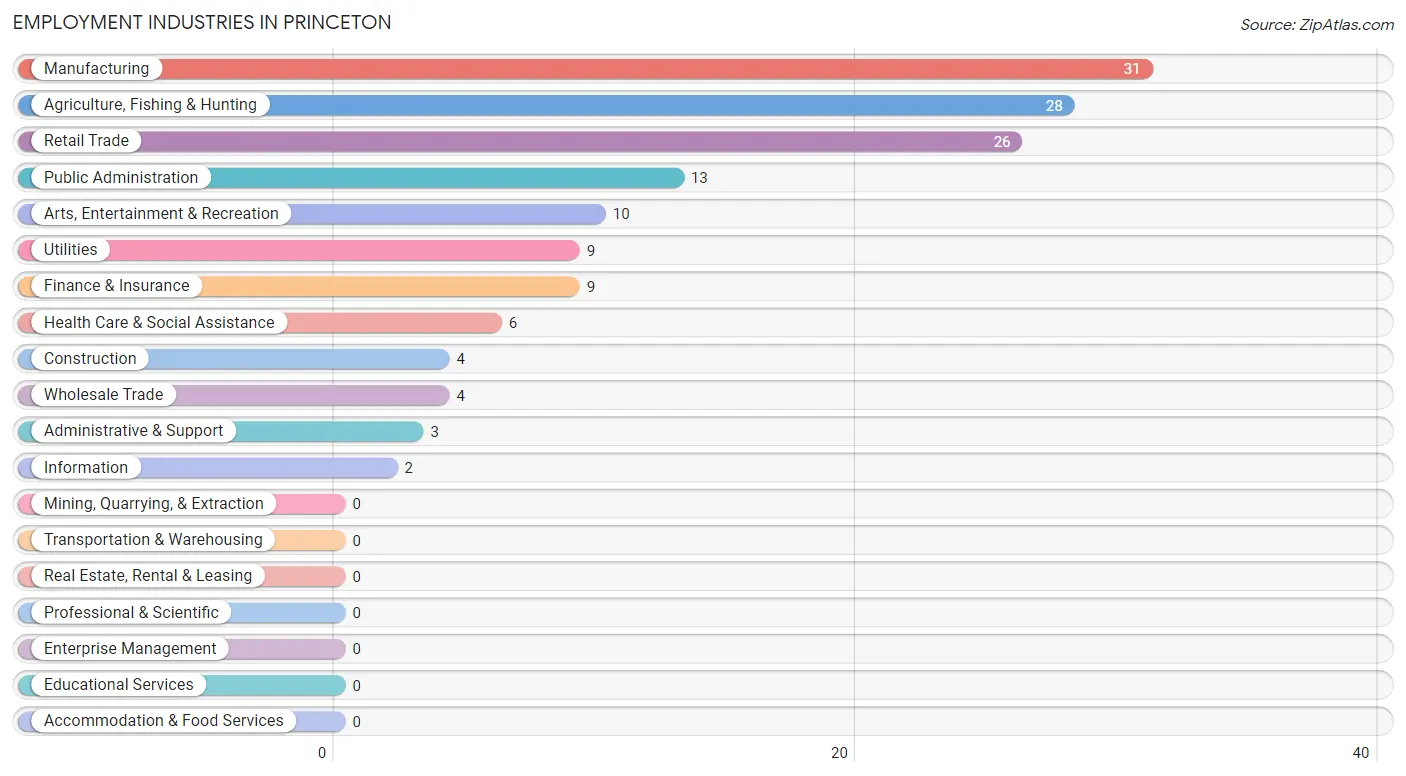
Employment Industries in Princeton
The major employment industries in Princeton include Manufacturing (31 | 21.4%), Agriculture, Fishing & Hunting (28 | 19.3%), Retail Trade (26 | 17.9%), Public Administration (13 | 9.0%), and Arts, Entertainment & Recreation (10 | 6.9%).
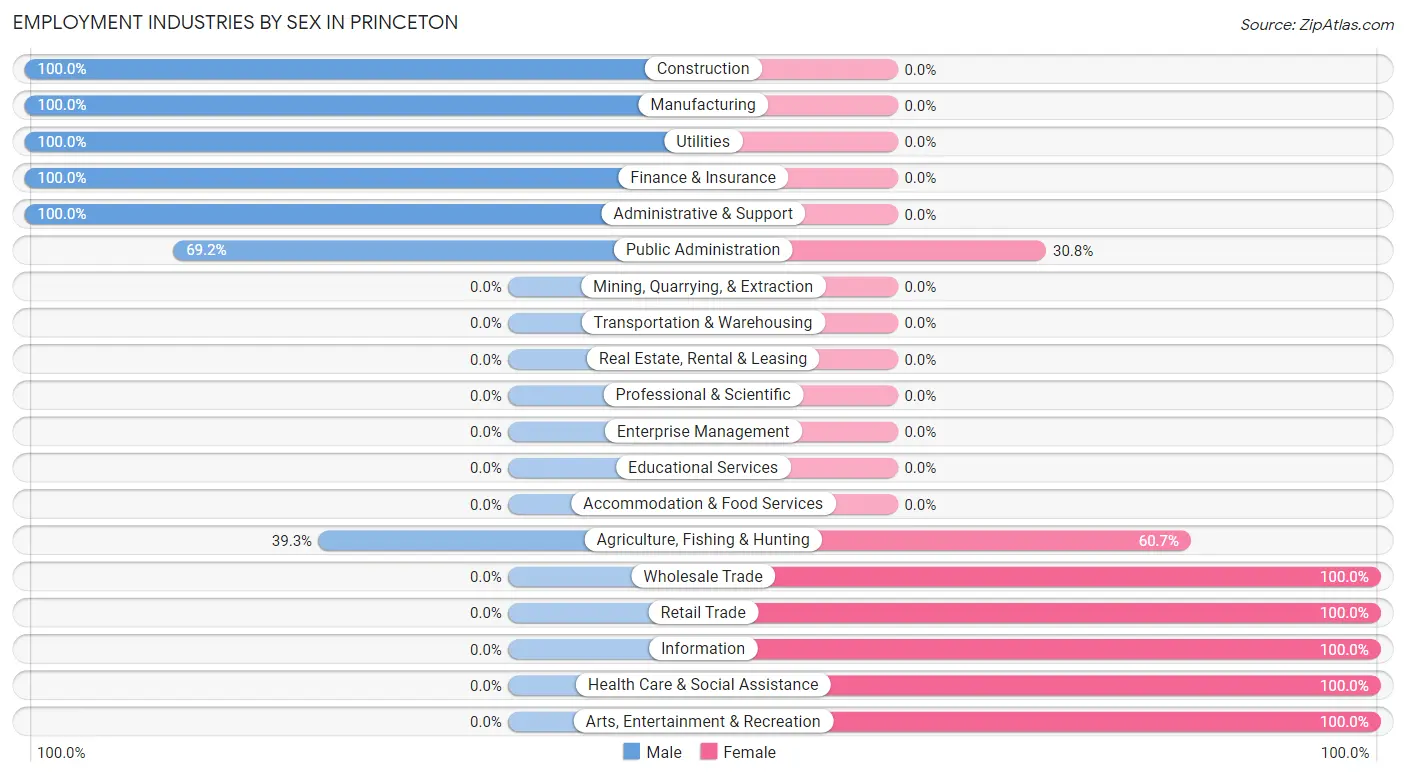
Employment Industries by Sex in Princeton
The Princeton industries that see more men than women are Construction (100.0%), Manufacturing (100.0%), and Utilities (100.0%), whereas the industries that tend to have a higher number of women are Wholesale Trade (100.0%), Retail Trade (100.0%), and Information (100.0%).
| Industry | Male | Female |
| Agriculture, Fishing & Hunting | 11 (39.3%) | 17 (60.7%) |
| Mining, Quarrying, & Extraction | 0 (0.0%) | 0 (0.0%) |
| Construction | 4 (100.0%) | 0 (0.0%) |
| Manufacturing | 31 (100.0%) | 0 (0.0%) |
| Wholesale Trade | 0 (0.0%) | 4 (100.0%) |
| Retail Trade | 0 (0.0%) | 26 (100.0%) |
| Transportation & Warehousing | 0 (0.0%) | 0 (0.0%) |
| Utilities | 9 (100.0%) | 0 (0.0%) |
| Information | 0 (0.0%) | 2 (100.0%) |
| Finance & Insurance | 9 (100.0%) | 0 (0.0%) |
| Real Estate, Rental & Leasing | 0 (0.0%) | 0 (0.0%) |
| Professional & Scientific | 0 (0.0%) | 0 (0.0%) |
| Enterprise Management | 0 (0.0%) | 0 (0.0%) |
| Administrative & Support | 3 (100.0%) | 0 (0.0%) |
| Educational Services | 0 (0.0%) | 0 (0.0%) |
| Health Care & Social Assistance | 0 (0.0%) | 6 (100.0%) |
| Arts, Entertainment & Recreation | 0 (0.0%) | 10 (100.0%) |
| Accommodation & Food Services | 0 (0.0%) | 0 (0.0%) |
| Public Administration | 9 (69.2%) | 4 (30.8%) |
| Total | 76 (52.4%) | 69 (47.6%) |
Education in Princeton
School Enrollment in Princeton
The most common levels of schooling among the 89 students in Princeton are middle school (38 | 42.7%), high school (21 | 23.6%), and elementary school (15 | 16.9%).
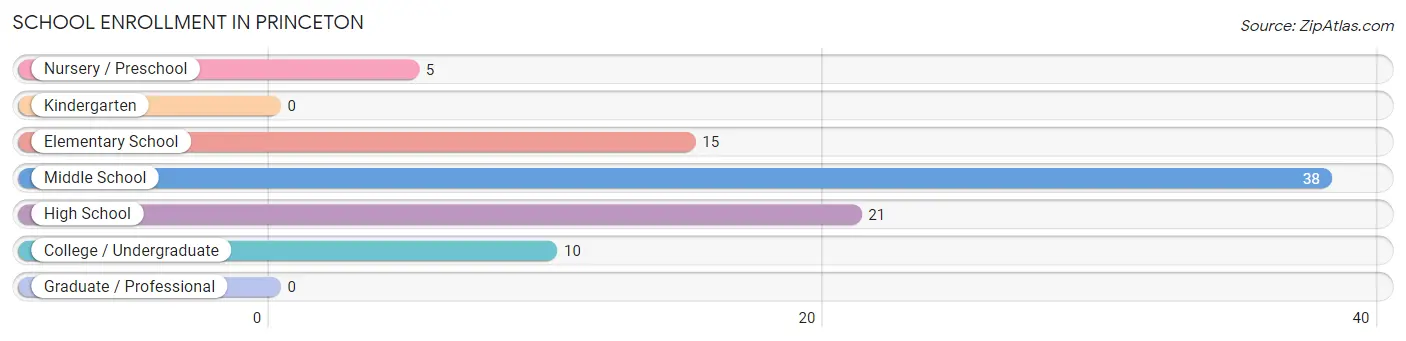
| School Level | # Students | % Students |
| Nursery / Preschool | 5 | 5.6% |
| Kindergarten | 0 | 0.0% |
| Elementary School | 15 | 16.9% |
| Middle School | 38 | 42.7% |
| High School | 21 | 23.6% |
| College / Undergraduate | 10 | 11.2% |
| Graduate / Professional | 0 | 0.0% |
| Total | 89 | 100.0% |
School Enrollment by Age by Funding Source in Princeton
Out of a total of 89 students who are enrolled in schools in Princeton, 15 (16.9%) attend a private institution, while the remaining 74 (83.1%) are enrolled in public schools. The age group of 3 to 4 year olds has the highest likelihood of being enrolled in private schools, with 5 (100.0% in the age bracket) enrolled. Conversely, the age group of 5 to 9 year old has the lowest likelihood of being enrolled in a private school, with 15 (100.0% in the age bracket) attending a public institution.
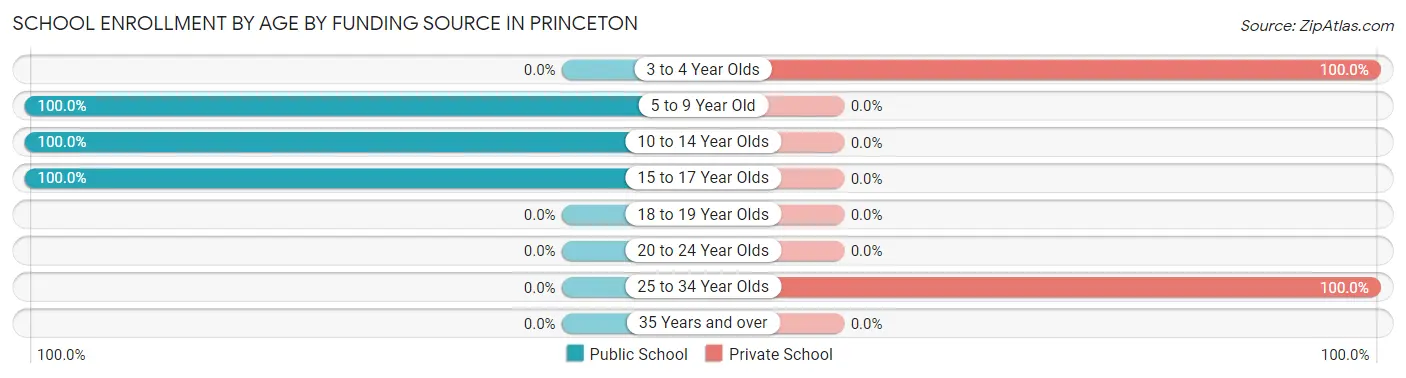
| Age Bracket | Public School | Private School |
| 3 to 4 Year Olds | 0 (0.0%) | 5 (100.0%) |
| 5 to 9 Year Old | 15 (100.0%) | 0 (0.0%) |
| 10 to 14 Year Olds | 56 (100.0%) | 0 (0.0%) |
| 15 to 17 Year Olds | 3 (100.0%) | 0 (0.0%) |
| 18 to 19 Year Olds | 0 (0.0%) | 0 (0.0%) |
| 20 to 24 Year Olds | 0 (0.0%) | 0 (0.0%) |
| 25 to 34 Year Olds | 0 (0.0%) | 10 (100.0%) |
| 35 Years and over | 0 (0.0%) | 0 (0.0%) |
| Total | 74 (83.1%) | 15 (16.9%) |
Educational Attainment by Field of Study in Princeton
Social sciences (4 | 40.0%), science & technology (4 | 40.0%), and education (2 | 20.0%) are the most common fields of study among 10 individuals in Princeton who have obtained a bachelor's degree or higher.
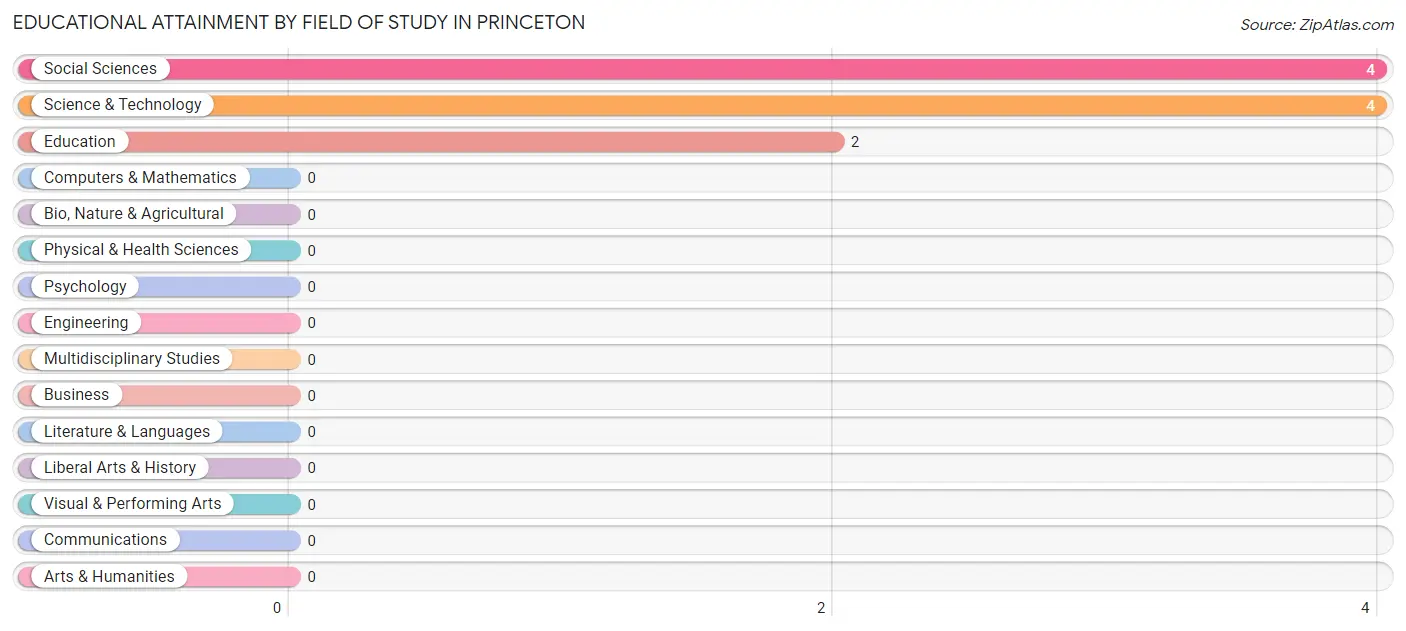
| Field of Study | # Graduates | % Graduates |
| Computers & Mathematics | 0 | 0.0% |
| Bio, Nature & Agricultural | 0 | 0.0% |
| Physical & Health Sciences | 0 | 0.0% |
| Psychology | 0 | 0.0% |
| Social Sciences | 4 | 40.0% |
| Engineering | 0 | 0.0% |
| Multidisciplinary Studies | 0 | 0.0% |
| Science & Technology | 4 | 40.0% |
| Business | 0 | 0.0% |
| Education | 2 | 20.0% |
| Literature & Languages | 0 | 0.0% |
| Liberal Arts & History | 0 | 0.0% |
| Visual & Performing Arts | 0 | 0.0% |
| Communications | 0 | 0.0% |
| Arts & Humanities | 0 | 0.0% |
| Total | 10 | 100.0% |
Transportation & Commute in Princeton
Vehicle Availability by Sex in Princeton
The most prevalent vehicle ownership categories in Princeton are males with 2 vehicles (59, accounting for 77.6%) and females with 2 vehicles (57, making up 85.5%).
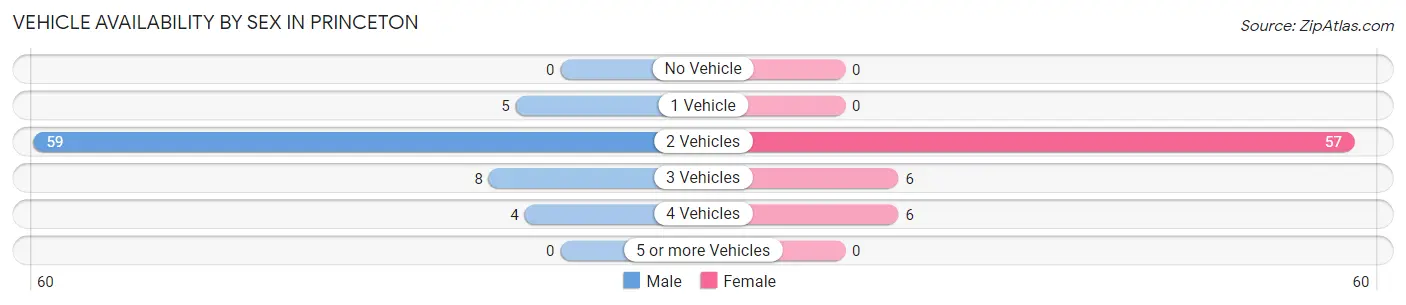
| Vehicles Available | Male | Female |
| No Vehicle | 0 (0.0%) | 0 (0.0%) |
| 1 Vehicle | 5 (6.6%) | 0 (0.0%) |
| 2 Vehicles | 59 (77.6%) | 57 (82.6%) |
| 3 Vehicles | 8 (10.5%) | 6 (8.7%) |
| 4 Vehicles | 4 (5.3%) | 6 (8.7%) |
| 5 or more Vehicles | 0 (0.0%) | 0 (0.0%) |
| Total | 76 (100.0%) | 69 (100.0%) |
Commute Time in Princeton
The most frequently occuring commute durations in Princeton are 30 to 34 minutes (27 commuters, 21.8%), 45 to 59 minutes (25 commuters, 20.2%), and less than 5 minutes (19 commuters, 15.3%).
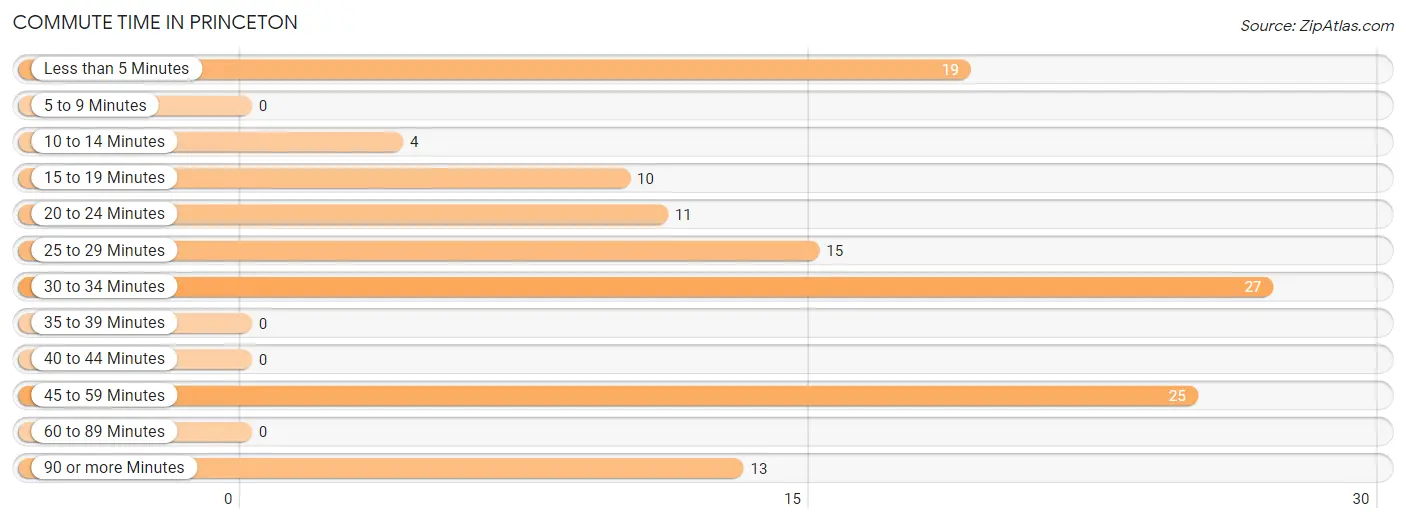
| Commute Time | # Commuters | % Commuters |
| Less than 5 Minutes | 19 | 15.3% |
| 5 to 9 Minutes | 0 | 0.0% |
| 10 to 14 Minutes | 4 | 3.2% |
| 15 to 19 Minutes | 10 | 8.1% |
| 20 to 24 Minutes | 11 | 8.9% |
| 25 to 29 Minutes | 15 | 12.1% |
| 30 to 34 Minutes | 27 | 21.8% |
| 35 to 39 Minutes | 0 | 0.0% |
| 40 to 44 Minutes | 0 | 0.0% |
| 45 to 59 Minutes | 25 | 20.2% |
| 60 to 89 Minutes | 0 | 0.0% |
| 90 or more Minutes | 13 | 10.5% |
Commute Time by Sex in Princeton
The most common commute times in Princeton are 30 to 34 minutes (23 commuters, 30.3%) for males and 45 to 59 minutes (20 commuters, 41.7%) for females.
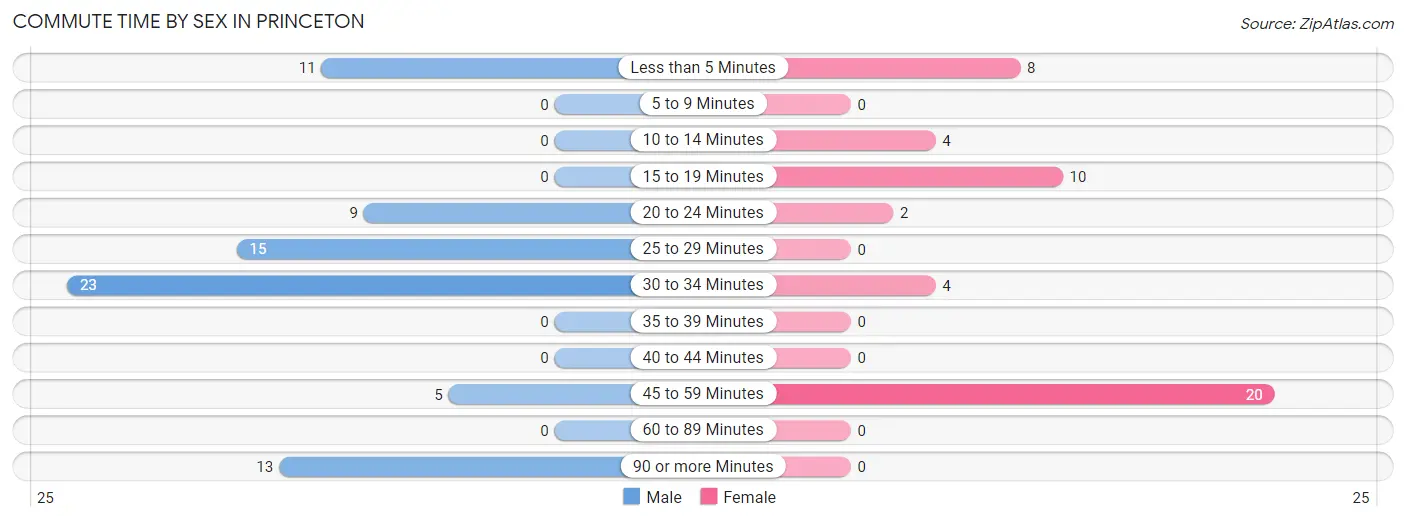
| Commute Time | Male | Female |
| Less than 5 Minutes | 11 (14.5%) | 8 (16.7%) |
| 5 to 9 Minutes | 0 (0.0%) | 0 (0.0%) |
| 10 to 14 Minutes | 0 (0.0%) | 4 (8.3%) |
| 15 to 19 Minutes | 0 (0.0%) | 10 (20.8%) |
| 20 to 24 Minutes | 9 (11.8%) | 2 (4.2%) |
| 25 to 29 Minutes | 15 (19.7%) | 0 (0.0%) |
| 30 to 34 Minutes | 23 (30.3%) | 4 (8.3%) |
| 35 to 39 Minutes | 0 (0.0%) | 0 (0.0%) |
| 40 to 44 Minutes | 0 (0.0%) | 0 (0.0%) |
| 45 to 59 Minutes | 5 (6.6%) | 20 (41.7%) |
| 60 to 89 Minutes | 0 (0.0%) | 0 (0.0%) |
| 90 or more Minutes | 13 (17.1%) | 0 (0.0%) |
Time of Departure to Work by Sex in Princeton
The most frequent times of departure to work in Princeton are 8:00 AM to 8:29 AM (23, 30.3%) for males and 7:30 AM to 7:59 AM (34, 70.8%) for females.
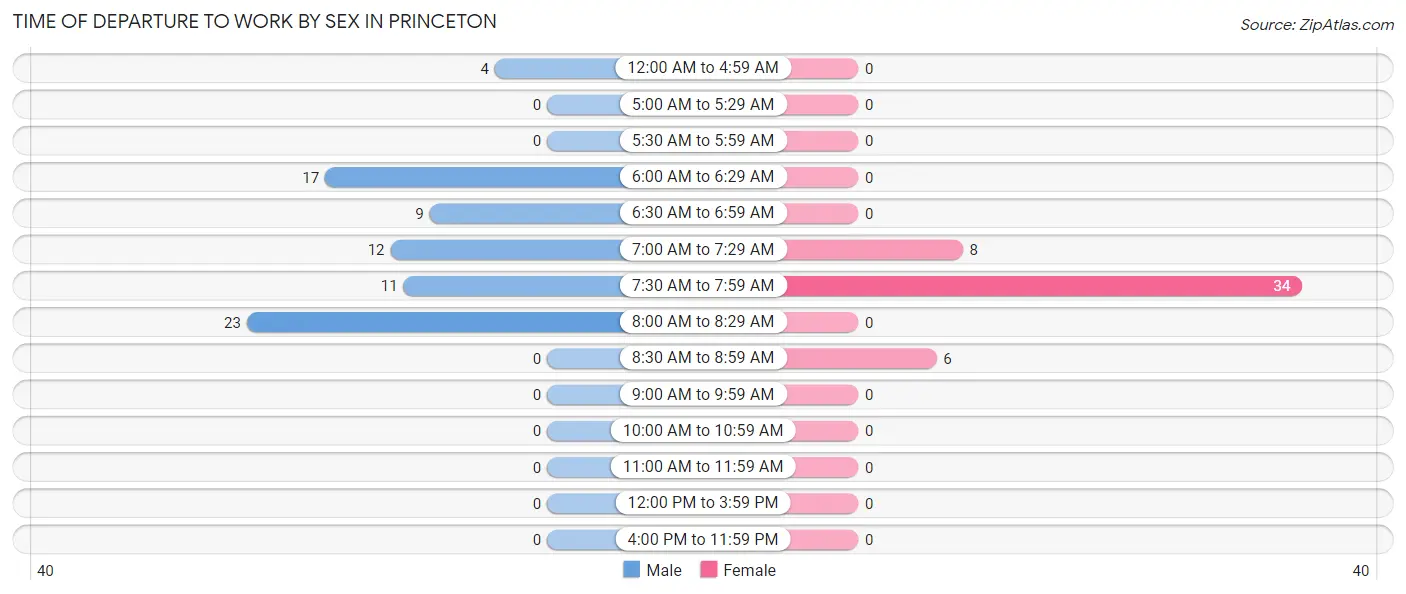
| Time of Departure | Male | Female |
| 12:00 AM to 4:59 AM | 4 (5.3%) | 0 (0.0%) |
| 5:00 AM to 5:29 AM | 0 (0.0%) | 0 (0.0%) |
| 5:30 AM to 5:59 AM | 0 (0.0%) | 0 (0.0%) |
| 6:00 AM to 6:29 AM | 17 (22.4%) | 0 (0.0%) |
| 6:30 AM to 6:59 AM | 9 (11.8%) | 0 (0.0%) |
| 7:00 AM to 7:29 AM | 12 (15.8%) | 8 (16.7%) |
| 7:30 AM to 7:59 AM | 11 (14.5%) | 34 (70.8%) |
| 8:00 AM to 8:29 AM | 23 (30.3%) | 0 (0.0%) |
| 8:30 AM to 8:59 AM | 0 (0.0%) | 6 (12.5%) |
| 9:00 AM to 9:59 AM | 0 (0.0%) | 0 (0.0%) |
| 10:00 AM to 10:59 AM | 0 (0.0%) | 0 (0.0%) |
| 11:00 AM to 11:59 AM | 0 (0.0%) | 0 (0.0%) |
| 12:00 PM to 3:59 PM | 0 (0.0%) | 0 (0.0%) |
| 4:00 PM to 11:59 PM | 0 (0.0%) | 0 (0.0%) |
| Total | 76 (100.0%) | 48 (100.0%) |
Housing Occupancy in Princeton
Occupancy by Ownership in Princeton
Of the total 132 dwellings in Princeton, owner-occupied units account for 89 (67.4%), while renter-occupied units make up 43 (32.6%).
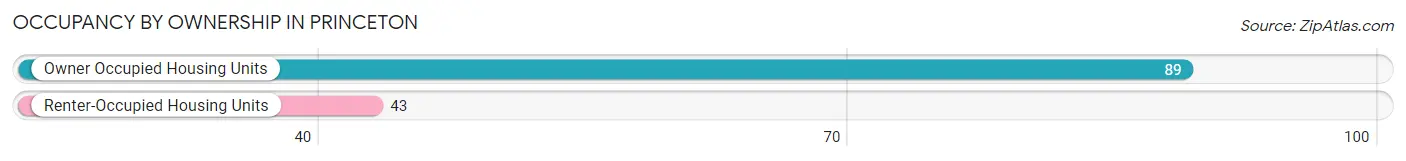
| Occupancy | # Housing Units | % Housing Units |
| Owner Occupied Housing Units | 89 | 67.4% |
| Renter-Occupied Housing Units | 43 | 32.6% |
| Total Occupied Housing Units | 132 | 100.0% |
Occupancy by Household Size in Princeton
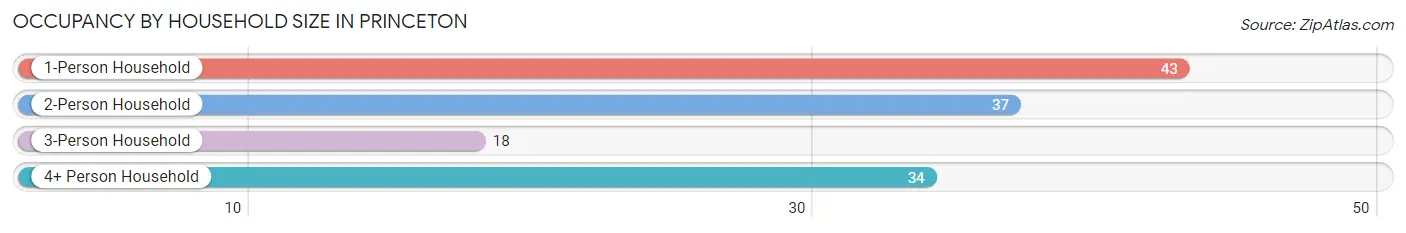
| Household Size | # Housing Units | % Housing Units |
| 1-Person Household | 43 | 32.6% |
| 2-Person Household | 37 | 28.0% |
| 3-Person Household | 18 | 13.6% |
| 4+ Person Household | 34 | 25.8% |
| Total Housing Units | 132 | 100.0% |
Occupancy by Ownership by Household Size in Princeton
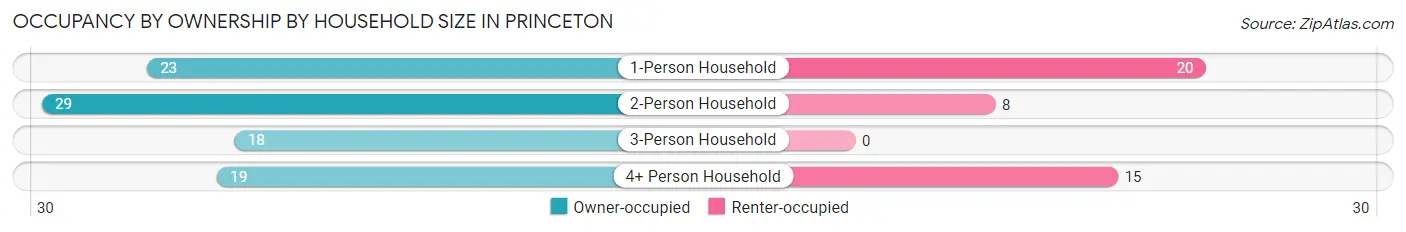
| Household Size | Owner-occupied | Renter-occupied |
| 1-Person Household | 23 (53.5%) | 20 (46.5%) |
| 2-Person Household | 29 (78.4%) | 8 (21.6%) |
| 3-Person Household | 18 (100.0%) | 0 (0.0%) |
| 4+ Person Household | 19 (55.9%) | 15 (44.1%) |
| Total Housing Units | 89 (67.4%) | 43 (32.6%) |
Occupancy by Educational Attainment in Princeton
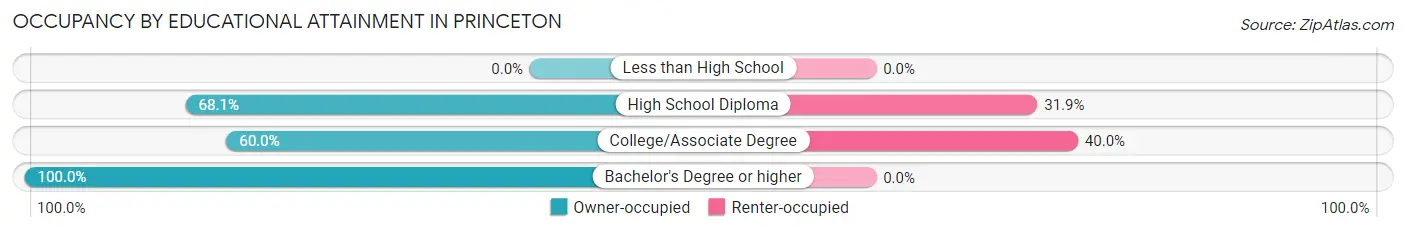
| Household Size | Owner-occupied | Renter-occupied |
| Less than High School | 0 (0.0%) | 0 (0.0%) |
| High School Diploma | 49 (68.1%) | 23 (31.9%) |
| College/Associate Degree | 30 (60.0%) | 20 (40.0%) |
| Bachelor's Degree or higher | 10 (100.0%) | 0 (0.0%) |
Occupancy by Age of Householder in Princeton
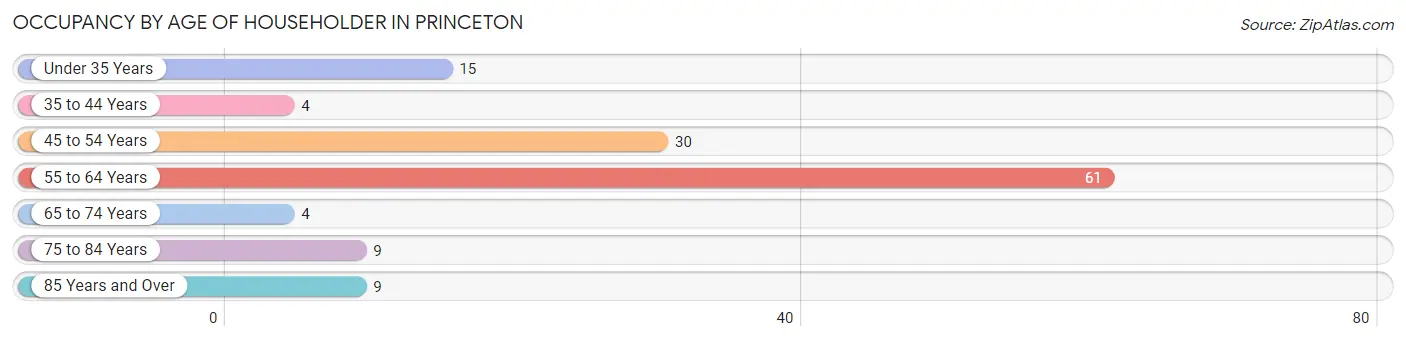
| Age Bracket | # Households | % Households |
| Under 35 Years | 15 | 11.4% |
| 35 to 44 Years | 4 | 3.0% |
| 45 to 54 Years | 30 | 22.7% |
| 55 to 64 Years | 61 | 46.2% |
| 65 to 74 Years | 4 | 3.0% |
| 75 to 84 Years | 9 | 6.8% |
| 85 Years and Over | 9 | 6.8% |
| Total | 132 | 100.0% |
Housing Finances in Princeton
Median Income by Occupancy in Princeton
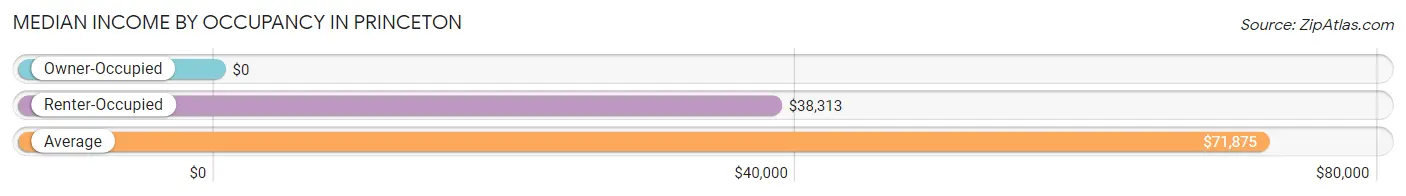
| Occupancy Type | # Households | Median Income |
| Owner-Occupied | 89 (67.4%) | $0 |
| Renter-Occupied | 43 (32.6%) | $38,313 |
| Average | 132 (100.0%) | $71,875 |
Occupancy by Householder Income Bracket in Princeton
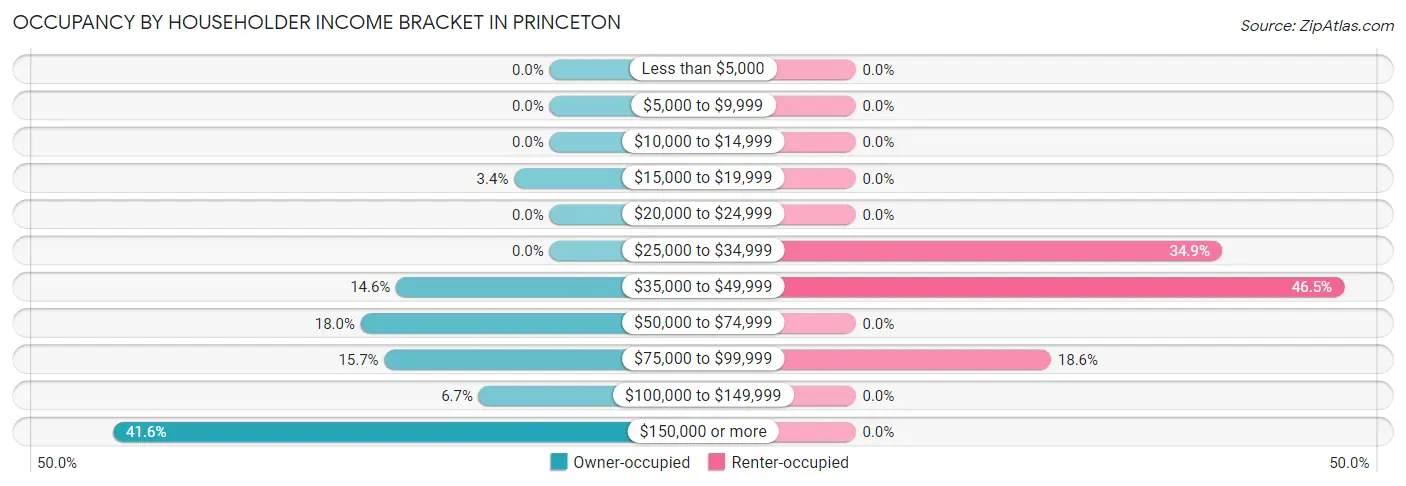
| Income Bracket | Owner-occupied | Renter-occupied |
| Less than $5,000 | 0 (0.0%) | 0 (0.0%) |
| $5,000 to $9,999 | 0 (0.0%) | 0 (0.0%) |
| $10,000 to $14,999 | 0 (0.0%) | 0 (0.0%) |
| $15,000 to $19,999 | 3 (3.4%) | 0 (0.0%) |
| $20,000 to $24,999 | 0 (0.0%) | 0 (0.0%) |
| $25,000 to $34,999 | 0 (0.0%) | 15 (34.9%) |
| $35,000 to $49,999 | 13 (14.6%) | 20 (46.5%) |
| $50,000 to $74,999 | 16 (18.0%) | 0 (0.0%) |
| $75,000 to $99,999 | 14 (15.7%) | 8 (18.6%) |
| $100,000 to $149,999 | 6 (6.7%) | 0 (0.0%) |
| $150,000 or more | 37 (41.6%) | 0 (0.0%) |
| Total | 89 (100.0%) | 43 (100.0%) |
Monthly Housing Cost Tiers in Princeton
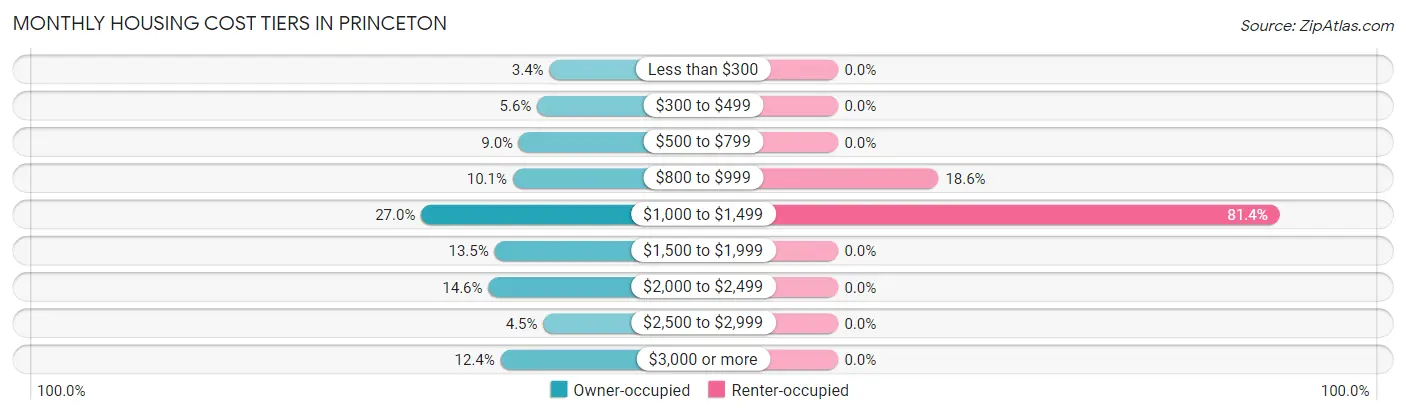
| Monthly Cost | Owner-occupied | Renter-occupied |
| Less than $300 | 3 (3.4%) | 0 (0.0%) |
| $300 to $499 | 5 (5.6%) | 0 (0.0%) |
| $500 to $799 | 8 (9.0%) | 0 (0.0%) |
| $800 to $999 | 9 (10.1%) | 8 (18.6%) |
| $1,000 to $1,499 | 24 (27.0%) | 35 (81.4%) |
| $1,500 to $1,999 | 12 (13.5%) | 0 (0.0%) |
| $2,000 to $2,499 | 13 (14.6%) | 0 (0.0%) |
| $2,500 to $2,999 | 4 (4.5%) | 0 (0.0%) |
| $3,000 or more | 11 (12.4%) | 0 (0.0%) |
| Total | 89 (100.0%) | 43 (100.0%) |
Physical Housing Characteristics in Princeton
Housing Structures in Princeton
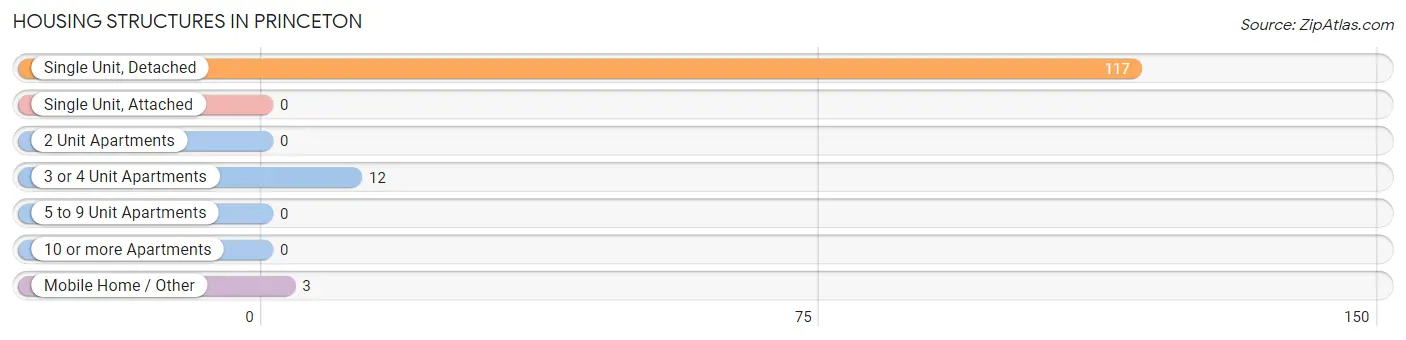
| Structure Type | # Housing Units | % Housing Units |
| Single Unit, Detached | 117 | 88.6% |
| Single Unit, Attached | 0 | 0.0% |
| 2 Unit Apartments | 0 | 0.0% |
| 3 or 4 Unit Apartments | 12 | 9.1% |
| 5 to 9 Unit Apartments | 0 | 0.0% |
| 10 or more Apartments | 0 | 0.0% |
| Mobile Home / Other | 3 | 2.3% |
| Total | 132 | 100.0% |
Housing Structures by Occupancy in Princeton
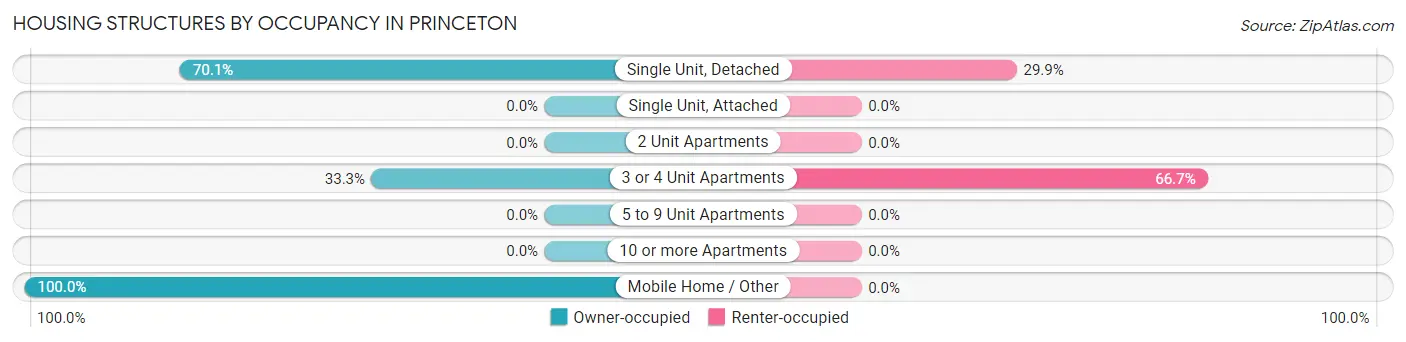
| Structure Type | Owner-occupied | Renter-occupied |
| Single Unit, Detached | 82 (70.1%) | 35 (29.9%) |
| Single Unit, Attached | 0 (0.0%) | 0 (0.0%) |
| 2 Unit Apartments | 0 (0.0%) | 0 (0.0%) |
| 3 or 4 Unit Apartments | 4 (33.3%) | 8 (66.7%) |
| 5 to 9 Unit Apartments | 0 (0.0%) | 0 (0.0%) |
| 10 or more Apartments | 0 (0.0%) | 0 (0.0%) |
| Mobile Home / Other | 3 (100.0%) | 0 (0.0%) |
| Total | 89 (67.4%) | 43 (32.6%) |
Housing Structures by Number of Rooms in Princeton
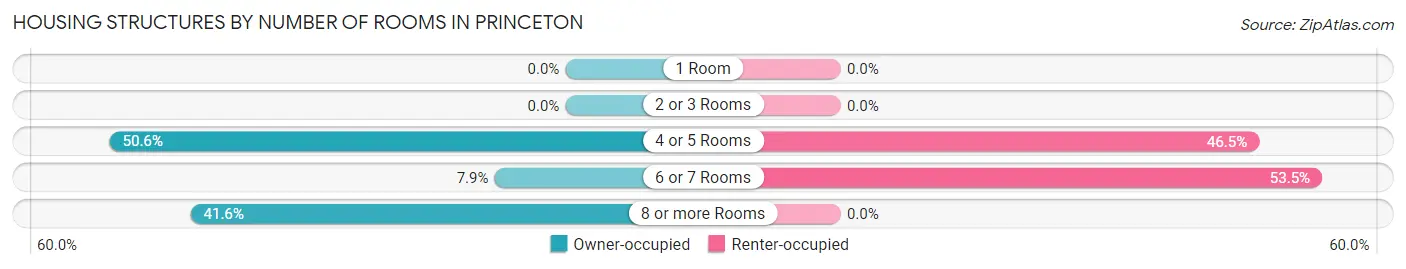
| Number of Rooms | Owner-occupied | Renter-occupied |
| 1 Room | 0 (0.0%) | 0 (0.0%) |
| 2 or 3 Rooms | 0 (0.0%) | 0 (0.0%) |
| 4 or 5 Rooms | 45 (50.6%) | 20 (46.5%) |
| 6 or 7 Rooms | 7 (7.9%) | 23 (53.5%) |
| 8 or more Rooms | 37 (41.6%) | 0 (0.0%) |
| Total | 89 (100.0%) | 43 (100.0%) |
Housing Structure by Heating Type in Princeton
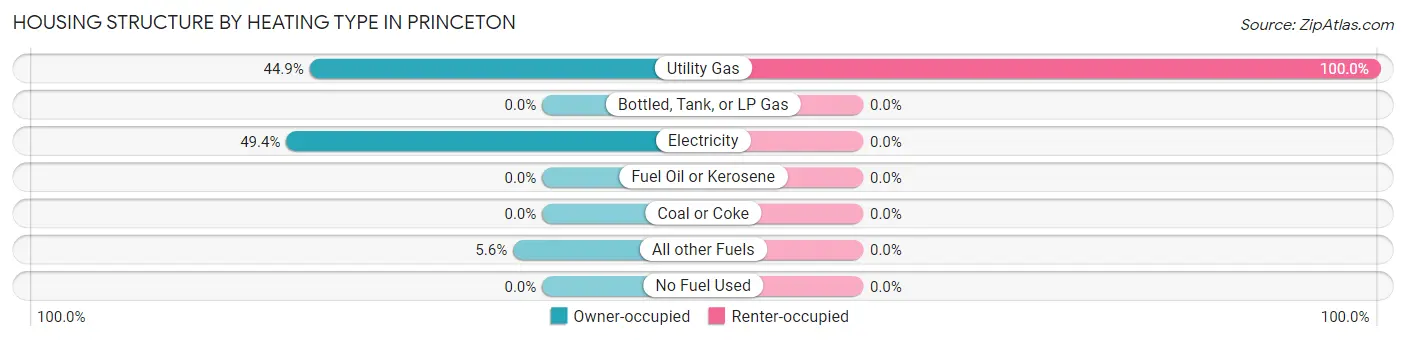
| Heating Type | Owner-occupied | Renter-occupied |
| Utility Gas | 40 (44.9%) | 43 (100.0%) |
| Bottled, Tank, or LP Gas | 0 (0.0%) | 0 (0.0%) |
| Electricity | 44 (49.4%) | 0 (0.0%) |
| Fuel Oil or Kerosene | 0 (0.0%) | 0 (0.0%) |
| Coal or Coke | 0 (0.0%) | 0 (0.0%) |
| All other Fuels | 5 (5.6%) | 0 (0.0%) |
| No Fuel Used | 0 (0.0%) | 0 (0.0%) |
| Total | 89 (100.0%) | 43 (100.0%) |
Household Vehicle Usage in Princeton
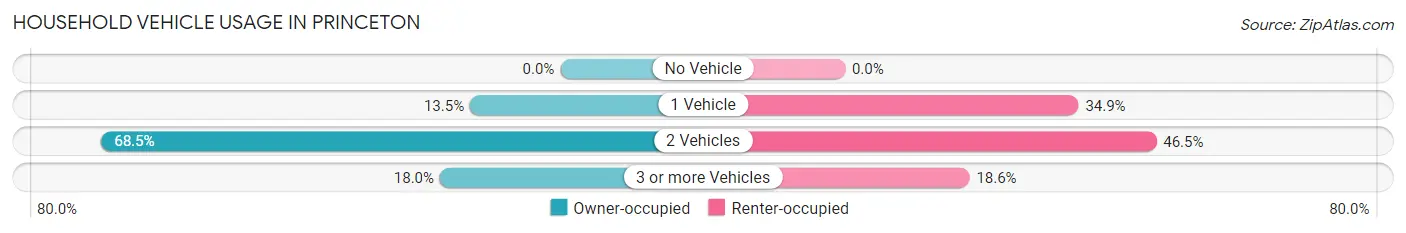
| Vehicles per Household | Owner-occupied | Renter-occupied |
| No Vehicle | 0 (0.0%) | 0 (0.0%) |
| 1 Vehicle | 12 (13.5%) | 15 (34.9%) |
| 2 Vehicles | 61 (68.5%) | 20 (46.5%) |
| 3 or more Vehicles | 16 (18.0%) | 8 (18.6%) |
| Total | 89 (100.0%) | 43 (100.0%) |
Real Estate & Mortgages in Princeton
Real Estate and Mortgage Overview in Princeton
| Characteristic | Without Mortgage | With Mortgage |
| Housing Units | 35 | 54 |
| Median Property Value | $519,700 | $386,700 |
| Median Household Income | $173,015 | $16 |
| Monthly Housing Costs | $1,109 | $11 |
| Real Estate Taxes | - | - |
Property Value by Mortgage Status in Princeton
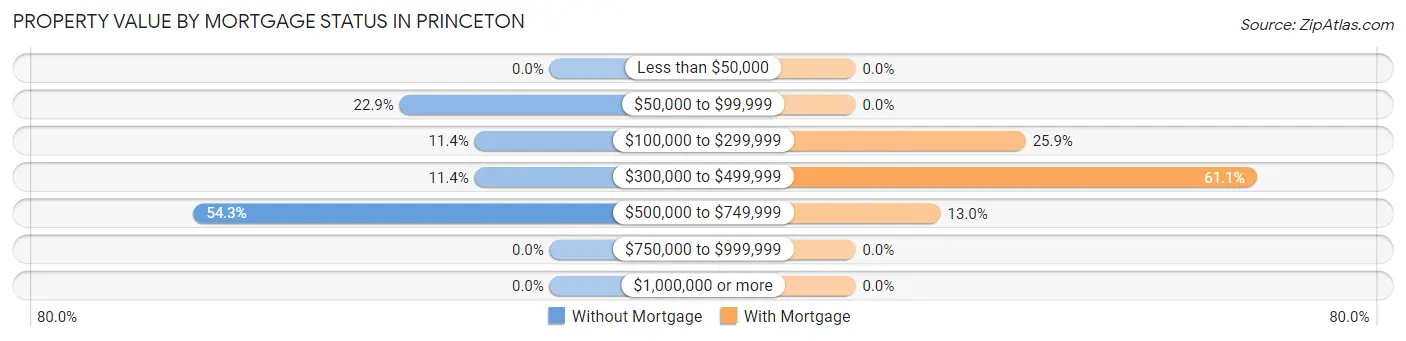
| Property Value | Without Mortgage | With Mortgage |
| Less than $50,000 | 0 (0.0%) | 0 (0.0%) |
| $50,000 to $99,999 | 8 (22.9%) | 0 (0.0%) |
| $100,000 to $299,999 | 4 (11.4%) | 14 (25.9%) |
| $300,000 to $499,999 | 4 (11.4%) | 33 (61.1%) |
| $500,000 to $749,999 | 19 (54.3%) | 7 (13.0%) |
| $750,000 to $999,999 | 0 (0.0%) | 0 (0.0%) |
| $1,000,000 or more | 0 (0.0%) | 0 (0.0%) |
| Total | 35 (100.0%) | 54 (100.0%) |
Household Income by Mortgage Status in Princeton
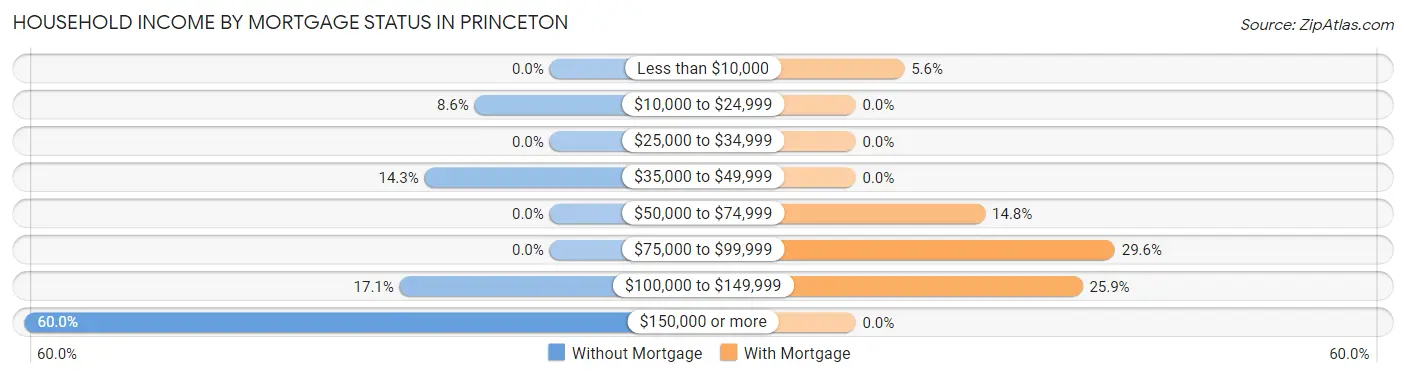
| Household Income | Without Mortgage | With Mortgage |
| Less than $10,000 | 0 (0.0%) | 3 (5.6%) |
| $10,000 to $24,999 | 3 (8.6%) | 0 (0.0%) |
| $25,000 to $34,999 | 0 (0.0%) | 0 (0.0%) |
| $35,000 to $49,999 | 5 (14.3%) | 0 (0.0%) |
| $50,000 to $74,999 | 0 (0.0%) | 8 (14.8%) |
| $75,000 to $99,999 | 0 (0.0%) | 16 (29.6%) |
| $100,000 to $149,999 | 6 (17.1%) | 14 (25.9%) |
| $150,000 or more | 21 (60.0%) | 0 (0.0%) |
| Total | 35 (100.0%) | 54 (100.0%) |
Property Value to Household Income Ratio in Princeton
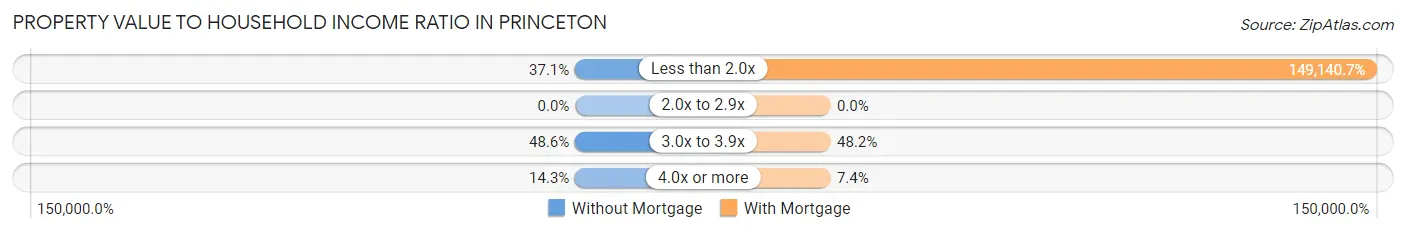
| Value-to-Income Ratio | Without Mortgage | With Mortgage |
| Less than 2.0x | 13 (37.1%) | 80,536 (149,140.7%) |
| 2.0x to 2.9x | 0 (0.0%) | 0 (0.0%) |
| 3.0x to 3.9x | 17 (48.6%) | 26 (48.1%) |
| 4.0x or more | 5 (14.3%) | 4 (7.4%) |
| Total | 35 (100.0%) | 54 (100.0%) |
Real Estate Taxes by Mortgage Status in Princeton
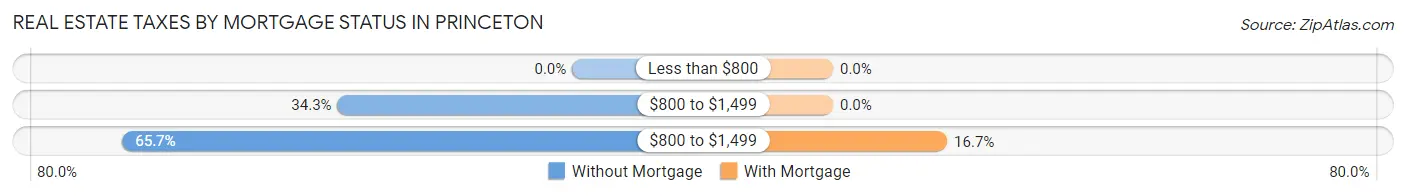
| Property Taxes | Without Mortgage | With Mortgage |
| Less than $800 | 0 (0.0%) | 0 (0.0%) |
| $800 to $1,499 | 12 (34.3%) | 0 (0.0%) |
| $800 to $1,499 | 23 (65.7%) | 9 (16.7%) |
| Total | 35 (100.0%) | 54 (100.0%) |
Health & Disability in Princeton
Health Insurance Coverage by Age in Princeton
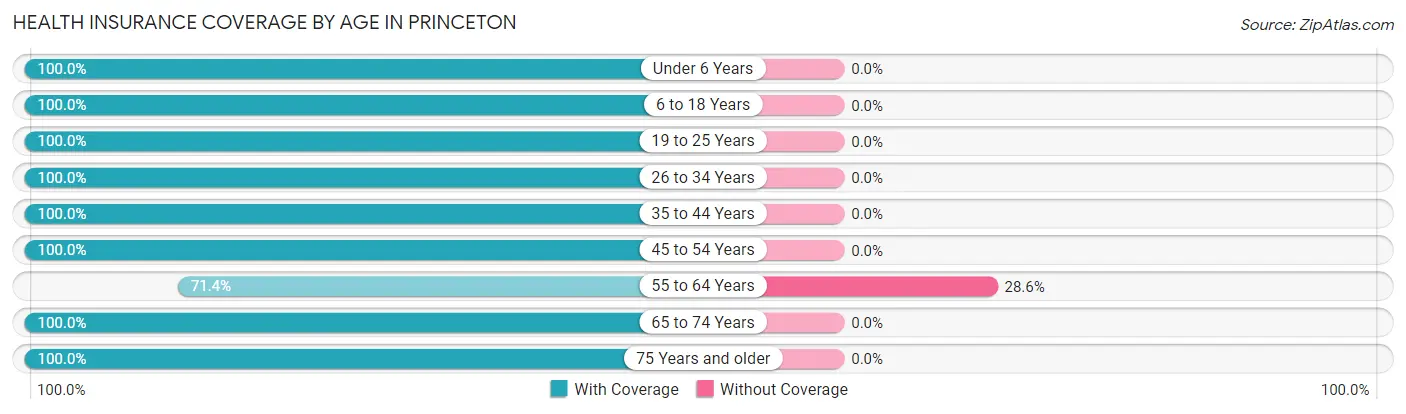
| Age Bracket | With Coverage | Without Coverage |
| Under 6 Years | 50 (100.0%) | 0 (0.0%) |
| 6 to 18 Years | 74 (100.0%) | 0 (0.0%) |
| 19 to 25 Years | 37 (100.0%) | 0 (0.0%) |
| 26 to 34 Years | 14 (100.0%) | 0 (0.0%) |
| 35 to 44 Years | 7 (100.0%) | 0 (0.0%) |
| 45 to 54 Years | 66 (100.0%) | 0 (0.0%) |
| 55 to 64 Years | 50 (71.4%) | 20 (28.6%) |
| 65 to 74 Years | 16 (100.0%) | 0 (0.0%) |
| 75 Years and older | 23 (100.0%) | 0 (0.0%) |
| Total | 337 (94.4%) | 20 (5.6%) |
Health Insurance Coverage by Citizenship Status in Princeton
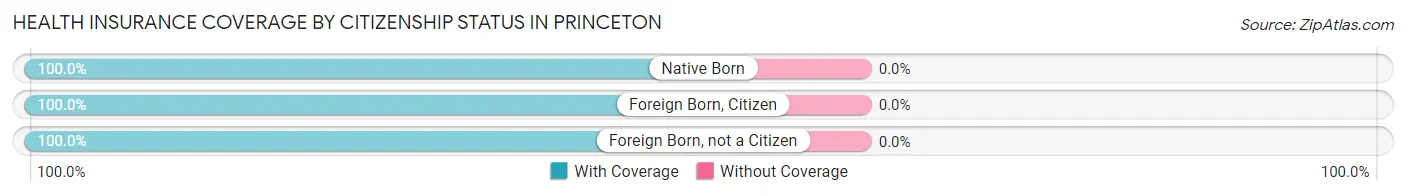
| Citizenship Status | With Coverage | Without Coverage |
| Native Born | 50 (100.0%) | 0 (0.0%) |
| Foreign Born, Citizen | 74 (100.0%) | 0 (0.0%) |
| Foreign Born, not a Citizen | 37 (100.0%) | 0 (0.0%) |
Health Insurance Coverage by Household Income in Princeton
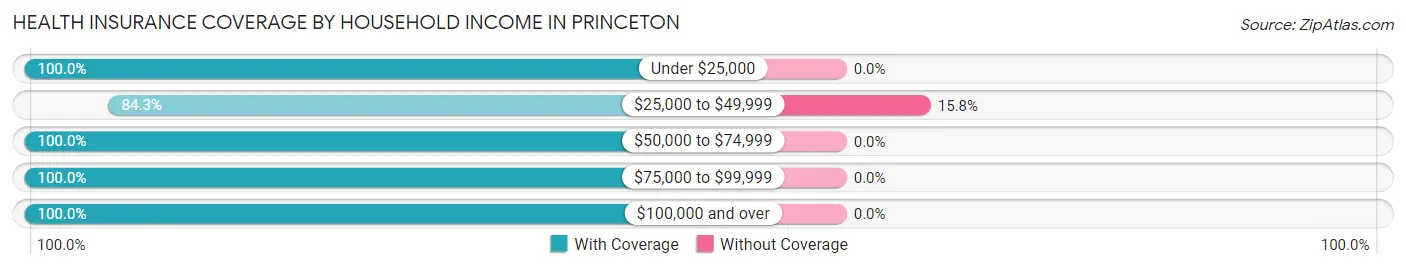
| Household Income | With Coverage | Without Coverage |
| Under $25,000 | 3 (100.0%) | 0 (0.0%) |
| $25,000 to $49,999 | 107 (84.3%) | 20 (15.8%) |
| $50,000 to $74,999 | 22 (100.0%) | 0 (0.0%) |
| $75,000 to $99,999 | 95 (100.0%) | 0 (0.0%) |
| $100,000 and over | 110 (100.0%) | 0 (0.0%) |
Public vs Private Health Insurance Coverage by Age in Princeton
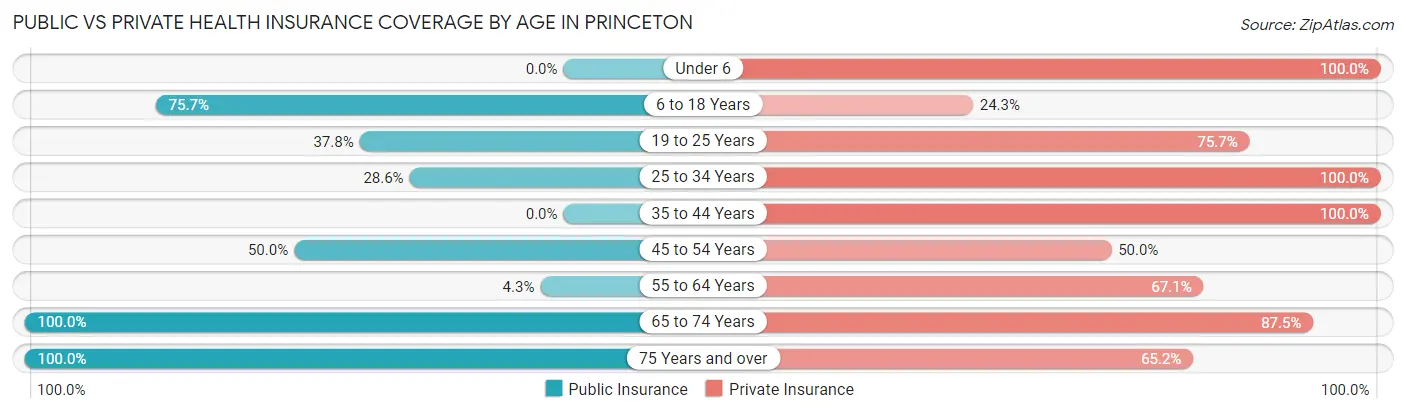
| Age Bracket | Public Insurance | Private Insurance |
| Under 6 | 0 (0.0%) | 50 (100.0%) |
| 6 to 18 Years | 56 (75.7%) | 18 (24.3%) |
| 19 to 25 Years | 14 (37.8%) | 28 (75.7%) |
| 25 to 34 Years | 4 (28.6%) | 14 (100.0%) |
| 35 to 44 Years | 0 (0.0%) | 7 (100.0%) |
| 45 to 54 Years | 33 (50.0%) | 33 (50.0%) |
| 55 to 64 Years | 3 (4.3%) | 47 (67.1%) |
| 65 to 74 Years | 16 (100.0%) | 14 (87.5%) |
| 75 Years and over | 23 (100.0%) | 15 (65.2%) |
| Total | 149 (41.7%) | 226 (63.3%) |
Disability Status by Sex by Age in Princeton
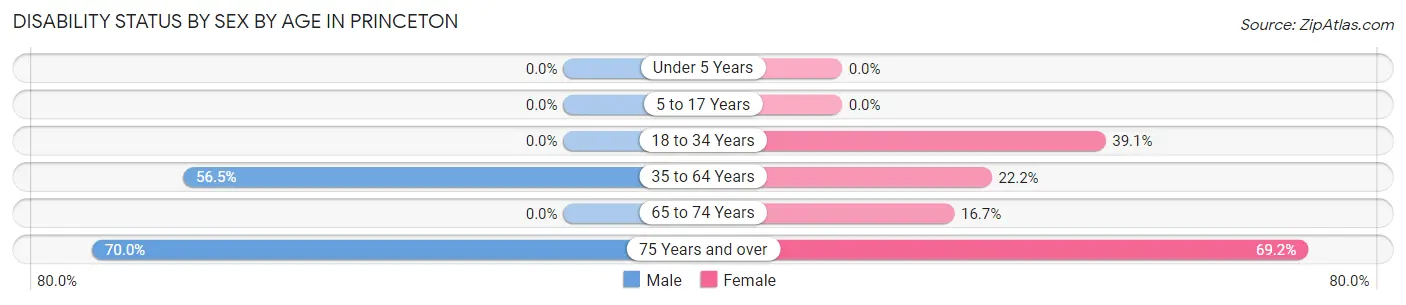
| Age Bracket | Male | Female |
| Under 5 Years | 0 (0.0%) | 0 (0.0%) |
| 5 to 17 Years | 0 (0.0%) | 0 (0.0%) |
| 18 to 34 Years | 0 (0.0%) | 9 (39.1%) |
| 35 to 64 Years | 35 (56.5%) | 18 (22.2%) |
| 65 to 74 Years | 0 (0.0%) | 2 (16.7%) |
| 75 Years and over | 7 (70.0%) | 9 (69.2%) |
Disability Class by Sex by Age in Princeton
Disability Class: Hearing Difficulty
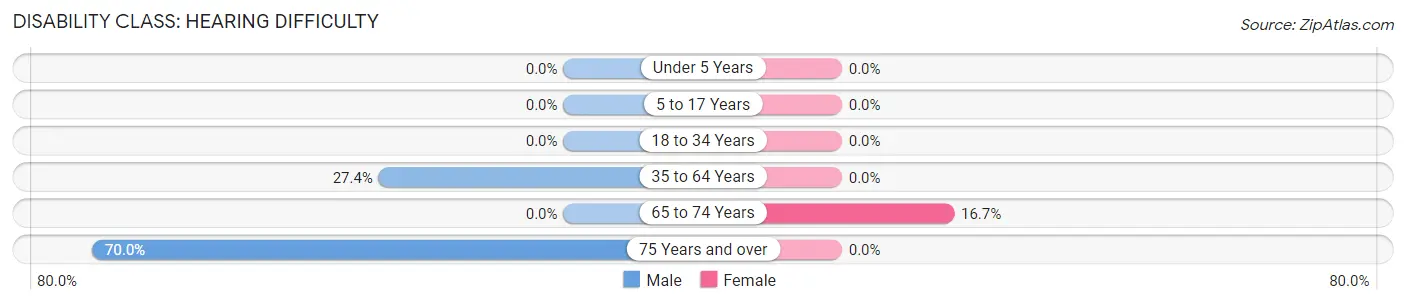
| Age Bracket | Male | Female |
| Under 5 Years | 0 (0.0%) | 0 (0.0%) |
| 5 to 17 Years | 0 (0.0%) | 0 (0.0%) |
| 18 to 34 Years | 0 (0.0%) | 0 (0.0%) |
| 35 to 64 Years | 17 (27.4%) | 0 (0.0%) |
| 65 to 74 Years | 0 (0.0%) | 2 (16.7%) |
| 75 Years and over | 7 (70.0%) | 0 (0.0%) |
Disability Class: Vision Difficulty
| Age Bracket | Male | Female |
| Under 5 Years | 0 (0.0%) | 0 (0.0%) |
| 5 to 17 Years | 0 (0.0%) | 0 (0.0%) |
| 18 to 34 Years | 0 (0.0%) | 0 (0.0%) |
| 35 to 64 Years | 0 (0.0%) | 0 (0.0%) |
| 65 to 74 Years | 0 (0.0%) | 0 (0.0%) |
| 75 Years and over | 0 (0.0%) | 0 (0.0%) |
Disability Class: Cognitive Difficulty
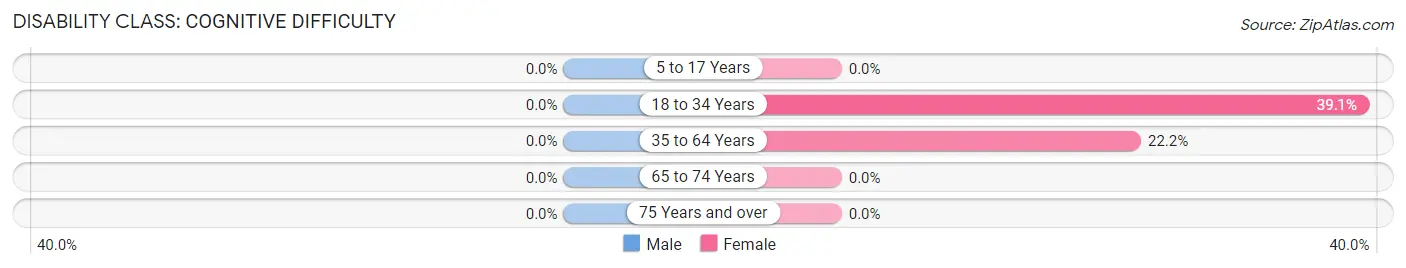
| Age Bracket | Male | Female |
| 5 to 17 Years | 0 (0.0%) | 0 (0.0%) |
| 18 to 34 Years | 0 (0.0%) | 9 (39.1%) |
| 35 to 64 Years | 0 (0.0%) | 18 (22.2%) |
| 65 to 74 Years | 0 (0.0%) | 0 (0.0%) |
| 75 Years and over | 0 (0.0%) | 0 (0.0%) |
Disability Class: Ambulatory Difficulty
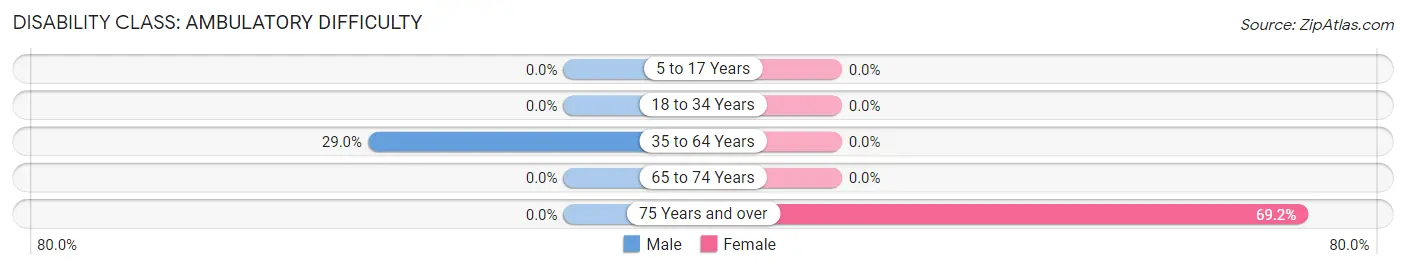
| Age Bracket | Male | Female |
| 5 to 17 Years | 0 (0.0%) | 0 (0.0%) |
| 18 to 34 Years | 0 (0.0%) | 0 (0.0%) |
| 35 to 64 Years | 18 (29.0%) | 0 (0.0%) |
| 65 to 74 Years | 0 (0.0%) | 0 (0.0%) |
| 75 Years and over | 0 (0.0%) | 9 (69.2%) |
Disability Class: Self-Care Difficulty
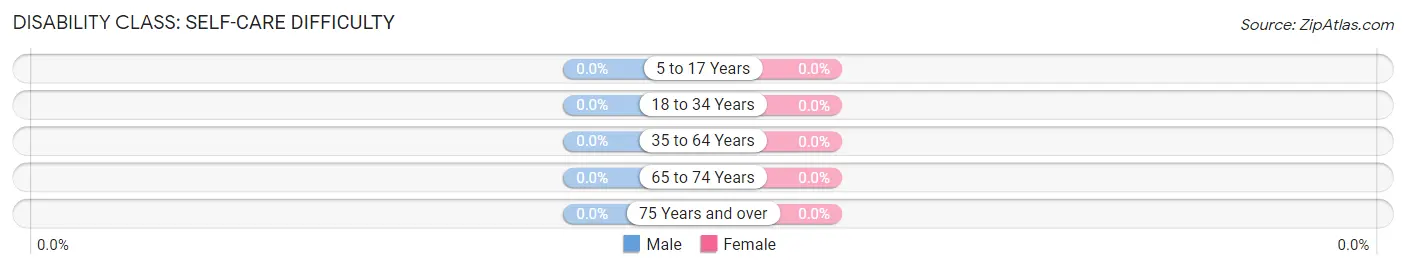
| Age Bracket | Male | Female |
| 5 to 17 Years | 0 (0.0%) | 0 (0.0%) |
| 18 to 34 Years | 0 (0.0%) | 0 (0.0%) |
| 35 to 64 Years | 0 (0.0%) | 0 (0.0%) |
| 65 to 74 Years | 0 (0.0%) | 0 (0.0%) |
| 75 Years and over | 0 (0.0%) | 0 (0.0%) |
Technology Access in Princeton
Computing Device Access in Princeton
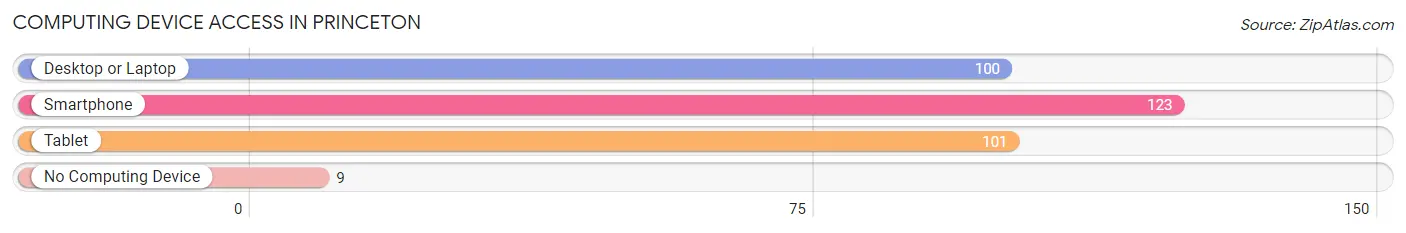
| Device Type | # Households | % Households |
| Desktop or Laptop | 100 | 75.8% |
| Smartphone | 123 | 93.2% |
| Tablet | 101 | 76.5% |
| No Computing Device | 9 | 6.8% |
| Total | 132 | 100.0% |
Internet Access in Princeton
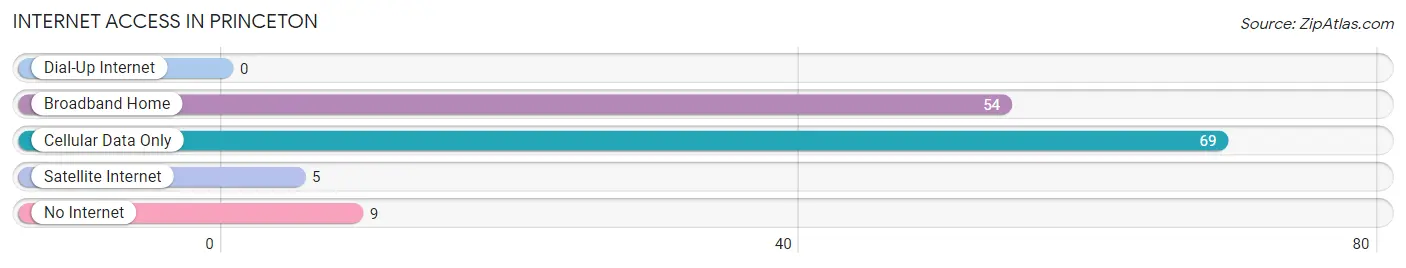
| Internet Type | # Households | % Households |
| Dial-Up Internet | 0 | 0.0% |
| Broadband Home | 54 | 40.9% |
| Cellular Data Only | 69 | 52.3% |
| Satellite Internet | 5 | 3.8% |
| No Internet | 9 | 6.8% |
| Total | 132 | 100.0% |
Princeton Summary
Princeton, California is a small unincorporated community located in the foothills of the Sierra Nevada Mountains in the western part of the state. It is situated in the Sierra Valley, which is part of the Sacramento Valley. The town is located in Sierra County, which is the second least populous county in California. The population of Princeton was estimated to be around 1,000 in 2020.
History
The area that is now Princeton was originally inhabited by the Maidu and Washoe Native American tribes. The first European settlers arrived in the area in the mid-1800s, and the town was officially founded in 1864. The town was named after Princeton University in New Jersey, and the first post office was established in 1867.
The town was initially a mining town, and the main industry was gold mining. The town also had a few other industries, such as logging and ranching. The town was also a popular stop for travelers on the stagecoach route between Reno and Sacramento.
In the early 1900s, the town began to decline as the gold mines were depleted and the stagecoach route was replaced by the railroad. The town was nearly abandoned by the 1940s, but it was revived in the 1950s when the area became a popular destination for tourists.
Geography
Princeton is located in the Sierra Valley, which is part of the Sacramento Valley. The town is situated at an elevation of 2,845 feet (867 m). The town is surrounded by the Sierra Nevada Mountains to the east and the Cascade Range to the west. The town is located about 50 miles (80 km) northeast of Sacramento and about 100 miles (160 km) northwest of Reno.
The climate in Princeton is semi-arid, with hot summers and cold winters. The average annual temperature is around 55°F (13°C). The average annual precipitation is around 20 inches (51 cm).
Economy
The economy of Princeton is largely based on tourism. The town is a popular destination for outdoor activities such as camping, fishing, hunting, and hiking. The town is also home to several wineries and vineyards.
The town also has a few small businesses, such as restaurants, cafes, and shops. The town is also home to a few small manufacturing companies.
Demographics
The population of Princeton was estimated to be around 1,000 in 2020. The town is predominantly white, with around 90% of the population being white. The median household income is around $50,000. The median age is around 40 years old.
Common Questions
What is Per Capita Income in Princeton?
Per Capita income in Princeton is $32,332.
What is the Median Family Income in Princeton?
Median Family Income in Princeton is $98,906.
What is the Median Household income in Princeton?
Median Household Income in Princeton is $71,875.
What is Inequality or Gini Index in Princeton?
Inequality or Gini Index in Princeton is 0.36.
What is the Total Population of Princeton?
Total Population of Princeton is 357.
What is the Total Male Population of Princeton?
Total Male Population of Princeton is 178.
What is the Total Female Population of Princeton?
Total Female Population of Princeton is 179.
What is the Ratio of Males per 100 Females in Princeton?
There are 99.44 Males per 100 Females in Princeton.
What is the Ratio of Females per 100 Males in Princeton?
There are 100.56 Females per 100 Males in Princeton.
What is the Median Population Age in Princeton?
Median Population Age in Princeton is 39.9 Years.
What is the Average Family Size in Princeton
Average Family Size in Princeton is 3.5 People.
What is the Average Household Size in Princeton
Average Household Size in Princeton is 2.7 People.
How Large is the Labor Force in Princeton?
There are 145 People in the Labor Forcein in Princeton.
What is the Percentage of People in the Labor Force in Princeton?
61.4% of People are in the Labor Force in Princeton.