Natoma, KS Map & Demographics
Natoma Map
Natoma Overview
$26,759
PER CAPITA INCOME
$68,092
AVG FAMILY INCOME
$54,167
AVG HOUSEHOLD INCOME
52.7%
WAGE / INCOME GAP [ % ]
47.3¢/ $1
WAGE / INCOME GAP [ $ ]
0.38
INEQUALITY / GINI INDEX
400
TOTAL POPULATION
211
MALE POPULATION
189
FEMALE POPULATION
111.64
MALES / 100 FEMALES
89.57
FEMALES / 100 MALES
37.3
MEDIAN AGE
2.7
AVG FAMILY SIZE
2.2
AVG HOUSEHOLD SIZE
168
LABOR FORCE [ PEOPLE ]
60.6%
PERCENT IN LABOR FORCE
1.8%
UNEMPLOYMENT RATE
Natoma Zip Codes
Natoma Area Codes
Income in Natoma
Income Overview in Natoma
Per Capita Income in Natoma is $26,759, while median incomes of families and households are $68,092 and $54,167 respectively.
| Characteristic | Number | Measure |
| Per Capita Income | 400 | $26,759 |
| Median Family Income | 129 | $68,092 |
| Mean Family Income | 129 | $77,442 |
| Median Household Income | 180 | $54,167 |
| Mean Household Income | 180 | $66,561 |
| Income Deficit | 129 | $0 |
| Wage / Income Gap (%) | 400 | 52.70% |
| Wage / Income Gap ($) | 400 | 47.30¢ per $1 |
| Gini / Inequality Index | 400 | 0.38 |
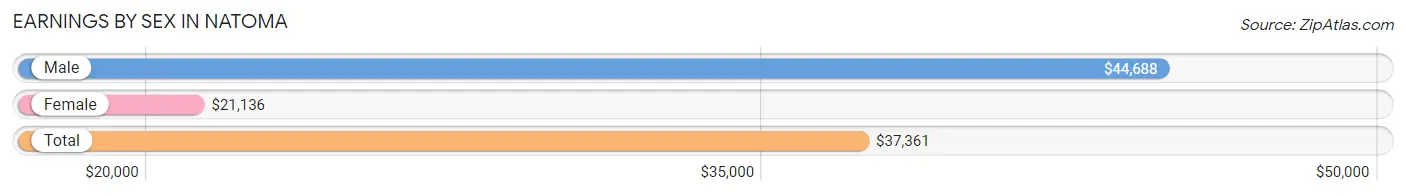
Earnings by Sex in Natoma
Average Earnings in Natoma are $37,361, $44,688 for men and $21,136 for women, a difference of 52.7%.
| Sex | Number | Average Earnings |
| Male | 95 (49.7%) | $44,688 |
| Female | 96 (50.3%) | $21,136 |
| Total | 191 (100.0%) | $37,361 |
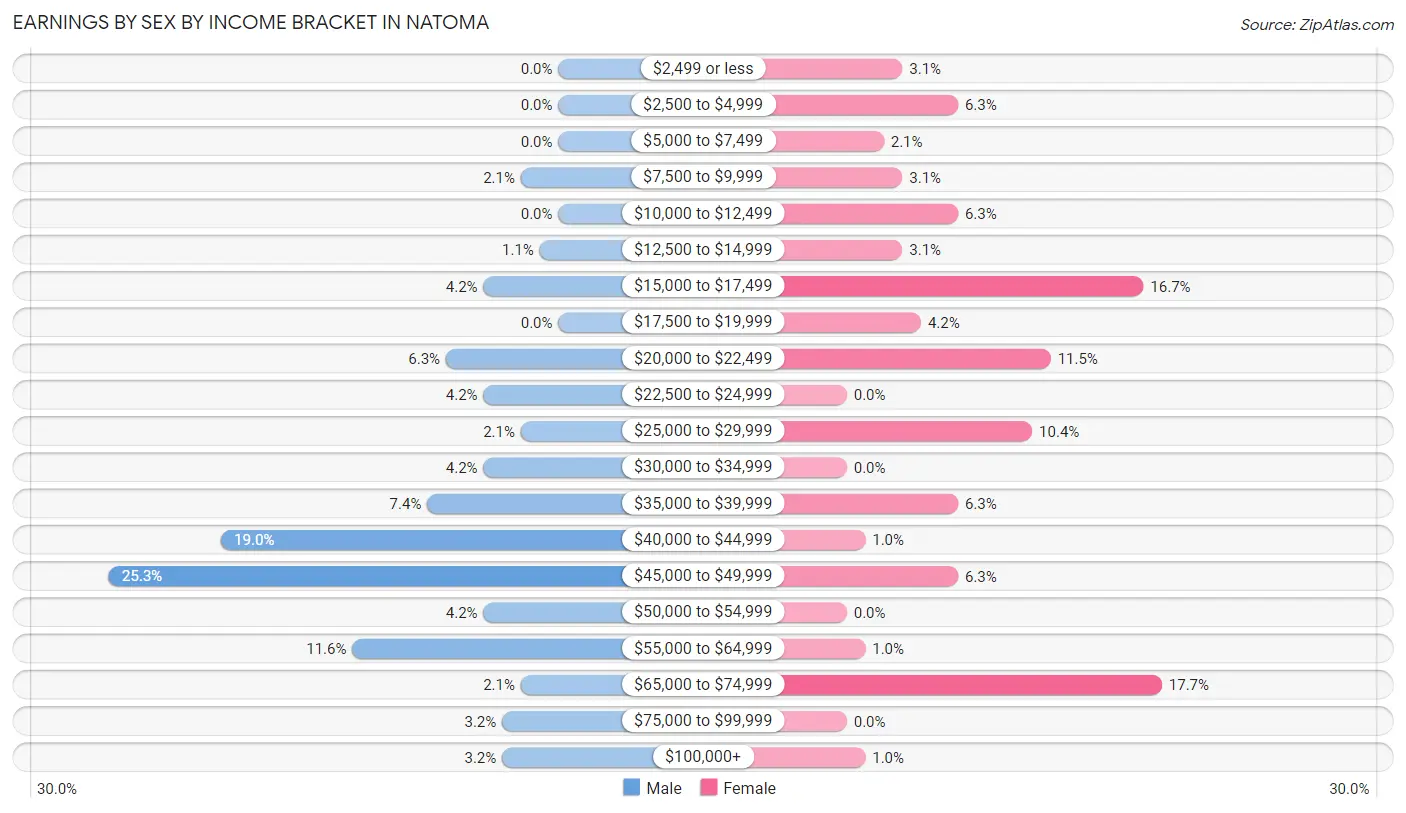
Earnings by Sex by Income Bracket in Natoma
The most common earnings brackets in Natoma are $45,000 to $49,999 for men (24 | 25.3%) and $65,000 to $74,999 for women (17 | 17.7%).
| Income | Male | Female |
| $2,499 or less | 0 (0.0%) | 3 (3.1%) |
| $2,500 to $4,999 | 0 (0.0%) | 6 (6.2%) |
| $5,000 to $7,499 | 0 (0.0%) | 2 (2.1%) |
| $7,500 to $9,999 | 2 (2.1%) | 3 (3.1%) |
| $10,000 to $12,499 | 0 (0.0%) | 6 (6.2%) |
| $12,500 to $14,999 | 1 (1.1%) | 3 (3.1%) |
| $15,000 to $17,499 | 4 (4.2%) | 16 (16.7%) |
| $17,500 to $19,999 | 0 (0.0%) | 4 (4.2%) |
| $20,000 to $22,499 | 6 (6.3%) | 11 (11.5%) |
| $22,500 to $24,999 | 4 (4.2%) | 0 (0.0%) |
| $25,000 to $29,999 | 2 (2.1%) | 10 (10.4%) |
| $30,000 to $34,999 | 4 (4.2%) | 0 (0.0%) |
| $35,000 to $39,999 | 7 (7.4%) | 6 (6.2%) |
| $40,000 to $44,999 | 18 (19.0%) | 1 (1.0%) |
| $45,000 to $49,999 | 24 (25.3%) | 6 (6.2%) |
| $50,000 to $54,999 | 4 (4.2%) | 0 (0.0%) |
| $55,000 to $64,999 | 11 (11.6%) | 1 (1.0%) |
| $65,000 to $74,999 | 2 (2.1%) | 17 (17.7%) |
| $75,000 to $99,999 | 3 (3.2%) | 0 (0.0%) |
| $100,000+ | 3 (3.2%) | 1 (1.0%) |
| Total | 95 (100.0%) | 96 (100.0%) |
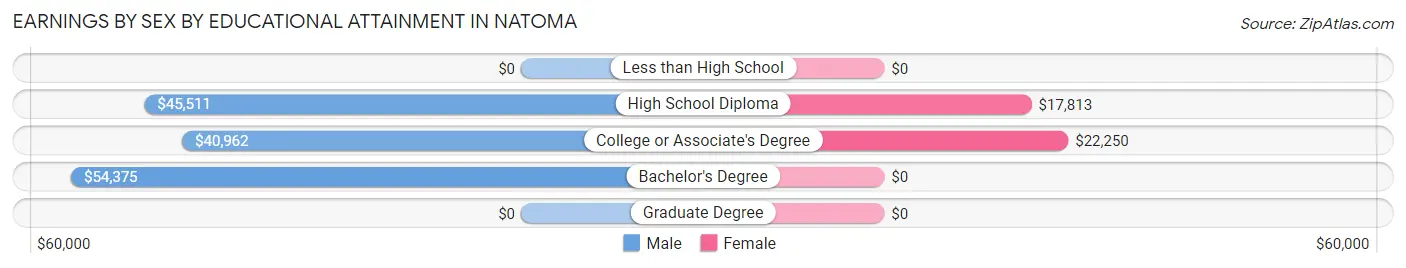
Earnings by Sex by Educational Attainment in Natoma
Average earnings in Natoma are $44,688 for men and $21,136 for women, a difference of 52.7%. Men with an educational attainment of bachelor's degree enjoy the highest average annual earnings of $54,375, while those with college or associate's degree education earn the least with $40,962. Women with an educational attainment of college or associate's degree earn the most with the average annual earnings of $22,250, while those with high school diploma education have the smallest earnings of $17,813.
| Educational Attainment | Male Income | Female Income |
| Less than High School | - | - |
| High School Diploma | $45,511 | $17,813 |
| College or Associate's Degree | $40,962 | $22,250 |
| Bachelor's Degree | $54,375 | $0 |
| Graduate Degree | - | - |
| Total | $44,688 | $21,136 |
Family Income in Natoma
Family Income Brackets in Natoma
According to the Natoma family income data, there are 44 families falling into the $50,000 to $74,999 income range, which is the most common income bracket and makes up 34.1% of all families.
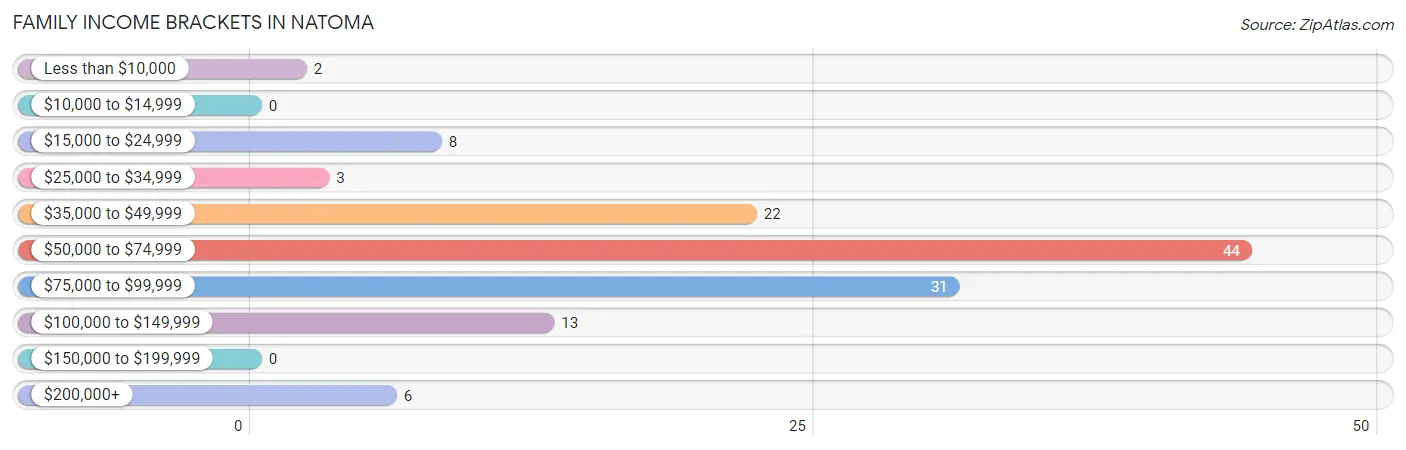
| Income Bracket | # Families | % Families |
| Less than $10,000 | 2 | 1.6% |
| $10,000 to $14,999 | 0 | 0.0% |
| $15,000 to $24,999 | 8 | 6.2% |
| $25,000 to $34,999 | 3 | 2.3% |
| $35,000 to $49,999 | 22 | 17.1% |
| $50,000 to $74,999 | 44 | 34.1% |
| $75,000 to $99,999 | 31 | 24.0% |
| $100,000 to $149,999 | 13 | 10.1% |
| $150,000 to $199,999 | 0 | 0.0% |
| $200,000+ | 6 | 4.7% |
Family Income by Famaliy Size in Natoma
3-person families (52 | 40.3%) account for the highest median family income in Natoma with $69,844 per family, while 2-person families (51 | 39.5%) have the highest median income of $24,688 per family member.
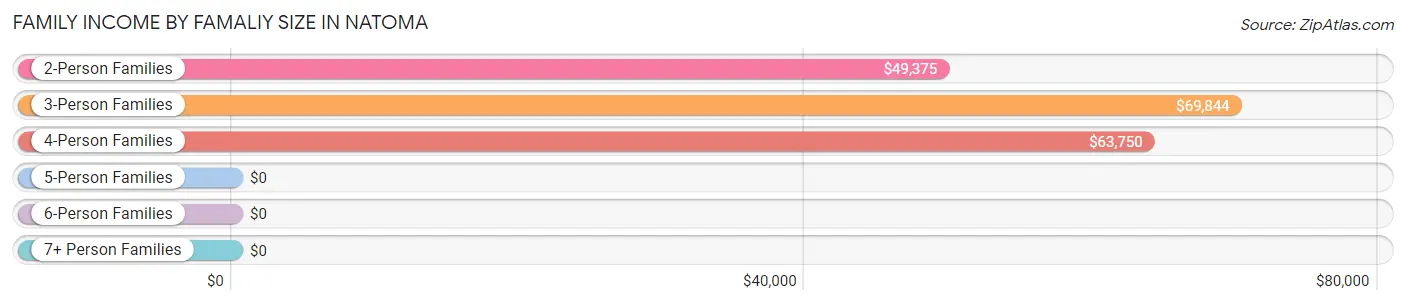
| Income Bracket | # Families | Median Income |
| 2-Person Families | 51 (39.5%) | $49,375 |
| 3-Person Families | 52 (40.3%) | $69,844 |
| 4-Person Families | 18 (14.0%) | $63,750 |
| 5-Person Families | 5 (3.9%) | $0 |
| 6-Person Families | 0 (0.0%) | $0 |
| 7+ Person Families | 3 (2.3%) | $0 |
| Total | 129 (100.0%) | $68,092 |
Family Income by Number of Earners in Natoma
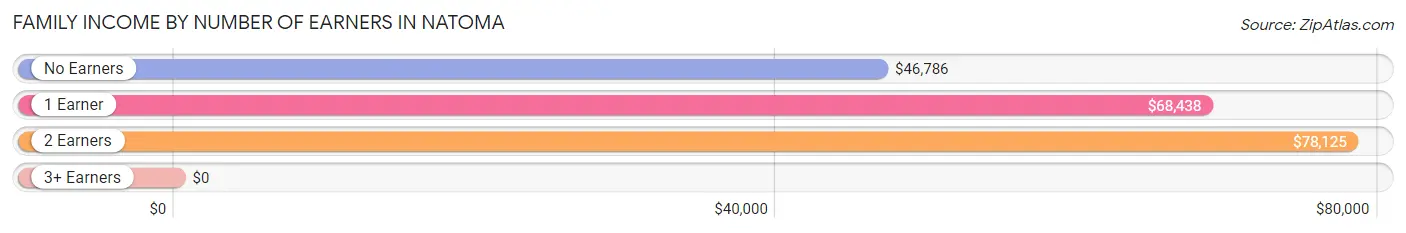
| Number of Earners | # Families | Median Income |
| No Earners | 22 (17.1%) | $46,786 |
| 1 Earner | 34 (26.4%) | $68,438 |
| 2 Earners | 71 (55.0%) | $78,125 |
| 3+ Earners | 2 (1.5%) | $0 |
| Total | 129 (100.0%) | $68,092 |
Household Income in Natoma
Household Income Brackets in Natoma
With 44 households falling in the category, the $75,000 to $99,999 income range is the most frequent in Natoma, accounting for 24.4% of all households.
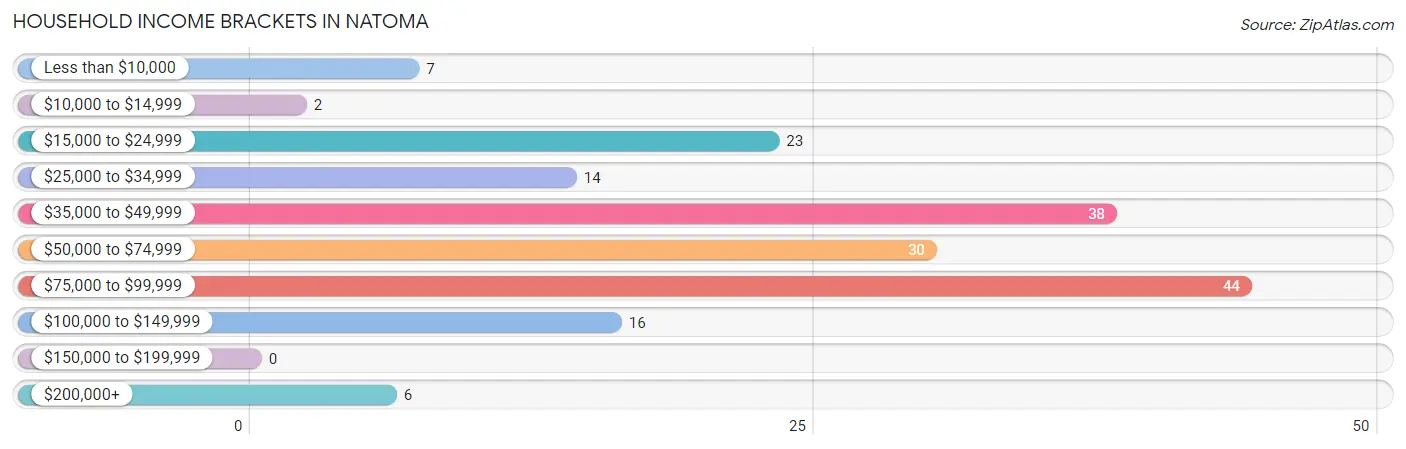
| Income Bracket | # Households | % Households |
| Less than $10,000 | 7 | 3.9% |
| $10,000 to $14,999 | 2 | 1.1% |
| $15,000 to $24,999 | 23 | 12.8% |
| $25,000 to $34,999 | 14 | 7.8% |
| $35,000 to $49,999 | 38 | 21.1% |
| $50,000 to $74,999 | 30 | 16.7% |
| $75,000 to $99,999 | 44 | 24.4% |
| $100,000 to $149,999 | 16 | 8.9% |
| $150,000 to $199,999 | 0 | 0.0% |
| $200,000+ | 6 | 3.3% |
Household Income by Householder Age in Natoma
The median household income in Natoma is $54,167, with the highest median household income of $97,656 found in the 25 to 44 years age bracket for the primary householder. A total of 46 households (25.6%) fall into this category.
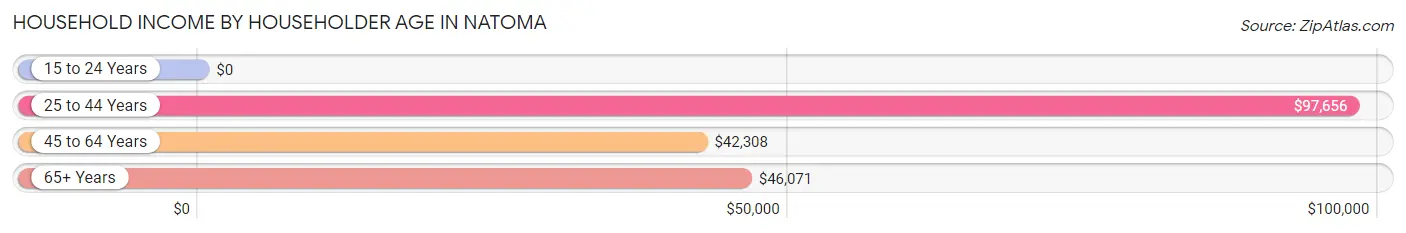
| Income Bracket | # Households | Median Income |
| 15 to 24 Years | 0 (0.0%) | $0 |
| 25 to 44 Years | 46 (25.6%) | $97,656 |
| 45 to 64 Years | 88 (48.9%) | $42,308 |
| 65+ Years | 46 (25.6%) | $46,071 |
| Total | 180 (100.0%) | $54,167 |
Poverty in Natoma
Income Below Poverty by Sex and Age in Natoma
With 3.3% poverty level for males and 6.4% for females among the residents of Natoma, 65 to 74 year old males and 65 to 74 year old females are the most vulnerable to poverty, with 4 males (28.6%) and 4 females (33.3%) in their respective age groups living below the poverty level.
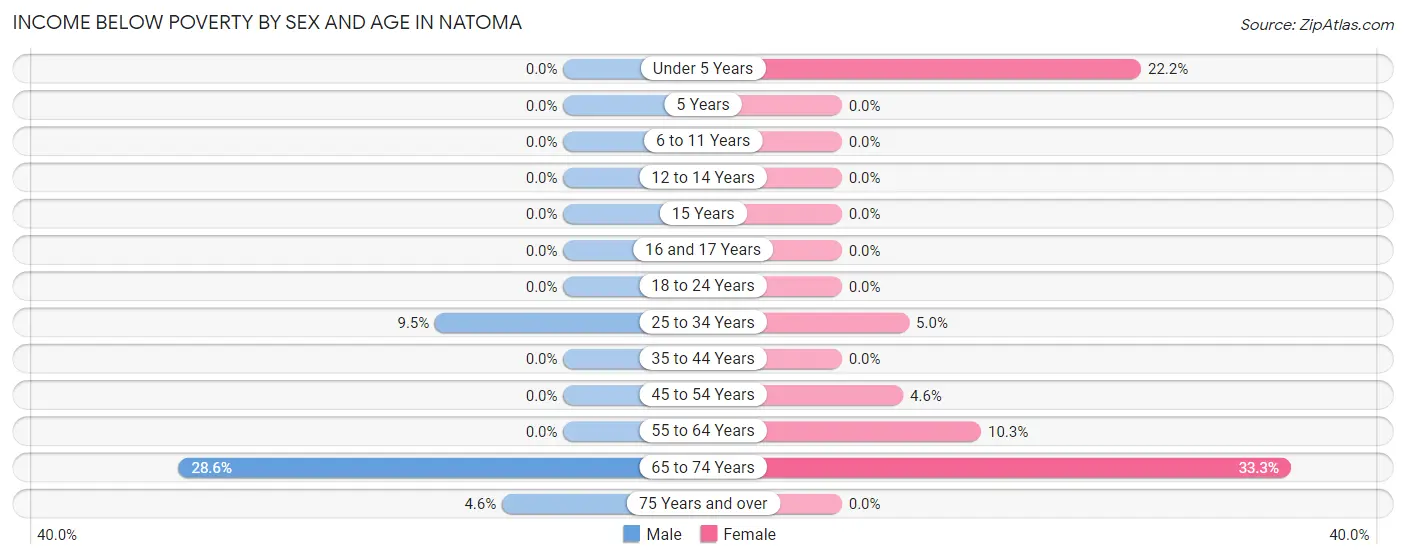
| Age Bracket | Male | Female |
| Under 5 Years | 0 (0.0%) | 2 (22.2%) |
| 5 Years | 0 (0.0%) | 0 (0.0%) |
| 6 to 11 Years | 0 (0.0%) | 0 (0.0%) |
| 12 to 14 Years | 0 (0.0%) | 0 (0.0%) |
| 15 Years | 0 (0.0%) | 0 (0.0%) |
| 16 and 17 Years | 0 (0.0%) | 0 (0.0%) |
| 18 to 24 Years | 0 (0.0%) | 0 (0.0%) |
| 25 to 34 Years | 2 (9.5%) | 2 (5.0%) |
| 35 to 44 Years | 0 (0.0%) | 0 (0.0%) |
| 45 to 54 Years | 0 (0.0%) | 1 (4.5%) |
| 55 to 64 Years | 0 (0.0%) | 3 (10.3%) |
| 65 to 74 Years | 4 (28.6%) | 4 (33.3%) |
| 75 Years and over | 1 (4.5%) | 0 (0.0%) |
| Total | 7 (3.3%) | 12 (6.4%) |
Income Above Poverty by Sex and Age in Natoma
According to the poverty statistics in Natoma, males aged under 5 years and females aged 6 to 11 years are the age groups that are most secure financially, with 100.0% of males and 100.0% of females in these age groups living above the poverty line.
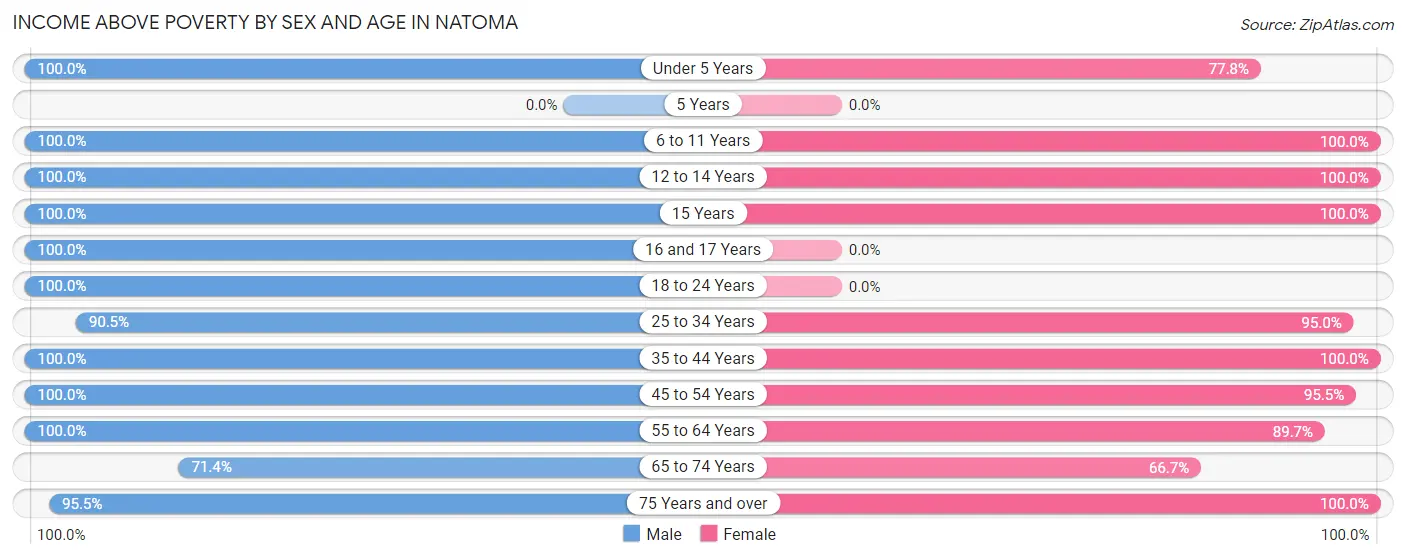
| Age Bracket | Male | Female |
| Under 5 Years | 11 (100.0%) | 7 (77.8%) |
| 5 Years | 0 (0.0%) | 0 (0.0%) |
| 6 to 11 Years | 47 (100.0%) | 13 (100.0%) |
| 12 to 14 Years | 6 (100.0%) | 33 (100.0%) |
| 15 Years | 2 (100.0%) | 2 (100.0%) |
| 16 and 17 Years | 1 (100.0%) | 0 (0.0%) |
| 18 to 24 Years | 2 (100.0%) | 0 (0.0%) |
| 25 to 34 Years | 19 (90.5%) | 38 (95.0%) |
| 35 to 44 Years | 13 (100.0%) | 9 (100.0%) |
| 45 to 54 Years | 17 (100.0%) | 21 (95.5%) |
| 55 to 64 Years | 55 (100.0%) | 26 (89.7%) |
| 65 to 74 Years | 10 (71.4%) | 8 (66.7%) |
| 75 Years and over | 21 (95.5%) | 20 (100.0%) |
| Total | 204 (96.7%) | 177 (93.6%) |
Income Below Poverty Among Married-Couple Families in Natoma
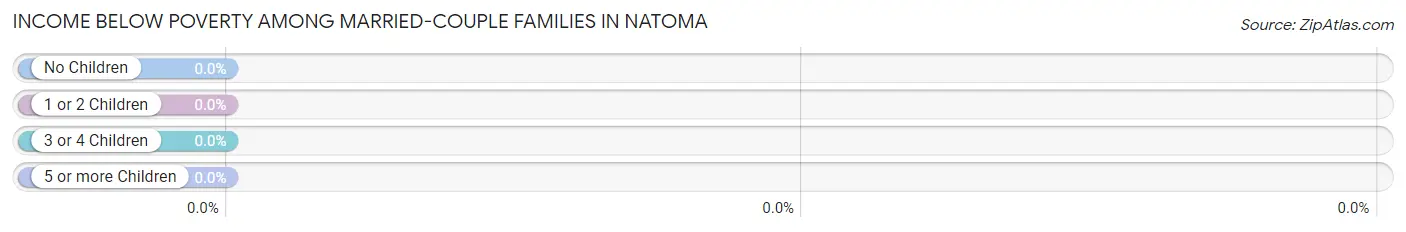
| Children | Above Poverty | Below Poverty |
| No Children | 43 (100.0%) | 0 (0.0%) |
| 1 or 2 Children | 45 (100.0%) | 0 (0.0%) |
| 3 or 4 Children | 5 (100.0%) | 0 (0.0%) |
| 5 or more Children | 3 (100.0%) | 0 (0.0%) |
| Total | 96 (100.0%) | 0 (0.0%) |
Income Below Poverty Among Single-Parent Households in Natoma
According to the poverty data in Natoma, 33.3% or 2 single-father households and 7.4% or 2 single-mother households are living below the poverty line. Among single-father households, those with no children have the highest poverty rate, with 2 households (33.3%) experiencing poverty. Likewise, among single-mother households, those with 1 or 2 children have the highest poverty rate, with 2 households (8.3%) falling below the poverty line.
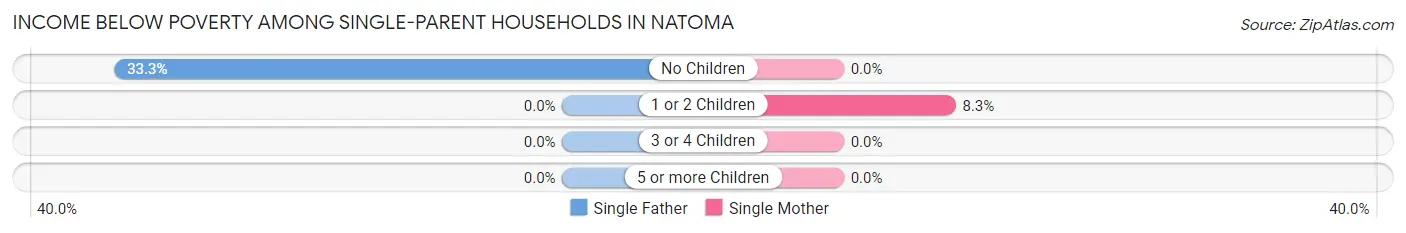
| Children | Single Father | Single Mother |
| No Children | 2 (33.3%) | 0 (0.0%) |
| 1 or 2 Children | 0 (0.0%) | 2 (8.3%) |
| 3 or 4 Children | 0 (0.0%) | 0 (0.0%) |
| 5 or more Children | 0 (0.0%) | 0 (0.0%) |
| Total | 2 (33.3%) | 2 (7.4%) |
Income Below Poverty Among Married-Couple vs Single-Parent Households in Natoma
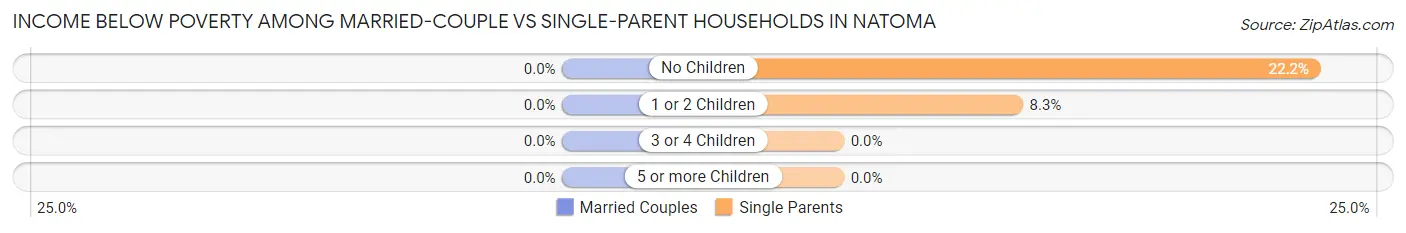
| Children | Married-Couple Families | Single-Parent Households |
| No Children | 0 (0.0%) | 2 (22.2%) |
| 1 or 2 Children | 0 (0.0%) | 2 (8.3%) |
| 3 or 4 Children | 0 (0.0%) | 0 (0.0%) |
| 5 or more Children | 0 (0.0%) | 0 (0.0%) |
| Total | 0 (0.0%) | 4 (12.1%) |
Race in Natoma
The most populous races in Natoma are White / Caucasian (354 | 88.5%), Two or more Races (32 | 8.0%), and Hispanic or Latino (14 | 3.5%).
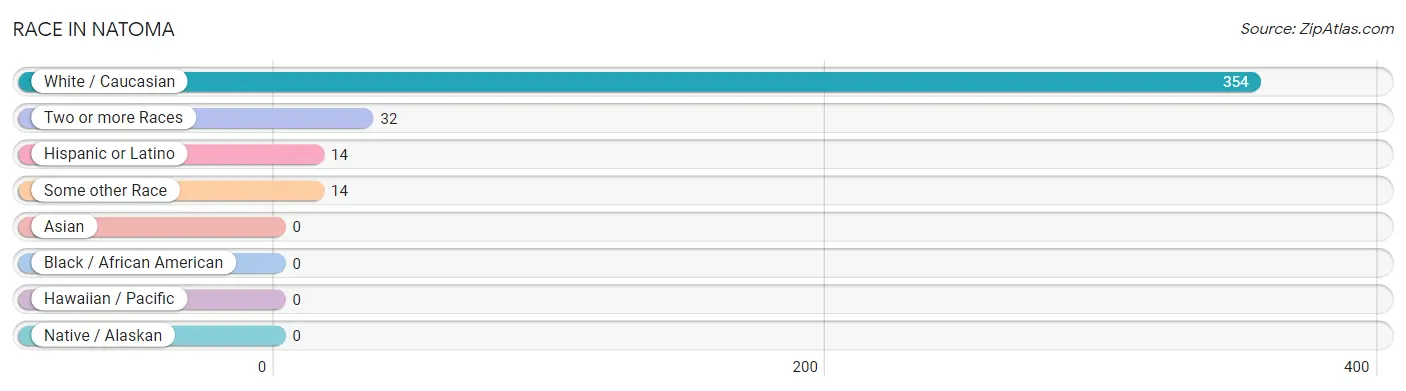
| Race | # Population | % Population |
| Asian | 0 | 0.0% |
| Black / African American | 0 | 0.0% |
| Hawaiian / Pacific | 0 | 0.0% |
| Hispanic or Latino | 14 | 3.5% |
| Native / Alaskan | 0 | 0.0% |
| White / Caucasian | 354 | 88.5% |
| Two or more Races | 32 | 8.0% |
| Some other Race | 14 | 3.5% |
| Total | 400 | 100.0% |
Ancestry in Natoma
The most populous ancestries reported in Natoma are German (91 | 22.8%), American (71 | 17.7%), English (55 | 13.8%), Irish (25 | 6.2%), and Scotch-Irish (25 | 6.2%), together accounting for 66.7% of all Natoma residents.
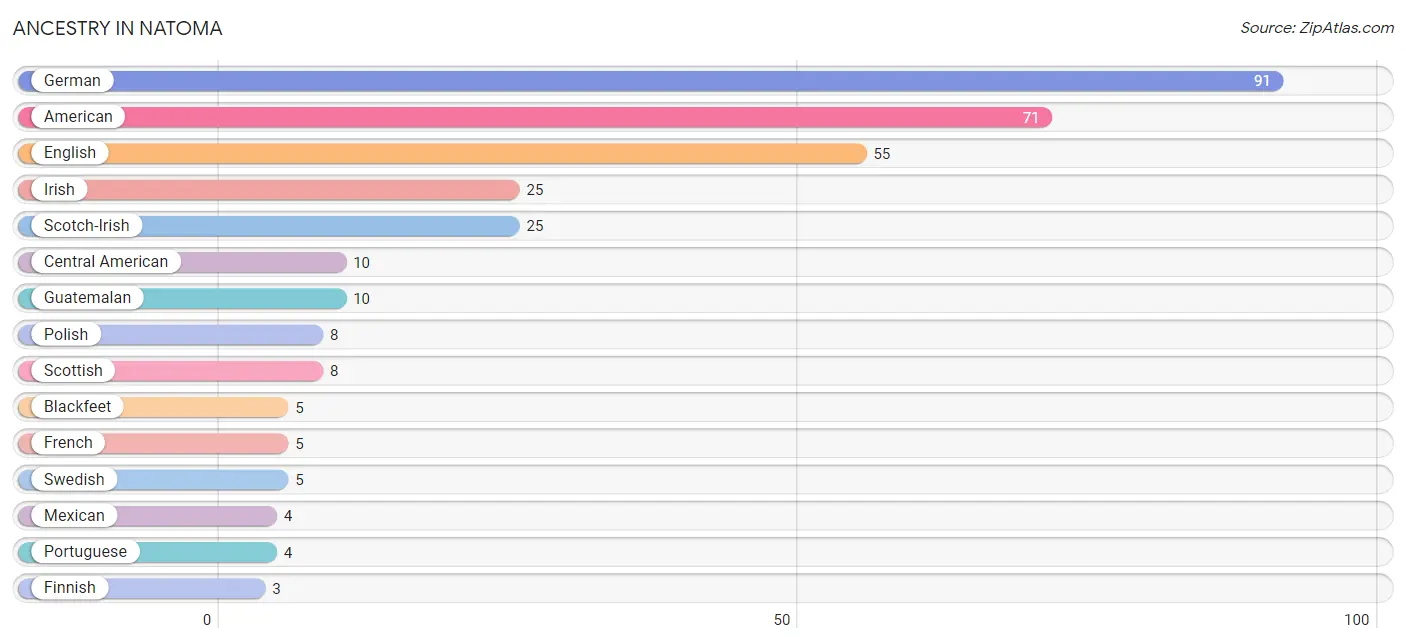
| Ancestry | # Population | % Population |
| American | 71 | 17.7% |
| Blackfeet | 5 | 1.3% |
| Central American | 10 | 2.5% |
| Danish | 1 | 0.3% |
| English | 55 | 13.8% |
| Finnish | 3 | 0.7% |
| French | 5 | 1.3% |
| German | 91 | 22.8% |
| Guatemalan | 10 | 2.5% |
| Irish | 25 | 6.2% |
| Mexican | 4 | 1.0% |
| Norwegian | 2 | 0.5% |
| Polish | 8 | 2.0% |
| Portuguese | 4 | 1.0% |
| Scotch-Irish | 25 | 6.2% |
| Scottish | 8 | 2.0% |
| Slavic | 3 | 0.7% |
| Swedish | 5 | 1.3% |
| Swiss | 1 | 0.3% | View All 19 Rows |
Immigrants in Natoma
The most numerous immigrant groups reported in Natoma came from Central America (10 | 2.5%), Latin America (10 | 2.5%), Mexico (10 | 2.5%), Azores (2 | 0.5%), and Europe (2 | 0.5%), together accounting for 8.5% of all Natoma residents.
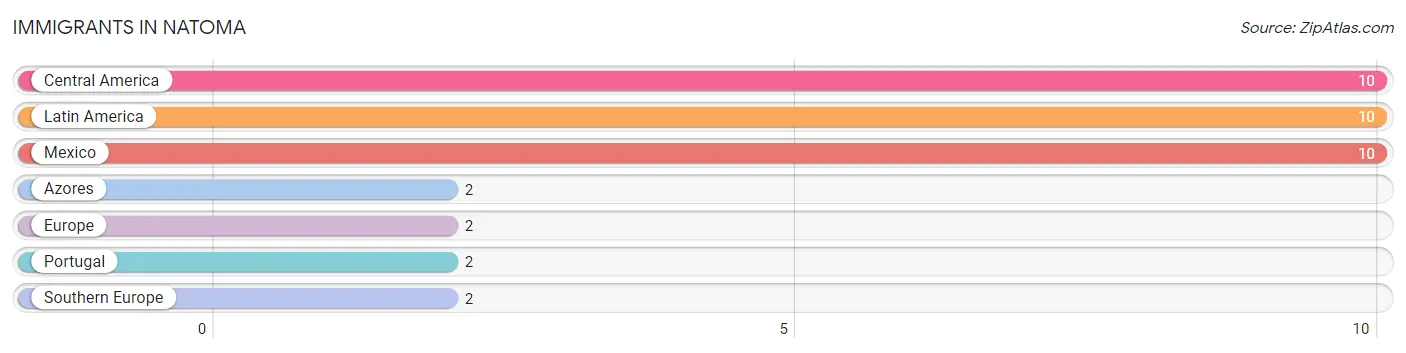
| Immigration Origin | # Population | % Population |
| Azores | 2 | 0.5% |
| Central America | 10 | 2.5% |
| Europe | 2 | 0.5% |
| Latin America | 10 | 2.5% |
| Mexico | 10 | 2.5% |
| Portugal | 2 | 0.5% |
| Southern Europe | 2 | 0.5% | View All 7 Rows |
Sex and Age in Natoma
Sex and Age in Natoma
The most populous age groups in Natoma are 10 to 14 Years (40 | 19.0%) for men and 10 to 14 Years (36 | 19.1%) for women.
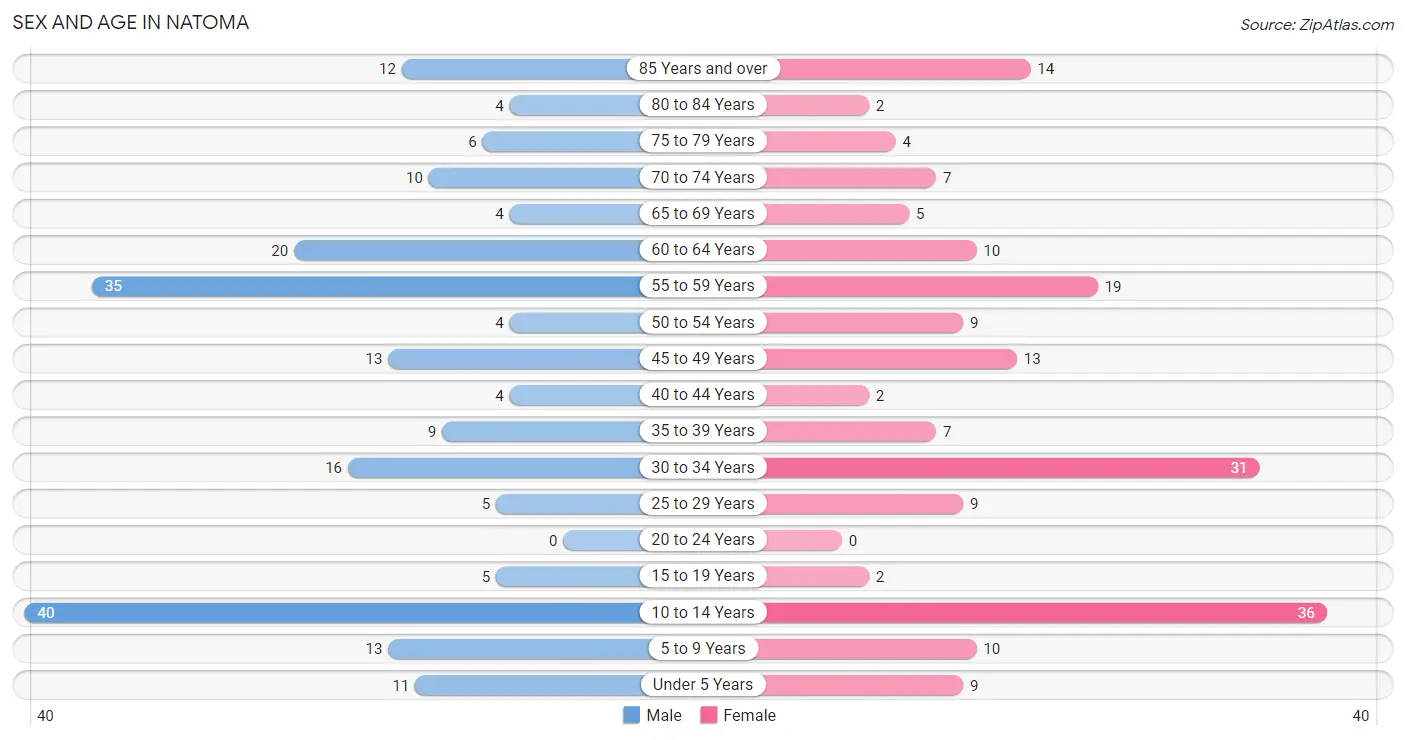
| Age Bracket | Male | Female |
| Under 5 Years | 11 (5.2%) | 9 (4.8%) |
| 5 to 9 Years | 13 (6.2%) | 10 (5.3%) |
| 10 to 14 Years | 40 (19.0%) | 36 (19.1%) |
| 15 to 19 Years | 5 (2.4%) | 2 (1.1%) |
| 20 to 24 Years | 0 (0.0%) | 0 (0.0%) |
| 25 to 29 Years | 5 (2.4%) | 9 (4.8%) |
| 30 to 34 Years | 16 (7.6%) | 31 (16.4%) |
| 35 to 39 Years | 9 (4.3%) | 7 (3.7%) |
| 40 to 44 Years | 4 (1.9%) | 2 (1.1%) |
| 45 to 49 Years | 13 (6.2%) | 13 (6.9%) |
| 50 to 54 Years | 4 (1.9%) | 9 (4.8%) |
| 55 to 59 Years | 35 (16.6%) | 19 (10.1%) |
| 60 to 64 Years | 20 (9.5%) | 10 (5.3%) |
| 65 to 69 Years | 4 (1.9%) | 5 (2.6%) |
| 70 to 74 Years | 10 (4.7%) | 7 (3.7%) |
| 75 to 79 Years | 6 (2.8%) | 4 (2.1%) |
| 80 to 84 Years | 4 (1.9%) | 2 (1.1%) |
| 85 Years and over | 12 (5.7%) | 14 (7.4%) |
| Total | 211 (100.0%) | 189 (100.0%) |
Families and Households in Natoma
Median Family Size in Natoma
The median family size in Natoma is 2.66 persons per family, with married-couple families (96 | 74.4%) accounting for the largest median family size of 2.77 persons per family. On the other hand, single male/father families (6 | 4.6%) represent the smallest median family size with 1.50 persons per family.
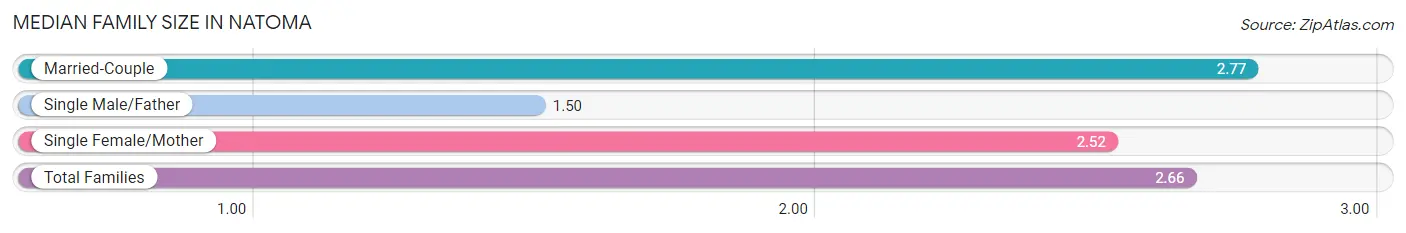
| Family Type | # Families | Family Size |
| Married-Couple | 96 (74.4%) | 2.77 |
| Single Male/Father | 6 (4.6%) | 1.50 |
| Single Female/Mother | 27 (20.9%) | 2.52 |
| Total Families | 129 (100.0%) | 2.66 |
Median Household Size in Natoma
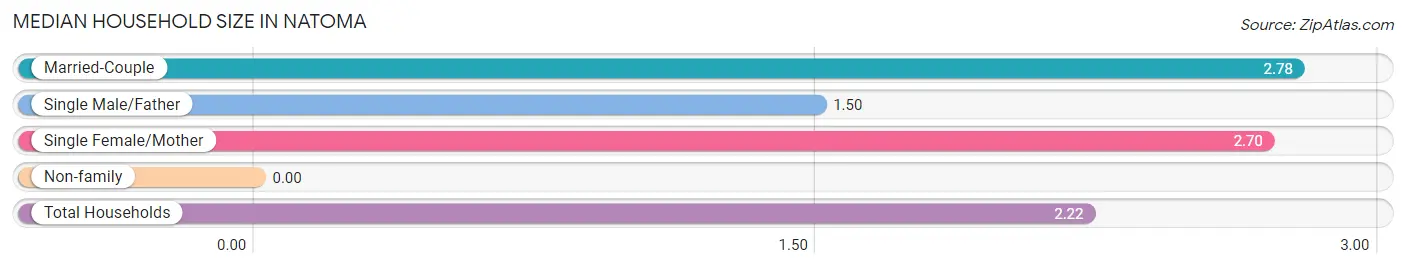
| Household Type | # Households | Household Size |
| Married-Couple | 96 (53.3%) | 2.78 |
| Single Male/Father | 6 (3.3%) | 1.50 |
| Single Female/Mother | 27 (15.0%) | 2.70 |
| Non-family | 51 (28.3%) | - |
| Total Households | 180 (100.0%) | 2.22 |
Household Size by Marriage Status in Natoma
Out of a total of 180 households in Natoma, 129 (71.7%) are family households, while 51 (28.3%) are nonfamily households. The most numerous type of family households are 2-person households, comprising 49, and the most common type of nonfamily households are 1-person households, comprising 51.
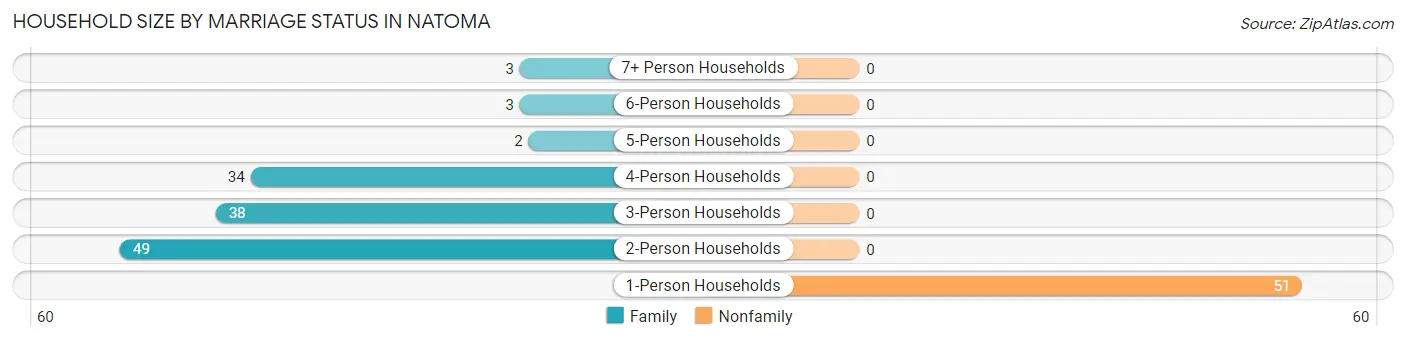
| Household Size | Family Households | Nonfamily Households |
| 1-Person Households | - | 51 (28.3%) |
| 2-Person Households | 49 (27.2%) | 0 (0.0%) |
| 3-Person Households | 38 (21.1%) | 0 (0.0%) |
| 4-Person Households | 34 (18.9%) | 0 (0.0%) |
| 5-Person Households | 2 (1.1%) | 0 (0.0%) |
| 6-Person Households | 3 (1.7%) | 0 (0.0%) |
| 7+ Person Households | 3 (1.7%) | 0 (0.0%) |
| Total | 129 (71.7%) | 51 (28.3%) |
Female Fertility in Natoma
Fertility by Age in Natoma
| Age Bracket | Women with Births | Births / 1,000 Women |
| 15 to 19 years | 0 (0.0%) | 0.0 |
| 20 to 34 years | 0 (0.0%) | 0.0 |
| 35 to 50 years | 0 (0.0%) | 0.0 |
| Total | 0 (0.0%) | 0.0 |
Fertility by Age by Marriage Status in Natoma
| Age Bracket | Married | Unmarried |
| 15 to 19 years | 0 (0.0%) | 0 (0.0%) |
| 20 to 34 years | 0 (0.0%) | 0 (0.0%) |
| 35 to 50 years | 0 (0.0%) | 0 (0.0%) |
| Total | 0 (0.0%) | 0 (0.0%) |
Fertility by Education in Natoma
| Educational Attainment | Women with Births | Births / 1,000 Women |
| Less than High School | 0 (0.0%) | 0.0 |
| High School Diploma | 0 (0.0%) | 0.0 |
| College or Associate's Degree | 0 (0.0%) | 0.0 |
| Bachelor's Degree | 0 (0.0%) | 0.0 |
| Graduate Degree | 0 (0.0%) | 0.0 |
| Total | 0 (0.0%) | 0.0 |
Fertility by Education by Marriage Status in Natoma
| Educational Attainment | Married | Unmarried |
| Less than High School | 0 (0.0%) | 0 (0.0%) |
| High School Diploma | 0 (0.0%) | 0 (0.0%) |
| College or Associate's Degree | 0 (0.0%) | 0 (0.0%) |
| Bachelor's Degree | 0 (0.0%) | 0 (0.0%) |
| Graduate Degree | 0 (0.0%) | 0 (0.0%) |
| Total | 0 (0.0%) | 0 (0.0%) |
Employment Characteristics in Natoma
Employment by Class of Employer in Natoma
Among the 161 employed individuals in Natoma, private company employees (77 | 47.8%), local government employees (48 | 29.8%), and self-employed (not incorporated) (18 | 11.2%) make up the most common classes of employment.
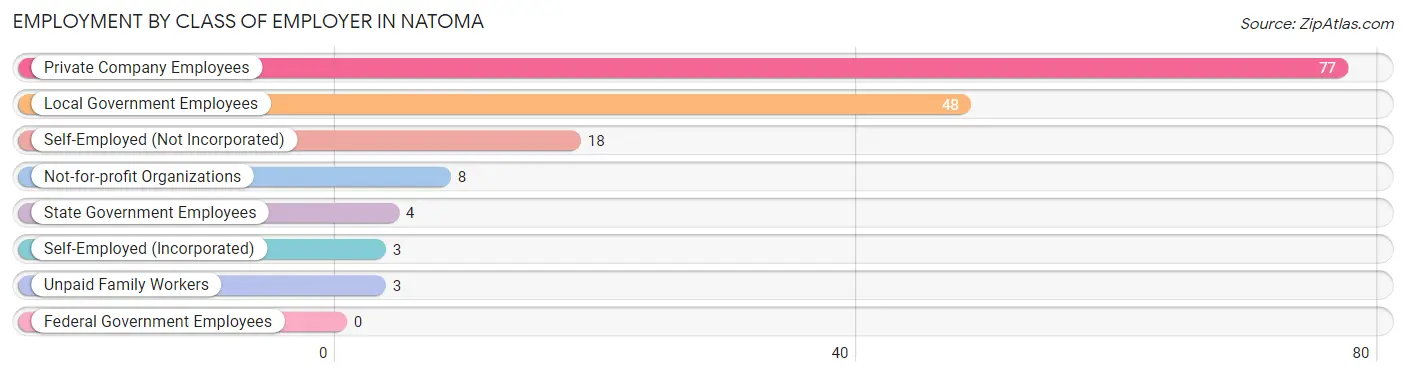
| Employer Class | # Employees | % Employees |
| Private Company Employees | 77 | 47.8% |
| Self-Employed (Incorporated) | 3 | 1.9% |
| Self-Employed (Not Incorporated) | 18 | 11.2% |
| Not-for-profit Organizations | 8 | 5.0% |
| Local Government Employees | 48 | 29.8% |
| State Government Employees | 4 | 2.5% |
| Federal Government Employees | 0 | 0.0% |
| Unpaid Family Workers | 3 | 1.9% |
| Total | 161 | 100.0% |
Employment Status by Age in Natoma
According to the labor force statistics for Natoma, out of the total population over 16 years of age (277), 60.6% or 168 individuals are in the labor force, with 1.8% or 3 of them unemployed. The age group with the highest labor force participation rate is 35 to 44 years, with 100.0% or 22 individuals in the labor force. Within the labor force, the 55 to 59 years age range has the highest percentage of unemployed individuals, with 6.0% or 3 of them being unemployed.
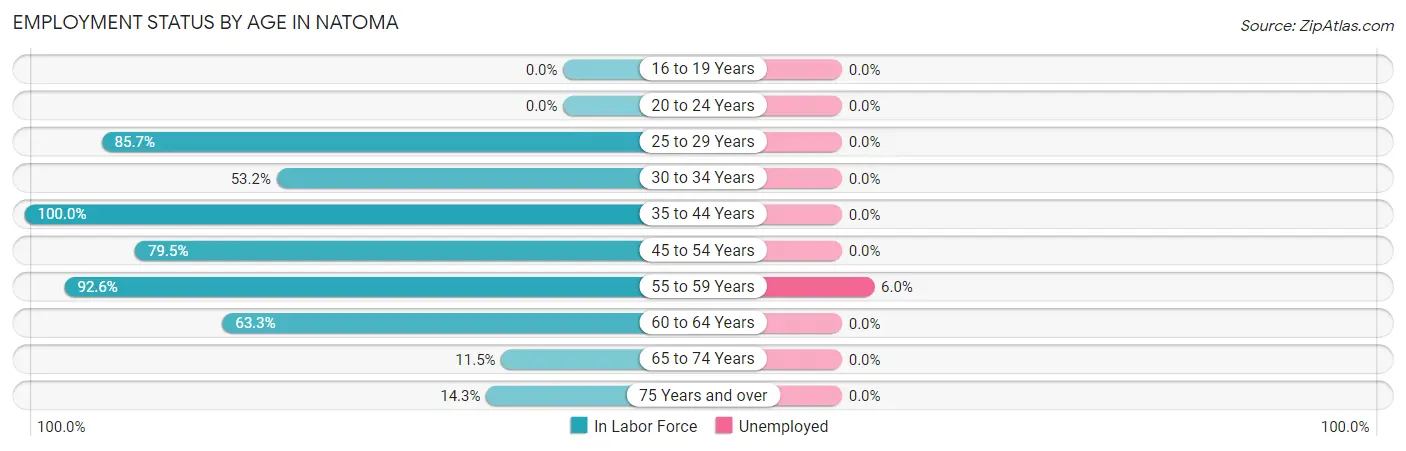
| Age Bracket | In Labor Force | Unemployed |
| 16 to 19 Years | 0 (0.0%) | 0 (0.0%) |
| 20 to 24 Years | 0 (0.0%) | 0 (0.0%) |
| 25 to 29 Years | 12 (85.7%) | 0 (0.0%) |
| 30 to 34 Years | 25 (53.2%) | 0 (0.0%) |
| 35 to 44 Years | 22 (100.0%) | 0 (0.0%) |
| 45 to 54 Years | 31 (79.5%) | 0 (0.0%) |
| 55 to 59 Years | 50 (92.6%) | 3 (6.0%) |
| 60 to 64 Years | 19 (63.3%) | 0 (0.0%) |
| 65 to 74 Years | 3 (11.5%) | 0 (0.0%) |
| 75 Years and over | 6 (14.3%) | 0 (0.0%) |
| Total | 168 (60.6%) | 3 (1.8%) |
Employment Status by Educational Attainment in Natoma
According to labor force statistics for Natoma, 77.2% of individuals (159) out of the total population between 25 and 64 years of age (206) are in the labor force, with 1.9% or 3 of them being unemployed. The group with the highest labor force participation rate are those with the educational attainment of high school diploma, with 89.7% or 61 individuals in the labor force. Within the labor force, individuals with college / associate degree education have the highest percentage of unemployment, with 4.7% or 3 of them being unemployed.
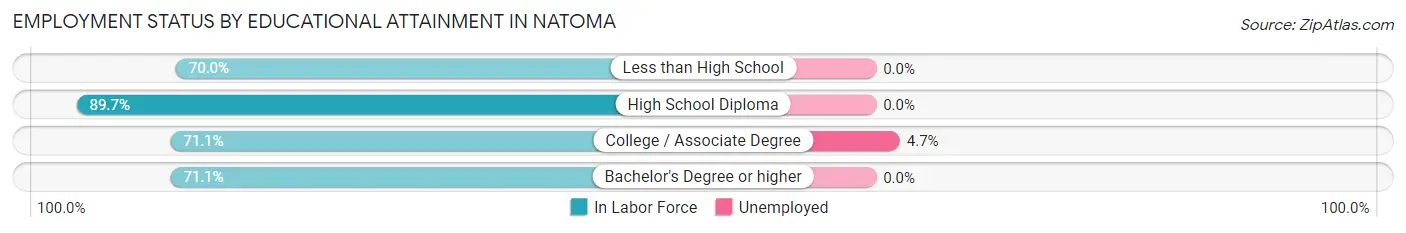
| Educational Attainment | In Labor Force | Unemployed |
| Less than High School | 7 (70.0%) | 0 (0.0%) |
| High School Diploma | 61 (89.7%) | 0 (0.0%) |
| College / Associate Degree | 64 (71.1%) | 4 (4.7%) |
| Bachelor's Degree or higher | 27 (71.1%) | 0 (0.0%) |
| Total | 159 (77.2%) | 4 (1.9%) |
Employment Occupations by Sex in Natoma
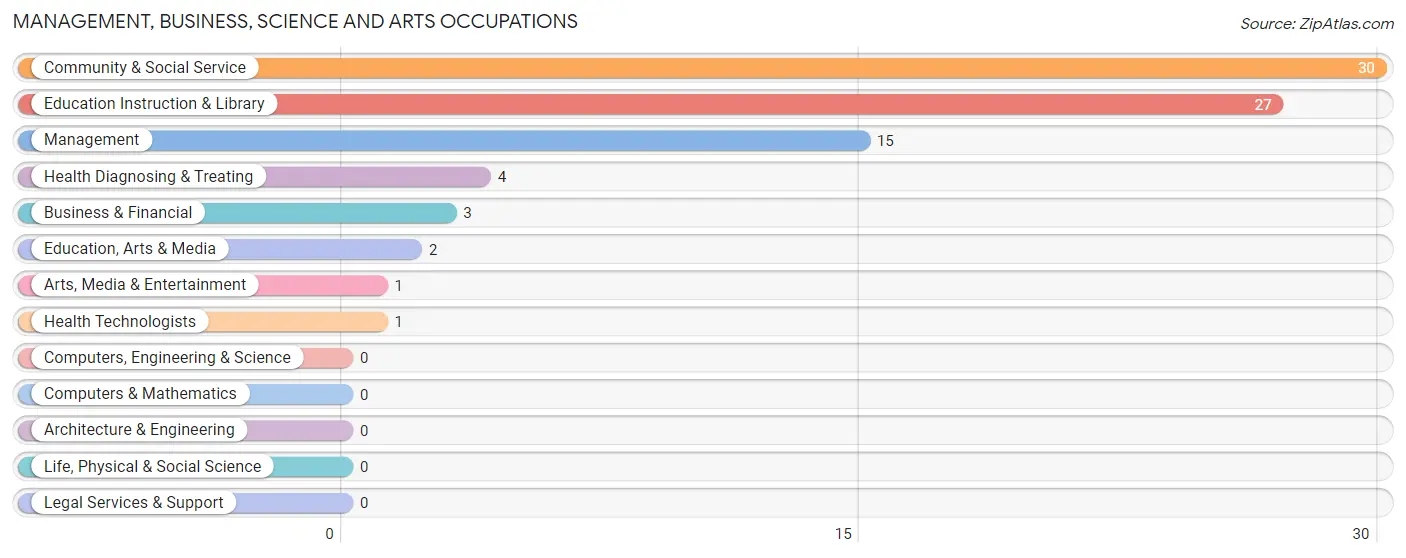
Management, Business, Science and Arts Occupations
The most common Management, Business, Science and Arts occupations in Natoma are Community & Social Service (30 | 18.2%), Education Instruction & Library (27 | 16.4%), Management (15 | 9.1%), Health Diagnosing & Treating (4 | 2.4%), and Business & Financial (3 | 1.8%).
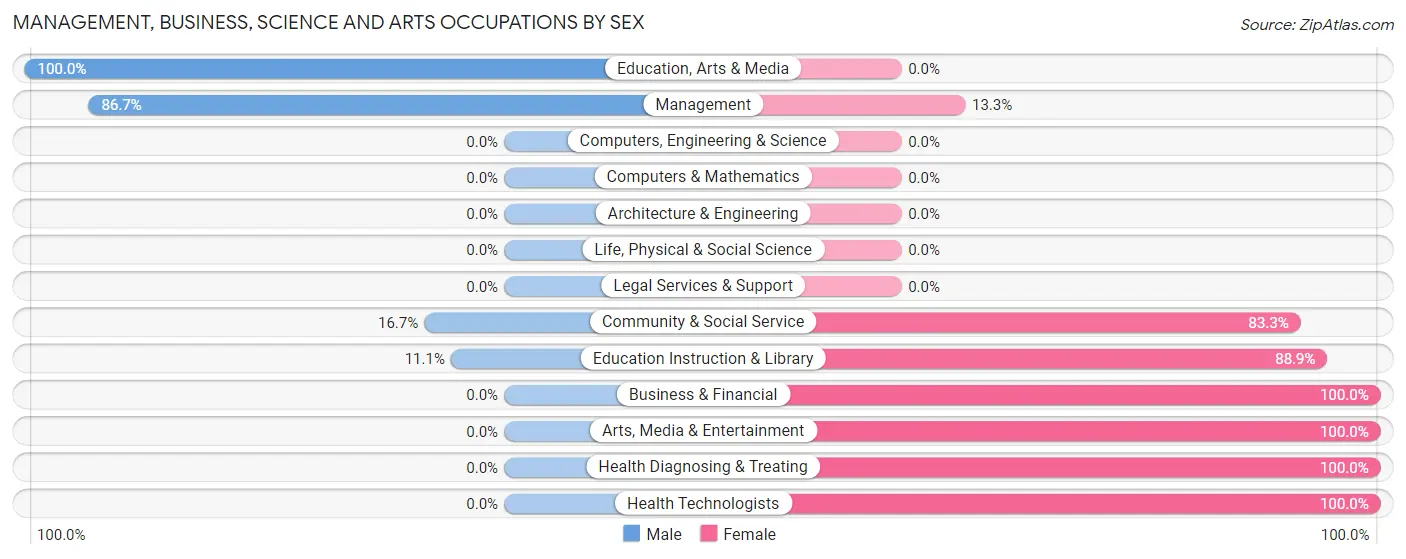
Management, Business, Science and Arts Occupations by Sex
Within the Management, Business, Science and Arts occupations in Natoma, the most male-oriented occupations are Education, Arts & Media (100.0%), Management (86.7%), and Community & Social Service (16.7%), while the most female-oriented occupations are Business & Financial (100.0%), Arts, Media & Entertainment (100.0%), and Health Diagnosing & Treating (100.0%).
| Occupation | Male | Female |
| Management | 13 (86.7%) | 2 (13.3%) |
| Business & Financial | 0 (0.0%) | 3 (100.0%) |
| Computers, Engineering & Science | 0 (0.0%) | 0 (0.0%) |
| Computers & Mathematics | 0 (0.0%) | 0 (0.0%) |
| Architecture & Engineering | 0 (0.0%) | 0 (0.0%) |
| Life, Physical & Social Science | 0 (0.0%) | 0 (0.0%) |
| Community & Social Service | 5 (16.7%) | 25 (83.3%) |
| Education, Arts & Media | 2 (100.0%) | 0 (0.0%) |
| Legal Services & Support | 0 (0.0%) | 0 (0.0%) |
| Education Instruction & Library | 3 (11.1%) | 24 (88.9%) |
| Arts, Media & Entertainment | 0 (0.0%) | 1 (100.0%) |
| Health Diagnosing & Treating | 0 (0.0%) | 4 (100.0%) |
| Health Technologists | 0 (0.0%) | 1 (100.0%) |
| Total (Category) | 18 (34.6%) | 34 (65.4%) |
| Total (Overall) | 95 (57.6%) | 70 (42.4%) |
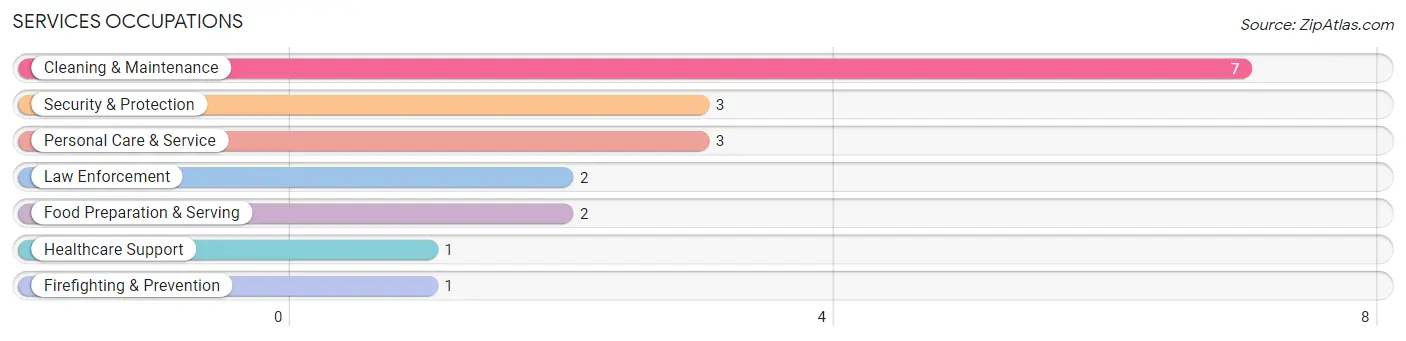
Services Occupations
The most common Services occupations in Natoma are Cleaning & Maintenance (7 | 4.2%), Security & Protection (3 | 1.8%), Personal Care & Service (3 | 1.8%), Law Enforcement (2 | 1.2%), and Food Preparation & Serving (2 | 1.2%).
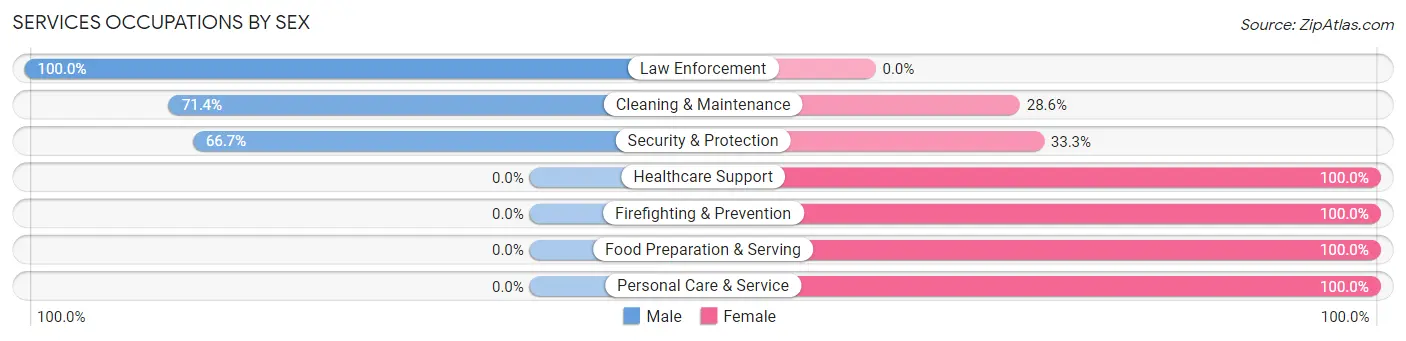
Services Occupations by Sex
Within the Services occupations in Natoma, the most male-oriented occupations are Law Enforcement (100.0%), Cleaning & Maintenance (71.4%), and Security & Protection (66.7%), while the most female-oriented occupations are Healthcare Support (100.0%), Firefighting & Prevention (100.0%), and Food Preparation & Serving (100.0%).
| Occupation | Male | Female |
| Healthcare Support | 0 (0.0%) | 1 (100.0%) |
| Security & Protection | 2 (66.7%) | 1 (33.3%) |
| Firefighting & Prevention | 0 (0.0%) | 1 (100.0%) |
| Law Enforcement | 2 (100.0%) | 0 (0.0%) |
| Food Preparation & Serving | 0 (0.0%) | 2 (100.0%) |
| Cleaning & Maintenance | 5 (71.4%) | 2 (28.6%) |
| Personal Care & Service | 0 (0.0%) | 3 (100.0%) |
| Total (Category) | 7 (43.8%) | 9 (56.2%) |
| Total (Overall) | 95 (57.6%) | 70 (42.4%) |
Sales and Office Occupations
The most common Sales and Office occupations in Natoma are Office & Administration (18 | 10.9%), and Sales & Related (6 | 3.6%).
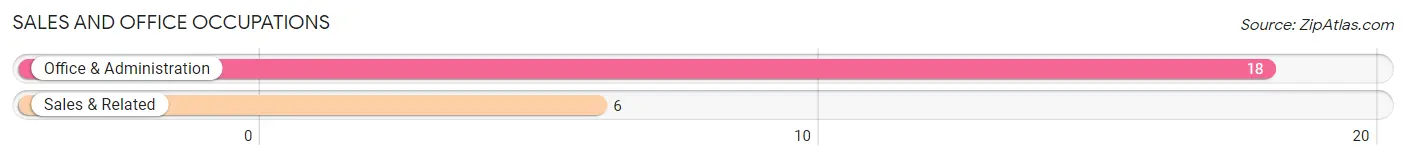
Sales and Office Occupations by Sex
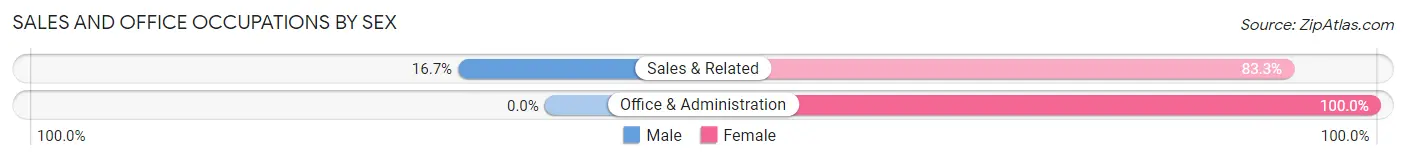
| Occupation | Male | Female |
| Sales & Related | 1 (16.7%) | 5 (83.3%) |
| Office & Administration | 0 (0.0%) | 18 (100.0%) |
| Total (Category) | 1 (4.2%) | 23 (95.8%) |
| Total (Overall) | 95 (57.6%) | 70 (42.4%) |
Natural Resources, Construction and Maintenance Occupations
The most common Natural Resources, Construction and Maintenance occupations in Natoma are Farming, Fishing & Forestry (23 | 13.9%), Installation, Maintenance & Repair (23 | 13.9%), and Construction & Extraction (8 | 4.9%).
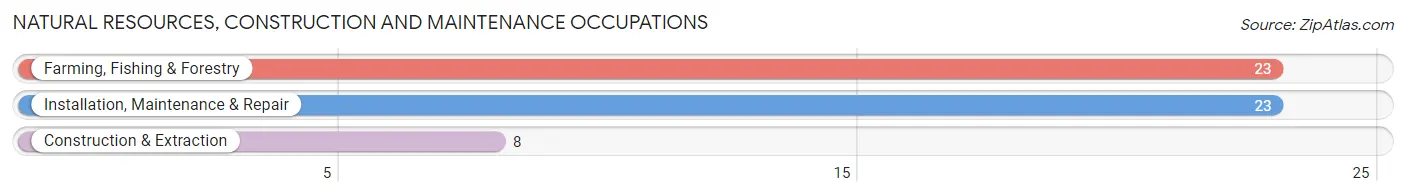
Natural Resources, Construction and Maintenance Occupations by Sex
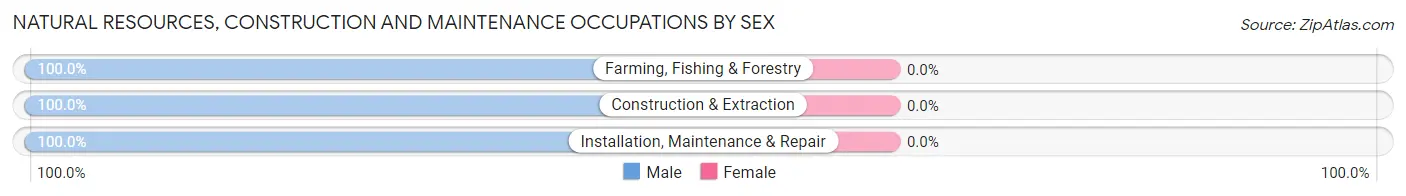
| Occupation | Male | Female |
| Farming, Fishing & Forestry | 23 (100.0%) | 0 (0.0%) |
| Construction & Extraction | 8 (100.0%) | 0 (0.0%) |
| Installation, Maintenance & Repair | 23 (100.0%) | 0 (0.0%) |
| Total (Category) | 54 (100.0%) | 0 (0.0%) |
| Total (Overall) | 95 (57.6%) | 70 (42.4%) |
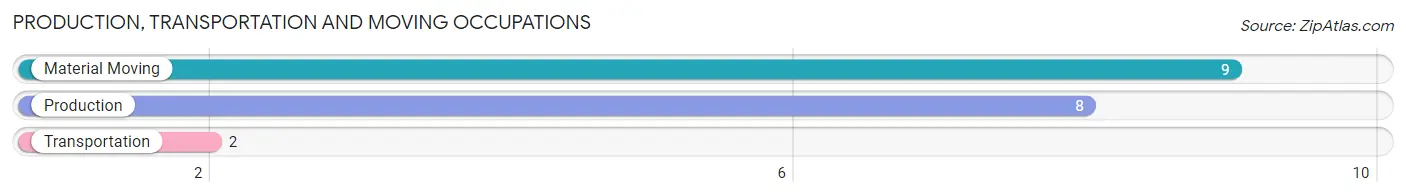
Production, Transportation and Moving Occupations
The most common Production, Transportation and Moving occupations in Natoma are Material Moving (9 | 5.4%), Production (8 | 4.9%), and Transportation (2 | 1.2%).
Production, Transportation and Moving Occupations by Sex
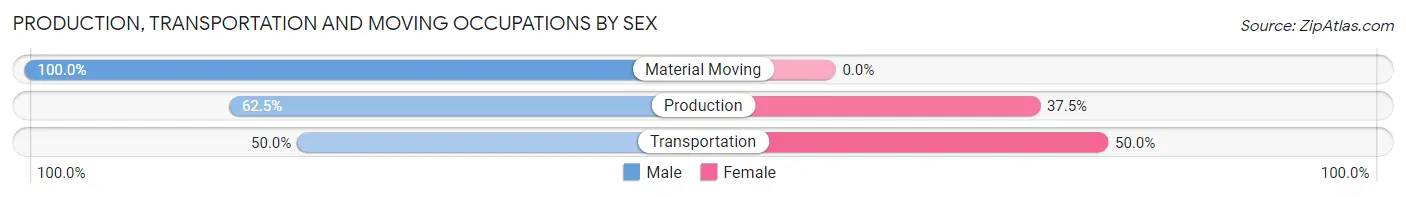
| Occupation | Male | Female |
| Production | 5 (62.5%) | 3 (37.5%) |
| Transportation | 1 (50.0%) | 1 (50.0%) |
| Material Moving | 9 (100.0%) | 0 (0.0%) |
| Total (Category) | 15 (78.9%) | 4 (21.0%) |
| Total (Overall) | 95 (57.6%) | 70 (42.4%) |
Employment Industries by Sex in Natoma
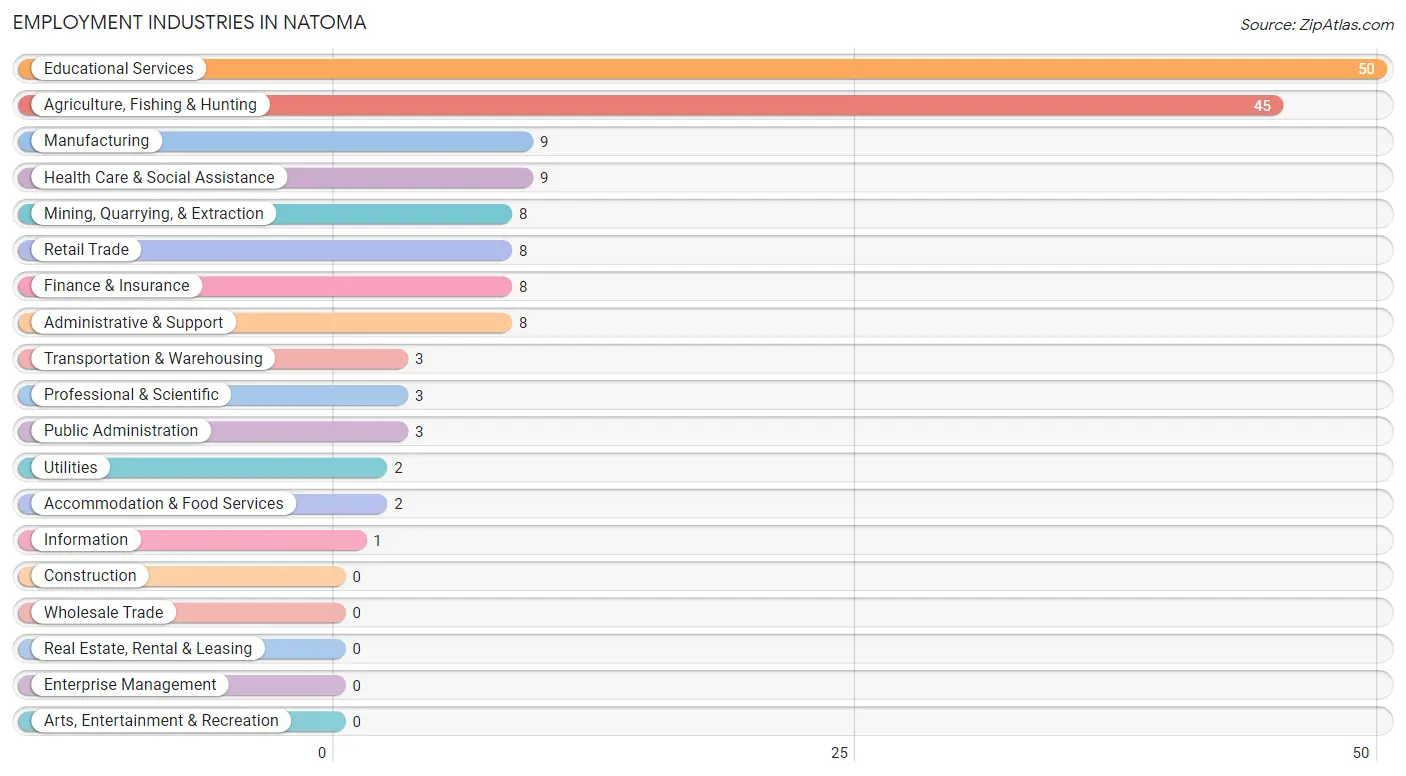
Employment Industries in Natoma
The major employment industries in Natoma include Educational Services (50 | 30.3%), Agriculture, Fishing & Hunting (45 | 27.3%), Manufacturing (9 | 5.4%), Health Care & Social Assistance (9 | 5.4%), and Mining, Quarrying, & Extraction (8 | 4.9%).
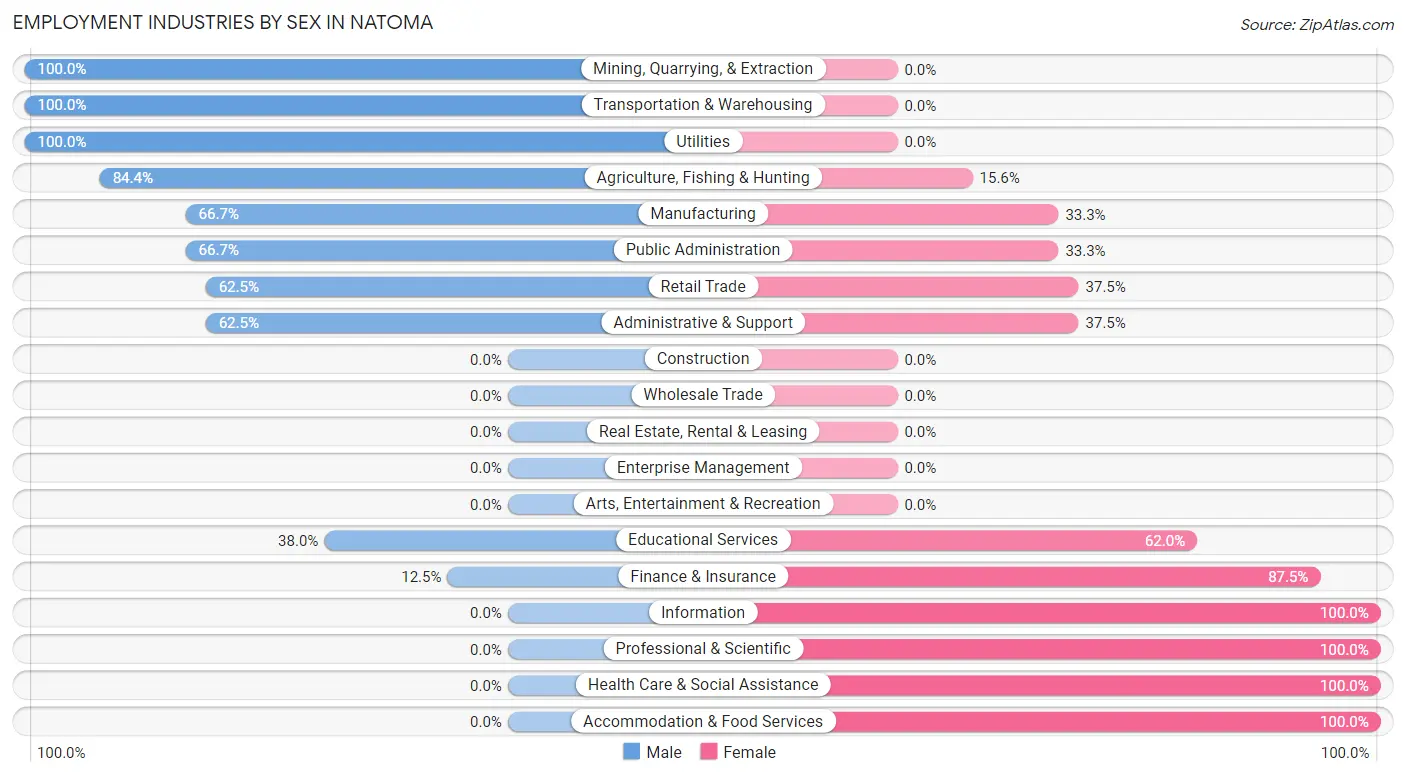
Employment Industries by Sex in Natoma
The Natoma industries that see more men than women are Mining, Quarrying, & Extraction (100.0%), Transportation & Warehousing (100.0%), and Utilities (100.0%), whereas the industries that tend to have a higher number of women are Information (100.0%), Professional & Scientific (100.0%), and Health Care & Social Assistance (100.0%).
| Industry | Male | Female |
| Agriculture, Fishing & Hunting | 38 (84.4%) | 7 (15.6%) |
| Mining, Quarrying, & Extraction | 8 (100.0%) | 0 (0.0%) |
| Construction | 0 (0.0%) | 0 (0.0%) |
| Manufacturing | 6 (66.7%) | 3 (33.3%) |
| Wholesale Trade | 0 (0.0%) | 0 (0.0%) |
| Retail Trade | 5 (62.5%) | 3 (37.5%) |
| Transportation & Warehousing | 3 (100.0%) | 0 (0.0%) |
| Utilities | 2 (100.0%) | 0 (0.0%) |
| Information | 0 (0.0%) | 1 (100.0%) |
| Finance & Insurance | 1 (12.5%) | 7 (87.5%) |
| Real Estate, Rental & Leasing | 0 (0.0%) | 0 (0.0%) |
| Professional & Scientific | 0 (0.0%) | 3 (100.0%) |
| Enterprise Management | 0 (0.0%) | 0 (0.0%) |
| Administrative & Support | 5 (62.5%) | 3 (37.5%) |
| Educational Services | 19 (38.0%) | 31 (62.0%) |
| Health Care & Social Assistance | 0 (0.0%) | 9 (100.0%) |
| Arts, Entertainment & Recreation | 0 (0.0%) | 0 (0.0%) |
| Accommodation & Food Services | 0 (0.0%) | 2 (100.0%) |
| Public Administration | 2 (66.7%) | 1 (33.3%) |
| Total | 95 (57.6%) | 70 (42.4%) |
Education in Natoma
School Enrollment in Natoma
The most common levels of schooling among the 124 students in Natoma are middle school (76 | 61.3%), elementary school (22 | 17.7%), and high school (8 | 6.5%).
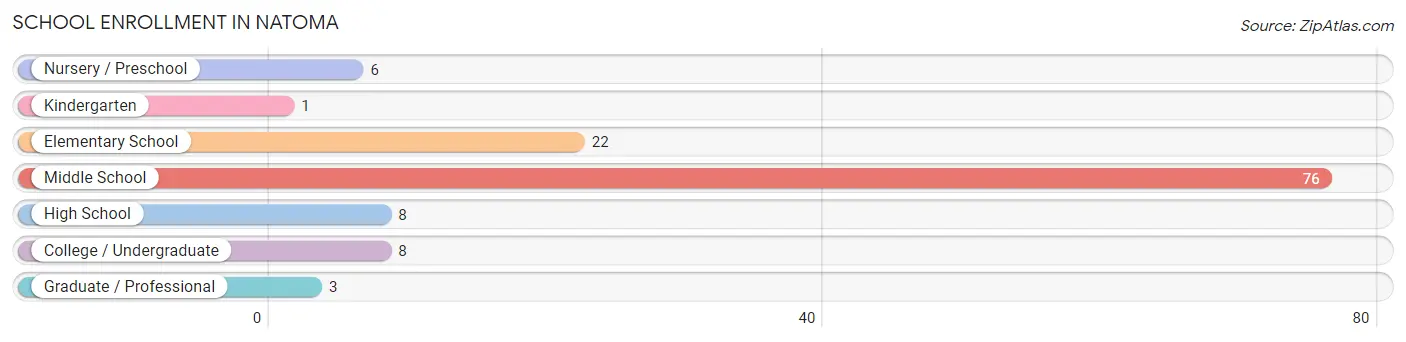
| School Level | # Students | % Students |
| Nursery / Preschool | 6 | 4.8% |
| Kindergarten | 1 | 0.8% |
| Elementary School | 22 | 17.7% |
| Middle School | 76 | 61.3% |
| High School | 8 | 6.5% |
| College / Undergraduate | 8 | 6.5% |
| Graduate / Professional | 3 | 2.4% |
| Total | 124 | 100.0% |
School Enrollment by Age by Funding Source in Natoma
Out of a total of 124 students who are enrolled in schools in Natoma, 6 (4.8%) attend a private institution, while the remaining 118 (95.2%) are enrolled in public schools. The age group of 18 to 19 year olds has the highest likelihood of being enrolled in private schools, with 2 (100.0% in the age bracket) enrolled. Conversely, the age group of 3 to 4 year olds has the lowest likelihood of being enrolled in a private school, with 6 (100.0% in the age bracket) attending a public institution.
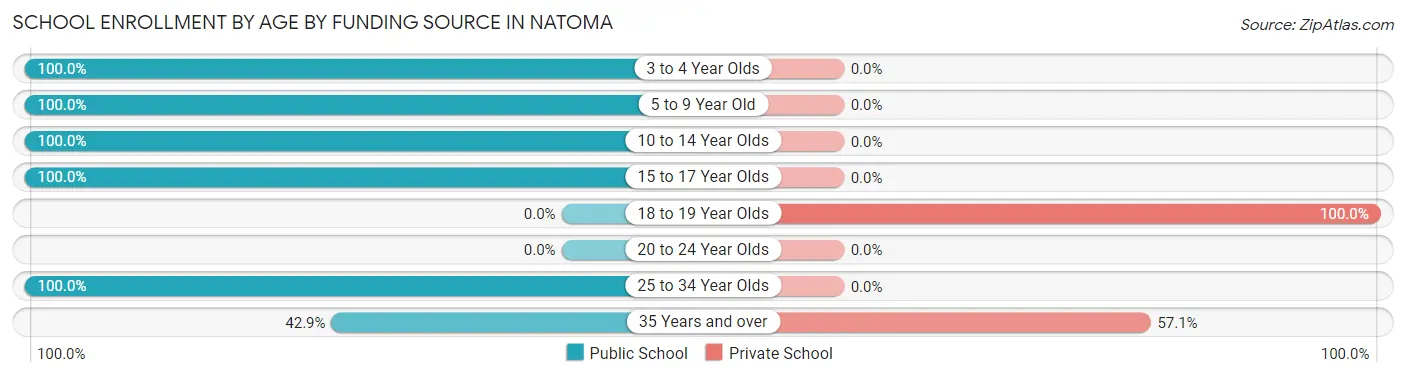
| Age Bracket | Public School | Private School |
| 3 to 4 Year Olds | 6 (100.0%) | 0 (0.0%) |
| 5 to 9 Year Old | 23 (100.0%) | 0 (0.0%) |
| 10 to 14 Year Olds | 76 (100.0%) | 0 (0.0%) |
| 15 to 17 Year Olds | 5 (100.0%) | 0 (0.0%) |
| 18 to 19 Year Olds | 0 (0.0%) | 2 (100.0%) |
| 20 to 24 Year Olds | 0 (0.0%) | 0 (0.0%) |
| 25 to 34 Year Olds | 5 (100.0%) | 0 (0.0%) |
| 35 Years and over | 3 (42.9%) | 4 (57.1%) |
| Total | 118 (95.2%) | 6 (4.8%) |
Educational Attainment by Field of Study in Natoma
Bio, nature & agricultural (17 | 30.4%), education (11 | 19.6%), engineering (8 | 14.3%), liberal arts & history (4 | 7.1%), and psychology (3 | 5.4%) are the most common fields of study among 56 individuals in Natoma who have obtained a bachelor's degree or higher.
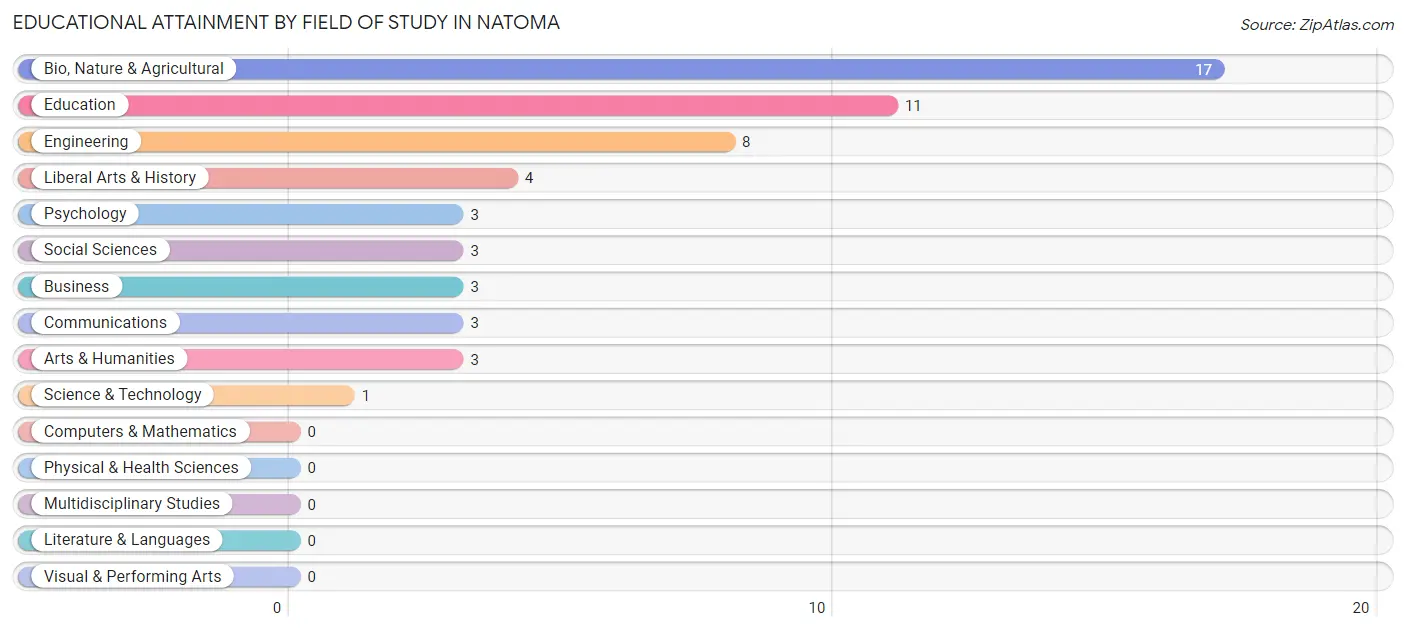
| Field of Study | # Graduates | % Graduates |
| Computers & Mathematics | 0 | 0.0% |
| Bio, Nature & Agricultural | 17 | 30.4% |
| Physical & Health Sciences | 0 | 0.0% |
| Psychology | 3 | 5.4% |
| Social Sciences | 3 | 5.4% |
| Engineering | 8 | 14.3% |
| Multidisciplinary Studies | 0 | 0.0% |
| Science & Technology | 1 | 1.8% |
| Business | 3 | 5.4% |
| Education | 11 | 19.6% |
| Literature & Languages | 0 | 0.0% |
| Liberal Arts & History | 4 | 7.1% |
| Visual & Performing Arts | 0 | 0.0% |
| Communications | 3 | 5.4% |
| Arts & Humanities | 3 | 5.4% |
| Total | 56 | 100.0% |
Transportation & Commute in Natoma
Vehicle Availability by Sex in Natoma
The most prevalent vehicle ownership categories in Natoma are males with 2 vehicles (47, accounting for 49.5%) and females with 2 vehicles (15, making up 71.2%).
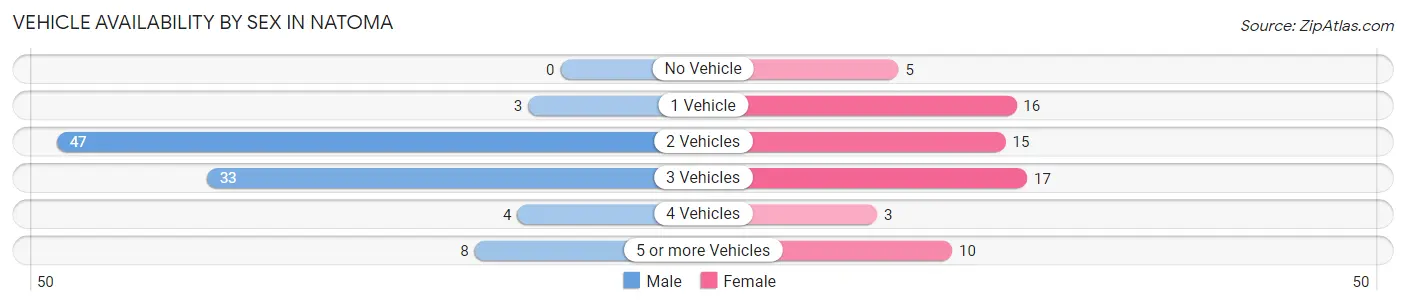
| Vehicles Available | Male | Female |
| No Vehicle | 0 (0.0%) | 5 (7.6%) |
| 1 Vehicle | 3 (3.2%) | 16 (24.2%) |
| 2 Vehicles | 47 (49.5%) | 15 (22.7%) |
| 3 Vehicles | 33 (34.7%) | 17 (25.8%) |
| 4 Vehicles | 4 (4.2%) | 3 (4.5%) |
| 5 or more Vehicles | 8 (8.4%) | 10 (15.1%) |
| Total | 95 (100.0%) | 66 (100.0%) |
Commute Time in Natoma
The most frequently occuring commute durations in Natoma are 5 to 9 minutes (70 commuters, 47.6%), less than 5 minutes (27 commuters, 18.4%), and 45 to 59 minutes (14 commuters, 9.5%).
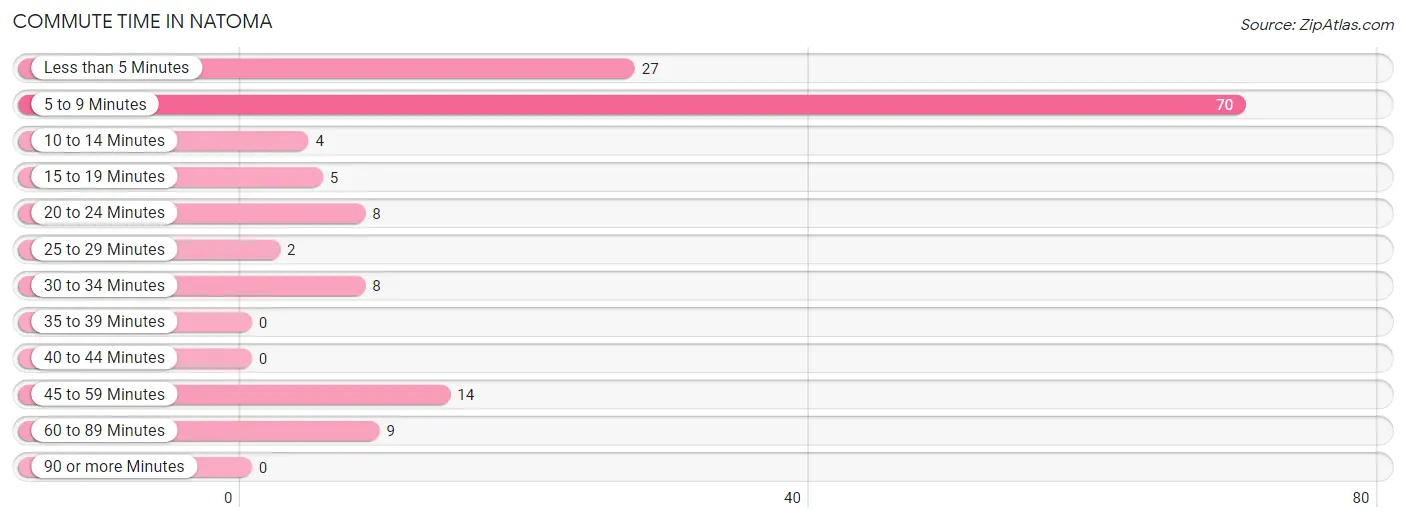
| Commute Time | # Commuters | % Commuters |
| Less than 5 Minutes | 27 | 18.4% |
| 5 to 9 Minutes | 70 | 47.6% |
| 10 to 14 Minutes | 4 | 2.7% |
| 15 to 19 Minutes | 5 | 3.4% |
| 20 to 24 Minutes | 8 | 5.4% |
| 25 to 29 Minutes | 2 | 1.4% |
| 30 to 34 Minutes | 8 | 5.4% |
| 35 to 39 Minutes | 0 | 0.0% |
| 40 to 44 Minutes | 0 | 0.0% |
| 45 to 59 Minutes | 14 | 9.5% |
| 60 to 89 Minutes | 9 | 6.1% |
| 90 or more Minutes | 0 | 0.0% |
Commute Time by Sex in Natoma
The most common commute times in Natoma are 5 to 9 minutes (48 commuters, 56.5%) for males and 5 to 9 minutes (22 commuters, 35.5%) for females.
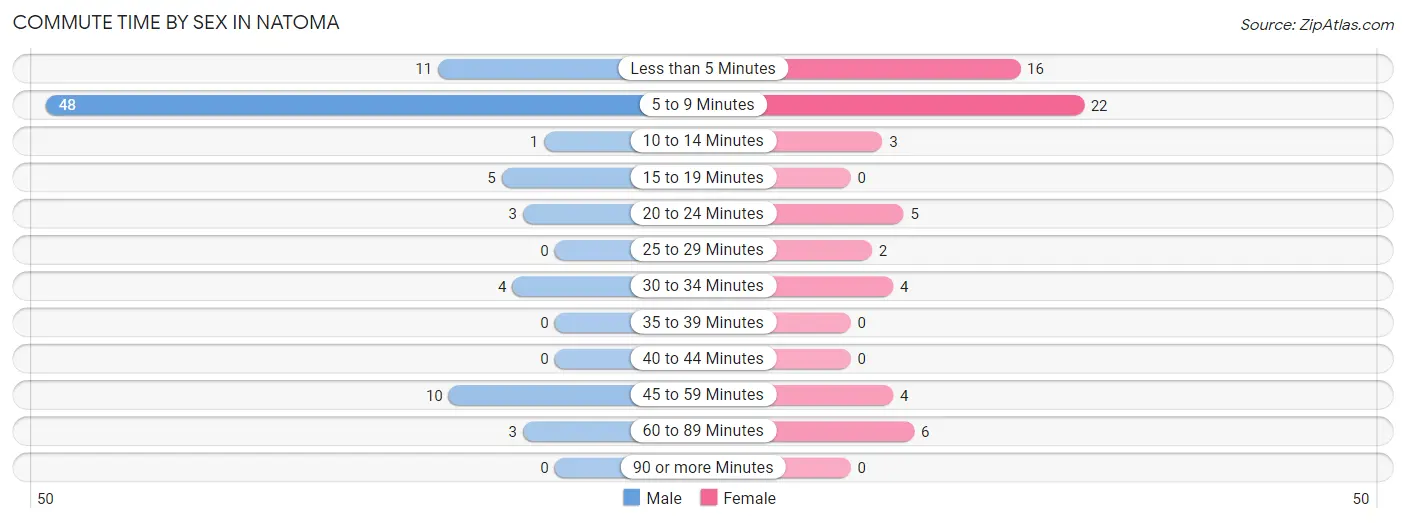
| Commute Time | Male | Female |
| Less than 5 Minutes | 11 (12.9%) | 16 (25.8%) |
| 5 to 9 Minutes | 48 (56.5%) | 22 (35.5%) |
| 10 to 14 Minutes | 1 (1.2%) | 3 (4.8%) |
| 15 to 19 Minutes | 5 (5.9%) | 0 (0.0%) |
| 20 to 24 Minutes | 3 (3.5%) | 5 (8.1%) |
| 25 to 29 Minutes | 0 (0.0%) | 2 (3.2%) |
| 30 to 34 Minutes | 4 (4.7%) | 4 (6.5%) |
| 35 to 39 Minutes | 0 (0.0%) | 0 (0.0%) |
| 40 to 44 Minutes | 0 (0.0%) | 0 (0.0%) |
| 45 to 59 Minutes | 10 (11.8%) | 4 (6.5%) |
| 60 to 89 Minutes | 3 (3.5%) | 6 (9.7%) |
| 90 or more Minutes | 0 (0.0%) | 0 (0.0%) |
Time of Departure to Work by Sex in Natoma
The most frequent times of departure to work in Natoma are 7:00 AM to 7:29 AM (42, 49.4%) for males and 7:30 AM to 7:59 AM (24, 38.7%) for females.
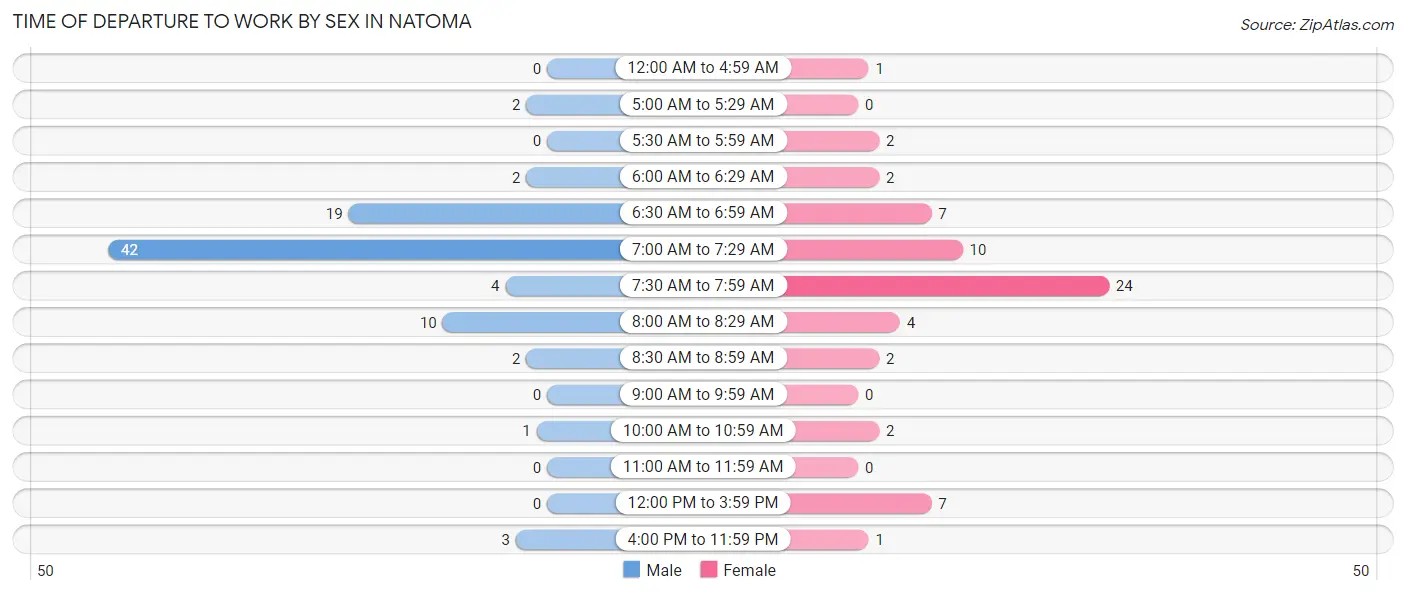
| Time of Departure | Male | Female |
| 12:00 AM to 4:59 AM | 0 (0.0%) | 1 (1.6%) |
| 5:00 AM to 5:29 AM | 2 (2.4%) | 0 (0.0%) |
| 5:30 AM to 5:59 AM | 0 (0.0%) | 2 (3.2%) |
| 6:00 AM to 6:29 AM | 2 (2.4%) | 2 (3.2%) |
| 6:30 AM to 6:59 AM | 19 (22.4%) | 7 (11.3%) |
| 7:00 AM to 7:29 AM | 42 (49.4%) | 10 (16.1%) |
| 7:30 AM to 7:59 AM | 4 (4.7%) | 24 (38.7%) |
| 8:00 AM to 8:29 AM | 10 (11.8%) | 4 (6.5%) |
| 8:30 AM to 8:59 AM | 2 (2.4%) | 2 (3.2%) |
| 9:00 AM to 9:59 AM | 0 (0.0%) | 0 (0.0%) |
| 10:00 AM to 10:59 AM | 1 (1.2%) | 2 (3.2%) |
| 11:00 AM to 11:59 AM | 0 (0.0%) | 0 (0.0%) |
| 12:00 PM to 3:59 PM | 0 (0.0%) | 7 (11.3%) |
| 4:00 PM to 11:59 PM | 3 (3.5%) | 1 (1.6%) |
| Total | 85 (100.0%) | 62 (100.0%) |
Housing Occupancy in Natoma
Occupancy by Ownership in Natoma
Of the total 180 dwellings in Natoma, owner-occupied units account for 147 (81.7%), while renter-occupied units make up 33 (18.3%).
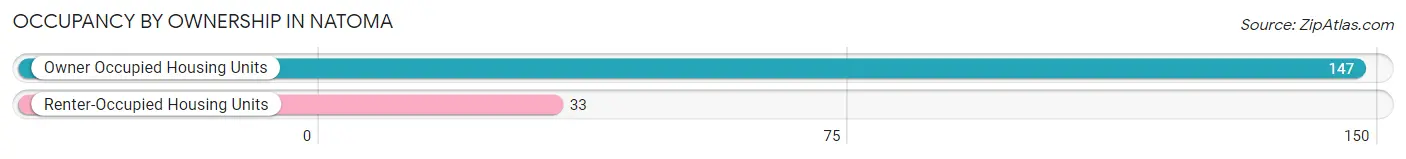
| Occupancy | # Housing Units | % Housing Units |
| Owner Occupied Housing Units | 147 | 81.7% |
| Renter-Occupied Housing Units | 33 | 18.3% |
| Total Occupied Housing Units | 180 | 100.0% |
Occupancy by Household Size in Natoma
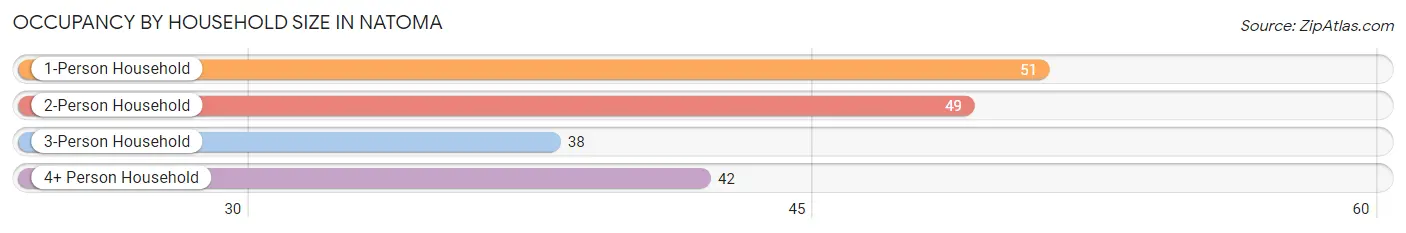
| Household Size | # Housing Units | % Housing Units |
| 1-Person Household | 51 | 28.3% |
| 2-Person Household | 49 | 27.2% |
| 3-Person Household | 38 | 21.1% |
| 4+ Person Household | 42 | 23.3% |
| Total Housing Units | 180 | 100.0% |
Occupancy by Ownership by Household Size in Natoma
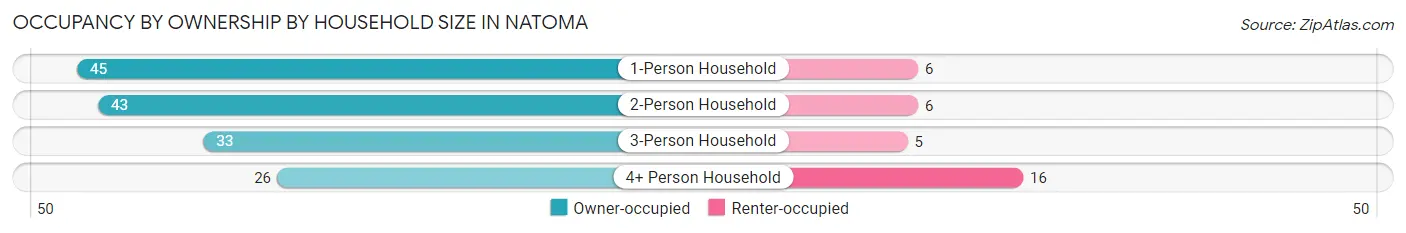
| Household Size | Owner-occupied | Renter-occupied |
| 1-Person Household | 45 (88.2%) | 6 (11.8%) |
| 2-Person Household | 43 (87.8%) | 6 (12.2%) |
| 3-Person Household | 33 (86.8%) | 5 (13.2%) |
| 4+ Person Household | 26 (61.9%) | 16 (38.1%) |
| Total Housing Units | 147 (81.7%) | 33 (18.3%) |
Occupancy by Educational Attainment in Natoma
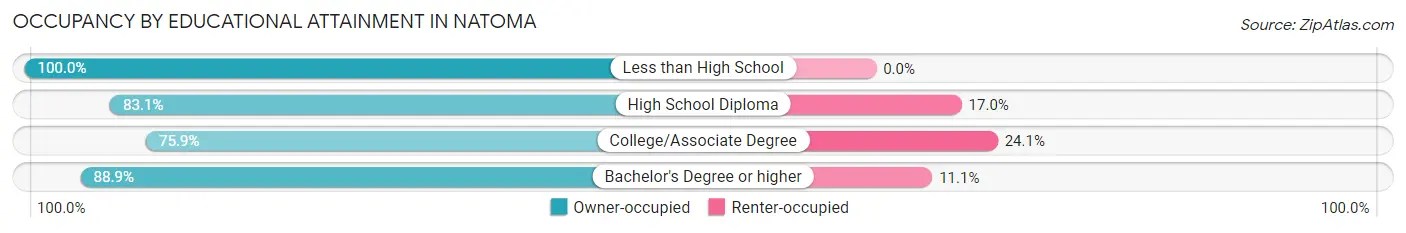
| Household Size | Owner-occupied | Renter-occupied |
| Less than High School | 11 (100.0%) | 0 (0.0%) |
| High School Diploma | 49 (83.1%) | 10 (17.0%) |
| College/Associate Degree | 63 (75.9%) | 20 (24.1%) |
| Bachelor's Degree or higher | 24 (88.9%) | 3 (11.1%) |
Occupancy by Age of Householder in Natoma
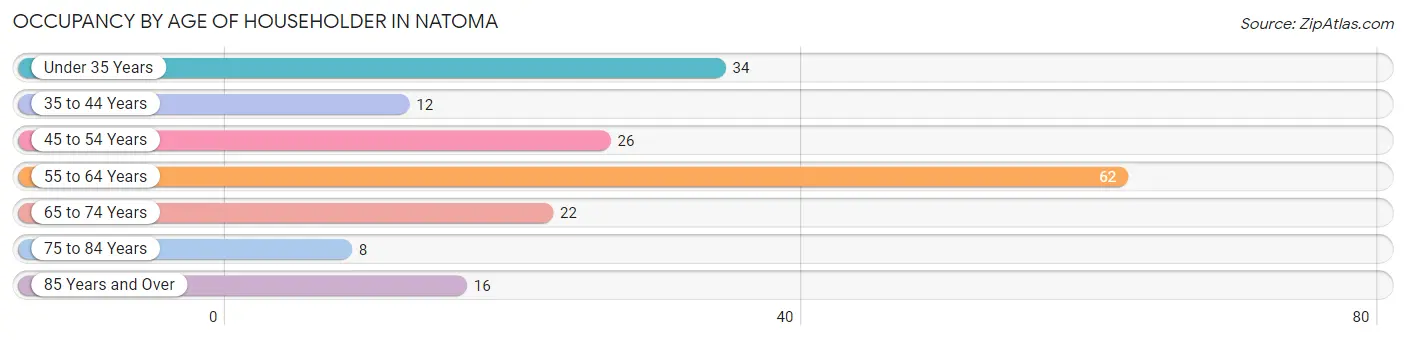
| Age Bracket | # Households | % Households |
| Under 35 Years | 34 | 18.9% |
| 35 to 44 Years | 12 | 6.7% |
| 45 to 54 Years | 26 | 14.4% |
| 55 to 64 Years | 62 | 34.4% |
| 65 to 74 Years | 22 | 12.2% |
| 75 to 84 Years | 8 | 4.4% |
| 85 Years and Over | 16 | 8.9% |
| Total | 180 | 100.0% |
Housing Finances in Natoma
Median Income by Occupancy in Natoma
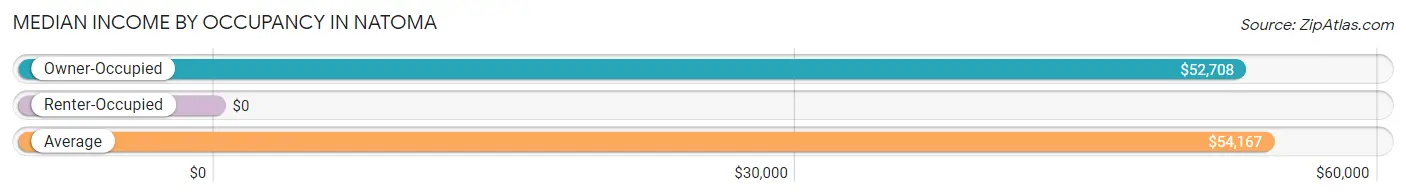
| Occupancy Type | # Households | Median Income |
| Owner-Occupied | 147 (81.7%) | $52,708 |
| Renter-Occupied | 33 (18.3%) | $0 |
| Average | 180 (100.0%) | $54,167 |
Occupancy by Householder Income Bracket in Natoma
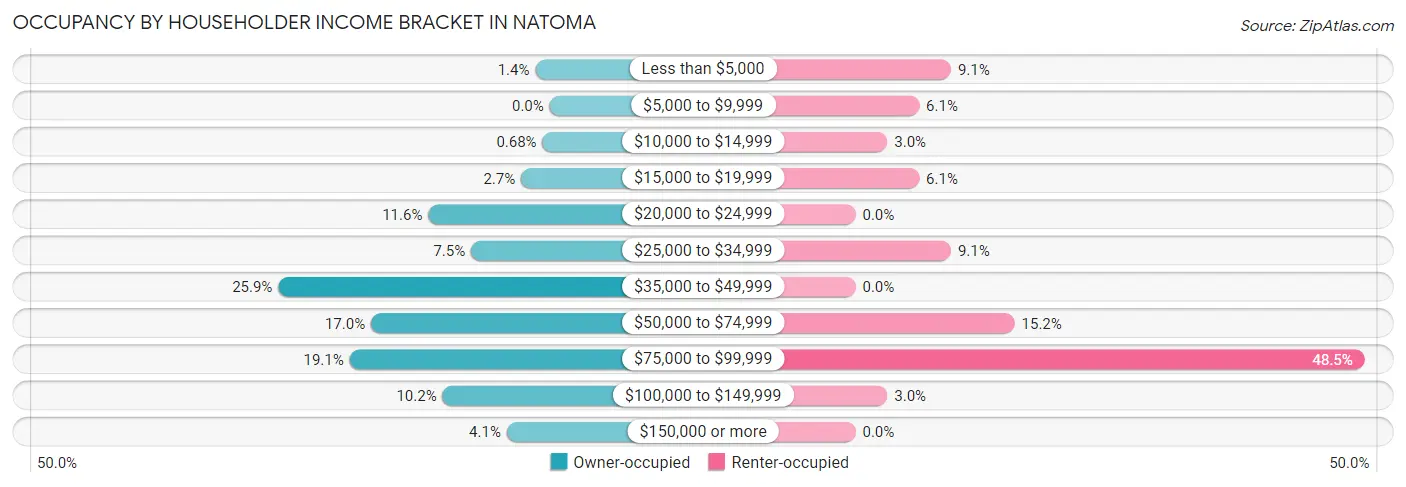
| Income Bracket | Owner-occupied | Renter-occupied |
| Less than $5,000 | 2 (1.4%) | 3 (9.1%) |
| $5,000 to $9,999 | 0 (0.0%) | 2 (6.1%) |
| $10,000 to $14,999 | 1 (0.7%) | 1 (3.0%) |
| $15,000 to $19,999 | 4 (2.7%) | 2 (6.1%) |
| $20,000 to $24,999 | 17 (11.6%) | 0 (0.0%) |
| $25,000 to $34,999 | 11 (7.5%) | 3 (9.1%) |
| $35,000 to $49,999 | 38 (25.9%) | 0 (0.0%) |
| $50,000 to $74,999 | 25 (17.0%) | 5 (15.1%) |
| $75,000 to $99,999 | 28 (19.1%) | 16 (48.5%) |
| $100,000 to $149,999 | 15 (10.2%) | 1 (3.0%) |
| $150,000 or more | 6 (4.1%) | 0 (0.0%) |
| Total | 147 (100.0%) | 33 (100.0%) |
Monthly Housing Cost Tiers in Natoma
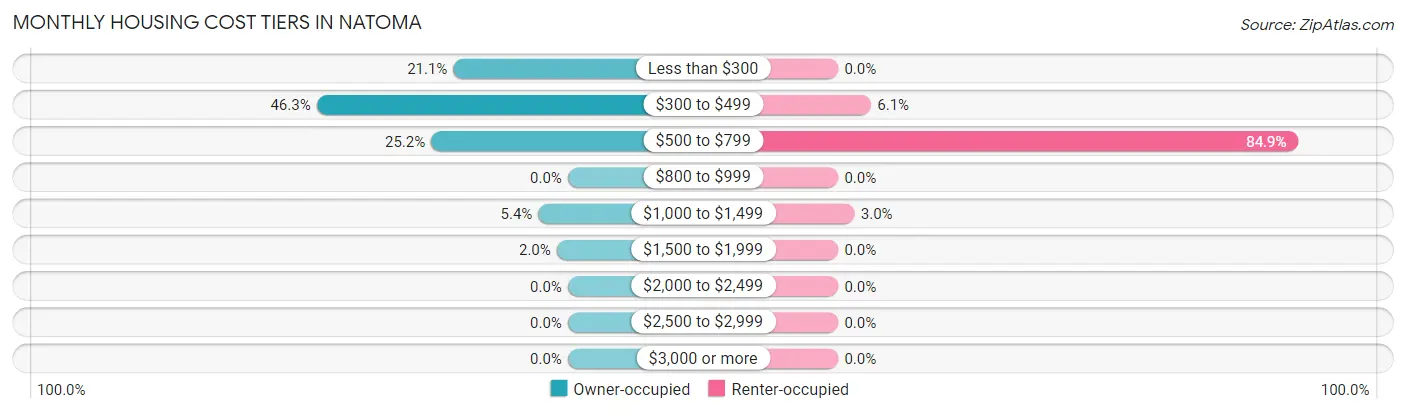
| Monthly Cost | Owner-occupied | Renter-occupied |
| Less than $300 | 31 (21.1%) | 0 (0.0%) |
| $300 to $499 | 68 (46.3%) | 2 (6.1%) |
| $500 to $799 | 37 (25.2%) | 28 (84.9%) |
| $800 to $999 | 0 (0.0%) | 0 (0.0%) |
| $1,000 to $1,499 | 8 (5.4%) | 1 (3.0%) |
| $1,500 to $1,999 | 3 (2.0%) | 0 (0.0%) |
| $2,000 to $2,499 | 0 (0.0%) | 0 (0.0%) |
| $2,500 to $2,999 | 0 (0.0%) | 0 (0.0%) |
| $3,000 or more | 0 (0.0%) | 0 (0.0%) |
| Total | 147 (100.0%) | 33 (100.0%) |
Physical Housing Characteristics in Natoma
Housing Structures in Natoma
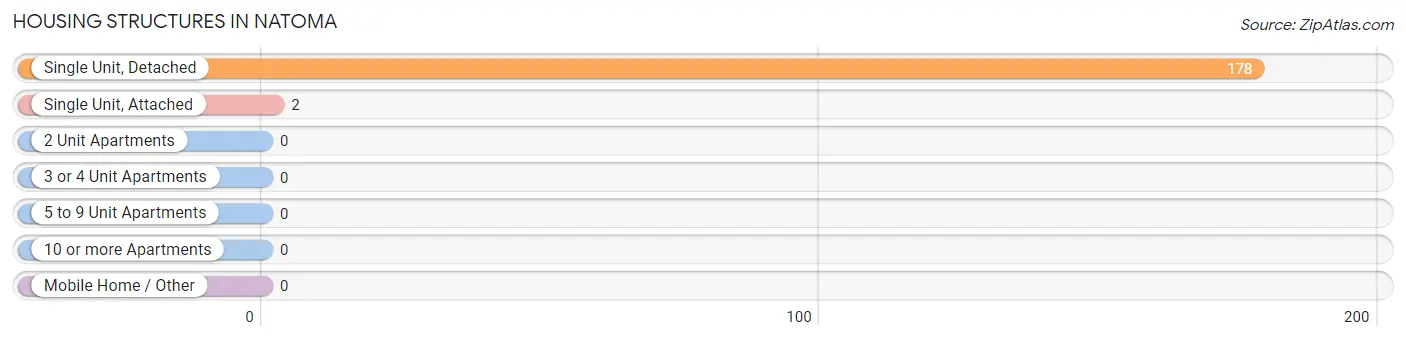
| Structure Type | # Housing Units | % Housing Units |
| Single Unit, Detached | 178 | 98.9% |
| Single Unit, Attached | 2 | 1.1% |
| 2 Unit Apartments | 0 | 0.0% |
| 3 or 4 Unit Apartments | 0 | 0.0% |
| 5 to 9 Unit Apartments | 0 | 0.0% |
| 10 or more Apartments | 0 | 0.0% |
| Mobile Home / Other | 0 | 0.0% |
| Total | 180 | 100.0% |
Housing Structures by Occupancy in Natoma
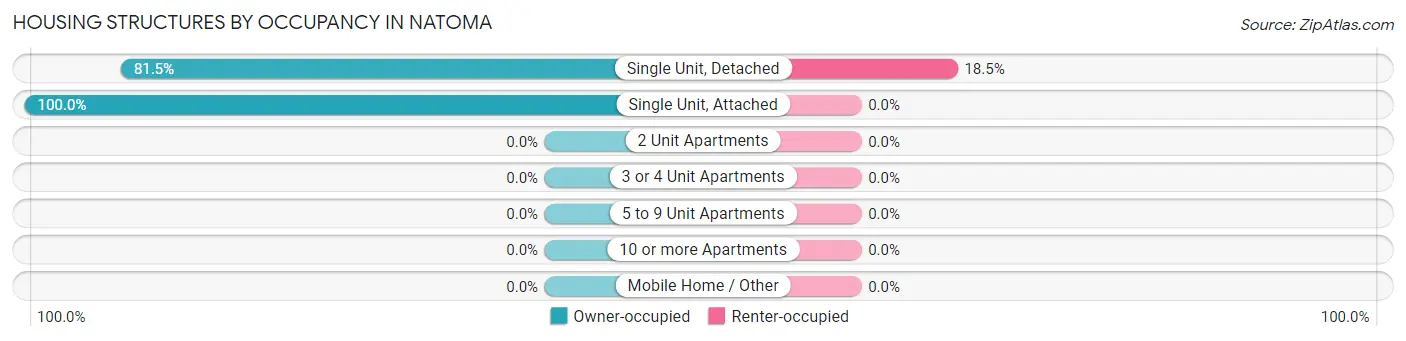
| Structure Type | Owner-occupied | Renter-occupied |
| Single Unit, Detached | 145 (81.5%) | 33 (18.5%) |
| Single Unit, Attached | 2 (100.0%) | 0 (0.0%) |
| 2 Unit Apartments | 0 (0.0%) | 0 (0.0%) |
| 3 or 4 Unit Apartments | 0 (0.0%) | 0 (0.0%) |
| 5 to 9 Unit Apartments | 0 (0.0%) | 0 (0.0%) |
| 10 or more Apartments | 0 (0.0%) | 0 (0.0%) |
| Mobile Home / Other | 0 (0.0%) | 0 (0.0%) |
| Total | 147 (81.7%) | 33 (18.3%) |
Housing Structures by Number of Rooms in Natoma
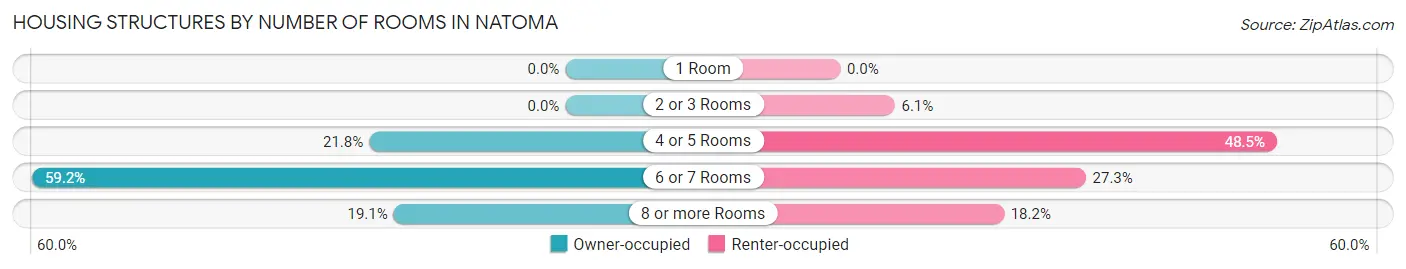
| Number of Rooms | Owner-occupied | Renter-occupied |
| 1 Room | 0 (0.0%) | 0 (0.0%) |
| 2 or 3 Rooms | 0 (0.0%) | 2 (6.1%) |
| 4 or 5 Rooms | 32 (21.8%) | 16 (48.5%) |
| 6 or 7 Rooms | 87 (59.2%) | 9 (27.3%) |
| 8 or more Rooms | 28 (19.1%) | 6 (18.2%) |
| Total | 147 (100.0%) | 33 (100.0%) |
Housing Structure by Heating Type in Natoma
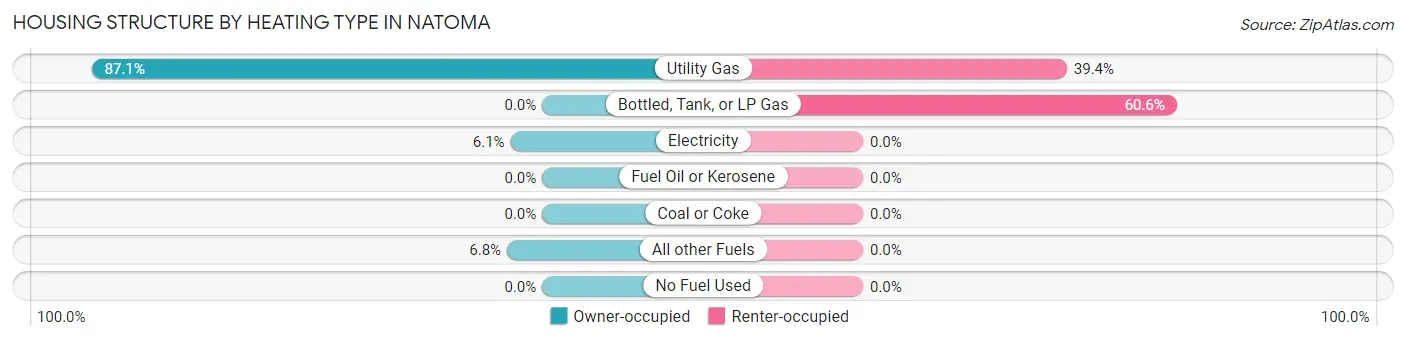
| Heating Type | Owner-occupied | Renter-occupied |
| Utility Gas | 128 (87.1%) | 13 (39.4%) |
| Bottled, Tank, or LP Gas | 0 (0.0%) | 20 (60.6%) |
| Electricity | 9 (6.1%) | 0 (0.0%) |
| Fuel Oil or Kerosene | 0 (0.0%) | 0 (0.0%) |
| Coal or Coke | 0 (0.0%) | 0 (0.0%) |
| All other Fuels | 10 (6.8%) | 0 (0.0%) |
| No Fuel Used | 0 (0.0%) | 0 (0.0%) |
| Total | 147 (100.0%) | 33 (100.0%) |
Household Vehicle Usage in Natoma
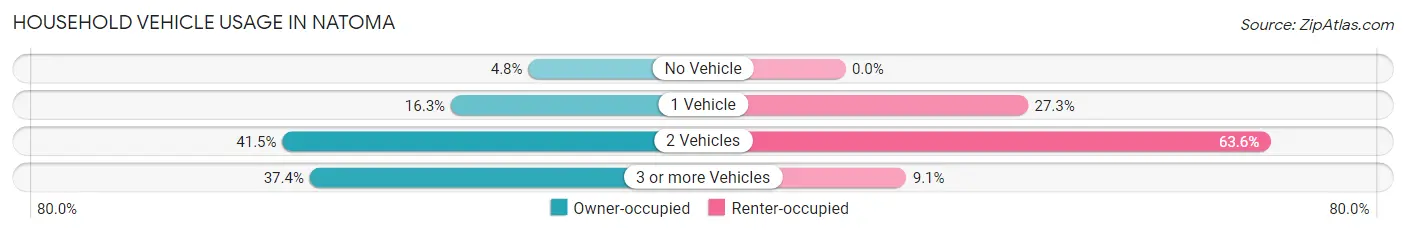
| Vehicles per Household | Owner-occupied | Renter-occupied |
| No Vehicle | 7 (4.8%) | 0 (0.0%) |
| 1 Vehicle | 24 (16.3%) | 9 (27.3%) |
| 2 Vehicles | 61 (41.5%) | 21 (63.6%) |
| 3 or more Vehicles | 55 (37.4%) | 3 (9.1%) |
| Total | 147 (100.0%) | 33 (100.0%) |
Real Estate & Mortgages in Natoma
Real Estate and Mortgage Overview in Natoma
| Characteristic | Without Mortgage | With Mortgage |
| Housing Units | 89 | 58 |
| Median Property Value | $40,300 | $25,000 |
| Median Household Income | $46,806 | $3 |
| Monthly Housing Costs | $345 | $0 |
| Real Estate Taxes | $556 | $0 |
Property Value by Mortgage Status in Natoma
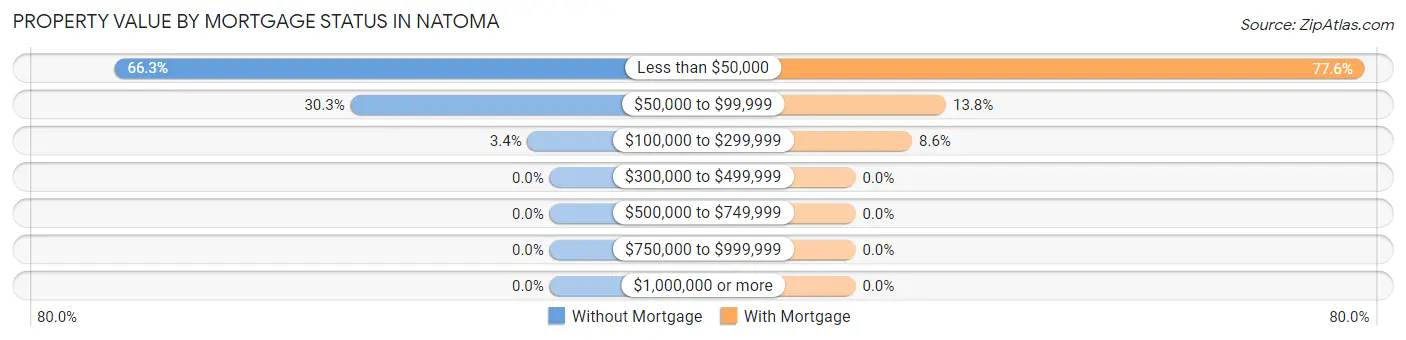
| Property Value | Without Mortgage | With Mortgage |
| Less than $50,000 | 59 (66.3%) | 45 (77.6%) |
| $50,000 to $99,999 | 27 (30.3%) | 8 (13.8%) |
| $100,000 to $299,999 | 3 (3.4%) | 5 (8.6%) |
| $300,000 to $499,999 | 0 (0.0%) | 0 (0.0%) |
| $500,000 to $749,999 | 0 (0.0%) | 0 (0.0%) |
| $750,000 to $999,999 | 0 (0.0%) | 0 (0.0%) |
| $1,000,000 or more | 0 (0.0%) | 0 (0.0%) |
| Total | 89 (100.0%) | 58 (100.0%) |
Household Income by Mortgage Status in Natoma
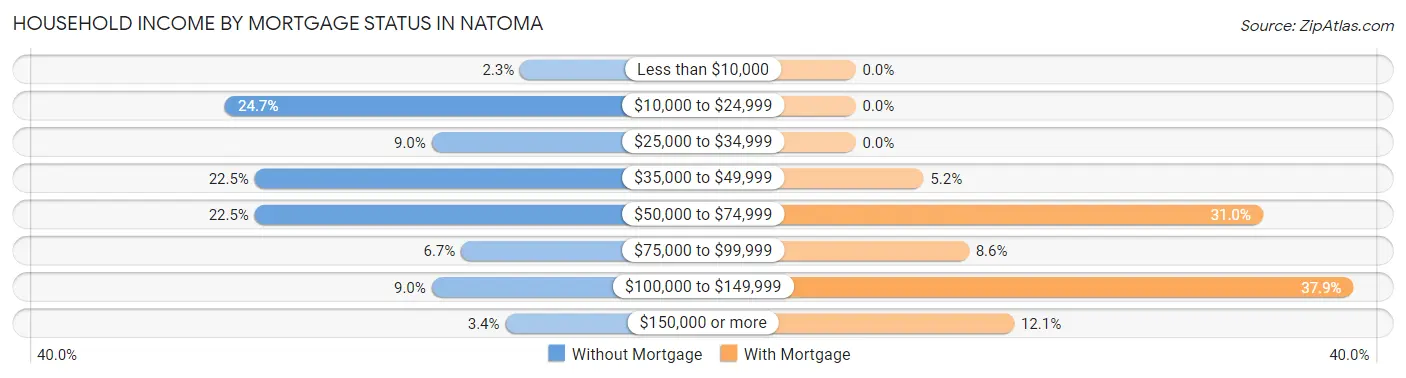
| Household Income | Without Mortgage | With Mortgage |
| Less than $10,000 | 2 (2.2%) | 0 (0.0%) |
| $10,000 to $24,999 | 22 (24.7%) | 0 (0.0%) |
| $25,000 to $34,999 | 8 (9.0%) | 0 (0.0%) |
| $35,000 to $49,999 | 20 (22.5%) | 3 (5.2%) |
| $50,000 to $74,999 | 20 (22.5%) | 18 (31.0%) |
| $75,000 to $99,999 | 6 (6.7%) | 5 (8.6%) |
| $100,000 to $149,999 | 8 (9.0%) | 22 (37.9%) |
| $150,000 or more | 3 (3.4%) | 7 (12.1%) |
| Total | 89 (100.0%) | 58 (100.0%) |
Property Value to Household Income Ratio in Natoma
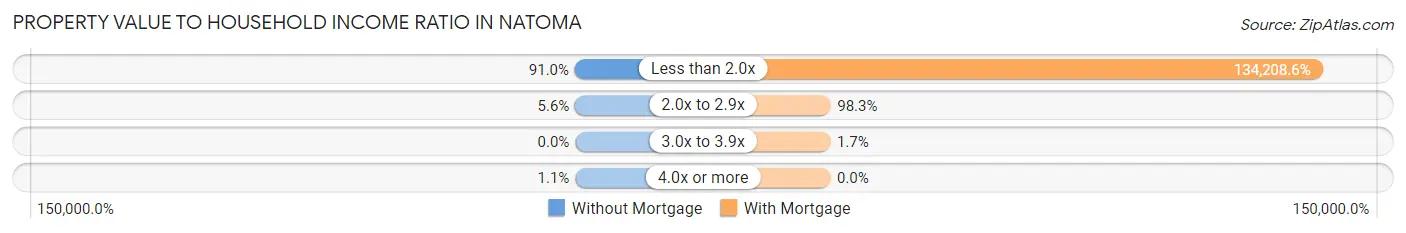
| Value-to-Income Ratio | Without Mortgage | With Mortgage |
| Less than 2.0x | 81 (91.0%) | 77,841 (134,208.6%) |
| 2.0x to 2.9x | 5 (5.6%) | 57 (98.3%) |
| 3.0x to 3.9x | 0 (0.0%) | 1 (1.7%) |
| 4.0x or more | 1 (1.1%) | 0 (0.0%) |
| Total | 89 (100.0%) | 58 (100.0%) |
Real Estate Taxes by Mortgage Status in Natoma
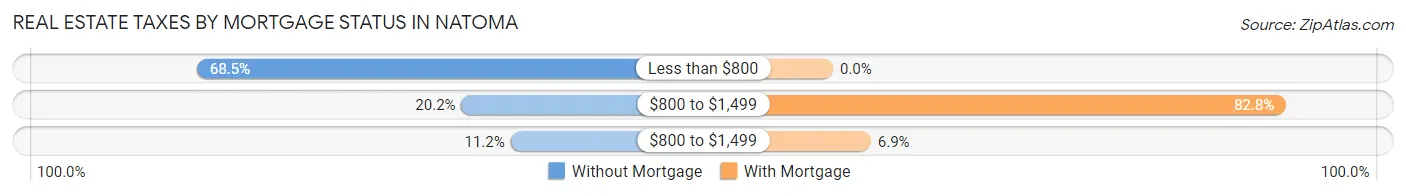
| Property Taxes | Without Mortgage | With Mortgage |
| Less than $800 | 61 (68.5%) | 0 (0.0%) |
| $800 to $1,499 | 18 (20.2%) | 48 (82.8%) |
| $800 to $1,499 | 10 (11.2%) | 4 (6.9%) |
| Total | 89 (100.0%) | 58 (100.0%) |
Health & Disability in Natoma
Health Insurance Coverage by Age in Natoma
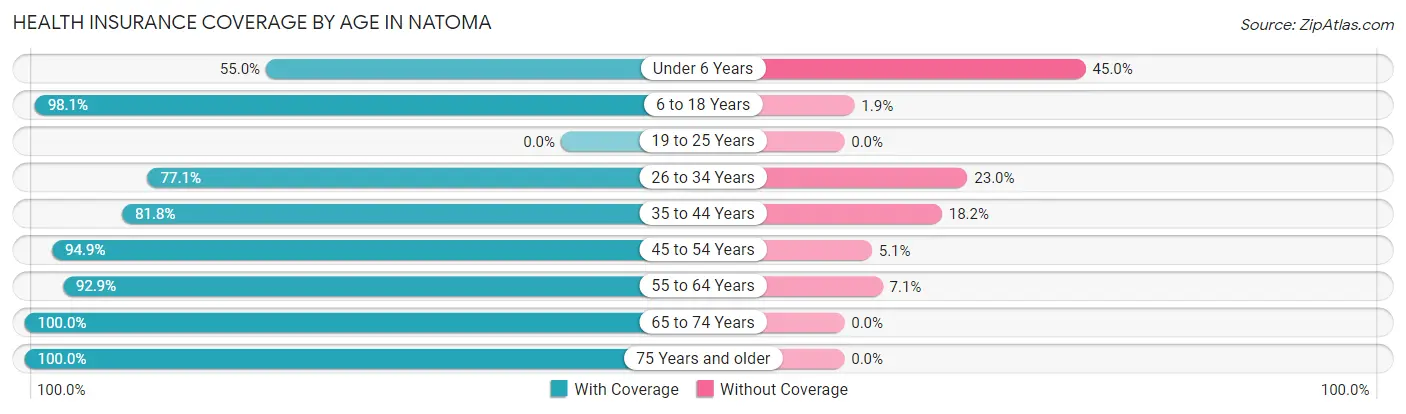
| Age Bracket | With Coverage | Without Coverage |
| Under 6 Years | 11 (55.0%) | 9 (45.0%) |
| 6 to 18 Years | 104 (98.1%) | 2 (1.9%) |
| 19 to 25 Years | 0 (0.0%) | 0 (0.0%) |
| 26 to 34 Years | 47 (77.0%) | 14 (23.0%) |
| 35 to 44 Years | 18 (81.8%) | 4 (18.2%) |
| 45 to 54 Years | 37 (94.9%) | 2 (5.1%) |
| 55 to 64 Years | 78 (92.9%) | 6 (7.1%) |
| 65 to 74 Years | 26 (100.0%) | 0 (0.0%) |
| 75 Years and older | 42 (100.0%) | 0 (0.0%) |
| Total | 363 (90.7%) | 37 (9.2%) |
Health Insurance Coverage by Citizenship Status in Natoma
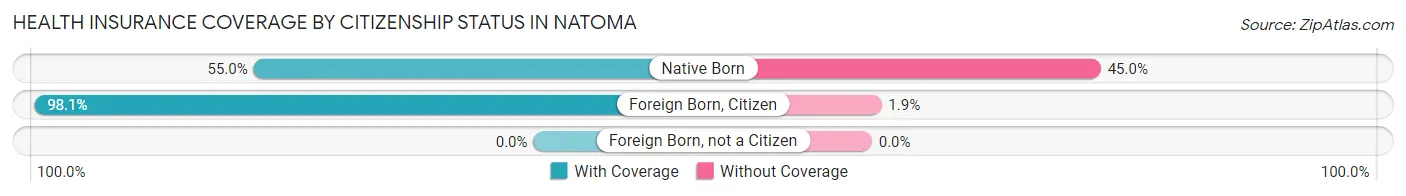
| Citizenship Status | With Coverage | Without Coverage |
| Native Born | 11 (55.0%) | 9 (45.0%) |
| Foreign Born, Citizen | 104 (98.1%) | 2 (1.9%) |
| Foreign Born, not a Citizen | 0 (0.0%) | 0 (0.0%) |
Health Insurance Coverage by Household Income in Natoma
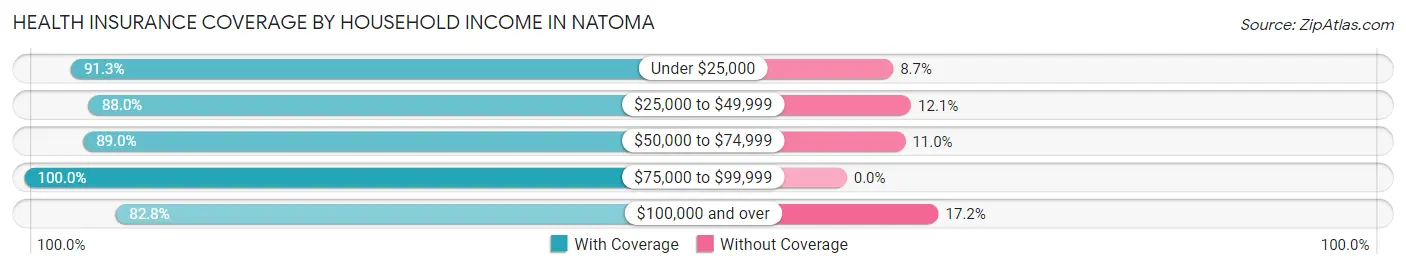
| Household Income | With Coverage | Without Coverage |
| Under $25,000 | 63 (91.3%) | 6 (8.7%) |
| $25,000 to $49,999 | 73 (87.9%) | 10 (12.0%) |
| $50,000 to $74,999 | 81 (89.0%) | 10 (11.0%) |
| $75,000 to $99,999 | 93 (100.0%) | 0 (0.0%) |
| $100,000 and over | 53 (82.8%) | 11 (17.2%) |
Public vs Private Health Insurance Coverage by Age in Natoma
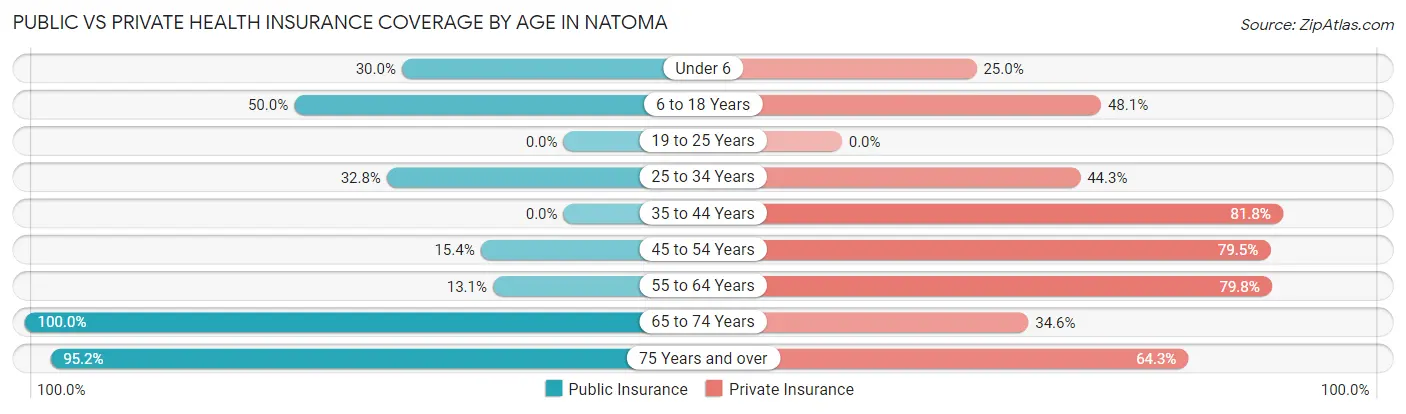
| Age Bracket | Public Insurance | Private Insurance |
| Under 6 | 6 (30.0%) | 5 (25.0%) |
| 6 to 18 Years | 53 (50.0%) | 51 (48.1%) |
| 19 to 25 Years | 0 (0.0%) | 0 (0.0%) |
| 25 to 34 Years | 20 (32.8%) | 27 (44.3%) |
| 35 to 44 Years | 0 (0.0%) | 18 (81.8%) |
| 45 to 54 Years | 6 (15.4%) | 31 (79.5%) |
| 55 to 64 Years | 11 (13.1%) | 67 (79.8%) |
| 65 to 74 Years | 26 (100.0%) | 9 (34.6%) |
| 75 Years and over | 40 (95.2%) | 27 (64.3%) |
| Total | 162 (40.5%) | 235 (58.8%) |
Disability Status by Sex by Age in Natoma
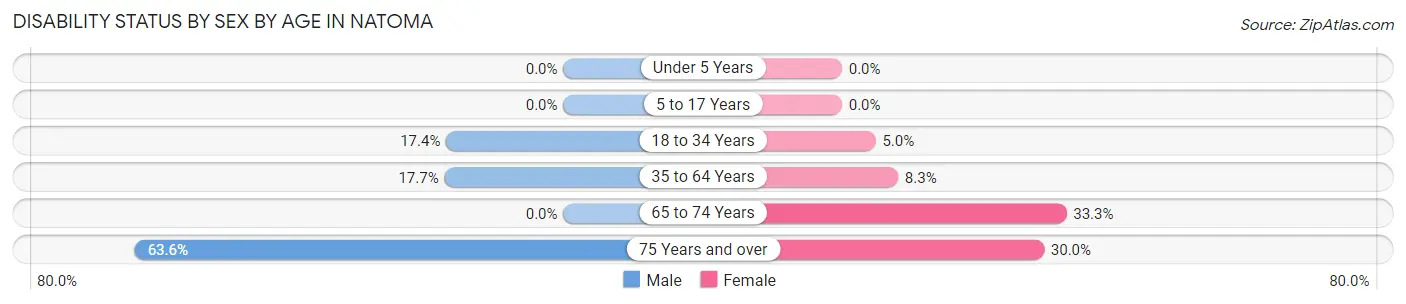
| Age Bracket | Male | Female |
| Under 5 Years | 0 (0.0%) | 0 (0.0%) |
| 5 to 17 Years | 0 (0.0%) | 0 (0.0%) |
| 18 to 34 Years | 4 (17.4%) | 2 (5.0%) |
| 35 to 64 Years | 15 (17.6%) | 5 (8.3%) |
| 65 to 74 Years | 0 (0.0%) | 4 (33.3%) |
| 75 Years and over | 14 (63.6%) | 6 (30.0%) |
Disability Class by Sex by Age in Natoma
Disability Class: Hearing Difficulty
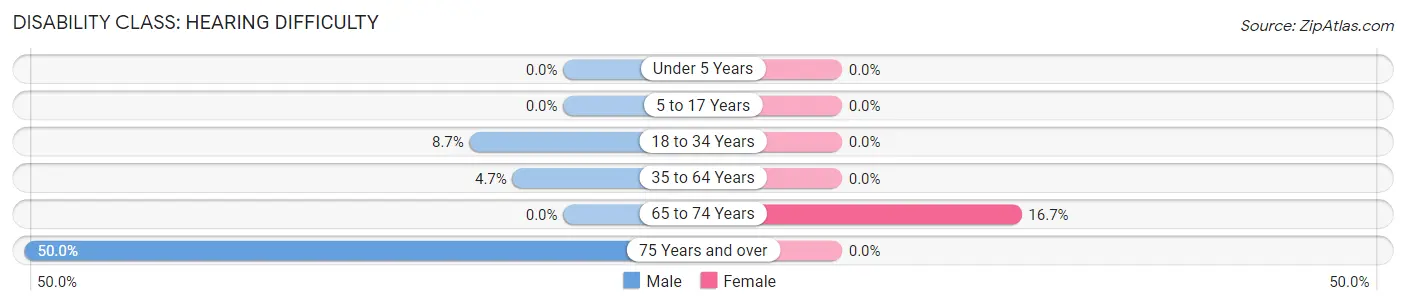
| Age Bracket | Male | Female |
| Under 5 Years | 0 (0.0%) | 0 (0.0%) |
| 5 to 17 Years | 0 (0.0%) | 0 (0.0%) |
| 18 to 34 Years | 2 (8.7%) | 0 (0.0%) |
| 35 to 64 Years | 4 (4.7%) | 0 (0.0%) |
| 65 to 74 Years | 0 (0.0%) | 2 (16.7%) |
| 75 Years and over | 11 (50.0%) | 0 (0.0%) |
Disability Class: Vision Difficulty
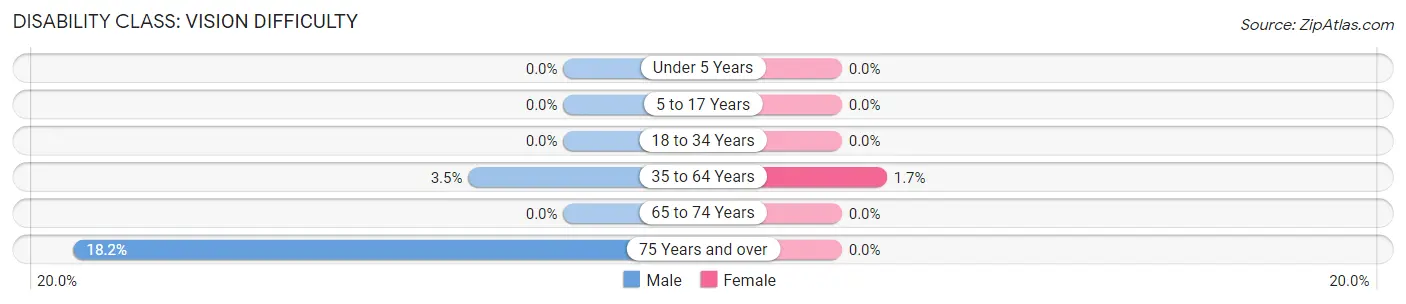
| Age Bracket | Male | Female |
| Under 5 Years | 0 (0.0%) | 0 (0.0%) |
| 5 to 17 Years | 0 (0.0%) | 0 (0.0%) |
| 18 to 34 Years | 0 (0.0%) | 0 (0.0%) |
| 35 to 64 Years | 3 (3.5%) | 1 (1.7%) |
| 65 to 74 Years | 0 (0.0%) | 0 (0.0%) |
| 75 Years and over | 4 (18.2%) | 0 (0.0%) |
Disability Class: Cognitive Difficulty
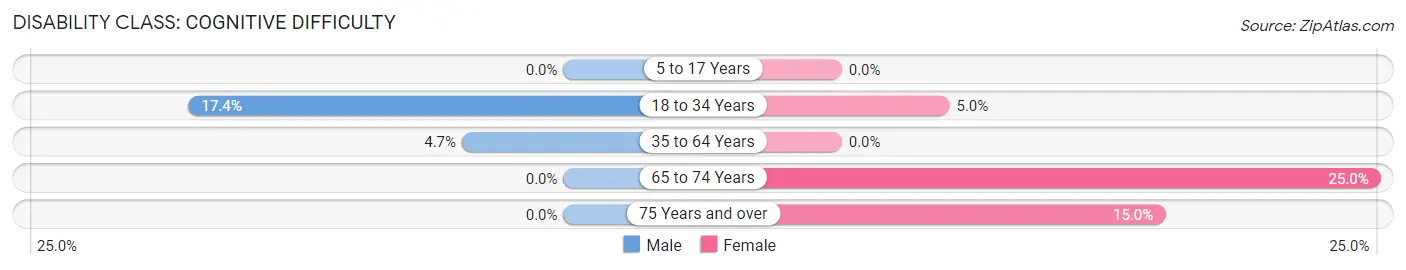
| Age Bracket | Male | Female |
| 5 to 17 Years | 0 (0.0%) | 0 (0.0%) |
| 18 to 34 Years | 4 (17.4%) | 2 (5.0%) |
| 35 to 64 Years | 4 (4.7%) | 0 (0.0%) |
| 65 to 74 Years | 0 (0.0%) | 3 (25.0%) |
| 75 Years and over | 0 (0.0%) | 3 (15.0%) |
Disability Class: Ambulatory Difficulty
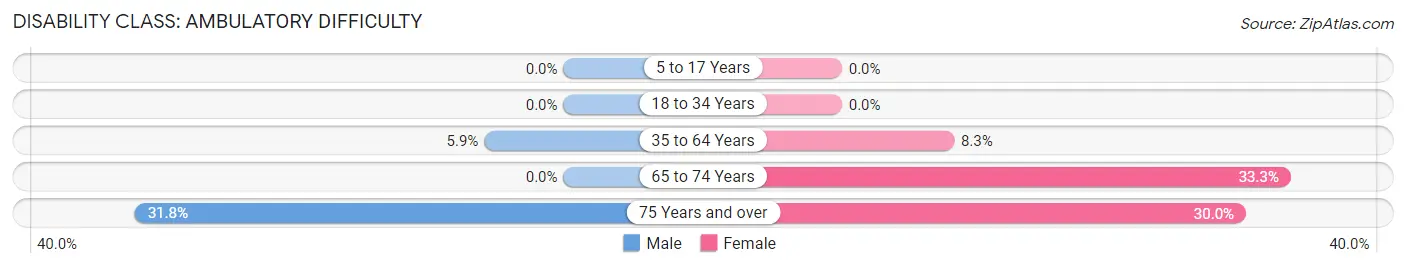
| Age Bracket | Male | Female |
| 5 to 17 Years | 0 (0.0%) | 0 (0.0%) |
| 18 to 34 Years | 0 (0.0%) | 0 (0.0%) |
| 35 to 64 Years | 5 (5.9%) | 5 (8.3%) |
| 65 to 74 Years | 0 (0.0%) | 4 (33.3%) |
| 75 Years and over | 7 (31.8%) | 6 (30.0%) |
Disability Class: Self-Care Difficulty
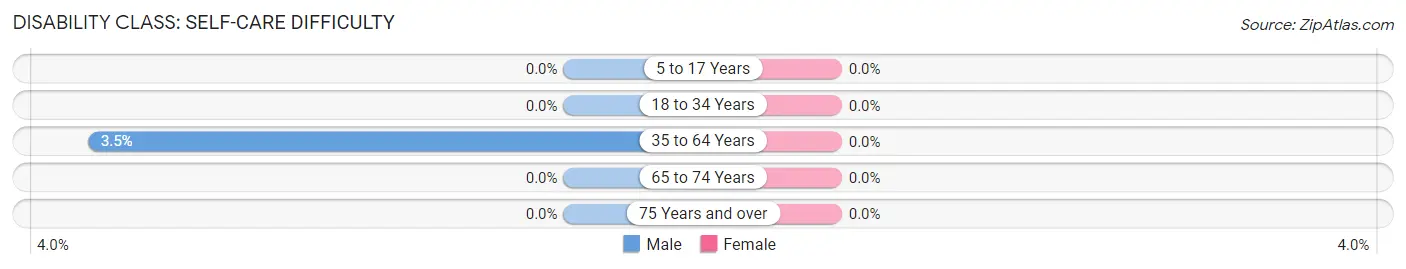
| Age Bracket | Male | Female |
| 5 to 17 Years | 0 (0.0%) | 0 (0.0%) |
| 18 to 34 Years | 0 (0.0%) | 0 (0.0%) |
| 35 to 64 Years | 3 (3.5%) | 0 (0.0%) |
| 65 to 74 Years | 0 (0.0%) | 0 (0.0%) |
| 75 Years and over | 0 (0.0%) | 0 (0.0%) |
Technology Access in Natoma
Computing Device Access in Natoma
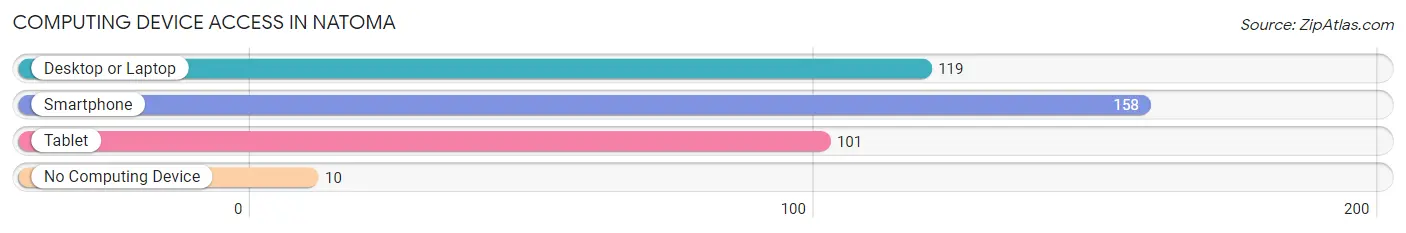
| Device Type | # Households | % Households |
| Desktop or Laptop | 119 | 66.1% |
| Smartphone | 158 | 87.8% |
| Tablet | 101 | 56.1% |
| No Computing Device | 10 | 5.6% |
| Total | 180 | 100.0% |
Internet Access in Natoma
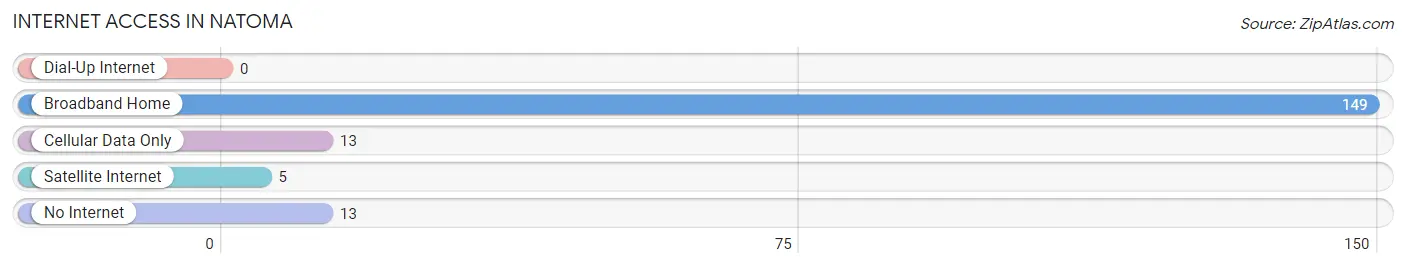
| Internet Type | # Households | % Households |
| Dial-Up Internet | 0 | 0.0% |
| Broadband Home | 149 | 82.8% |
| Cellular Data Only | 13 | 7.2% |
| Satellite Internet | 5 | 2.8% |
| No Internet | 13 | 7.2% |
| Total | 180 | 100.0% |
Natoma Summary
History
The small town of Natoma, Kansas is located in the northwest corner of Osborne County. It was founded in 1887 by the Union Pacific Railroad and was named after the daughter of a railroad official. The town was originally a stop on the Union Pacific Railroad, but it quickly grew into a small farming community.
The first settlers in Natoma were mostly German immigrants who had come to the area in search of a better life. They were attracted to the area because of its fertile soil and abundant water supply. The settlers quickly established a thriving agricultural community, growing wheat, corn, and other crops.
In the early 1900s, Natoma began to experience a period of growth and prosperity. The town was home to several businesses, including a bank, a hotel, a general store, and a blacksmith shop. The town also had a school, a post office, and a newspaper.
In the 1920s, the town experienced a period of decline as the railroad industry began to decline. The Great Depression further exacerbated the town’s economic woes. However, the town was able to survive and eventually began to experience a period of growth and prosperity once again.
In the 1950s, the town experienced a period of growth and development. The town was home to several businesses, including a grocery store, a hardware store, and a movie theater. The town also had a library, a hospital, and a fire station.
In the 1960s, the town experienced a period of decline as the railroad industry continued to decline. However, the town was able to survive and eventually began to experience a period of growth and prosperity once again.
In the 1970s, the town experienced a period of growth and development. The town was home to several businesses, including a grocery store, a hardware store, and a movie theater. The town also had a library, a hospital, and a fire station.
In the 1980s, the town experienced a period of decline as the railroad industry continued to decline. However, the town was able to survive and eventually began to experience a period of growth and prosperity once again.
In the 1990s, the town experienced a period of growth and development. The town was home to several businesses, including a grocery store, a hardware store, and a movie theater. The town also had a library, a hospital, and a fire station.
Geography
Natoma is located in the northwest corner of Osborne County, Kansas. It is situated on the banks of the Solomon River, which flows through the town. The town is located in the Central Plains region of the state, which is characterized by rolling hills and flat plains.
The town is located at an elevation of 1,845 feet above sea level. The climate in Natoma is characterized by hot summers and cold winters. The average temperature in the summer is around 85 degrees Fahrenheit, while the average temperature in the winter is around 25 degrees Fahrenheit.
Economy
The economy of Natoma is largely based on agriculture. The town is home to several farms, which produce wheat, corn, and other crops. The town is also home to several businesses, including a grocery store, a hardware store, and a movie theater.
The town is also home to several manufacturing companies, which produce a variety of products, including furniture, clothing, and electronics. The town is also home to several service-based businesses, including restaurants, hotels, and auto repair shops.
Demographics
As of the 2010 census, the population of Natoma was 1,093. The racial makeup of the town was 97.3% White, 0.7% African American, 0.3% Native American, 0.2% Asian, 0.1% Pacific Islander, and 1.4% from other races.
The median household income in Natoma was $41,250, and the median family income was $45,625. The per capita income in Natoma was $19,845. About 8.3% of families and 10.2% of the population were below the poverty line, including 14.3% of those under the age of 18 and 8.2% of those 65 and older.
Common Questions
What is Per Capita Income in Natoma?
Per Capita income in Natoma is $26,759.
What is the Median Family Income in Natoma?
Median Family Income in Natoma is $68,092.
What is the Median Household income in Natoma?
Median Household Income in Natoma is $54,167.
What is Income or Wage Gap in Natoma?
Income or Wage Gap in Natoma is 52.7%.
Women in Natoma earn 47.3 cents for every dollar earned by a man.
What is Inequality or Gini Index in Natoma?
Inequality or Gini Index in Natoma is 0.38.
What is the Total Population of Natoma?
Total Population of Natoma is 400.
What is the Total Male Population of Natoma?
Total Male Population of Natoma is 211.
What is the Total Female Population of Natoma?
Total Female Population of Natoma is 189.
What is the Ratio of Males per 100 Females in Natoma?
There are 111.64 Males per 100 Females in Natoma.
What is the Ratio of Females per 100 Males in Natoma?
There are 89.57 Females per 100 Males in Natoma.
What is the Median Population Age in Natoma?
Median Population Age in Natoma is 37.3 Years.
What is the Average Family Size in Natoma
Average Family Size in Natoma is 2.7 People.
What is the Average Household Size in Natoma
Average Household Size in Natoma is 2.2 People.
How Large is the Labor Force in Natoma?
There are 168 People in the Labor Forcein in Natoma.
What is the Percentage of People in the Labor Force in Natoma?
60.6% of People are in the Labor Force in Natoma.
What is the Unemployment Rate in Natoma?
Unemployment Rate in Natoma is 1.8%.