Hanford, CA Map & Demographics
Hanford Map
Hanford Overview
$30,889
PER CAPITA INCOME
$83,794
AVG FAMILY INCOME
$73,819
AVG HOUSEHOLD INCOME
34.5%
WAGE / INCOME GAP [ % ]
65.5¢/ $1
WAGE / INCOME GAP [ $ ]
$10,715
FAMILY INCOME DEFICIT
0.40
INEQUALITY / GINI INDEX
57,920
TOTAL POPULATION
30,045
MALE POPULATION
27,875
FEMALE POPULATION
107.78
MALES / 100 FEMALES
92.78
FEMALES / 100 MALES
32.7
MEDIAN AGE
3.6
AVG FAMILY SIZE
3.1
AVG HOUSEHOLD SIZE
26,143
LABOR FORCE [ PEOPLE ]
60.9%
PERCENT IN LABOR FORCE
8.2%
UNEMPLOYMENT RATE
Hanford Zip Codes
Hanford Area Codes
Income in Hanford
Income Overview in Hanford
Per Capita Income in Hanford is $30,889, while median incomes of families and households are $83,794 and $73,819 respectively.
| Characteristic | Number | Measure |
| Per Capita Income | 57,920 | $30,889 |
| Median Family Income | 13,910 | $83,794 |
| Mean Family Income | 13,910 | $98,138 |
| Median Household Income | 18,495 | $73,819 |
| Mean Household Income | 18,495 | $90,406 |
| Income Deficit | 13,910 | $10,715 |
| Wage / Income Gap (%) | 57,920 | 34.53% |
| Wage / Income Gap ($) | 57,920 | 65.47¢ per $1 |
| Gini / Inequality Index | 57,920 | 0.40 |
Earnings by Sex in Hanford
Average Earnings in Hanford are $45,057, $51,435 for men and $33,674 for women, a difference of 34.5%.

| Sex | Number | Average Earnings |
| Male | 15,620 (57.9%) | $51,435 |
| Female | 11,348 (42.1%) | $33,674 |
| Total | 26,968 (100.0%) | $45,057 |
Earnings by Sex by Income Bracket in Hanford
The most common earnings brackets in Hanford are $75,000 to $99,999 for men (2,262 | 14.5%) and $75,000 to $99,999 for women (1,220 | 10.7%).
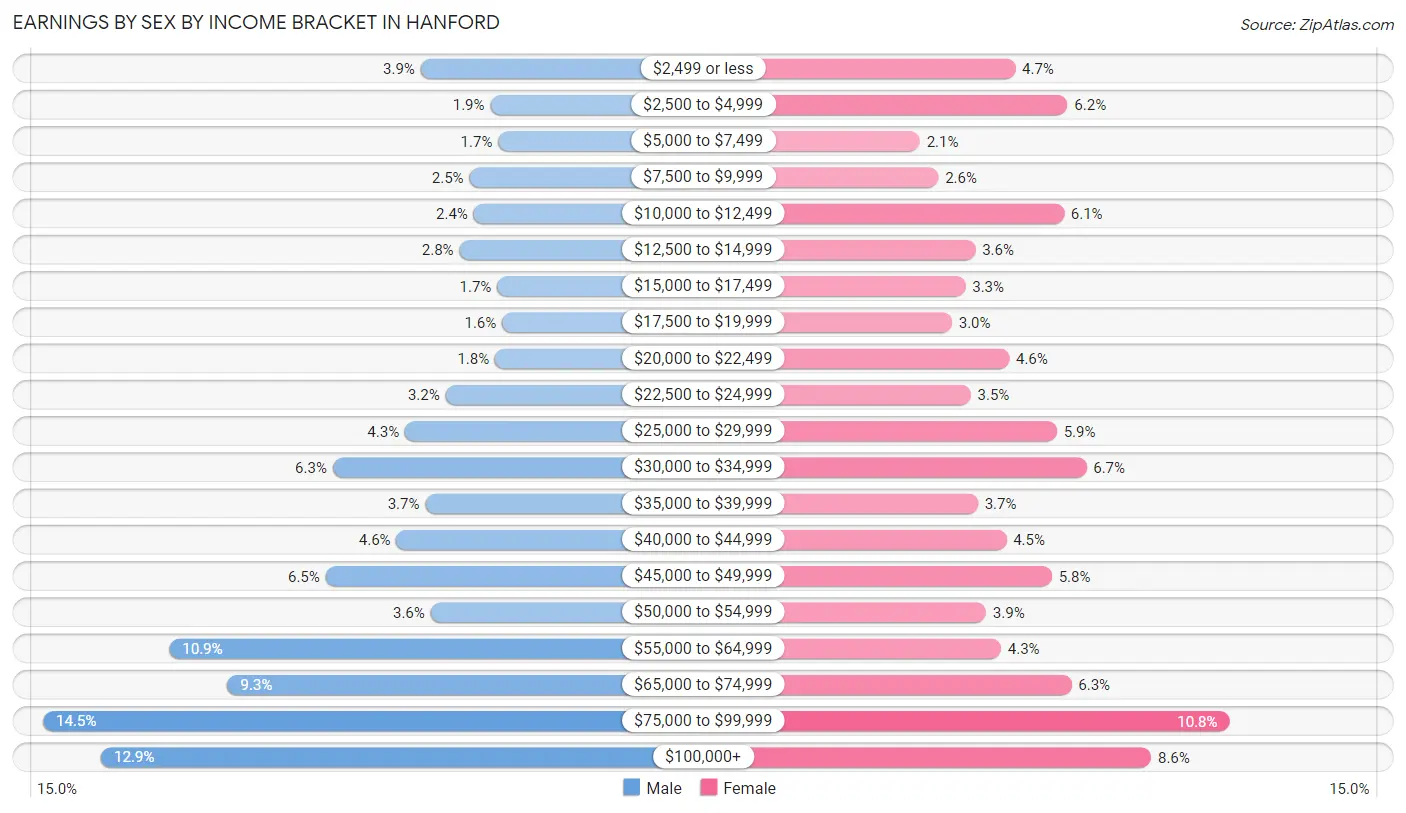
| Income | Male | Female |
| $2,499 or less | 605 (3.9%) | 537 (4.7%) |
| $2,500 to $4,999 | 298 (1.9%) | 704 (6.2%) |
| $5,000 to $7,499 | 264 (1.7%) | 233 (2.1%) |
| $7,500 to $9,999 | 391 (2.5%) | 292 (2.6%) |
| $10,000 to $12,499 | 372 (2.4%) | 692 (6.1%) |
| $12,500 to $14,999 | 434 (2.8%) | 410 (3.6%) |
| $15,000 to $17,499 | 269 (1.7%) | 378 (3.3%) |
| $17,500 to $19,999 | 247 (1.6%) | 335 (2.9%) |
| $20,000 to $22,499 | 278 (1.8%) | 518 (4.6%) |
| $22,500 to $24,999 | 495 (3.2%) | 395 (3.5%) |
| $25,000 to $29,999 | 673 (4.3%) | 669 (5.9%) |
| $30,000 to $34,999 | 990 (6.3%) | 764 (6.7%) |
| $35,000 to $39,999 | 584 (3.7%) | 418 (3.7%) |
| $40,000 to $44,999 | 710 (4.5%) | 508 (4.5%) |
| $45,000 to $49,999 | 1,022 (6.5%) | 654 (5.8%) |
| $50,000 to $54,999 | 560 (3.6%) | 444 (3.9%) |
| $55,000 to $64,999 | 1,707 (10.9%) | 491 (4.3%) |
| $65,000 to $74,999 | 1,452 (9.3%) | 716 (6.3%) |
| $75,000 to $99,999 | 2,262 (14.5%) | 1,220 (10.7%) |
| $100,000+ | 2,007 (12.9%) | 970 (8.6%) |
| Total | 15,620 (100.0%) | 11,348 (100.0%) |
Earnings by Sex by Educational Attainment in Hanford
Average earnings in Hanford are $58,241 for men and $39,267 for women, a difference of 32.6%. Men with an educational attainment of graduate degree enjoy the highest average annual earnings of $130,563, while those with less than high school education earn the least with $33,787. Women with an educational attainment of graduate degree earn the most with the average annual earnings of $83,295, while those with less than high school education have the smallest earnings of $13,352.
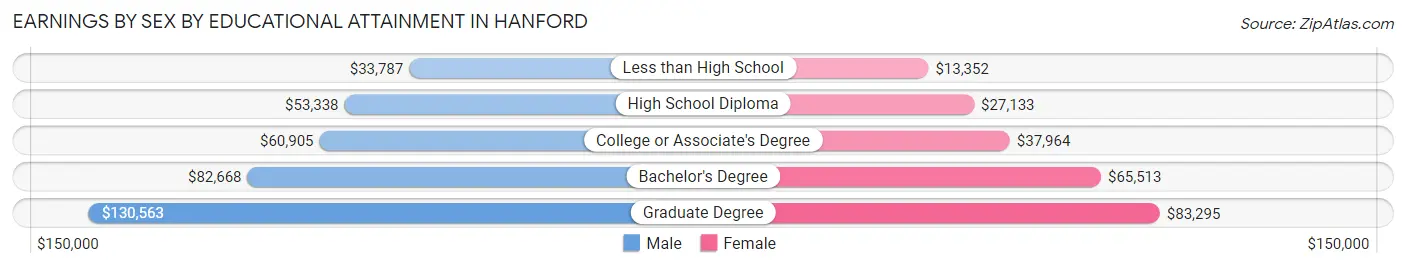
| Educational Attainment | Male Income | Female Income |
| Less than High School | $33,787 | $13,352 |
| High School Diploma | $53,338 | $27,133 |
| College or Associate's Degree | $60,905 | $37,964 |
| Bachelor's Degree | $82,668 | $65,513 |
| Graduate Degree | $130,563 | $83,295 |
| Total | $58,241 | $39,267 |
Family Income in Hanford
Family Income Brackets in Hanford
According to the Hanford family income data, there are 2,740 families falling into the $100,000 to $149,999 income range, which is the most common income bracket and makes up 19.7% of all families. Conversely, the $10,000 to $14,999 income bracket is the least frequent group with only 223 families (1.6%) belonging to this category.
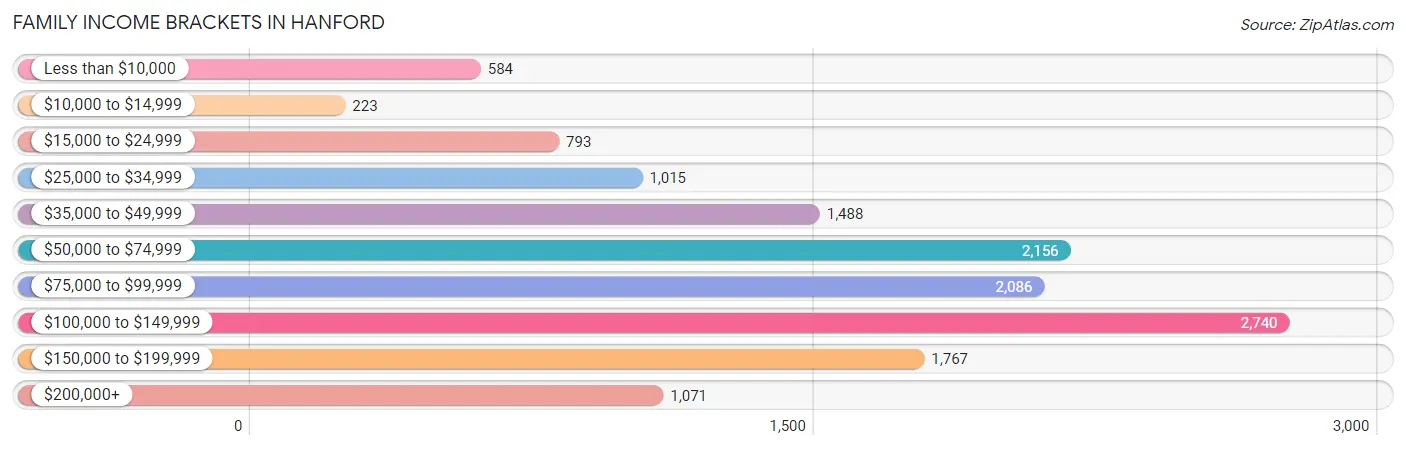
| Income Bracket | # Families | % Families |
| Less than $10,000 | 584 | 4.2% |
| $10,000 to $14,999 | 223 | 1.6% |
| $15,000 to $24,999 | 793 | 5.7% |
| $25,000 to $34,999 | 1,015 | 7.3% |
| $35,000 to $49,999 | 1,488 | 10.7% |
| $50,000 to $74,999 | 2,156 | 15.5% |
| $75,000 to $99,999 | 2,086 | 15.0% |
| $100,000 to $149,999 | 2,740 | 19.7% |
| $150,000 to $199,999 | 1,767 | 12.7% |
| $200,000+ | 1,071 | 7.7% |
Family Income by Famaliy Size in Hanford
6-person families (946 | 6.8%) account for the highest median family income in Hanford with $99,375 per family, while 2-person families (5,231 | 37.6%) have the highest median income of $35,950 per family member.
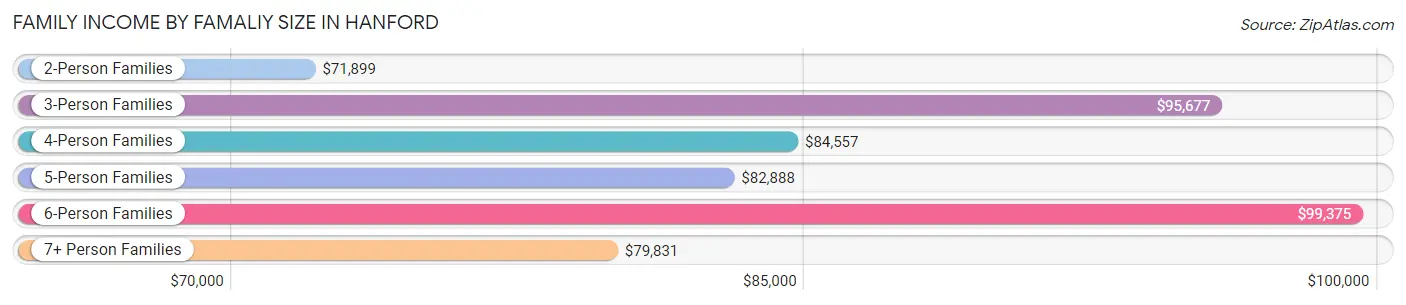
| Income Bracket | # Families | Median Income |
| 2-Person Families | 5,231 (37.6%) | $71,899 |
| 3-Person Families | 2,940 (21.1%) | $95,677 |
| 4-Person Families | 2,984 (21.4%) | $84,557 |
| 5-Person Families | 1,469 (10.6%) | $82,888 |
| 6-Person Families | 946 (6.8%) | $99,375 |
| 7+ Person Families | 340 (2.4%) | $79,831 |
| Total | 13,910 (100.0%) | $83,794 |
Family Income by Number of Earners in Hanford
The median family income in Hanford is $83,794, with families comprising 3+ earners (1,329) having the highest median family income of $139,196, while families with no earners (1,998) have the lowest median family income of $42,871, accounting for 9.6% and 14.4% of families, respectively.
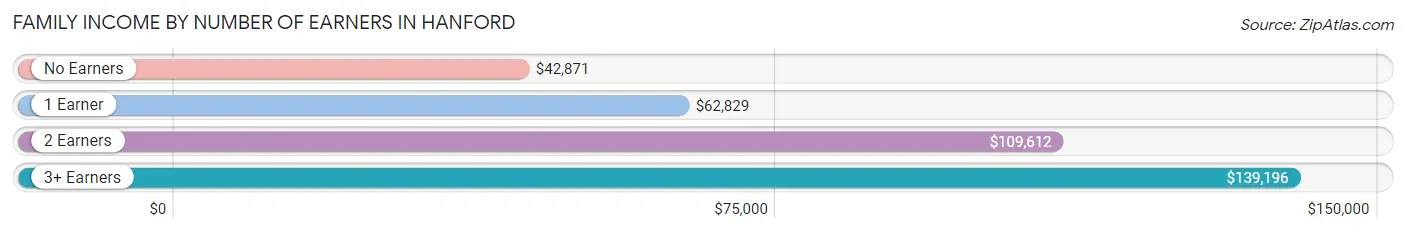
| Number of Earners | # Families | Median Income |
| No Earners | 1,998 (14.4%) | $42,871 |
| 1 Earner | 5,206 (37.4%) | $62,829 |
| 2 Earners | 5,377 (38.7%) | $109,612 |
| 3+ Earners | 1,329 (9.6%) | $139,196 |
| Total | 13,910 (100.0%) | $83,794 |
Household Income in Hanford
Household Income Brackets in Hanford
With 3,477 households falling in the category, the $100,000 to $149,999 income range is the most frequent in Hanford, accounting for 18.8% of all households. In contrast, only 481 households (2.6%) fall into the $10,000 to $14,999 income bracket, making it the least populous group.
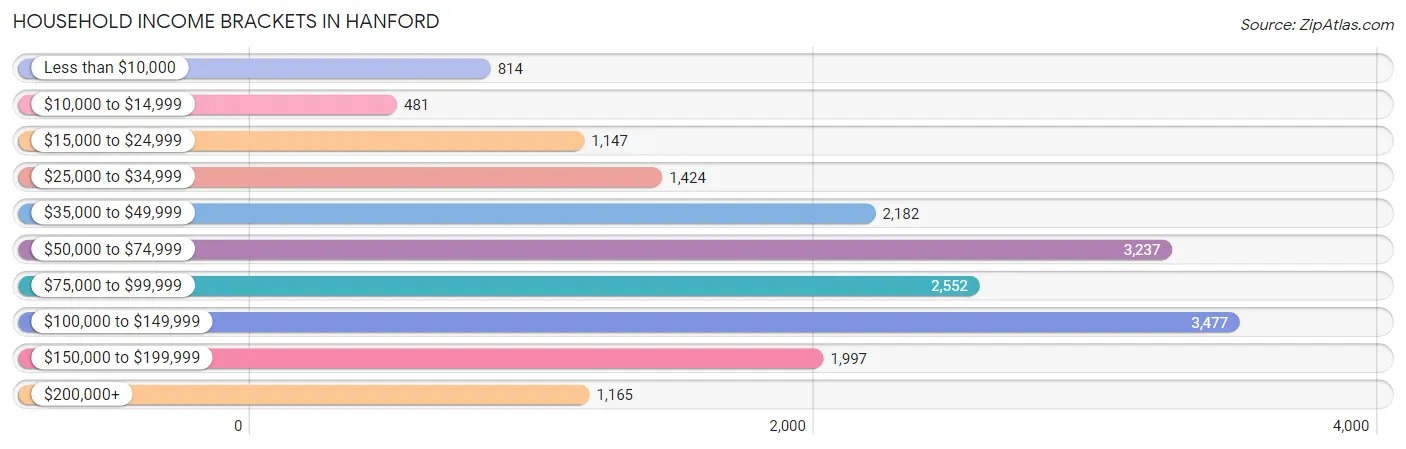
| Income Bracket | # Households | % Households |
| Less than $10,000 | 814 | 4.4% |
| $10,000 to $14,999 | 481 | 2.6% |
| $15,000 to $24,999 | 1,147 | 6.2% |
| $25,000 to $34,999 | 1,424 | 7.7% |
| $35,000 to $49,999 | 2,182 | 11.8% |
| $50,000 to $74,999 | 3,237 | 17.5% |
| $75,000 to $99,999 | 2,552 | 13.8% |
| $100,000 to $149,999 | 3,477 | 18.8% |
| $150,000 to $199,999 | 1,997 | 10.8% |
| $200,000+ | 1,165 | 6.3% |
Household Income by Householder Age in Hanford
The median household income in Hanford is $73,819, with the highest median household income of $88,292 found in the 45 to 64 years age bracket for the primary householder. A total of 5,952 households (32.2%) fall into this category. Meanwhile, the 15 to 24 years age bracket for the primary householder has the lowest median household income of $45,385, with 602 households (3.3%) in this group.
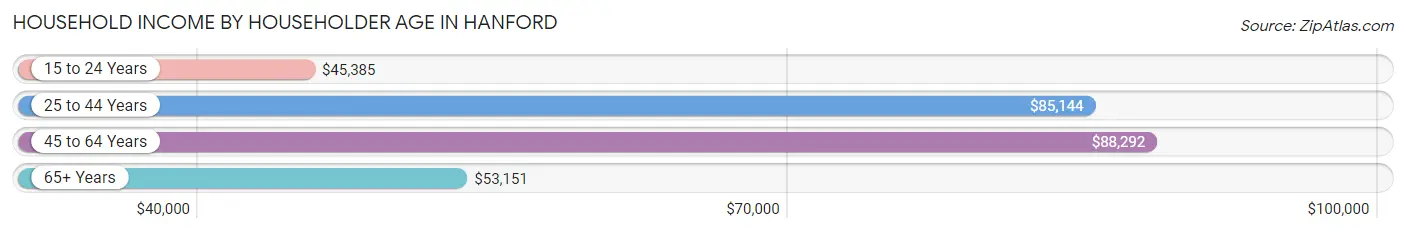
| Income Bracket | # Households | Median Income |
| 15 to 24 Years | 602 (3.3%) | $45,385 |
| 25 to 44 Years | 7,774 (42.0%) | $85,144 |
| 45 to 64 Years | 5,952 (32.2%) | $88,292 |
| 65+ Years | 4,167 (22.5%) | $53,151 |
| Total | 18,495 (100.0%) | $73,819 |
Poverty in Hanford
Income Below Poverty by Sex and Age in Hanford
With 14.3% poverty level for males and 14.8% for females among the residents of Hanford, under 5 year old males and 6 to 11 year old females are the most vulnerable to poverty, with 570 males (28.5%) and 706 females (21.8%) in their respective age groups living below the poverty level.
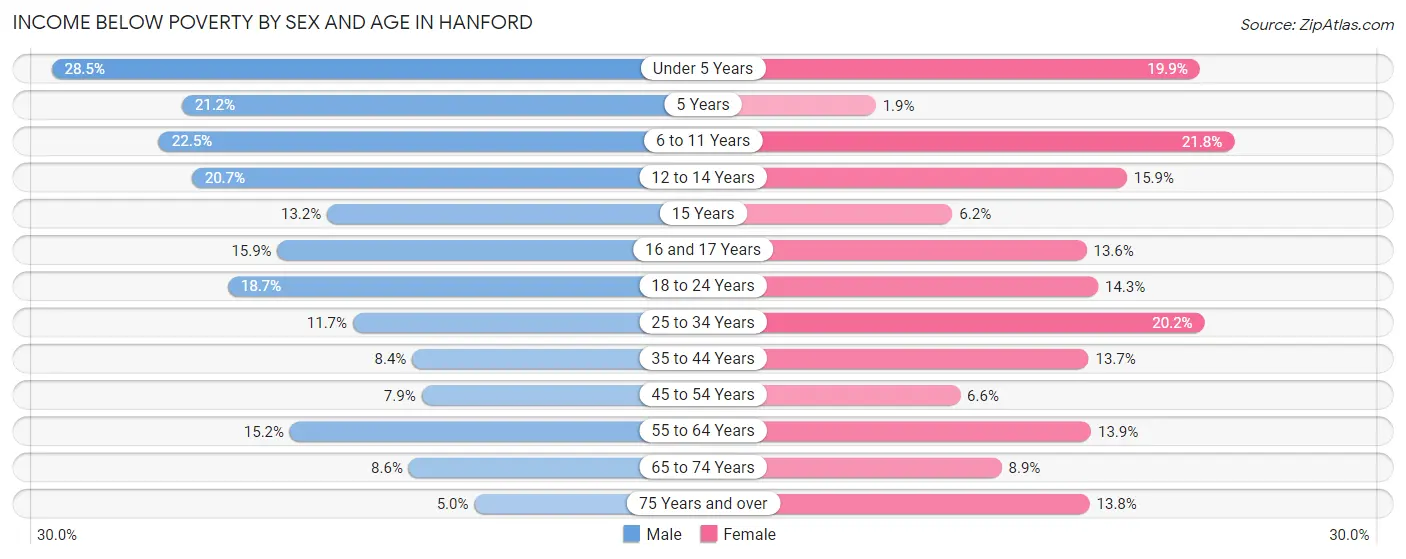
| Age Bracket | Male | Female |
| Under 5 Years | 570 (28.5%) | 424 (19.9%) |
| 5 Years | 72 (21.2%) | 8 (1.9%) |
| 6 to 11 Years | 648 (22.5%) | 706 (21.8%) |
| 12 to 14 Years | 364 (20.7%) | 200 (15.9%) |
| 15 Years | 60 (13.2%) | 30 (6.2%) |
| 16 and 17 Years | 163 (15.9%) | 118 (13.6%) |
| 18 to 24 Years | 546 (18.7%) | 339 (14.3%) |
| 25 to 34 Years | 518 (11.7%) | 770 (20.2%) |
| 35 to 44 Years | 418 (8.4%) | 525 (13.7%) |
| 45 to 54 Years | 247 (7.9%) | 190 (6.6%) |
| 55 to 64 Years | 418 (15.2%) | 369 (13.9%) |
| 65 to 74 Years | 173 (8.6%) | 181 (8.9%) |
| 75 Years and over | 55 (5.0%) | 240 (13.8%) |
| Total | 4,252 (14.3%) | 4,100 (14.8%) |
Income Above Poverty by Sex and Age in Hanford
According to the poverty statistics in Hanford, males aged 75 years and over and females aged 5 years are the age groups that are most secure financially, with 95.0% of males and 98.1% of females in these age groups living above the poverty line.
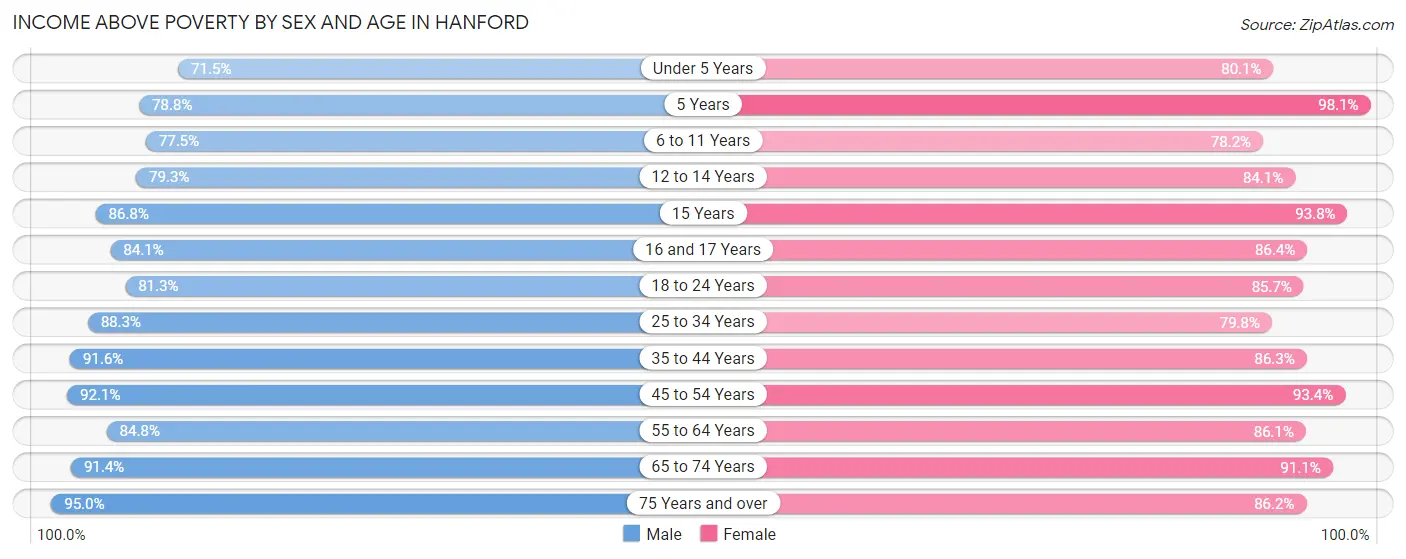
| Age Bracket | Male | Female |
| Under 5 Years | 1,430 (71.5%) | 1,704 (80.1%) |
| 5 Years | 267 (78.8%) | 415 (98.1%) |
| 6 to 11 Years | 2,230 (77.5%) | 2,527 (78.2%) |
| 12 to 14 Years | 1,395 (79.3%) | 1,060 (84.1%) |
| 15 Years | 396 (86.8%) | 457 (93.8%) |
| 16 and 17 Years | 861 (84.1%) | 748 (86.4%) |
| 18 to 24 Years | 2,377 (81.3%) | 2,036 (85.7%) |
| 25 to 34 Years | 3,901 (88.3%) | 3,044 (79.8%) |
| 35 to 44 Years | 4,545 (91.6%) | 3,296 (86.3%) |
| 45 to 54 Years | 2,879 (92.1%) | 2,691 (93.4%) |
| 55 to 64 Years | 2,326 (84.8%) | 2,289 (86.1%) |
| 65 to 74 Years | 1,837 (91.4%) | 1,852 (91.1%) |
| 75 Years and over | 1,053 (95.0%) | 1,499 (86.2%) |
| Total | 25,497 (85.7%) | 23,618 (85.2%) |
Income Below Poverty Among Married-Couple Families in Hanford
The poverty statistics for married-couple families in Hanford show that 5.4% or 498 of the total 9,277 families live below the poverty line. Families with 5 or more children have the highest poverty rate of 23.5%, comprising of 19 families. On the other hand, families with no children have the lowest poverty rate of 3.1%, which includes 132 families.
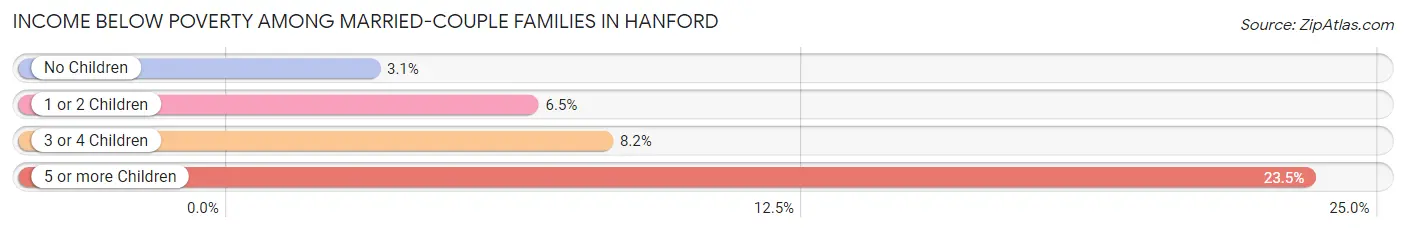
| Children | Above Poverty | Below Poverty |
| No Children | 4,140 (96.9%) | 132 (3.1%) |
| 1 or 2 Children | 3,171 (93.5%) | 222 (6.5%) |
| 3 or 4 Children | 1,406 (91.8%) | 125 (8.2%) |
| 5 or more Children | 62 (76.5%) | 19 (23.5%) |
| Total | 8,779 (94.6%) | 498 (5.4%) |
Income Below Poverty Among Single-Parent Households in Hanford
According to the poverty data in Hanford, 16.7% or 258 single-father households and 30.3% or 935 single-mother households are living below the poverty line. Among single-father households, those with 3 or 4 children have the highest poverty rate, with 37 households (25.7%) experiencing poverty. Likewise, among single-mother households, those with 5 or more children have the highest poverty rate, with 43 households (100.0%) falling below the poverty line.
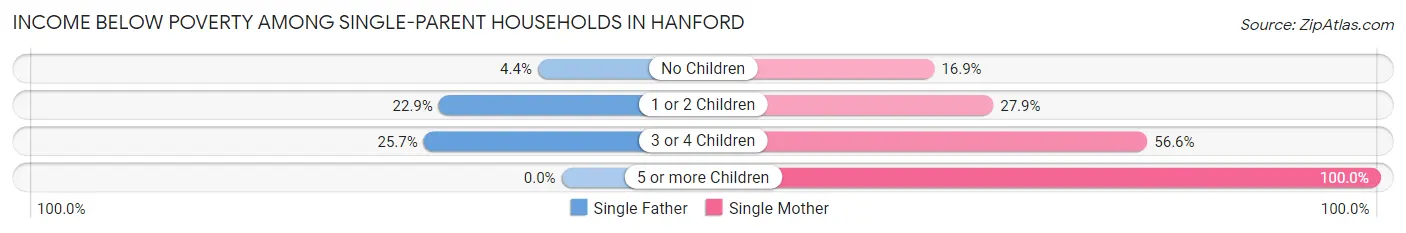
| Children | Single Father | Single Mother |
| No Children | 24 (4.4%) | 198 (16.9%) |
| 1 or 2 Children | 197 (22.9%) | 354 (27.9%) |
| 3 or 4 Children | 37 (25.7%) | 340 (56.6%) |
| 5 or more Children | 0 (0.0%) | 43 (100.0%) |
| Total | 258 (16.7%) | 935 (30.3%) |
Income Below Poverty Among Married-Couple vs Single-Parent Households in Hanford
The poverty data for Hanford shows that 498 of the married-couple family households (5.4%) and 1,193 of the single-parent households (25.8%) are living below the poverty level. Within the married-couple family households, those with 5 or more children have the highest poverty rate, with 19 households (23.5%) falling below the poverty line. Among the single-parent households, those with 5 or more children have the highest poverty rate, with 43 household (100.0%) living below poverty.
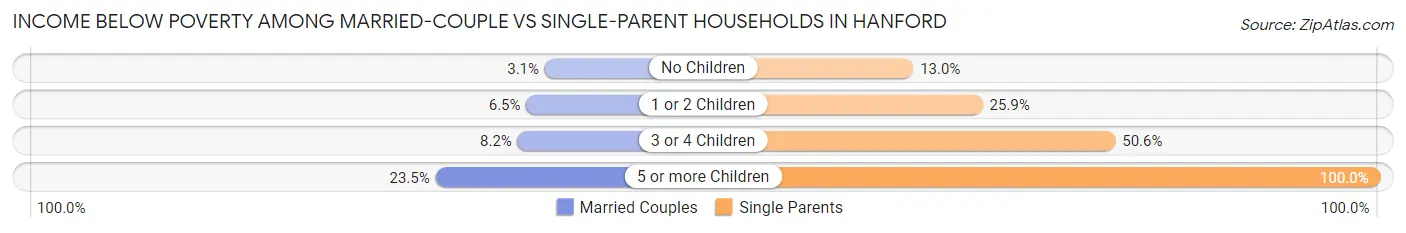
| Children | Married-Couple Families | Single-Parent Households |
| No Children | 132 (3.1%) | 222 (13.0%) |
| 1 or 2 Children | 222 (6.5%) | 551 (25.9%) |
| 3 or 4 Children | 125 (8.2%) | 377 (50.6%) |
| 5 or more Children | 19 (23.5%) | 43 (100.0%) |
| Total | 498 (5.4%) | 1,193 (25.8%) |
Race in Hanford
The most populous races in Hanford are White / Caucasian (33,823 | 58.4%), Hispanic or Latino (29,019 | 50.1%), and Two or more Races (8,705 | 15.0%).
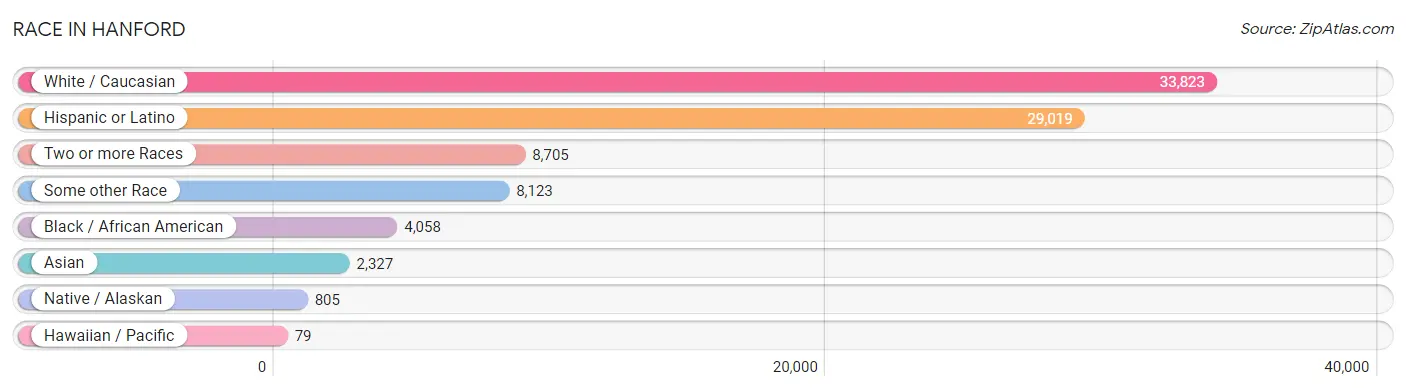
| Race | # Population | % Population |
| Asian | 2,327 | 4.0% |
| Black / African American | 4,058 | 7.0% |
| Hawaiian / Pacific | 79 | 0.1% |
| Hispanic or Latino | 29,019 | 50.1% |
| Native / Alaskan | 805 | 1.4% |
| White / Caucasian | 33,823 | 58.4% |
| Two or more Races | 8,705 | 15.0% |
| Some other Race | 8,123 | 14.0% |
| Total | 57,920 | 100.0% |
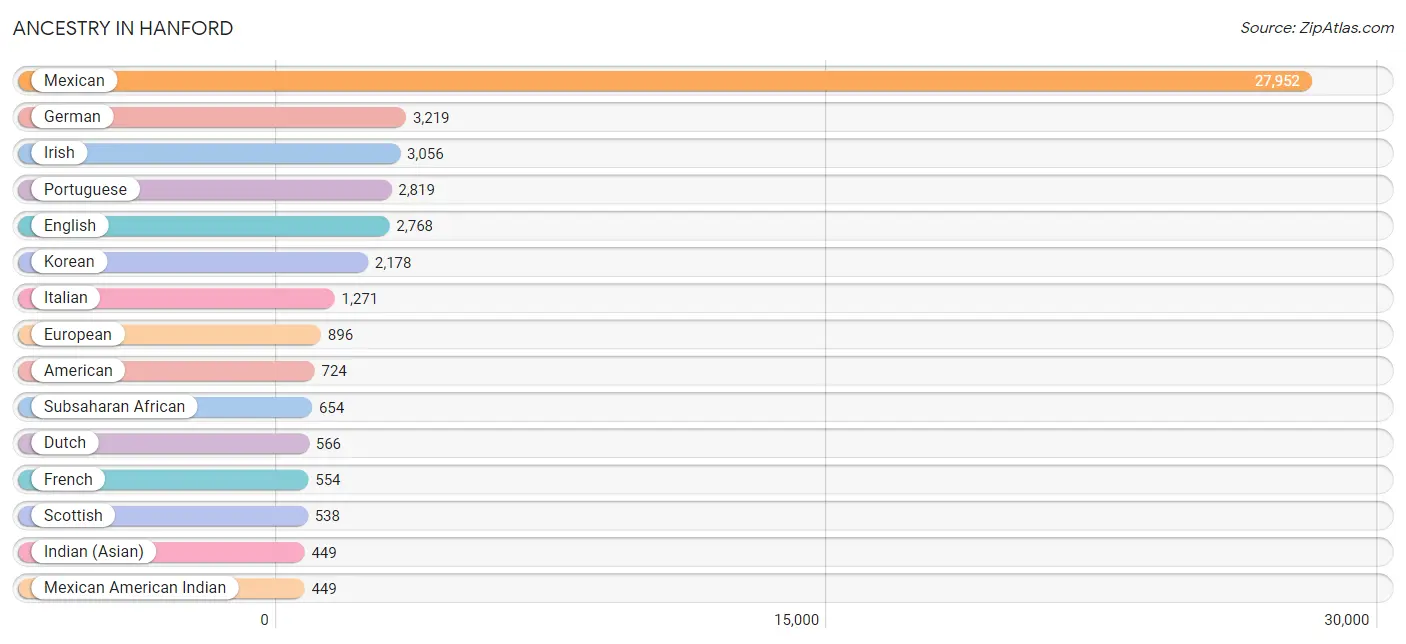
Ancestry in Hanford
The most populous ancestries reported in Hanford are Mexican (27,952 | 48.3%), German (3,219 | 5.6%), Irish (3,056 | 5.3%), Portuguese (2,819 | 4.9%), and English (2,768 | 4.8%), together accounting for 68.7% of all Hanford residents.
| Ancestry | # Population | % Population |
| African | 274 | 0.5% |
| American | 724 | 1.3% |
| Apache | 8 | 0.0% |
| Arab | 102 | 0.2% |
| Armenian | 26 | 0.0% |
| Bangladeshi | 204 | 0.4% |
| Bhutanese | 405 | 0.7% |
| Blackfeet | 88 | 0.2% |
| Brazilian | 4 | 0.0% |
| British | 72 | 0.1% |
| Burmese | 75 | 0.1% |
| Canadian | 53 | 0.1% |
| Central American | 206 | 0.4% |
| Central American Indian | 235 | 0.4% |
| Cherokee | 172 | 0.3% |
| Chilean | 17 | 0.0% |
| Choctaw | 23 | 0.0% |
| Colombian | 16 | 0.0% |
| Comanche | 48 | 0.1% |
| Creek | 23 | 0.0% |
| Cuban | 100 | 0.2% |
| Czech | 57 | 0.1% |
| Czechoslovakian | 27 | 0.1% |
| Danish | 93 | 0.2% |
| Dominican | 30 | 0.1% |
| Dutch | 566 | 1.0% |
| Eastern European | 57 | 0.1% |
| Ecuadorian | 26 | 0.0% |
| English | 2,768 | 4.8% |
| European | 896 | 1.5% |
| French | 554 | 1.0% |
| French Canadian | 55 | 0.1% |
| German | 3,219 | 5.6% |
| Greek | 9 | 0.0% |
| Guamanian / Chamorro | 59 | 0.1% |
| Honduran | 62 | 0.1% |
| Hungarian | 20 | 0.0% |
| Indian (Asian) | 449 | 0.8% |
| Iraqi | 33 | 0.1% |
| Irish | 3,056 | 5.3% |
| Iroquois | 4 | 0.0% |
| Italian | 1,271 | 2.2% |
| Jamaican | 26 | 0.0% |
| Japanese | 15 | 0.0% |
| Korean | 2,178 | 3.8% |
| Lebanese | 20 | 0.0% |
| Lithuanian | 13 | 0.0% |
| Mexican | 27,952 | 48.3% |
| Mexican American Indian | 449 | 0.8% |
| Moroccan | 4 | 0.0% |
| Native Hawaiian | 71 | 0.1% |
| Nigerian | 216 | 0.4% |
| Northern European | 84 | 0.2% |
| Norwegian | 282 | 0.5% |
| Pakistani | 102 | 0.2% |
| Palestinian | 26 | 0.0% |
| Peruvian | 15 | 0.0% |
| Polish | 231 | 0.4% |
| Portuguese | 2,819 | 4.9% |
| Puerto Rican | 190 | 0.3% |
| Russian | 27 | 0.1% |
| Salvadoran | 144 | 0.3% |
| Samoan | 106 | 0.2% |
| Scandinavian | 304 | 0.5% |
| Scotch-Irish | 102 | 0.2% |
| Scottish | 538 | 0.9% |
| Serbian | 3 | 0.0% |
| Sioux | 6 | 0.0% |
| South African | 48 | 0.1% |
| South American | 74 | 0.1% |
| Spaniard | 173 | 0.3% |
| Spanish | 103 | 0.2% |
| Sri Lankan | 26 | 0.0% |
| Subsaharan African | 654 | 1.1% |
| Swedish | 353 | 0.6% |
| Swiss | 30 | 0.1% |
| Syrian | 45 | 0.1% |
| Thai | 125 | 0.2% |
| Ukrainian | 26 | 0.0% |
| Ute | 15 | 0.0% |
| Welsh | 245 | 0.4% |
| West Indian | 21 | 0.0% | View All 82 Rows |
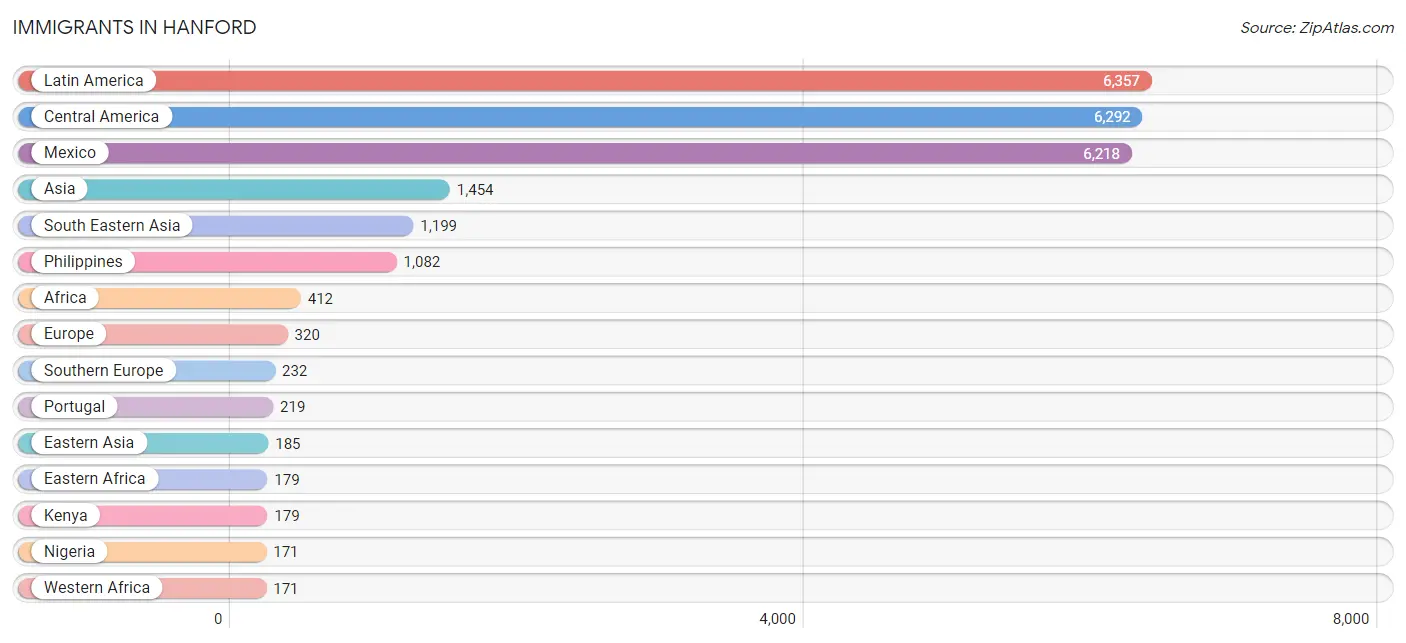
Immigrants in Hanford
The most numerous immigrant groups reported in Hanford came from Latin America (6,357 | 11.0%), Central America (6,292 | 10.9%), Mexico (6,218 | 10.7%), Asia (1,454 | 2.5%), and South Eastern Asia (1,199 | 2.1%), together accounting for 37.2% of all Hanford residents.
| Immigration Origin | # Population | % Population |
| Africa | 412 | 0.7% |
| Asia | 1,454 | 2.5% |
| Australia | 41 | 0.1% |
| Azores | 127 | 0.2% |
| Brazil | 4 | 0.0% |
| Canada | 100 | 0.2% |
| Caribbean | 52 | 0.1% |
| Central America | 6,292 | 10.9% |
| China | 113 | 0.2% |
| Cuba | 44 | 0.1% |
| Dominican Republic | 8 | 0.0% |
| Eastern Africa | 179 | 0.3% |
| Eastern Asia | 185 | 0.3% |
| Ecuador | 9 | 0.0% |
| El Salvador | 74 | 0.1% |
| England | 5 | 0.0% |
| Europe | 320 | 0.5% |
| Germany | 39 | 0.1% |
| Hong Kong | 15 | 0.0% |
| India | 22 | 0.0% |
| Iraq | 41 | 0.1% |
| Italy | 13 | 0.0% |
| Japan | 49 | 0.1% |
| Kenya | 179 | 0.3% |
| Korea | 23 | 0.0% |
| Laos | 17 | 0.0% |
| Latin America | 6,357 | 11.0% |
| Mexico | 6,218 | 10.7% |
| Morocco | 14 | 0.0% |
| Nigeria | 171 | 0.3% |
| Northern Africa | 14 | 0.0% |
| Northern Europe | 49 | 0.1% |
| Norway | 25 | 0.0% |
| Oceania | 66 | 0.1% |
| Philippines | 1,082 | 1.9% |
| Portugal | 219 | 0.4% |
| Singapore | 8 | 0.0% |
| South Africa | 48 | 0.1% |
| South America | 13 | 0.0% |
| South Central Asia | 22 | 0.0% |
| South Eastern Asia | 1,199 | 2.1% |
| Southern Europe | 232 | 0.4% |
| Sweden | 12 | 0.0% |
| Taiwan | 21 | 0.0% |
| Thailand | 60 | 0.1% |
| Turkey | 7 | 0.0% |
| Western Africa | 171 | 0.3% |
| Western Asia | 48 | 0.1% |
| Western Europe | 39 | 0.1% | View All 49 Rows |
Sex and Age in Hanford
Sex and Age in Hanford
The most populous age groups in Hanford are 10 to 14 Years (3,062 | 10.2%) for men and 10 to 14 Years (2,674 | 9.6%) for women.
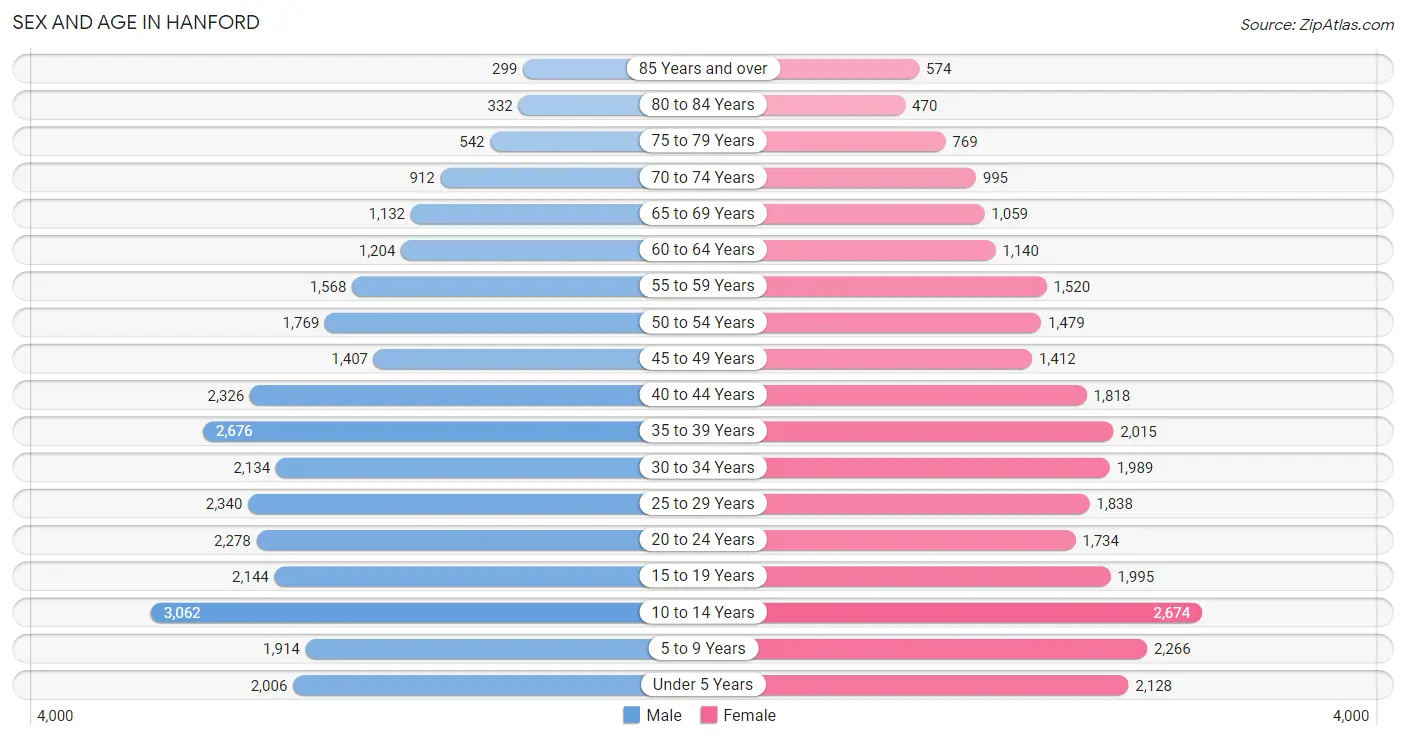
| Age Bracket | Male | Female |
| Under 5 Years | 2,006 (6.7%) | 2,128 (7.6%) |
| 5 to 9 Years | 1,914 (6.4%) | 2,266 (8.1%) |
| 10 to 14 Years | 3,062 (10.2%) | 2,674 (9.6%) |
| 15 to 19 Years | 2,144 (7.1%) | 1,995 (7.2%) |
| 20 to 24 Years | 2,278 (7.6%) | 1,734 (6.2%) |
| 25 to 29 Years | 2,340 (7.8%) | 1,838 (6.6%) |
| 30 to 34 Years | 2,134 (7.1%) | 1,989 (7.1%) |
| 35 to 39 Years | 2,676 (8.9%) | 2,015 (7.2%) |
| 40 to 44 Years | 2,326 (7.7%) | 1,818 (6.5%) |
| 45 to 49 Years | 1,407 (4.7%) | 1,412 (5.1%) |
| 50 to 54 Years | 1,769 (5.9%) | 1,479 (5.3%) |
| 55 to 59 Years | 1,568 (5.2%) | 1,520 (5.4%) |
| 60 to 64 Years | 1,204 (4.0%) | 1,140 (4.1%) |
| 65 to 69 Years | 1,132 (3.8%) | 1,059 (3.8%) |
| 70 to 74 Years | 912 (3.0%) | 995 (3.6%) |
| 75 to 79 Years | 542 (1.8%) | 769 (2.8%) |
| 80 to 84 Years | 332 (1.1%) | 470 (1.7%) |
| 85 Years and over | 299 (1.0%) | 574 (2.1%) |
| Total | 30,045 (100.0%) | 27,875 (100.0%) |
Families and Households in Hanford
Median Family Size in Hanford
The median family size in Hanford is 3.58 persons per family, with married-couple families (9,277 | 66.7%) accounting for the largest median family size of 3.73 persons per family. On the other hand, single male/father families (1,548 | 11.1%) represent the smallest median family size with 3.12 persons per family.
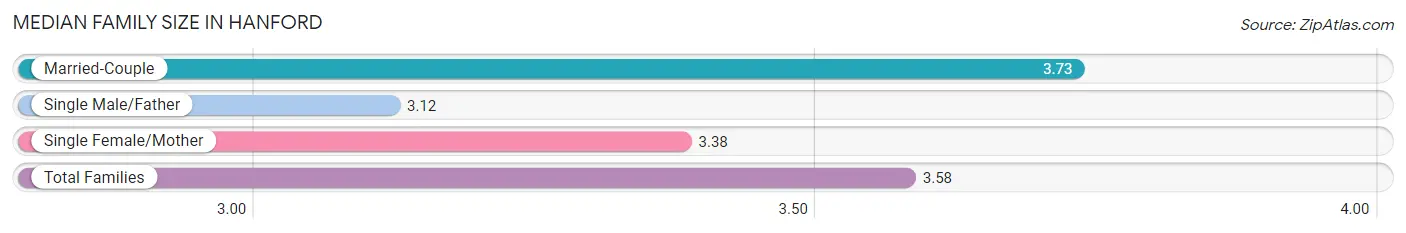
| Family Type | # Families | Family Size |
| Married-Couple | 9,277 (66.7%) | 3.73 |
| Single Male/Father | 1,548 (11.1%) | 3.12 |
| Single Female/Mother | 3,085 (22.2%) | 3.38 |
| Total Families | 13,910 (100.0%) | 3.58 |
Median Household Size in Hanford
The median household size in Hanford is 3.09 persons per household, with married-couple households (9,277 | 50.2%) accounting for the largest median household size of 3.75 persons per household. non-family households (4,585 | 24.8%) represent the smallest median household size with 1.27 persons per household.
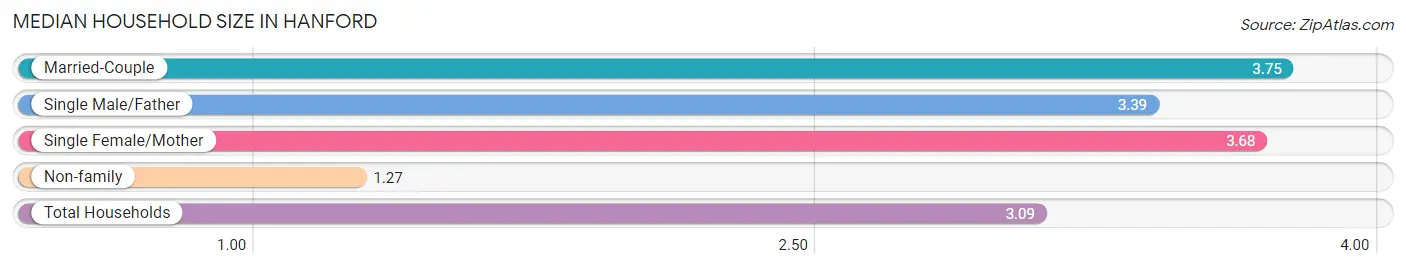
| Household Type | # Households | Household Size |
| Married-Couple | 9,277 (50.2%) | 3.75 |
| Single Male/Father | 1,548 (8.4%) | 3.39 |
| Single Female/Mother | 3,085 (16.7%) | 3.68 |
| Non-family | 4,585 (24.8%) | 1.27 |
| Total Households | 18,495 (100.0%) | 3.09 |
Household Size by Marriage Status in Hanford
Out of a total of 18,495 households in Hanford, 13,910 (75.2%) are family households, while 4,585 (24.8%) are nonfamily households. The most numerous type of family households are 2-person households, comprising 4,898, and the most common type of nonfamily households are 1-person households, comprising 3,589.
| Household Size | Family Households | Nonfamily Households |
| 1-Person Households | - | 3,589 (19.4%) |
| 2-Person Households | 4,898 (26.5%) | 874 (4.7%) |
| 3-Person Households | 2,796 (15.1%) | 120 (0.6%) |
| 4-Person Households | 3,197 (17.3%) | 2 (0.0%) |
| 5-Person Households | 1,566 (8.5%) | 0 (0.0%) |
| 6-Person Households | 1,067 (5.8%) | 0 (0.0%) |
| 7+ Person Households | 386 (2.1%) | 0 (0.0%) |
| Total | 13,910 (75.2%) | 4,585 (24.8%) |
Female Fertility in Hanford
Fertility by Age in Hanford
Average fertility rate in Hanford is 83.0 births per 1,000 women. Women in the age bracket of 20 to 34 years have the highest fertility rate with 152.0 births per 1,000 women. Women in the age bracket of 20 to 34 years acount for 77.6% of all women with births.
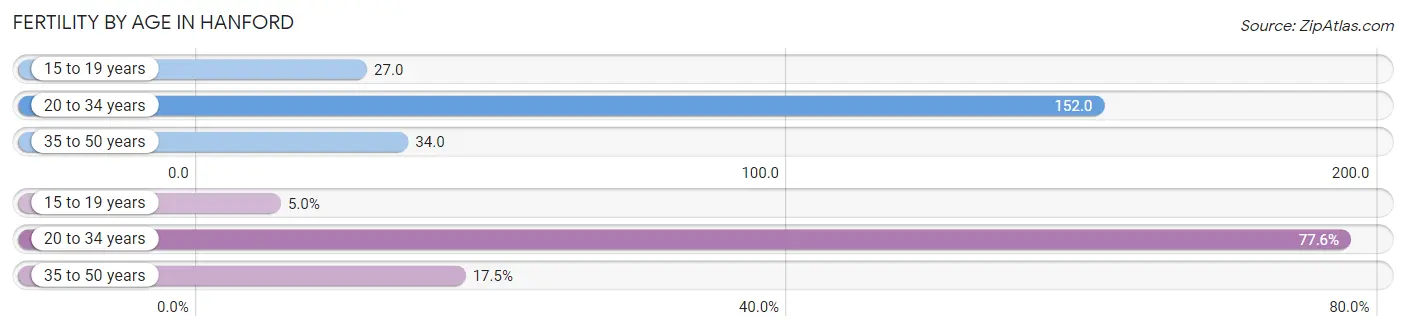
| Age Bracket | Women with Births | Births / 1,000 Women |
| 15 to 19 years | 54 (5.0%) | 27.0 |
| 20 to 34 years | 847 (77.6%) | 152.0 |
| 35 to 50 years | 191 (17.5%) | 34.0 |
| Total | 1,092 (100.0%) | 83.0 |
Fertility by Age by Marriage Status in Hanford
72.0% of women with births (1,092) in Hanford are married. The highest percentage of unmarried women with births falls into 15 to 19 years age bracket with 100.0% of them unmarried at the time of birth, while the lowest percentage of unmarried women with births belong to 35 to 50 years age bracket with 5.8% of them unmarried.
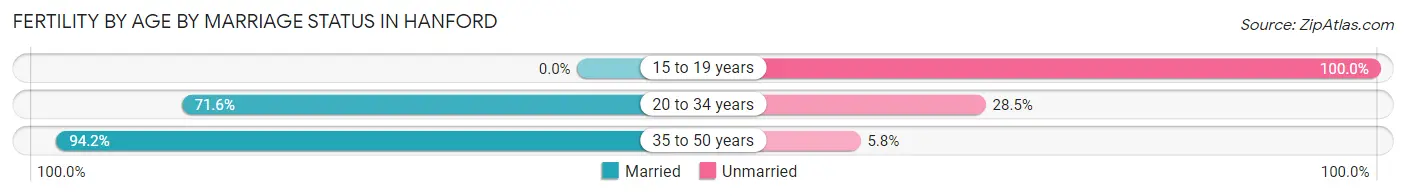
| Age Bracket | Married | Unmarried |
| 15 to 19 years | 0 (0.0%) | 54 (100.0%) |
| 20 to 34 years | 606 (71.6%) | 241 (28.4%) |
| 35 to 50 years | 180 (94.2%) | 11 (5.8%) |
| Total | 786 (72.0%) | 306 (28.0%) |
Fertility by Education in Hanford
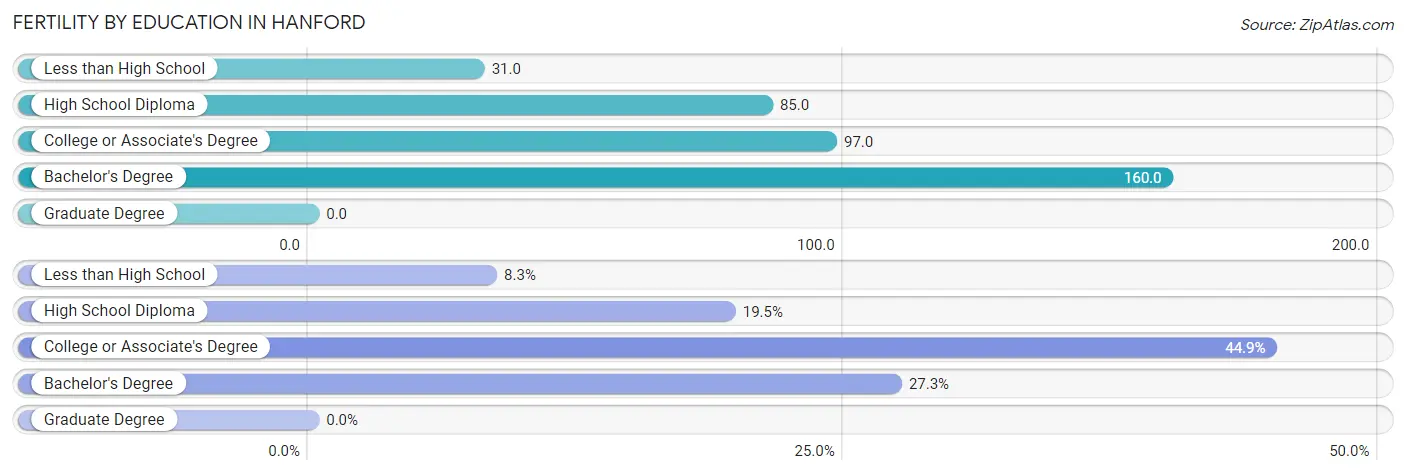
| Educational Attainment | Women with Births | Births / 1,000 Women |
| Less than High School | 91 (8.3%) | 31.0 |
| High School Diploma | 213 (19.5%) | 85.0 |
| College or Associate's Degree | 490 (44.9%) | 97.0 |
| Bachelor's Degree | 298 (27.3%) | 160.0 |
| Graduate Degree | 0 (0.0%) | 0.0 |
| Total | 1,092 (100.0%) | 83.0 |
Fertility by Education by Marriage Status in Hanford
28.0% of women with births in Hanford are unmarried. Women with the educational attainment of bachelor's degree are most likely to be married with 100.0% of them married at childbirth, while women with the educational attainment of less than high school are least likely to be married with 94.5% of them unmarried at childbirth.
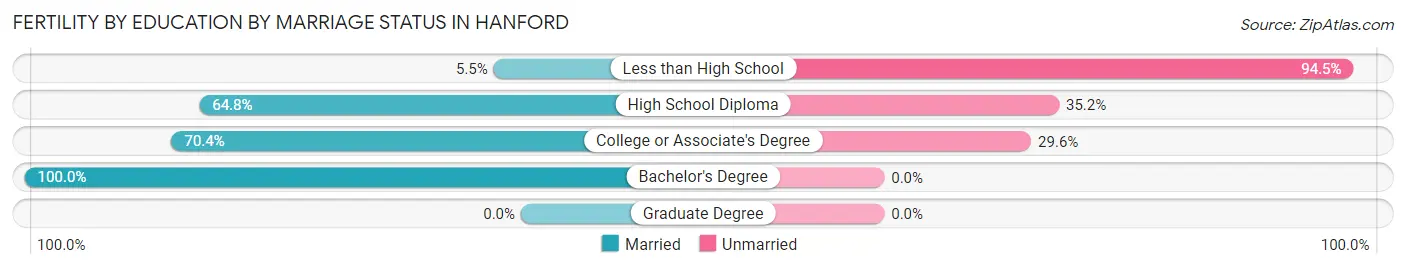
| Educational Attainment | Married | Unmarried |
| Less than High School | 5 (5.5%) | 86 (94.5%) |
| High School Diploma | 138 (64.8%) | 75 (35.2%) |
| College or Associate's Degree | 345 (70.4%) | 145 (29.6%) |
| Bachelor's Degree | 298 (100.0%) | 0 (0.0%) |
| Graduate Degree | 0 (0.0%) | 0 (0.0%) |
| Total | 786 (72.0%) | 306 (28.0%) |
Employment Characteristics in Hanford
Employment by Class of Employer in Hanford
Among the 23,549 employed individuals in Hanford, private company employees (13,077 | 55.5%), local government employees (2,854 | 12.1%), and federal government employees (2,353 | 10.0%) make up the most common classes of employment.
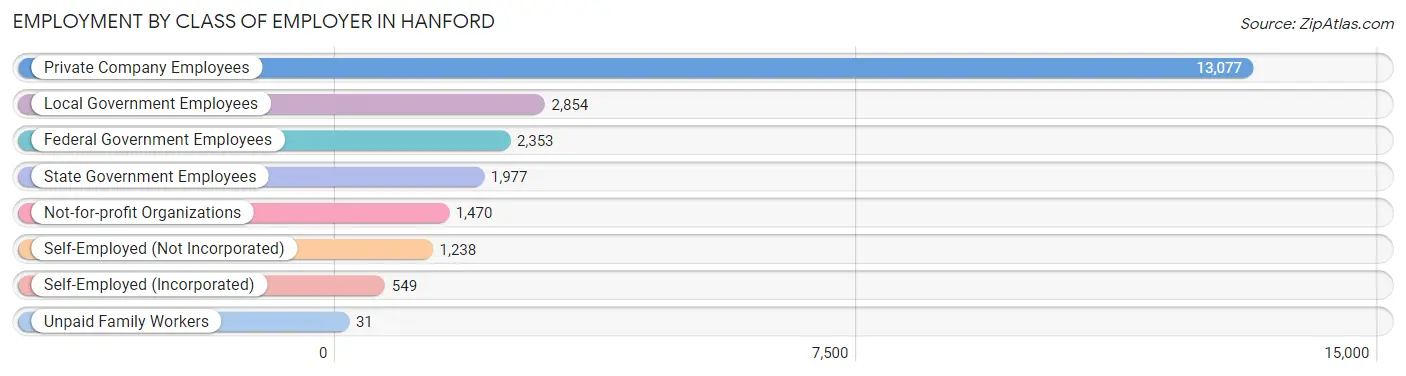
| Employer Class | # Employees | % Employees |
| Private Company Employees | 13,077 | 55.5% |
| Self-Employed (Incorporated) | 549 | 2.3% |
| Self-Employed (Not Incorporated) | 1,238 | 5.3% |
| Not-for-profit Organizations | 1,470 | 6.2% |
| Local Government Employees | 2,854 | 12.1% |
| State Government Employees | 1,977 | 8.4% |
| Federal Government Employees | 2,353 | 10.0% |
| Unpaid Family Workers | 31 | 0.1% |
| Total | 23,549 | 100.0% |
Employment Status by Age in Hanford
According to the labor force statistics for Hanford, out of the total population over 16 years of age (42,927), 60.9% or 26,143 individuals are in the labor force, with 8.2% or 2,144 of them unemployed. The age group with the highest labor force participation rate is 35 to 44 years, with 84.1% or 7,430 individuals in the labor force. Within the labor force, the 16 to 19 years age range has the highest percentage of unemployed individuals, with 25.5% or 192 of them being unemployed.
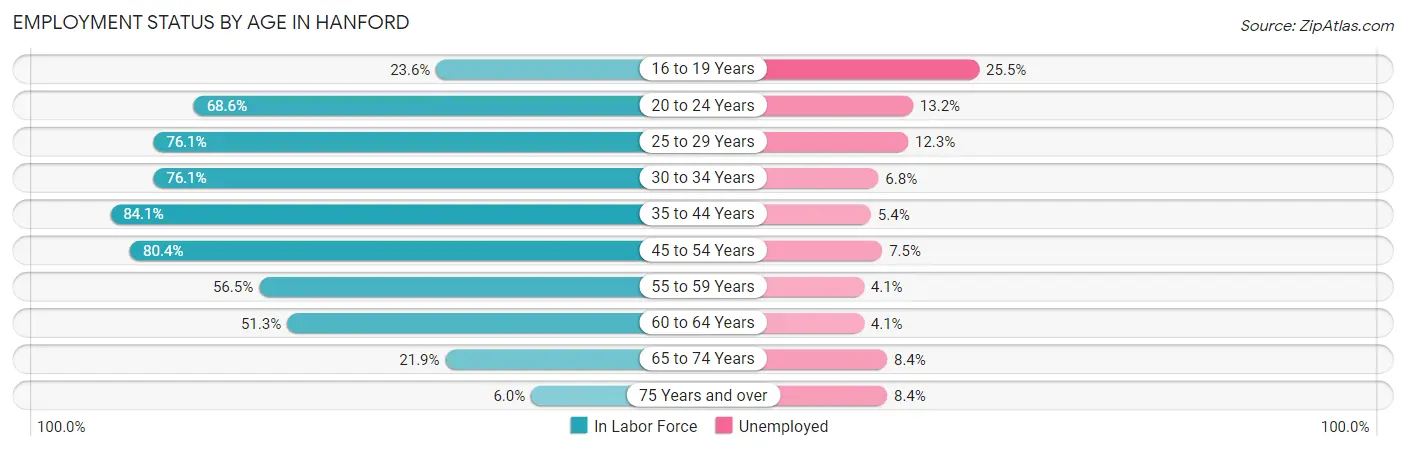
| Age Bracket | In Labor Force | Unemployed |
| 16 to 19 Years | 754 (23.6%) | 192 (25.5%) |
| 20 to 24 Years | 2,752 (68.6%) | 363 (13.2%) |
| 25 to 29 Years | 3,179 (76.1%) | 391 (12.3%) |
| 30 to 34 Years | 3,138 (76.1%) | 213 (6.8%) |
| 35 to 44 Years | 7,430 (84.1%) | 401 (5.4%) |
| 45 to 54 Years | 4,878 (80.4%) | 366 (7.5%) |
| 55 to 59 Years | 1,745 (56.5%) | 72 (4.1%) |
| 60 to 64 Years | 1,202 (51.3%) | 49 (4.1%) |
| 65 to 74 Years | 897 (21.9%) | 75 (8.4%) |
| 75 Years and over | 179 (6.0%) | 15 (8.4%) |
| Total | 26,143 (60.9%) | 2,144 (8.2%) |
Employment Status by Educational Attainment in Hanford
According to labor force statistics for Hanford, 75.3% of individuals (21,562) out of the total population between 25 and 64 years of age (28,635) are in the labor force, with 6.9% or 1,488 of them being unemployed. The group with the highest labor force participation rate are those with the educational attainment of bachelor's degree or higher, with 88.4% or 4,856 individuals in the labor force. Within the labor force, individuals with less than high school education have the highest percentage of unemployment, with 12.4% or 410 of them being unemployed.
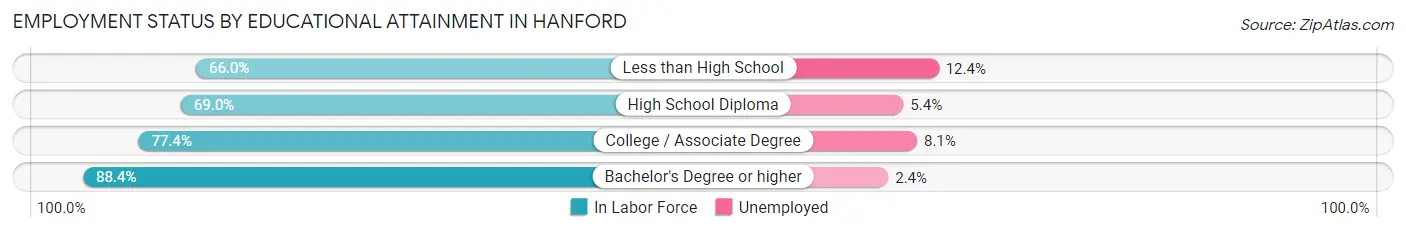
| Educational Attainment | In Labor Force | Unemployed |
| Less than High School | 3,308 (66.0%) | 621 (12.4%) |
| High School Diploma | 5,075 (69.0%) | 397 (5.4%) |
| College / Associate Degree | 8,340 (77.4%) | 873 (8.1%) |
| Bachelor's Degree or higher | 4,856 (88.4%) | 132 (2.4%) |
| Total | 21,562 (75.3%) | 1,976 (6.9%) |
Employment Occupations by Sex in Hanford
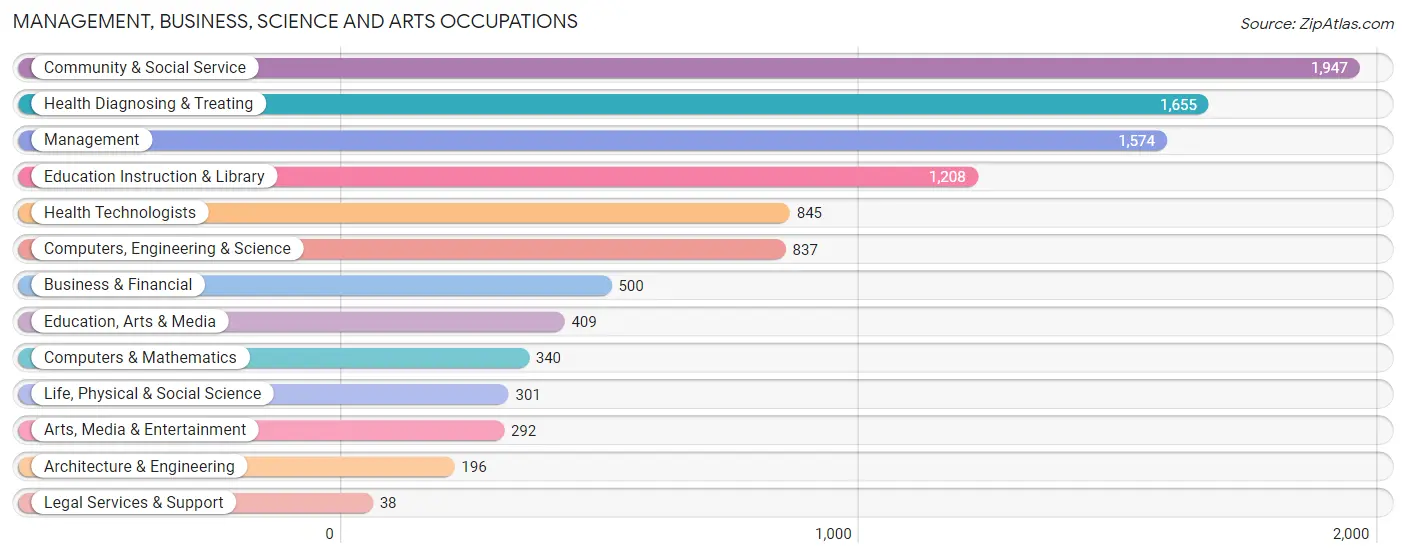
Management, Business, Science and Arts Occupations
The most common Management, Business, Science and Arts occupations in Hanford are Community & Social Service (1,947 | 8.5%), Health Diagnosing & Treating (1,655 | 7.2%), Management (1,574 | 6.9%), Education Instruction & Library (1,208 | 5.3%), and Health Technologists (845 | 3.7%).
Management, Business, Science and Arts Occupations by Sex
Within the Management, Business, Science and Arts occupations in Hanford, the most male-oriented occupations are Computers & Mathematics (92.6%), Architecture & Engineering (92.3%), and Computers, Engineering & Science (77.9%), while the most female-oriented occupations are Health Diagnosing & Treating (72.4%), Health Technologists (69.1%), and Education Instruction & Library (68.5%).
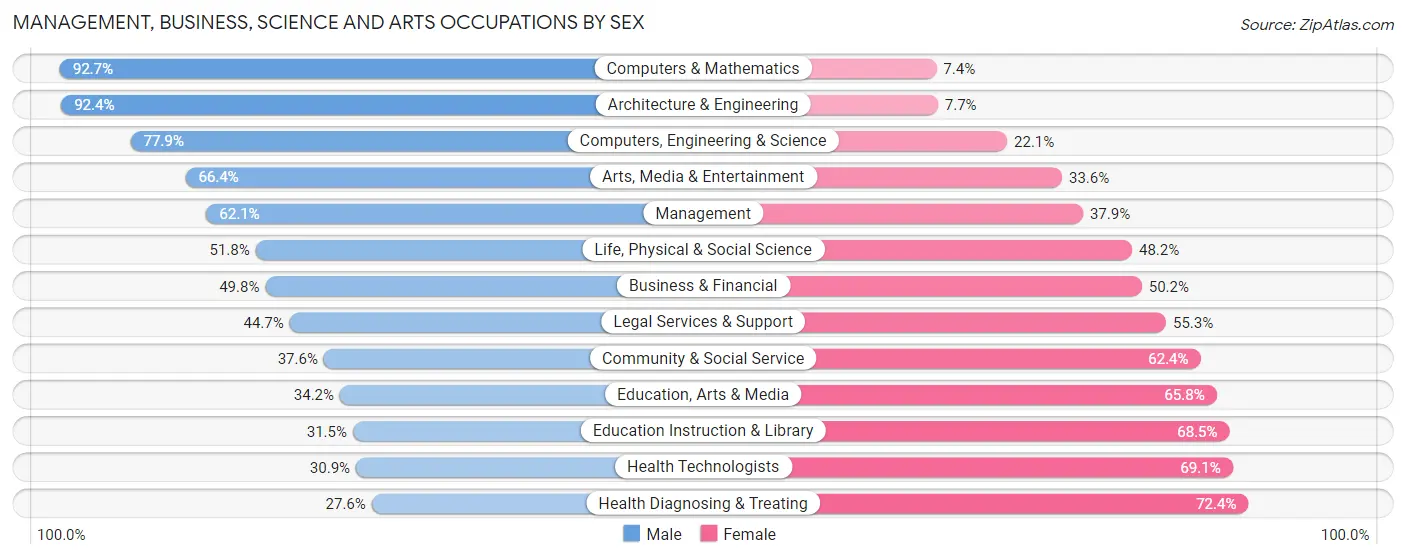
| Occupation | Male | Female |
| Management | 977 (62.1%) | 597 (37.9%) |
| Business & Financial | 249 (49.8%) | 251 (50.2%) |
| Computers, Engineering & Science | 652 (77.9%) | 185 (22.1%) |
| Computers & Mathematics | 315 (92.6%) | 25 (7.3%) |
| Architecture & Engineering | 181 (92.3%) | 15 (7.6%) |
| Life, Physical & Social Science | 156 (51.8%) | 145 (48.2%) |
| Community & Social Service | 732 (37.6%) | 1,215 (62.4%) |
| Education, Arts & Media | 140 (34.2%) | 269 (65.8%) |
| Legal Services & Support | 17 (44.7%) | 21 (55.3%) |
| Education Instruction & Library | 381 (31.5%) | 827 (68.5%) |
| Arts, Media & Entertainment | 194 (66.4%) | 98 (33.6%) |
| Health Diagnosing & Treating | 457 (27.6%) | 1,198 (72.4%) |
| Health Technologists | 261 (30.9%) | 584 (69.1%) |
| Total (Category) | 3,067 (47.1%) | 3,446 (52.9%) |
| Total (Overall) | 13,453 (58.5%) | 9,530 (41.5%) |
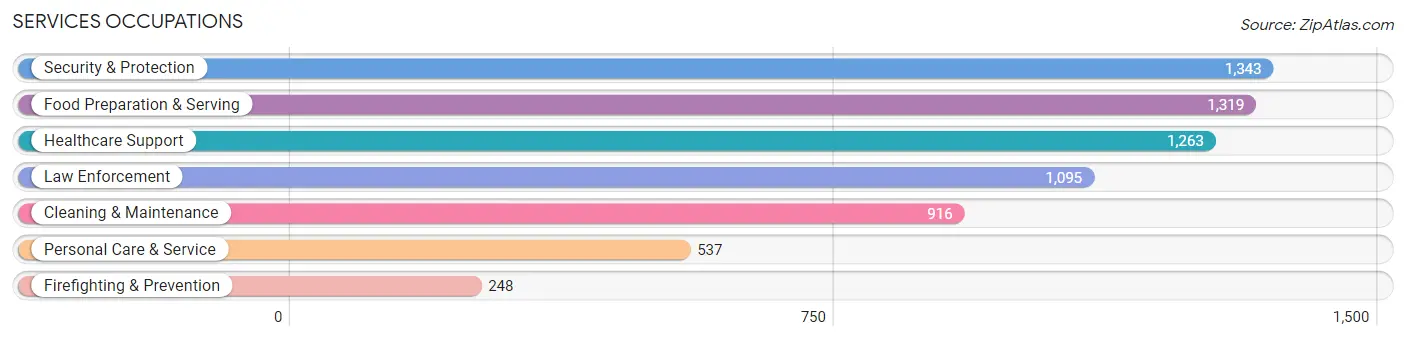
Services Occupations
The most common Services occupations in Hanford are Security & Protection (1,343 | 5.8%), Food Preparation & Serving (1,319 | 5.7%), Healthcare Support (1,263 | 5.5%), Law Enforcement (1,095 | 4.8%), and Cleaning & Maintenance (916 | 4.0%).
Services Occupations by Sex
Within the Services occupations in Hanford, the most male-oriented occupations are Law Enforcement (84.3%), Security & Protection (83.1%), and Cleaning & Maintenance (81.4%), while the most female-oriented occupations are Healthcare Support (79.7%), Personal Care & Service (62.6%), and Food Preparation & Serving (52.2%).
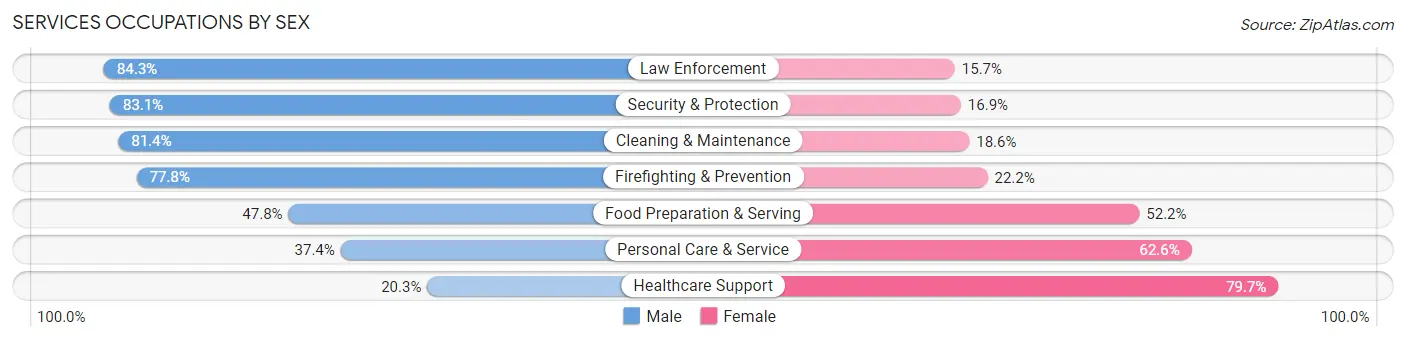
| Occupation | Male | Female |
| Healthcare Support | 256 (20.3%) | 1,007 (79.7%) |
| Security & Protection | 1,116 (83.1%) | 227 (16.9%) |
| Firefighting & Prevention | 193 (77.8%) | 55 (22.2%) |
| Law Enforcement | 923 (84.3%) | 172 (15.7%) |
| Food Preparation & Serving | 630 (47.8%) | 689 (52.2%) |
| Cleaning & Maintenance | 746 (81.4%) | 170 (18.6%) |
| Personal Care & Service | 201 (37.4%) | 336 (62.6%) |
| Total (Category) | 2,949 (54.8%) | 2,429 (45.2%) |
| Total (Overall) | 13,453 (58.5%) | 9,530 (41.5%) |
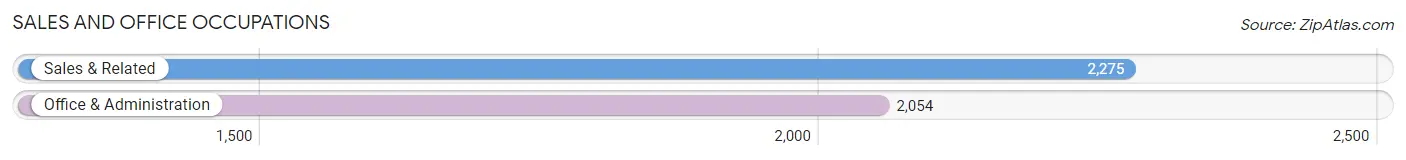
Sales and Office Occupations
The most common Sales and Office occupations in Hanford are Sales & Related (2,275 | 9.9%), and Office & Administration (2,054 | 8.9%).
Sales and Office Occupations by Sex
| Occupation | Male | Female |
| Sales & Related | 861 (37.9%) | 1,414 (62.2%) |
| Office & Administration | 479 (23.3%) | 1,575 (76.7%) |
| Total (Category) | 1,340 (30.9%) | 2,989 (69.1%) |
| Total (Overall) | 13,453 (58.5%) | 9,530 (41.5%) |
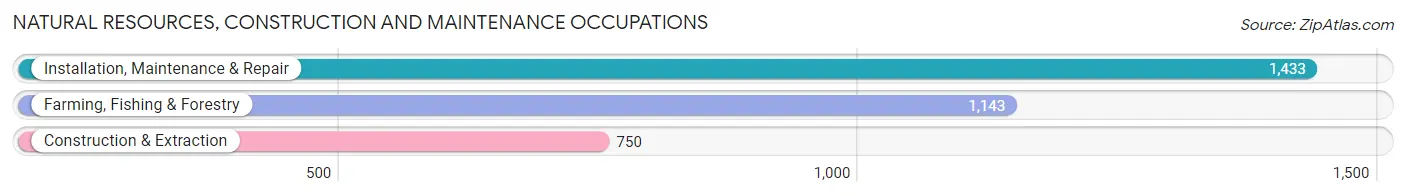
Natural Resources, Construction and Maintenance Occupations
The most common Natural Resources, Construction and Maintenance occupations in Hanford are Installation, Maintenance & Repair (1,433 | 6.2%), Farming, Fishing & Forestry (1,143 | 5.0%), and Construction & Extraction (750 | 3.3%).
Natural Resources, Construction and Maintenance Occupations by Sex
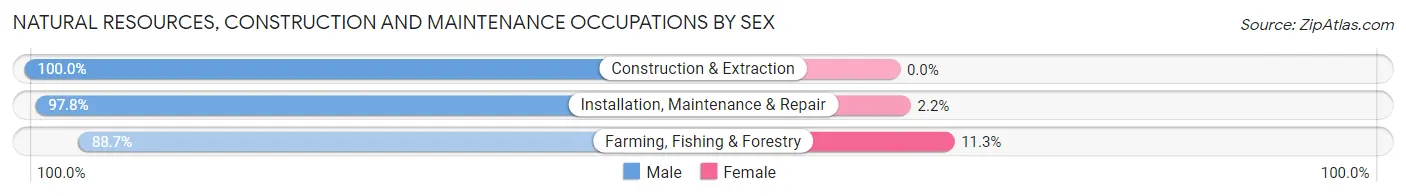
| Occupation | Male | Female |
| Farming, Fishing & Forestry | 1,014 (88.7%) | 129 (11.3%) |
| Construction & Extraction | 750 (100.0%) | 0 (0.0%) |
| Installation, Maintenance & Repair | 1,401 (97.8%) | 32 (2.2%) |
| Total (Category) | 3,165 (95.2%) | 161 (4.8%) |
| Total (Overall) | 13,453 (58.5%) | 9,530 (41.5%) |
Production, Transportation and Moving Occupations
The most common Production, Transportation and Moving occupations in Hanford are Production (1,377 | 6.0%), Material Moving (1,127 | 4.9%), and Transportation (933 | 4.1%).
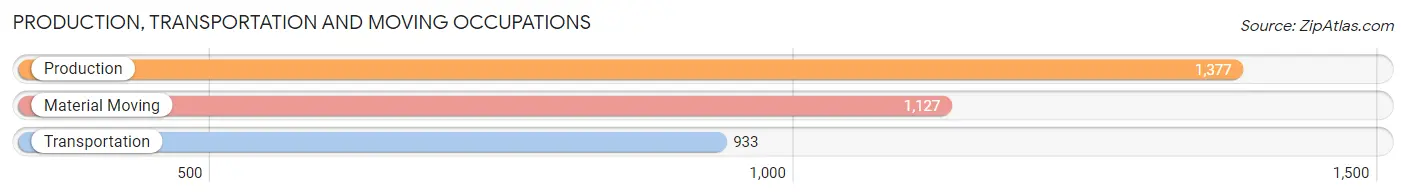
Production, Transportation and Moving Occupations by Sex
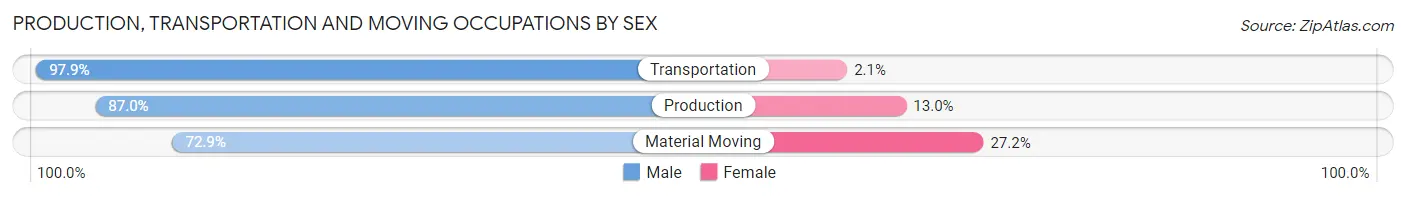
| Occupation | Male | Female |
| Production | 1,198 (87.0%) | 179 (13.0%) |
| Transportation | 913 (97.9%) | 20 (2.1%) |
| Material Moving | 821 (72.9%) | 306 (27.2%) |
| Total (Category) | 2,932 (85.3%) | 505 (14.7%) |
| Total (Overall) | 13,453 (58.5%) | 9,530 (41.5%) |
Employment Industries by Sex in Hanford
Employment Industries in Hanford
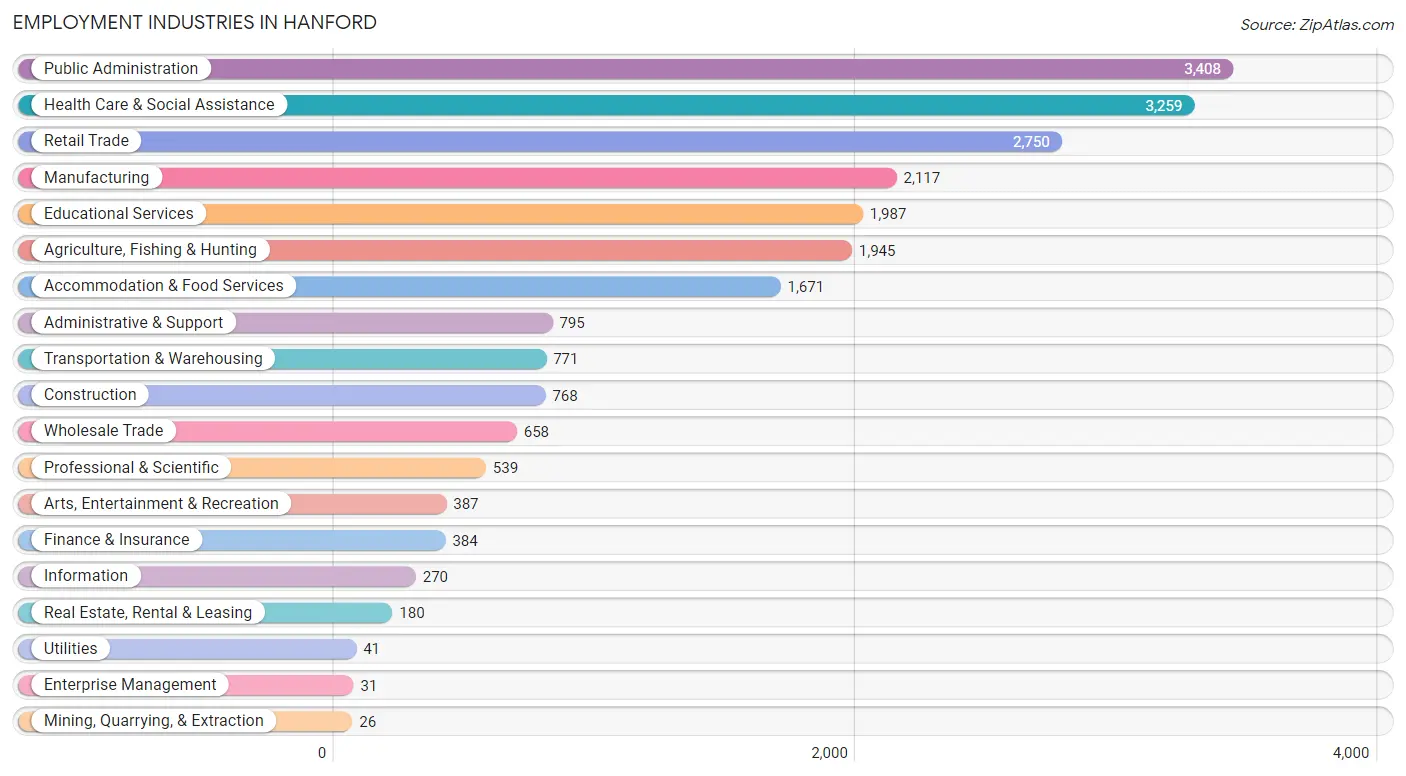
The major employment industries in Hanford include Public Administration (3,408 | 14.8%), Health Care & Social Assistance (3,259 | 14.2%), Retail Trade (2,750 | 12.0%), Manufacturing (2,117 | 9.2%), and Educational Services (1,987 | 8.6%).
Employment Industries by Sex in Hanford
The Hanford industries that see more men than women are Mining, Quarrying, & Extraction (100.0%), Utilities (100.0%), and Construction (96.5%), whereas the industries that tend to have a higher number of women are Enterprise Management (100.0%), Finance & Insurance (89.8%), and Real Estate, Rental & Leasing (79.4%).
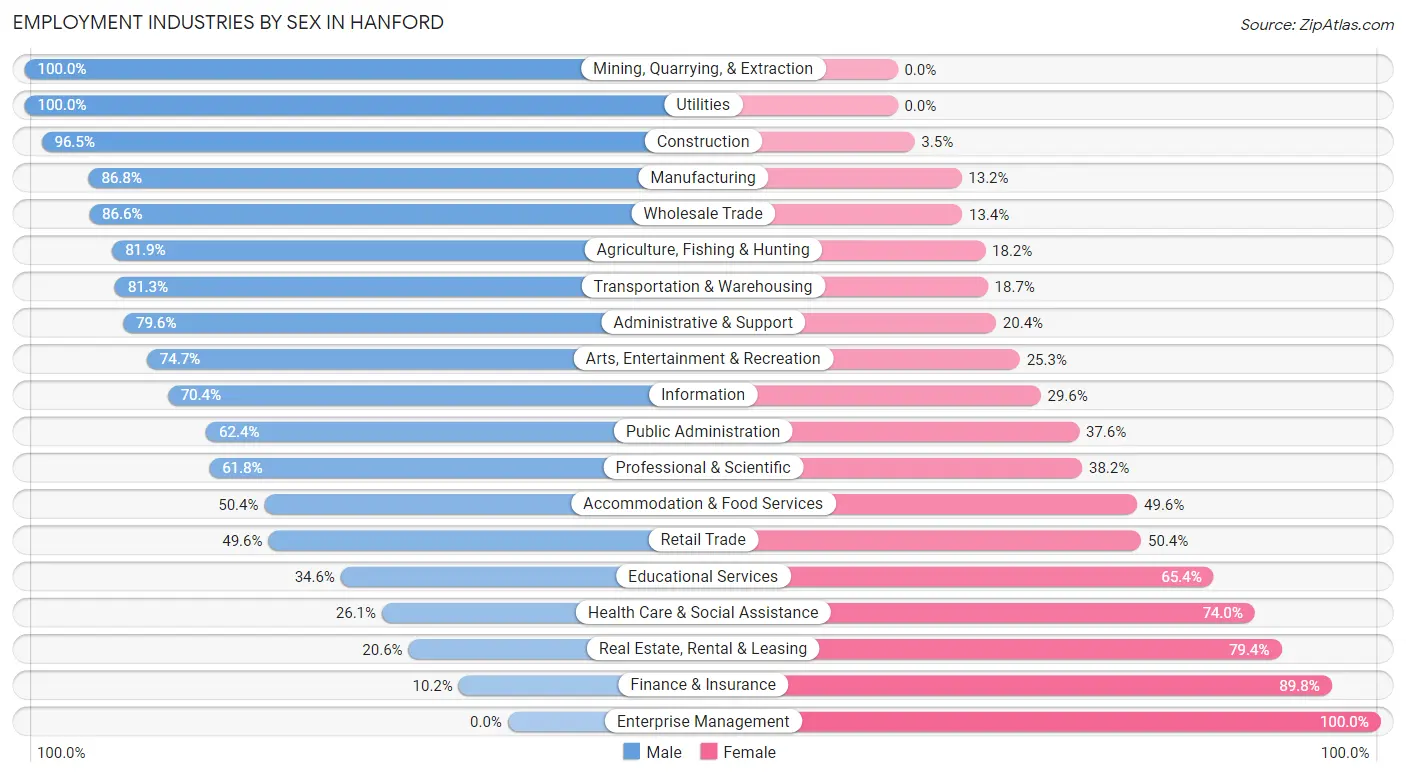
| Industry | Male | Female |
| Agriculture, Fishing & Hunting | 1,592 (81.9%) | 353 (18.1%) |
| Mining, Quarrying, & Extraction | 26 (100.0%) | 0 (0.0%) |
| Construction | 741 (96.5%) | 27 (3.5%) |
| Manufacturing | 1,837 (86.8%) | 280 (13.2%) |
| Wholesale Trade | 570 (86.6%) | 88 (13.4%) |
| Retail Trade | 1,363 (49.6%) | 1,387 (50.4%) |
| Transportation & Warehousing | 627 (81.3%) | 144 (18.7%) |
| Utilities | 41 (100.0%) | 0 (0.0%) |
| Information | 190 (70.4%) | 80 (29.6%) |
| Finance & Insurance | 39 (10.2%) | 345 (89.8%) |
| Real Estate, Rental & Leasing | 37 (20.6%) | 143 (79.4%) |
| Professional & Scientific | 333 (61.8%) | 206 (38.2%) |
| Enterprise Management | 0 (0.0%) | 31 (100.0%) |
| Administrative & Support | 633 (79.6%) | 162 (20.4%) |
| Educational Services | 687 (34.6%) | 1,300 (65.4%) |
| Health Care & Social Assistance | 849 (26.1%) | 2,410 (74.0%) |
| Arts, Entertainment & Recreation | 289 (74.7%) | 98 (25.3%) |
| Accommodation & Food Services | 842 (50.4%) | 829 (49.6%) |
| Public Administration | 2,127 (62.4%) | 1,281 (37.6%) |
| Total | 13,453 (58.5%) | 9,530 (41.5%) |
Education in Hanford
School Enrollment in Hanford
The most common levels of schooling among the 16,782 students in Hanford are middle school (4,016 | 23.9%), high school (3,975 | 23.7%), and elementary school (3,731 | 22.2%).
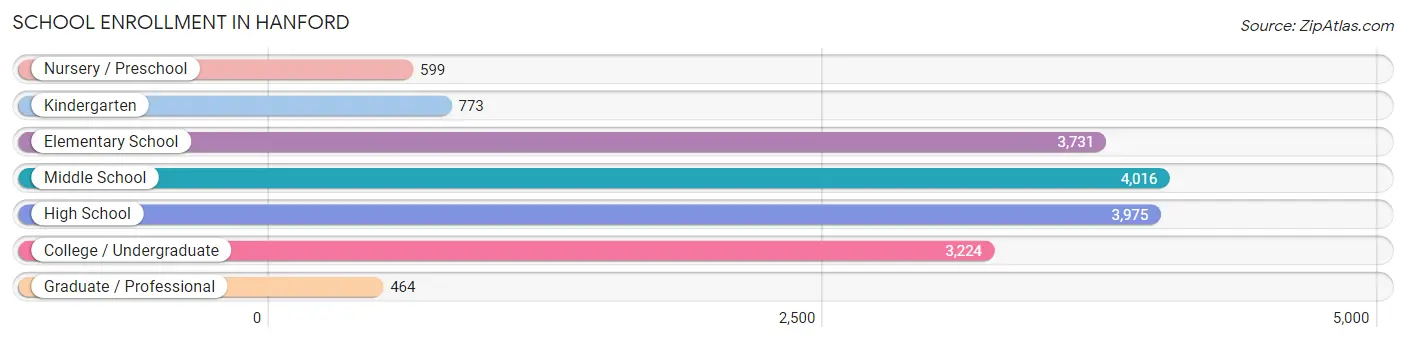
| School Level | # Students | % Students |
| Nursery / Preschool | 599 | 3.6% |
| Kindergarten | 773 | 4.6% |
| Elementary School | 3,731 | 22.2% |
| Middle School | 4,016 | 23.9% |
| High School | 3,975 | 23.7% |
| College / Undergraduate | 3,224 | 19.2% |
| Graduate / Professional | 464 | 2.8% |
| Total | 16,782 | 100.0% |
School Enrollment by Age by Funding Source in Hanford
Out of a total of 16,782 students who are enrolled in schools in Hanford, 1,729 (10.3%) attend a private institution, while the remaining 15,053 (89.7%) are enrolled in public schools. The age group of 35 years and over has the highest likelihood of being enrolled in private schools, with 503 (47.5% in the age bracket) enrolled. Conversely, the age group of 5 to 9 year old has the lowest likelihood of being enrolled in a private school, with 3,795 (96.9% in the age bracket) attending a public institution.
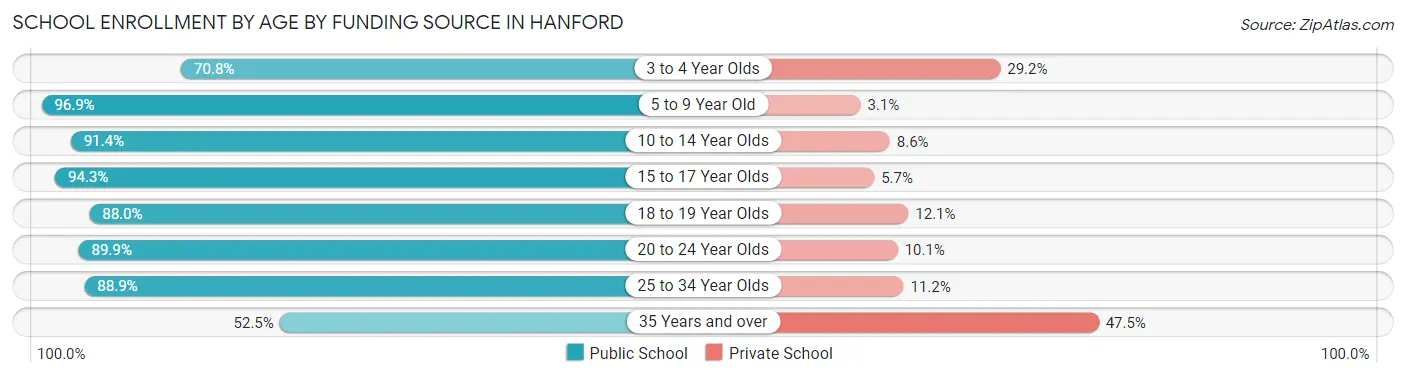
| Age Bracket | Public School | Private School |
| 3 to 4 Year Olds | 323 (70.8%) | 133 (29.2%) |
| 5 to 9 Year Old | 3,795 (96.9%) | 123 (3.1%) |
| 10 to 14 Year Olds | 5,154 (91.4%) | 485 (8.6%) |
| 15 to 17 Year Olds | 2,602 (94.3%) | 157 (5.7%) |
| 18 to 19 Year Olds | 664 (87.9%) | 91 (12.0%) |
| 20 to 24 Year Olds | 1,136 (89.9%) | 127 (10.1%) |
| 25 to 34 Year Olds | 829 (88.8%) | 104 (11.2%) |
| 35 Years and over | 556 (52.5%) | 503 (47.5%) |
| Total | 15,053 (89.7%) | 1,729 (10.3%) |
Educational Attainment by Field of Study in Hanford
Business (979 | 13.8%), liberal arts & history (941 | 13.3%), science & technology (882 | 12.4%), arts & humanities (808 | 11.4%), and social sciences (682 | 9.6%) are the most common fields of study among 7,092 individuals in Hanford who have obtained a bachelor's degree or higher.
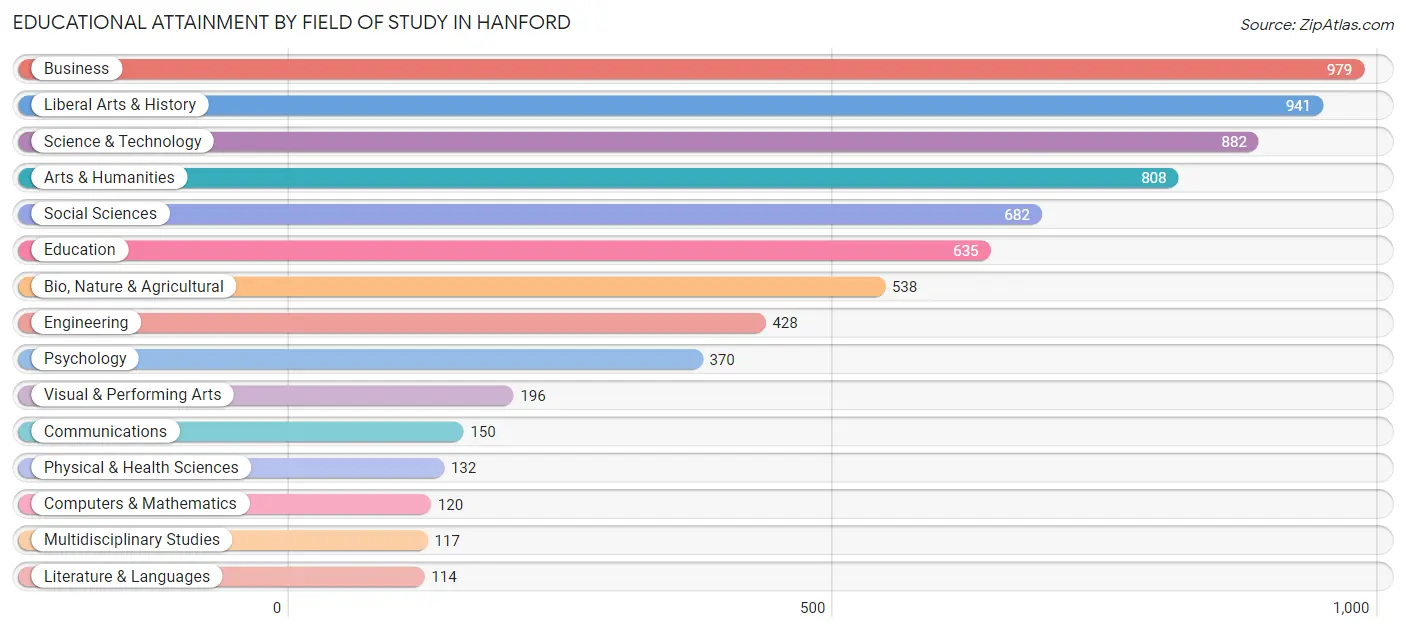
| Field of Study | # Graduates | % Graduates |
| Computers & Mathematics | 120 | 1.7% |
| Bio, Nature & Agricultural | 538 | 7.6% |
| Physical & Health Sciences | 132 | 1.9% |
| Psychology | 370 | 5.2% |
| Social Sciences | 682 | 9.6% |
| Engineering | 428 | 6.0% |
| Multidisciplinary Studies | 117 | 1.7% |
| Science & Technology | 882 | 12.4% |
| Business | 979 | 13.8% |
| Education | 635 | 8.9% |
| Literature & Languages | 114 | 1.6% |
| Liberal Arts & History | 941 | 13.3% |
| Visual & Performing Arts | 196 | 2.8% |
| Communications | 150 | 2.1% |
| Arts & Humanities | 808 | 11.4% |
| Total | 7,092 | 100.0% |
Transportation & Commute in Hanford
Vehicle Availability by Sex in Hanford
The most prevalent vehicle ownership categories in Hanford are males with 2 vehicles (6,068, accounting for 42.8%) and females with 2 vehicles (3,210, making up 65.4%).
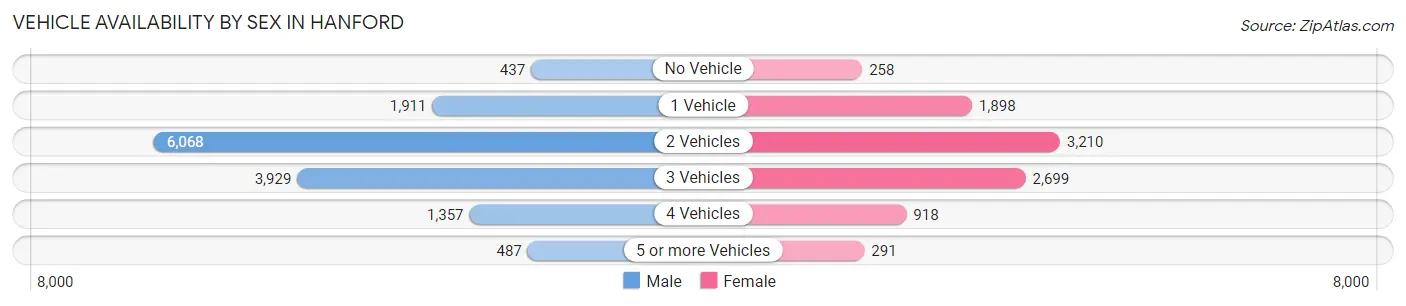
| Vehicles Available | Male | Female |
| No Vehicle | 437 (3.1%) | 258 (2.8%) |
| 1 Vehicle | 1,911 (13.5%) | 1,898 (20.5%) |
| 2 Vehicles | 6,068 (42.8%) | 3,210 (34.6%) |
| 3 Vehicles | 3,929 (27.7%) | 2,699 (29.1%) |
| 4 Vehicles | 1,357 (9.6%) | 918 (9.9%) |
| 5 or more Vehicles | 487 (3.4%) | 291 (3.1%) |
| Total | 14,189 (100.0%) | 9,274 (100.0%) |
Commute Time in Hanford
The most frequently occuring commute durations in Hanford are 5 to 9 minutes (4,171 commuters, 18.8%), 10 to 14 minutes (3,473 commuters, 15.7%), and 15 to 19 minutes (2,760 commuters, 12.5%).
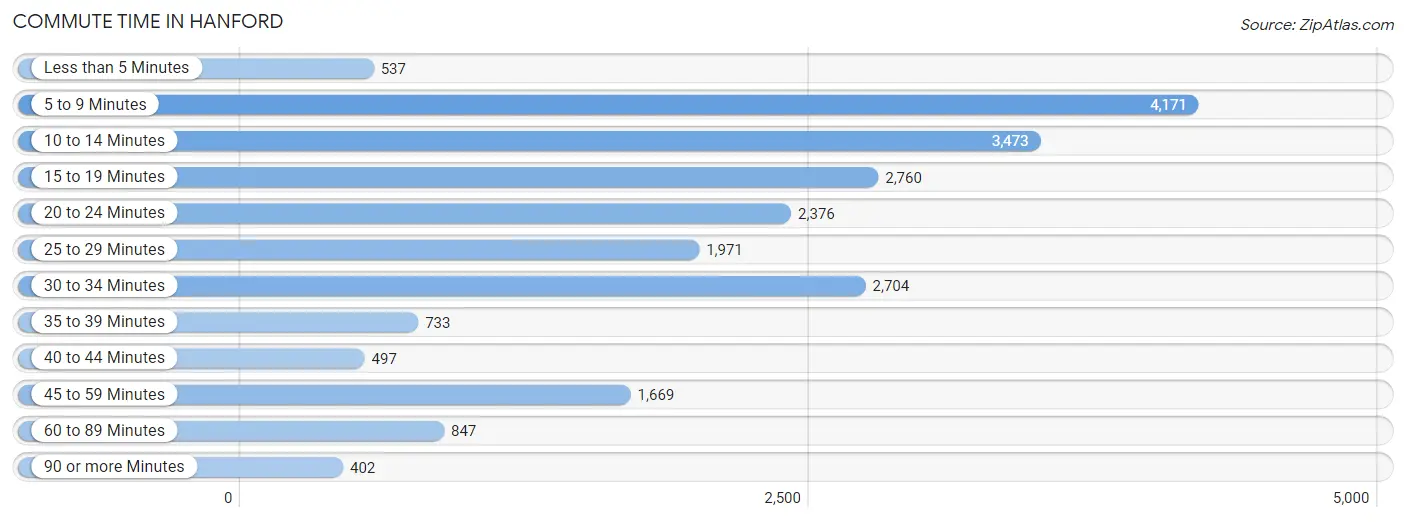
| Commute Time | # Commuters | % Commuters |
| Less than 5 Minutes | 537 | 2.4% |
| 5 to 9 Minutes | 4,171 | 18.8% |
| 10 to 14 Minutes | 3,473 | 15.7% |
| 15 to 19 Minutes | 2,760 | 12.5% |
| 20 to 24 Minutes | 2,376 | 10.7% |
| 25 to 29 Minutes | 1,971 | 8.9% |
| 30 to 34 Minutes | 2,704 | 12.2% |
| 35 to 39 Minutes | 733 | 3.3% |
| 40 to 44 Minutes | 497 | 2.2% |
| 45 to 59 Minutes | 1,669 | 7.5% |
| 60 to 89 Minutes | 847 | 3.8% |
| 90 or more Minutes | 402 | 1.8% |
Commute Time by Sex in Hanford
The most common commute times in Hanford are 5 to 9 minutes (1,950 commuters, 14.4%) for males and 5 to 9 minutes (2,221 commuters, 25.9%) for females.
| Commute Time | Male | Female |
| Less than 5 Minutes | 359 (2.6%) | 178 (2.1%) |
| 5 to 9 Minutes | 1,950 (14.4%) | 2,221 (25.9%) |
| 10 to 14 Minutes | 1,829 (13.5%) | 1,644 (19.2%) |
| 15 to 19 Minutes | 1,875 (13.8%) | 885 (10.3%) |
| 20 to 24 Minutes | 1,801 (13.3%) | 575 (6.7%) |
| 25 to 29 Minutes | 1,275 (9.4%) | 696 (8.1%) |
| 30 to 34 Minutes | 1,717 (12.7%) | 987 (11.5%) |
| 35 to 39 Minutes | 526 (3.9%) | 207 (2.4%) |
| 40 to 44 Minutes | 274 (2.0%) | 223 (2.6%) |
| 45 to 59 Minutes | 993 (7.3%) | 676 (7.9%) |
| 60 to 89 Minutes | 592 (4.4%) | 255 (3.0%) |
| 90 or more Minutes | 387 (2.9%) | 15 (0.2%) |
Time of Departure to Work by Sex in Hanford
The most frequent times of departure to work in Hanford are 6:00 AM to 6:29 AM (2,035, 15.0%) for males and 8:00 AM to 8:29 AM (1,223, 14.3%) for females.
| Time of Departure | Male | Female |
| 12:00 AM to 4:59 AM | 1,626 (12.0%) | 315 (3.7%) |
| 5:00 AM to 5:29 AM | 1,270 (9.3%) | 360 (4.2%) |
| 5:30 AM to 5:59 AM | 1,375 (10.1%) | 366 (4.3%) |
| 6:00 AM to 6:29 AM | 2,035 (15.0%) | 750 (8.8%) |
| 6:30 AM to 6:59 AM | 1,147 (8.5%) | 671 (7.8%) |
| 7:00 AM to 7:29 AM | 1,052 (7.7%) | 1,023 (11.9%) |
| 7:30 AM to 7:59 AM | 1,106 (8.2%) | 1,209 (14.1%) |
| 8:00 AM to 8:29 AM | 715 (5.3%) | 1,223 (14.3%) |
| 8:30 AM to 8:59 AM | 158 (1.2%) | 230 (2.7%) |
| 9:00 AM to 9:59 AM | 449 (3.3%) | 363 (4.2%) |
| 10:00 AM to 10:59 AM | 346 (2.5%) | 328 (3.8%) |
| 11:00 AM to 11:59 AM | 263 (1.9%) | 91 (1.1%) |
| 12:00 PM to 3:59 PM | 1,071 (7.9%) | 779 (9.1%) |
| 4:00 PM to 11:59 PM | 965 (7.1%) | 854 (10.0%) |
| Total | 13,578 (100.0%) | 8,562 (100.0%) |
Housing Occupancy in Hanford
Occupancy by Ownership in Hanford
Of the total 18,495 dwellings in Hanford, owner-occupied units account for 11,444 (61.9%), while renter-occupied units make up 7,051 (38.1%).
| Occupancy | # Housing Units | % Housing Units |
| Owner Occupied Housing Units | 11,444 | 61.9% |
| Renter-Occupied Housing Units | 7,051 | 38.1% |
| Total Occupied Housing Units | 18,495 | 100.0% |
Occupancy by Household Size in Hanford
| Household Size | # Housing Units | % Housing Units |
| 1-Person Household | 3,589 | 19.4% |
| 2-Person Household | 5,772 | 31.2% |
| 3-Person Household | 2,916 | 15.8% |
| 4+ Person Household | 6,218 | 33.6% |
| Total Housing Units | 18,495 | 100.0% |
Occupancy by Ownership by Household Size in Hanford
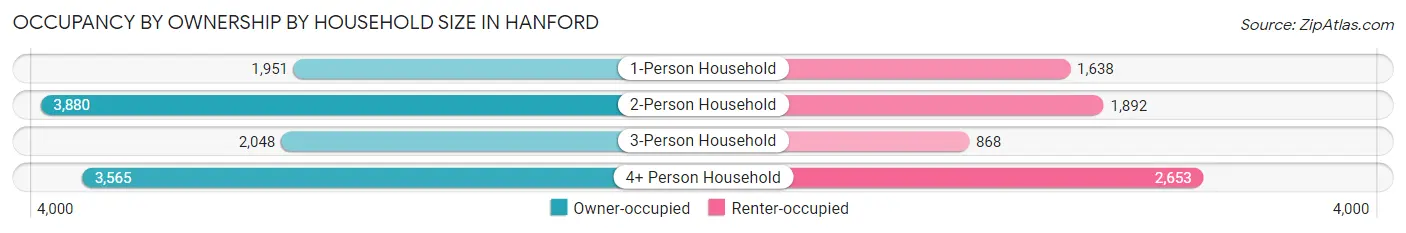
| Household Size | Owner-occupied | Renter-occupied |
| 1-Person Household | 1,951 (54.4%) | 1,638 (45.6%) |
| 2-Person Household | 3,880 (67.2%) | 1,892 (32.8%) |
| 3-Person Household | 2,048 (70.2%) | 868 (29.8%) |
| 4+ Person Household | 3,565 (57.3%) | 2,653 (42.7%) |
| Total Housing Units | 11,444 (61.9%) | 7,051 (38.1%) |
Occupancy by Educational Attainment in Hanford
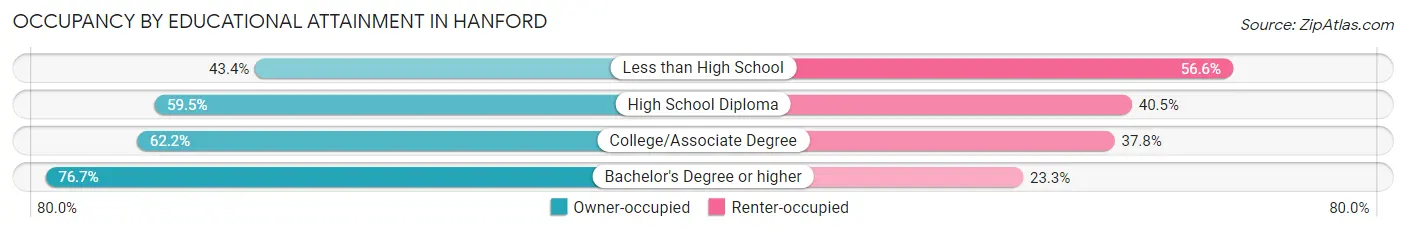
| Household Size | Owner-occupied | Renter-occupied |
| Less than High School | 1,214 (43.4%) | 1,581 (56.6%) |
| High School Diploma | 2,499 (59.5%) | 1,704 (40.5%) |
| College/Associate Degree | 4,664 (62.2%) | 2,835 (37.8%) |
| Bachelor's Degree or higher | 3,067 (76.7%) | 931 (23.3%) |
Occupancy by Age of Householder in Hanford
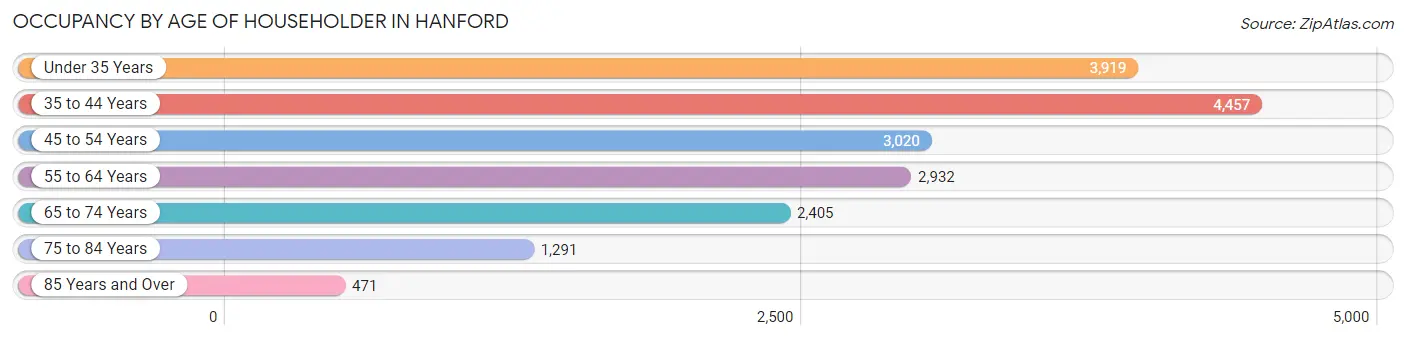
| Age Bracket | # Households | % Households |
| Under 35 Years | 3,919 | 21.2% |
| 35 to 44 Years | 4,457 | 24.1% |
| 45 to 54 Years | 3,020 | 16.3% |
| 55 to 64 Years | 2,932 | 15.9% |
| 65 to 74 Years | 2,405 | 13.0% |
| 75 to 84 Years | 1,291 | 7.0% |
| 85 Years and Over | 471 | 2.5% |
| Total | 18,495 | 100.0% |
Housing Finances in Hanford
Median Income by Occupancy in Hanford
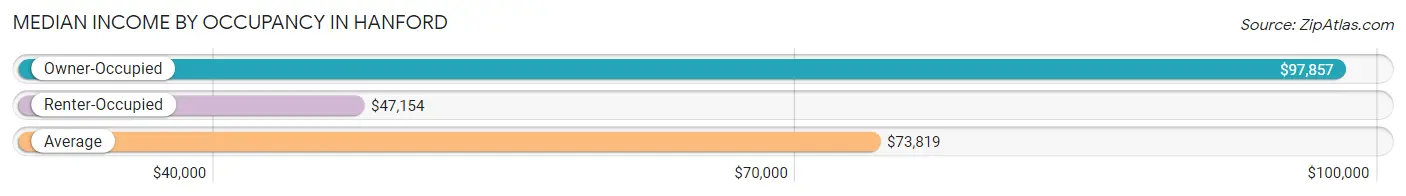
| Occupancy Type | # Households | Median Income |
| Owner-Occupied | 11,444 (61.9%) | $97,857 |
| Renter-Occupied | 7,051 (38.1%) | $47,154 |
| Average | 18,495 (100.0%) | $73,819 |
Occupancy by Householder Income Bracket in Hanford
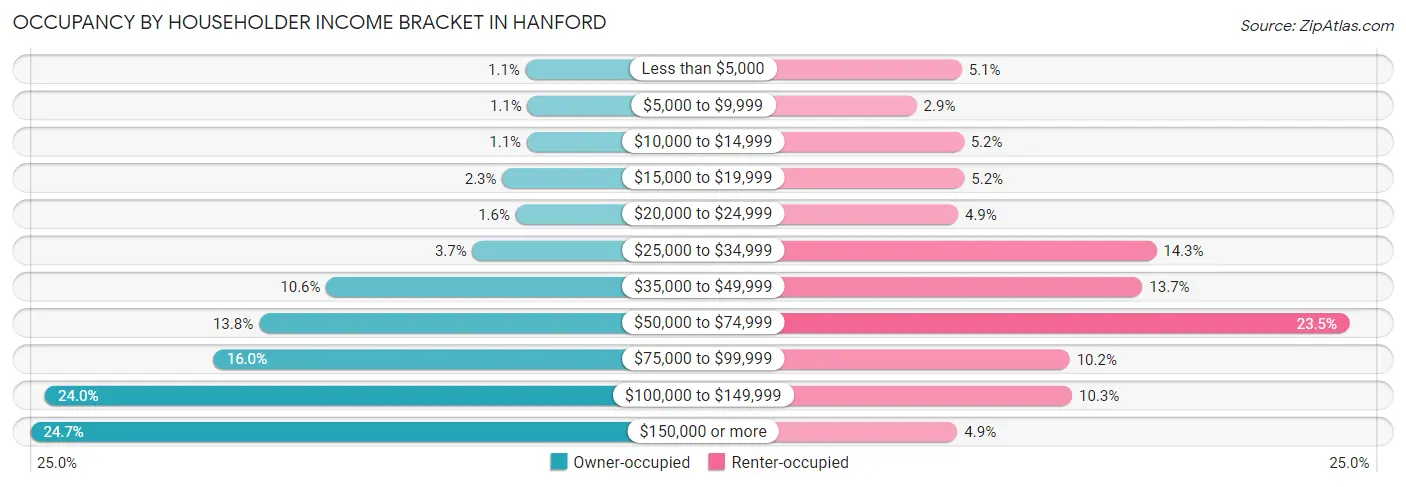
| Income Bracket | Owner-occupied | Renter-occupied |
| Less than $5,000 | 130 (1.1%) | 357 (5.1%) |
| $5,000 to $9,999 | 120 (1.1%) | 205 (2.9%) |
| $10,000 to $14,999 | 124 (1.1%) | 363 (5.1%) |
| $15,000 to $19,999 | 258 (2.2%) | 365 (5.2%) |
| $20,000 to $24,999 | 184 (1.6%) | 344 (4.9%) |
| $25,000 to $34,999 | 420 (3.7%) | 1,010 (14.3%) |
| $35,000 to $49,999 | 1,216 (10.6%) | 963 (13.7%) |
| $50,000 to $74,999 | 1,584 (13.8%) | 1,656 (23.5%) |
| $75,000 to $99,999 | 1,830 (16.0%) | 719 (10.2%) |
| $100,000 to $149,999 | 2,749 (24.0%) | 727 (10.3%) |
| $150,000 or more | 2,829 (24.7%) | 342 (4.9%) |
| Total | 11,444 (100.0%) | 7,051 (100.0%) |
Monthly Housing Cost Tiers in Hanford
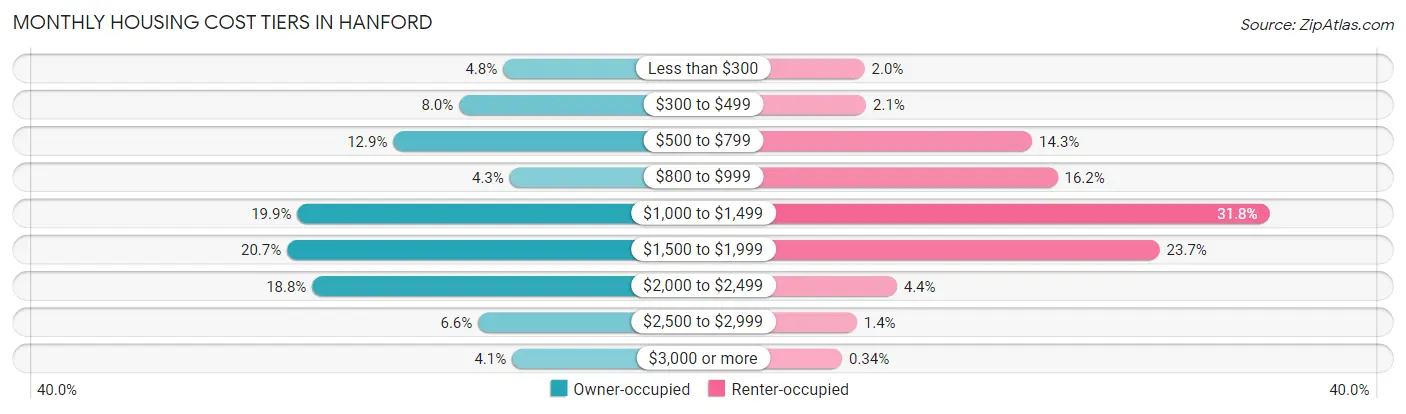
| Monthly Cost | Owner-occupied | Renter-occupied |
| Less than $300 | 545 (4.8%) | 141 (2.0%) |
| $300 to $499 | 915 (8.0%) | 149 (2.1%) |
| $500 to $799 | 1,470 (12.9%) | 1,011 (14.3%) |
| $800 to $999 | 490 (4.3%) | 1,143 (16.2%) |
| $1,000 to $1,499 | 2,280 (19.9%) | 2,243 (31.8%) |
| $1,500 to $1,999 | 2,366 (20.7%) | 1,673 (23.7%) |
| $2,000 to $2,499 | 2,154 (18.8%) | 308 (4.4%) |
| $2,500 to $2,999 | 755 (6.6%) | 101 (1.4%) |
| $3,000 or more | 469 (4.1%) | 24 (0.3%) |
| Total | 11,444 (100.0%) | 7,051 (100.0%) |
Physical Housing Characteristics in Hanford
Housing Structures in Hanford
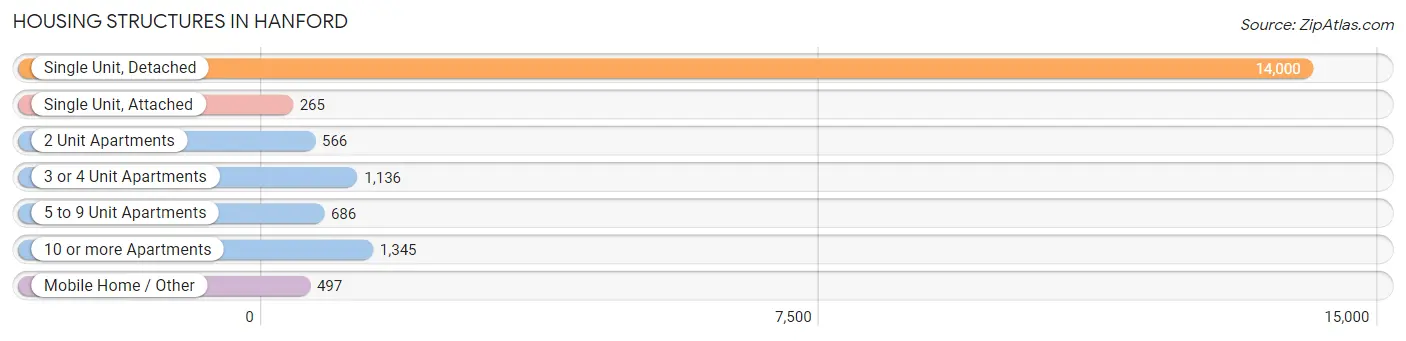
| Structure Type | # Housing Units | % Housing Units |
| Single Unit, Detached | 14,000 | 75.7% |
| Single Unit, Attached | 265 | 1.4% |
| 2 Unit Apartments | 566 | 3.1% |
| 3 or 4 Unit Apartments | 1,136 | 6.1% |
| 5 to 9 Unit Apartments | 686 | 3.7% |
| 10 or more Apartments | 1,345 | 7.3% |
| Mobile Home / Other | 497 | 2.7% |
| Total | 18,495 | 100.0% |
Housing Structures by Occupancy in Hanford
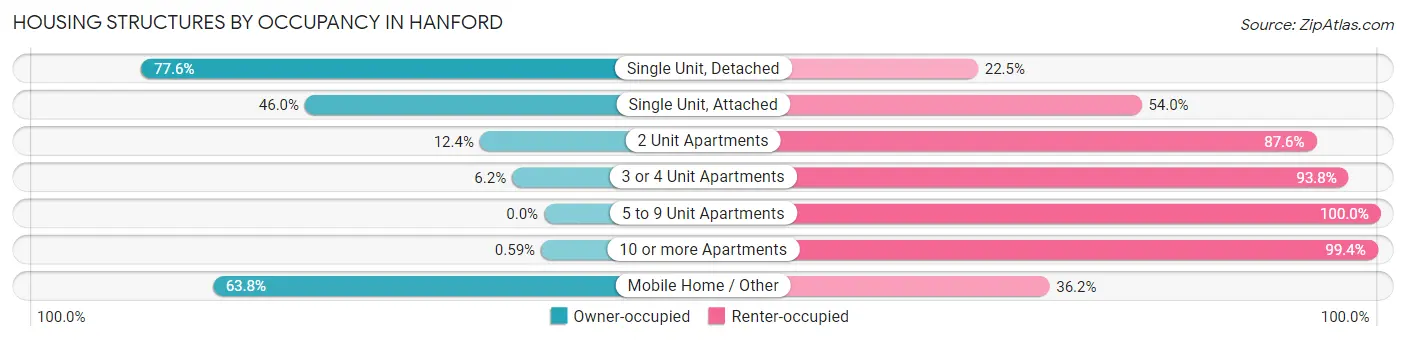
| Structure Type | Owner-occupied | Renter-occupied |
| Single Unit, Detached | 10,857 (77.5%) | 3,143 (22.5%) |
| Single Unit, Attached | 122 (46.0%) | 143 (54.0%) |
| 2 Unit Apartments | 70 (12.4%) | 496 (87.6%) |
| 3 or 4 Unit Apartments | 70 (6.2%) | 1,066 (93.8%) |
| 5 to 9 Unit Apartments | 0 (0.0%) | 686 (100.0%) |
| 10 or more Apartments | 8 (0.6%) | 1,337 (99.4%) |
| Mobile Home / Other | 317 (63.8%) | 180 (36.2%) |
| Total | 11,444 (61.9%) | 7,051 (38.1%) |
Housing Structures by Number of Rooms in Hanford
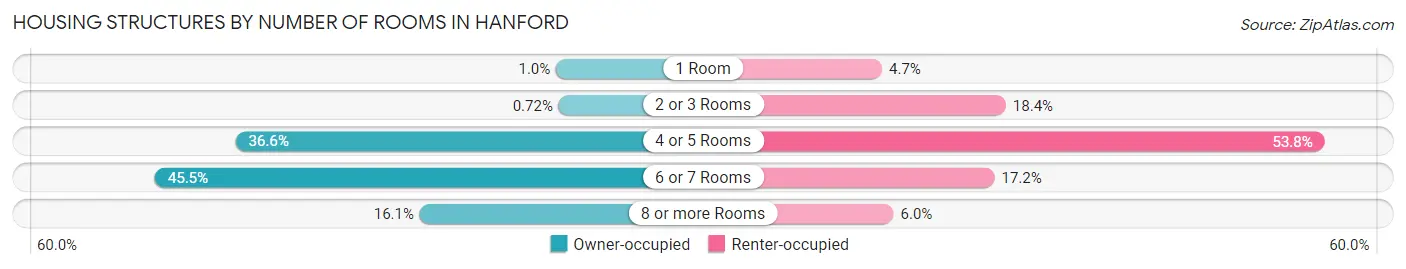
| Number of Rooms | Owner-occupied | Renter-occupied |
| 1 Room | 116 (1.0%) | 330 (4.7%) |
| 2 or 3 Rooms | 82 (0.7%) | 1,299 (18.4%) |
| 4 or 5 Rooms | 4,187 (36.6%) | 3,792 (53.8%) |
| 6 or 7 Rooms | 5,212 (45.5%) | 1,210 (17.2%) |
| 8 or more Rooms | 1,847 (16.1%) | 420 (6.0%) |
| Total | 11,444 (100.0%) | 7,051 (100.0%) |
Housing Structure by Heating Type in Hanford
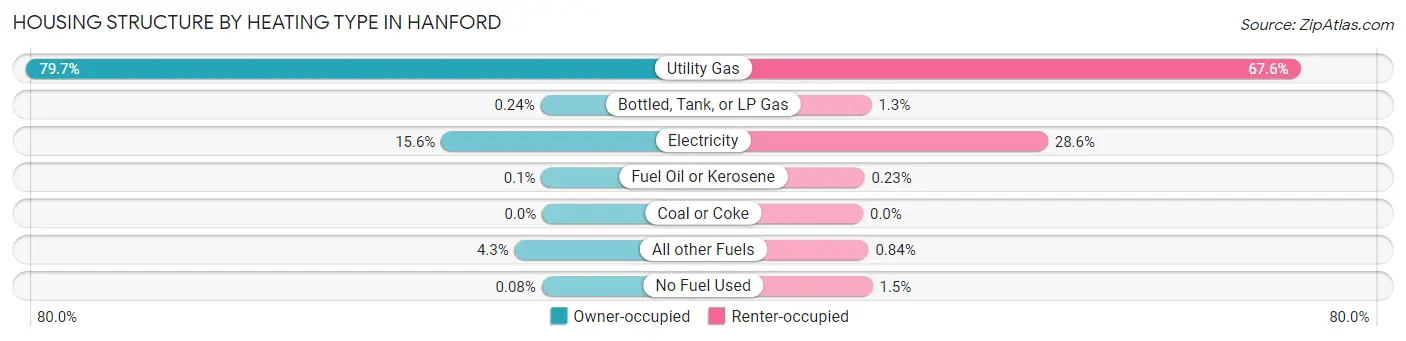
| Heating Type | Owner-occupied | Renter-occupied |
| Utility Gas | 9,124 (79.7%) | 4,767 (67.6%) |
| Bottled, Tank, or LP Gas | 28 (0.2%) | 92 (1.3%) |
| Electricity | 1,785 (15.6%) | 2,014 (28.6%) |
| Fuel Oil or Kerosene | 11 (0.1%) | 16 (0.2%) |
| Coal or Coke | 0 (0.0%) | 0 (0.0%) |
| All other Fuels | 487 (4.3%) | 59 (0.8%) |
| No Fuel Used | 9 (0.1%) | 103 (1.5%) |
| Total | 11,444 (100.0%) | 7,051 (100.0%) |
Household Vehicle Usage in Hanford
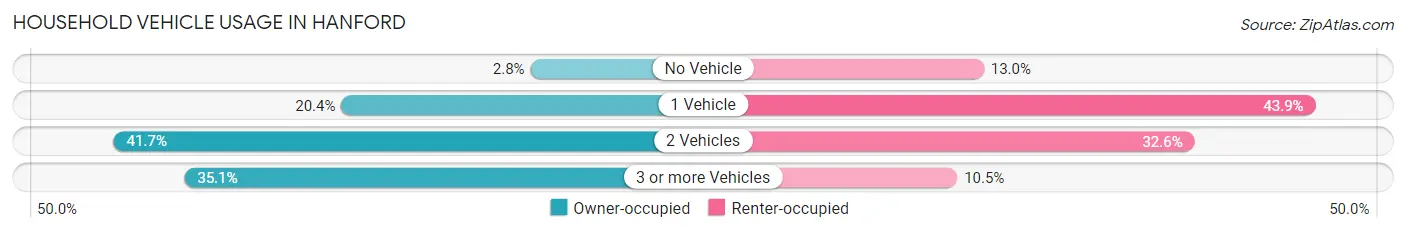
| Vehicles per Household | Owner-occupied | Renter-occupied |
| No Vehicle | 318 (2.8%) | 914 (13.0%) |
| 1 Vehicle | 2,339 (20.4%) | 3,097 (43.9%) |
| 2 Vehicles | 4,771 (41.7%) | 2,301 (32.6%) |
| 3 or more Vehicles | 4,016 (35.1%) | 739 (10.5%) |
| Total | 11,444 (100.0%) | 7,051 (100.0%) |
Real Estate & Mortgages in Hanford
Real Estate and Mortgage Overview in Hanford
| Characteristic | Without Mortgage | With Mortgage |
| Housing Units | 3,344 | 8,100 |
| Median Property Value | $271,900 | $299,100 |
| Median Household Income | $75,968 | $2,171 |
| Monthly Housing Costs | $546 | $405 |
| Real Estate Taxes | $2,047 | $200 |
Property Value by Mortgage Status in Hanford
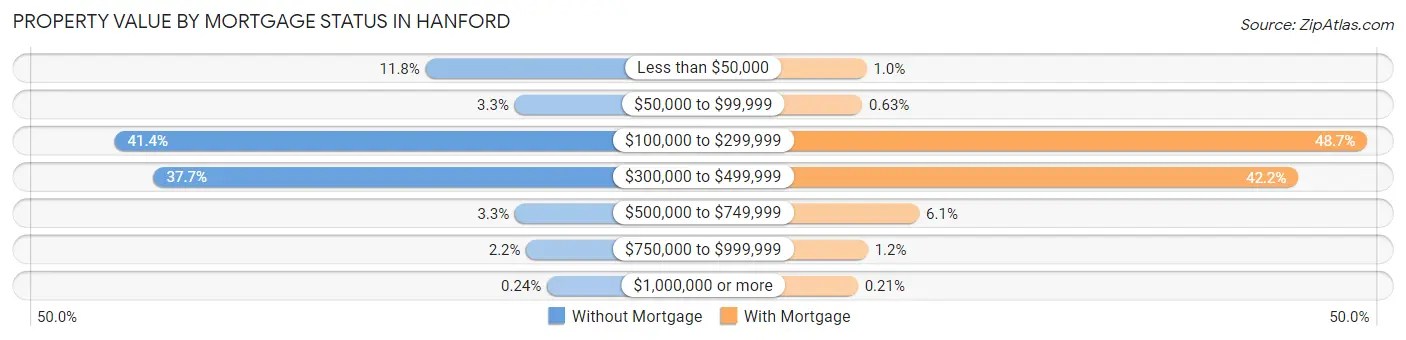
| Property Value | Without Mortgage | With Mortgage |
| Less than $50,000 | 395 (11.8%) | 84 (1.0%) |
| $50,000 to $99,999 | 111 (3.3%) | 51 (0.6%) |
| $100,000 to $299,999 | 1,385 (41.4%) | 3,948 (48.7%) |
| $300,000 to $499,999 | 1,261 (37.7%) | 3,415 (42.2%) |
| $500,000 to $749,999 | 110 (3.3%) | 491 (6.1%) |
| $750,000 to $999,999 | 74 (2.2%) | 94 (1.2%) |
| $1,000,000 or more | 8 (0.2%) | 17 (0.2%) |
| Total | 3,344 (100.0%) | 8,100 (100.0%) |
Household Income by Mortgage Status in Hanford
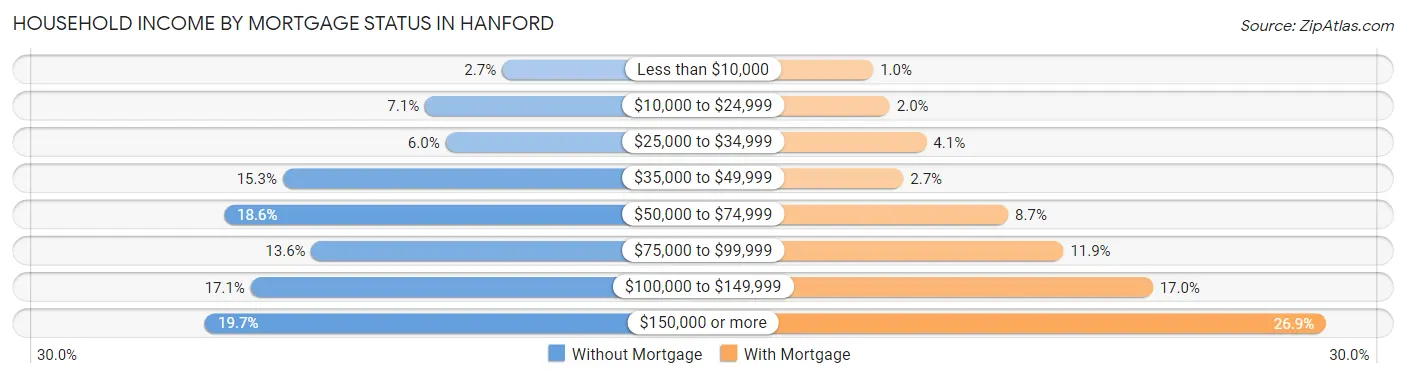
| Household Income | Without Mortgage | With Mortgage |
| Less than $10,000 | 91 (2.7%) | 82 (1.0%) |
| $10,000 to $24,999 | 238 (7.1%) | 159 (2.0%) |
| $25,000 to $34,999 | 199 (5.9%) | 328 (4.1%) |
| $35,000 to $49,999 | 510 (15.2%) | 221 (2.7%) |
| $50,000 to $74,999 | 622 (18.6%) | 706 (8.7%) |
| $75,000 to $99,999 | 455 (13.6%) | 962 (11.9%) |
| $100,000 to $149,999 | 571 (17.1%) | 1,375 (17.0%) |
| $150,000 or more | 658 (19.7%) | 2,178 (26.9%) |
| Total | 3,344 (100.0%) | 8,100 (100.0%) |
Property Value to Household Income Ratio in Hanford
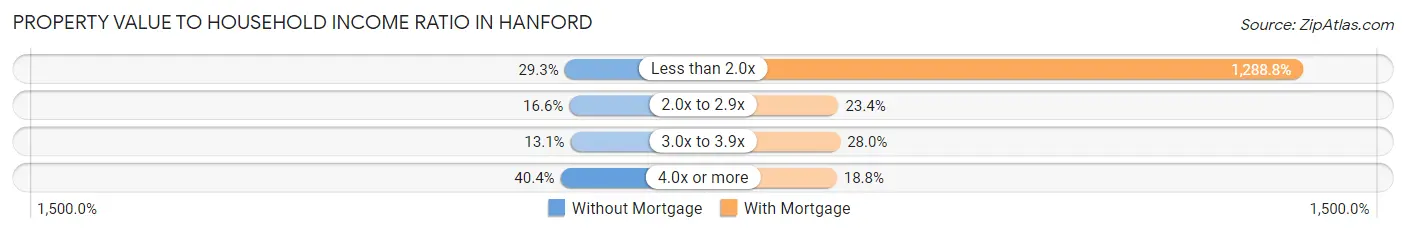
| Value-to-Income Ratio | Without Mortgage | With Mortgage |
| Less than 2.0x | 979 (29.3%) | 104,392 (1,288.8%) |
| 2.0x to 2.9x | 554 (16.6%) | 1,893 (23.4%) |
| 3.0x to 3.9x | 438 (13.1%) | 2,264 (28.0%) |
| 4.0x or more | 1,352 (40.4%) | 1,522 (18.8%) |
| Total | 3,344 (100.0%) | 8,100 (100.0%) |
Real Estate Taxes by Mortgage Status in Hanford
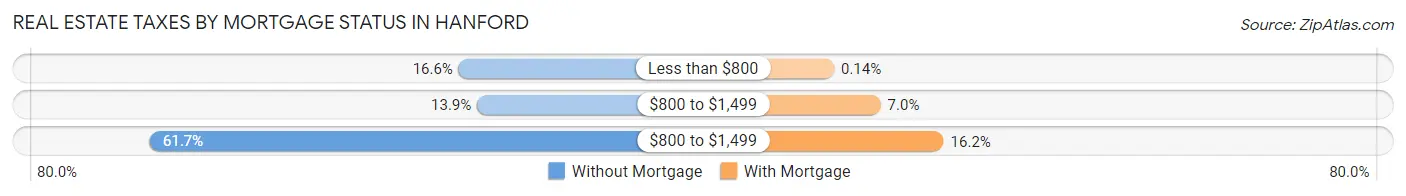
| Property Taxes | Without Mortgage | With Mortgage |
| Less than $800 | 554 (16.6%) | 11 (0.1%) |
| $800 to $1,499 | 464 (13.9%) | 564 (7.0%) |
| $800 to $1,499 | 2,063 (61.7%) | 1,309 (16.2%) |
| Total | 3,344 (100.0%) | 8,100 (100.0%) |
Health & Disability in Hanford
Health Insurance Coverage by Age in Hanford
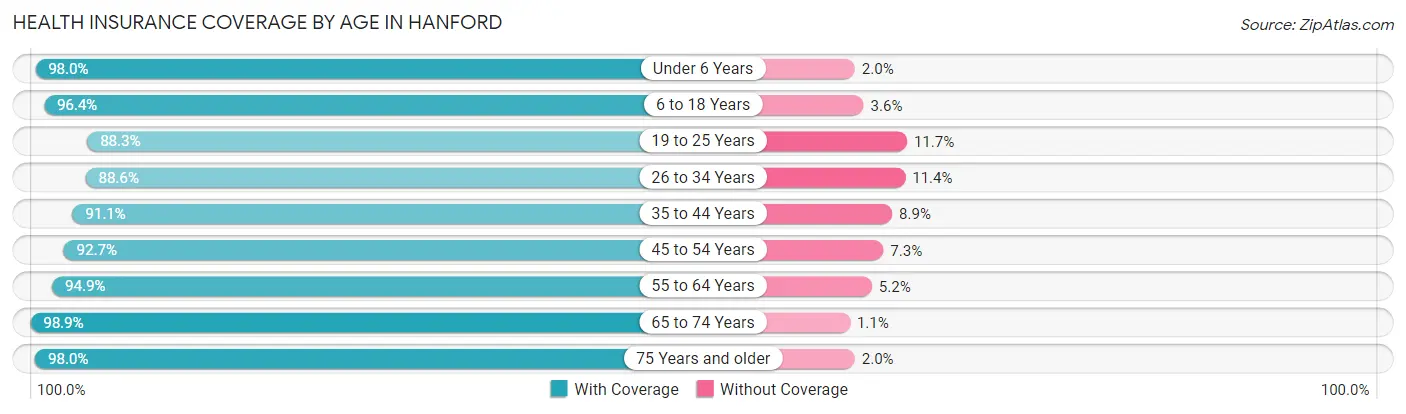
| Age Bracket | With Coverage | Without Coverage |
| Under 6 Years | 4,799 (98.0%) | 97 (2.0%) |
| 6 to 18 Years | 12,167 (96.4%) | 456 (3.6%) |
| 19 to 25 Years | 4,652 (88.3%) | 616 (11.7%) |
| 26 to 34 Years | 6,197 (88.6%) | 795 (11.4%) |
| 35 to 44 Years | 7,641 (91.1%) | 748 (8.9%) |
| 45 to 54 Years | 5,479 (92.7%) | 431 (7.3%) |
| 55 to 64 Years | 5,124 (94.9%) | 278 (5.1%) |
| 65 to 74 Years | 4,000 (98.9%) | 43 (1.1%) |
| 75 Years and older | 2,791 (98.0%) | 56 (2.0%) |
| Total | 52,850 (93.8%) | 3,520 (6.2%) |
Health Insurance Coverage by Citizenship Status in Hanford
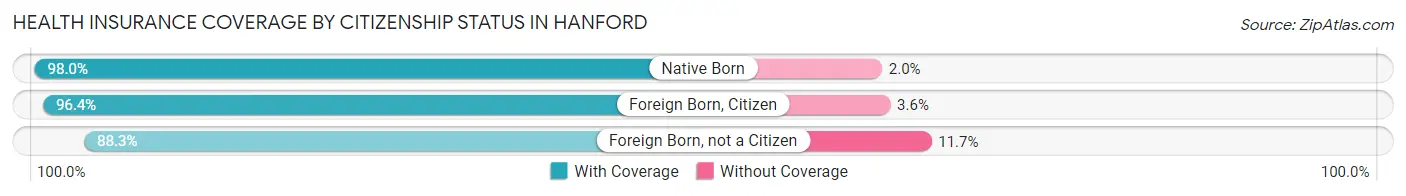
| Citizenship Status | With Coverage | Without Coverage |
| Native Born | 4,799 (98.0%) | 97 (2.0%) |
| Foreign Born, Citizen | 12,167 (96.4%) | 456 (3.6%) |
| Foreign Born, not a Citizen | 4,652 (88.3%) | 616 (11.7%) |
Health Insurance Coverage by Household Income in Hanford
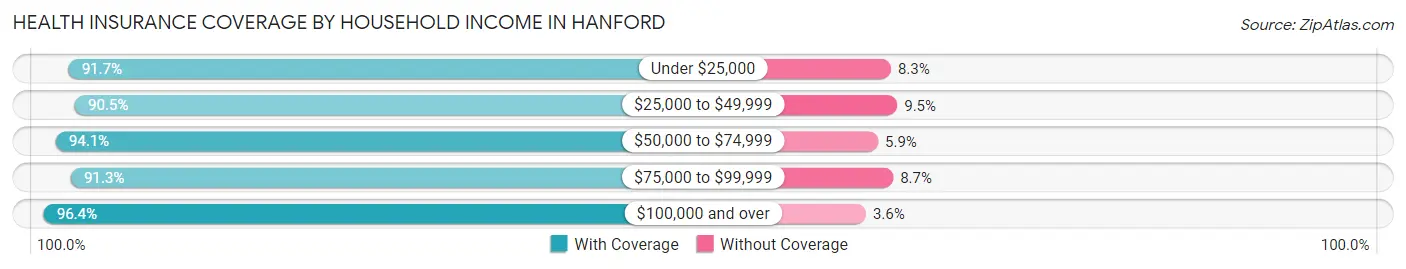
| Household Income | With Coverage | Without Coverage |
| Under $25,000 | 5,263 (91.7%) | 475 (8.3%) |
| $25,000 to $49,999 | 9,505 (90.5%) | 993 (9.5%) |
| $50,000 to $74,999 | 8,174 (94.1%) | 510 (5.9%) |
| $75,000 to $99,999 | 7,556 (91.3%) | 720 (8.7%) |
| $100,000 and over | 22,035 (96.4%) | 822 (3.6%) |
Public vs Private Health Insurance Coverage by Age in Hanford
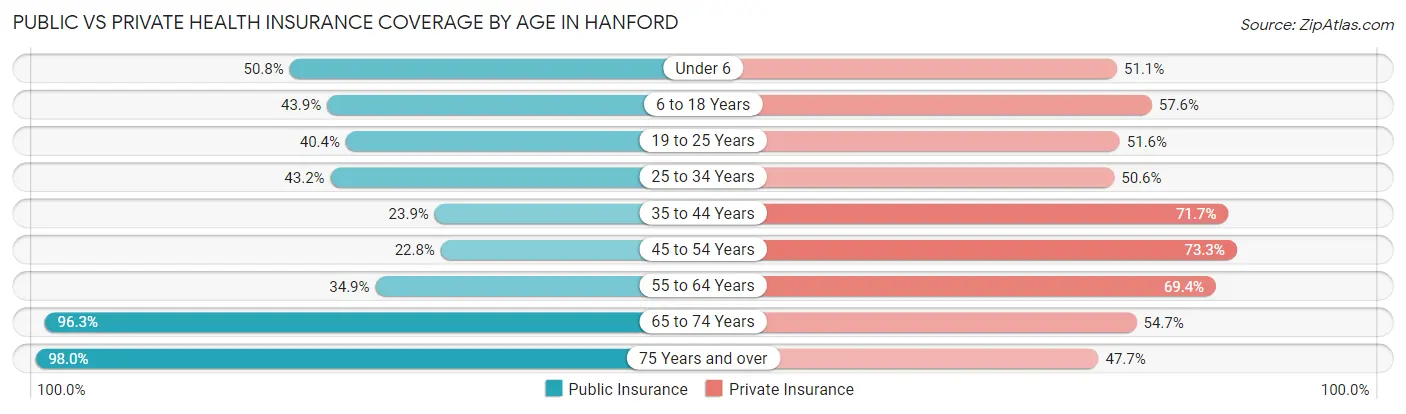
| Age Bracket | Public Insurance | Private Insurance |
| Under 6 | 2,488 (50.8%) | 2,502 (51.1%) |
| 6 to 18 Years | 5,537 (43.9%) | 7,264 (57.6%) |
| 19 to 25 Years | 2,127 (40.4%) | 2,719 (51.6%) |
| 25 to 34 Years | 3,023 (43.2%) | 3,537 (50.6%) |
| 35 to 44 Years | 2,004 (23.9%) | 6,017 (71.7%) |
| 45 to 54 Years | 1,346 (22.8%) | 4,331 (73.3%) |
| 55 to 64 Years | 1,885 (34.9%) | 3,751 (69.4%) |
| 65 to 74 Years | 3,892 (96.3%) | 2,212 (54.7%) |
| 75 Years and over | 2,791 (98.0%) | 1,357 (47.7%) |
| Total | 25,093 (44.5%) | 33,690 (59.8%) |
Disability Status by Sex by Age in Hanford
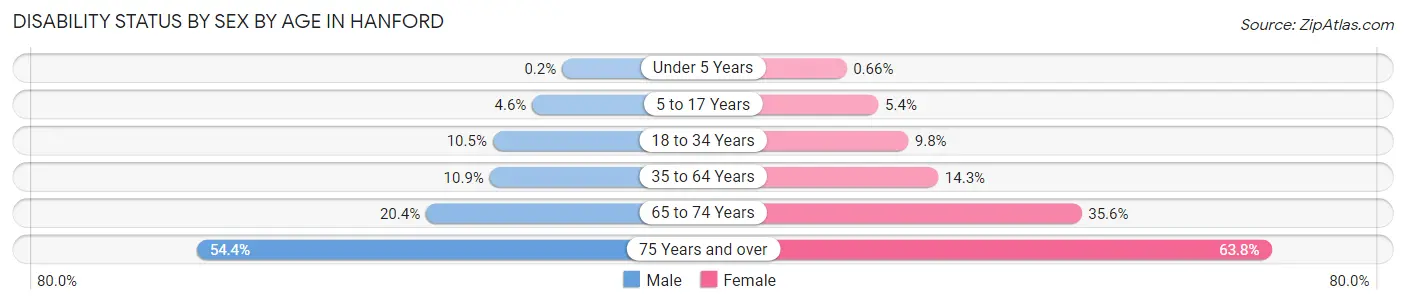
| Age Bracket | Male | Female |
| Under 5 Years | 4 (0.2%) | 14 (0.7%) |
| 5 to 17 Years | 299 (4.6%) | 340 (5.4%) |
| 18 to 34 Years | 709 (10.5%) | 602 (9.8%) |
| 35 to 64 Years | 1,139 (10.9%) | 1,326 (14.3%) |
| 65 to 74 Years | 410 (20.4%) | 723 (35.6%) |
| 75 Years and over | 603 (54.4%) | 1,109 (63.8%) |
Disability Class by Sex by Age in Hanford
Disability Class: Hearing Difficulty
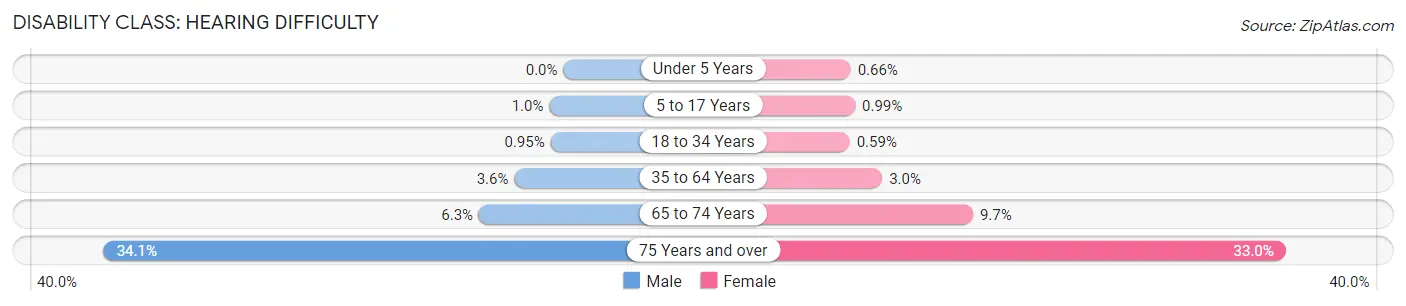
| Age Bracket | Male | Female |
| Under 5 Years | 0 (0.0%) | 14 (0.7%) |
| 5 to 17 Years | 67 (1.0%) | 62 (1.0%) |
| 18 to 34 Years | 64 (0.9%) | 36 (0.6%) |
| 35 to 64 Years | 379 (3.6%) | 279 (3.0%) |
| 65 to 74 Years | 126 (6.3%) | 198 (9.7%) |
| 75 Years and over | 378 (34.1%) | 573 (33.0%) |
Disability Class: Vision Difficulty
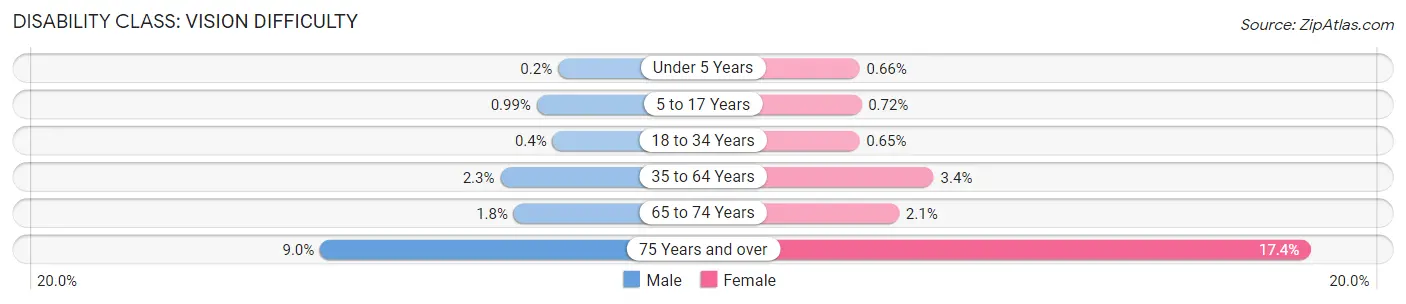
| Age Bracket | Male | Female |
| Under 5 Years | 4 (0.2%) | 14 (0.7%) |
| 5 to 17 Years | 64 (1.0%) | 45 (0.7%) |
| 18 to 34 Years | 27 (0.4%) | 40 (0.6%) |
| 35 to 64 Years | 244 (2.3%) | 317 (3.4%) |
| 65 to 74 Years | 37 (1.8%) | 43 (2.1%) |
| 75 Years and over | 100 (9.0%) | 303 (17.4%) |
Disability Class: Cognitive Difficulty
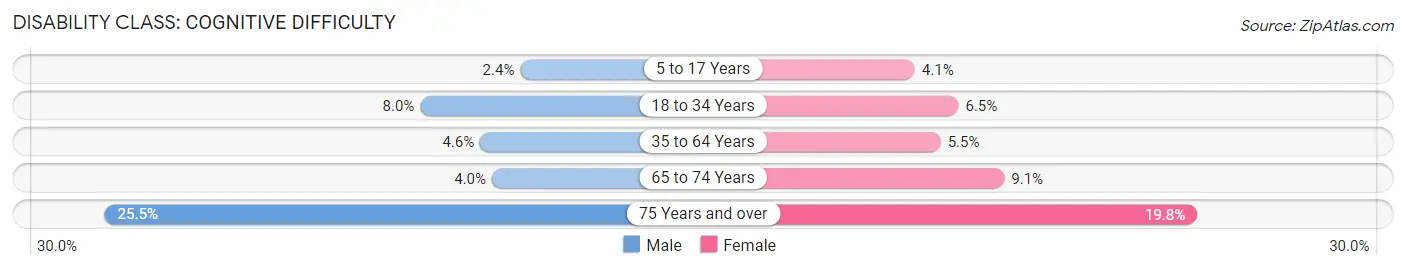
| Age Bracket | Male | Female |
| 5 to 17 Years | 155 (2.4%) | 256 (4.1%) |
| 18 to 34 Years | 539 (8.0%) | 399 (6.5%) |
| 35 to 64 Years | 483 (4.6%) | 512 (5.5%) |
| 65 to 74 Years | 80 (4.0%) | 184 (9.0%) |
| 75 Years and over | 283 (25.5%) | 344 (19.8%) |
Disability Class: Ambulatory Difficulty
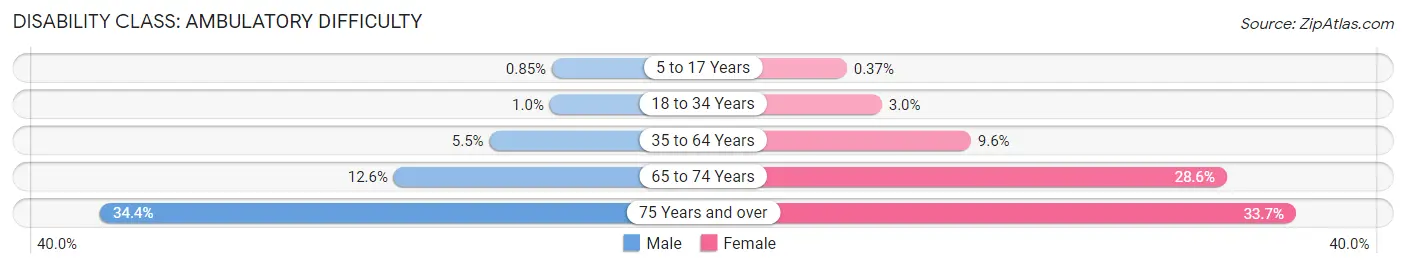
| Age Bracket | Male | Female |
| 5 to 17 Years | 55 (0.9%) | 23 (0.4%) |
| 18 to 34 Years | 68 (1.0%) | 182 (3.0%) |
| 35 to 64 Years | 572 (5.5%) | 890 (9.6%) |
| 65 to 74 Years | 253 (12.6%) | 581 (28.6%) |
| 75 Years and over | 381 (34.4%) | 586 (33.7%) |
Disability Class: Self-Care Difficulty
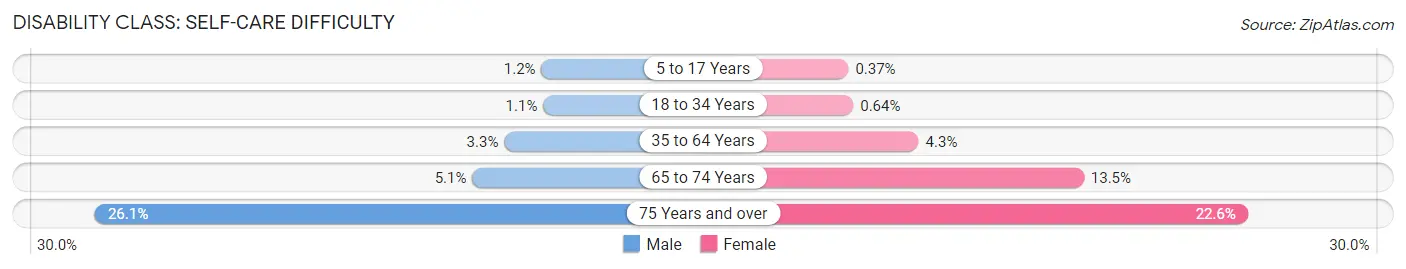
| Age Bracket | Male | Female |
| 5 to 17 Years | 79 (1.2%) | 23 (0.4%) |
| 18 to 34 Years | 76 (1.1%) | 39 (0.6%) |
| 35 to 64 Years | 343 (3.3%) | 398 (4.3%) |
| 65 to 74 Years | 102 (5.1%) | 274 (13.5%) |
| 75 Years and over | 289 (26.1%) | 393 (22.6%) |
Technology Access in Hanford
Computing Device Access in Hanford
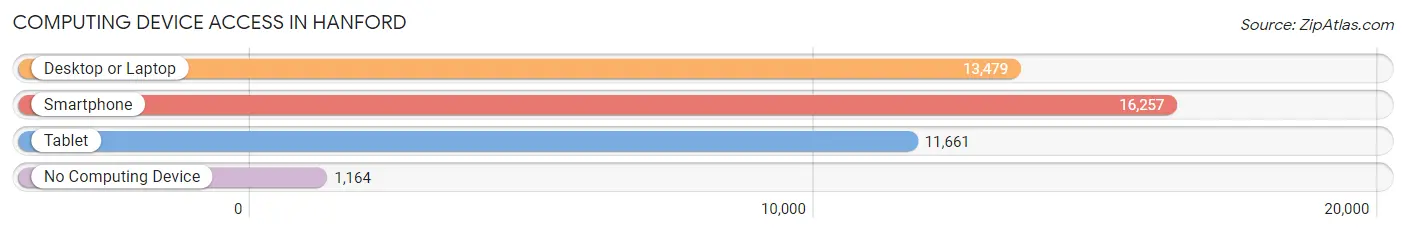
| Device Type | # Households | % Households |
| Desktop or Laptop | 13,479 | 72.9% |
| Smartphone | 16,257 | 87.9% |
| Tablet | 11,661 | 63.0% |
| No Computing Device | 1,164 | 6.3% |
| Total | 18,495 | 100.0% |
Internet Access in Hanford
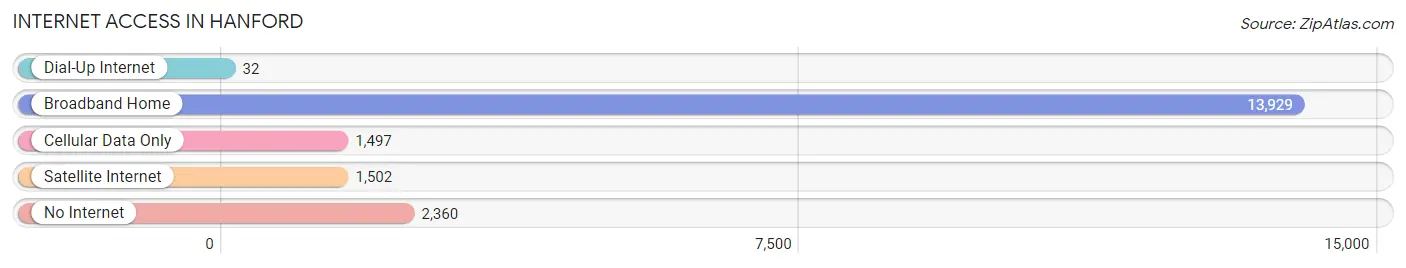
| Internet Type | # Households | % Households |
| Dial-Up Internet | 32 | 0.2% |
| Broadband Home | 13,929 | 75.3% |
| Cellular Data Only | 1,497 | 8.1% |
| Satellite Internet | 1,502 | 8.1% |
| No Internet | 2,360 | 12.8% |
| Total | 18,495 | 100.0% |
Hanford Summary
Hanford is a city located in Kings County, California, United States. The population was 55,945 at the 2010 census. Hanford is located in the San Joaquin Valley, near the Kings River. It is the county seat of Kings County and is situated in the south central portion of the county.
History
Hanford was founded in 1877 by James Madison Hanford, a former Union Army officer. The city was named after him. Hanford was originally a small agricultural community, but it grew rapidly after the completion of the Southern Pacific Railroad in 1891. The city was incorporated in 1891 and became the county seat of Kings County in 1893.
Geography
Hanford is located at 36°19'55" North, 119°38'52" West (36.3318, -119.6477). It is situated in the San Joaquin Valley, near the Kings River. The city has a total area of 11.2 square miles, all of which is land.
Economy
Hanford's economy is largely based on agriculture. The city is home to a number of large agricultural companies, including Foster Farms, Grimmway Farms, and Sun-Maid Raisins. Hanford is also home to a number of manufacturing companies, including Hanford Industries, Inc., and Hanford Machine Works.
Demographics
As of the 2010 census, there were 55,945 people, 17,845 households, and 12,845 families residing in the city. The population density was 4,988.3 people per square mile. The racial makeup of the city was 57.2% White, 2.3% African American, 1.2% Native American, 1.3% Asian, 0.2% Pacific Islander, 34.3% from other races, and 3.7% from two or more races. Hispanic or Latino of any race were 57.2% of the population.
The median income for a household in the city was $37,845, and the median income for a family was $45,845. The per capita income for the city was $17,845. About 18.2% of families and 22.2% of the population were below the poverty line, including 30.2% of those under age 18 and 11.2% of those age 65 or over.
Hanford is a diverse city with a rich history and a vibrant economy. The city is home to a number of large agricultural and manufacturing companies, and its population is largely Hispanic or Latino. The city has a median income that is slightly higher than the national average, and its poverty rate is slightly lower than the national average. Hanford is a great place to live and work, and it is a great place to visit.
Common Questions
What is Per Capita Income in Hanford?
Per Capita income in Hanford is $30,889.
What is the Median Family Income in Hanford?
Median Family Income in Hanford is $83,794.
What is the Median Household income in Hanford?
Median Household Income in Hanford is $73,819.
What is Income or Wage Gap in Hanford?
Income or Wage Gap in Hanford is 34.5%.
Women in Hanford earn 65.5 cents for every dollar earned by a man.
What is Family Income Deficit in Hanford?
Family Income Deficit in Hanford is $10,715.
Families that are below poverty line in Hanford earn $10,715 less on average than the poverty threshold level.
What is Inequality or Gini Index in Hanford?
Inequality or Gini Index in Hanford is 0.40.
What is the Total Population of Hanford?
Total Population of Hanford is 57,920.
What is the Total Male Population of Hanford?
Total Male Population of Hanford is 30,045.
What is the Total Female Population of Hanford?
Total Female Population of Hanford is 27,875.
What is the Ratio of Males per 100 Females in Hanford?
There are 107.78 Males per 100 Females in Hanford.
What is the Ratio of Females per 100 Males in Hanford?
There are 92.78 Females per 100 Males in Hanford.
What is the Median Population Age in Hanford?
Median Population Age in Hanford is 32.7 Years.
What is the Average Family Size in Hanford
Average Family Size in Hanford is 3.6 People.
What is the Average Household Size in Hanford
Average Household Size in Hanford is 3.1 People.
How Large is the Labor Force in Hanford?
There are 26,143 People in the Labor Forcein in Hanford.
What is the Percentage of People in the Labor Force in Hanford?
60.9% of People are in the Labor Force in Hanford.
What is the Unemployment Rate in Hanford?
Unemployment Rate in Hanford is 8.2%.