Denair, CA Map & Demographics
Denair Map
Denair Overview
$36,710
PER CAPITA INCOME
$94,402
AVG FAMILY INCOME
$92,234
AVG HOUSEHOLD INCOME
24.7%
WAGE / INCOME GAP [ % ]
75.3¢/ $1
WAGE / INCOME GAP [ $ ]
0.39
INEQUALITY / GINI INDEX
4,289
TOTAL POPULATION
1,874
MALE POPULATION
2,415
FEMALE POPULATION
77.60
MALES / 100 FEMALES
128.87
FEMALES / 100 MALES
40.9
MEDIAN AGE
3.3
AVG FAMILY SIZE
2.8
AVG HOUSEHOLD SIZE
2,223
LABOR FORCE [ PEOPLE ]
64.7%
PERCENT IN LABOR FORCE
8.5%
UNEMPLOYMENT RATE
Denair Zip Codes
Denair Area Codes
Income in Denair
Income Overview in Denair
Per Capita Income in Denair is $36,710, while median incomes of families and households are $94,402 and $92,234 respectively.
| Characteristic | Number | Measure |
| Per Capita Income | 4,289 | $36,710 |
| Median Family Income | 1,072 | $94,402 |
| Mean Family Income | 1,072 | $102,395 |
| Median Household Income | 1,551 | $92,234 |
| Mean Household Income | 1,551 | $100,046 |
| Income Deficit | 1,072 | $0 |
| Wage / Income Gap (%) | 4,289 | 24.74% |
| Wage / Income Gap ($) | 4,289 | 75.26¢ per $1 |
| Gini / Inequality Index | 4,289 | 0.39 |
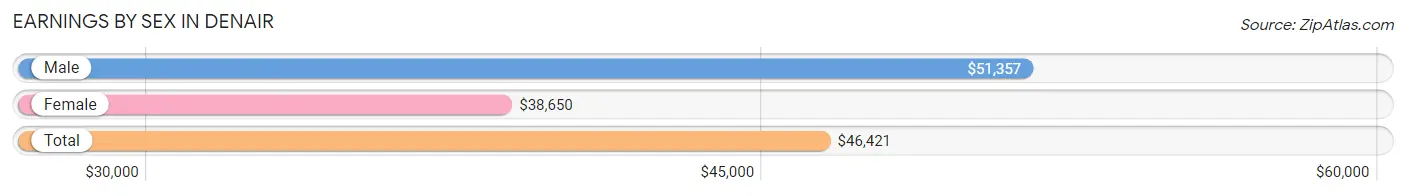
Earnings by Sex in Denair
Average Earnings in Denair are $46,421, $51,357 for men and $38,650 for women, a difference of 24.7%.
| Sex | Number | Average Earnings |
| Male | 1,267 (54.3%) | $51,357 |
| Female | 1,068 (45.7%) | $38,650 |
| Total | 2,335 (100.0%) | $46,421 |
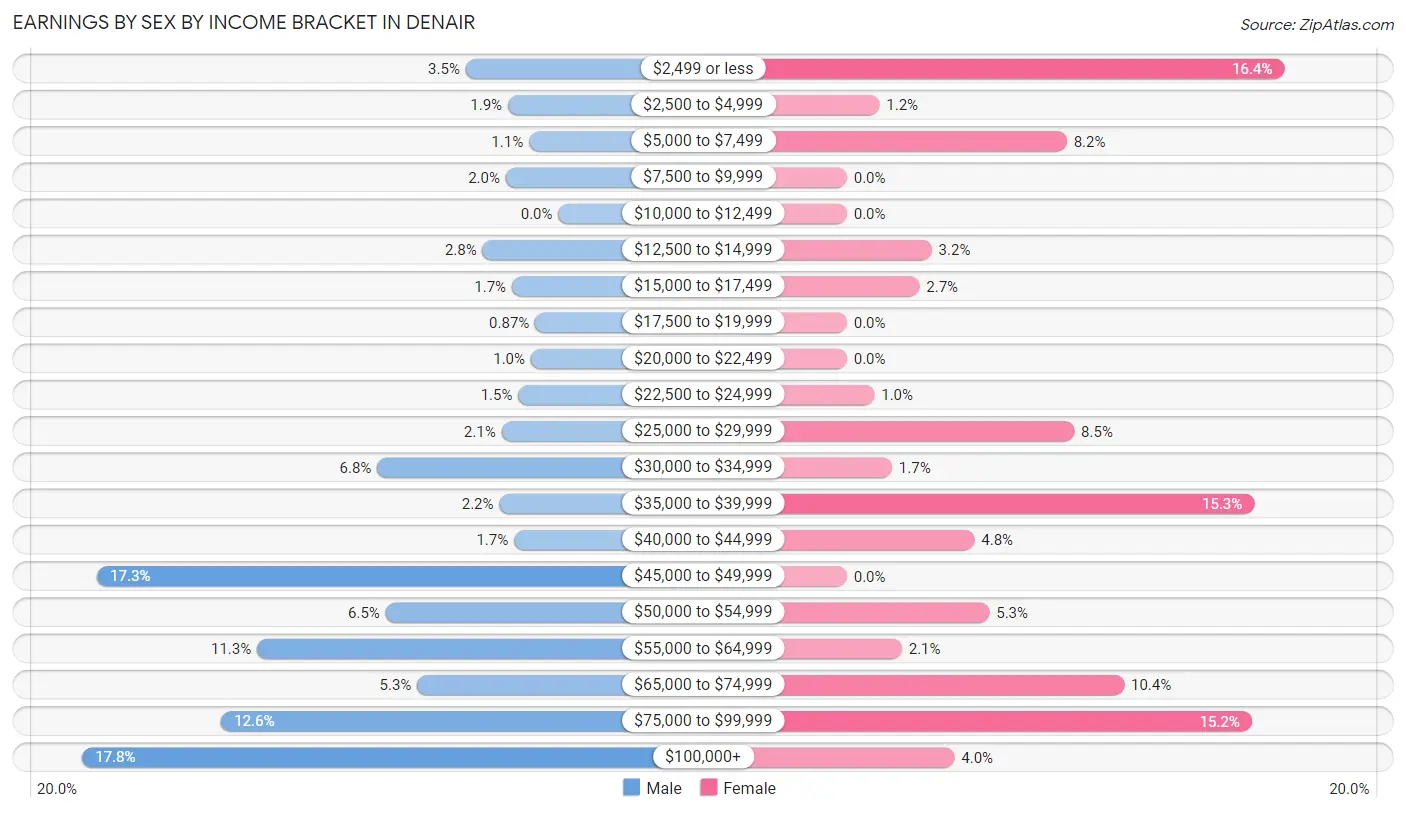
Earnings by Sex by Income Bracket in Denair
The most common earnings brackets in Denair are $100,000+ for men (226 | 17.8%) and $2,499 or less for women (175 | 16.4%).
| Income | Male | Female |
| $2,499 or less | 44 (3.5%) | 175 (16.4%) |
| $2,500 to $4,999 | 24 (1.9%) | 13 (1.2%) |
| $5,000 to $7,499 | 14 (1.1%) | 88 (8.2%) |
| $7,500 to $9,999 | 25 (2.0%) | 0 (0.0%) |
| $10,000 to $12,499 | 0 (0.0%) | 0 (0.0%) |
| $12,500 to $14,999 | 36 (2.8%) | 34 (3.2%) |
| $15,000 to $17,499 | 22 (1.7%) | 29 (2.7%) |
| $17,500 to $19,999 | 11 (0.9%) | 0 (0.0%) |
| $20,000 to $22,499 | 13 (1.0%) | 0 (0.0%) |
| $22,500 to $24,999 | 19 (1.5%) | 11 (1.0%) |
| $25,000 to $29,999 | 27 (2.1%) | 91 (8.5%) |
| $30,000 to $34,999 | 86 (6.8%) | 18 (1.7%) |
| $35,000 to $39,999 | 28 (2.2%) | 163 (15.3%) |
| $40,000 to $44,999 | 21 (1.7%) | 51 (4.8%) |
| $45,000 to $49,999 | 219 (17.3%) | 0 (0.0%) |
| $50,000 to $54,999 | 82 (6.5%) | 57 (5.3%) |
| $55,000 to $64,999 | 143 (11.3%) | 22 (2.1%) |
| $65,000 to $74,999 | 67 (5.3%) | 111 (10.4%) |
| $75,000 to $99,999 | 160 (12.6%) | 162 (15.2%) |
| $100,000+ | 226 (17.8%) | 43 (4.0%) |
| Total | 1,267 (100.0%) | 1,068 (100.0%) |
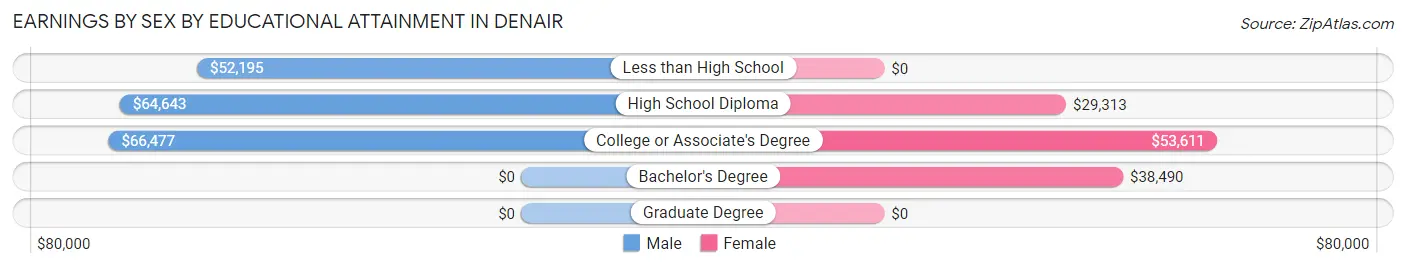
Earnings by Sex by Educational Attainment in Denair
Average earnings in Denair are $64,293 for men and $39,256 for women, a difference of 38.9%. Men with an educational attainment of college or associate's degree enjoy the highest average annual earnings of $66,477, while those with less than high school education earn the least with $52,195. Women with an educational attainment of college or associate's degree earn the most with the average annual earnings of $53,611, while those with high school diploma education have the smallest earnings of $29,313.
| Educational Attainment | Male Income | Female Income |
| Less than High School | $52,195 | $0 |
| High School Diploma | $64,643 | $29,313 |
| College or Associate's Degree | $66,477 | $53,611 |
| Bachelor's Degree | - | - |
| Graduate Degree | - | - |
| Total | $64,293 | $39,256 |
Family Income in Denair
Family Income Brackets in Denair
According to the Denair family income data, there are 311 families falling into the $100,000 to $149,999 income range, which is the most common income bracket and makes up 29.0% of all families.
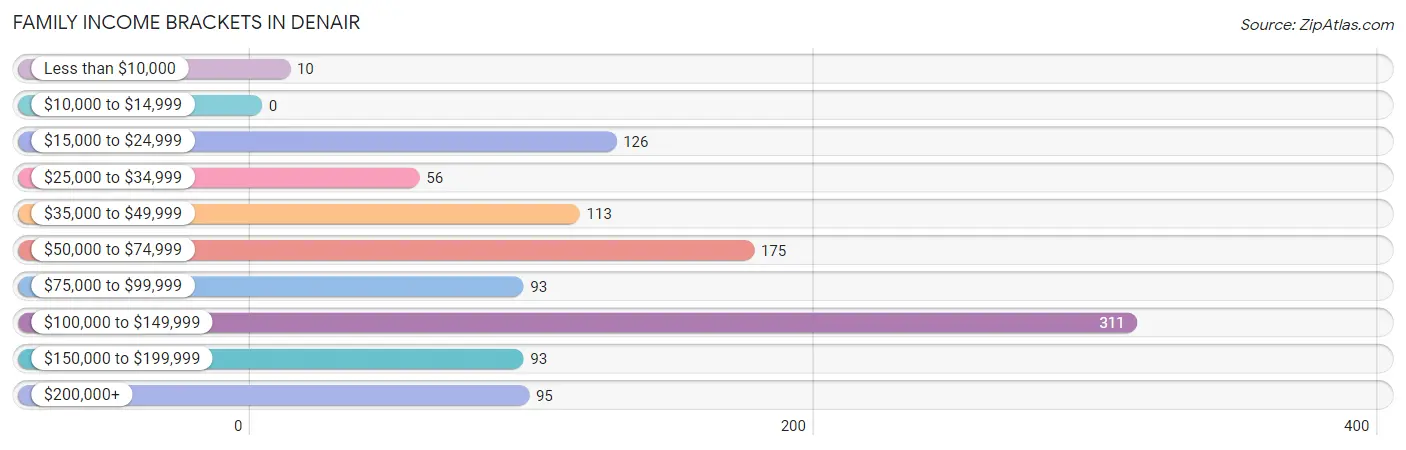
| Income Bracket | # Families | % Families |
| Less than $10,000 | 10 | 0.9% |
| $10,000 to $14,999 | 0 | 0.0% |
| $15,000 to $24,999 | 126 | 11.8% |
| $25,000 to $34,999 | 56 | 5.2% |
| $35,000 to $49,999 | 113 | 10.5% |
| $50,000 to $74,999 | 175 | 16.3% |
| $75,000 to $99,999 | 93 | 8.7% |
| $100,000 to $149,999 | 311 | 29.0% |
| $150,000 to $199,999 | 93 | 8.7% |
| $200,000+ | 95 | 8.9% |
Family Income by Famaliy Size in Denair
3-person families (279 | 26.0%) account for the highest median family income in Denair with $131,630 per family, while 3-person families (279 | 26.0%) have the highest median income of $43,877 per family member.
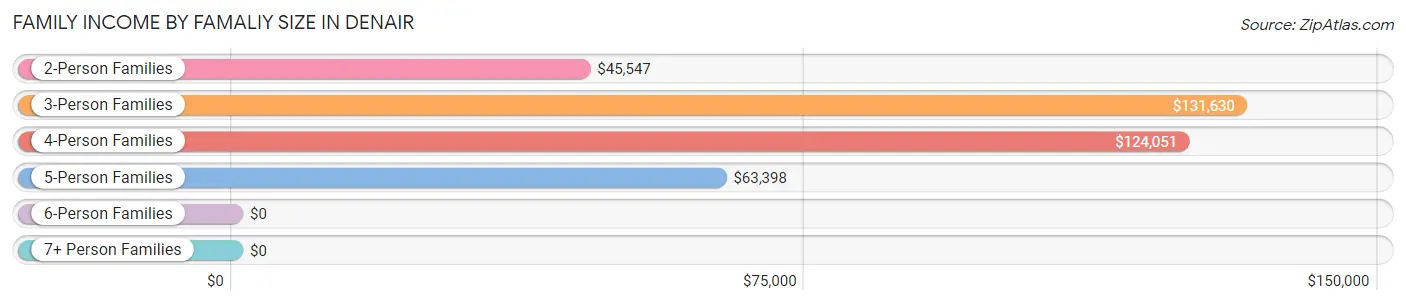
| Income Bracket | # Families | Median Income |
| 2-Person Families | 429 (40.0%) | $45,547 |
| 3-Person Families | 279 (26.0%) | $131,630 |
| 4-Person Families | 162 (15.1%) | $124,051 |
| 5-Person Families | 143 (13.3%) | $63,398 |
| 6-Person Families | 59 (5.5%) | $0 |
| 7+ Person Families | 0 (0.0%) | $0 |
| Total | 1,072 (100.0%) | $94,402 |
Family Income by Number of Earners in Denair
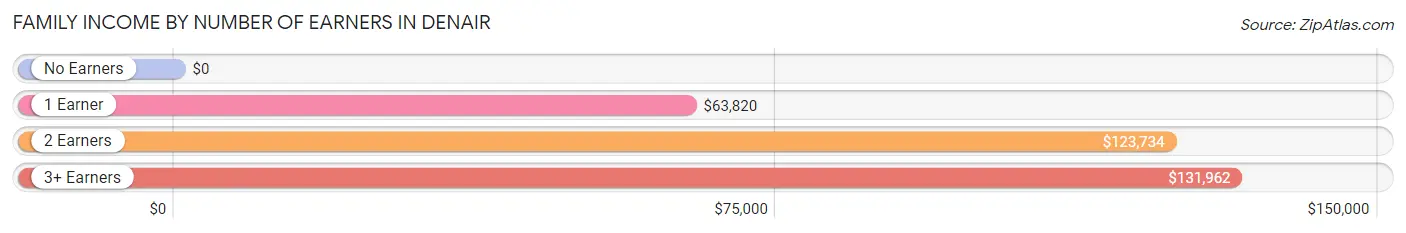
| Number of Earners | # Families | Median Income |
| No Earners | 211 (19.7%) | $0 |
| 1 Earner | 223 (20.8%) | $63,820 |
| 2 Earners | 462 (43.1%) | $123,734 |
| 3+ Earners | 176 (16.4%) | $131,962 |
| Total | 1,072 (100.0%) | $94,402 |
Household Income in Denair
Household Income Brackets in Denair
With 456 households falling in the category, the $100,000 to $149,999 income range is the most frequent in Denair, accounting for 29.4% of all households. In contrast, only 26 households (1.7%) fall into the less than $10,000 income bracket, making it the least populous group.
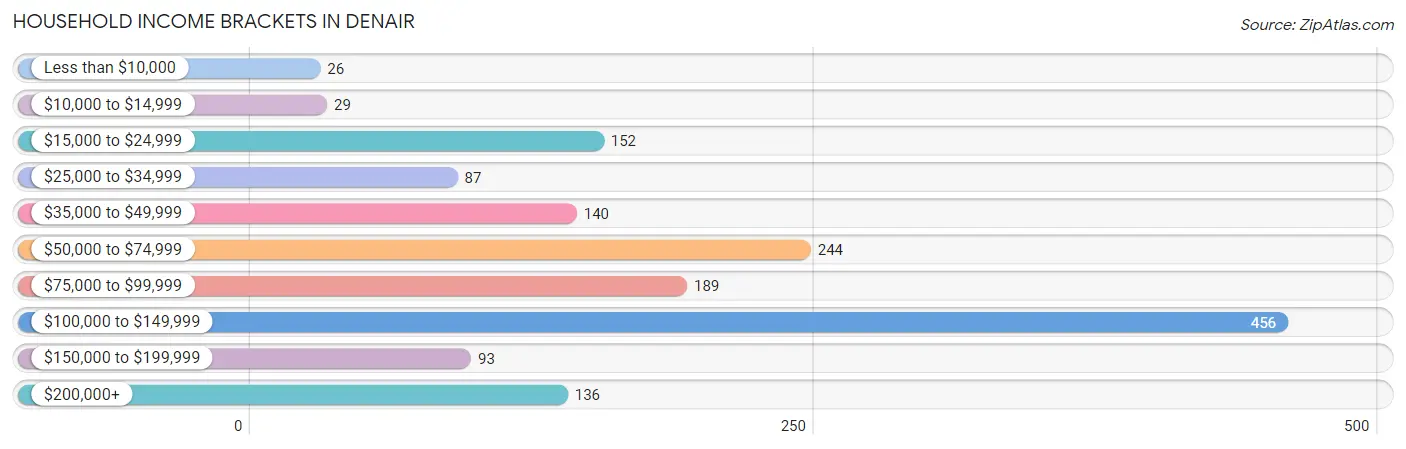
| Income Bracket | # Households | % Households |
| Less than $10,000 | 26 | 1.7% |
| $10,000 to $14,999 | 29 | 1.9% |
| $15,000 to $24,999 | 152 | 9.8% |
| $25,000 to $34,999 | 87 | 5.6% |
| $35,000 to $49,999 | 140 | 9.0% |
| $50,000 to $74,999 | 244 | 15.7% |
| $75,000 to $99,999 | 189 | 12.2% |
| $100,000 to $149,999 | 456 | 29.4% |
| $150,000 to $199,999 | 93 | 6.0% |
| $200,000+ | 136 | 8.8% |
Household Income by Householder Age in Denair
The median household income in Denair is $92,234, with the highest median household income of $117,368 found in the 45 to 64 years age bracket for the primary householder. A total of 510 households (32.9%) fall into this category. Meanwhile, the 15 to 24 years age bracket for the primary householder has the lowest median household income of $0, with 126 households (8.1%) in this group.
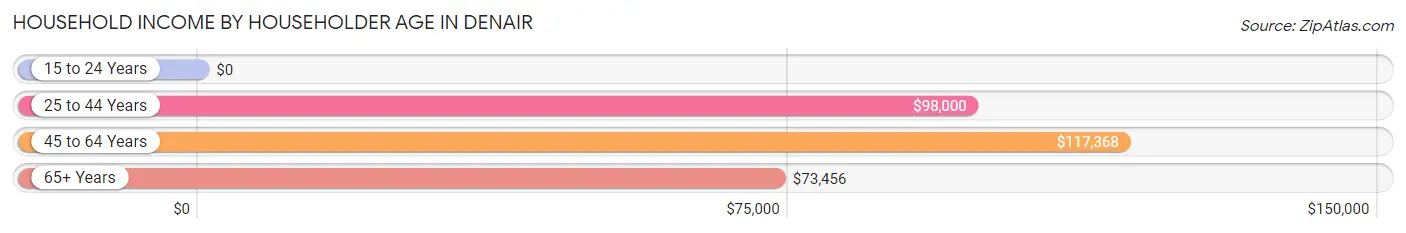
| Income Bracket | # Households | Median Income |
| 15 to 24 Years | 126 (8.1%) | $0 |
| 25 to 44 Years | 430 (27.7%) | $98,000 |
| 45 to 64 Years | 510 (32.9%) | $117,368 |
| 65+ Years | 485 (31.3%) | $73,456 |
| Total | 1,551 (100.0%) | $92,234 |
Poverty in Denair
Income Below Poverty by Sex and Age in Denair
With 10.6% poverty level for males and 9.9% for females among the residents of Denair, 65 to 74 year old males and 16 and 17 year old females are the most vulnerable to poverty, with 56 males (28.7%) and 16 females (37.2%) in their respective age groups living below the poverty level.
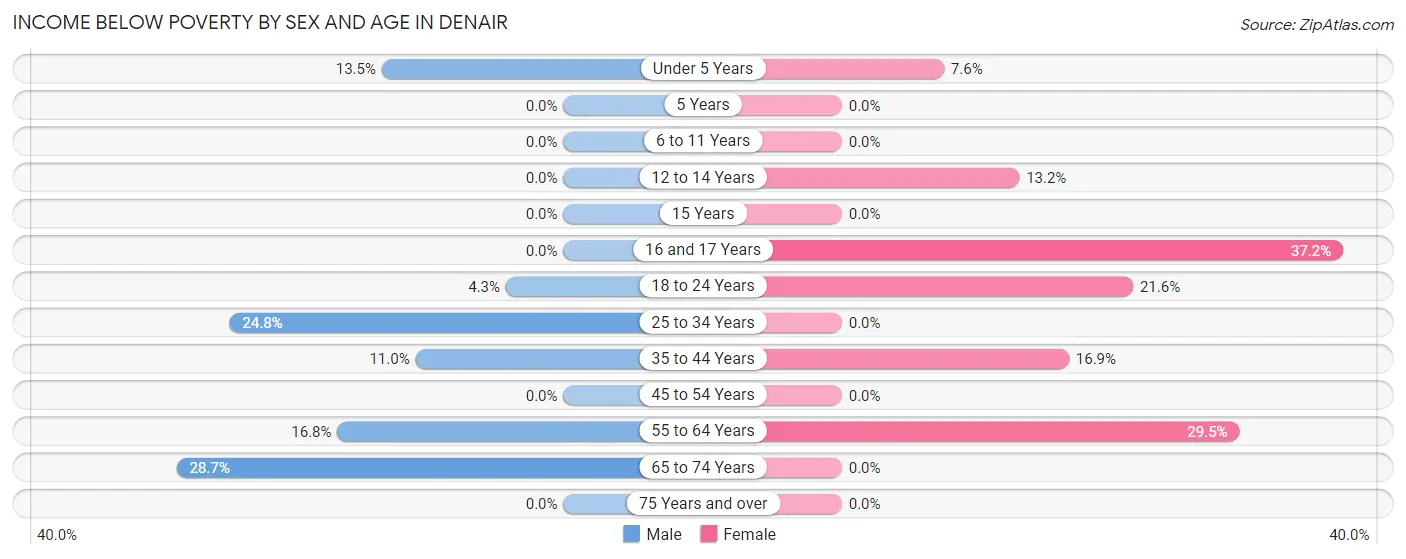
| Age Bracket | Male | Female |
| Under 5 Years | 12 (13.5%) | 16 (7.6%) |
| 5 Years | 0 (0.0%) | 0 (0.0%) |
| 6 to 11 Years | 0 (0.0%) | 0 (0.0%) |
| 12 to 14 Years | 0 (0.0%) | 22 (13.2%) |
| 15 Years | 0 (0.0%) | 0 (0.0%) |
| 16 and 17 Years | 0 (0.0%) | 16 (37.2%) |
| 18 to 24 Years | 14 (4.3%) | 48 (21.6%) |
| 25 to 34 Years | 29 (24.8%) | 0 (0.0%) |
| 35 to 44 Years | 37 (11.0%) | 44 (16.9%) |
| 45 to 54 Years | 0 (0.0%) | 0 (0.0%) |
| 55 to 64 Years | 48 (16.8%) | 93 (29.5%) |
| 65 to 74 Years | 56 (28.7%) | 0 (0.0%) |
| 75 Years and over | 0 (0.0%) | 0 (0.0%) |
| Total | 196 (10.6%) | 239 (9.9%) |
Income Above Poverty by Sex and Age in Denair
According to the poverty statistics in Denair, males aged 6 to 11 years and females aged 6 to 11 years are the age groups that are most secure financially, with 100.0% of males and 100.0% of females in these age groups living above the poverty line.
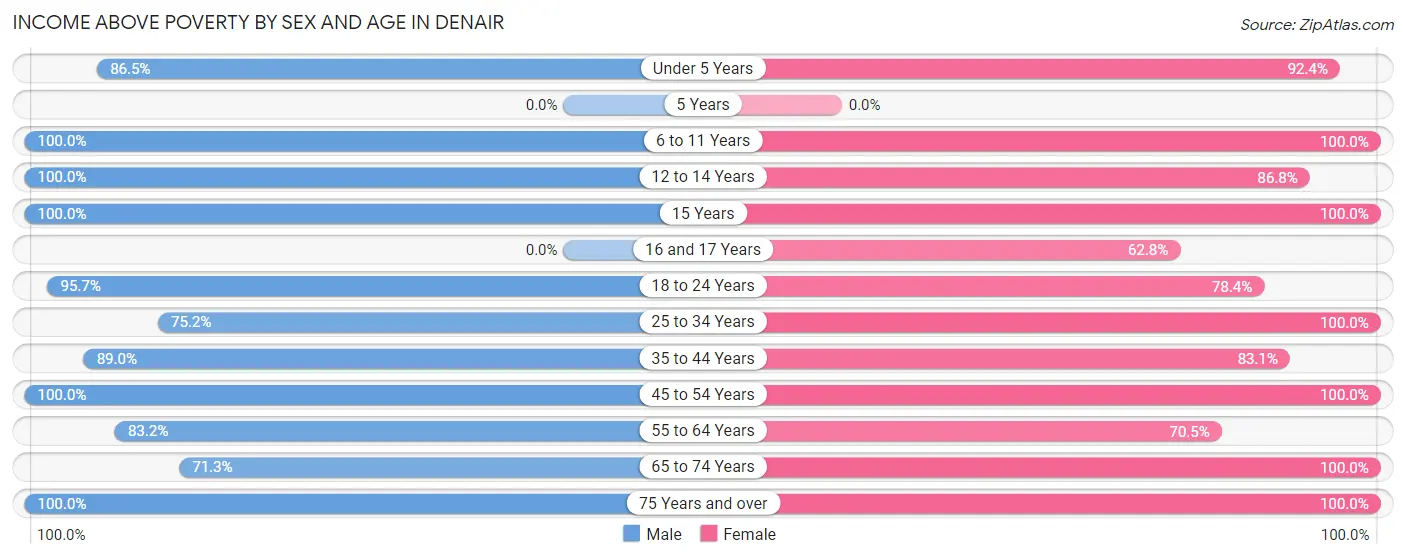
| Age Bracket | Male | Female |
| Under 5 Years | 77 (86.5%) | 195 (92.4%) |
| 5 Years | 0 (0.0%) | 0 (0.0%) |
| 6 to 11 Years | 82 (100.0%) | 229 (100.0%) |
| 12 to 14 Years | 20 (100.0%) | 145 (86.8%) |
| 15 Years | 12 (100.0%) | 14 (100.0%) |
| 16 and 17 Years | 0 (0.0%) | 27 (62.8%) |
| 18 to 24 Years | 314 (95.7%) | 174 (78.4%) |
| 25 to 34 Years | 88 (75.2%) | 305 (100.0%) |
| 35 to 44 Years | 300 (89.0%) | 217 (83.1%) |
| 45 to 54 Years | 289 (100.0%) | 291 (100.0%) |
| 55 to 64 Years | 238 (83.2%) | 222 (70.5%) |
| 65 to 74 Years | 139 (71.3%) | 288 (100.0%) |
| 75 Years and over | 90 (100.0%) | 69 (100.0%) |
| Total | 1,649 (89.4%) | 2,176 (90.1%) |
Income Below Poverty Among Married-Couple Families in Denair
The poverty statistics for married-couple families in Denair show that 13.5% or 125 of the total 927 families live below the poverty line. Families with 3 or 4 children have the highest poverty rate of 23.1%, comprising of 27 families. On the other hand, families with 1 or 2 children have the lowest poverty rate of 0.0%, which includes 0 families.
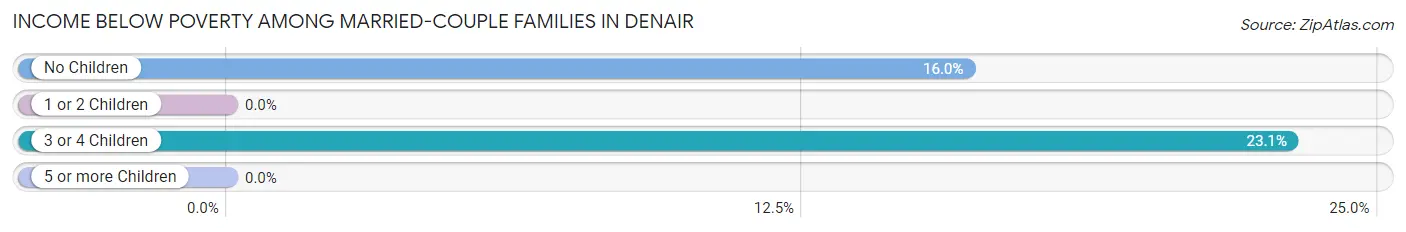
| Children | Above Poverty | Below Poverty |
| No Children | 513 (84.0%) | 98 (16.0%) |
| 1 or 2 Children | 199 (100.0%) | 0 (0.0%) |
| 3 or 4 Children | 90 (76.9%) | 27 (23.1%) |
| 5 or more Children | 0 (0.0%) | 0 (0.0%) |
| Total | 802 (86.5%) | 125 (13.5%) |
Income Below Poverty Among Single-Parent Households in Denair
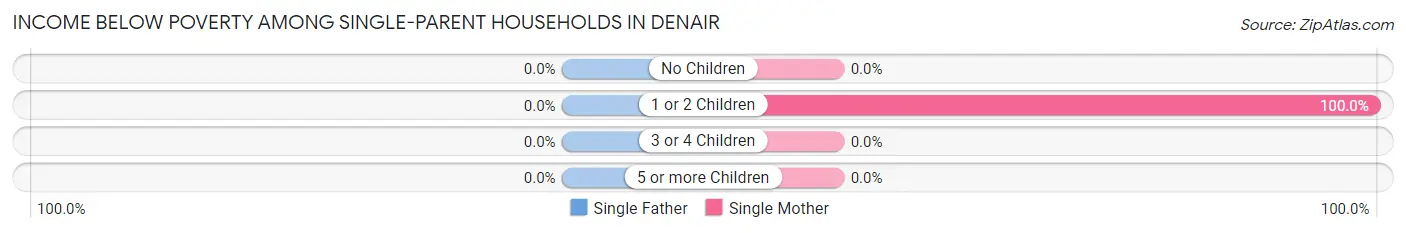
| Children | Single Father | Single Mother |
| No Children | 0 (0.0%) | 0 (0.0%) |
| 1 or 2 Children | 0 (0.0%) | 11 (100.0%) |
| 3 or 4 Children | 0 (0.0%) | 0 (0.0%) |
| 5 or more Children | 0 (0.0%) | 0 (0.0%) |
| Total | 0 (0.0%) | 11 (11.7%) |
Income Below Poverty Among Married-Couple vs Single-Parent Households in Denair
The poverty data for Denair shows that 125 of the married-couple family households (13.5%) and 11 of the single-parent households (7.6%) are living below the poverty level. Within the married-couple family households, those with 3 or 4 children have the highest poverty rate, with 27 households (23.1%) falling below the poverty line. Among the single-parent households, those with 1 or 2 children have the highest poverty rate, with 11 household (100.0%) living below poverty.
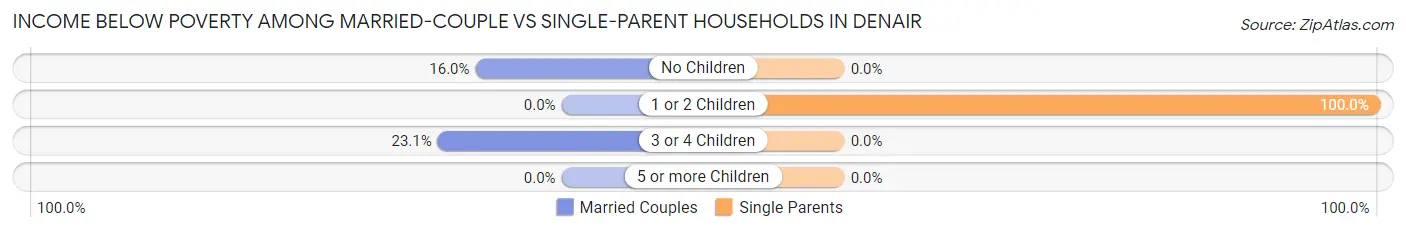
| Children | Married-Couple Families | Single-Parent Households |
| No Children | 98 (16.0%) | 0 (0.0%) |
| 1 or 2 Children | 0 (0.0%) | 11 (100.0%) |
| 3 or 4 Children | 27 (23.1%) | 0 (0.0%) |
| 5 or more Children | 0 (0.0%) | 0 (0.0%) |
| Total | 125 (13.5%) | 11 (7.6%) |
Race in Denair
The most populous races in Denair are White / Caucasian (2,889 | 67.4%), Hispanic or Latino (1,654 | 38.6%), and Some other Race (637 | 14.8%).
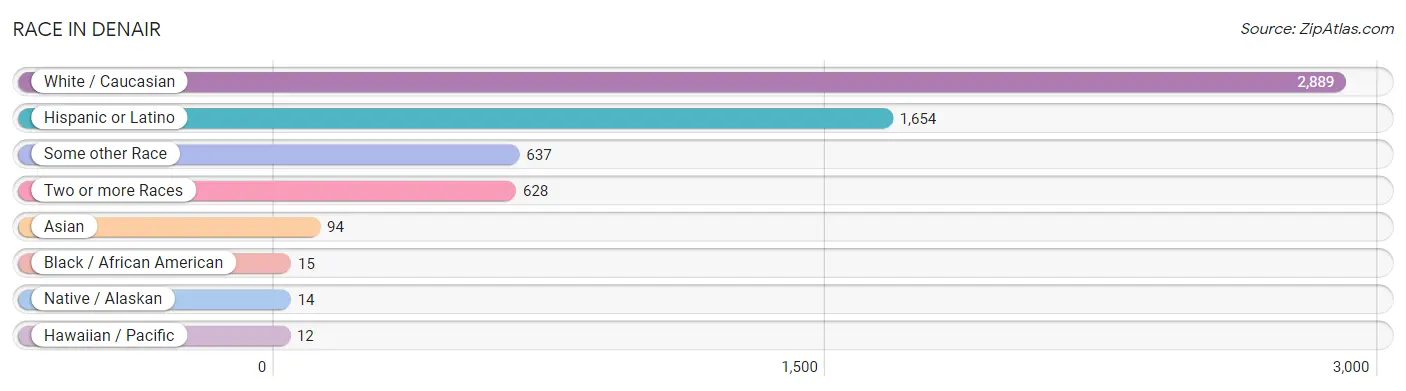
| Race | # Population | % Population |
| Asian | 94 | 2.2% |
| Black / African American | 15 | 0.4% |
| Hawaiian / Pacific | 12 | 0.3% |
| Hispanic or Latino | 1,654 | 38.6% |
| Native / Alaskan | 14 | 0.3% |
| White / Caucasian | 2,889 | 67.4% |
| Two or more Races | 628 | 14.6% |
| Some other Race | 637 | 14.8% |
| Total | 4,289 | 100.0% |
Ancestry in Denair
The most populous ancestries reported in Denair are Mexican (1,568 | 36.6%), German (812 | 18.9%), Irish (604 | 14.1%), Portuguese (239 | 5.6%), and American (178 | 4.2%), together accounting for 79.3% of all Denair residents.
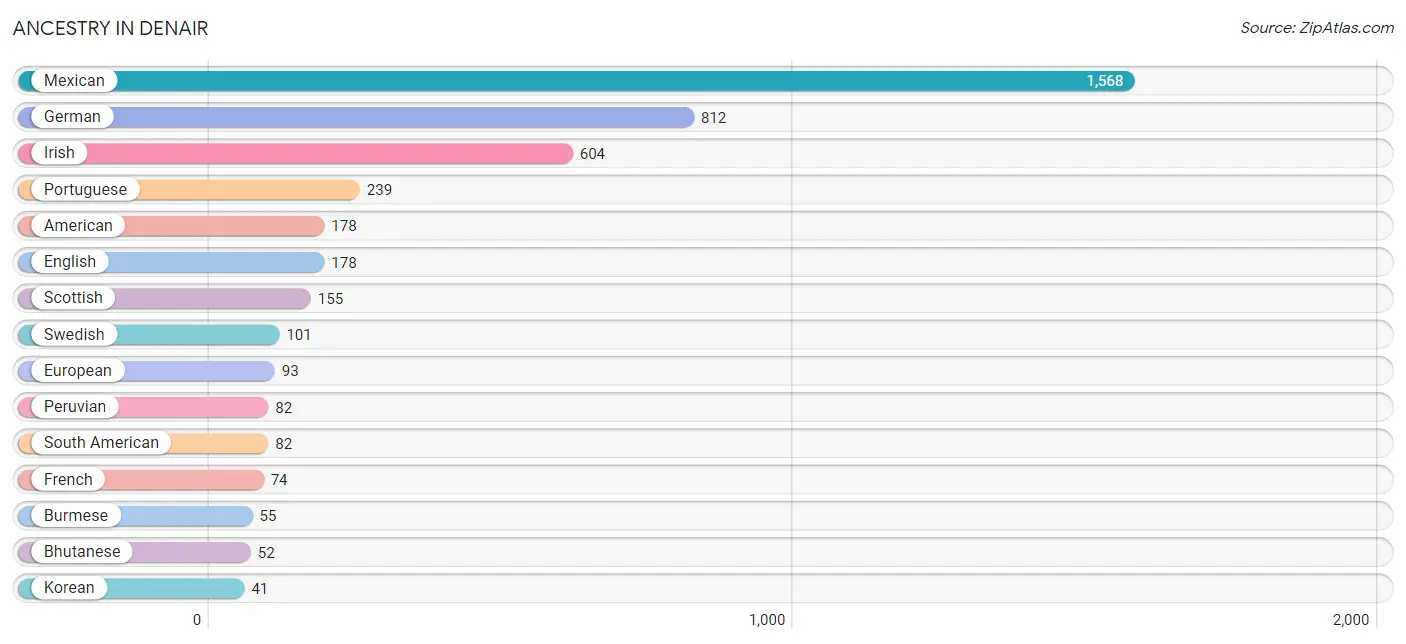
| Ancestry | # Population | % Population |
| American | 178 | 4.2% |
| Assyrian / Chaldean / Syriac | 8 | 0.2% |
| Bhutanese | 52 | 1.2% |
| Burmese | 55 | 1.3% |
| Choctaw | 32 | 0.7% |
| Dutch | 31 | 0.7% |
| English | 178 | 4.2% |
| European | 93 | 2.2% |
| French | 74 | 1.7% |
| German | 812 | 18.9% |
| Guamanian / Chamorro | 32 | 0.7% |
| Irish | 604 | 14.1% |
| Italian | 28 | 0.6% |
| Korean | 41 | 1.0% |
| Mexican | 1,568 | 36.6% |
| Mexican American Indian | 6 | 0.1% |
| Northern European | 30 | 0.7% |
| Norwegian | 26 | 0.6% |
| Peruvian | 82 | 1.9% |
| Portuguese | 239 | 5.6% |
| Scandinavian | 19 | 0.4% |
| Scotch-Irish | 24 | 0.6% |
| Scottish | 155 | 3.6% |
| South American | 82 | 1.9% |
| Spanish | 4 | 0.1% |
| Swedish | 101 | 2.4% |
| Welsh | 39 | 0.9% | View All 27 Rows |
Immigrants in Denair
The most numerous immigrant groups reported in Denair came from Central America (426 | 9.9%), Latin America (426 | 9.9%), Mexico (426 | 9.9%), Asia (91 | 2.1%), and Eastern Asia (83 | 1.9%), together accounting for 33.9% of all Denair residents.
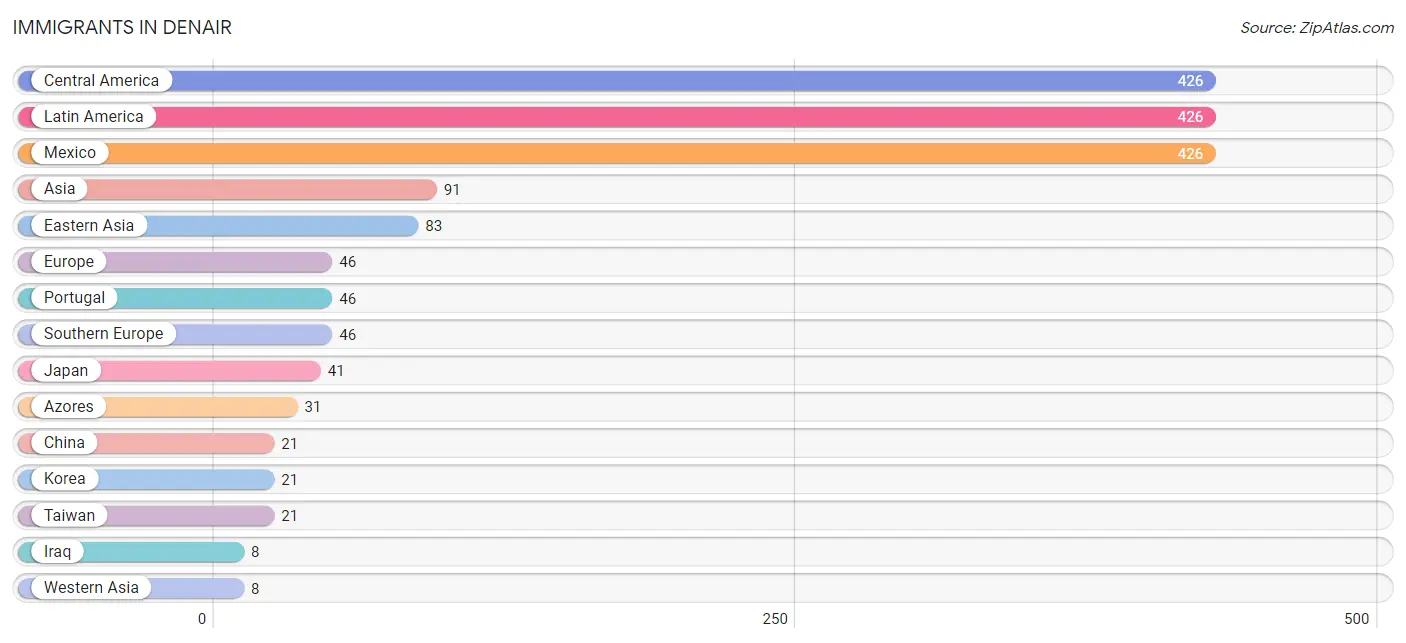
| Immigration Origin | # Population | % Population |
| Asia | 91 | 2.1% |
| Azores | 31 | 0.7% |
| Central America | 426 | 9.9% |
| China | 21 | 0.5% |
| Eastern Asia | 83 | 1.9% |
| Europe | 46 | 1.1% |
| Iraq | 8 | 0.2% |
| Japan | 41 | 1.0% |
| Korea | 21 | 0.5% |
| Latin America | 426 | 9.9% |
| Mexico | 426 | 9.9% |
| Portugal | 46 | 1.1% |
| Southern Europe | 46 | 1.1% |
| Taiwan | 21 | 0.5% |
| Western Asia | 8 | 0.2% | View All 15 Rows |
Sex and Age in Denair
Sex and Age in Denair
The most populous age groups in Denair are 20 to 24 Years (318 | 17.0%) for men and 10 to 14 Years (267 | 11.1%) for women.
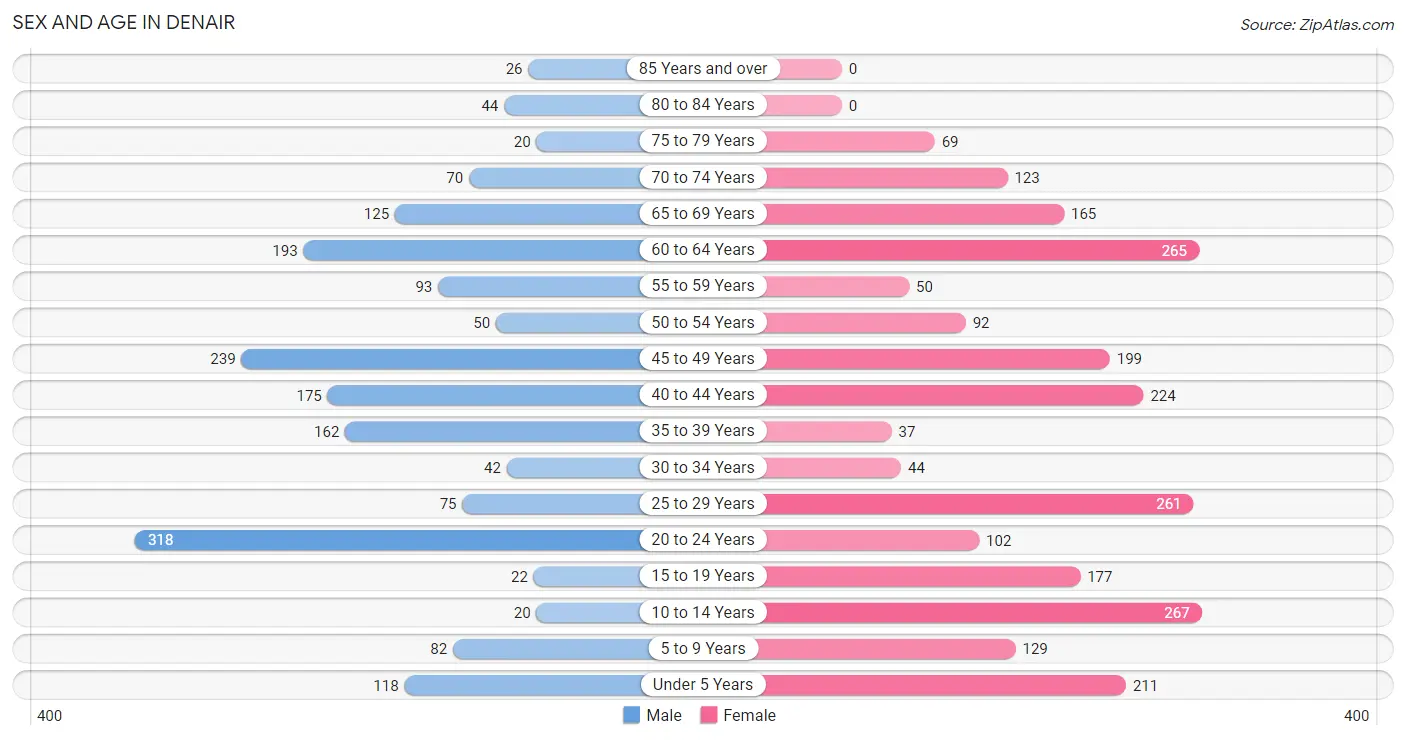
| Age Bracket | Male | Female |
| Under 5 Years | 118 (6.3%) | 211 (8.7%) |
| 5 to 9 Years | 82 (4.4%) | 129 (5.3%) |
| 10 to 14 Years | 20 (1.1%) | 267 (11.1%) |
| 15 to 19 Years | 22 (1.2%) | 177 (7.3%) |
| 20 to 24 Years | 318 (17.0%) | 102 (4.2%) |
| 25 to 29 Years | 75 (4.0%) | 261 (10.8%) |
| 30 to 34 Years | 42 (2.2%) | 44 (1.8%) |
| 35 to 39 Years | 162 (8.6%) | 37 (1.5%) |
| 40 to 44 Years | 175 (9.3%) | 224 (9.3%) |
| 45 to 49 Years | 239 (12.8%) | 199 (8.2%) |
| 50 to 54 Years | 50 (2.7%) | 92 (3.8%) |
| 55 to 59 Years | 93 (5.0%) | 50 (2.1%) |
| 60 to 64 Years | 193 (10.3%) | 265 (11.0%) |
| 65 to 69 Years | 125 (6.7%) | 165 (6.8%) |
| 70 to 74 Years | 70 (3.7%) | 123 (5.1%) |
| 75 to 79 Years | 20 (1.1%) | 69 (2.9%) |
| 80 to 84 Years | 44 (2.4%) | 0 (0.0%) |
| 85 Years and over | 26 (1.4%) | 0 (0.0%) |
| Total | 1,874 (100.0%) | 2,415 (100.0%) |
Families and Households in Denair
Median Family Size in Denair
The median family size in Denair is 3.31 persons per family, with single male/father families (51 | 4.8%) accounting for the largest median family size of 6.55 persons per family. On the other hand, single female/mother families (94 | 8.8%) represent the smallest median family size with 2.10 persons per family.
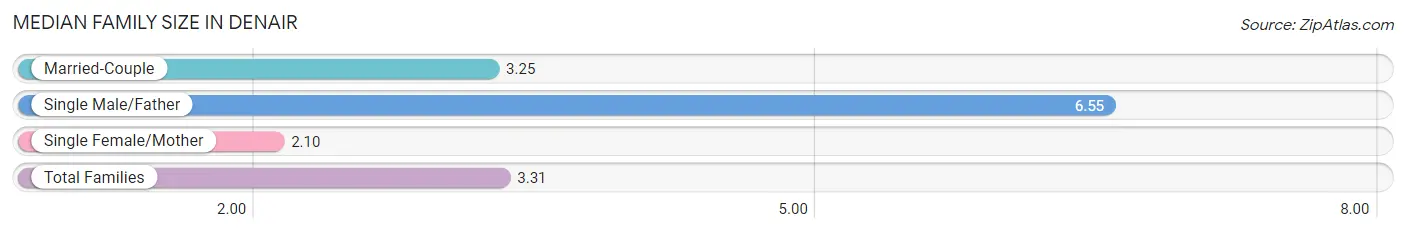
| Family Type | # Families | Family Size |
| Married-Couple | 927 (86.5%) | 3.25 |
| Single Male/Father | 51 (4.8%) | 6.55 |
| Single Female/Mother | 94 (8.8%) | 2.10 |
| Total Families | 1,072 (100.0%) | 3.31 |
Median Household Size in Denair
The median household size in Denair is 2.77 persons per household, with single male/father households (51 | 3.3%) accounting for the largest median household size of 7.49 persons per household. non-family households (479 | 30.9%) represent the smallest median household size with 1.39 persons per household.
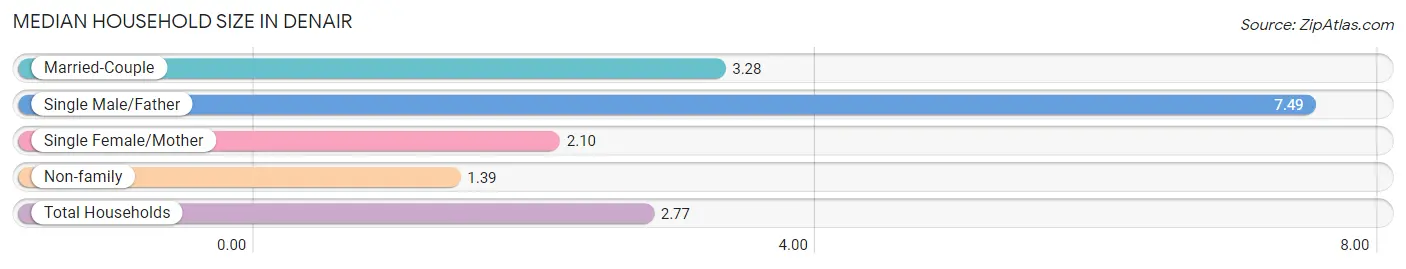
| Household Type | # Households | Household Size |
| Married-Couple | 927 (59.8%) | 3.28 |
| Single Male/Father | 51 (3.3%) | 7.49 |
| Single Female/Mother | 94 (6.1%) | 2.10 |
| Non-family | 479 (30.9%) | 1.39 |
| Total Households | 1,551 (100.0%) | 2.77 |
Household Size by Marriage Status in Denair
Out of a total of 1,551 households in Denair, 1,072 (69.1%) are family households, while 479 (30.9%) are nonfamily households. The most numerous type of family households are 2-person households, comprising 429, and the most common type of nonfamily households are 1-person households, comprising 303.
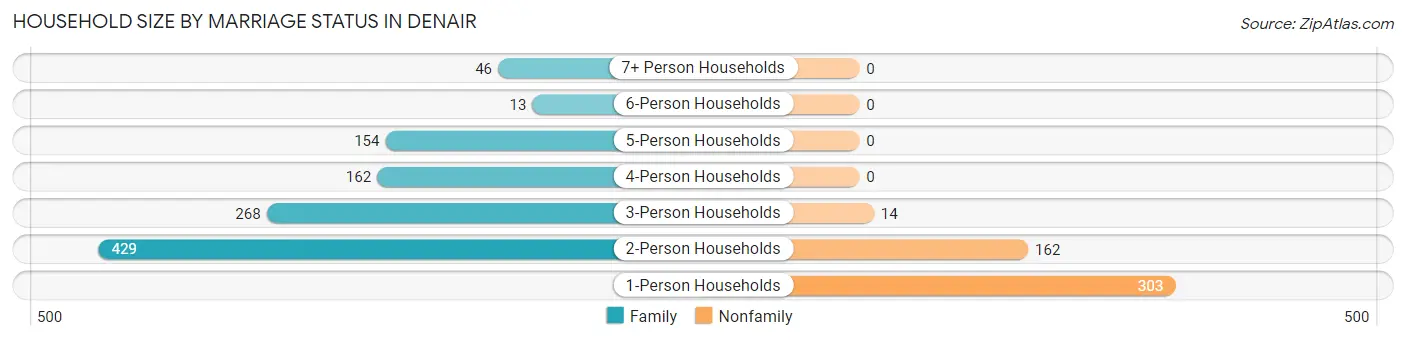
| Household Size | Family Households | Nonfamily Households |
| 1-Person Households | - | 303 (19.5%) |
| 2-Person Households | 429 (27.7%) | 162 (10.4%) |
| 3-Person Households | 268 (17.3%) | 14 (0.9%) |
| 4-Person Households | 162 (10.4%) | 0 (0.0%) |
| 5-Person Households | 154 (9.9%) | 0 (0.0%) |
| 6-Person Households | 13 (0.8%) | 0 (0.0%) |
| 7+ Person Households | 46 (3.0%) | 0 (0.0%) |
| Total | 1,072 (69.1%) | 479 (30.9%) |
Female Fertility in Denair
Fertility by Age in Denair
Average fertility rate in Denair is 76.0 births per 1,000 women. Women in the age bracket of 20 to 34 years have the highest fertility rate with 204.0 births per 1,000 women. Women in the age bracket of 20 to 34 years acount for 100.0% of all women with births.
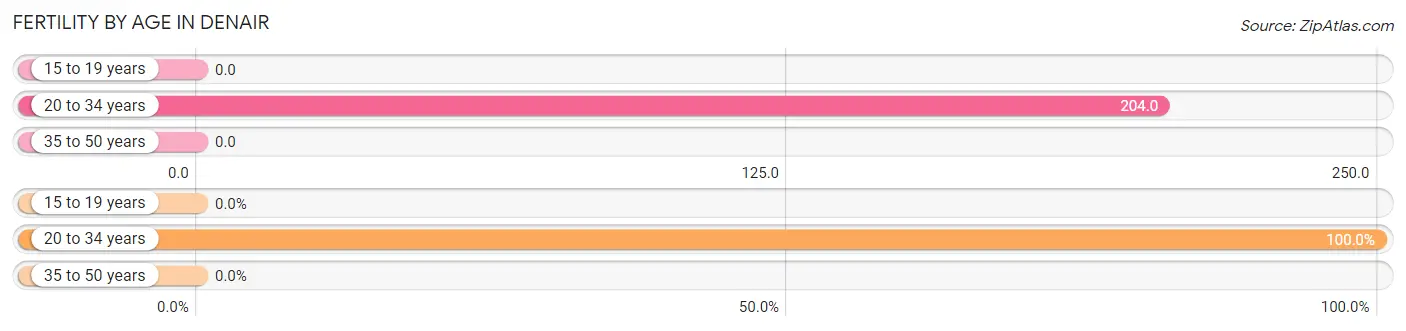
| Age Bracket | Women with Births | Births / 1,000 Women |
| 15 to 19 years | 0 (0.0%) | 0.0 |
| 20 to 34 years | 83 (100.0%) | 204.0 |
| 35 to 50 years | 0 (0.0%) | 0.0 |
| Total | 83 (100.0%) | 76.0 |
Fertility by Age by Marriage Status in Denair
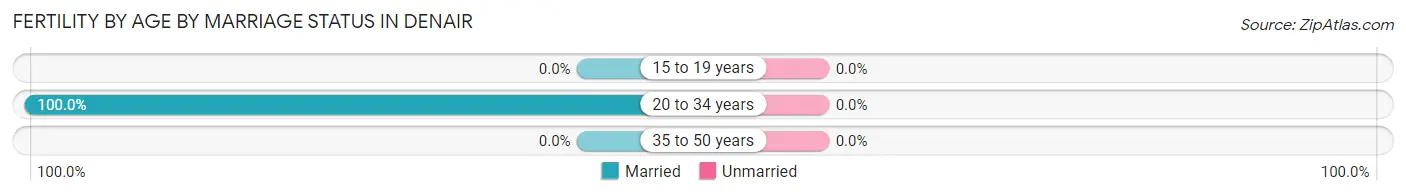
| Age Bracket | Married | Unmarried |
| 15 to 19 years | 0 (0.0%) | 0 (0.0%) |
| 20 to 34 years | 83 (100.0%) | 0 (0.0%) |
| 35 to 50 years | 0 (0.0%) | 0 (0.0%) |
| Total | 83 (100.0%) | 0 (0.0%) |
Fertility by Education in Denair
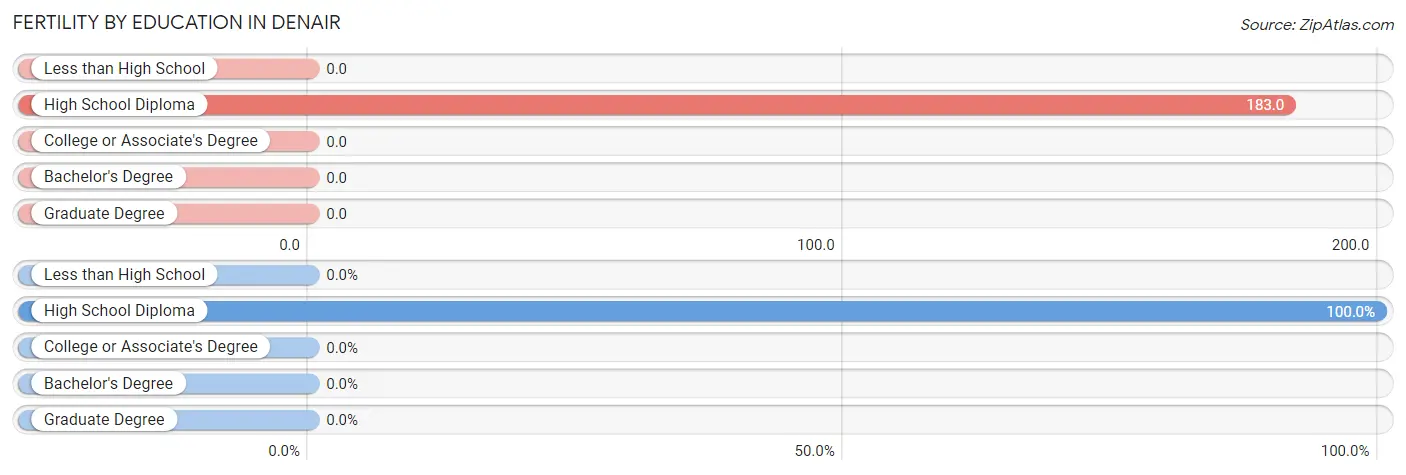
| Educational Attainment | Women with Births | Births / 1,000 Women |
| Less than High School | 0 (0.0%) | 0.0 |
| High School Diploma | 83 (100.0%) | 183.0 |
| College or Associate's Degree | 0 (0.0%) | 0.0 |
| Bachelor's Degree | 0 (0.0%) | 0.0 |
| Graduate Degree | 0 (0.0%) | 0.0 |
| Total | 83 (100.0%) | 76.0 |
Fertility by Education by Marriage Status in Denair
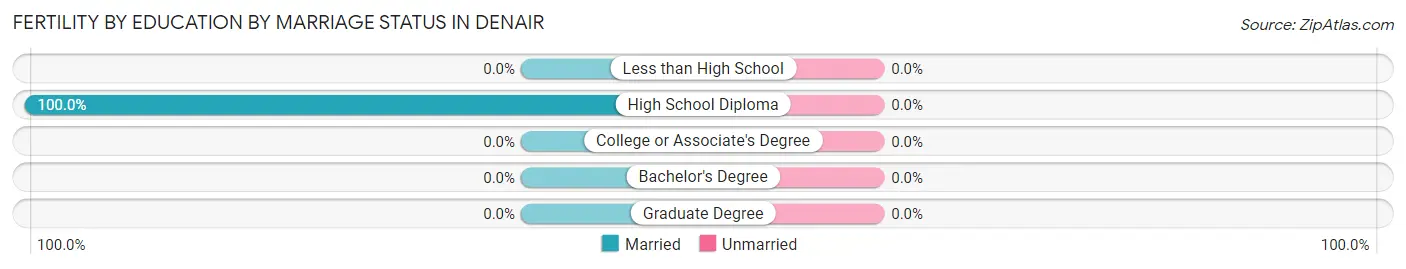
| Educational Attainment | Married | Unmarried |
| Less than High School | 0 (0.0%) | 0 (0.0%) |
| High School Diploma | 83 (100.0%) | 0 (0.0%) |
| College or Associate's Degree | 0 (0.0%) | 0 (0.0%) |
| Bachelor's Degree | 0 (0.0%) | 0 (0.0%) |
| Graduate Degree | 0 (0.0%) | 0 (0.0%) |
| Total | 83 (100.0%) | 0 (0.0%) |
Employment Characteristics in Denair
Employment by Class of Employer in Denair
Among the 1,977 employed individuals in Denair, private company employees (1,397 | 70.7%), local government employees (214 | 10.8%), and self-employed (not incorporated) (127 | 6.4%) make up the most common classes of employment.
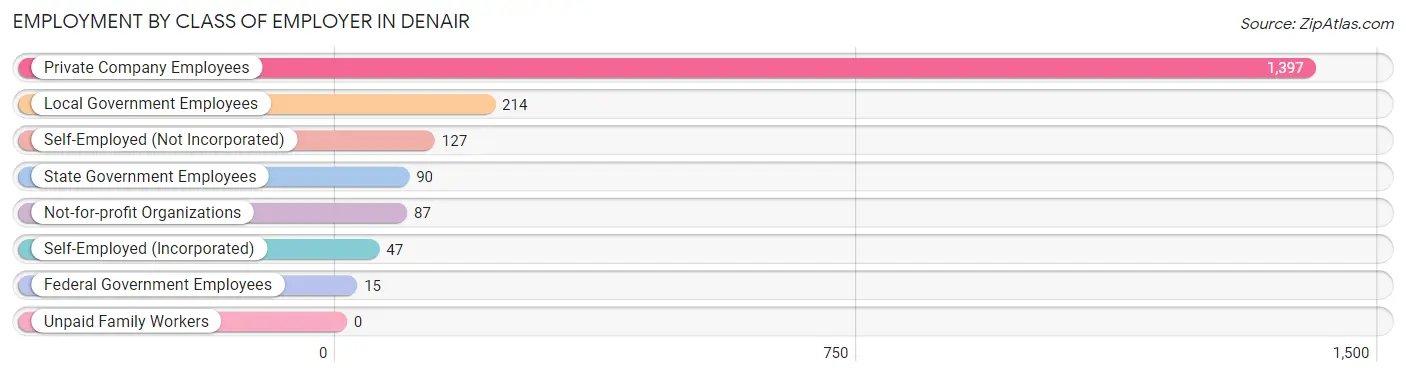
| Employer Class | # Employees | % Employees |
| Private Company Employees | 1,397 | 70.7% |
| Self-Employed (Incorporated) | 47 | 2.4% |
| Self-Employed (Not Incorporated) | 127 | 6.4% |
| Not-for-profit Organizations | 87 | 4.4% |
| Local Government Employees | 214 | 10.8% |
| State Government Employees | 90 | 4.5% |
| Federal Government Employees | 15 | 0.8% |
| Unpaid Family Workers | 0 | 0.0% |
| Total | 1,977 | 100.0% |
Employment Status by Age in Denair
According to the labor force statistics for Denair, out of the total population over 16 years of age (3,436), 64.7% or 2,223 individuals are in the labor force, with 8.5% or 189 of them unemployed. The age group with the highest labor force participation rate is 30 to 34 years, with 100.0% or 86 individuals in the labor force. Within the labor force, the 25 to 29 years age range has the highest percentage of unemployed individuals, with 28.8% or 40 of them being unemployed.
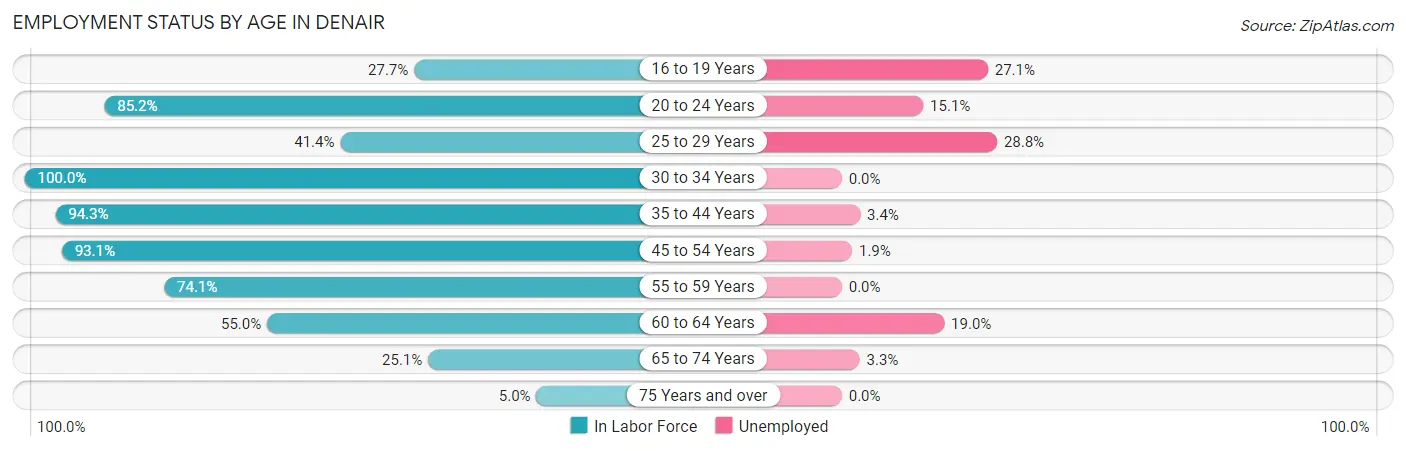
| Age Bracket | In Labor Force | Unemployed |
| 16 to 19 Years | 48 (27.7%) | 13 (27.1%) |
| 20 to 24 Years | 358 (85.2%) | 54 (15.1%) |
| 25 to 29 Years | 139 (41.4%) | 40 (28.8%) |
| 30 to 34 Years | 86 (100.0%) | 0 (0.0%) |
| 35 to 44 Years | 564 (94.3%) | 19 (3.4%) |
| 45 to 54 Years | 540 (93.1%) | 10 (1.9%) |
| 55 to 59 Years | 106 (74.1%) | 0 (0.0%) |
| 60 to 64 Years | 252 (55.0%) | 48 (19.0%) |
| 65 to 74 Years | 121 (25.1%) | 4 (3.3%) |
| 75 Years and over | 8 (5.0%) | 0 (0.0%) |
| Total | 2,223 (64.7%) | 189 (8.5%) |
Employment Status by Educational Attainment in Denair
According to labor force statistics for Denair, 76.6% of individuals (1,686) out of the total population between 25 and 64 years of age (2,201) are in the labor force, with 6.9% or 116 of them being unemployed. The group with the highest labor force participation rate are those with the educational attainment of less than high school, with 81.3% or 195 individuals in the labor force. Within the labor force, individuals with bachelor's degree or higher education have the highest percentage of unemployment, with 22.3% or 58 of them being unemployed.
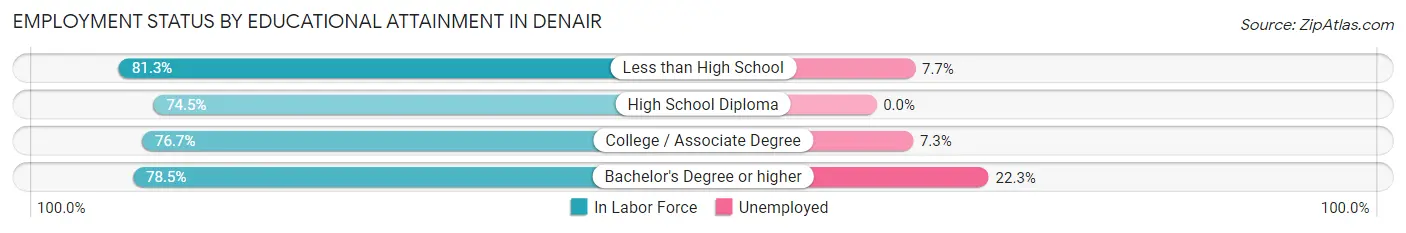
| Educational Attainment | In Labor Force | Unemployed |
| Less than High School | 195 (81.3%) | 18 (7.7%) |
| High School Diploma | 626 (74.5%) | 0 (0.0%) |
| College / Associate Degree | 606 (76.7%) | 58 (7.3%) |
| Bachelor's Degree or higher | 260 (78.5%) | 74 (22.3%) |
| Total | 1,686 (76.6%) | 152 (6.9%) |
Employment Occupations by Sex in Denair
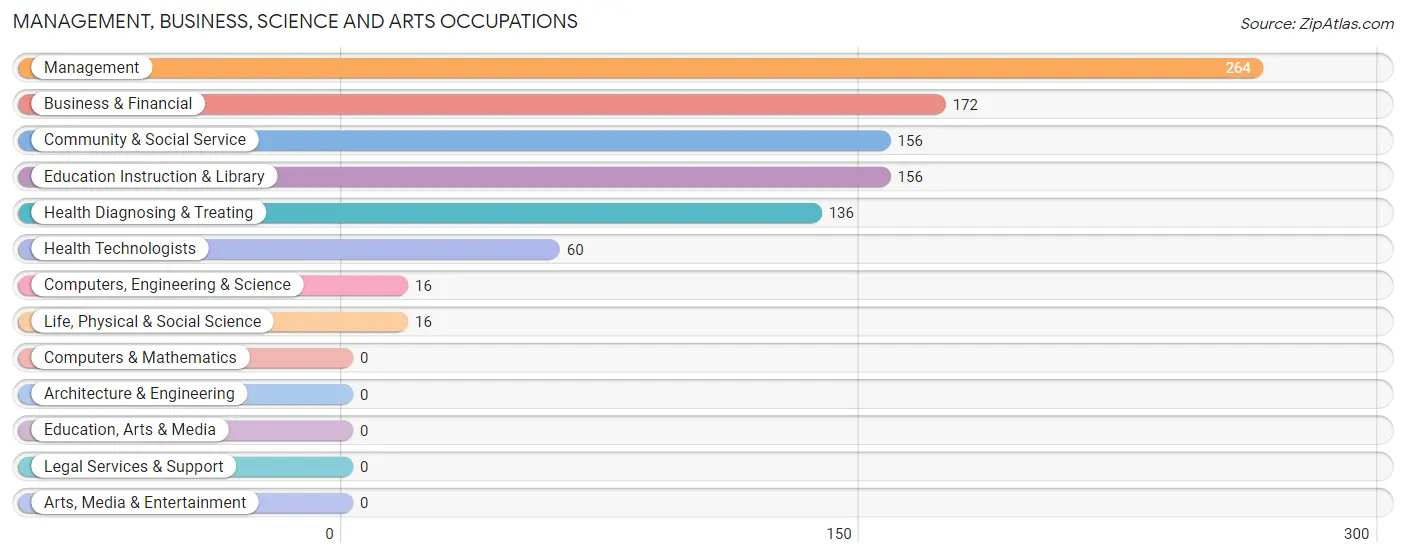
Management, Business, Science and Arts Occupations
The most common Management, Business, Science and Arts occupations in Denair are Management (264 | 13.0%), Business & Financial (172 | 8.5%), Community & Social Service (156 | 7.7%), Education Instruction & Library (156 | 7.7%), and Health Diagnosing & Treating (136 | 6.7%).
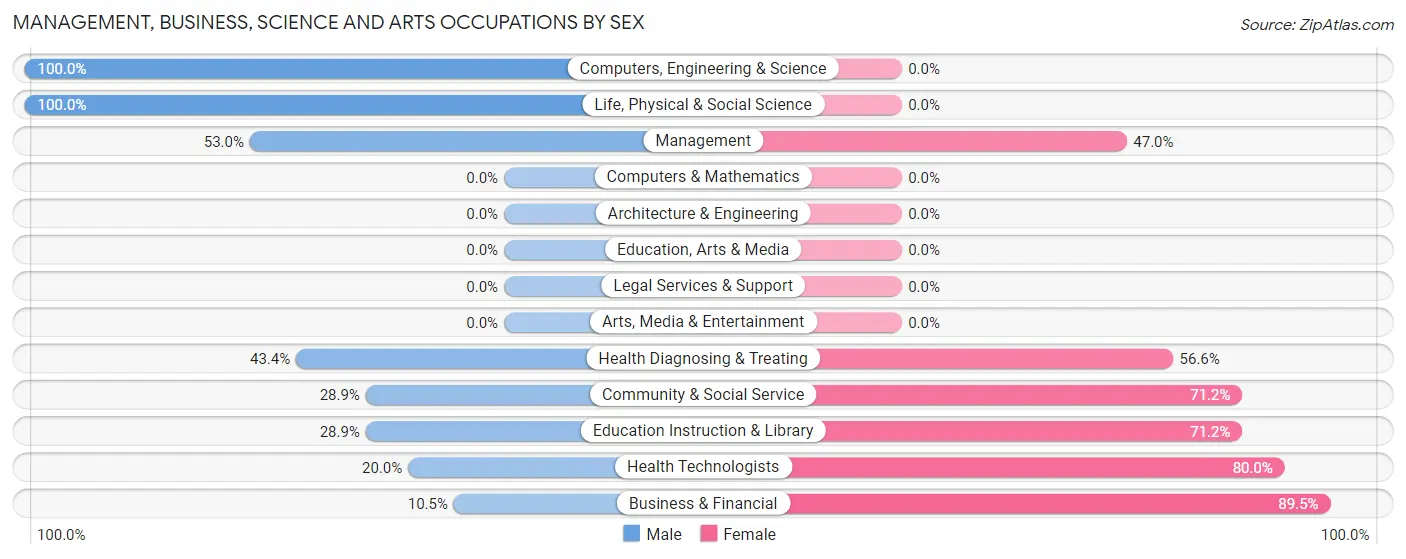
Management, Business, Science and Arts Occupations by Sex
Within the Management, Business, Science and Arts occupations in Denair, the most male-oriented occupations are Computers, Engineering & Science (100.0%), Life, Physical & Social Science (100.0%), and Management (53.0%), while the most female-oriented occupations are Business & Financial (89.5%), Health Technologists (80.0%), and Community & Social Service (71.2%).
| Occupation | Male | Female |
| Management | 140 (53.0%) | 124 (47.0%) |
| Business & Financial | 18 (10.5%) | 154 (89.5%) |
| Computers, Engineering & Science | 16 (100.0%) | 0 (0.0%) |
| Computers & Mathematics | 0 (0.0%) | 0 (0.0%) |
| Architecture & Engineering | 0 (0.0%) | 0 (0.0%) |
| Life, Physical & Social Science | 16 (100.0%) | 0 (0.0%) |
| Community & Social Service | 45 (28.8%) | 111 (71.2%) |
| Education, Arts & Media | 0 (0.0%) | 0 (0.0%) |
| Legal Services & Support | 0 (0.0%) | 0 (0.0%) |
| Education Instruction & Library | 45 (28.8%) | 111 (71.2%) |
| Arts, Media & Entertainment | 0 (0.0%) | 0 (0.0%) |
| Health Diagnosing & Treating | 59 (43.4%) | 77 (56.6%) |
| Health Technologists | 12 (20.0%) | 48 (80.0%) |
| Total (Category) | 278 (37.4%) | 466 (62.6%) |
| Total (Overall) | 1,211 (59.5%) | 823 (40.5%) |
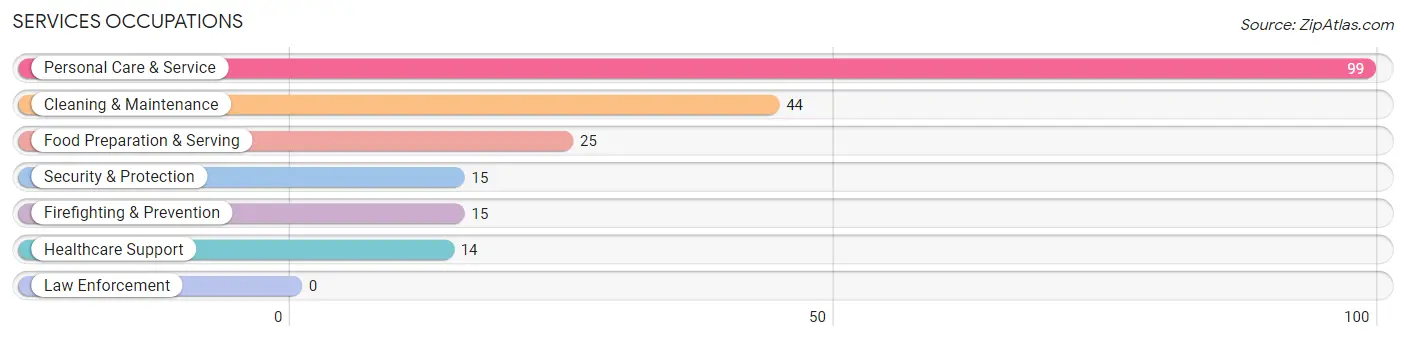
Services Occupations
The most common Services occupations in Denair are Personal Care & Service (99 | 4.9%), Cleaning & Maintenance (44 | 2.2%), Food Preparation & Serving (25 | 1.2%), Security & Protection (15 | 0.7%), and Firefighting & Prevention (15 | 0.7%).
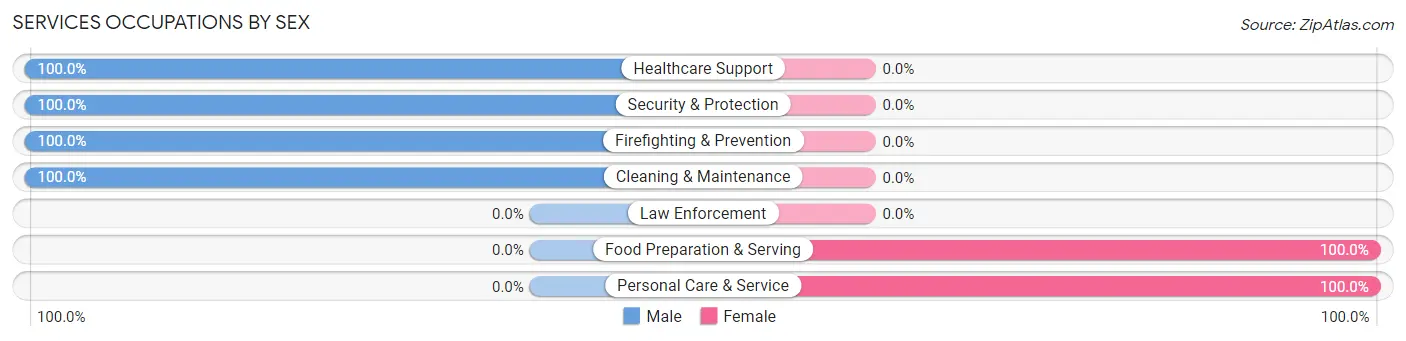
Services Occupations by Sex
Within the Services occupations in Denair, the most male-oriented occupations are Healthcare Support (100.0%), Security & Protection (100.0%), and Firefighting & Prevention (100.0%), while the most female-oriented occupations are Food Preparation & Serving (100.0%), and Personal Care & Service (100.0%).
| Occupation | Male | Female |
| Healthcare Support | 14 (100.0%) | 0 (0.0%) |
| Security & Protection | 15 (100.0%) | 0 (0.0%) |
| Firefighting & Prevention | 15 (100.0%) | 0 (0.0%) |
| Law Enforcement | 0 (0.0%) | 0 (0.0%) |
| Food Preparation & Serving | 0 (0.0%) | 25 (100.0%) |
| Cleaning & Maintenance | 44 (100.0%) | 0 (0.0%) |
| Personal Care & Service | 0 (0.0%) | 99 (100.0%) |
| Total (Category) | 73 (37.1%) | 124 (62.9%) |
| Total (Overall) | 1,211 (59.5%) | 823 (40.5%) |
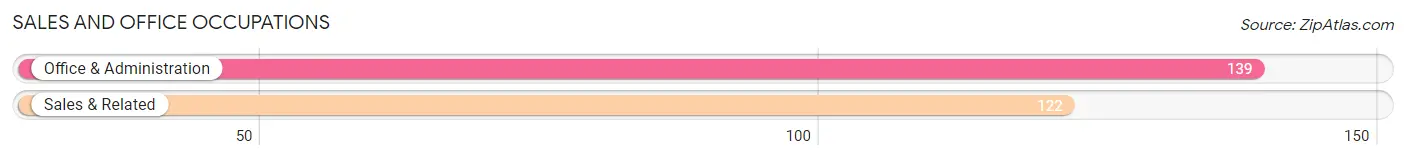
Sales and Office Occupations
The most common Sales and Office occupations in Denair are Office & Administration (139 | 6.8%), and Sales & Related (122 | 6.0%).
Sales and Office Occupations by Sex
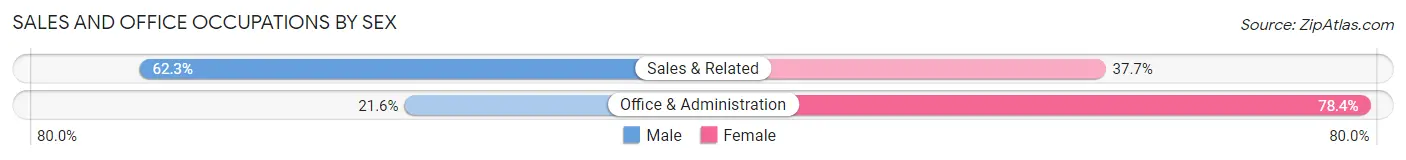
| Occupation | Male | Female |
| Sales & Related | 76 (62.3%) | 46 (37.7%) |
| Office & Administration | 30 (21.6%) | 109 (78.4%) |
| Total (Category) | 106 (40.6%) | 155 (59.4%) |
| Total (Overall) | 1,211 (59.5%) | 823 (40.5%) |
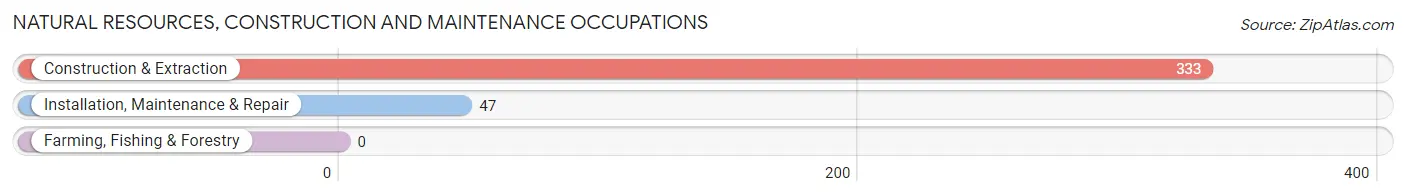
Natural Resources, Construction and Maintenance Occupations
The most common Natural Resources, Construction and Maintenance occupations in Denair are Construction & Extraction (333 | 16.4%), and Installation, Maintenance & Repair (47 | 2.3%).
Natural Resources, Construction and Maintenance Occupations by Sex
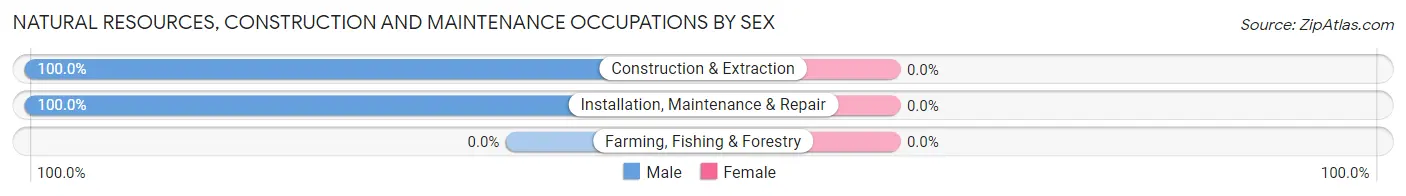
| Occupation | Male | Female |
| Farming, Fishing & Forestry | 0 (0.0%) | 0 (0.0%) |
| Construction & Extraction | 333 (100.0%) | 0 (0.0%) |
| Installation, Maintenance & Repair | 47 (100.0%) | 0 (0.0%) |
| Total (Category) | 380 (100.0%) | 0 (0.0%) |
| Total (Overall) | 1,211 (59.5%) | 823 (40.5%) |
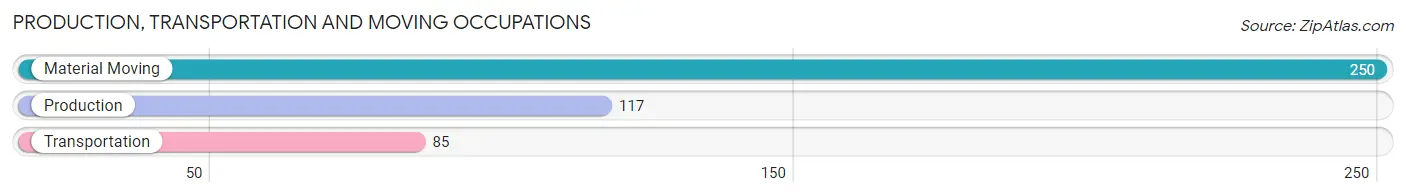
Production, Transportation and Moving Occupations
The most common Production, Transportation and Moving occupations in Denair are Material Moving (250 | 12.3%), Production (117 | 5.8%), and Transportation (85 | 4.2%).
Production, Transportation and Moving Occupations by Sex
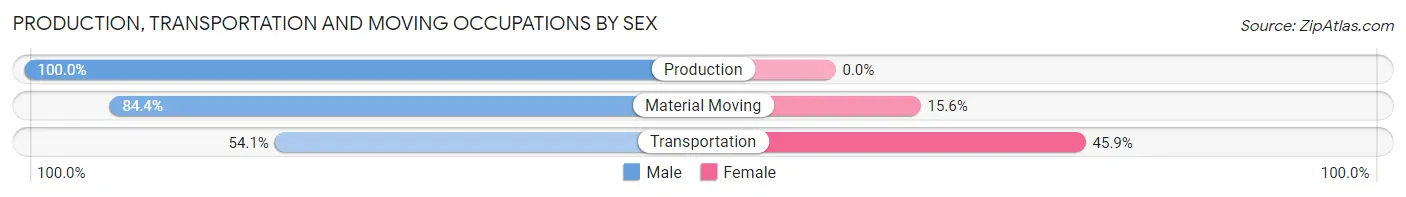
| Occupation | Male | Female |
| Production | 117 (100.0%) | 0 (0.0%) |
| Transportation | 46 (54.1%) | 39 (45.9%) |
| Material Moving | 211 (84.4%) | 39 (15.6%) |
| Total (Category) | 374 (82.7%) | 78 (17.3%) |
| Total (Overall) | 1,211 (59.5%) | 823 (40.5%) |
Employment Industries by Sex in Denair
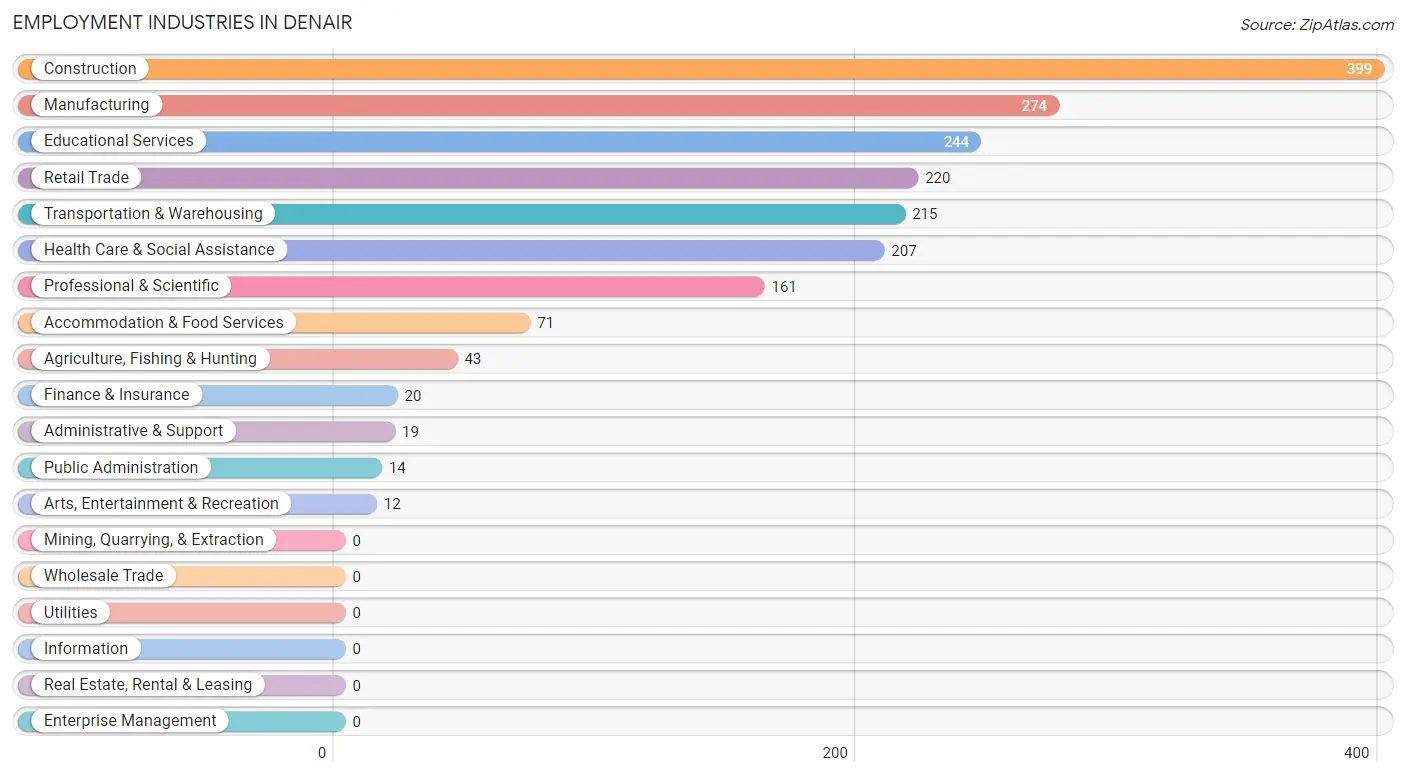
Employment Industries in Denair
The major employment industries in Denair include Construction (399 | 19.6%), Manufacturing (274 | 13.5%), Educational Services (244 | 12.0%), Retail Trade (220 | 10.8%), and Transportation & Warehousing (215 | 10.6%).
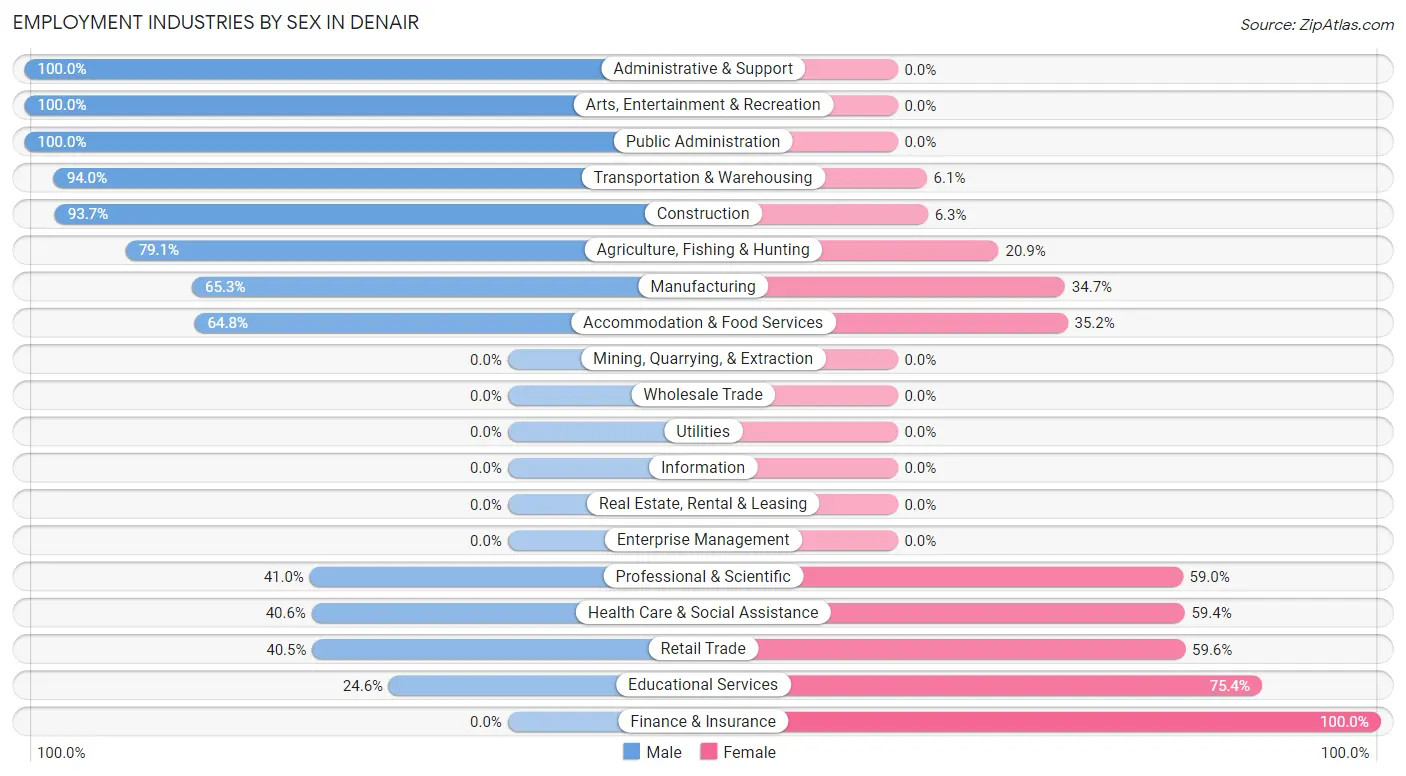
Employment Industries by Sex in Denair
The Denair industries that see more men than women are Administrative & Support (100.0%), Arts, Entertainment & Recreation (100.0%), and Public Administration (100.0%), whereas the industries that tend to have a higher number of women are Finance & Insurance (100.0%), Educational Services (75.4%), and Retail Trade (59.6%).
| Industry | Male | Female |
| Agriculture, Fishing & Hunting | 34 (79.1%) | 9 (20.9%) |
| Mining, Quarrying, & Extraction | 0 (0.0%) | 0 (0.0%) |
| Construction | 374 (93.7%) | 25 (6.3%) |
| Manufacturing | 179 (65.3%) | 95 (34.7%) |
| Wholesale Trade | 0 (0.0%) | 0 (0.0%) |
| Retail Trade | 89 (40.5%) | 131 (59.6%) |
| Transportation & Warehousing | 202 (94.0%) | 13 (6.0%) |
| Utilities | 0 (0.0%) | 0 (0.0%) |
| Information | 0 (0.0%) | 0 (0.0%) |
| Finance & Insurance | 0 (0.0%) | 20 (100.0%) |
| Real Estate, Rental & Leasing | 0 (0.0%) | 0 (0.0%) |
| Professional & Scientific | 66 (41.0%) | 95 (59.0%) |
| Enterprise Management | 0 (0.0%) | 0 (0.0%) |
| Administrative & Support | 19 (100.0%) | 0 (0.0%) |
| Educational Services | 60 (24.6%) | 184 (75.4%) |
| Health Care & Social Assistance | 84 (40.6%) | 123 (59.4%) |
| Arts, Entertainment & Recreation | 12 (100.0%) | 0 (0.0%) |
| Accommodation & Food Services | 46 (64.8%) | 25 (35.2%) |
| Public Administration | 14 (100.0%) | 0 (0.0%) |
| Total | 1,211 (59.5%) | 823 (40.5%) |
Education in Denair
School Enrollment in Denair
The most common levels of schooling among the 943 students in Denair are middle school (287 | 30.4%), college / undergraduate (285 | 30.2%), and elementary school (193 | 20.5%).
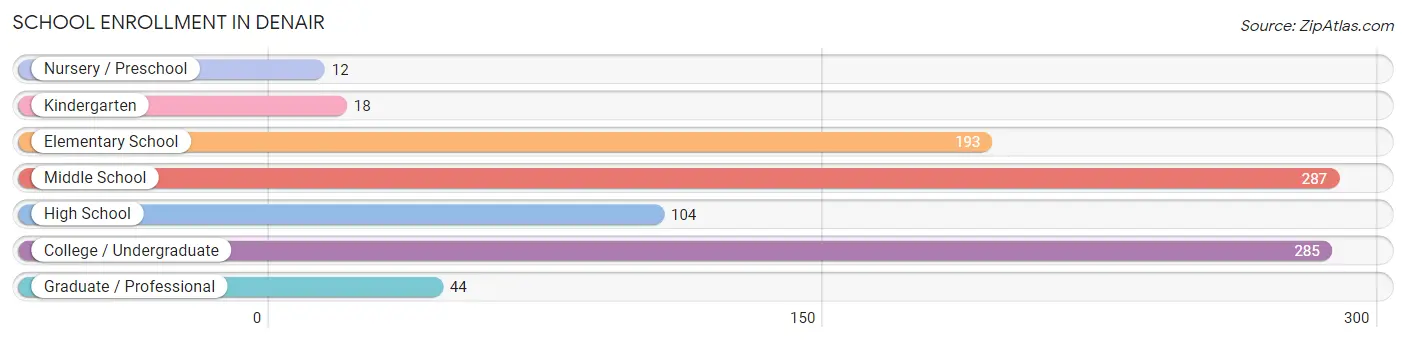
| School Level | # Students | % Students |
| Nursery / Preschool | 12 | 1.3% |
| Kindergarten | 18 | 1.9% |
| Elementary School | 193 | 20.5% |
| Middle School | 287 | 30.4% |
| High School | 104 | 11.0% |
| College / Undergraduate | 285 | 30.2% |
| Graduate / Professional | 44 | 4.7% |
| Total | 943 | 100.0% |
School Enrollment by Age by Funding Source in Denair
Out of a total of 943 students who are enrolled in schools in Denair, 252 (26.7%) attend a private institution, while the remaining 691 (73.3%) are enrolled in public schools. The age group of 25 to 34 year olds has the highest likelihood of being enrolled in private schools, with 125 (76.2% in the age bracket) enrolled. Conversely, the age group of 3 to 4 year olds has the lowest likelihood of being enrolled in a private school, with 12 (100.0% in the age bracket) attending a public institution.
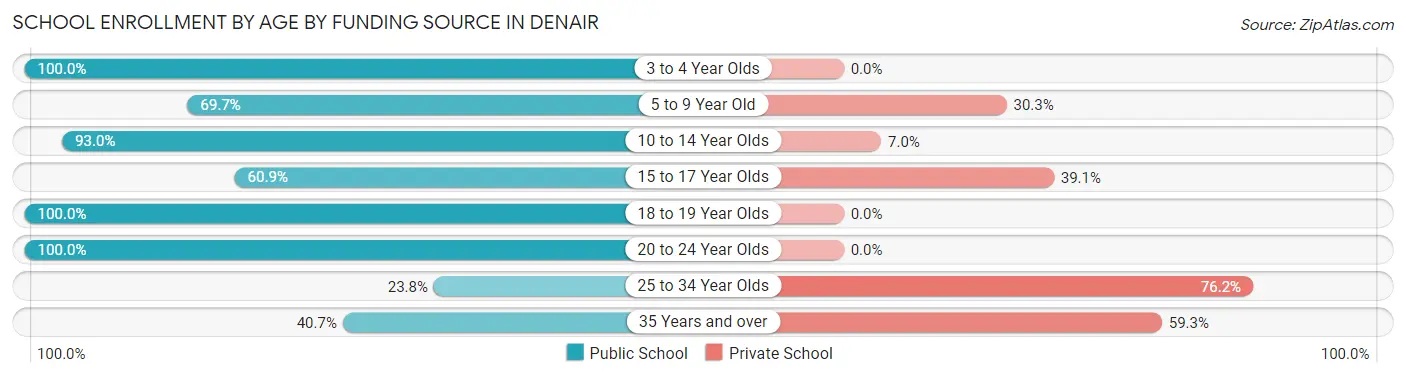
| Age Bracket | Public School | Private School |
| 3 to 4 Year Olds | 12 (100.0%) | 0 (0.0%) |
| 5 to 9 Year Old | 147 (69.7%) | 64 (30.3%) |
| 10 to 14 Year Olds | 267 (93.0%) | 20 (7.0%) |
| 15 to 17 Year Olds | 42 (60.9%) | 27 (39.1%) |
| 18 to 19 Year Olds | 117 (100.0%) | 0 (0.0%) |
| 20 to 24 Year Olds | 56 (100.0%) | 0 (0.0%) |
| 25 to 34 Year Olds | 39 (23.8%) | 125 (76.2%) |
| 35 Years and over | 11 (40.7%) | 16 (59.3%) |
| Total | 691 (73.3%) | 252 (26.7%) |
Educational Attainment by Field of Study in Denair
Science & technology (112 | 20.8%), bio, nature & agricultural (69 | 12.8%), visual & performing arts (58 | 10.8%), education (54 | 10.0%), and liberal arts & history (52 | 9.7%) are the most common fields of study among 539 individuals in Denair who have obtained a bachelor's degree or higher.
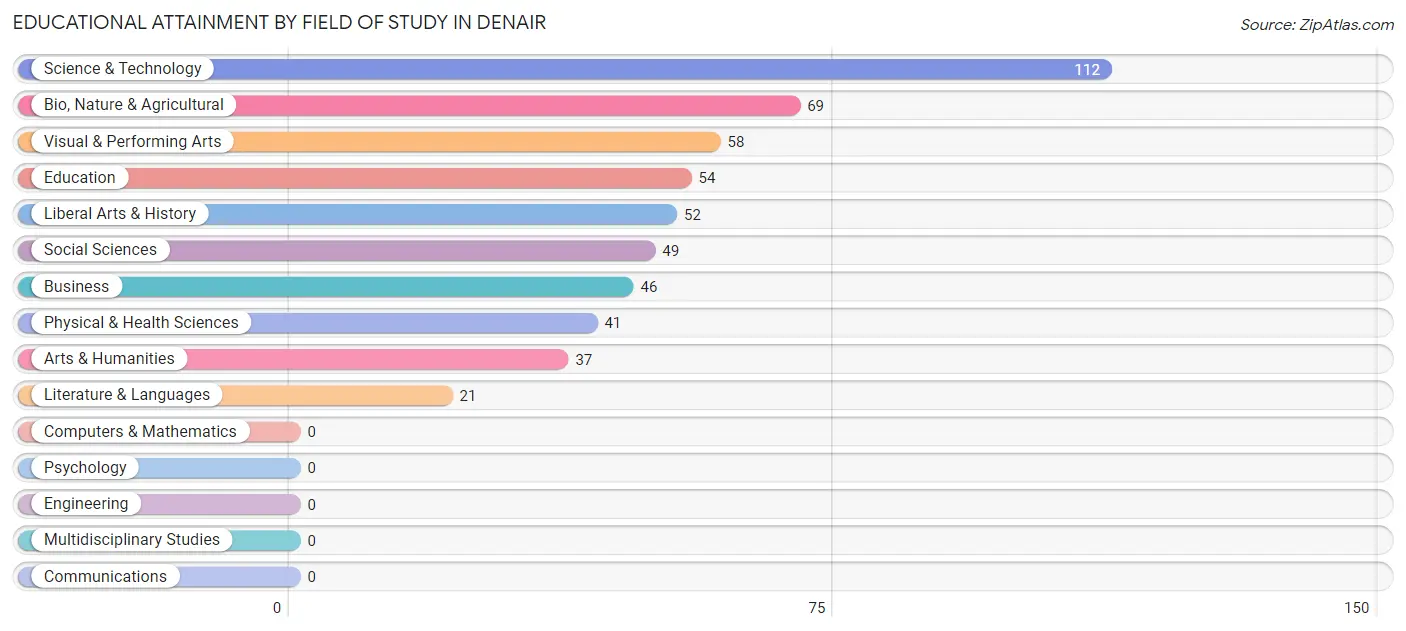
| Field of Study | # Graduates | % Graduates |
| Computers & Mathematics | 0 | 0.0% |
| Bio, Nature & Agricultural | 69 | 12.8% |
| Physical & Health Sciences | 41 | 7.6% |
| Psychology | 0 | 0.0% |
| Social Sciences | 49 | 9.1% |
| Engineering | 0 | 0.0% |
| Multidisciplinary Studies | 0 | 0.0% |
| Science & Technology | 112 | 20.8% |
| Business | 46 | 8.5% |
| Education | 54 | 10.0% |
| Literature & Languages | 21 | 3.9% |
| Liberal Arts & History | 52 | 9.7% |
| Visual & Performing Arts | 58 | 10.8% |
| Communications | 0 | 0.0% |
| Arts & Humanities | 37 | 6.9% |
| Total | 539 | 100.0% |
Transportation & Commute in Denair
Vehicle Availability by Sex in Denair
The most prevalent vehicle ownership categories in Denair are males with 2 vehicles (561, accounting for 47.5%) and females with 2 vehicles (413, making up 70.6%).
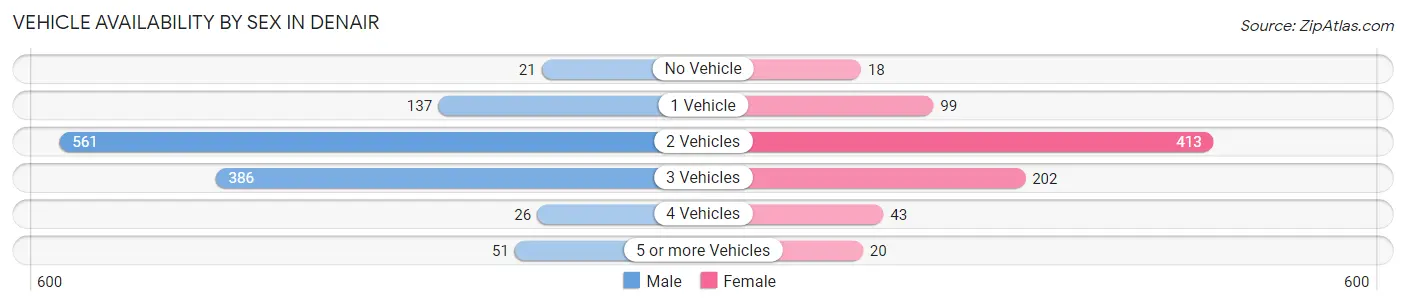
| Vehicles Available | Male | Female |
| No Vehicle | 21 (1.8%) | 18 (2.3%) |
| 1 Vehicle | 137 (11.6%) | 99 (12.4%) |
| 2 Vehicles | 561 (47.5%) | 413 (51.9%) |
| 3 Vehicles | 386 (32.7%) | 202 (25.4%) |
| 4 Vehicles | 26 (2.2%) | 43 (5.4%) |
| 5 or more Vehicles | 51 (4.3%) | 20 (2.5%) |
| Total | 1,182 (100.0%) | 795 (100.0%) |
Commute Time in Denair
The most frequently occuring commute durations in Denair are 20 to 24 minutes (311 commuters, 16.6%), 90 or more minutes (303 commuters, 16.2%), and 45 to 59 minutes (233 commuters, 12.4%).
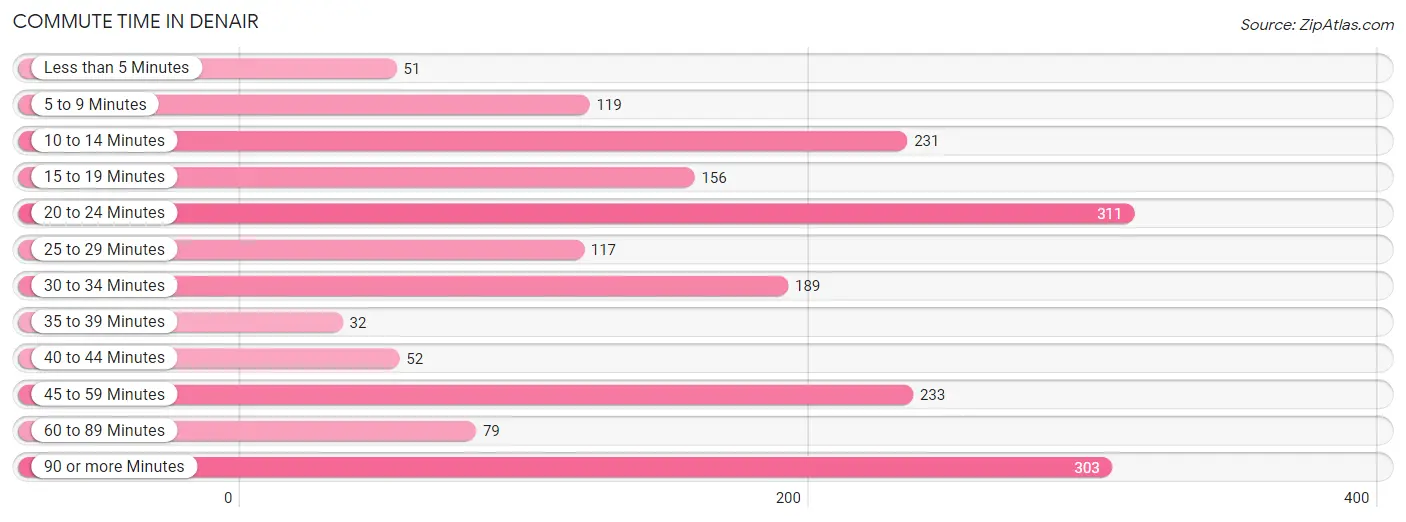
| Commute Time | # Commuters | % Commuters |
| Less than 5 Minutes | 51 | 2.7% |
| 5 to 9 Minutes | 119 | 6.4% |
| 10 to 14 Minutes | 231 | 12.3% |
| 15 to 19 Minutes | 156 | 8.3% |
| 20 to 24 Minutes | 311 | 16.6% |
| 25 to 29 Minutes | 117 | 6.2% |
| 30 to 34 Minutes | 189 | 10.1% |
| 35 to 39 Minutes | 32 | 1.7% |
| 40 to 44 Minutes | 52 | 2.8% |
| 45 to 59 Minutes | 233 | 12.4% |
| 60 to 89 Minutes | 79 | 4.2% |
| 90 or more Minutes | 303 | 16.2% |
Commute Time by Sex in Denair
The most common commute times in Denair are 90 or more minutes (303 commuters, 26.6%) for males and 10 to 14 minutes (157 commuters, 21.4%) for females.
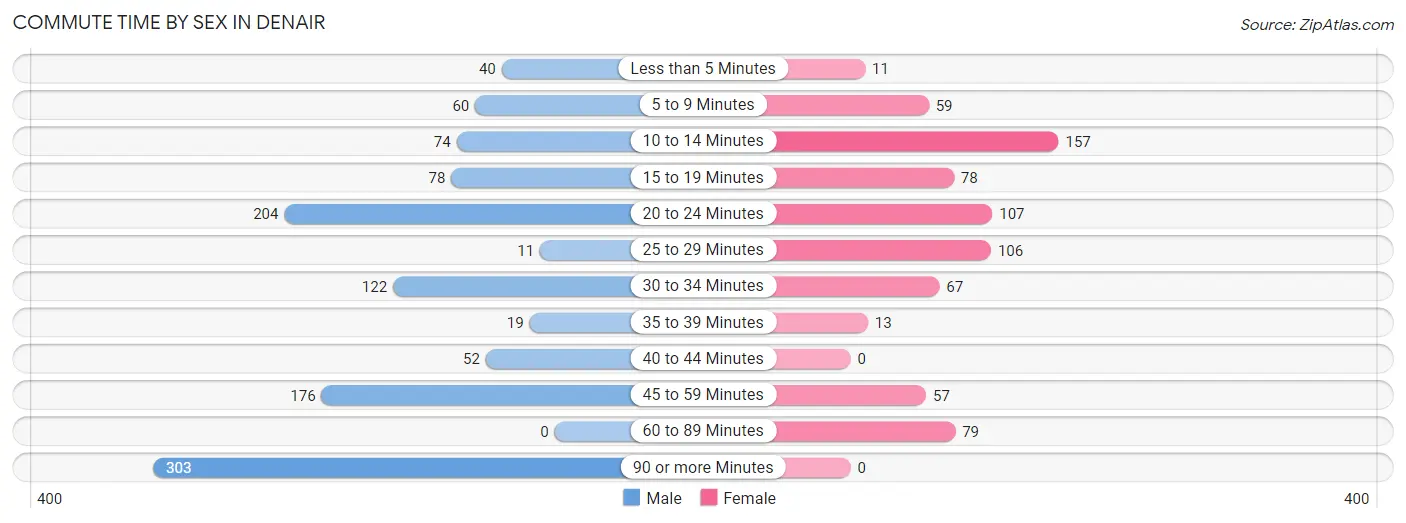
| Commute Time | Male | Female |
| Less than 5 Minutes | 40 (3.5%) | 11 (1.5%) |
| 5 to 9 Minutes | 60 (5.3%) | 59 (8.0%) |
| 10 to 14 Minutes | 74 (6.5%) | 157 (21.4%) |
| 15 to 19 Minutes | 78 (6.9%) | 78 (10.6%) |
| 20 to 24 Minutes | 204 (17.9%) | 107 (14.6%) |
| 25 to 29 Minutes | 11 (1.0%) | 106 (14.4%) |
| 30 to 34 Minutes | 122 (10.7%) | 67 (9.1%) |
| 35 to 39 Minutes | 19 (1.7%) | 13 (1.8%) |
| 40 to 44 Minutes | 52 (4.6%) | 0 (0.0%) |
| 45 to 59 Minutes | 176 (15.4%) | 57 (7.8%) |
| 60 to 89 Minutes | 0 (0.0%) | 79 (10.8%) |
| 90 or more Minutes | 303 (26.6%) | 0 (0.0%) |
Time of Departure to Work by Sex in Denair
The most frequent times of departure to work in Denair are 12:00 AM to 4:59 AM (401, 35.2%) for males and 7:00 AM to 7:29 AM (173, 23.6%) for females.
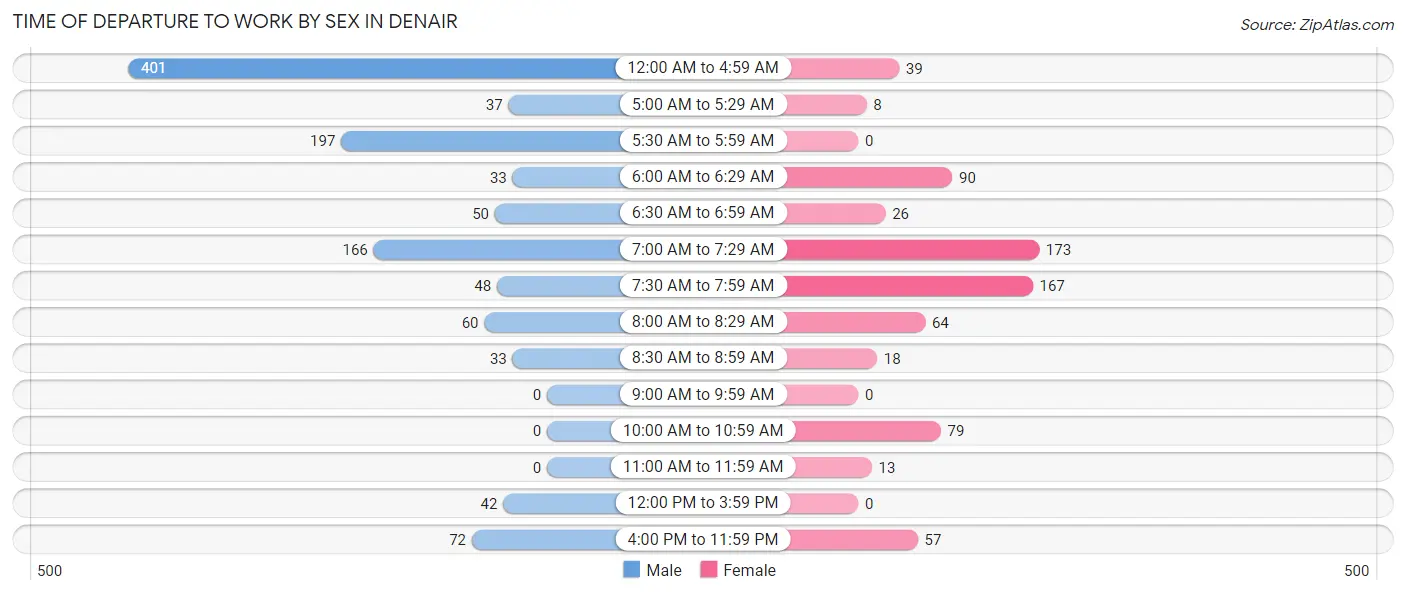
| Time of Departure | Male | Female |
| 12:00 AM to 4:59 AM | 401 (35.2%) | 39 (5.3%) |
| 5:00 AM to 5:29 AM | 37 (3.3%) | 8 (1.1%) |
| 5:30 AM to 5:59 AM | 197 (17.3%) | 0 (0.0%) |
| 6:00 AM to 6:29 AM | 33 (2.9%) | 90 (12.3%) |
| 6:30 AM to 6:59 AM | 50 (4.4%) | 26 (3.5%) |
| 7:00 AM to 7:29 AM | 166 (14.6%) | 173 (23.6%) |
| 7:30 AM to 7:59 AM | 48 (4.2%) | 167 (22.8%) |
| 8:00 AM to 8:29 AM | 60 (5.3%) | 64 (8.7%) |
| 8:30 AM to 8:59 AM | 33 (2.9%) | 18 (2.5%) |
| 9:00 AM to 9:59 AM | 0 (0.0%) | 0 (0.0%) |
| 10:00 AM to 10:59 AM | 0 (0.0%) | 79 (10.8%) |
| 11:00 AM to 11:59 AM | 0 (0.0%) | 13 (1.8%) |
| 12:00 PM to 3:59 PM | 42 (3.7%) | 0 (0.0%) |
| 4:00 PM to 11:59 PM | 72 (6.3%) | 57 (7.8%) |
| Total | 1,139 (100.0%) | 734 (100.0%) |
Housing Occupancy in Denair
Occupancy by Ownership in Denair
Of the total 1,551 dwellings in Denair, owner-occupied units account for 1,155 (74.5%), while renter-occupied units make up 396 (25.5%).
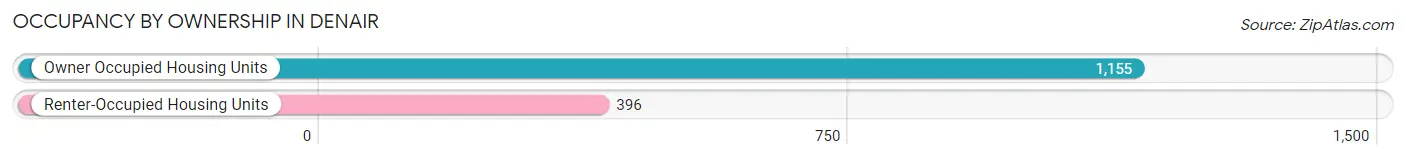
| Occupancy | # Housing Units | % Housing Units |
| Owner Occupied Housing Units | 1,155 | 74.5% |
| Renter-Occupied Housing Units | 396 | 25.5% |
| Total Occupied Housing Units | 1,551 | 100.0% |
Occupancy by Household Size in Denair
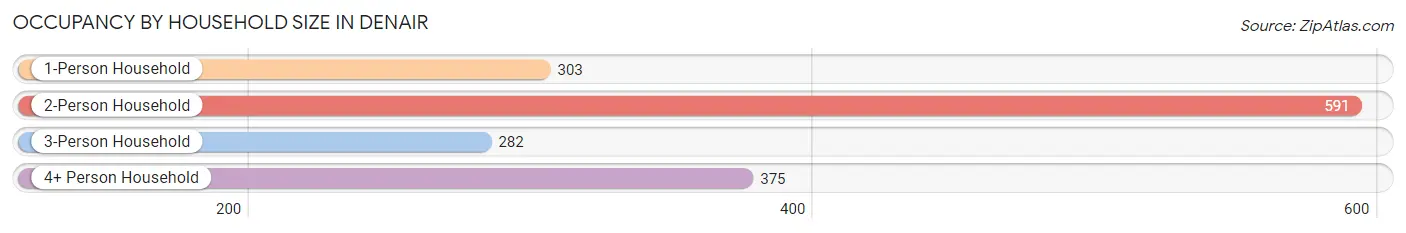
| Household Size | # Housing Units | % Housing Units |
| 1-Person Household | 303 | 19.5% |
| 2-Person Household | 591 | 38.1% |
| 3-Person Household | 282 | 18.2% |
| 4+ Person Household | 375 | 24.2% |
| Total Housing Units | 1,551 | 100.0% |
Occupancy by Ownership by Household Size in Denair
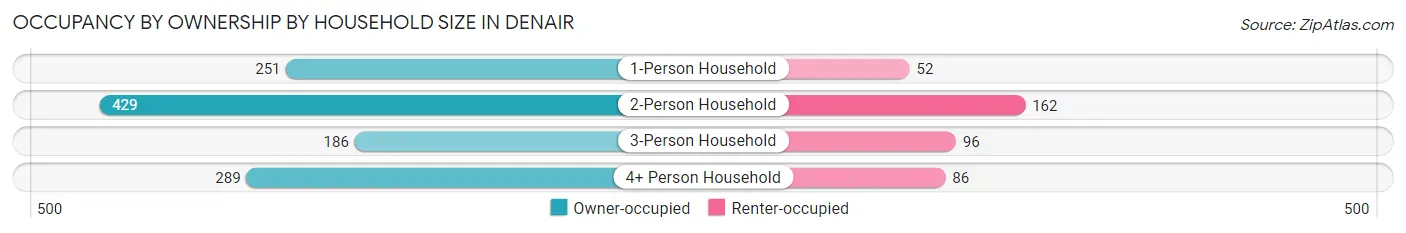
| Household Size | Owner-occupied | Renter-occupied |
| 1-Person Household | 251 (82.8%) | 52 (17.2%) |
| 2-Person Household | 429 (72.6%) | 162 (27.4%) |
| 3-Person Household | 186 (66.0%) | 96 (34.0%) |
| 4+ Person Household | 289 (77.1%) | 86 (22.9%) |
| Total Housing Units | 1,155 (74.5%) | 396 (25.5%) |
Occupancy by Educational Attainment in Denair
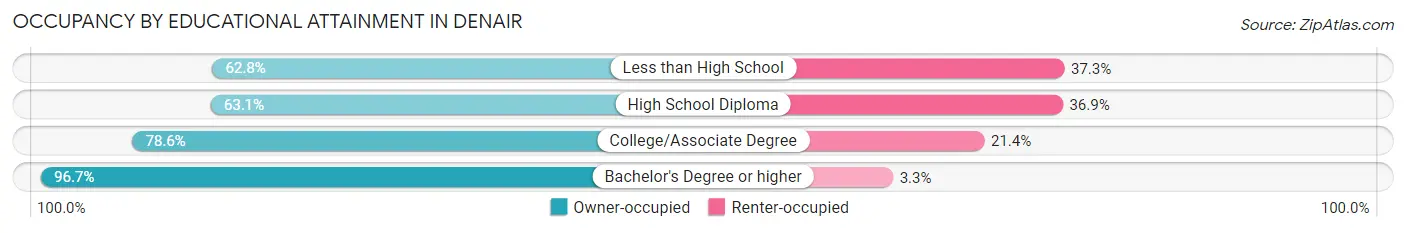
| Household Size | Owner-occupied | Renter-occupied |
| Less than High School | 96 (62.7%) | 57 (37.2%) |
| High School Diploma | 408 (63.1%) | 239 (36.9%) |
| College/Associate Degree | 327 (78.6%) | 89 (21.4%) |
| Bachelor's Degree or higher | 324 (96.7%) | 11 (3.3%) |
Occupancy by Age of Householder in Denair
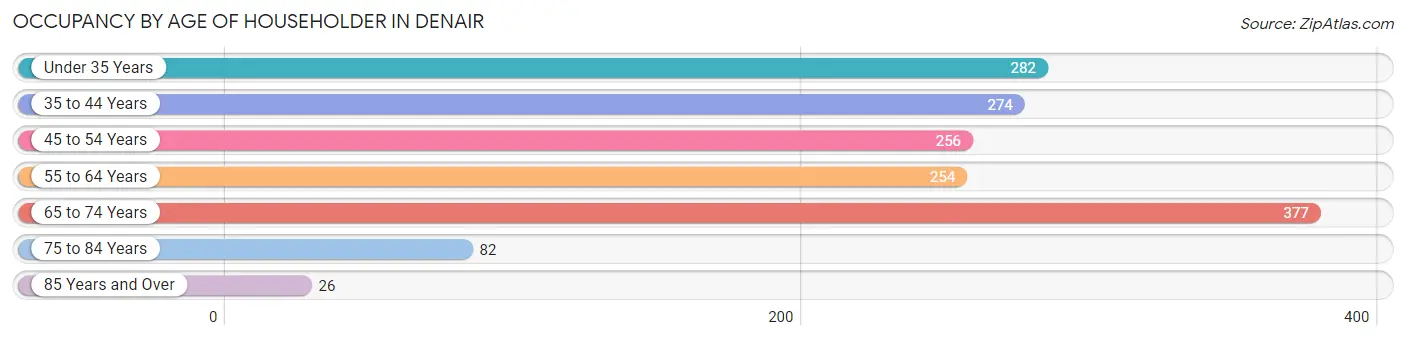
| Age Bracket | # Households | % Households |
| Under 35 Years | 282 | 18.2% |
| 35 to 44 Years | 274 | 17.7% |
| 45 to 54 Years | 256 | 16.5% |
| 55 to 64 Years | 254 | 16.4% |
| 65 to 74 Years | 377 | 24.3% |
| 75 to 84 Years | 82 | 5.3% |
| 85 Years and Over | 26 | 1.7% |
| Total | 1,551 | 100.0% |
Housing Finances in Denair
Median Income by Occupancy in Denair
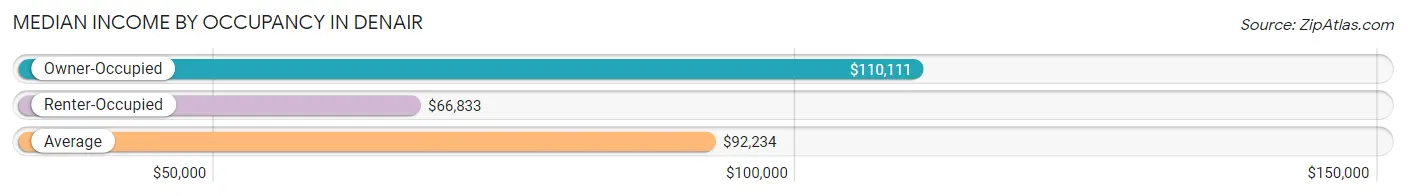
| Occupancy Type | # Households | Median Income |
| Owner-Occupied | 1,155 (74.5%) | $110,111 |
| Renter-Occupied | 396 (25.5%) | $66,833 |
| Average | 1,551 (100.0%) | $92,234 |
Occupancy by Householder Income Bracket in Denair
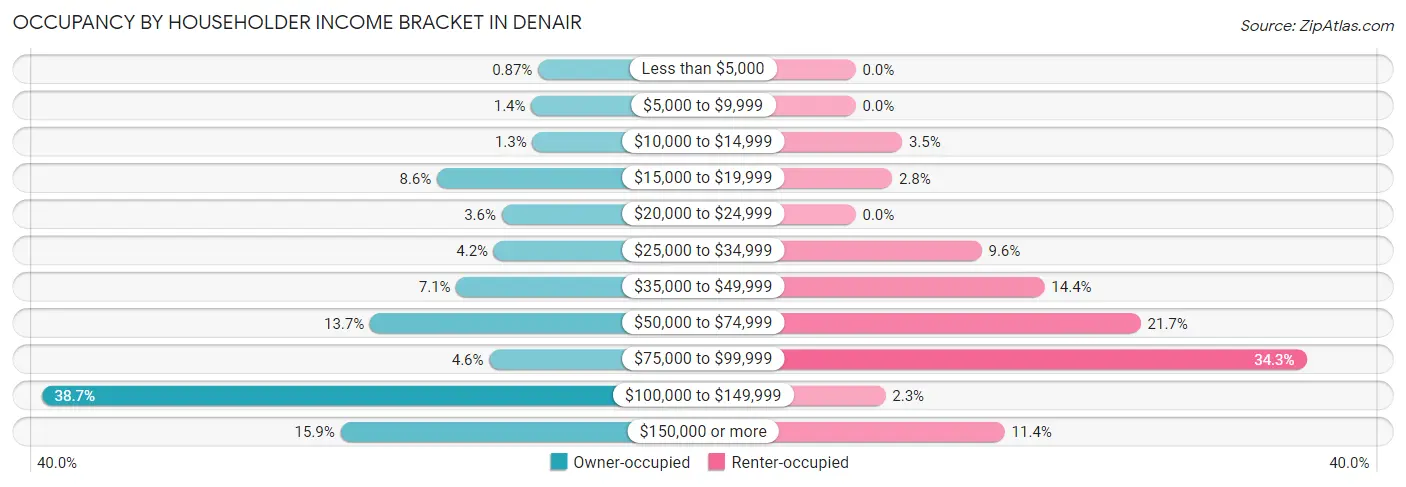
| Income Bracket | Owner-occupied | Renter-occupied |
| Less than $5,000 | 10 (0.9%) | 0 (0.0%) |
| $5,000 to $9,999 | 16 (1.4%) | 0 (0.0%) |
| $10,000 to $14,999 | 15 (1.3%) | 14 (3.5%) |
| $15,000 to $19,999 | 99 (8.6%) | 11 (2.8%) |
| $20,000 to $24,999 | 42 (3.6%) | 0 (0.0%) |
| $25,000 to $34,999 | 49 (4.2%) | 38 (9.6%) |
| $35,000 to $49,999 | 82 (7.1%) | 57 (14.4%) |
| $50,000 to $74,999 | 158 (13.7%) | 86 (21.7%) |
| $75,000 to $99,999 | 53 (4.6%) | 136 (34.3%) |
| $100,000 to $149,999 | 447 (38.7%) | 9 (2.3%) |
| $150,000 or more | 184 (15.9%) | 45 (11.4%) |
| Total | 1,155 (100.0%) | 396 (100.0%) |
Monthly Housing Cost Tiers in Denair
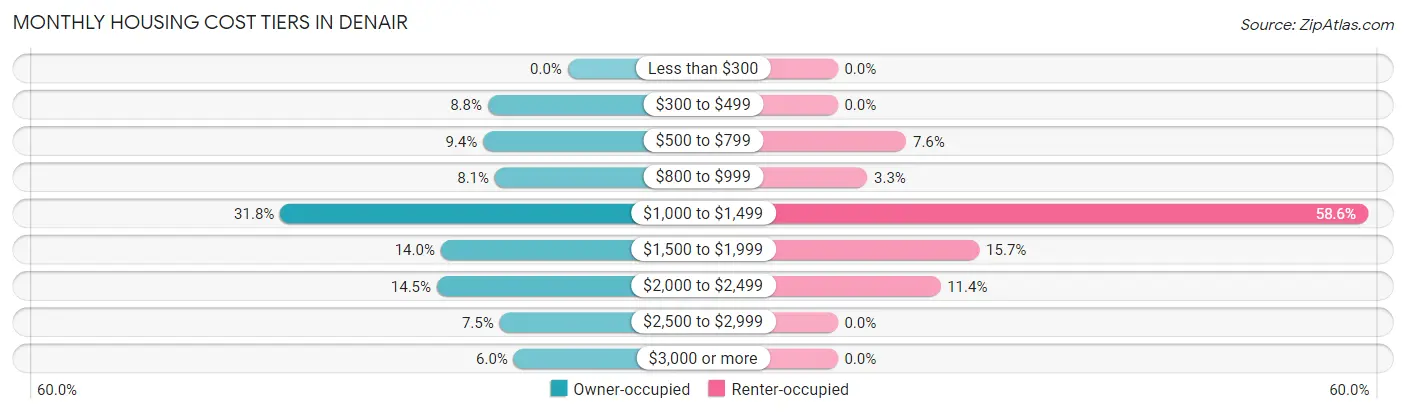
| Monthly Cost | Owner-occupied | Renter-occupied |
| Less than $300 | 0 (0.0%) | 0 (0.0%) |
| $300 to $499 | 102 (8.8%) | 0 (0.0%) |
| $500 to $799 | 108 (9.3%) | 30 (7.6%) |
| $800 to $999 | 93 (8.1%) | 13 (3.3%) |
| $1,000 to $1,499 | 367 (31.8%) | 232 (58.6%) |
| $1,500 to $1,999 | 162 (14.0%) | 62 (15.7%) |
| $2,000 to $2,499 | 167 (14.5%) | 45 (11.4%) |
| $2,500 to $2,999 | 87 (7.5%) | 0 (0.0%) |
| $3,000 or more | 69 (6.0%) | 0 (0.0%) |
| Total | 1,155 (100.0%) | 396 (100.0%) |
Physical Housing Characteristics in Denair
Housing Structures in Denair
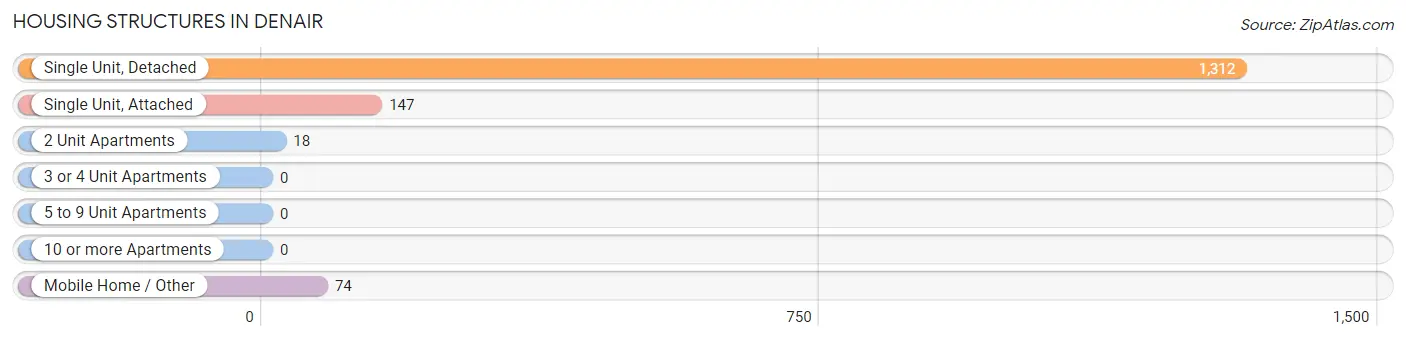
| Structure Type | # Housing Units | % Housing Units |
| Single Unit, Detached | 1,312 | 84.6% |
| Single Unit, Attached | 147 | 9.5% |
| 2 Unit Apartments | 18 | 1.2% |
| 3 or 4 Unit Apartments | 0 | 0.0% |
| 5 to 9 Unit Apartments | 0 | 0.0% |
| 10 or more Apartments | 0 | 0.0% |
| Mobile Home / Other | 74 | 4.8% |
| Total | 1,551 | 100.0% |
Housing Structures by Occupancy in Denair
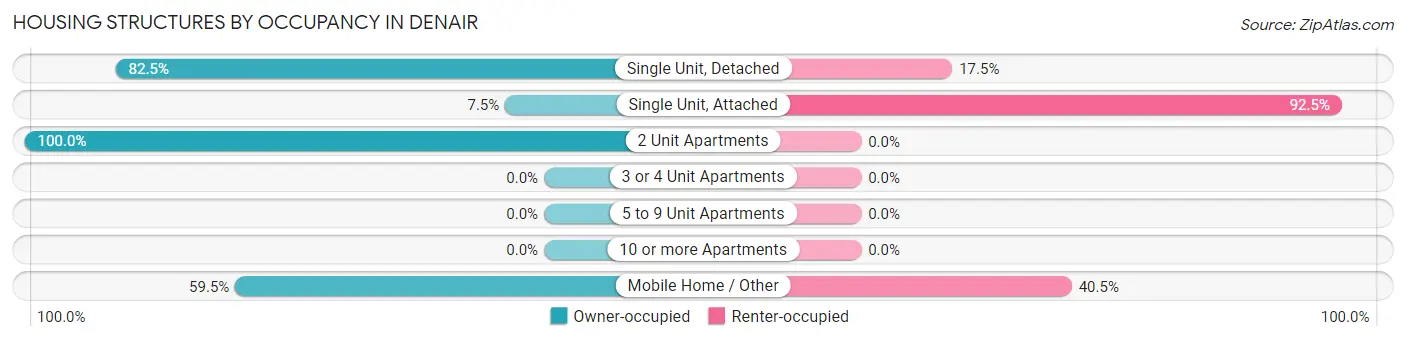
| Structure Type | Owner-occupied | Renter-occupied |
| Single Unit, Detached | 1,082 (82.5%) | 230 (17.5%) |
| Single Unit, Attached | 11 (7.5%) | 136 (92.5%) |
| 2 Unit Apartments | 18 (100.0%) | 0 (0.0%) |
| 3 or 4 Unit Apartments | 0 (0.0%) | 0 (0.0%) |
| 5 to 9 Unit Apartments | 0 (0.0%) | 0 (0.0%) |
| 10 or more Apartments | 0 (0.0%) | 0 (0.0%) |
| Mobile Home / Other | 44 (59.5%) | 30 (40.5%) |
| Total | 1,155 (74.5%) | 396 (25.5%) |
Housing Structures by Number of Rooms in Denair
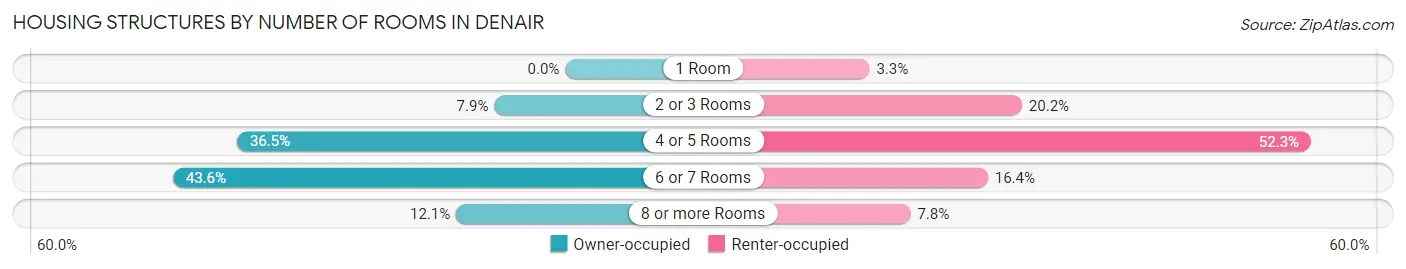
| Number of Rooms | Owner-occupied | Renter-occupied |
| 1 Room | 0 (0.0%) | 13 (3.3%) |
| 2 or 3 Rooms | 91 (7.9%) | 80 (20.2%) |
| 4 or 5 Rooms | 421 (36.4%) | 207 (52.3%) |
| 6 or 7 Rooms | 503 (43.5%) | 65 (16.4%) |
| 8 or more Rooms | 140 (12.1%) | 31 (7.8%) |
| Total | 1,155 (100.0%) | 396 (100.0%) |
Housing Structure by Heating Type in Denair
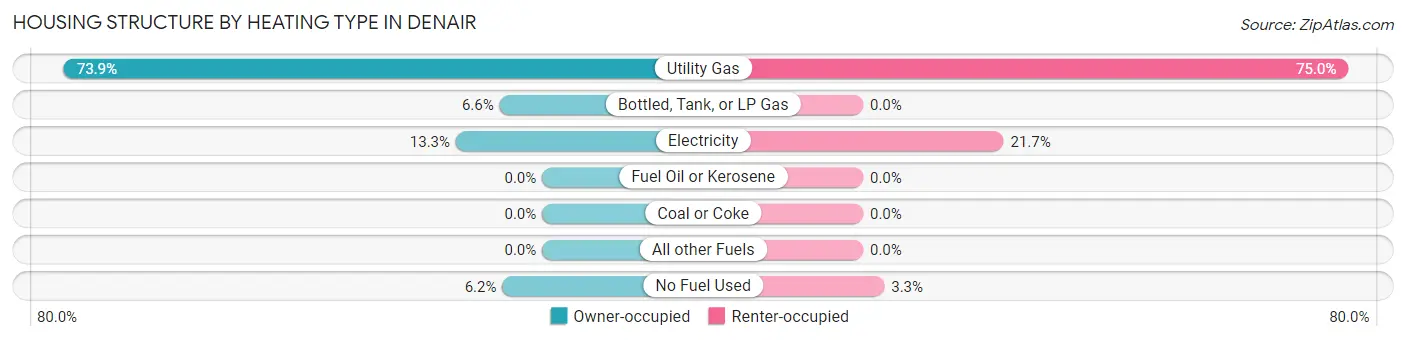
| Heating Type | Owner-occupied | Renter-occupied |
| Utility Gas | 854 (73.9%) | 297 (75.0%) |
| Bottled, Tank, or LP Gas | 76 (6.6%) | 0 (0.0%) |
| Electricity | 154 (13.3%) | 86 (21.7%) |
| Fuel Oil or Kerosene | 0 (0.0%) | 0 (0.0%) |
| Coal or Coke | 0 (0.0%) | 0 (0.0%) |
| All other Fuels | 0 (0.0%) | 0 (0.0%) |
| No Fuel Used | 71 (6.1%) | 13 (3.3%) |
| Total | 1,155 (100.0%) | 396 (100.0%) |
Household Vehicle Usage in Denair
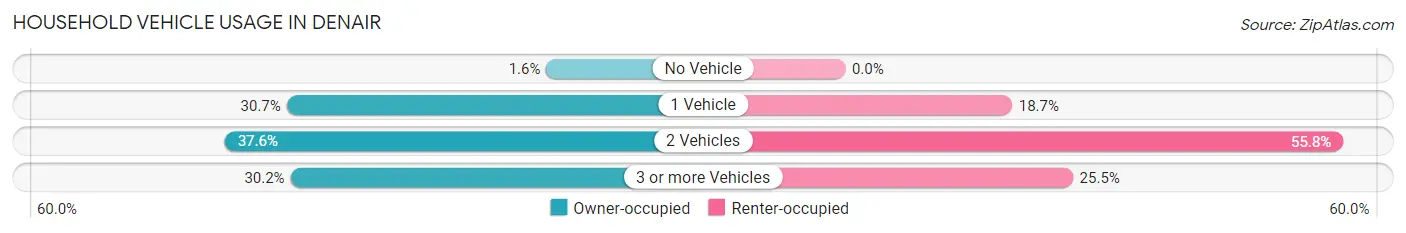
| Vehicles per Household | Owner-occupied | Renter-occupied |
| No Vehicle | 18 (1.6%) | 0 (0.0%) |
| 1 Vehicle | 354 (30.6%) | 74 (18.7%) |
| 2 Vehicles | 434 (37.6%) | 221 (55.8%) |
| 3 or more Vehicles | 349 (30.2%) | 101 (25.5%) |
| Total | 1,155 (100.0%) | 396 (100.0%) |
Real Estate & Mortgages in Denair
Real Estate and Mortgage Overview in Denair
| Characteristic | Without Mortgage | With Mortgage |
| Housing Units | 224 | 931 |
| Median Property Value | $242,900 | $371,200 |
| Median Household Income | $57,857 | $172 |
| Monthly Housing Costs | $514 | $69 |
| Real Estate Taxes | $1,289 | $9 |
Property Value by Mortgage Status in Denair
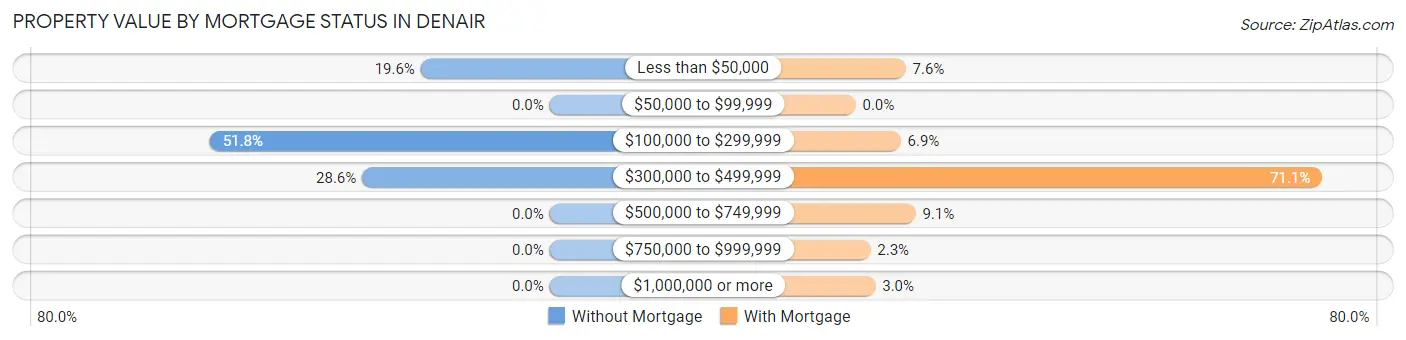
| Property Value | Without Mortgage | With Mortgage |
| Less than $50,000 | 44 (19.6%) | 71 (7.6%) |
| $50,000 to $99,999 | 0 (0.0%) | 0 (0.0%) |
| $100,000 to $299,999 | 116 (51.8%) | 64 (6.9%) |
| $300,000 to $499,999 | 64 (28.6%) | 662 (71.1%) |
| $500,000 to $749,999 | 0 (0.0%) | 85 (9.1%) |
| $750,000 to $999,999 | 0 (0.0%) | 21 (2.3%) |
| $1,000,000 or more | 0 (0.0%) | 28 (3.0%) |
| Total | 224 (100.0%) | 931 (100.0%) |
Household Income by Mortgage Status in Denair
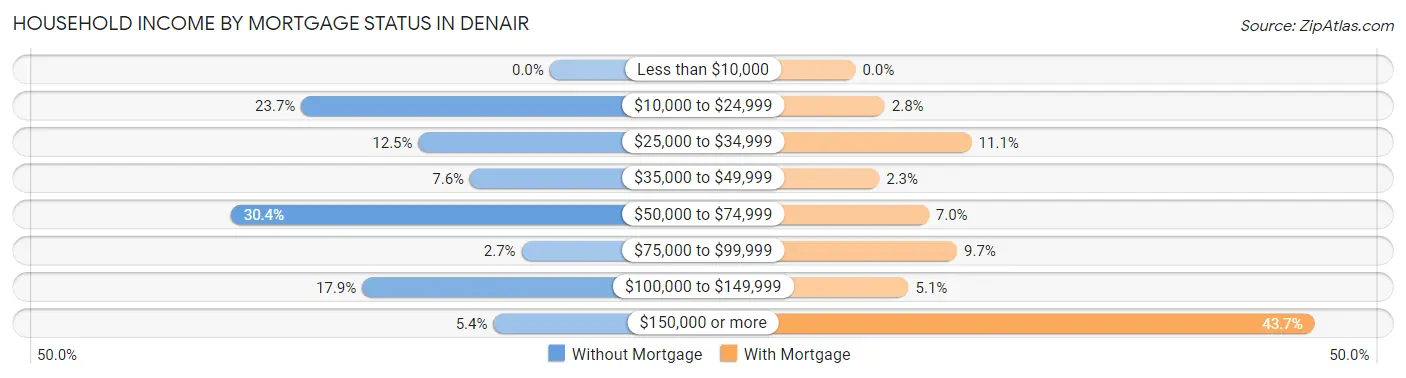
| Household Income | Without Mortgage | With Mortgage |
| Less than $10,000 | 0 (0.0%) | 0 (0.0%) |
| $10,000 to $24,999 | 53 (23.7%) | 26 (2.8%) |
| $25,000 to $34,999 | 28 (12.5%) | 103 (11.1%) |
| $35,000 to $49,999 | 17 (7.6%) | 21 (2.3%) |
| $50,000 to $74,999 | 68 (30.4%) | 65 (7.0%) |
| $75,000 to $99,999 | 6 (2.7%) | 90 (9.7%) |
| $100,000 to $149,999 | 40 (17.9%) | 47 (5.1%) |
| $150,000 or more | 12 (5.4%) | 407 (43.7%) |
| Total | 224 (100.0%) | 931 (100.0%) |
Property Value to Household Income Ratio in Denair
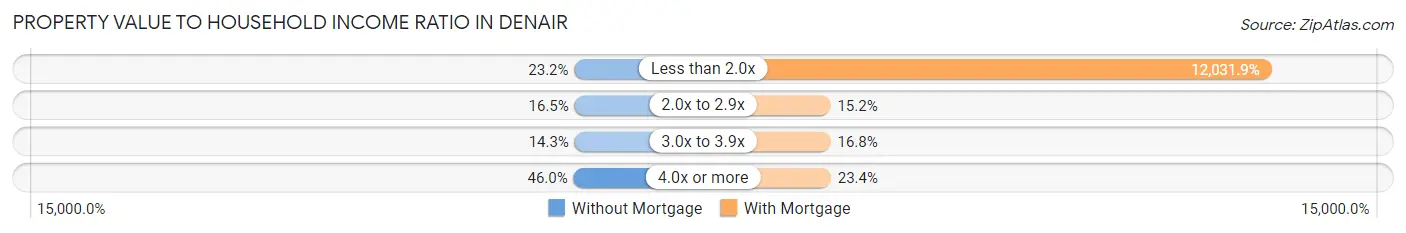
| Value-to-Income Ratio | Without Mortgage | With Mortgage |
| Less than 2.0x | 52 (23.2%) | 112,017 (12,031.9%) |
| 2.0x to 2.9x | 37 (16.5%) | 141 (15.1%) |
| 3.0x to 3.9x | 32 (14.3%) | 156 (16.8%) |
| 4.0x or more | 103 (46.0%) | 218 (23.4%) |
| Total | 224 (100.0%) | 931 (100.0%) |
Real Estate Taxes by Mortgage Status in Denair
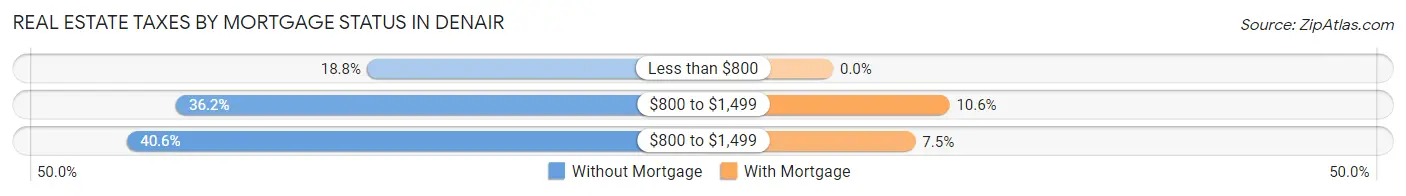
| Property Taxes | Without Mortgage | With Mortgage |
| Less than $800 | 42 (18.8%) | 0 (0.0%) |
| $800 to $1,499 | 81 (36.2%) | 99 (10.6%) |
| $800 to $1,499 | 91 (40.6%) | 70 (7.5%) |
| Total | 224 (100.0%) | 931 (100.0%) |
Health & Disability in Denair
Health Insurance Coverage by Age in Denair
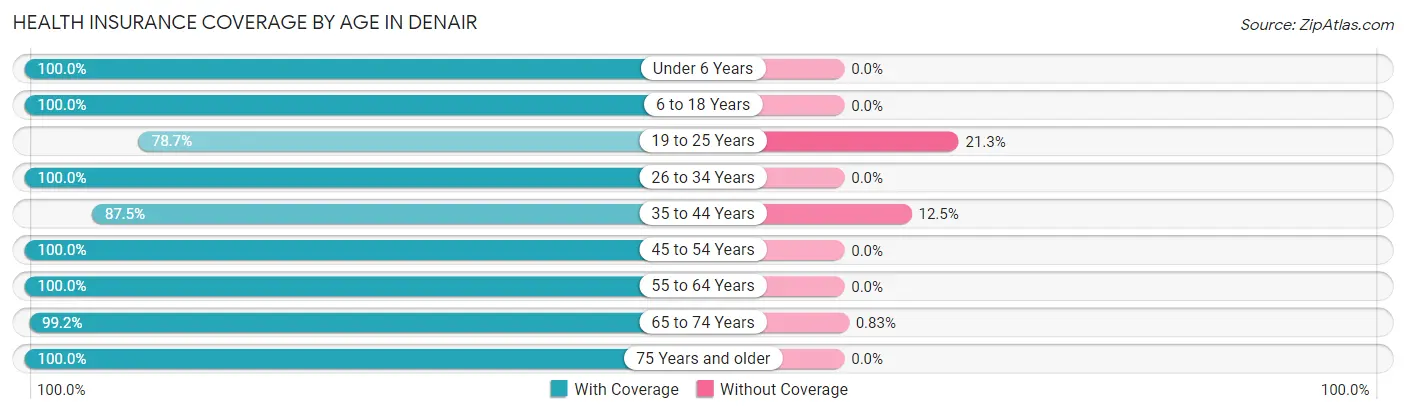
| Age Bracket | With Coverage | Without Coverage |
| Under 6 Years | 329 (100.0%) | 0 (0.0%) |
| 6 to 18 Years | 602 (100.0%) | 0 (0.0%) |
| 19 to 25 Years | 521 (78.7%) | 141 (21.3%) |
| 26 to 34 Years | 275 (100.0%) | 0 (0.0%) |
| 35 to 44 Years | 523 (87.5%) | 75 (12.5%) |
| 45 to 54 Years | 580 (100.0%) | 0 (0.0%) |
| 55 to 64 Years | 601 (100.0%) | 0 (0.0%) |
| 65 to 74 Years | 479 (99.2%) | 4 (0.8%) |
| 75 Years and older | 159 (100.0%) | 0 (0.0%) |
| Total | 4,069 (94.9%) | 220 (5.1%) |
Health Insurance Coverage by Citizenship Status in Denair
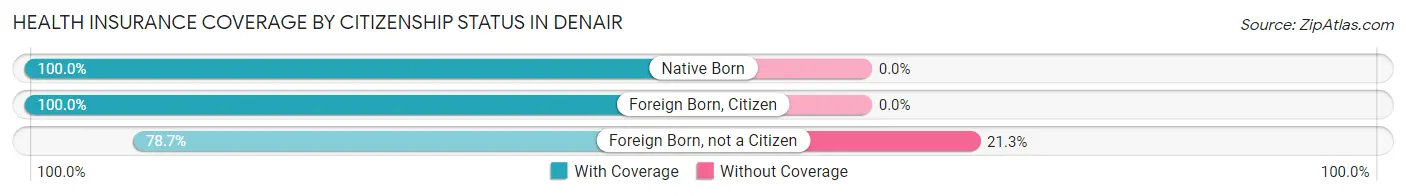
| Citizenship Status | With Coverage | Without Coverage |
| Native Born | 329 (100.0%) | 0 (0.0%) |
| Foreign Born, Citizen | 602 (100.0%) | 0 (0.0%) |
| Foreign Born, not a Citizen | 521 (78.7%) | 141 (21.3%) |
Health Insurance Coverage by Household Income in Denair
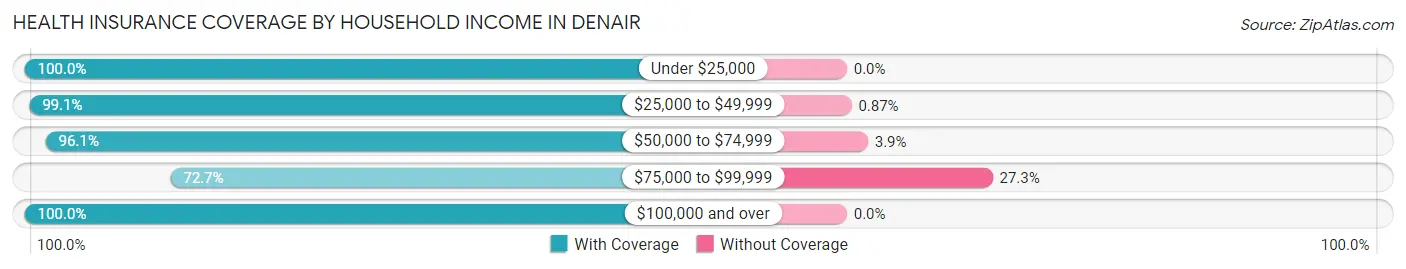
| Household Income | With Coverage | Without Coverage |
| Under $25,000 | 377 (100.0%) | 0 (0.0%) |
| $25,000 to $49,999 | 458 (99.1%) | 4 (0.9%) |
| $50,000 to $74,999 | 783 (96.1%) | 32 (3.9%) |
| $75,000 to $99,999 | 490 (72.7%) | 184 (27.3%) |
| $100,000 and over | 1,961 (100.0%) | 0 (0.0%) |
Public vs Private Health Insurance Coverage by Age in Denair
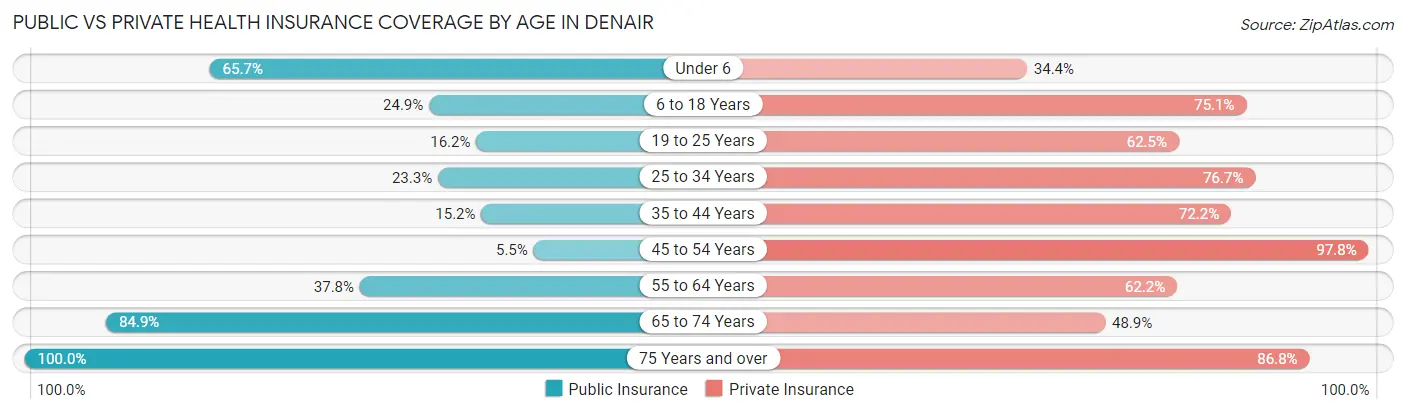
| Age Bracket | Public Insurance | Private Insurance |
| Under 6 | 216 (65.6%) | 113 (34.4%) |
| 6 to 18 Years | 150 (24.9%) | 452 (75.1%) |
| 19 to 25 Years | 107 (16.2%) | 414 (62.5%) |
| 25 to 34 Years | 64 (23.3%) | 211 (76.7%) |
| 35 to 44 Years | 91 (15.2%) | 432 (72.2%) |
| 45 to 54 Years | 32 (5.5%) | 567 (97.8%) |
| 55 to 64 Years | 227 (37.8%) | 374 (62.2%) |
| 65 to 74 Years | 410 (84.9%) | 236 (48.9%) |
| 75 Years and over | 159 (100.0%) | 138 (86.8%) |
| Total | 1,456 (34.0%) | 2,937 (68.5%) |
Disability Status by Sex by Age in Denair
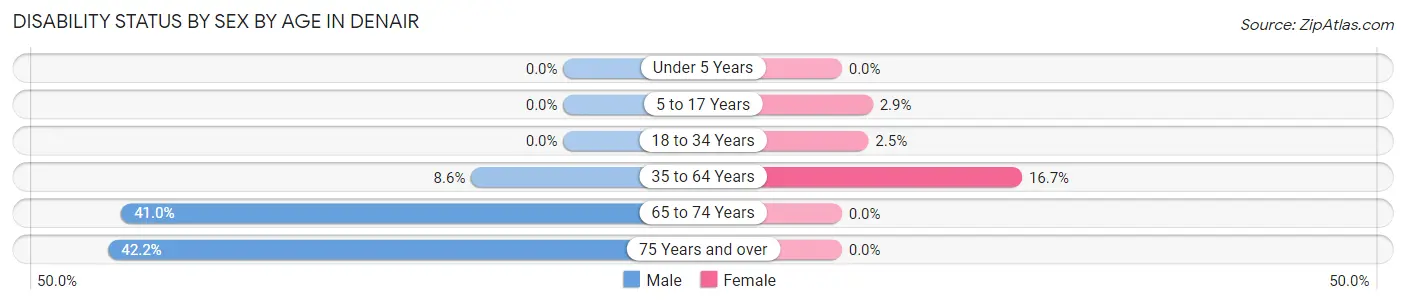
| Age Bracket | Male | Female |
| Under 5 Years | 0 (0.0%) | 0 (0.0%) |
| 5 to 17 Years | 0 (0.0%) | 13 (2.9%) |
| 18 to 34 Years | 0 (0.0%) | 13 (2.5%) |
| 35 to 64 Years | 78 (8.6%) | 145 (16.7%) |
| 65 to 74 Years | 80 (41.0%) | 0 (0.0%) |
| 75 Years and over | 38 (42.2%) | 0 (0.0%) |
Disability Class by Sex by Age in Denair
Disability Class: Hearing Difficulty
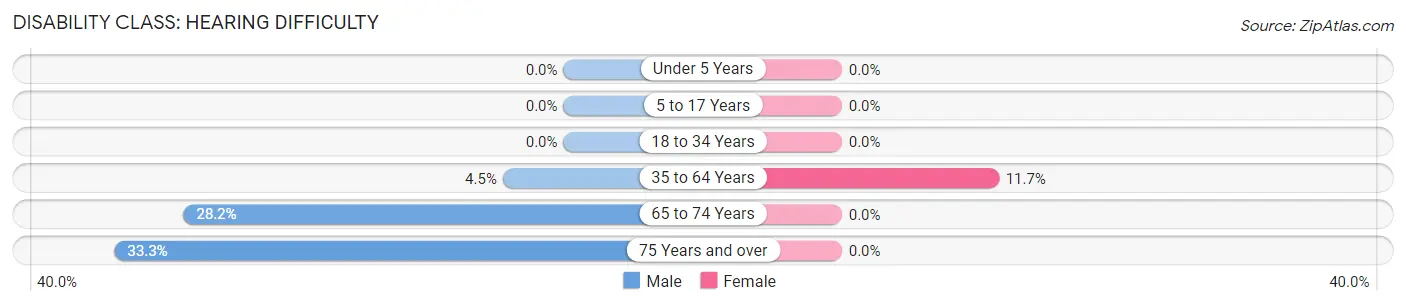
| Age Bracket | Male | Female |
| Under 5 Years | 0 (0.0%) | 0 (0.0%) |
| 5 to 17 Years | 0 (0.0%) | 0 (0.0%) |
| 18 to 34 Years | 0 (0.0%) | 0 (0.0%) |
| 35 to 64 Years | 41 (4.5%) | 101 (11.7%) |
| 65 to 74 Years | 55 (28.2%) | 0 (0.0%) |
| 75 Years and over | 30 (33.3%) | 0 (0.0%) |
Disability Class: Vision Difficulty
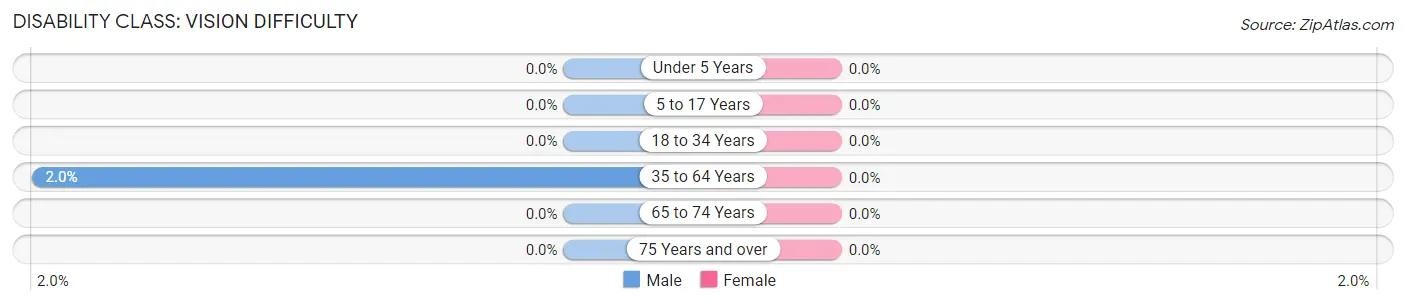
| Age Bracket | Male | Female |
| Under 5 Years | 0 (0.0%) | 0 (0.0%) |
| 5 to 17 Years | 0 (0.0%) | 0 (0.0%) |
| 18 to 34 Years | 0 (0.0%) | 0 (0.0%) |
| 35 to 64 Years | 18 (2.0%) | 0 (0.0%) |
| 65 to 74 Years | 0 (0.0%) | 0 (0.0%) |
| 75 Years and over | 0 (0.0%) | 0 (0.0%) |
Disability Class: Cognitive Difficulty
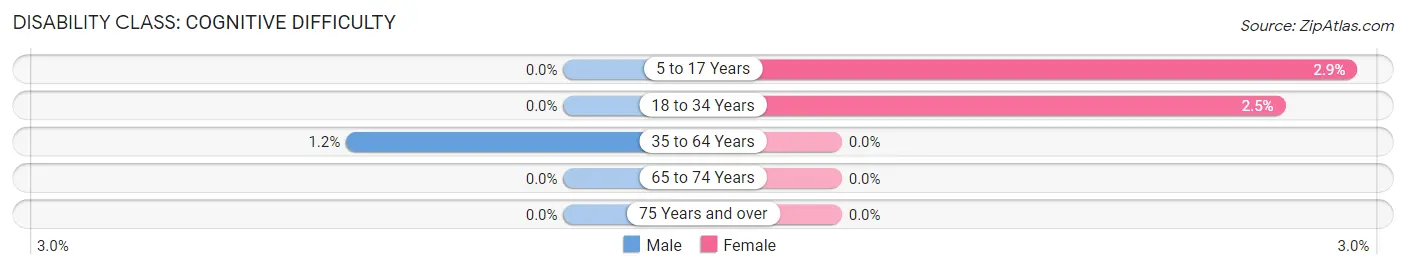
| Age Bracket | Male | Female |
| 5 to 17 Years | 0 (0.0%) | 13 (2.9%) |
| 18 to 34 Years | 0 (0.0%) | 13 (2.5%) |
| 35 to 64 Years | 11 (1.2%) | 0 (0.0%) |
| 65 to 74 Years | 0 (0.0%) | 0 (0.0%) |
| 75 Years and over | 0 (0.0%) | 0 (0.0%) |
Disability Class: Ambulatory Difficulty
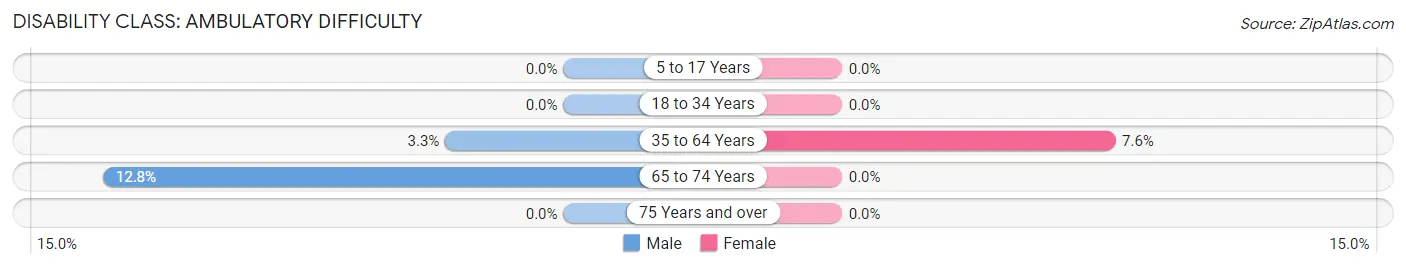
| Age Bracket | Male | Female |
| 5 to 17 Years | 0 (0.0%) | 0 (0.0%) |
| 18 to 34 Years | 0 (0.0%) | 0 (0.0%) |
| 35 to 64 Years | 30 (3.3%) | 66 (7.6%) |
| 65 to 74 Years | 25 (12.8%) | 0 (0.0%) |
| 75 Years and over | 0 (0.0%) | 0 (0.0%) |
Disability Class: Self-Care Difficulty
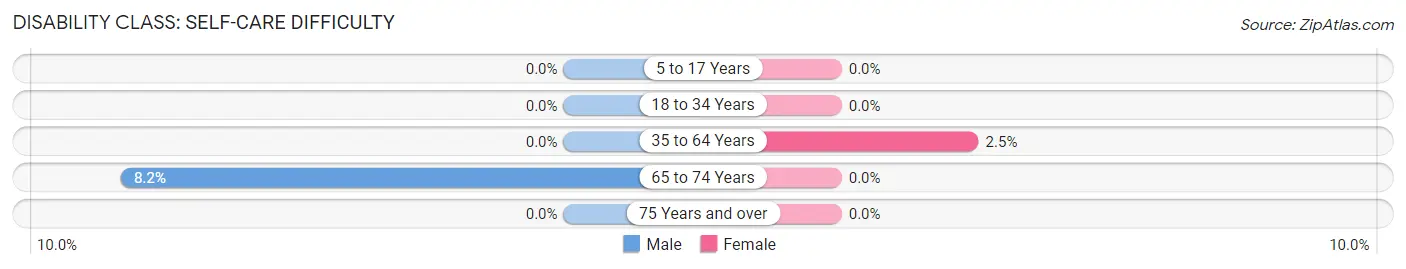
| Age Bracket | Male | Female |
| 5 to 17 Years | 0 (0.0%) | 0 (0.0%) |
| 18 to 34 Years | 0 (0.0%) | 0 (0.0%) |
| 35 to 64 Years | 0 (0.0%) | 22 (2.5%) |
| 65 to 74 Years | 16 (8.2%) | 0 (0.0%) |
| 75 Years and over | 0 (0.0%) | 0 (0.0%) |
Technology Access in Denair
Computing Device Access in Denair
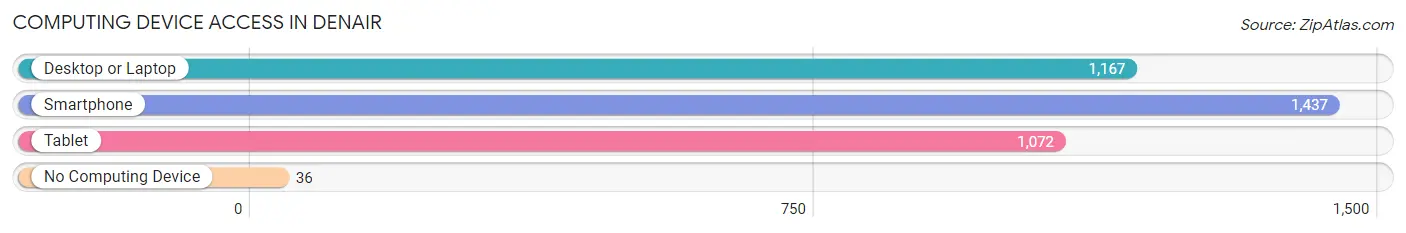
| Device Type | # Households | % Households |
| Desktop or Laptop | 1,167 | 75.2% |
| Smartphone | 1,437 | 92.6% |
| Tablet | 1,072 | 69.1% |
| No Computing Device | 36 | 2.3% |
| Total | 1,551 | 100.0% |
Internet Access in Denair
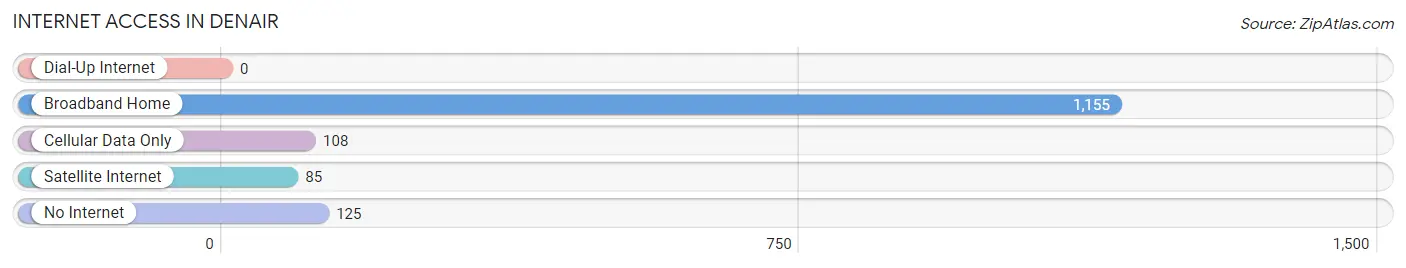
| Internet Type | # Households | % Households |
| Dial-Up Internet | 0 | 0.0% |
| Broadband Home | 1,155 | 74.5% |
| Cellular Data Only | 108 | 7.0% |
| Satellite Internet | 85 | 5.5% |
| No Internet | 125 | 8.1% |
| Total | 1,551 | 100.0% |
Denair Summary
Denair is a small town located in Stanislaus County, California, United States. It is situated in the San Joaquin Valley, approximately 8 miles south of Turlock and 8 miles north of Modesto. The population was 2,416 at the 2010 census, up from 1,522 at the 2000 census.
History
The area that is now Denair was originally inhabited by the Yokut Indians. The first European settlers arrived in the area in the 1850s, and the town was founded in 1871. It was named after the Denair family, who were among the first settlers.
The town was initially a farming community, and the main crops grown were wheat, barley, and oats. In the early 1900s, the town began to grow as the railroad came through and the population increased. The town was incorporated in 1913.
In the 1950s, the town began to experience a population boom as the Central Valley experienced a population surge. This growth was fueled by the construction of the nearby Modesto Dam, which provided irrigation water for the area.
Geography
Denair is located at 37°33'25" North, 120°54'45" West (37.556944, -120.9125). It is situated in the San Joaquin Valley, approximately 8 miles south of Turlock and 8 miles north of Modesto.
The town has a total area of 1.2 square miles, all of which is land. The elevation is approximately 118 feet above sea level.
Economy
The economy of Denair is largely based on agriculture. The main crops grown in the area are almonds, walnuts, grapes, and other fruits and vegetables. The town is also home to several small businesses, including a grocery store, a hardware store, and a few restaurants.
Demographics
As of the 2010 census, there were 2,416 people, 817 households, and 602 families residing in the town. The population density was 2,006.7 people per square mile. The racial makeup of the town was 68.2% White, 0.7% African American, 1.2% Native American, 0.7% Asian, 0.1% Pacific Islander, 25.2% from other races, and 3.9% from two or more races. Hispanic or Latino of any race were 44.2% of the population.
The median income for a household in the town was $45,938, and the median income for a family was $50,938. The per capita income for the town was $18,938. About 16.2% of families and 19.2% of the population were below the poverty line, including 25.2% of those under age 18 and 8.2% of those age 65 or over.
Common Questions
What is Per Capita Income in Denair?
Per Capita income in Denair is $36,710.
What is the Median Family Income in Denair?
Median Family Income in Denair is $94,402.
What is the Median Household income in Denair?
Median Household Income in Denair is $92,234.
What is Income or Wage Gap in Denair?
Income or Wage Gap in Denair is 24.7%.
Women in Denair earn 75.3 cents for every dollar earned by a man.
What is Inequality or Gini Index in Denair?
Inequality or Gini Index in Denair is 0.39.
What is the Total Population of Denair?
Total Population of Denair is 4,289.
What is the Total Male Population of Denair?
Total Male Population of Denair is 1,874.
What is the Total Female Population of Denair?
Total Female Population of Denair is 2,415.
What is the Ratio of Males per 100 Females in Denair?
There are 77.60 Males per 100 Females in Denair.
What is the Ratio of Females per 100 Males in Denair?
There are 128.87 Females per 100 Males in Denair.
What is the Median Population Age in Denair?
Median Population Age in Denair is 40.9 Years.
What is the Average Family Size in Denair
Average Family Size in Denair is 3.3 People.
What is the Average Household Size in Denair
Average Household Size in Denair is 2.8 People.
How Large is the Labor Force in Denair?
There are 2,223 People in the Labor Forcein in Denair.
What is the Percentage of People in the Labor Force in Denair?
64.7% of People are in the Labor Force in Denair.
What is the Unemployment Rate in Denair?
Unemployment Rate in Denair is 8.5%.