Freedom, CA Map & Demographics
Freedom Map
Freedom Overview
$37,348
PER CAPITA INCOME
$116,087
AVG FAMILY INCOME
$123,224
AVG HOUSEHOLD INCOME
32.8%
WAGE / INCOME GAP [ % ]
67.2¢/ $1
WAGE / INCOME GAP [ $ ]
0.35
INEQUALITY / GINI INDEX
3,360
TOTAL POPULATION
1,791
MALE POPULATION
1,569
FEMALE POPULATION
114.15
MALES / 100 FEMALES
87.60
FEMALES / 100 MALES
34.3
MEDIAN AGE
3.8
AVG FAMILY SIZE
3.6
AVG HOUSEHOLD SIZE
1,758
LABOR FORCE [ PEOPLE ]
72.0%
PERCENT IN LABOR FORCE
9.8%
UNEMPLOYMENT RATE
Freedom Zip Codes
Freedom Area Codes
Income in Freedom
Income Overview in Freedom
Per Capita Income in Freedom is $37,348, while median incomes of families and households are $116,087 and $123,224 respectively.
| Characteristic | Number | Measure |
| Per Capita Income | 3,360 | $37,348 |
| Median Family Income | 720 | $116,087 |
| Mean Family Income | 720 | $132,154 |
| Median Household Income | 921 | $123,224 |
| Mean Household Income | 921 | $138,824 |
| Income Deficit | 720 | $0 |
| Wage / Income Gap (%) | 3,360 | 32.82% |
| Wage / Income Gap ($) | 3,360 | 67.18¢ per $1 |
| Gini / Inequality Index | 3,360 | 0.35 |
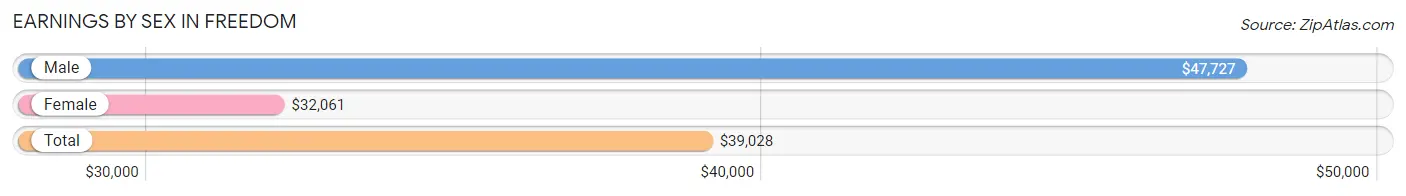
Earnings by Sex in Freedom
Average Earnings in Freedom are $39,028, $47,727 for men and $32,061 for women, a difference of 32.8%.
| Sex | Number | Average Earnings |
| Male | 894 (48.7%) | $47,727 |
| Female | 940 (51.2%) | $32,061 |
| Total | 1,834 (100.0%) | $39,028 |
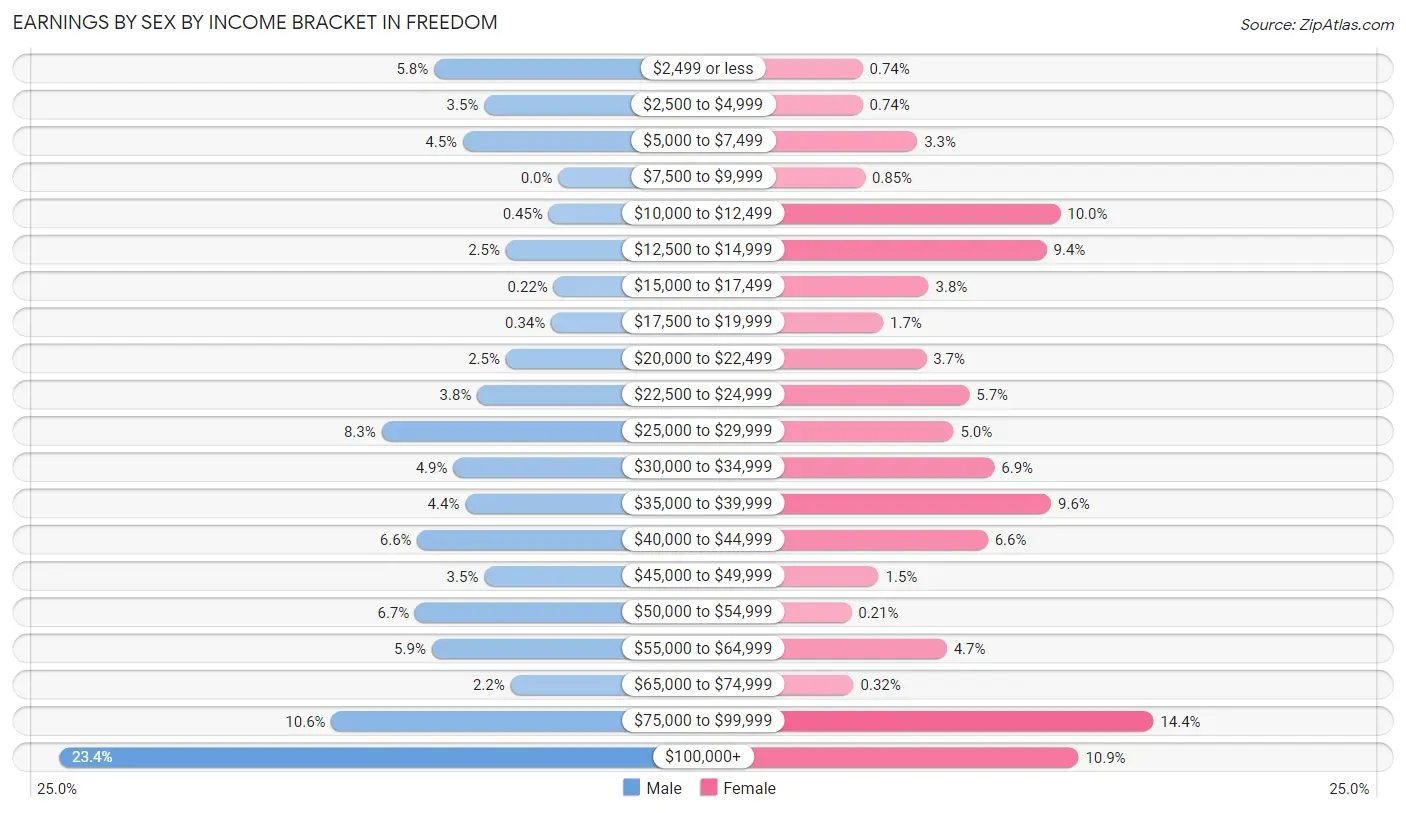
Earnings by Sex by Income Bracket in Freedom
The most common earnings brackets in Freedom are $100,000+ for men (209 | 23.4%) and $75,000 to $99,999 for women (135 | 14.4%).
| Income | Male | Female |
| $2,499 or less | 52 (5.8%) | 7 (0.7%) |
| $2,500 to $4,999 | 31 (3.5%) | 7 (0.7%) |
| $5,000 to $7,499 | 40 (4.5%) | 31 (3.3%) |
| $7,500 to $9,999 | 0 (0.0%) | 8 (0.9%) |
| $10,000 to $12,499 | 4 (0.4%) | 94 (10.0%) |
| $12,500 to $14,999 | 22 (2.5%) | 88 (9.4%) |
| $15,000 to $17,499 | 2 (0.2%) | 36 (3.8%) |
| $17,500 to $19,999 | 3 (0.3%) | 16 (1.7%) |
| $20,000 to $22,499 | 22 (2.5%) | 35 (3.7%) |
| $22,500 to $24,999 | 34 (3.8%) | 54 (5.7%) |
| $25,000 to $29,999 | 74 (8.3%) | 47 (5.0%) |
| $30,000 to $34,999 | 44 (4.9%) | 65 (6.9%) |
| $35,000 to $39,999 | 39 (4.4%) | 90 (9.6%) |
| $40,000 to $44,999 | 59 (6.6%) | 62 (6.6%) |
| $45,000 to $49,999 | 31 (3.5%) | 14 (1.5%) |
| $50,000 to $54,999 | 60 (6.7%) | 2 (0.2%) |
| $55,000 to $64,999 | 53 (5.9%) | 44 (4.7%) |
| $65,000 to $74,999 | 20 (2.2%) | 3 (0.3%) |
| $75,000 to $99,999 | 95 (10.6%) | 135 (14.4%) |
| $100,000+ | 209 (23.4%) | 102 (10.8%) |
| Total | 894 (100.0%) | 940 (100.0%) |
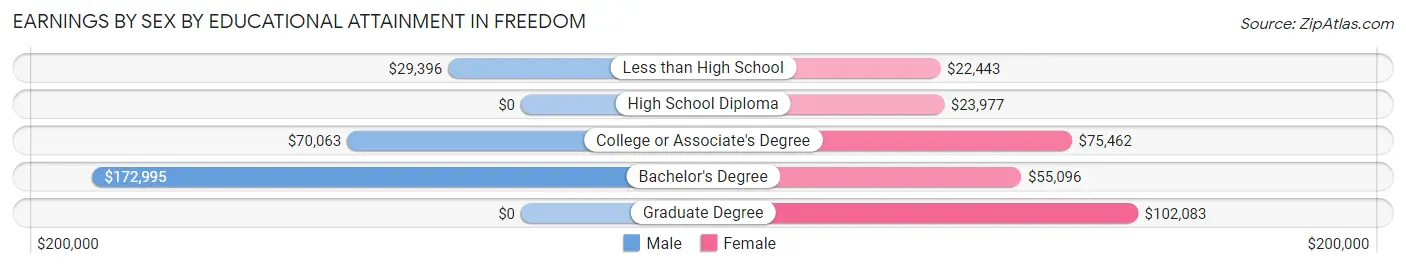
Earnings by Sex by Educational Attainment in Freedom
Average earnings in Freedom are $58,008 for men and $39,809 for women, a difference of 31.4%. Men with an educational attainment of bachelor's degree enjoy the highest average annual earnings of $172,995, while those with less than high school education earn the least with $29,396. Women with an educational attainment of graduate degree earn the most with the average annual earnings of $102,083, while those with less than high school education have the smallest earnings of $22,443.
| Educational Attainment | Male Income | Female Income |
| Less than High School | $29,396 | $22,443 |
| High School Diploma | - | - |
| College or Associate's Degree | $70,063 | $75,462 |
| Bachelor's Degree | $172,995 | $55,096 |
| Graduate Degree | - | - |
| Total | $58,008 | $39,809 |
Family Income in Freedom
Family Income Brackets in Freedom
According to the Freedom family income data, there are 175 families falling into the $150,000 to $199,999 income range, which is the most common income bracket and makes up 24.3% of all families.
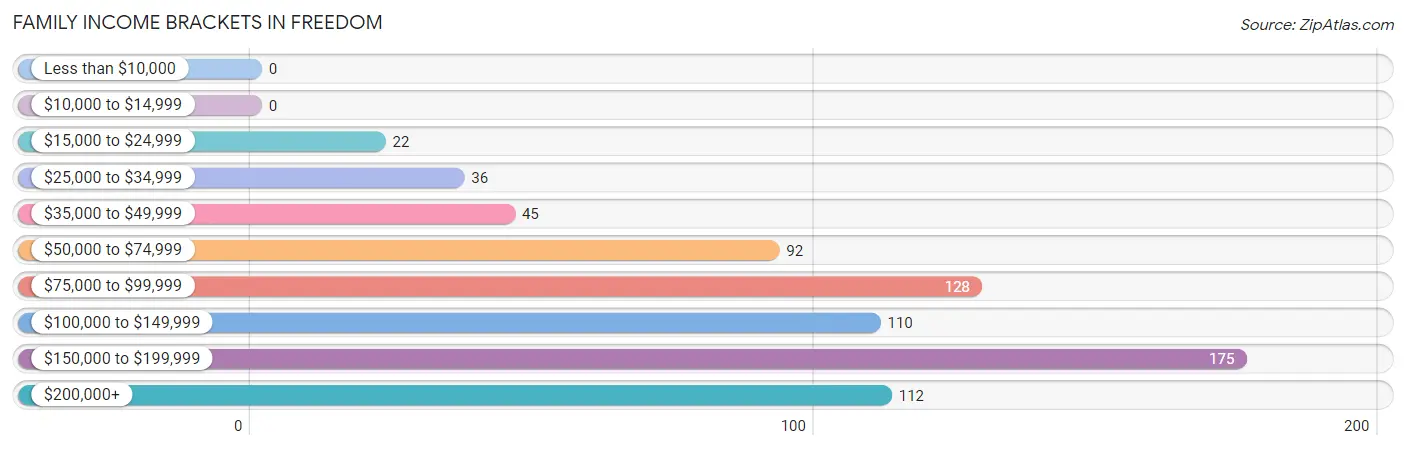
| Income Bracket | # Families | % Families |
| Less than $10,000 | 0 | 0.0% |
| $10,000 to $14,999 | 0 | 0.0% |
| $15,000 to $24,999 | 22 | 3.1% |
| $25,000 to $34,999 | 36 | 5.0% |
| $35,000 to $49,999 | 45 | 6.3% |
| $50,000 to $74,999 | 92 | 12.8% |
| $75,000 to $99,999 | 128 | 17.8% |
| $100,000 to $149,999 | 110 | 15.3% |
| $150,000 to $199,999 | 175 | 24.3% |
| $200,000+ | 112 | 15.6% |
Family Income by Famaliy Size in Freedom
7+ person families (67 | 9.3%) account for the highest median family income in Freedom with $190,750 per family, while 2-person families (198 | 27.5%) have the highest median income of $76,562 per family member.
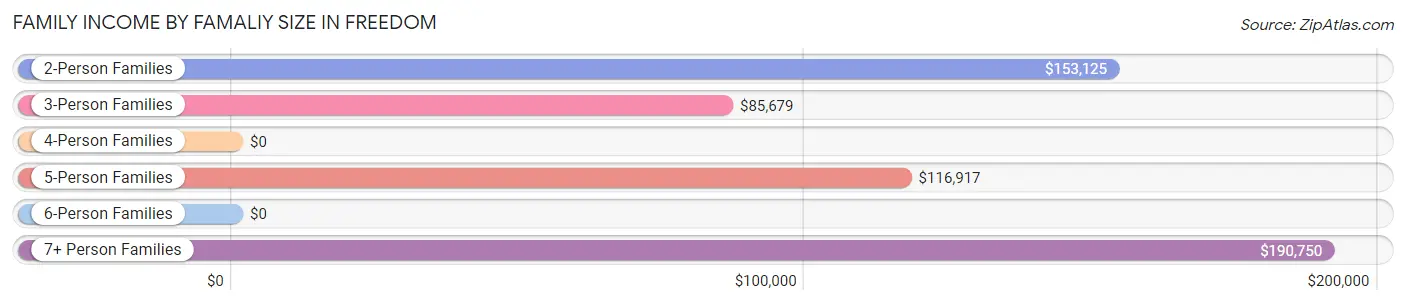
| Income Bracket | # Families | Median Income |
| 2-Person Families | 198 (27.5%) | $153,125 |
| 3-Person Families | 254 (35.3%) | $85,679 |
| 4-Person Families | 69 (9.6%) | $0 |
| 5-Person Families | 45 (6.2%) | $116,917 |
| 6-Person Families | 87 (12.1%) | $0 |
| 7+ Person Families | 67 (9.3%) | $190,750 |
| Total | 720 (100.0%) | $116,087 |
Family Income by Number of Earners in Freedom
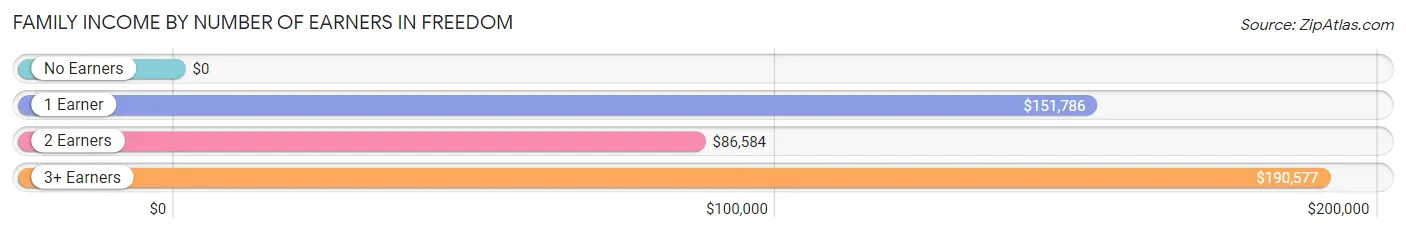
| Number of Earners | # Families | Median Income |
| No Earners | 29 (4.0%) | $0 |
| 1 Earner | 204 (28.3%) | $151,786 |
| 2 Earners | 337 (46.8%) | $86,584 |
| 3+ Earners | 150 (20.8%) | $190,577 |
| Total | 720 (100.0%) | $116,087 |
Household Income in Freedom
Household Income Brackets in Freedom
With 206 households falling in the category, the $200,000+ income range is the most frequent in Freedom, accounting for 22.4% of all households. In contrast, only 8 households (0.9%) fall into the $10,000 to $14,999 income bracket, making it the least populous group.
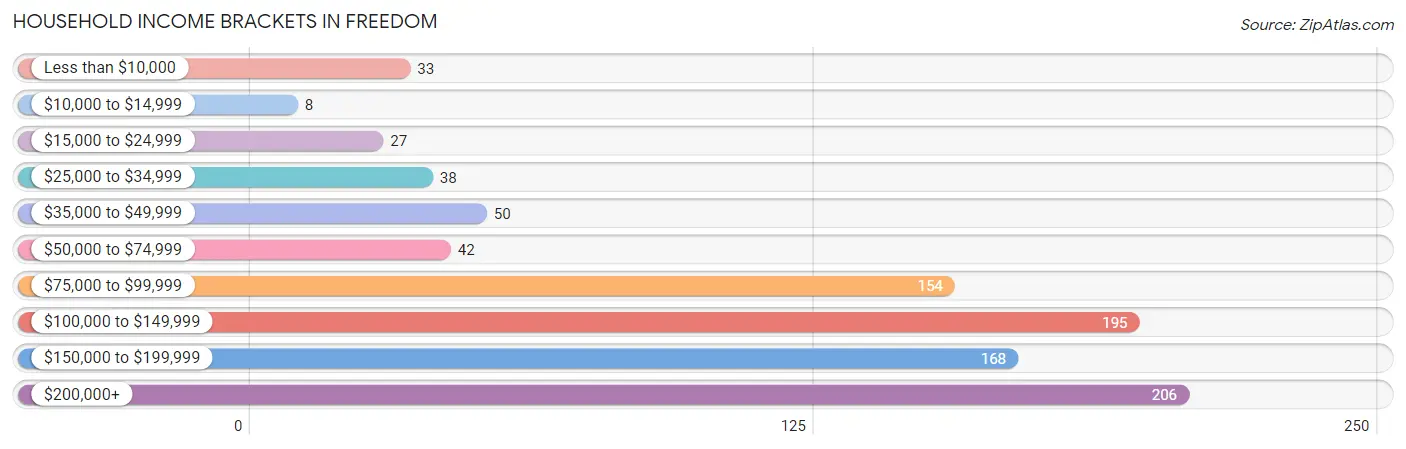
| Income Bracket | # Households | % Households |
| Less than $10,000 | 33 | 3.6% |
| $10,000 to $14,999 | 8 | 0.9% |
| $15,000 to $24,999 | 27 | 2.9% |
| $25,000 to $34,999 | 38 | 4.1% |
| $35,000 to $49,999 | 50 | 5.4% |
| $50,000 to $74,999 | 42 | 4.6% |
| $75,000 to $99,999 | 154 | 16.7% |
| $100,000 to $149,999 | 195 | 21.2% |
| $150,000 to $199,999 | 168 | 18.2% |
| $200,000+ | 206 | 22.4% |
Household Income by Householder Age in Freedom
The median household income in Freedom is $123,224, with the highest median household income of $138,352 found in the 25 to 44 years age bracket for the primary householder. A total of 303 households (32.9%) fall into this category. Meanwhile, the 15 to 24 years age bracket for the primary householder has the lowest median household income of $0, with 18 households (1.9%) in this group.
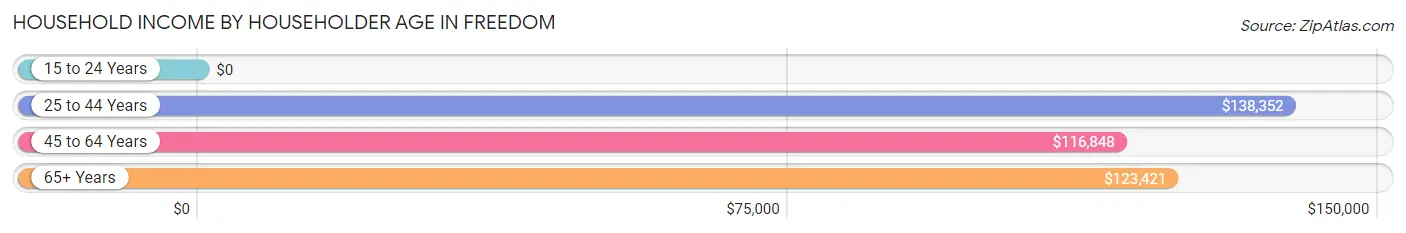
| Income Bracket | # Households | Median Income |
| 15 to 24 Years | 18 (1.9%) | $0 |
| 25 to 44 Years | 303 (32.9%) | $138,352 |
| 45 to 64 Years | 402 (43.6%) | $116,848 |
| 65+ Years | 198 (21.5%) | $123,421 |
| Total | 921 (100.0%) | $123,224 |
Poverty in Freedom
Income Below Poverty by Sex and Age in Freedom
With 7.7% poverty level for males and 6.2% for females among the residents of Freedom, 15 year old males and 15 year old females are the most vulnerable to poverty, with 11 males (100.0%) and 12 females (37.5%) in their respective age groups living below the poverty level.
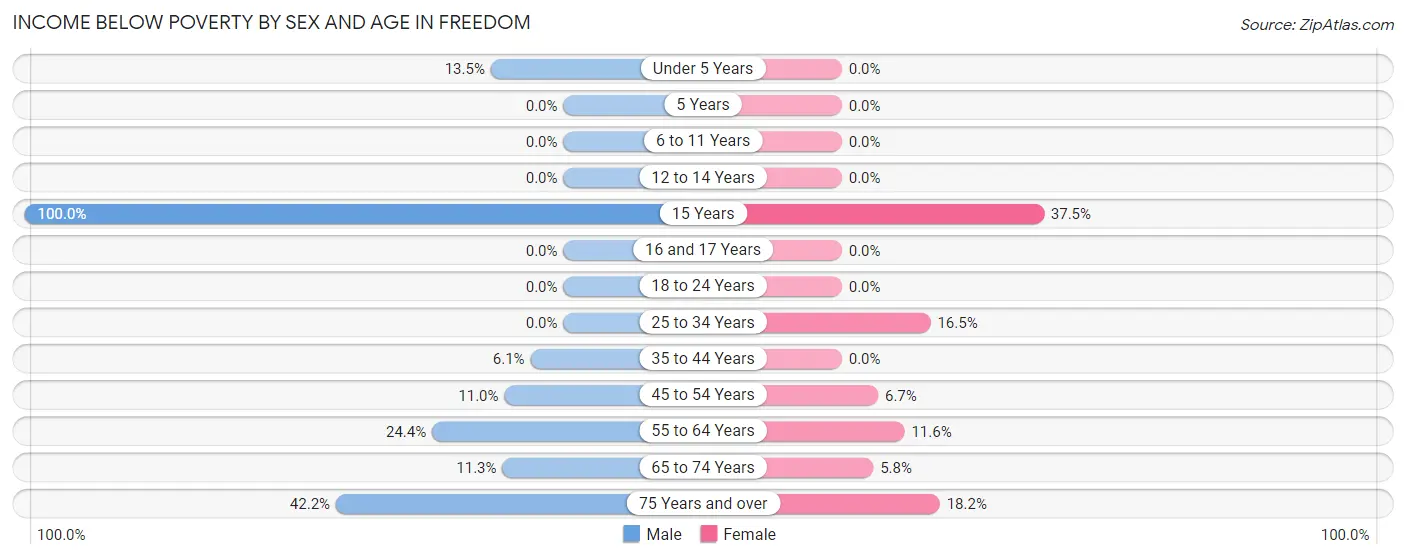
| Age Bracket | Male | Female |
| Under 5 Years | 12 (13.5%) | 0 (0.0%) |
| 5 Years | 0 (0.0%) | 0 (0.0%) |
| 6 to 11 Years | 0 (0.0%) | 0 (0.0%) |
| 12 to 14 Years | 0 (0.0%) | 0 (0.0%) |
| 15 Years | 11 (100.0%) | 12 (37.5%) |
| 16 and 17 Years | 0 (0.0%) | 0 (0.0%) |
| 18 to 24 Years | 0 (0.0%) | 0 (0.0%) |
| 25 to 34 Years | 0 (0.0%) | 40 (16.5%) |
| 35 to 44 Years | 19 (6.1%) | 0 (0.0%) |
| 45 to 54 Years | 23 (11.0%) | 14 (6.7%) |
| 55 to 64 Years | 29 (24.4%) | 17 (11.6%) |
| 65 to 74 Years | 24 (11.3%) | 7 (5.8%) |
| 75 Years and over | 19 (42.2%) | 6 (18.2%) |
| Total | 137 (7.7%) | 96 (6.2%) |
Income Above Poverty by Sex and Age in Freedom
According to the poverty statistics in Freedom, males aged 5 years and females aged under 5 years are the age groups that are most secure financially, with 100.0% of males and 100.0% of females in these age groups living above the poverty line.
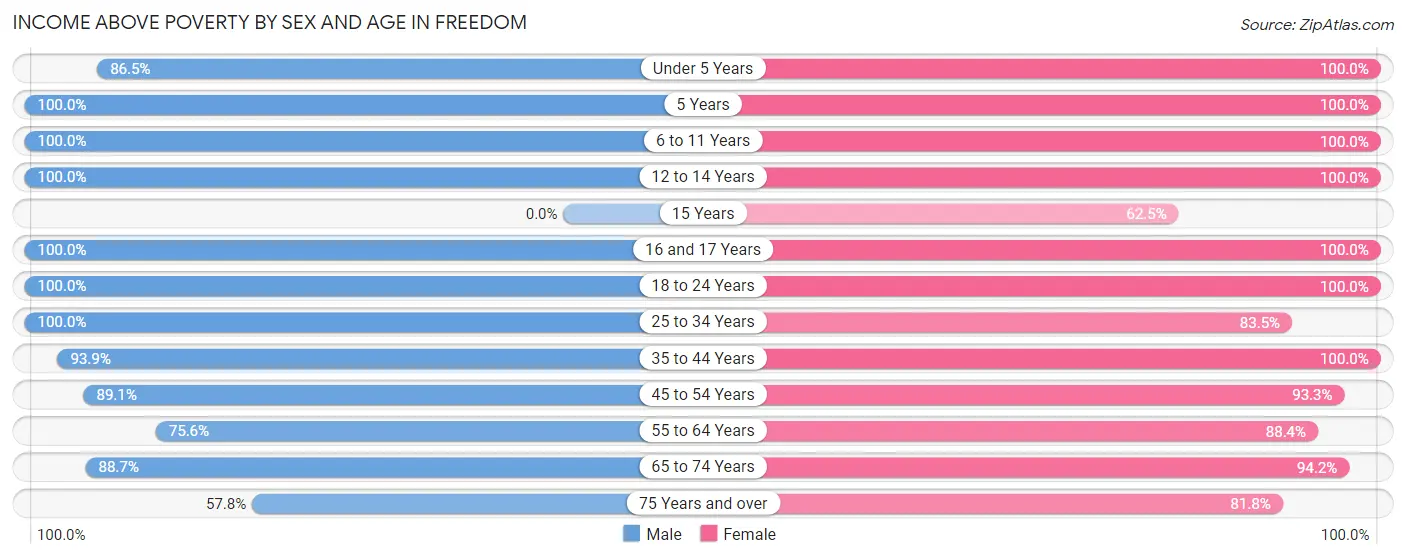
| Age Bracket | Male | Female |
| Under 5 Years | 77 (86.5%) | 91 (100.0%) |
| 5 Years | 21 (100.0%) | 8 (100.0%) |
| 6 to 11 Years | 287 (100.0%) | 83 (100.0%) |
| 12 to 14 Years | 130 (100.0%) | 122 (100.0%) |
| 15 Years | 0 (0.0%) | 20 (62.5%) |
| 16 and 17 Years | 96 (100.0%) | 3 (100.0%) |
| 18 to 24 Years | 172 (100.0%) | 254 (100.0%) |
| 25 to 34 Years | 72 (100.0%) | 203 (83.5%) |
| 35 to 44 Years | 292 (93.9%) | 196 (100.0%) |
| 45 to 54 Years | 187 (89.0%) | 194 (93.3%) |
| 55 to 64 Years | 90 (75.6%) | 129 (88.4%) |
| 65 to 74 Years | 188 (88.7%) | 113 (94.2%) |
| 75 Years and over | 26 (57.8%) | 27 (81.8%) |
| Total | 1,638 (92.3%) | 1,443 (93.8%) |
Income Below Poverty Among Married-Couple Families in Freedom
The poverty statistics for married-couple families in Freedom show that 4.1% or 17 of the total 417 families live below the poverty line. Families with 1 or 2 children have the highest poverty rate of 7.9%, comprising of 17 families. On the other hand, families with no children have the lowest poverty rate of 0.0%, which includes 0 families.
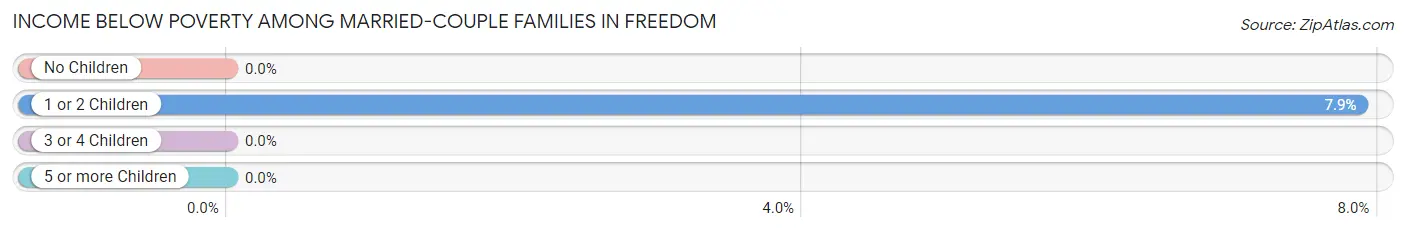
| Children | Above Poverty | Below Poverty |
| No Children | 152 (100.0%) | 0 (0.0%) |
| 1 or 2 Children | 199 (92.1%) | 17 (7.9%) |
| 3 or 4 Children | 47 (100.0%) | 0 (0.0%) |
| 5 or more Children | 2 (100.0%) | 0 (0.0%) |
| Total | 400 (95.9%) | 17 (4.1%) |
Income Below Poverty Among Single-Parent Households in Freedom
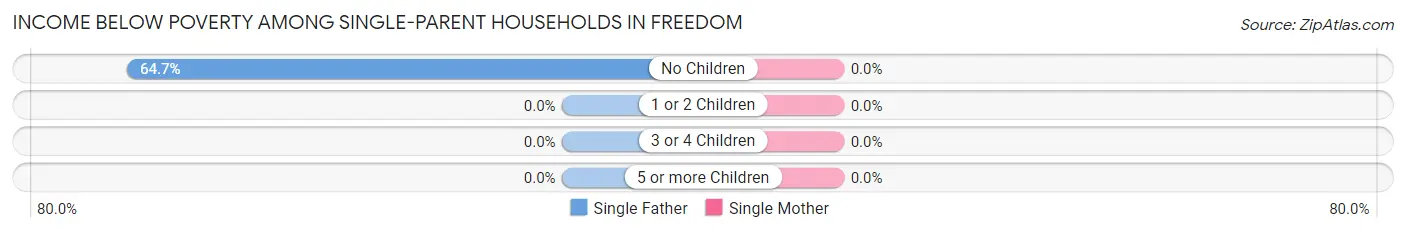
| Children | Single Father | Single Mother |
| No Children | 22 (64.7%) | 0 (0.0%) |
| 1 or 2 Children | 0 (0.0%) | 0 (0.0%) |
| 3 or 4 Children | 0 (0.0%) | 0 (0.0%) |
| 5 or more Children | 0 (0.0%) | 0 (0.0%) |
| Total | 22 (22.9%) | 0 (0.0%) |
Income Below Poverty Among Married-Couple vs Single-Parent Households in Freedom
The poverty data for Freedom shows that 17 of the married-couple family households (4.1%) and 22 of the single-parent households (7.3%) are living below the poverty level. Within the married-couple family households, those with 1 or 2 children have the highest poverty rate, with 17 households (7.9%) falling below the poverty line. Among the single-parent households, those with no children have the highest poverty rate, with 22 household (33.3%) living below poverty.
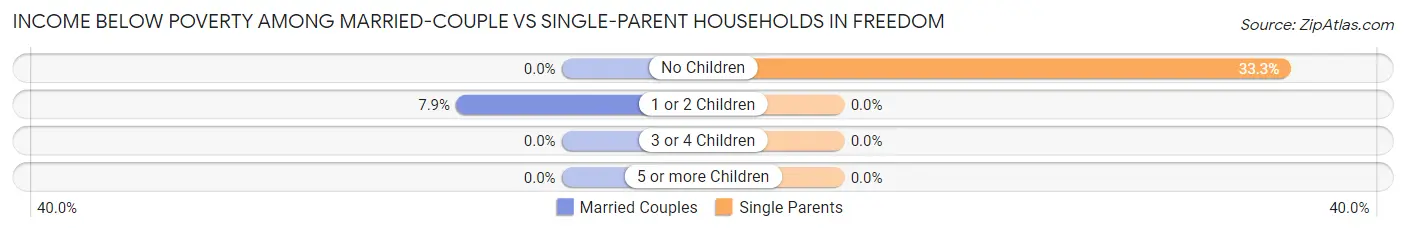
| Children | Married-Couple Families | Single-Parent Households |
| No Children | 0 (0.0%) | 22 (33.3%) |
| 1 or 2 Children | 17 (7.9%) | 0 (0.0%) |
| 3 or 4 Children | 0 (0.0%) | 0 (0.0%) |
| 5 or more Children | 0 (0.0%) | 0 (0.0%) |
| Total | 17 (4.1%) | 22 (7.3%) |
Race in Freedom
The most populous races in Freedom are Hispanic or Latino (2,548 | 75.8%), White / Caucasian (1,448 | 43.1%), and Some other Race (1,203 | 35.8%).
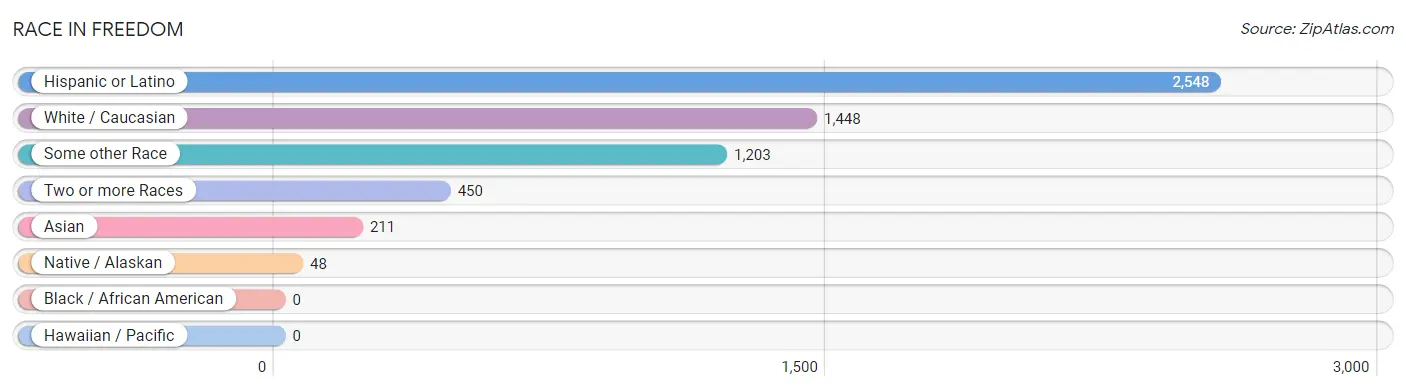
| Race | # Population | % Population |
| Asian | 211 | 6.3% |
| Black / African American | 0 | 0.0% |
| Hawaiian / Pacific | 0 | 0.0% |
| Hispanic or Latino | 2,548 | 75.8% |
| Native / Alaskan | 48 | 1.4% |
| White / Caucasian | 1,448 | 43.1% |
| Two or more Races | 450 | 13.4% |
| Some other Race | 1,203 | 35.8% |
| Total | 3,360 | 100.0% |
Ancestry in Freedom
The most populous ancestries reported in Freedom are Mexican (2,484 | 73.9%), German (179 | 5.3%), Bhutanese (134 | 4.0%), Korean (131 | 3.9%), and English (128 | 3.8%), together accounting for 91.0% of all Freedom residents.
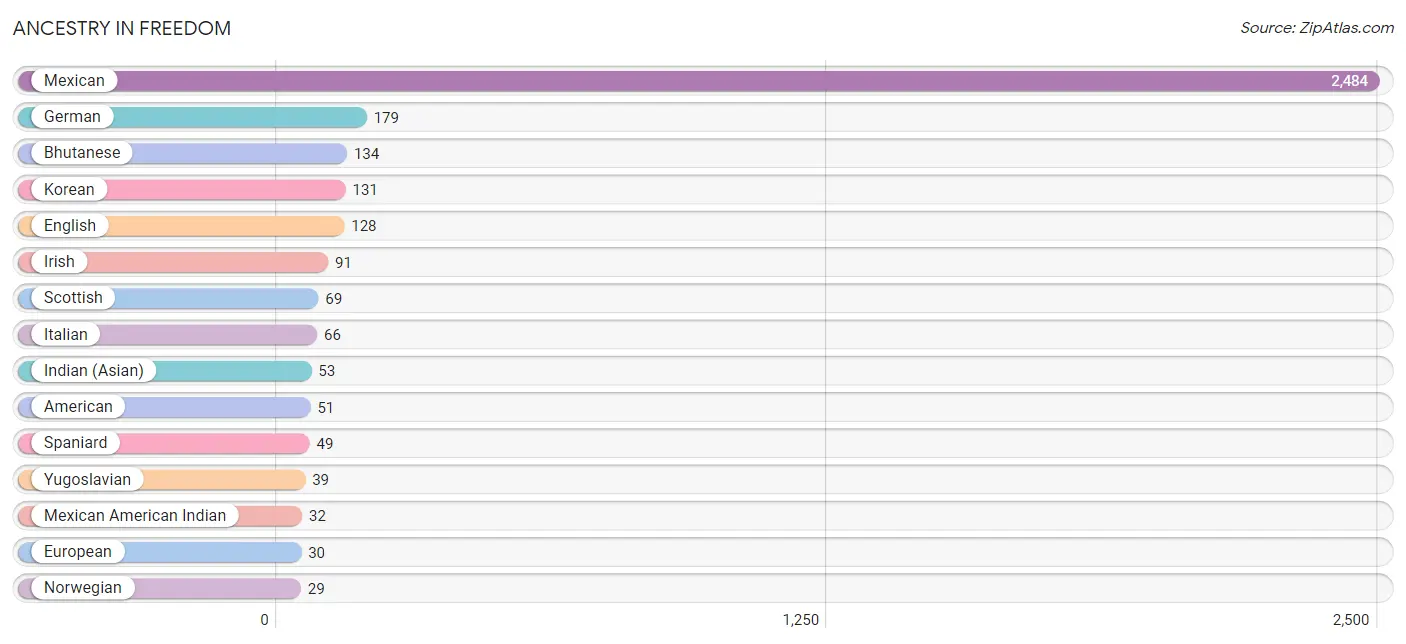
| Ancestry | # Population | % Population |
| American | 51 | 1.5% |
| Arab | 24 | 0.7% |
| Bhutanese | 134 | 4.0% |
| British | 19 | 0.6% |
| Burmese | 5 | 0.2% |
| Croatian | 24 | 0.7% |
| Czech | 14 | 0.4% |
| Danish | 10 | 0.3% |
| Dutch | 19 | 0.6% |
| English | 128 | 3.8% |
| European | 30 | 0.9% |
| French | 22 | 0.6% |
| French Canadian | 7 | 0.2% |
| German | 179 | 5.3% |
| Hungarian | 14 | 0.4% |
| Indian (Asian) | 53 | 1.6% |
| Irish | 91 | 2.7% |
| Italian | 66 | 2.0% |
| Korean | 131 | 3.9% |
| Mexican | 2,484 | 73.9% |
| Mexican American Indian | 32 | 0.9% |
| Northern European | 6 | 0.2% |
| Norwegian | 29 | 0.9% |
| Polish | 4 | 0.1% |
| Portuguese | 15 | 0.4% |
| Russian | 4 | 0.1% |
| Scandinavian | 4 | 0.1% |
| Scotch-Irish | 15 | 0.4% |
| Scottish | 69 | 2.1% |
| Serbian | 7 | 0.2% |
| Spaniard | 49 | 1.5% |
| Spanish | 15 | 0.4% |
| Sri Lankan | 1 | 0.0% |
| Swedish | 6 | 0.2% |
| Syrian | 24 | 0.7% |
| Welsh | 9 | 0.3% |
| Yaqui | 9 | 0.3% |
| Yugoslavian | 39 | 1.2% | View All 38 Rows |
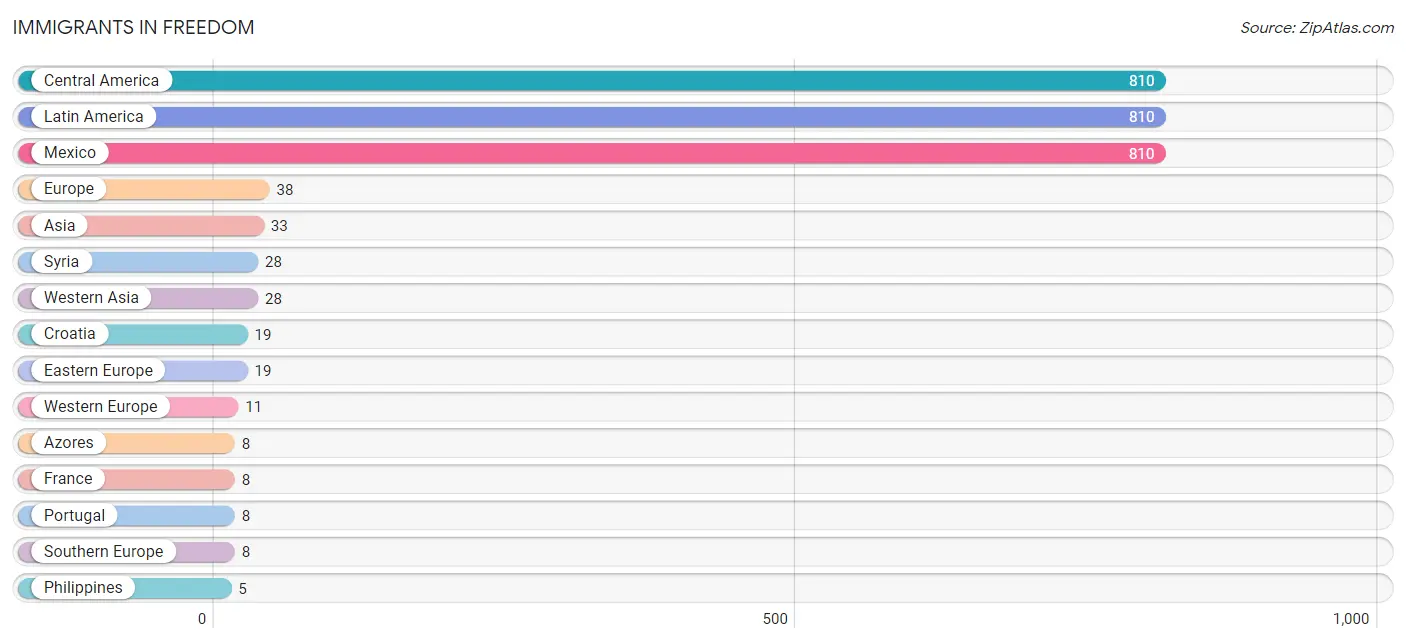
Immigrants in Freedom
The most numerous immigrant groups reported in Freedom came from Central America (810 | 24.1%), Latin America (810 | 24.1%), Mexico (810 | 24.1%), Europe (38 | 1.1%), and Asia (33 | 1.0%), together accounting for 74.4% of all Freedom residents.
| Immigration Origin | # Population | % Population |
| Asia | 33 | 1.0% |
| Azores | 8 | 0.2% |
| Central America | 810 | 24.1% |
| Croatia | 19 | 0.6% |
| Eastern Europe | 19 | 0.6% |
| Europe | 38 | 1.1% |
| France | 8 | 0.2% |
| Germany | 3 | 0.1% |
| Latin America | 810 | 24.1% |
| Mexico | 810 | 24.1% |
| Philippines | 5 | 0.2% |
| Portugal | 8 | 0.2% |
| South Eastern Asia | 5 | 0.2% |
| Southern Europe | 8 | 0.2% |
| Syria | 28 | 0.8% |
| Western Asia | 28 | 0.8% |
| Western Europe | 11 | 0.3% | View All 17 Rows |
Sex and Age in Freedom
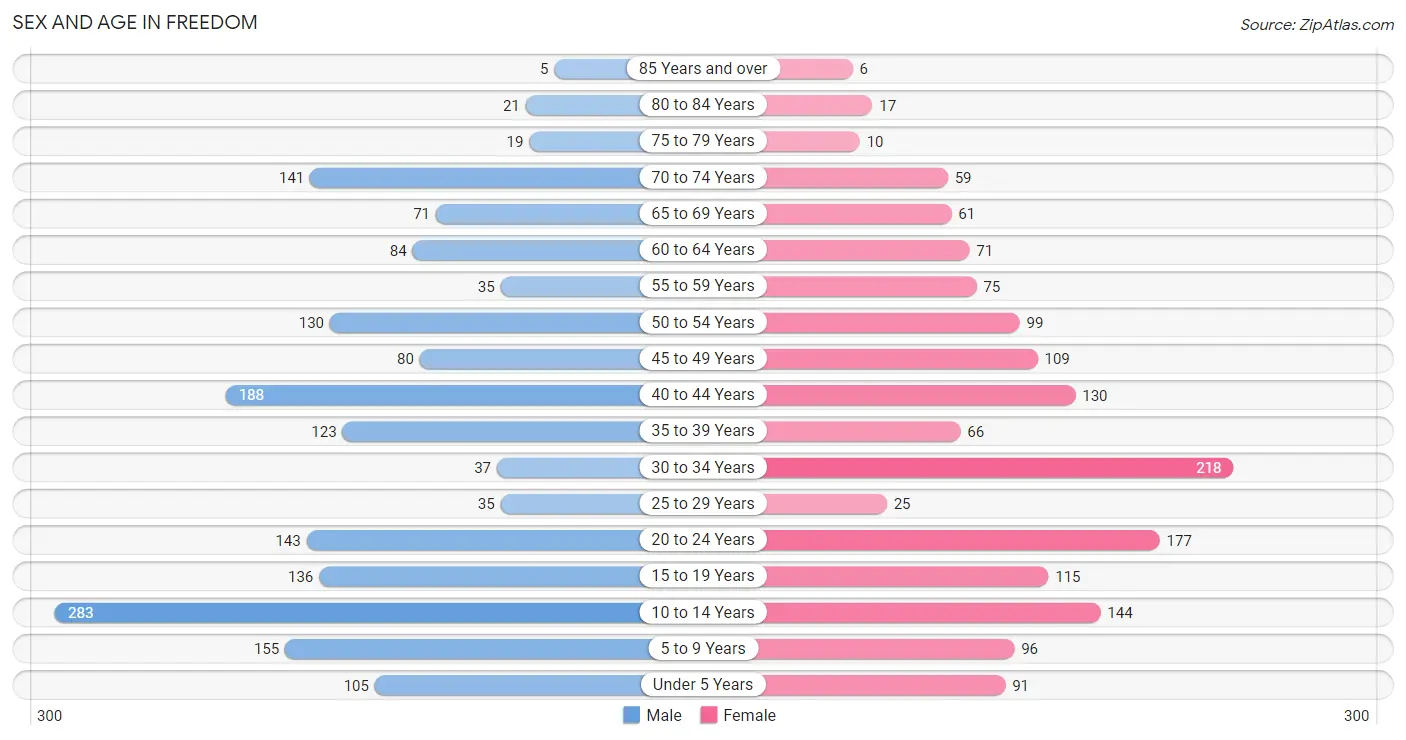
Sex and Age in Freedom
The most populous age groups in Freedom are 10 to 14 Years (283 | 15.8%) for men and 30 to 34 Years (218 | 13.9%) for women.
| Age Bracket | Male | Female |
| Under 5 Years | 105 (5.9%) | 91 (5.8%) |
| 5 to 9 Years | 155 (8.6%) | 96 (6.1%) |
| 10 to 14 Years | 283 (15.8%) | 144 (9.2%) |
| 15 to 19 Years | 136 (7.6%) | 115 (7.3%) |
| 20 to 24 Years | 143 (8.0%) | 177 (11.3%) |
| 25 to 29 Years | 35 (1.9%) | 25 (1.6%) |
| 30 to 34 Years | 37 (2.1%) | 218 (13.9%) |
| 35 to 39 Years | 123 (6.9%) | 66 (4.2%) |
| 40 to 44 Years | 188 (10.5%) | 130 (8.3%) |
| 45 to 49 Years | 80 (4.5%) | 109 (7.0%) |
| 50 to 54 Years | 130 (7.3%) | 99 (6.3%) |
| 55 to 59 Years | 35 (1.9%) | 75 (4.8%) |
| 60 to 64 Years | 84 (4.7%) | 71 (4.5%) |
| 65 to 69 Years | 71 (4.0%) | 61 (3.9%) |
| 70 to 74 Years | 141 (7.9%) | 59 (3.8%) |
| 75 to 79 Years | 19 (1.1%) | 10 (0.6%) |
| 80 to 84 Years | 21 (1.2%) | 17 (1.1%) |
| 85 Years and over | 5 (0.3%) | 6 (0.4%) |
| Total | 1,791 (100.0%) | 1,569 (100.0%) |
Families and Households in Freedom
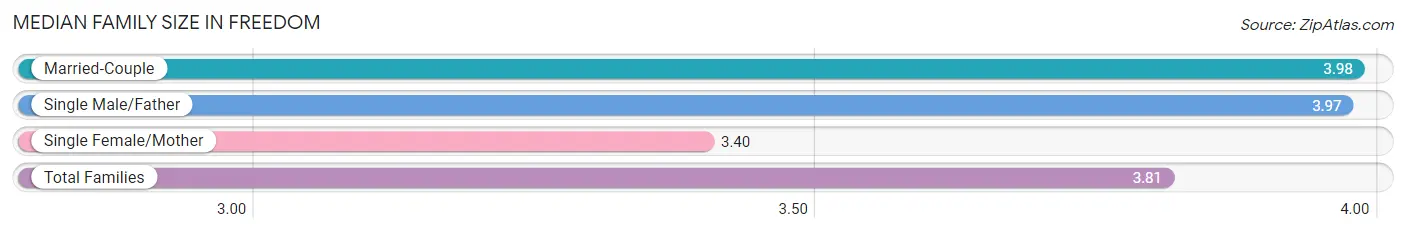
Median Family Size in Freedom
The median family size in Freedom is 3.81 persons per family, with married-couple families (417 | 57.9%) accounting for the largest median family size of 3.98 persons per family. On the other hand, single female/mother families (207 | 28.7%) represent the smallest median family size with 3.40 persons per family.
| Family Type | # Families | Family Size |
| Married-Couple | 417 (57.9%) | 3.98 |
| Single Male/Father | 96 (13.3%) | 3.97 |
| Single Female/Mother | 207 (28.7%) | 3.40 |
| Total Families | 720 (100.0%) | 3.81 |
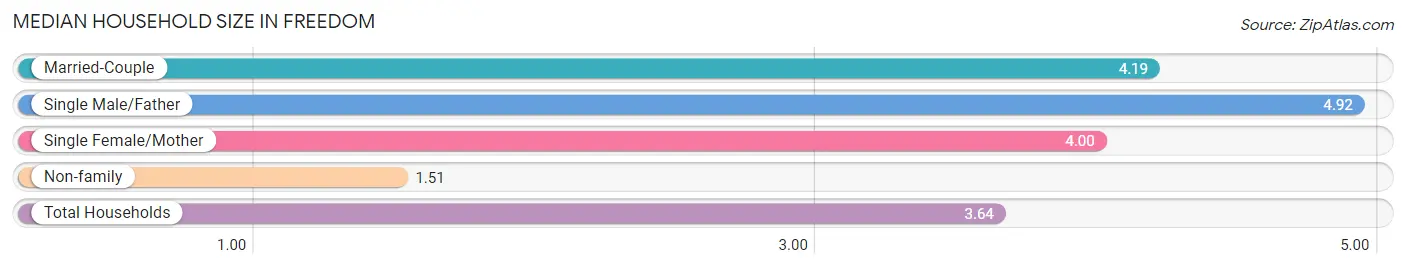
Median Household Size in Freedom
The median household size in Freedom is 3.64 persons per household, with single male/father households (96 | 10.4%) accounting for the largest median household size of 4.92 persons per household. non-family households (201 | 21.8%) represent the smallest median household size with 1.51 persons per household.
| Household Type | # Households | Household Size |
| Married-Couple | 417 (45.3%) | 4.19 |
| Single Male/Father | 96 (10.4%) | 4.92 |
| Single Female/Mother | 207 (22.5%) | 4.00 |
| Non-family | 201 (21.8%) | 1.51 |
| Total Households | 921 (100.0%) | 3.64 |
Household Size by Marriage Status in Freedom
Out of a total of 921 households in Freedom, 720 (78.2%) are family households, while 201 (21.8%) are nonfamily households. The most numerous type of family households are 3-person households, comprising 171, and the most common type of nonfamily households are 1-person households, comprising 153.
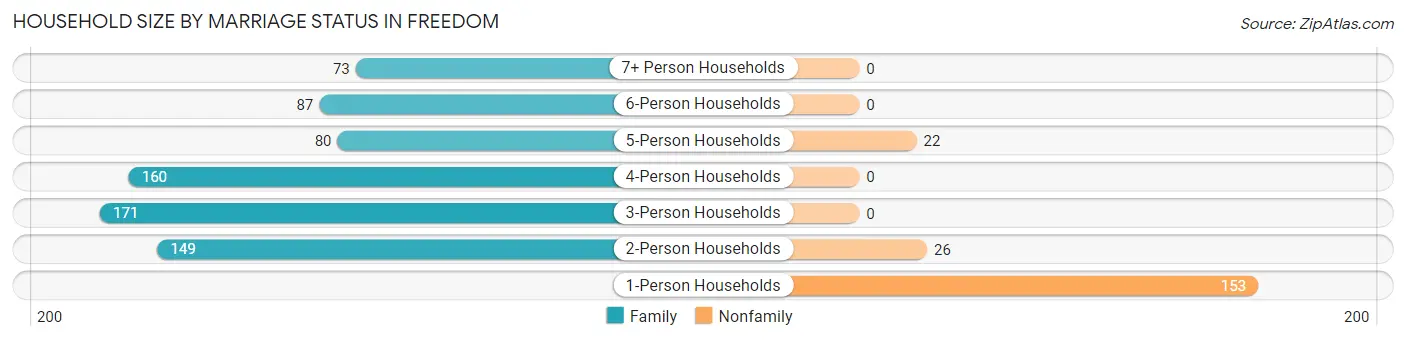
| Household Size | Family Households | Nonfamily Households |
| 1-Person Households | - | 153 (16.6%) |
| 2-Person Households | 149 (16.2%) | 26 (2.8%) |
| 3-Person Households | 171 (18.6%) | 0 (0.0%) |
| 4-Person Households | 160 (17.4%) | 0 (0.0%) |
| 5-Person Households | 80 (8.7%) | 22 (2.4%) |
| 6-Person Households | 87 (9.5%) | 0 (0.0%) |
| 7+ Person Households | 73 (7.9%) | 0 (0.0%) |
| Total | 720 (78.2%) | 201 (21.8%) |
Female Fertility in Freedom
Fertility by Age in Freedom
Average fertility rate in Freedom is 51.0 births per 1,000 women. Women in the age bracket of 15 to 19 years have the highest fertility rate with 157.0 births per 1,000 women. Women in the age bracket of 15 to 19 years acount for 40.9% of all women with births.
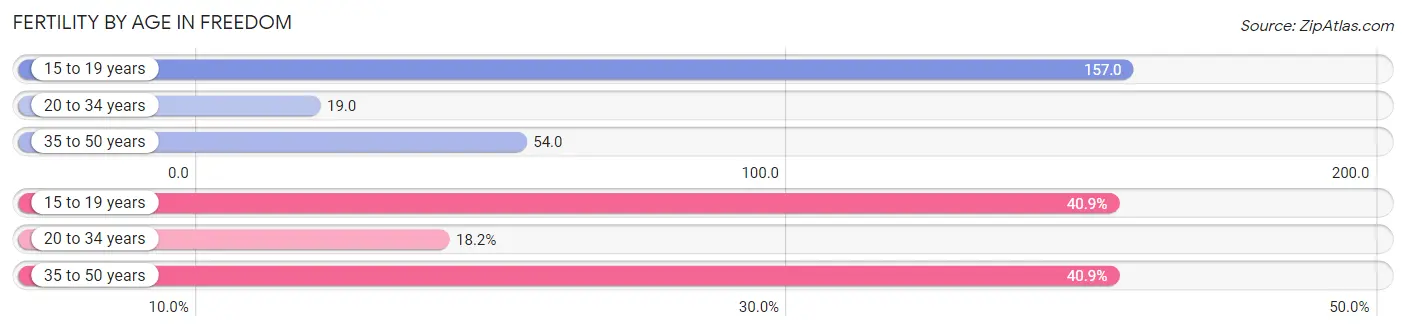
| Age Bracket | Women with Births | Births / 1,000 Women |
| 15 to 19 years | 18 (40.9%) | 157.0 |
| 20 to 34 years | 8 (18.2%) | 19.0 |
| 35 to 50 years | 18 (40.9%) | 54.0 |
| Total | 44 (100.0%) | 51.0 |
Fertility by Age by Marriage Status in Freedom
47.7% of women with births (44) in Freedom are married. The highest percentage of unmarried women with births falls into 15 to 19 years age bracket with 100.0% of them unmarried at the time of birth, while the lowest percentage of unmarried women with births belong to 20 to 34 years age bracket with 0.0% of them unmarried.
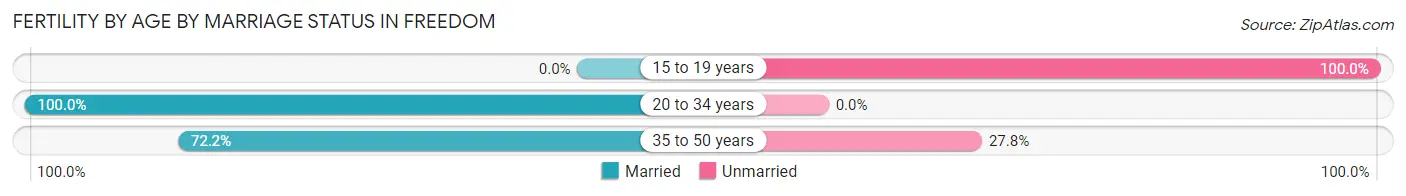
| Age Bracket | Married | Unmarried |
| 15 to 19 years | 0 (0.0%) | 18 (100.0%) |
| 20 to 34 years | 8 (100.0%) | 0 (0.0%) |
| 35 to 50 years | 13 (72.2%) | 5 (27.8%) |
| Total | 21 (47.7%) | 23 (52.3%) |
Fertility by Education in Freedom
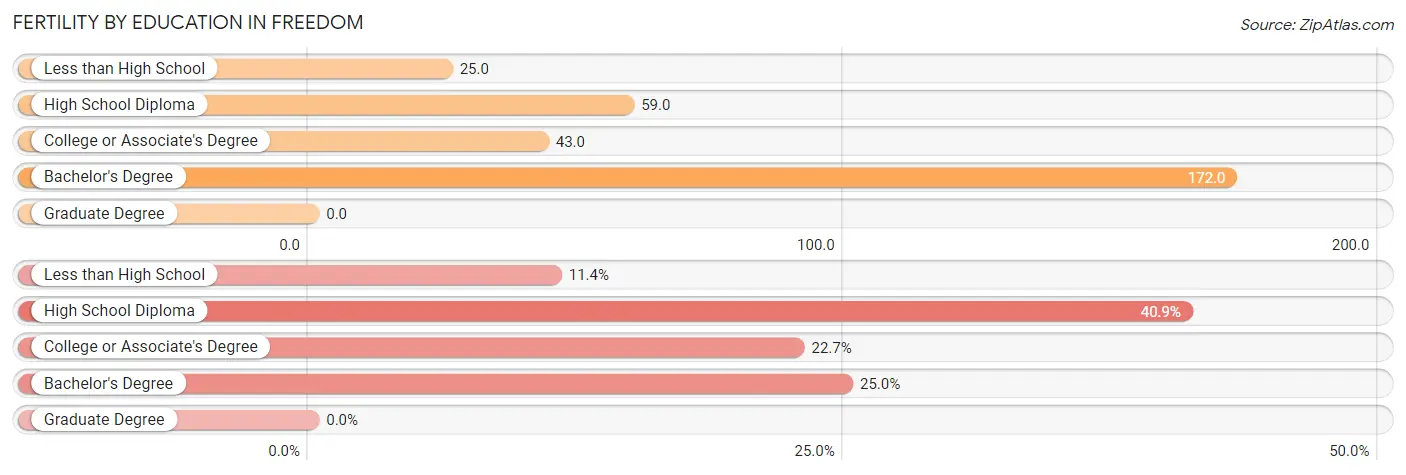
| Educational Attainment | Women with Births | Births / 1,000 Women |
| Less than High School | 5 (11.4%) | 25.0 |
| High School Diploma | 18 (40.9%) | 59.0 |
| College or Associate's Degree | 10 (22.7%) | 43.0 |
| Bachelor's Degree | 11 (25.0%) | 172.0 |
| Graduate Degree | 0 (0.0%) | 0.0 |
| Total | 44 (100.0%) | 51.0 |
Fertility by Education by Marriage Status in Freedom
52.3% of women with births in Freedom are unmarried. Women with the educational attainment of college or associate's degree are most likely to be married with 100.0% of them married at childbirth, while women with the educational attainment of less than high school are least likely to be married with 100.0% of them unmarried at childbirth.
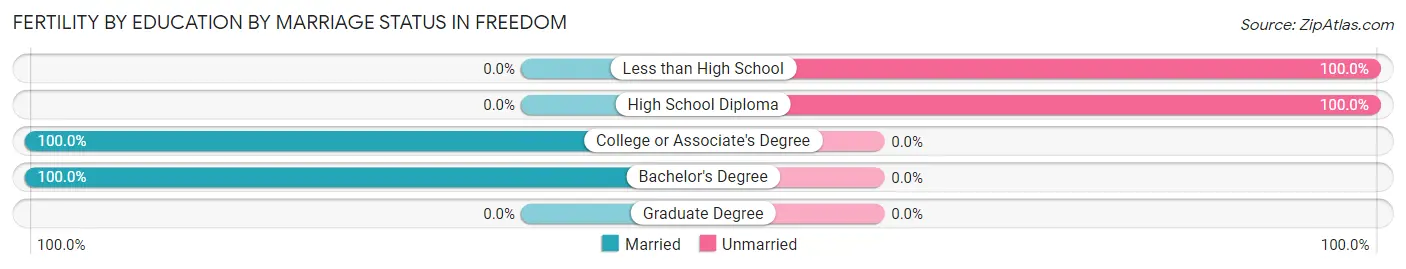
| Educational Attainment | Married | Unmarried |
| Less than High School | 0 (0.0%) | 5 (100.0%) |
| High School Diploma | 0 (0.0%) | 18 (100.0%) |
| College or Associate's Degree | 10 (100.0%) | 0 (0.0%) |
| Bachelor's Degree | 11 (100.0%) | 0 (0.0%) |
| Graduate Degree | 0 (0.0%) | 0 (0.0%) |
| Total | 21 (47.7%) | 23 (52.3%) |
Employment Characteristics in Freedom
Employment by Class of Employer in Freedom
Among the 1,567 employed individuals in Freedom, private company employees (890 | 56.8%), local government employees (227 | 14.5%), and not-for-profit organizations (161 | 10.3%) make up the most common classes of employment.
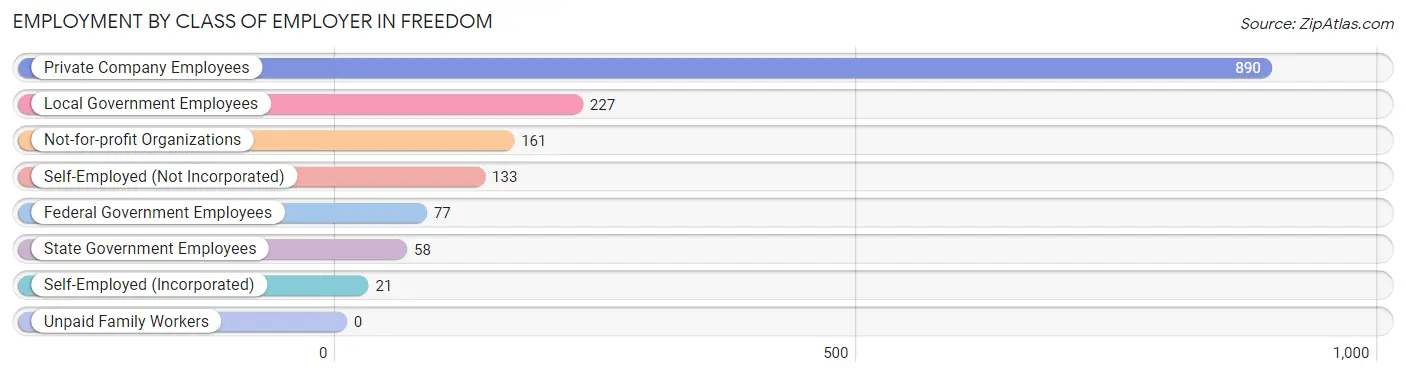
| Employer Class | # Employees | % Employees |
| Private Company Employees | 890 | 56.8% |
| Self-Employed (Incorporated) | 21 | 1.3% |
| Self-Employed (Not Incorporated) | 133 | 8.5% |
| Not-for-profit Organizations | 161 | 10.3% |
| Local Government Employees | 227 | 14.5% |
| State Government Employees | 58 | 3.7% |
| Federal Government Employees | 77 | 4.9% |
| Unpaid Family Workers | 0 | 0.0% |
| Total | 1,567 | 100.0% |
Employment Status by Age in Freedom
According to the labor force statistics for Freedom, out of the total population over 16 years of age (2,442), 72.0% or 1,758 individuals are in the labor force, with 9.8% or 172 of them unemployed. The age group with the highest labor force participation rate is 25 to 29 years, with 100.0% or 60 individuals in the labor force. Within the labor force, the 20 to 24 years age range has the highest percentage of unemployed individuals, with 26.8% or 81 of them being unemployed.
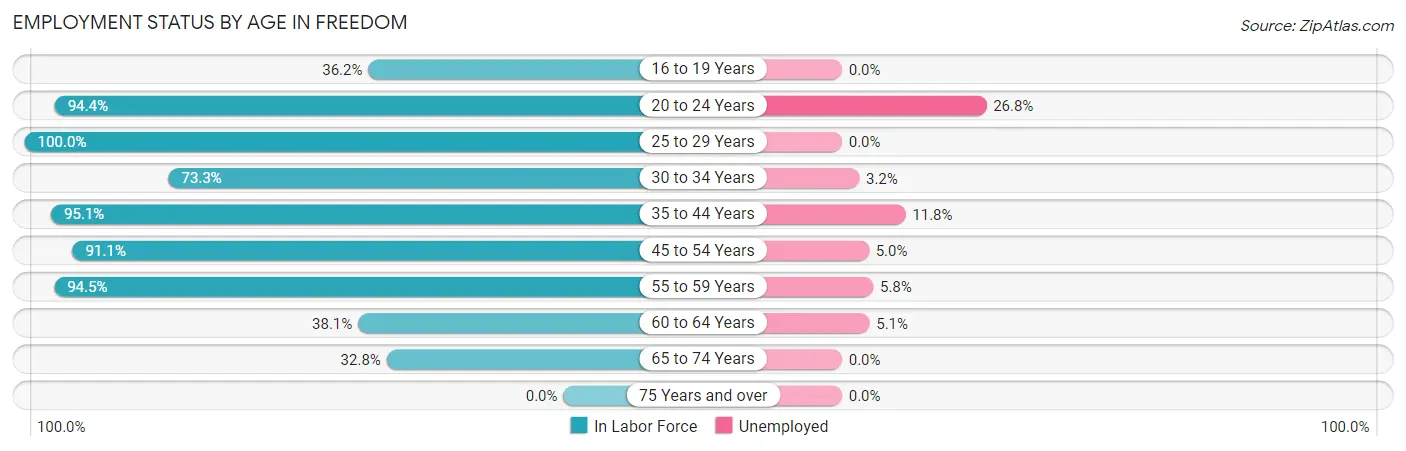
| Age Bracket | In Labor Force | Unemployed |
| 16 to 19 Years | 75 (36.2%) | 0 (0.0%) |
| 20 to 24 Years | 302 (94.4%) | 81 (26.8%) |
| 25 to 29 Years | 60 (100.0%) | 0 (0.0%) |
| 30 to 34 Years | 187 (73.3%) | 6 (3.2%) |
| 35 to 44 Years | 482 (95.1%) | 57 (11.8%) |
| 45 to 54 Years | 381 (91.1%) | 19 (5.0%) |
| 55 to 59 Years | 104 (94.5%) | 6 (5.8%) |
| 60 to 64 Years | 59 (38.1%) | 3 (5.1%) |
| 65 to 74 Years | 109 (32.8%) | 0 (0.0%) |
| 75 Years and over | 0 (0.0%) | 0 (0.0%) |
| Total | 1,758 (72.0%) | 172 (9.8%) |
Employment Status by Educational Attainment in Freedom
According to labor force statistics for Freedom, 84.6% of individuals (1,273) out of the total population between 25 and 64 years of age (1,505) are in the labor force, with 7.1% or 90 of them being unemployed. The group with the highest labor force participation rate are those with the educational attainment of bachelor's degree or higher, with 94.1% or 286 individuals in the labor force. Within the labor force, individuals with less than high school education have the highest percentage of unemployment, with 18.8% or 64 of them being unemployed.
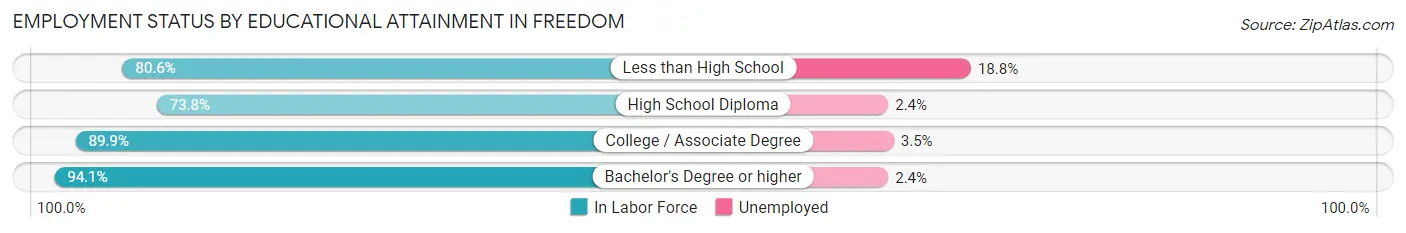
| Educational Attainment | In Labor Force | Unemployed |
| Less than High School | 341 (80.6%) | 80 (18.8%) |
| High School Diploma | 245 (73.8%) | 8 (2.4%) |
| College / Associate Degree | 401 (89.9%) | 16 (3.5%) |
| Bachelor's Degree or higher | 286 (94.1%) | 7 (2.4%) |
| Total | 1,273 (84.6%) | 107 (7.1%) |
Employment Occupations by Sex in Freedom
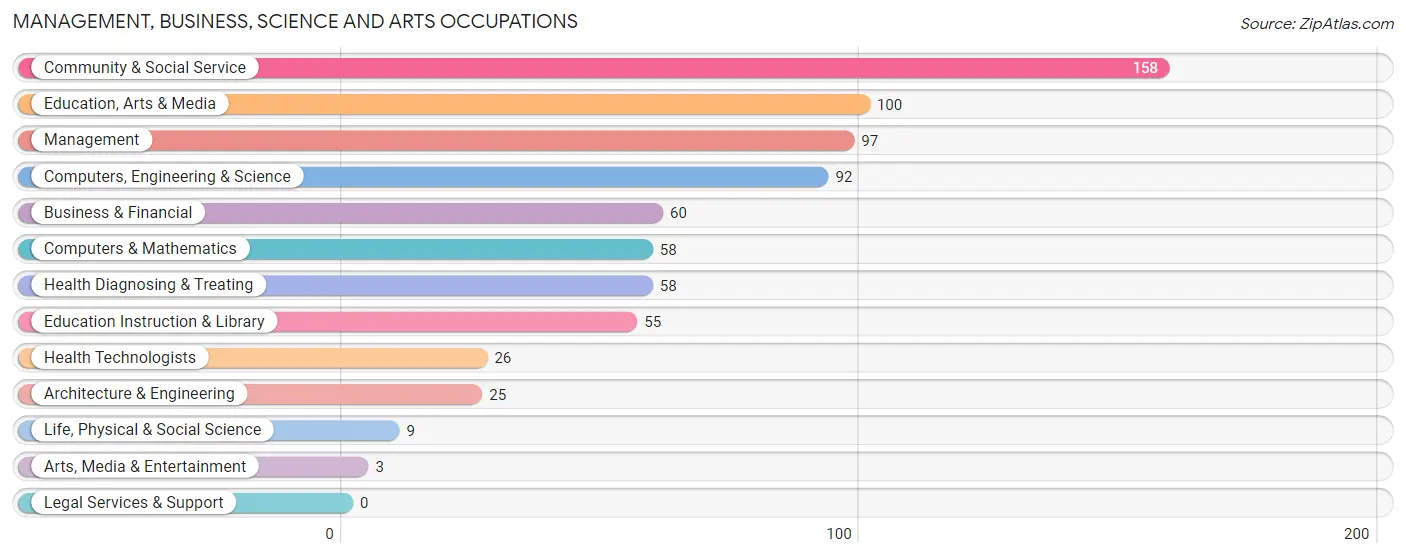
Management, Business, Science and Arts Occupations
The most common Management, Business, Science and Arts occupations in Freedom are Community & Social Service (158 | 10.0%), Education, Arts & Media (100 | 6.3%), Management (97 | 6.1%), Computers, Engineering & Science (92 | 5.8%), and Business & Financial (60 | 3.8%).
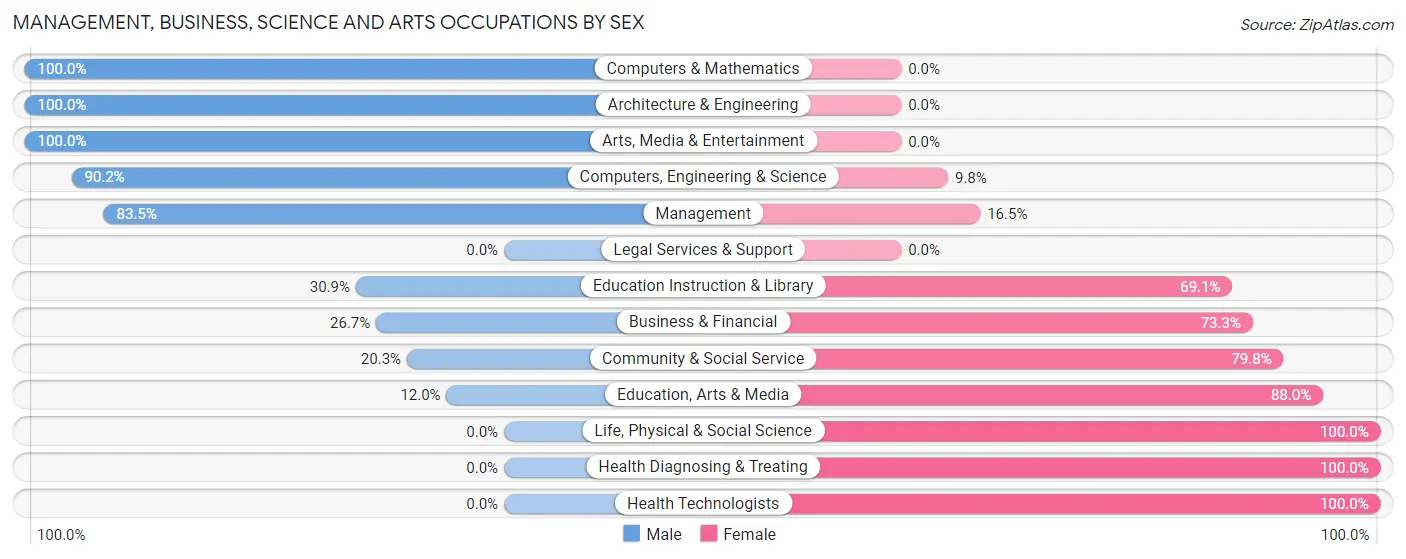
Management, Business, Science and Arts Occupations by Sex
Within the Management, Business, Science and Arts occupations in Freedom, the most male-oriented occupations are Computers & Mathematics (100.0%), Architecture & Engineering (100.0%), and Arts, Media & Entertainment (100.0%), while the most female-oriented occupations are Life, Physical & Social Science (100.0%), Health Diagnosing & Treating (100.0%), and Health Technologists (100.0%).
| Occupation | Male | Female |
| Management | 81 (83.5%) | 16 (16.5%) |
| Business & Financial | 16 (26.7%) | 44 (73.3%) |
| Computers, Engineering & Science | 83 (90.2%) | 9 (9.8%) |
| Computers & Mathematics | 58 (100.0%) | 0 (0.0%) |
| Architecture & Engineering | 25 (100.0%) | 0 (0.0%) |
| Life, Physical & Social Science | 0 (0.0%) | 9 (100.0%) |
| Community & Social Service | 32 (20.3%) | 126 (79.7%) |
| Education, Arts & Media | 12 (12.0%) | 88 (88.0%) |
| Legal Services & Support | 0 (0.0%) | 0 (0.0%) |
| Education Instruction & Library | 17 (30.9%) | 38 (69.1%) |
| Arts, Media & Entertainment | 3 (100.0%) | 0 (0.0%) |
| Health Diagnosing & Treating | 0 (0.0%) | 58 (100.0%) |
| Health Technologists | 0 (0.0%) | 26 (100.0%) |
| Total (Category) | 212 (45.6%) | 253 (54.4%) |
| Total (Overall) | 835 (52.6%) | 752 (47.4%) |
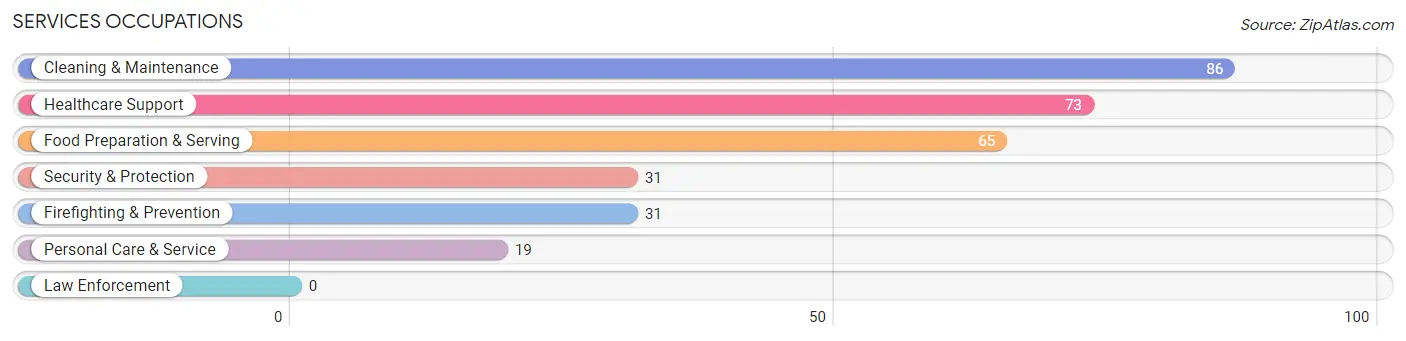
Services Occupations
The most common Services occupations in Freedom are Cleaning & Maintenance (86 | 5.4%), Healthcare Support (73 | 4.6%), Food Preparation & Serving (65 | 4.1%), Security & Protection (31 | 1.9%), and Firefighting & Prevention (31 | 1.9%).
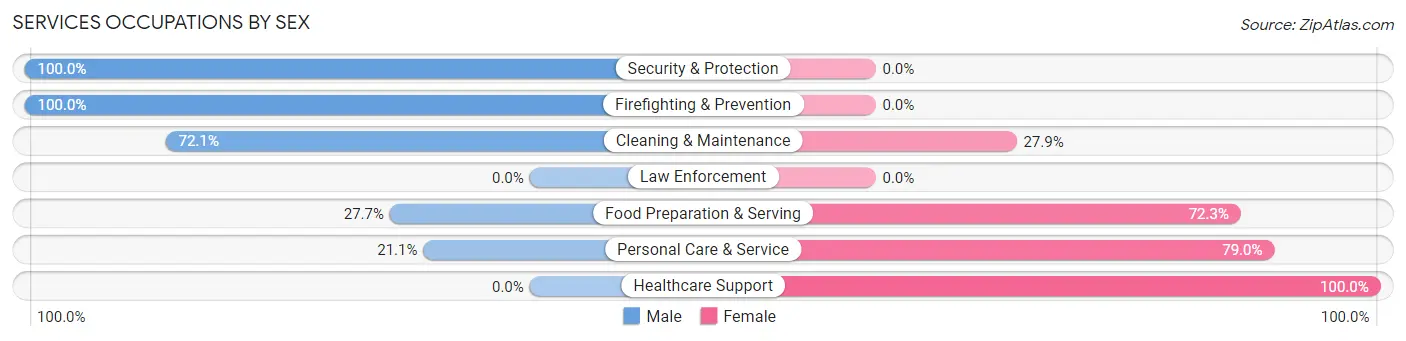
Services Occupations by Sex
Within the Services occupations in Freedom, the most male-oriented occupations are Security & Protection (100.0%), Firefighting & Prevention (100.0%), and Cleaning & Maintenance (72.1%), while the most female-oriented occupations are Healthcare Support (100.0%), Personal Care & Service (78.9%), and Food Preparation & Serving (72.3%).
| Occupation | Male | Female |
| Healthcare Support | 0 (0.0%) | 73 (100.0%) |
| Security & Protection | 31 (100.0%) | 0 (0.0%) |
| Firefighting & Prevention | 31 (100.0%) | 0 (0.0%) |
| Law Enforcement | 0 (0.0%) | 0 (0.0%) |
| Food Preparation & Serving | 18 (27.7%) | 47 (72.3%) |
| Cleaning & Maintenance | 62 (72.1%) | 24 (27.9%) |
| Personal Care & Service | 4 (21.0%) | 15 (78.9%) |
| Total (Category) | 115 (42.0%) | 159 (58.0%) |
| Total (Overall) | 835 (52.6%) | 752 (47.4%) |
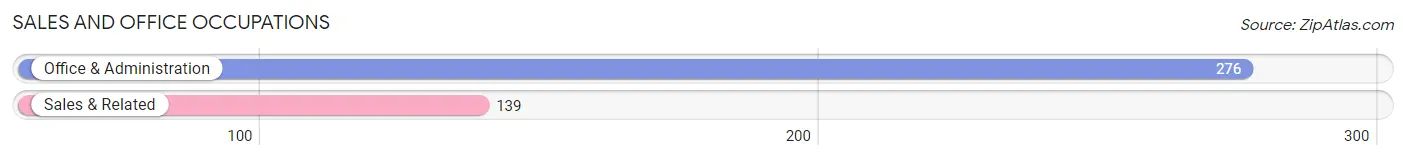
Sales and Office Occupations
The most common Sales and Office occupations in Freedom are Office & Administration (276 | 17.4%), and Sales & Related (139 | 8.8%).
Sales and Office Occupations by Sex
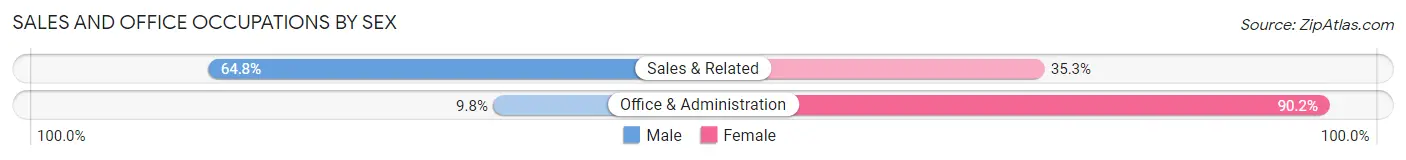
| Occupation | Male | Female |
| Sales & Related | 90 (64.7%) | 49 (35.2%) |
| Office & Administration | 27 (9.8%) | 249 (90.2%) |
| Total (Category) | 117 (28.2%) | 298 (71.8%) |
| Total (Overall) | 835 (52.6%) | 752 (47.4%) |
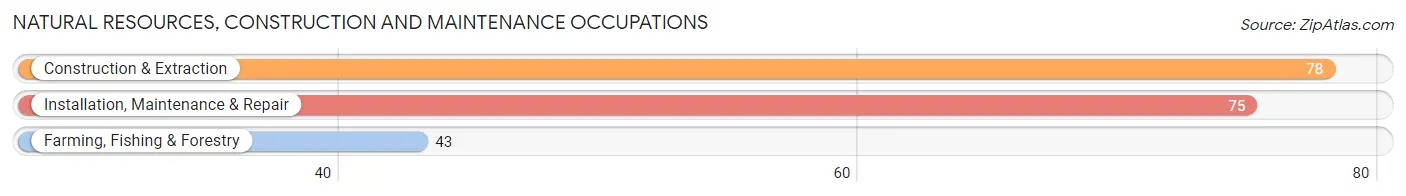
Natural Resources, Construction and Maintenance Occupations
The most common Natural Resources, Construction and Maintenance occupations in Freedom are Construction & Extraction (78 | 4.9%), Installation, Maintenance & Repair (75 | 4.7%), and Farming, Fishing & Forestry (43 | 2.7%).
Natural Resources, Construction and Maintenance Occupations by Sex
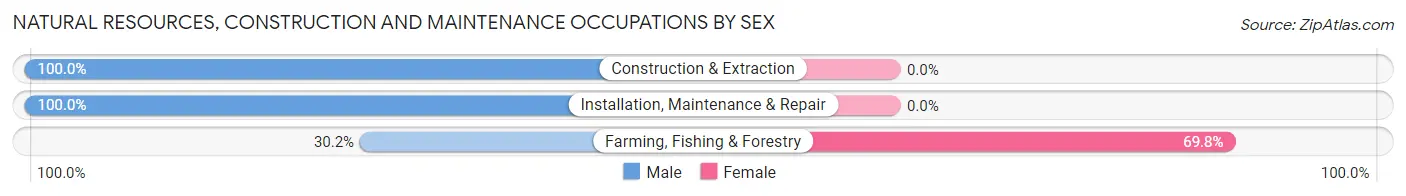
| Occupation | Male | Female |
| Farming, Fishing & Forestry | 13 (30.2%) | 30 (69.8%) |
| Construction & Extraction | 78 (100.0%) | 0 (0.0%) |
| Installation, Maintenance & Repair | 75 (100.0%) | 0 (0.0%) |
| Total (Category) | 166 (84.7%) | 30 (15.3%) |
| Total (Overall) | 835 (52.6%) | 752 (47.4%) |
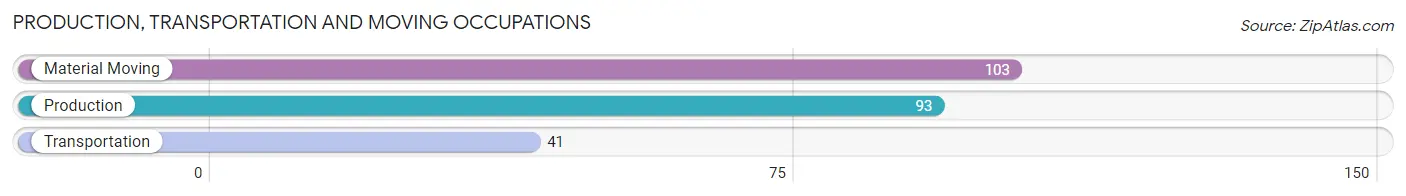
Production, Transportation and Moving Occupations
The most common Production, Transportation and Moving occupations in Freedom are Material Moving (103 | 6.5%), Production (93 | 5.9%), and Transportation (41 | 2.6%).
Production, Transportation and Moving Occupations by Sex
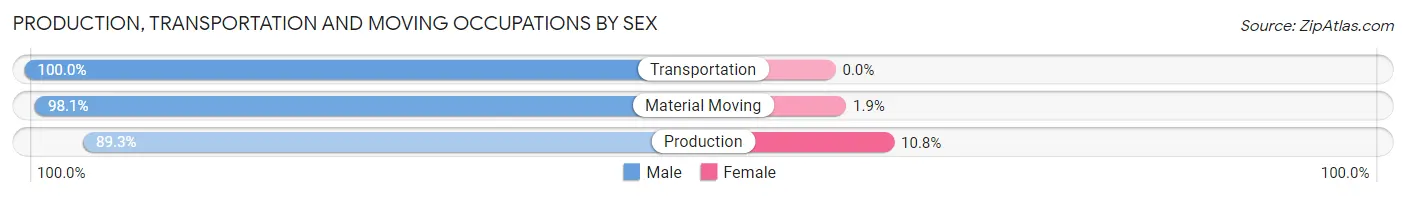
| Occupation | Male | Female |
| Production | 83 (89.2%) | 10 (10.7%) |
| Transportation | 41 (100.0%) | 0 (0.0%) |
| Material Moving | 101 (98.1%) | 2 (1.9%) |
| Total (Category) | 225 (94.9%) | 12 (5.1%) |
| Total (Overall) | 835 (52.6%) | 752 (47.4%) |
Employment Industries by Sex in Freedom
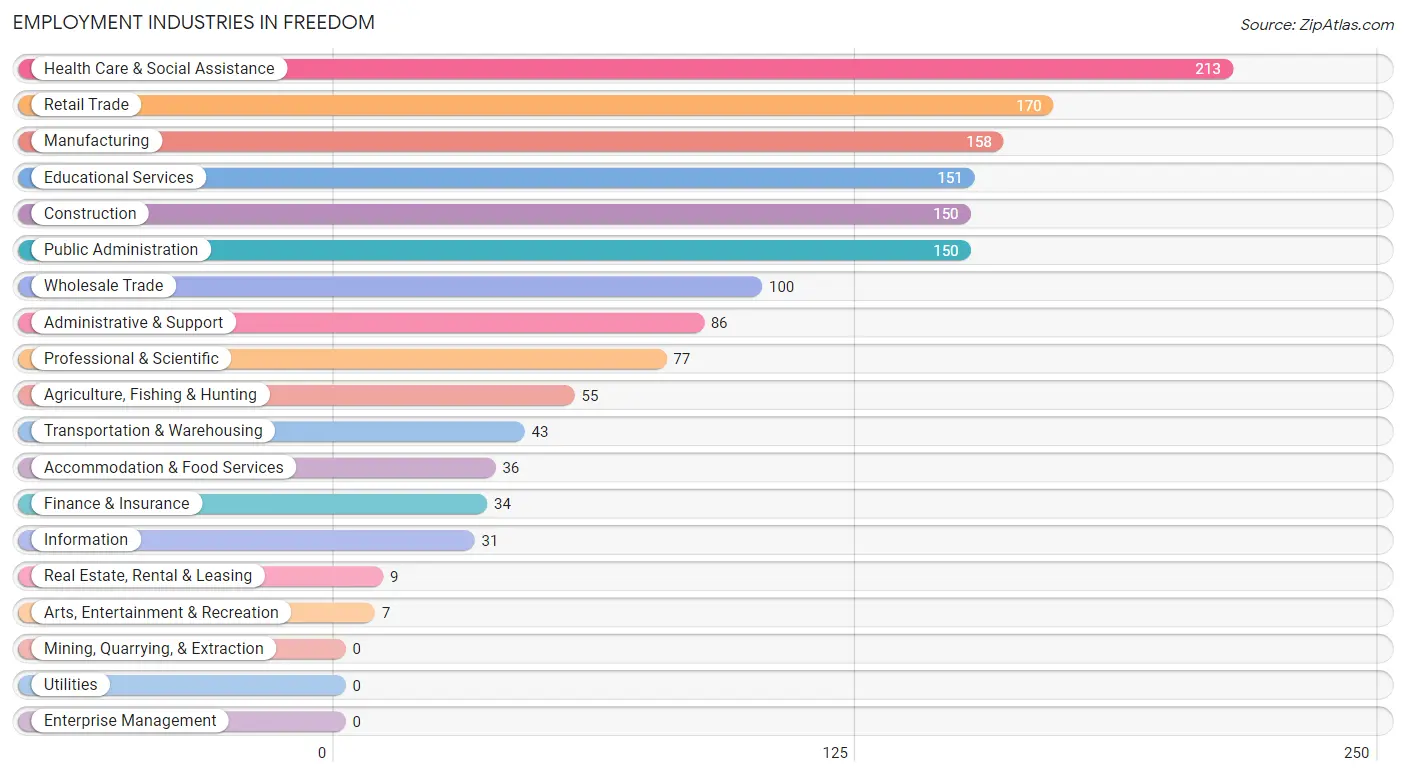
Employment Industries in Freedom
The major employment industries in Freedom include Health Care & Social Assistance (213 | 13.4%), Retail Trade (170 | 10.7%), Manufacturing (158 | 10.0%), Educational Services (151 | 9.5%), and Construction (150 | 9.5%).
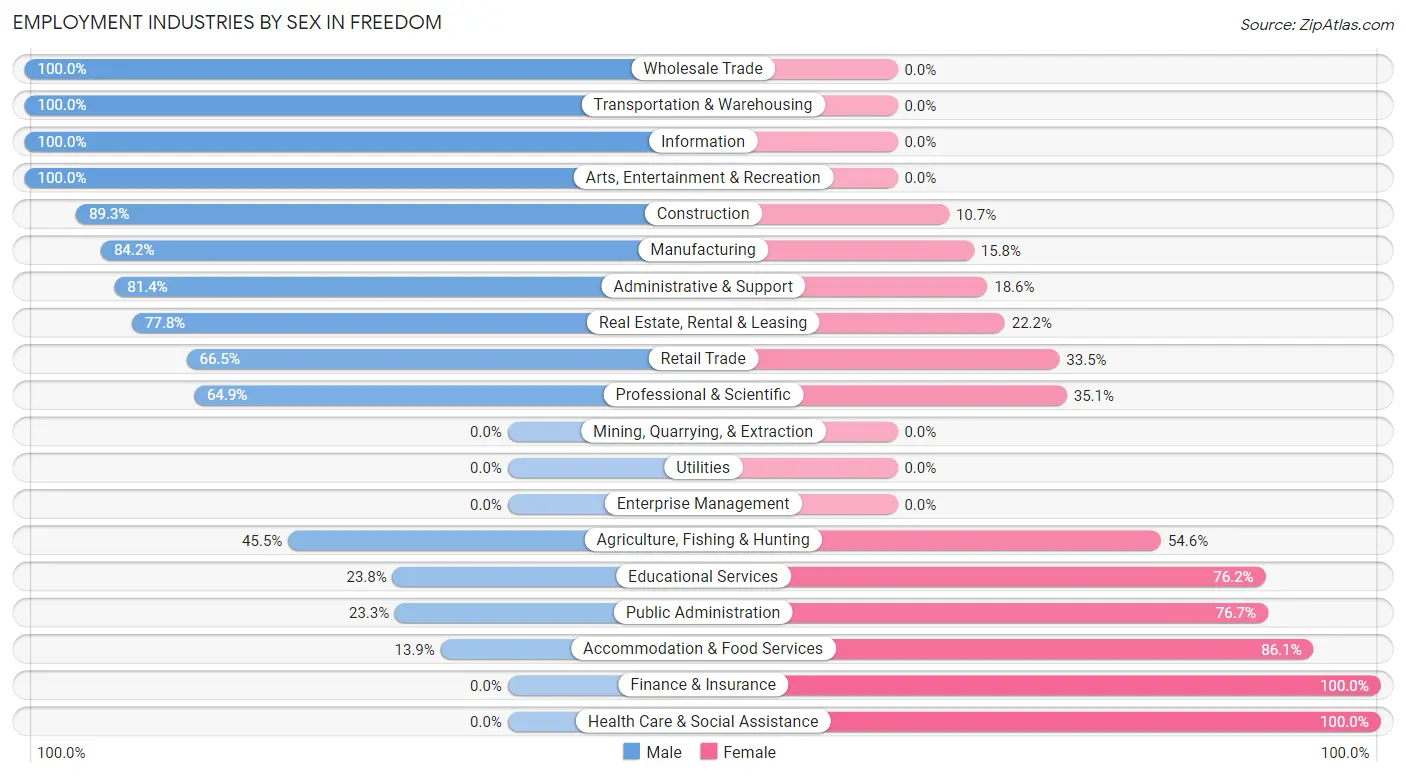
Employment Industries by Sex in Freedom
The Freedom industries that see more men than women are Wholesale Trade (100.0%), Transportation & Warehousing (100.0%), and Information (100.0%), whereas the industries that tend to have a higher number of women are Finance & Insurance (100.0%), Health Care & Social Assistance (100.0%), and Accommodation & Food Services (86.1%).
| Industry | Male | Female |
| Agriculture, Fishing & Hunting | 25 (45.5%) | 30 (54.5%) |
| Mining, Quarrying, & Extraction | 0 (0.0%) | 0 (0.0%) |
| Construction | 134 (89.3%) | 16 (10.7%) |
| Manufacturing | 133 (84.2%) | 25 (15.8%) |
| Wholesale Trade | 100 (100.0%) | 0 (0.0%) |
| Retail Trade | 113 (66.5%) | 57 (33.5%) |
| Transportation & Warehousing | 43 (100.0%) | 0 (0.0%) |
| Utilities | 0 (0.0%) | 0 (0.0%) |
| Information | 31 (100.0%) | 0 (0.0%) |
| Finance & Insurance | 0 (0.0%) | 34 (100.0%) |
| Real Estate, Rental & Leasing | 7 (77.8%) | 2 (22.2%) |
| Professional & Scientific | 50 (64.9%) | 27 (35.1%) |
| Enterprise Management | 0 (0.0%) | 0 (0.0%) |
| Administrative & Support | 70 (81.4%) | 16 (18.6%) |
| Educational Services | 36 (23.8%) | 115 (76.2%) |
| Health Care & Social Assistance | 0 (0.0%) | 213 (100.0%) |
| Arts, Entertainment & Recreation | 7 (100.0%) | 0 (0.0%) |
| Accommodation & Food Services | 5 (13.9%) | 31 (86.1%) |
| Public Administration | 35 (23.3%) | 115 (76.7%) |
| Total | 835 (52.6%) | 752 (47.4%) |
Education in Freedom
School Enrollment in Freedom
The most common levels of schooling among the 1,102 students in Freedom are middle school (343 | 31.1%), high school (235 | 21.3%), and elementary school (208 | 18.9%).
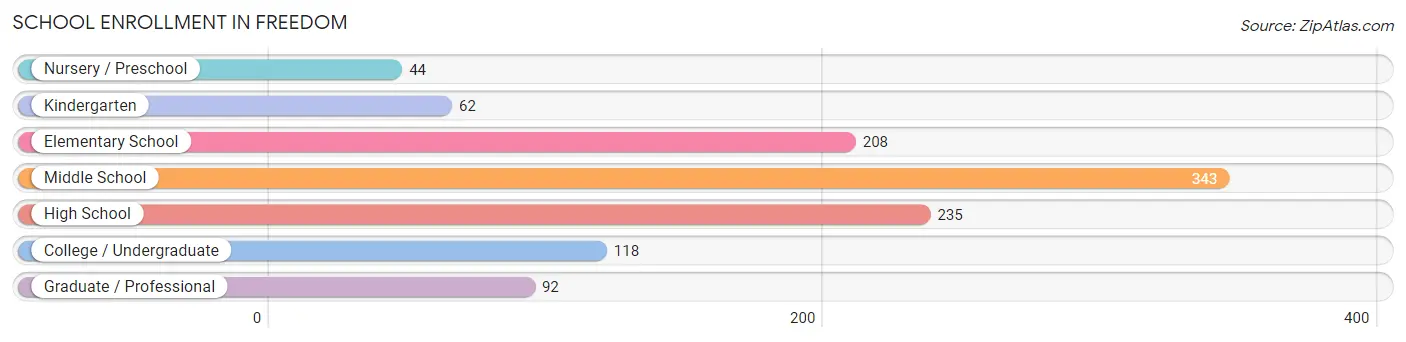
| School Level | # Students | % Students |
| Nursery / Preschool | 44 | 4.0% |
| Kindergarten | 62 | 5.6% |
| Elementary School | 208 | 18.9% |
| Middle School | 343 | 31.1% |
| High School | 235 | 21.3% |
| College / Undergraduate | 118 | 10.7% |
| Graduate / Professional | 92 | 8.4% |
| Total | 1,102 | 100.0% |
School Enrollment by Age by Funding Source in Freedom
Out of a total of 1,102 students who are enrolled in schools in Freedom, 21 (1.9%) attend a private institution, while the remaining 1,081 (98.1%) are enrolled in public schools. The age group of 35 years and over has the highest likelihood of being enrolled in private schools, with 6 (17.6% in the age bracket) enrolled. Conversely, the age group of 10 to 14 year olds has the lowest likelihood of being enrolled in a private school, with 427 (100.0% in the age bracket) attending a public institution.
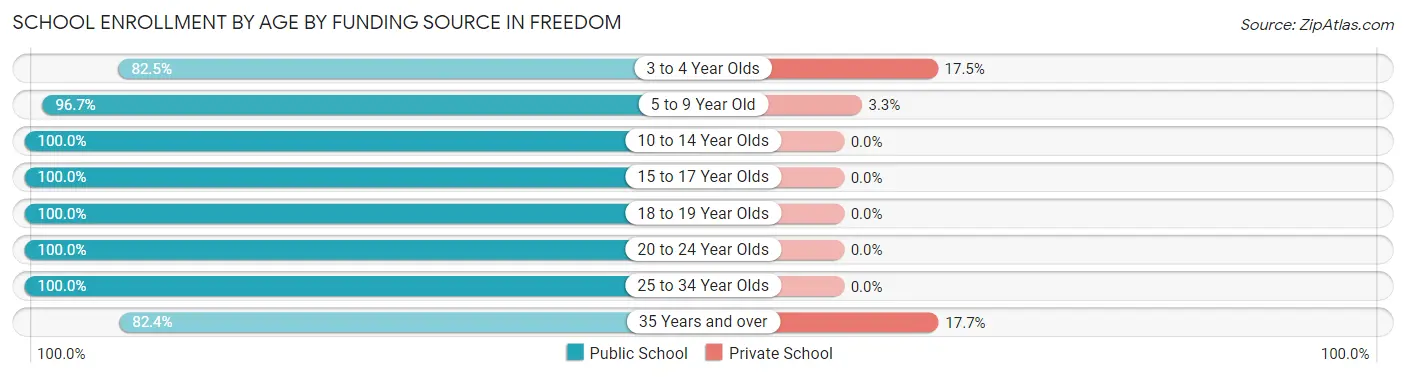
| Age Bracket | Public School | Private School |
| 3 to 4 Year Olds | 33 (82.5%) | 7 (17.5%) |
| 5 to 9 Year Old | 232 (96.7%) | 8 (3.3%) |
| 10 to 14 Year Olds | 427 (100.0%) | 0 (0.0%) |
| 15 to 17 Year Olds | 145 (100.0%) | 0 (0.0%) |
| 18 to 19 Year Olds | 57 (100.0%) | 0 (0.0%) |
| 20 to 24 Year Olds | 82 (100.0%) | 0 (0.0%) |
| 25 to 34 Year Olds | 77 (100.0%) | 0 (0.0%) |
| 35 Years and over | 28 (82.4%) | 6 (17.6%) |
| Total | 1,081 (98.1%) | 21 (1.9%) |
Educational Attainment by Field of Study in Freedom
Business (80 | 17.7%), social sciences (57 | 12.6%), science & technology (46 | 10.2%), bio, nature & agricultural (39 | 8.6%), and arts & humanities (37 | 8.2%) are the most common fields of study among 453 individuals in Freedom who have obtained a bachelor's degree or higher.
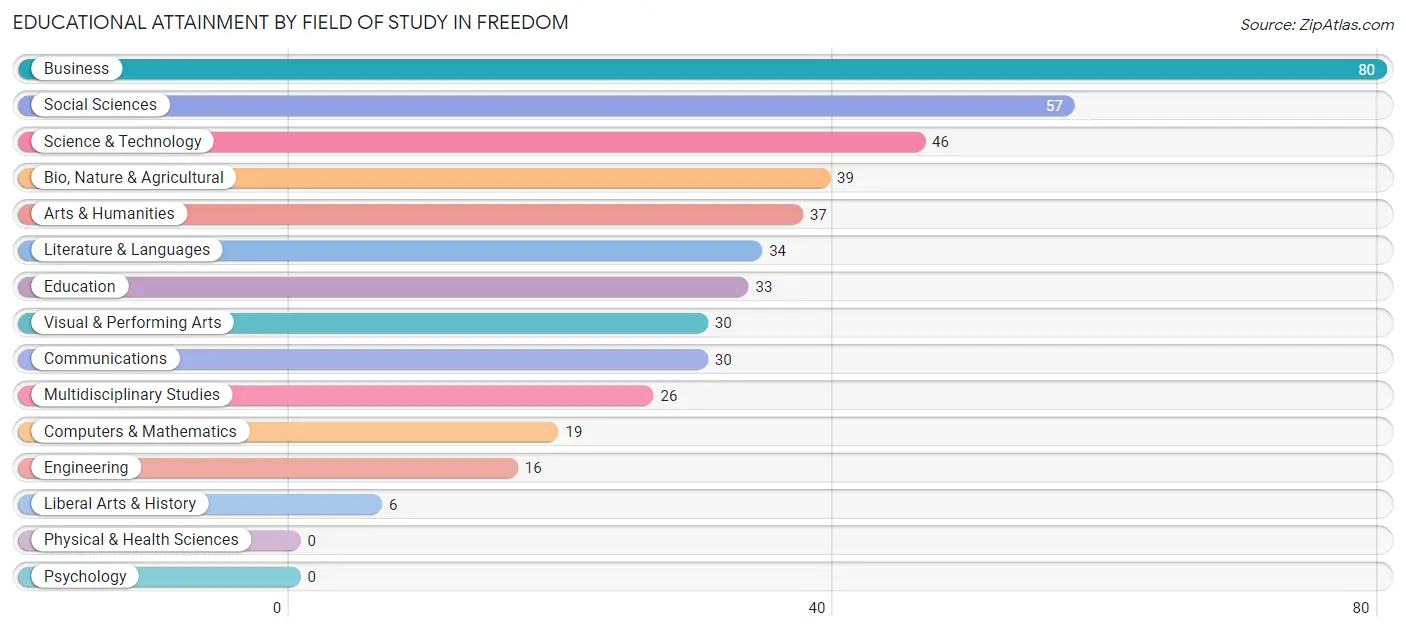
| Field of Study | # Graduates | % Graduates |
| Computers & Mathematics | 19 | 4.2% |
| Bio, Nature & Agricultural | 39 | 8.6% |
| Physical & Health Sciences | 0 | 0.0% |
| Psychology | 0 | 0.0% |
| Social Sciences | 57 | 12.6% |
| Engineering | 16 | 3.5% |
| Multidisciplinary Studies | 26 | 5.7% |
| Science & Technology | 46 | 10.2% |
| Business | 80 | 17.7% |
| Education | 33 | 7.3% |
| Literature & Languages | 34 | 7.5% |
| Liberal Arts & History | 6 | 1.3% |
| Visual & Performing Arts | 30 | 6.6% |
| Communications | 30 | 6.6% |
| Arts & Humanities | 37 | 8.2% |
| Total | 453 | 100.0% |
Transportation & Commute in Freedom
Vehicle Availability by Sex in Freedom
The most prevalent vehicle ownership categories in Freedom are males with 3 vehicles (303, accounting for 36.9%) and females with 3 vehicles (402, making up 40.6%).
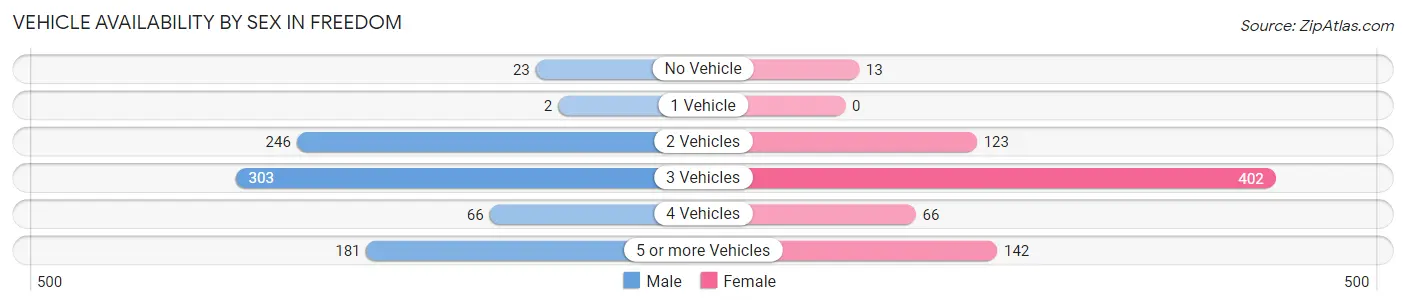
| Vehicles Available | Male | Female |
| No Vehicle | 23 (2.8%) | 13 (1.7%) |
| 1 Vehicle | 2 (0.2%) | 0 (0.0%) |
| 2 Vehicles | 246 (30.0%) | 123 (16.5%) |
| 3 Vehicles | 303 (36.9%) | 402 (53.9%) |
| 4 Vehicles | 66 (8.0%) | 66 (8.8%) |
| 5 or more Vehicles | 181 (22.1%) | 142 (19.0%) |
| Total | 821 (100.0%) | 746 (100.0%) |
Commute Time in Freedom
The most frequently occuring commute durations in Freedom are 10 to 14 minutes (341 commuters, 22.8%), 15 to 19 minutes (210 commuters, 14.1%), and 45 to 59 minutes (164 commuters, 11.0%).
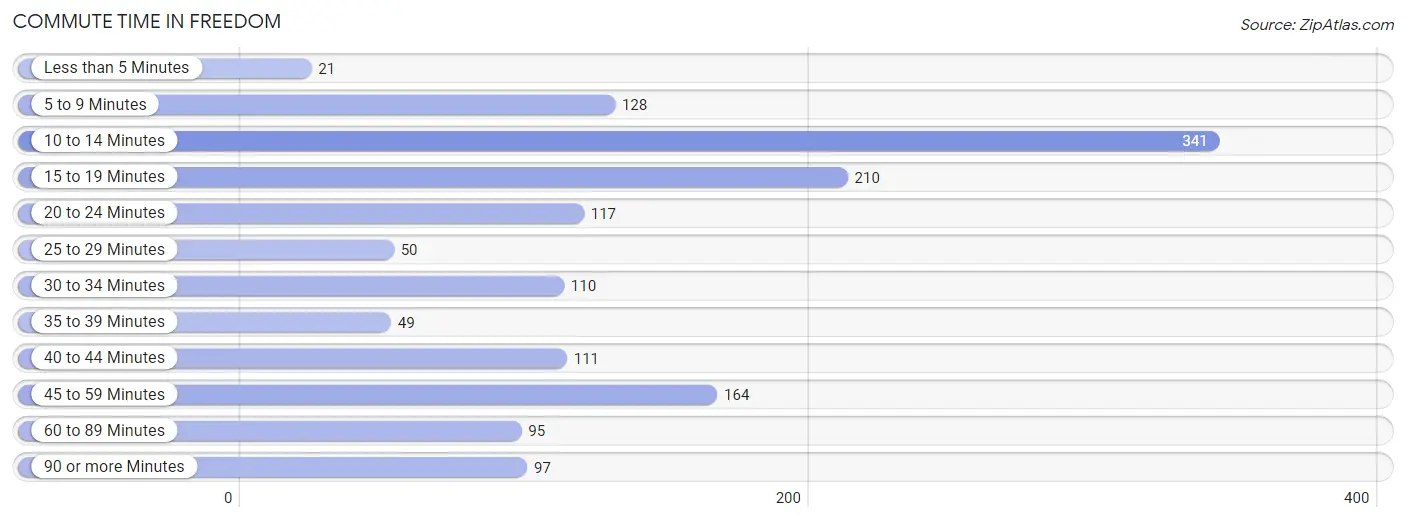
| Commute Time | # Commuters | % Commuters |
| Less than 5 Minutes | 21 | 1.4% |
| 5 to 9 Minutes | 128 | 8.6% |
| 10 to 14 Minutes | 341 | 22.8% |
| 15 to 19 Minutes | 210 | 14.1% |
| 20 to 24 Minutes | 117 | 7.8% |
| 25 to 29 Minutes | 50 | 3.4% |
| 30 to 34 Minutes | 110 | 7.4% |
| 35 to 39 Minutes | 49 | 3.3% |
| 40 to 44 Minutes | 111 | 7.4% |
| 45 to 59 Minutes | 164 | 11.0% |
| 60 to 89 Minutes | 95 | 6.4% |
| 90 or more Minutes | 97 | 6.5% |
Commute Time by Sex in Freedom
The most common commute times in Freedom are 10 to 14 minutes (209 commuters, 27.3%) for males and 10 to 14 minutes (132 commuters, 18.2%) for females.
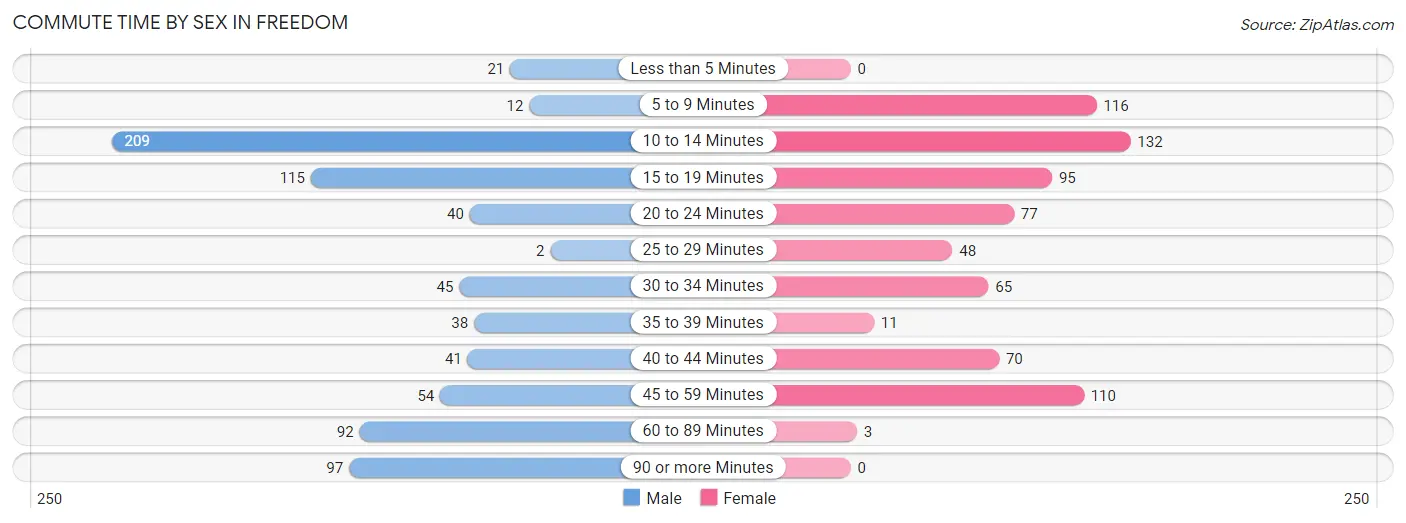
| Commute Time | Male | Female |
| Less than 5 Minutes | 21 (2.7%) | 0 (0.0%) |
| 5 to 9 Minutes | 12 (1.6%) | 116 (16.0%) |
| 10 to 14 Minutes | 209 (27.3%) | 132 (18.2%) |
| 15 to 19 Minutes | 115 (15.0%) | 95 (13.1%) |
| 20 to 24 Minutes | 40 (5.2%) | 77 (10.6%) |
| 25 to 29 Minutes | 2 (0.3%) | 48 (6.6%) |
| 30 to 34 Minutes | 45 (5.9%) | 65 (8.9%) |
| 35 to 39 Minutes | 38 (5.0%) | 11 (1.5%) |
| 40 to 44 Minutes | 41 (5.3%) | 70 (9.6%) |
| 45 to 59 Minutes | 54 (7.0%) | 110 (15.1%) |
| 60 to 89 Minutes | 92 (12.0%) | 3 (0.4%) |
| 90 or more Minutes | 97 (12.7%) | 0 (0.0%) |
Time of Departure to Work by Sex in Freedom
The most frequent times of departure to work in Freedom are 12:00 AM to 4:59 AM (192, 25.1%) for males and 7:00 AM to 7:29 AM (176, 24.2%) for females.
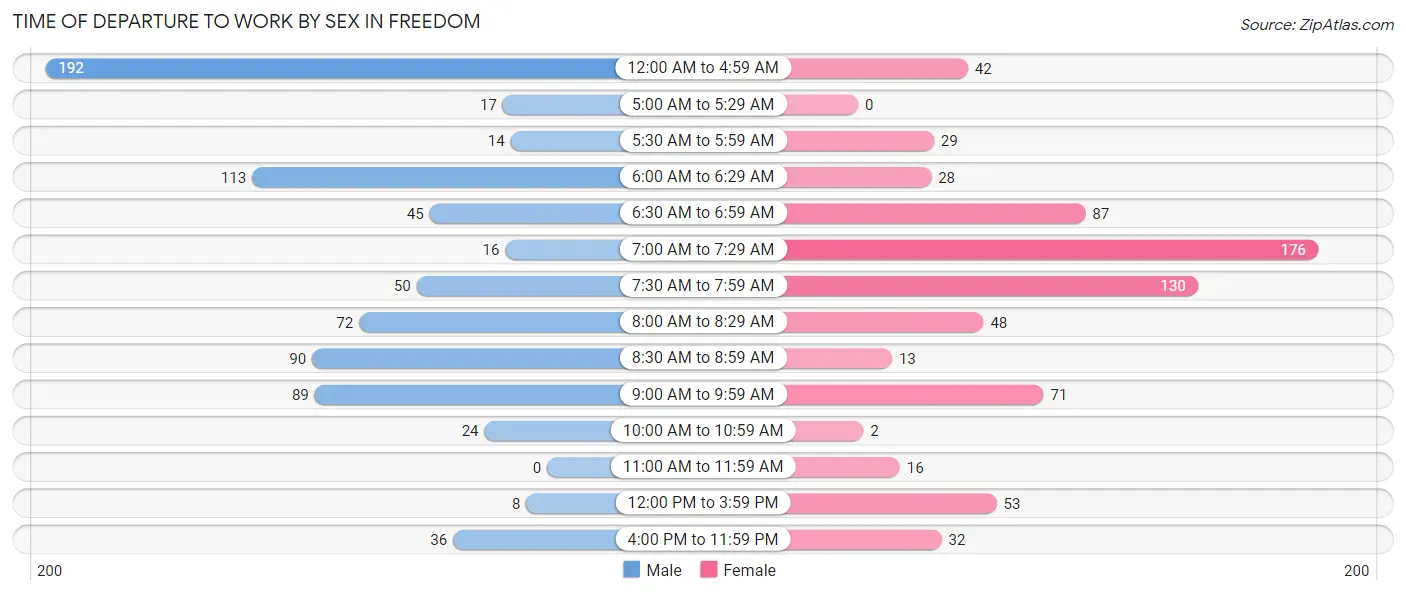
| Time of Departure | Male | Female |
| 12:00 AM to 4:59 AM | 192 (25.1%) | 42 (5.8%) |
| 5:00 AM to 5:29 AM | 17 (2.2%) | 0 (0.0%) |
| 5:30 AM to 5:59 AM | 14 (1.8%) | 29 (4.0%) |
| 6:00 AM to 6:29 AM | 113 (14.7%) | 28 (3.8%) |
| 6:30 AM to 6:59 AM | 45 (5.9%) | 87 (12.0%) |
| 7:00 AM to 7:29 AM | 16 (2.1%) | 176 (24.2%) |
| 7:30 AM to 7:59 AM | 50 (6.5%) | 130 (17.9%) |
| 8:00 AM to 8:29 AM | 72 (9.4%) | 48 (6.6%) |
| 8:30 AM to 8:59 AM | 90 (11.7%) | 13 (1.8%) |
| 9:00 AM to 9:59 AM | 89 (11.6%) | 71 (9.8%) |
| 10:00 AM to 10:59 AM | 24 (3.1%) | 2 (0.3%) |
| 11:00 AM to 11:59 AM | 0 (0.0%) | 16 (2.2%) |
| 12:00 PM to 3:59 PM | 8 (1.0%) | 53 (7.3%) |
| 4:00 PM to 11:59 PM | 36 (4.7%) | 32 (4.4%) |
| Total | 766 (100.0%) | 727 (100.0%) |
Housing Occupancy in Freedom
Occupancy by Ownership in Freedom
Of the total 921 dwellings in Freedom, owner-occupied units account for 535 (58.1%), while renter-occupied units make up 386 (41.9%).
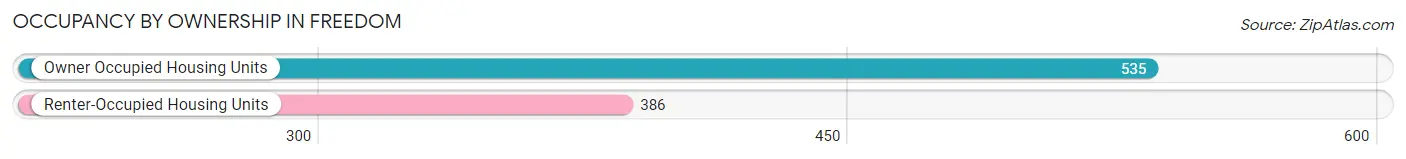
| Occupancy | # Housing Units | % Housing Units |
| Owner Occupied Housing Units | 535 | 58.1% |
| Renter-Occupied Housing Units | 386 | 41.9% |
| Total Occupied Housing Units | 921 | 100.0% |
Occupancy by Household Size in Freedom
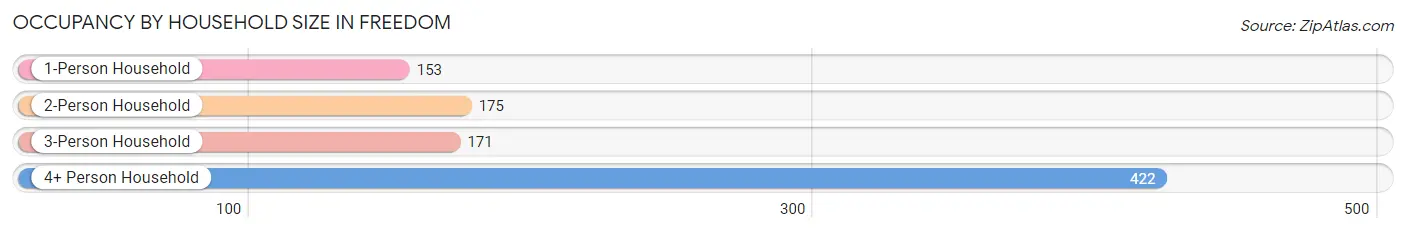
| Household Size | # Housing Units | % Housing Units |
| 1-Person Household | 153 | 16.6% |
| 2-Person Household | 175 | 19.0% |
| 3-Person Household | 171 | 18.6% |
| 4+ Person Household | 422 | 45.8% |
| Total Housing Units | 921 | 100.0% |
Occupancy by Ownership by Household Size in Freedom
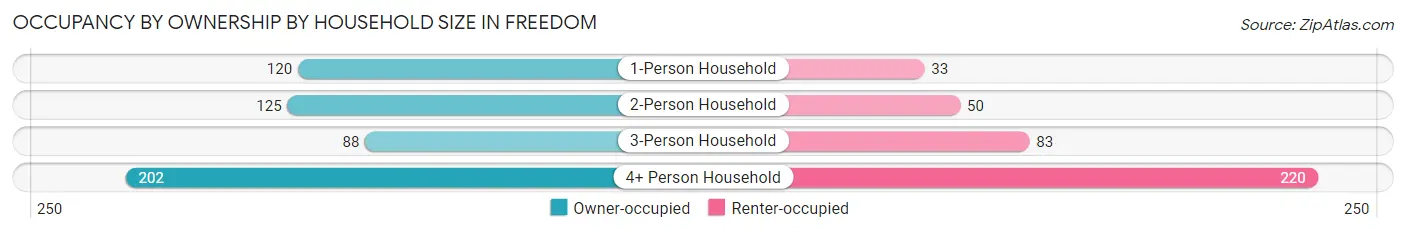
| Household Size | Owner-occupied | Renter-occupied |
| 1-Person Household | 120 (78.4%) | 33 (21.6%) |
| 2-Person Household | 125 (71.4%) | 50 (28.6%) |
| 3-Person Household | 88 (51.5%) | 83 (48.5%) |
| 4+ Person Household | 202 (47.9%) | 220 (52.1%) |
| Total Housing Units | 535 (58.1%) | 386 (41.9%) |
Occupancy by Educational Attainment in Freedom
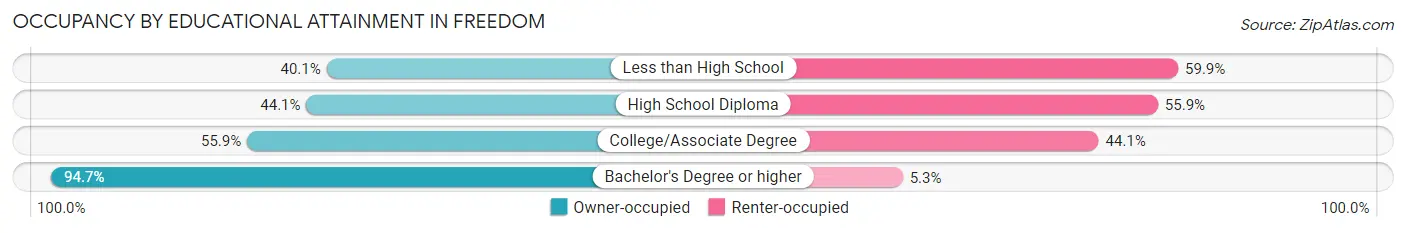
| Household Size | Owner-occupied | Renter-occupied |
| Less than High School | 112 (40.1%) | 167 (59.9%) |
| High School Diploma | 64 (44.1%) | 81 (55.9%) |
| College/Associate Degree | 161 (55.9%) | 127 (44.1%) |
| Bachelor's Degree or higher | 198 (94.7%) | 11 (5.3%) |
Occupancy by Age of Householder in Freedom
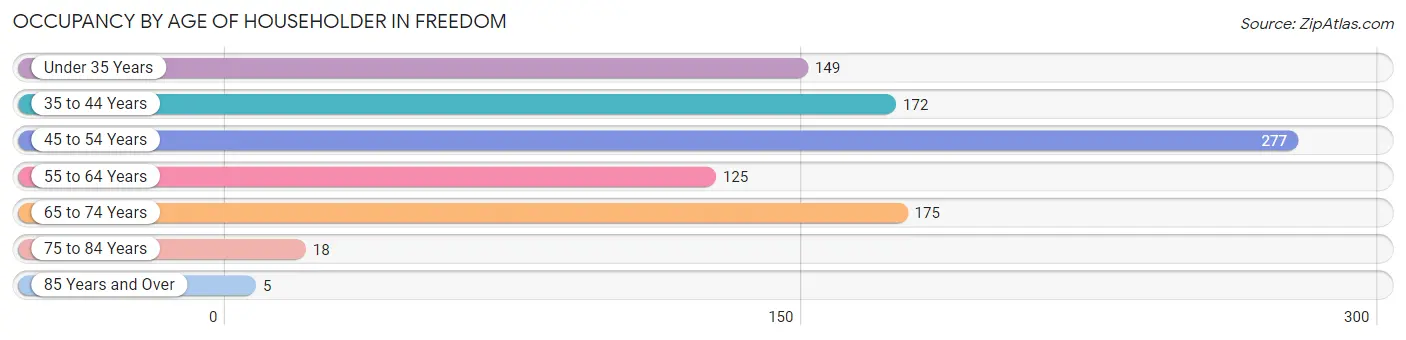
| Age Bracket | # Households | % Households |
| Under 35 Years | 149 | 16.2% |
| 35 to 44 Years | 172 | 18.7% |
| 45 to 54 Years | 277 | 30.1% |
| 55 to 64 Years | 125 | 13.6% |
| 65 to 74 Years | 175 | 19.0% |
| 75 to 84 Years | 18 | 1.9% |
| 85 Years and Over | 5 | 0.5% |
| Total | 921 | 100.0% |
Housing Finances in Freedom
Median Income by Occupancy in Freedom
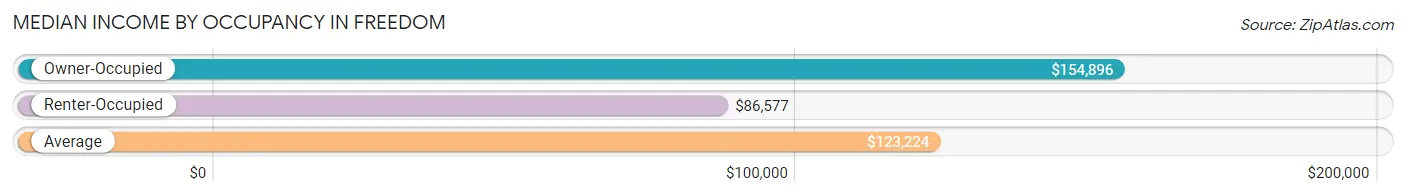
| Occupancy Type | # Households | Median Income |
| Owner-Occupied | 535 (58.1%) | $154,896 |
| Renter-Occupied | 386 (41.9%) | $86,577 |
| Average | 921 (100.0%) | $123,224 |
Occupancy by Householder Income Bracket in Freedom
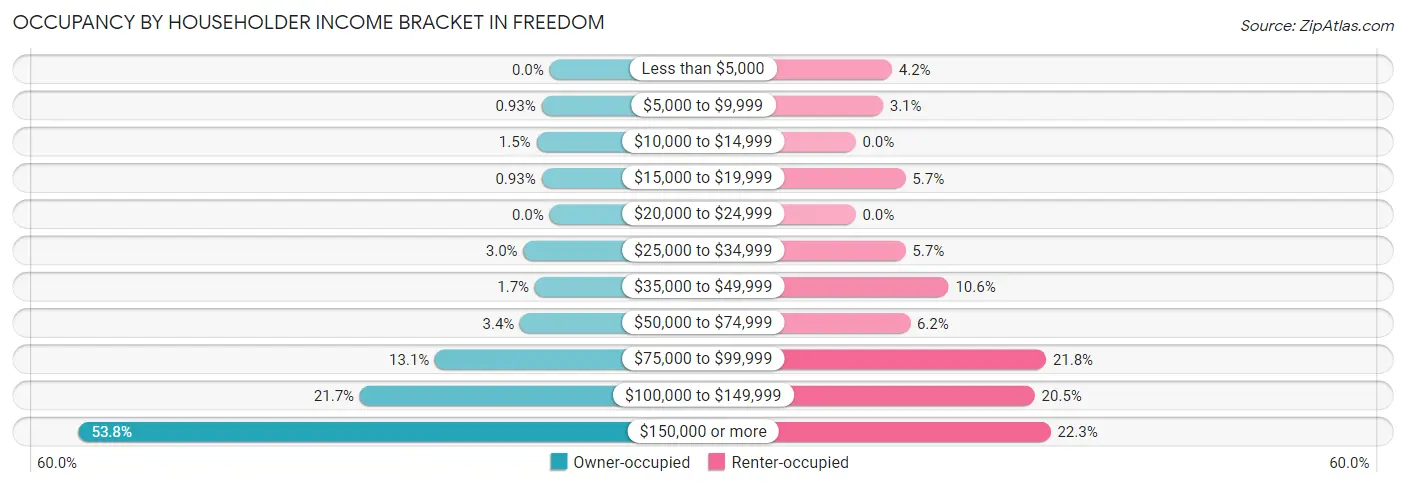
| Income Bracket | Owner-occupied | Renter-occupied |
| Less than $5,000 | 0 (0.0%) | 16 (4.2%) |
| $5,000 to $9,999 | 5 (0.9%) | 12 (3.1%) |
| $10,000 to $14,999 | 8 (1.5%) | 0 (0.0%) |
| $15,000 to $19,999 | 5 (0.9%) | 22 (5.7%) |
| $20,000 to $24,999 | 0 (0.0%) | 0 (0.0%) |
| $25,000 to $34,999 | 16 (3.0%) | 22 (5.7%) |
| $35,000 to $49,999 | 9 (1.7%) | 41 (10.6%) |
| $50,000 to $74,999 | 18 (3.4%) | 24 (6.2%) |
| $75,000 to $99,999 | 70 (13.1%) | 84 (21.8%) |
| $100,000 to $149,999 | 116 (21.7%) | 79 (20.5%) |
| $150,000 or more | 288 (53.8%) | 86 (22.3%) |
| Total | 535 (100.0%) | 386 (100.0%) |
Monthly Housing Cost Tiers in Freedom
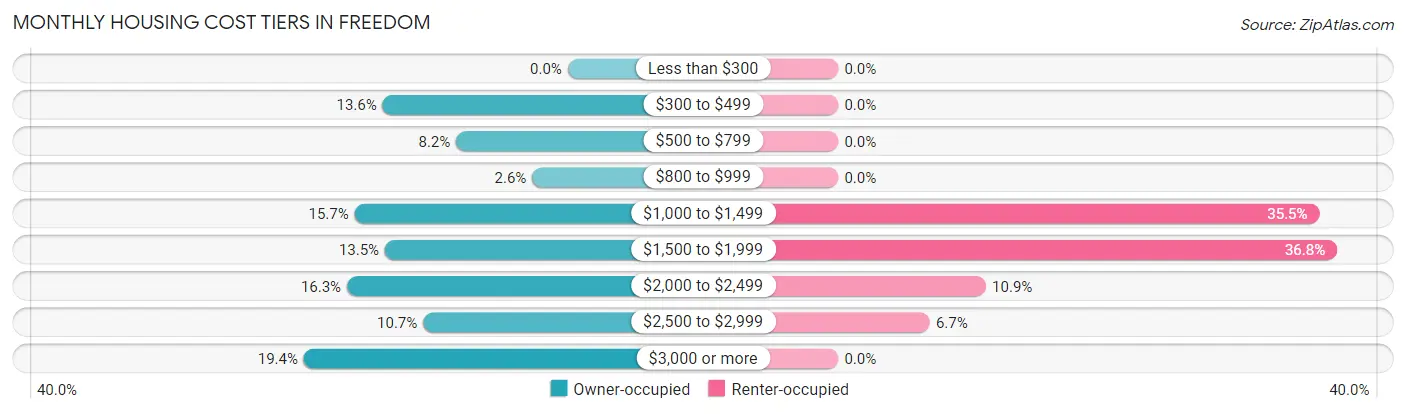
| Monthly Cost | Owner-occupied | Renter-occupied |
| Less than $300 | 0 (0.0%) | 0 (0.0%) |
| $300 to $499 | 73 (13.6%) | 0 (0.0%) |
| $500 to $799 | 44 (8.2%) | 0 (0.0%) |
| $800 to $999 | 14 (2.6%) | 0 (0.0%) |
| $1,000 to $1,499 | 84 (15.7%) | 137 (35.5%) |
| $1,500 to $1,999 | 72 (13.5%) | 142 (36.8%) |
| $2,000 to $2,499 | 87 (16.3%) | 42 (10.9%) |
| $2,500 to $2,999 | 57 (10.6%) | 26 (6.7%) |
| $3,000 or more | 104 (19.4%) | 0 (0.0%) |
| Total | 535 (100.0%) | 386 (100.0%) |
Physical Housing Characteristics in Freedom
Housing Structures in Freedom
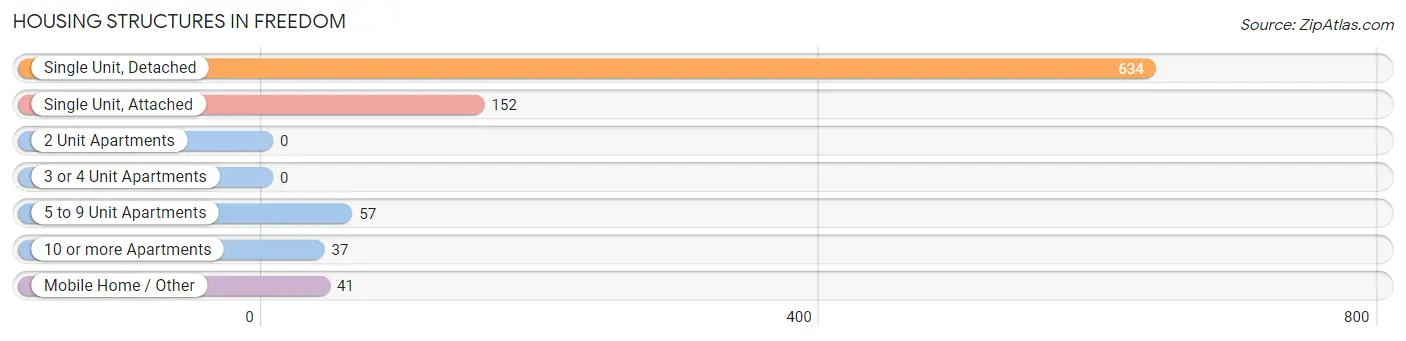
| Structure Type | # Housing Units | % Housing Units |
| Single Unit, Detached | 634 | 68.8% |
| Single Unit, Attached | 152 | 16.5% |
| 2 Unit Apartments | 0 | 0.0% |
| 3 or 4 Unit Apartments | 0 | 0.0% |
| 5 to 9 Unit Apartments | 57 | 6.2% |
| 10 or more Apartments | 37 | 4.0% |
| Mobile Home / Other | 41 | 4.4% |
| Total | 921 | 100.0% |
Housing Structures by Occupancy in Freedom
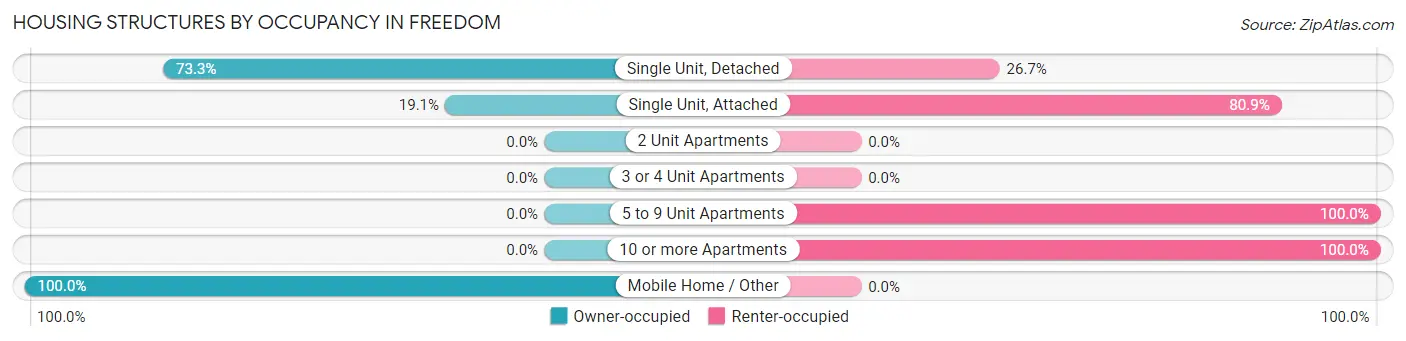
| Structure Type | Owner-occupied | Renter-occupied |
| Single Unit, Detached | 465 (73.3%) | 169 (26.7%) |
| Single Unit, Attached | 29 (19.1%) | 123 (80.9%) |
| 2 Unit Apartments | 0 (0.0%) | 0 (0.0%) |
| 3 or 4 Unit Apartments | 0 (0.0%) | 0 (0.0%) |
| 5 to 9 Unit Apartments | 0 (0.0%) | 57 (100.0%) |
| 10 or more Apartments | 0 (0.0%) | 37 (100.0%) |
| Mobile Home / Other | 41 (100.0%) | 0 (0.0%) |
| Total | 535 (58.1%) | 386 (41.9%) |
Housing Structures by Number of Rooms in Freedom
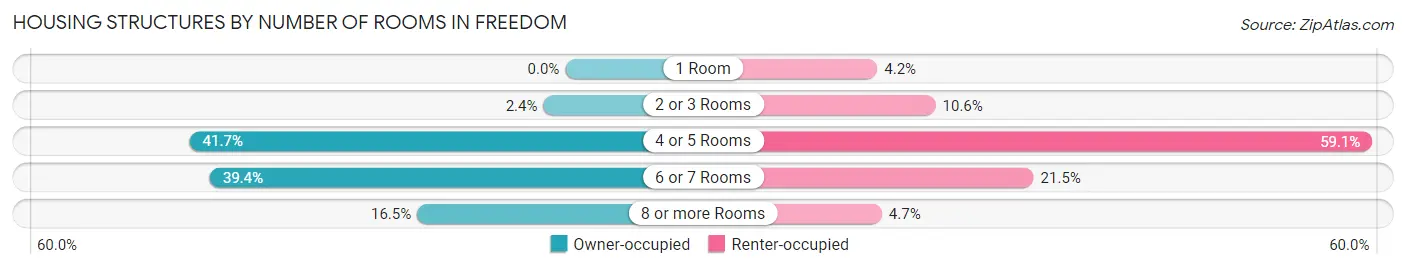
| Number of Rooms | Owner-occupied | Renter-occupied |
| 1 Room | 0 (0.0%) | 16 (4.2%) |
| 2 or 3 Rooms | 13 (2.4%) | 41 (10.6%) |
| 4 or 5 Rooms | 223 (41.7%) | 228 (59.1%) |
| 6 or 7 Rooms | 211 (39.4%) | 83 (21.5%) |
| 8 or more Rooms | 88 (16.5%) | 18 (4.7%) |
| Total | 535 (100.0%) | 386 (100.0%) |
Housing Structure by Heating Type in Freedom
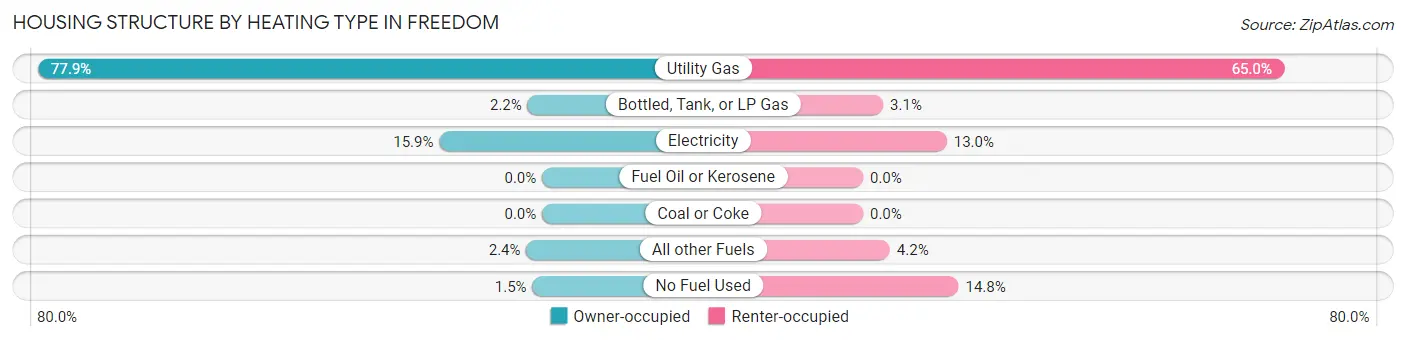
| Heating Type | Owner-occupied | Renter-occupied |
| Utility Gas | 417 (77.9%) | 251 (65.0%) |
| Bottled, Tank, or LP Gas | 12 (2.2%) | 12 (3.1%) |
| Electricity | 85 (15.9%) | 50 (13.0%) |
| Fuel Oil or Kerosene | 0 (0.0%) | 0 (0.0%) |
| Coal or Coke | 0 (0.0%) | 0 (0.0%) |
| All other Fuels | 13 (2.4%) | 16 (4.2%) |
| No Fuel Used | 8 (1.5%) | 57 (14.8%) |
| Total | 535 (100.0%) | 386 (100.0%) |
Household Vehicle Usage in Freedom
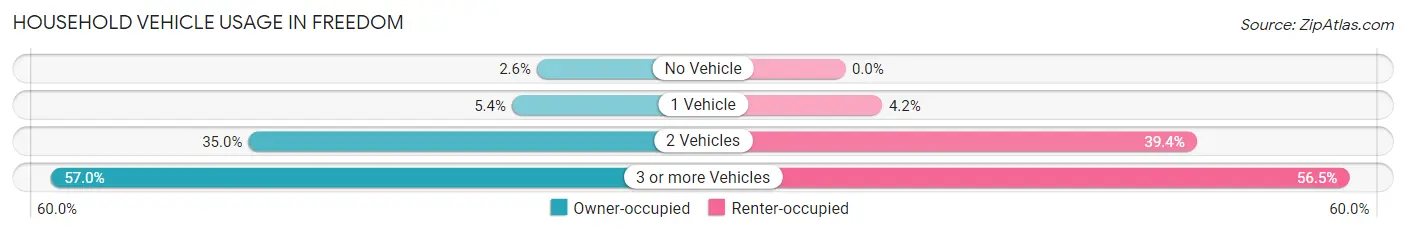
| Vehicles per Household | Owner-occupied | Renter-occupied |
| No Vehicle | 14 (2.6%) | 0 (0.0%) |
| 1 Vehicle | 29 (5.4%) | 16 (4.2%) |
| 2 Vehicles | 187 (34.9%) | 152 (39.4%) |
| 3 or more Vehicles | 305 (57.0%) | 218 (56.5%) |
| Total | 535 (100.0%) | 386 (100.0%) |
Real Estate & Mortgages in Freedom
Real Estate and Mortgage Overview in Freedom
| Characteristic | Without Mortgage | With Mortgage |
| Housing Units | 145 | 390 |
| Median Property Value | $631,900 | $656,500 |
| Median Household Income | - | - |
| Monthly Housing Costs | $493 | $104 |
| Real Estate Taxes | $1,930 | $6 |
Property Value by Mortgage Status in Freedom
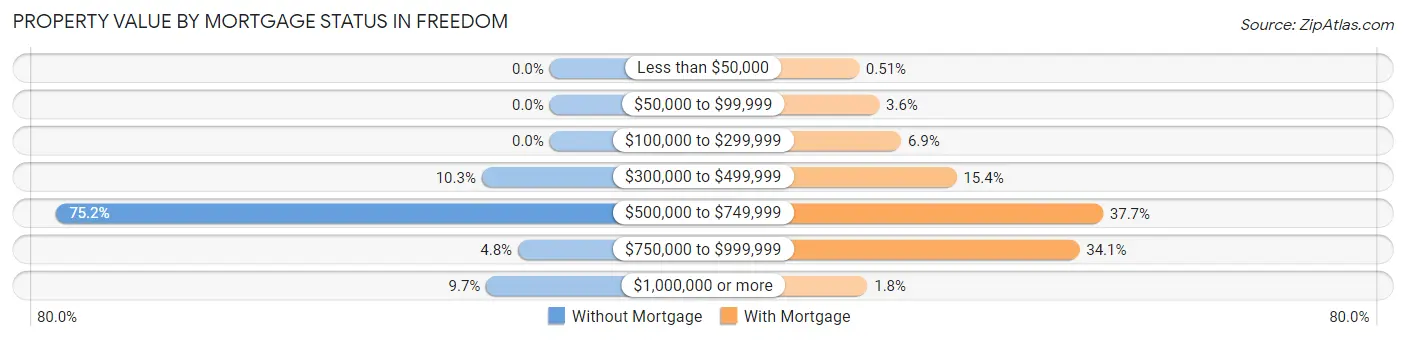
| Property Value | Without Mortgage | With Mortgage |
| Less than $50,000 | 0 (0.0%) | 2 (0.5%) |
| $50,000 to $99,999 | 0 (0.0%) | 14 (3.6%) |
| $100,000 to $299,999 | 0 (0.0%) | 27 (6.9%) |
| $300,000 to $499,999 | 15 (10.3%) | 60 (15.4%) |
| $500,000 to $749,999 | 109 (75.2%) | 147 (37.7%) |
| $750,000 to $999,999 | 7 (4.8%) | 133 (34.1%) |
| $1,000,000 or more | 14 (9.7%) | 7 (1.8%) |
| Total | 145 (100.0%) | 390 (100.0%) |
Household Income by Mortgage Status in Freedom
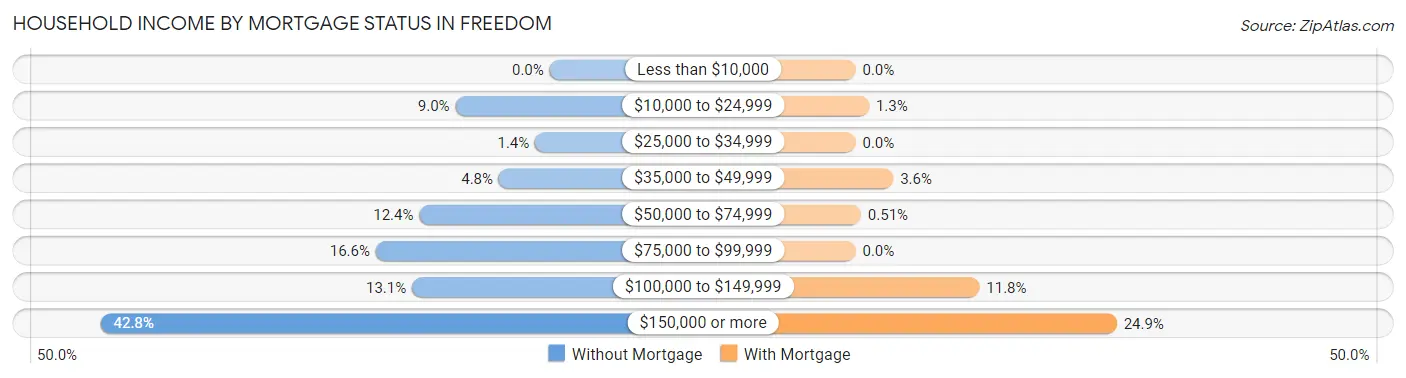
| Household Income | Without Mortgage | With Mortgage |
| Less than $10,000 | 0 (0.0%) | 0 (0.0%) |
| $10,000 to $24,999 | 13 (9.0%) | 5 (1.3%) |
| $25,000 to $34,999 | 2 (1.4%) | 0 (0.0%) |
| $35,000 to $49,999 | 7 (4.8%) | 14 (3.6%) |
| $50,000 to $74,999 | 18 (12.4%) | 2 (0.5%) |
| $75,000 to $99,999 | 24 (16.6%) | 0 (0.0%) |
| $100,000 to $149,999 | 19 (13.1%) | 46 (11.8%) |
| $150,000 or more | 62 (42.8%) | 97 (24.9%) |
| Total | 145 (100.0%) | 390 (100.0%) |
Property Value to Household Income Ratio in Freedom
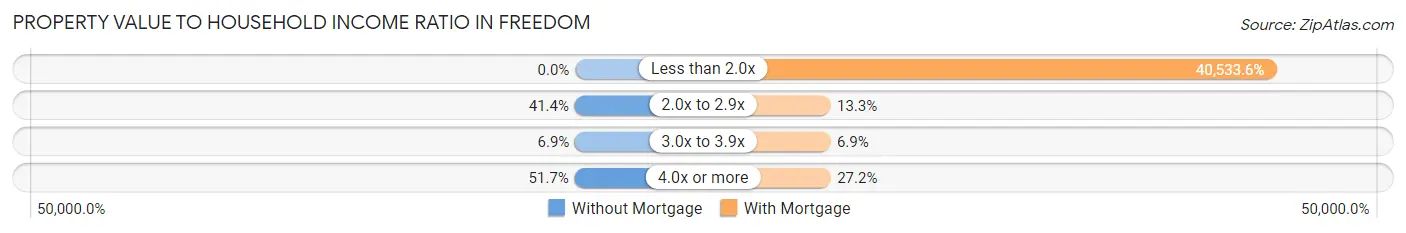
| Value-to-Income Ratio | Without Mortgage | With Mortgage |
| Less than 2.0x | 0 (0.0%) | 158,081 (40,533.6%) |
| 2.0x to 2.9x | 60 (41.4%) | 52 (13.3%) |
| 3.0x to 3.9x | 10 (6.9%) | 27 (6.9%) |
| 4.0x or more | 75 (51.7%) | 106 (27.2%) |
| Total | 145 (100.0%) | 390 (100.0%) |
Real Estate Taxes by Mortgage Status in Freedom
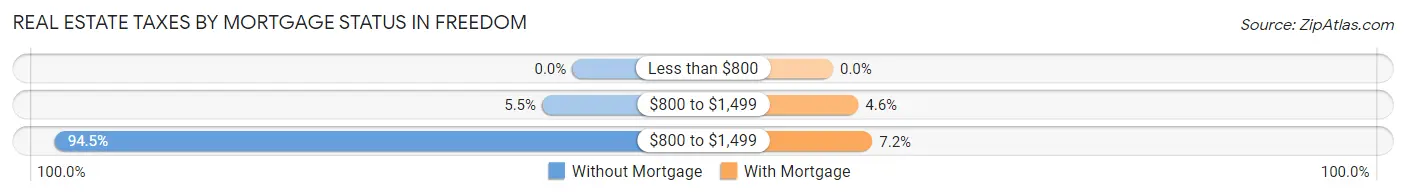
| Property Taxes | Without Mortgage | With Mortgage |
| Less than $800 | 0 (0.0%) | 0 (0.0%) |
| $800 to $1,499 | 8 (5.5%) | 18 (4.6%) |
| $800 to $1,499 | 137 (94.5%) | 28 (7.2%) |
| Total | 145 (100.0%) | 390 (100.0%) |
Health & Disability in Freedom
Health Insurance Coverage by Age in Freedom
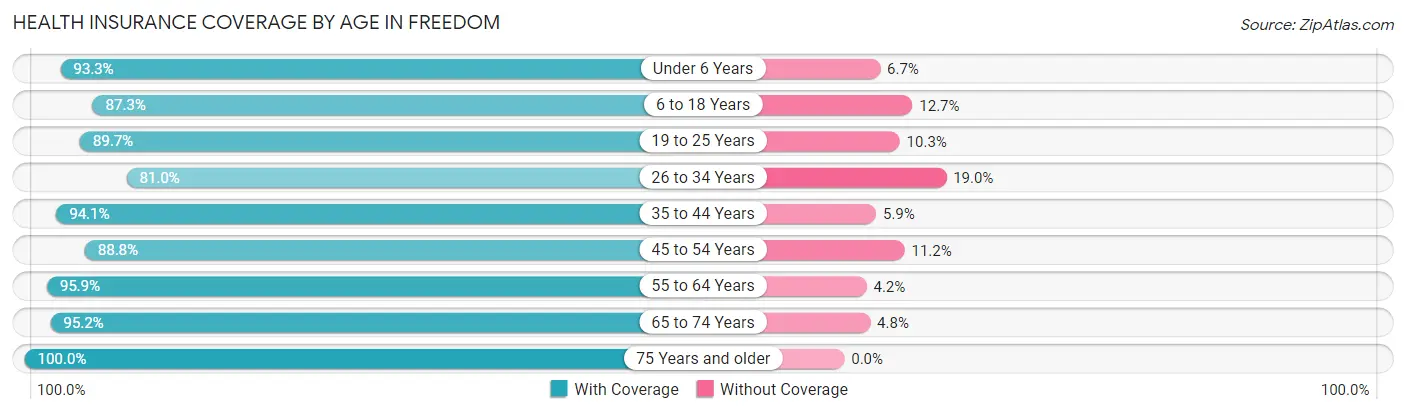
| Age Bracket | With Coverage | Without Coverage |
| Under 6 Years | 210 (93.3%) | 15 (6.7%) |
| 6 to 18 Years | 743 (87.3%) | 108 (12.7%) |
| 19 to 25 Years | 339 (89.7%) | 39 (10.3%) |
| 26 to 34 Years | 243 (81.0%) | 57 (19.0%) |
| 35 to 44 Years | 477 (94.1%) | 30 (5.9%) |
| 45 to 54 Years | 371 (88.8%) | 47 (11.2%) |
| 55 to 64 Years | 254 (95.9%) | 11 (4.2%) |
| 65 to 74 Years | 316 (95.2%) | 16 (4.8%) |
| 75 Years and older | 78 (100.0%) | 0 (0.0%) |
| Total | 3,031 (90.4%) | 323 (9.6%) |
Health Insurance Coverage by Citizenship Status in Freedom
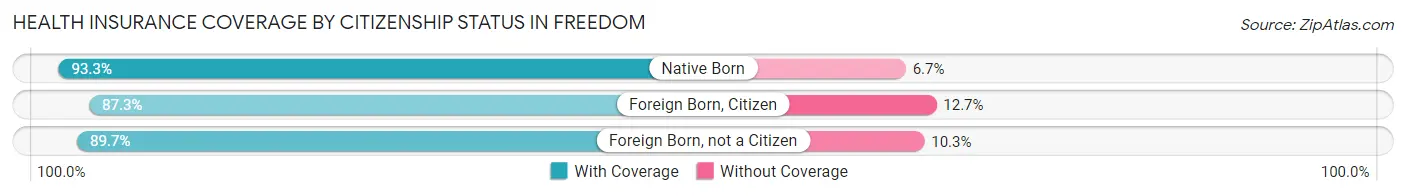
| Citizenship Status | With Coverage | Without Coverage |
| Native Born | 210 (93.3%) | 15 (6.7%) |
| Foreign Born, Citizen | 743 (87.3%) | 108 (12.7%) |
| Foreign Born, not a Citizen | 339 (89.7%) | 39 (10.3%) |
Health Insurance Coverage by Household Income in Freedom
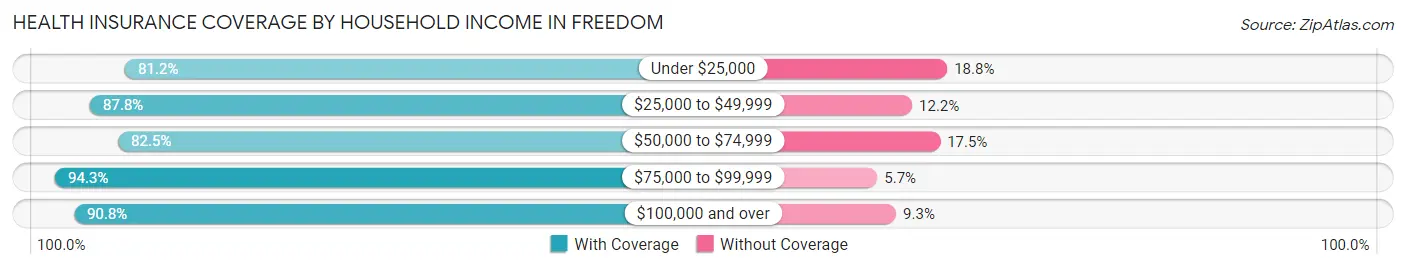
| Household Income | With Coverage | Without Coverage |
| Under $25,000 | 69 (81.2%) | 16 (18.8%) |
| $25,000 to $49,999 | 258 (87.8%) | 36 (12.2%) |
| $50,000 to $74,999 | 99 (82.5%) | 21 (17.5%) |
| $75,000 to $99,999 | 379 (94.3%) | 23 (5.7%) |
| $100,000 and over | 2,226 (90.7%) | 227 (9.2%) |
Public vs Private Health Insurance Coverage by Age in Freedom
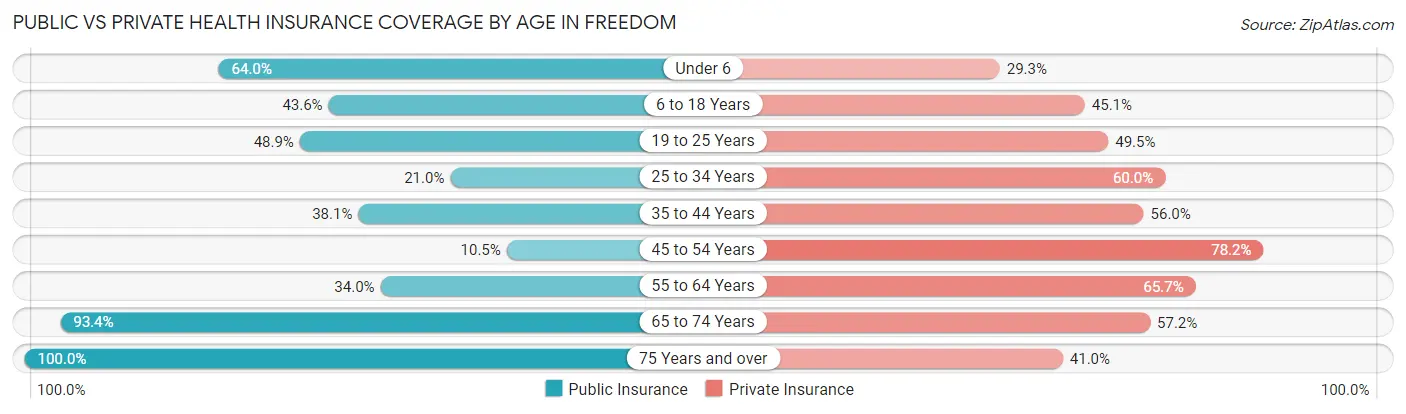
| Age Bracket | Public Insurance | Private Insurance |
| Under 6 | 144 (64.0%) | 66 (29.3%) |
| 6 to 18 Years | 371 (43.6%) | 384 (45.1%) |
| 19 to 25 Years | 185 (48.9%) | 187 (49.5%) |
| 25 to 34 Years | 63 (21.0%) | 180 (60.0%) |
| 35 to 44 Years | 193 (38.1%) | 284 (56.0%) |
| 45 to 54 Years | 44 (10.5%) | 327 (78.2%) |
| 55 to 64 Years | 90 (34.0%) | 174 (65.7%) |
| 65 to 74 Years | 310 (93.4%) | 190 (57.2%) |
| 75 Years and over | 78 (100.0%) | 32 (41.0%) |
| Total | 1,478 (44.1%) | 1,824 (54.4%) |
Disability Status by Sex by Age in Freedom
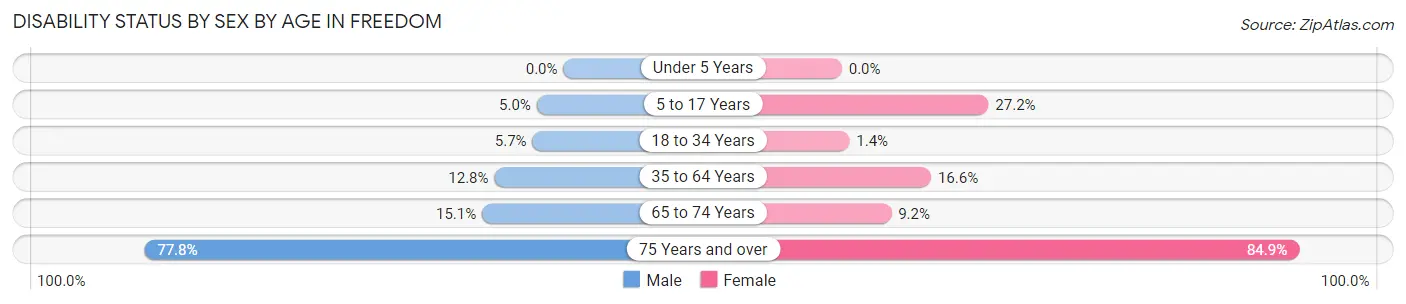
| Age Bracket | Male | Female |
| Under 5 Years | 0 (0.0%) | 0 (0.0%) |
| 5 to 17 Years | 27 (5.0%) | 74 (27.2%) |
| 18 to 34 Years | 14 (5.7%) | 7 (1.4%) |
| 35 to 64 Years | 82 (12.8%) | 91 (16.6%) |
| 65 to 74 Years | 32 (15.1%) | 11 (9.2%) |
| 75 Years and over | 35 (77.8%) | 28 (84.9%) |
Disability Class by Sex by Age in Freedom
Disability Class: Hearing Difficulty
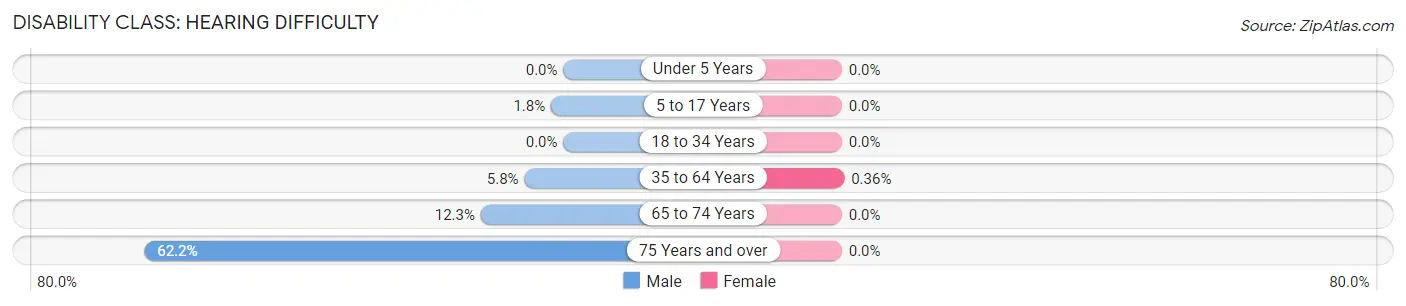
| Age Bracket | Male | Female |
| Under 5 Years | 0 (0.0%) | 0 (0.0%) |
| 5 to 17 Years | 10 (1.8%) | 0 (0.0%) |
| 18 to 34 Years | 0 (0.0%) | 0 (0.0%) |
| 35 to 64 Years | 37 (5.8%) | 2 (0.4%) |
| 65 to 74 Years | 26 (12.3%) | 0 (0.0%) |
| 75 Years and over | 28 (62.2%) | 0 (0.0%) |
Disability Class: Vision Difficulty
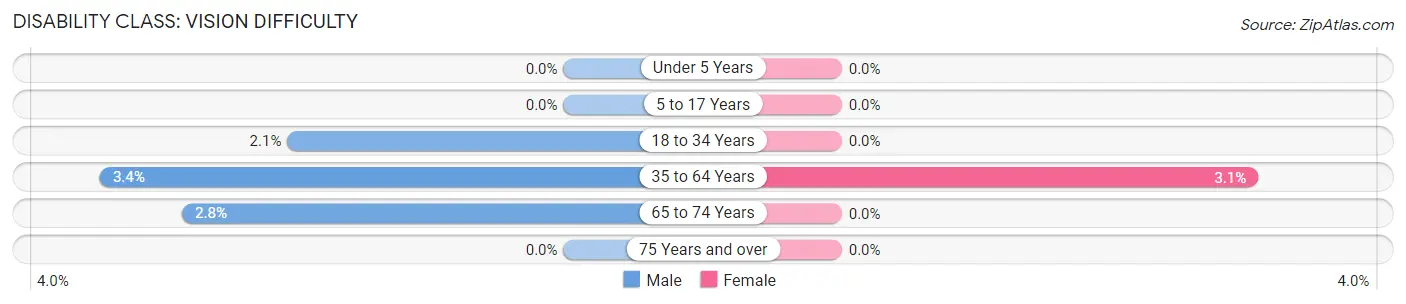
| Age Bracket | Male | Female |
| Under 5 Years | 0 (0.0%) | 0 (0.0%) |
| 5 to 17 Years | 0 (0.0%) | 0 (0.0%) |
| 18 to 34 Years | 5 (2.1%) | 0 (0.0%) |
| 35 to 64 Years | 22 (3.4%) | 17 (3.1%) |
| 65 to 74 Years | 6 (2.8%) | 0 (0.0%) |
| 75 Years and over | 0 (0.0%) | 0 (0.0%) |
Disability Class: Cognitive Difficulty
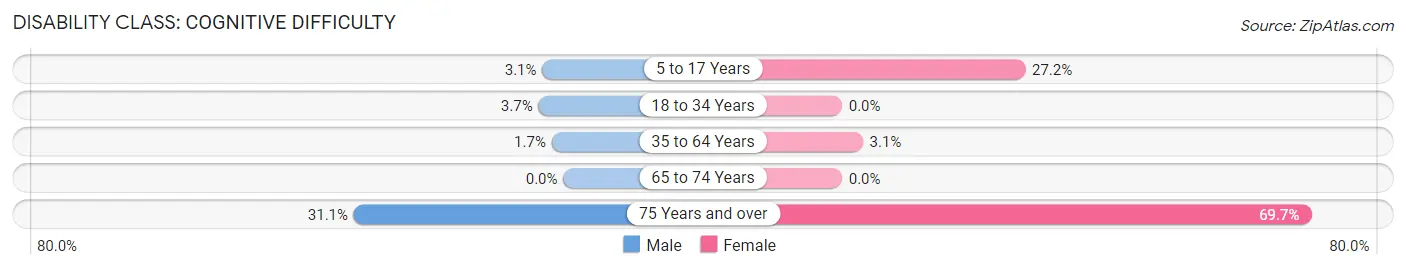
| Age Bracket | Male | Female |
| 5 to 17 Years | 17 (3.1%) | 74 (27.2%) |
| 18 to 34 Years | 9 (3.7%) | 0 (0.0%) |
| 35 to 64 Years | 11 (1.7%) | 17 (3.1%) |
| 65 to 74 Years | 0 (0.0%) | 0 (0.0%) |
| 75 Years and over | 14 (31.1%) | 23 (69.7%) |
Disability Class: Ambulatory Difficulty
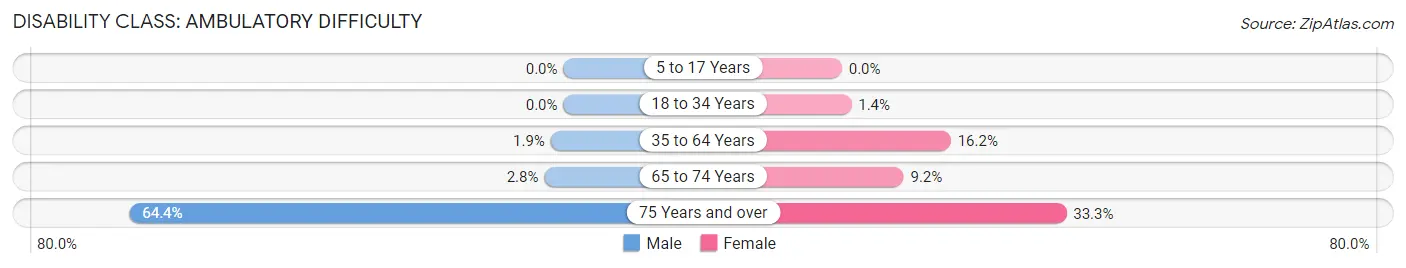
| Age Bracket | Male | Female |
| 5 to 17 Years | 0 (0.0%) | 0 (0.0%) |
| 18 to 34 Years | 0 (0.0%) | 7 (1.4%) |
| 35 to 64 Years | 12 (1.9%) | 89 (16.2%) |
| 65 to 74 Years | 6 (2.8%) | 11 (9.2%) |
| 75 Years and over | 29 (64.4%) | 11 (33.3%) |
Disability Class: Self-Care Difficulty
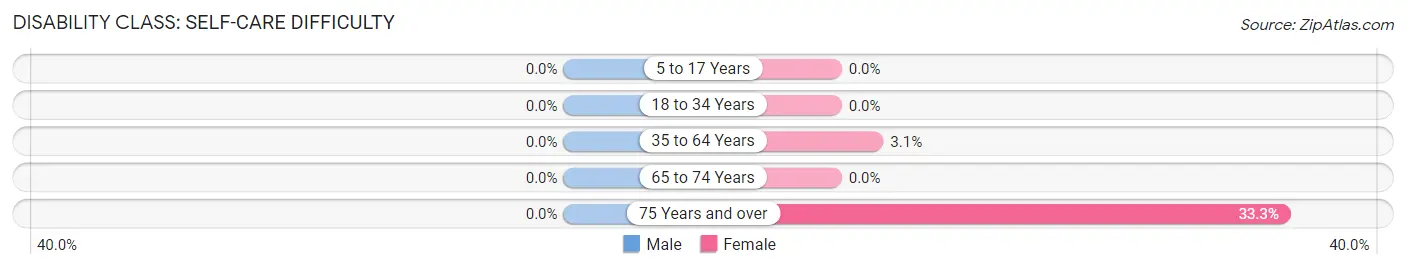
| Age Bracket | Male | Female |
| 5 to 17 Years | 0 (0.0%) | 0 (0.0%) |
| 18 to 34 Years | 0 (0.0%) | 0 (0.0%) |
| 35 to 64 Years | 0 (0.0%) | 17 (3.1%) |
| 65 to 74 Years | 0 (0.0%) | 0 (0.0%) |
| 75 Years and over | 0 (0.0%) | 11 (33.3%) |
Technology Access in Freedom
Computing Device Access in Freedom
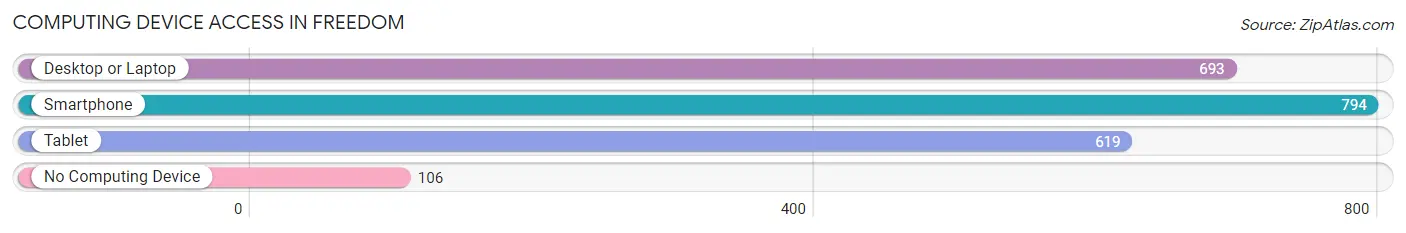
| Device Type | # Households | % Households |
| Desktop or Laptop | 693 | 75.2% |
| Smartphone | 794 | 86.2% |
| Tablet | 619 | 67.2% |
| No Computing Device | 106 | 11.5% |
| Total | 921 | 100.0% |
Internet Access in Freedom
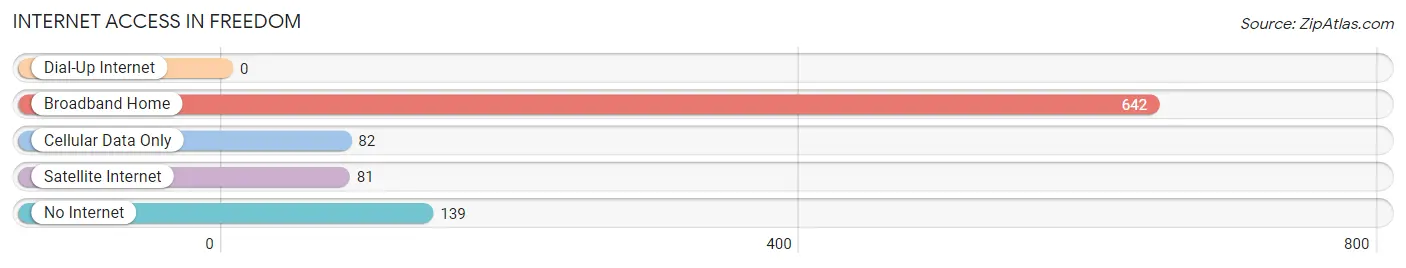
| Internet Type | # Households | % Households |
| Dial-Up Internet | 0 | 0.0% |
| Broadband Home | 642 | 69.7% |
| Cellular Data Only | 82 | 8.9% |
| Satellite Internet | 81 | 8.8% |
| No Internet | 139 | 15.1% |
| Total | 921 | 100.0% |
Freedom Summary
Freedom, California is a small unincorporated community located in Santa Cruz County, California. It is situated in the foothills of the Santa Cruz Mountains, approximately 8 miles south of the city of Santa Cruz. The population of Freedom was estimated to be 1,845 in the year 2000.
History
The area now known as Freedom was originally inhabited by the Ohlone people, who lived in the area for thousands of years before the arrival of Europeans. The first Europeans to settle in the area were Spanish missionaries, who established the Mission Santa Cruz in 1791. The mission was abandoned in 1834, and the land was divided into large ranchos.
In the late 19th century, the area was settled by farmers and ranchers, who grew crops such as wheat, barley, and oats. The town of Freedom was founded in 1887, and was named after the freedom of the settlers to own their own land.
Geography
Freedom is located in the foothills of the Santa Cruz Mountains, approximately 8 miles south of the city of Santa Cruz. The town is situated at an elevation of approximately 500 feet above sea level. The climate in Freedom is mild, with temperatures ranging from the mid-50s to the mid-70s throughout the year.
The town is surrounded by rolling hills and open space, and is home to a variety of wildlife, including deer, coyotes, and bobcats. The nearby San Lorenzo River provides a habitat for a variety of fish and other aquatic life.
Economy
The economy of Freedom is largely based on agriculture and tourism. The town is home to several wineries, and is a popular destination for wine tasting. The town is also home to several small businesses, including restaurants, shops, and art galleries.
Demographics
The population of Freedom was estimated to be 1,845 in the year 2000. The racial makeup of the town was 79.3% White, 0.7% African American, 0.3% Native American, 0.7% Asian, 0.1% Pacific Islander, 16.2% from other races, and 2.9% from two or more races. Hispanic or Latino of any race were 33.2% of the population.
The median household income in Freedom was $50,000 in 2000, and the median family income was $54,000. The per capita income for the town was $20,000. The unemployment rate in Freedom was 5.2% in 2000.
Common Questions
What is Per Capita Income in Freedom?
Per Capita income in Freedom is $37,348.
What is the Median Family Income in Freedom?
Median Family Income in Freedom is $116,087.
What is the Median Household income in Freedom?
Median Household Income in Freedom is $123,224.
What is Income or Wage Gap in Freedom?
Income or Wage Gap in Freedom is 32.8%.
Women in Freedom earn 67.2 cents for every dollar earned by a man.
What is Inequality or Gini Index in Freedom?
Inequality or Gini Index in Freedom is 0.35.
What is the Total Population of Freedom?
Total Population of Freedom is 3,360.
What is the Total Male Population of Freedom?
Total Male Population of Freedom is 1,791.
What is the Total Female Population of Freedom?
Total Female Population of Freedom is 1,569.
What is the Ratio of Males per 100 Females in Freedom?
There are 114.15 Males per 100 Females in Freedom.
What is the Ratio of Females per 100 Males in Freedom?
There are 87.60 Females per 100 Males in Freedom.
What is the Median Population Age in Freedom?
Median Population Age in Freedom is 34.3 Years.
What is the Average Family Size in Freedom
Average Family Size in Freedom is 3.8 People.
What is the Average Household Size in Freedom
Average Household Size in Freedom is 3.6 People.
How Large is the Labor Force in Freedom?
There are 1,758 People in the Labor Forcein in Freedom.
What is the Percentage of People in the Labor Force in Freedom?
72.0% of People are in the Labor Force in Freedom.
What is the Unemployment Rate in Freedom?
Unemployment Rate in Freedom is 9.8%.