West Wareham, MA Map & Demographics
West Wareham Map
West Wareham Overview
$32,046
PER CAPITA INCOME
$53,967
AVG FAMILY INCOME
$52,771
AVG HOUSEHOLD INCOME
32.4%
WAGE / INCOME GAP [ % ]
67.6¢/ $1
WAGE / INCOME GAP [ $ ]
0.49
INEQUALITY / GINI INDEX
2,605
TOTAL POPULATION
1,029
MALE POPULATION
1,576
FEMALE POPULATION
65.29
MALES / 100 FEMALES
153.16
FEMALES / 100 MALES
58.4
MEDIAN AGE
2.5
AVG FAMILY SIZE
2.2
AVG HOUSEHOLD SIZE
1,162
LABOR FORCE [ PEOPLE ]
52.7%
PERCENT IN LABOR FORCE
5.6%
UNEMPLOYMENT RATE
West Wareham Zip Codes
Income in West Wareham
Income Overview in West Wareham
Per Capita Income in West Wareham is $32,046, while median incomes of families and households are $53,967 and $52,771 respectively.
| Characteristic | Number | Measure |
| Per Capita Income | 2,605 | $32,046 |
| Median Family Income | 839 | $53,967 |
| Mean Family Income | 839 | $79,289 |
| Median Household Income | 1,198 | $52,771 |
| Mean Household Income | 1,198 | $69,552 |
| Income Deficit | 839 | $0 |
| Wage / Income Gap (%) | 2,605 | 32.41% |
| Wage / Income Gap ($) | 2,605 | 67.59¢ per $1 |
| Gini / Inequality Index | 2,605 | 0.49 |
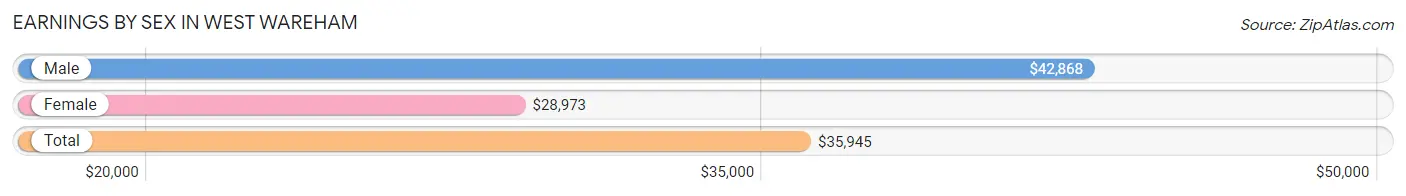
Earnings by Sex in West Wareham
Average Earnings in West Wareham are $35,945, $42,868 for men and $28,973 for women, a difference of 32.4%.
| Sex | Number | Average Earnings |
| Male | 495 (41.4%) | $42,868 |
| Female | 701 (58.6%) | $28,973 |
| Total | 1,196 (100.0%) | $35,945 |
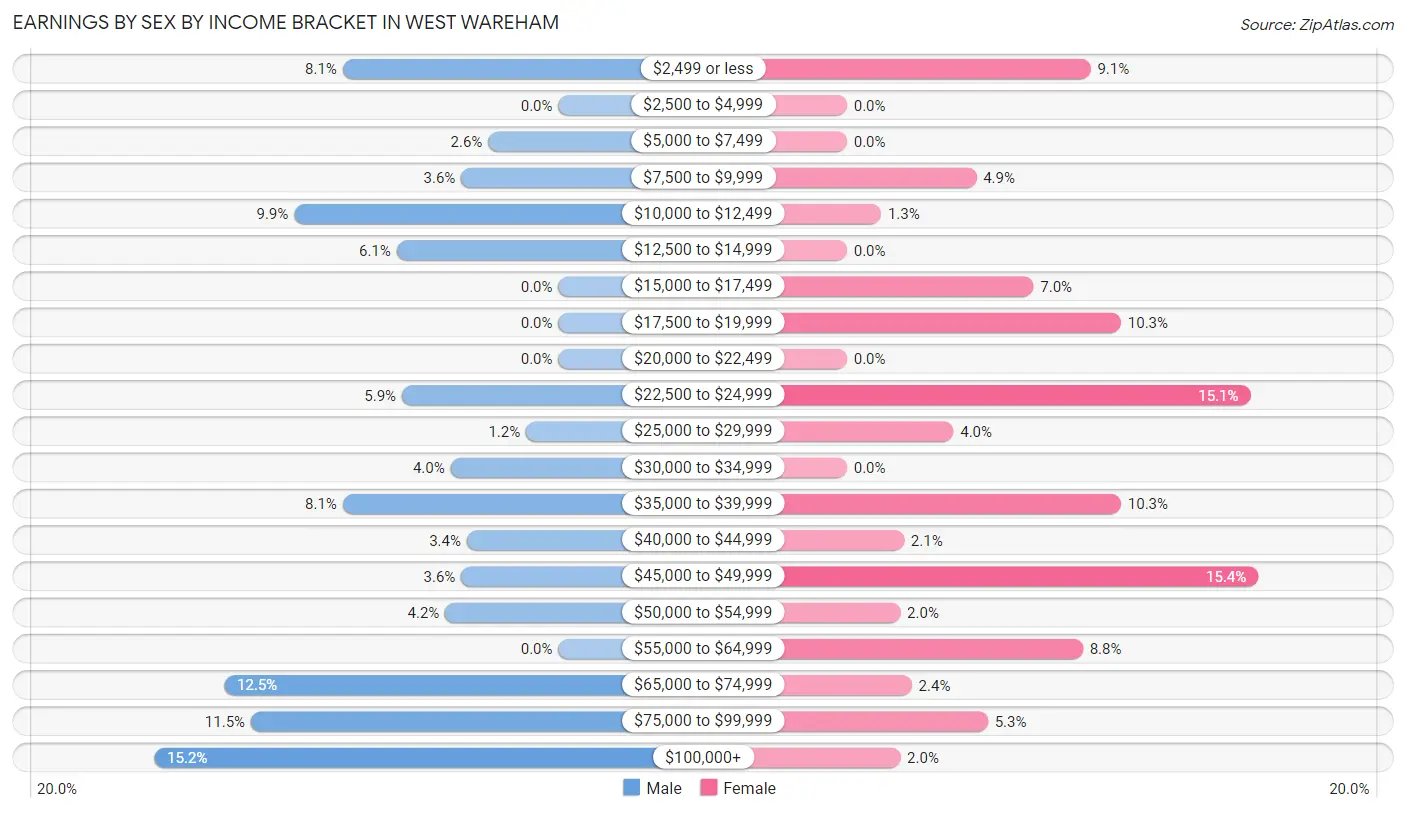
Earnings by Sex by Income Bracket in West Wareham
The most common earnings brackets in West Wareham are $100,000+ for men (75 | 15.1%) and $45,000 to $49,999 for women (108 | 15.4%).
| Income | Male | Female |
| $2,499 or less | 40 (8.1%) | 64 (9.1%) |
| $2,500 to $4,999 | 0 (0.0%) | 0 (0.0%) |
| $5,000 to $7,499 | 13 (2.6%) | 0 (0.0%) |
| $7,500 to $9,999 | 18 (3.6%) | 34 (4.9%) |
| $10,000 to $12,499 | 49 (9.9%) | 9 (1.3%) |
| $12,500 to $14,999 | 30 (6.1%) | 0 (0.0%) |
| $15,000 to $17,499 | 0 (0.0%) | 49 (7.0%) |
| $17,500 to $19,999 | 0 (0.0%) | 72 (10.3%) |
| $20,000 to $22,499 | 0 (0.0%) | 0 (0.0%) |
| $22,500 to $24,999 | 29 (5.9%) | 106 (15.1%) |
| $25,000 to $29,999 | 6 (1.2%) | 28 (4.0%) |
| $30,000 to $34,999 | 20 (4.0%) | 0 (0.0%) |
| $35,000 to $39,999 | 40 (8.1%) | 72 (10.3%) |
| $40,000 to $44,999 | 17 (3.4%) | 15 (2.1%) |
| $45,000 to $49,999 | 18 (3.6%) | 108 (15.4%) |
| $50,000 to $54,999 | 21 (4.2%) | 14 (2.0%) |
| $55,000 to $64,999 | 0 (0.0%) | 62 (8.8%) |
| $65,000 to $74,999 | 62 (12.5%) | 17 (2.4%) |
| $75,000 to $99,999 | 57 (11.5%) | 37 (5.3%) |
| $100,000+ | 75 (15.1%) | 14 (2.0%) |
| Total | 495 (100.0%) | 701 (100.0%) |
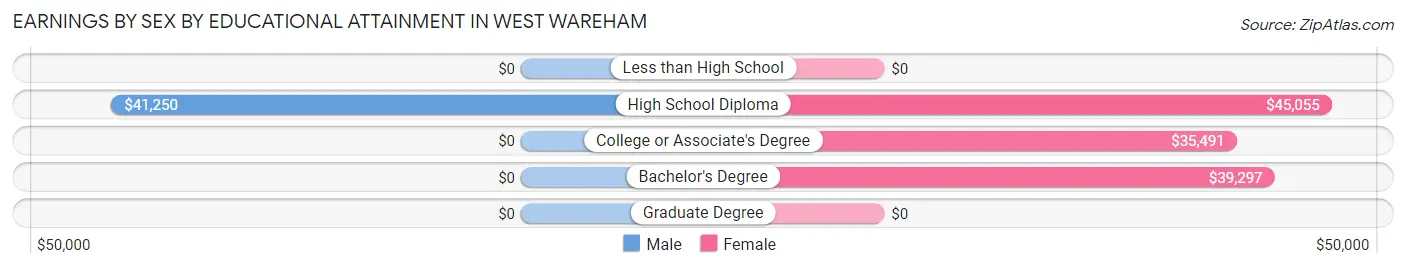
Earnings by Sex by Educational Attainment in West Wareham
Average earnings in West Wareham are $45,625 for men and $35,603 for women, a difference of 22.0%. Men with an educational attainment of high school diploma enjoy the highest average annual earnings of $41,250, while those with high school diploma education earn the least with $41,250. Women with an educational attainment of high school diploma earn the most with the average annual earnings of $45,055, while those with college or associate's degree education have the smallest earnings of $35,491.
| Educational Attainment | Male Income | Female Income |
| Less than High School | - | - |
| High School Diploma | $41,250 | $45,055 |
| College or Associate's Degree | - | - |
| Bachelor's Degree | - | - |
| Graduate Degree | - | - |
| Total | $45,625 | $35,603 |
Family Income in West Wareham
Family Income Brackets in West Wareham
According to the West Wareham family income data, there are 276 families falling into the $50,000 to $74,999 income range, which is the most common income bracket and makes up 32.9% of all families.
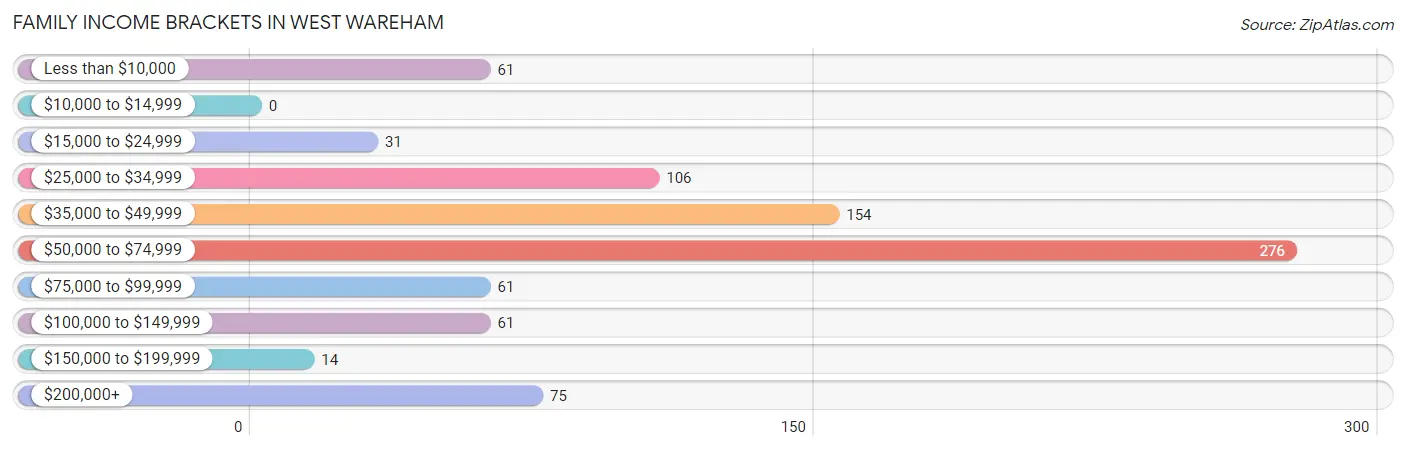
| Income Bracket | # Families | % Families |
| Less than $10,000 | 61 | 7.3% |
| $10,000 to $14,999 | 0 | 0.0% |
| $15,000 to $24,999 | 31 | 3.7% |
| $25,000 to $34,999 | 106 | 12.6% |
| $35,000 to $49,999 | 154 | 18.4% |
| $50,000 to $74,999 | 276 | 32.9% |
| $75,000 to $99,999 | 61 | 7.3% |
| $100,000 to $149,999 | 61 | 7.3% |
| $150,000 to $199,999 | 14 | 1.7% |
| $200,000+ | 75 | 8.9% |
Family Income by Famaliy Size in West Wareham
4-person families (81 | 9.7%) account for the highest median family income in West Wareham with $250,001 per family, while 4-person families (81 | 9.7%) have the highest median income of $62,500 per family member.
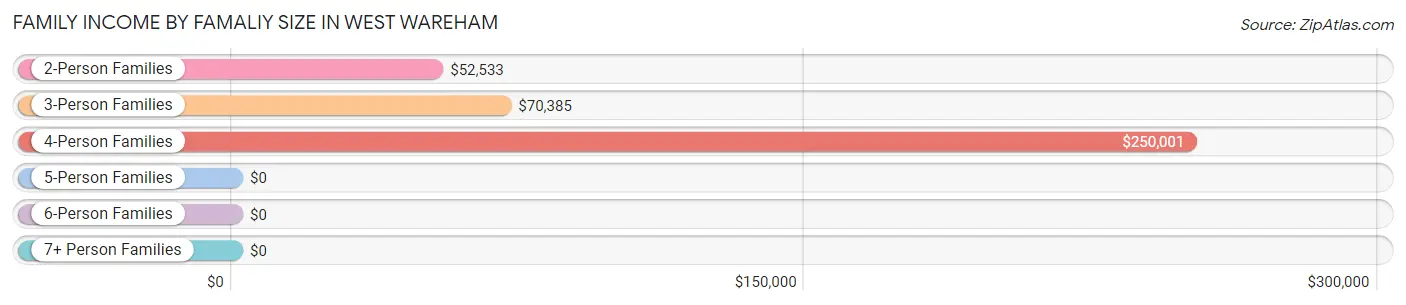
| Income Bracket | # Families | Median Income |
| 2-Person Families | 569 (67.8%) | $52,533 |
| 3-Person Families | 154 (18.4%) | $70,385 |
| 4-Person Families | 81 (9.7%) | $250,001 |
| 5-Person Families | 35 (4.2%) | $0 |
| 6-Person Families | 0 (0.0%) | $0 |
| 7+ Person Families | 0 (0.0%) | $0 |
| Total | 839 (100.0%) | $53,967 |
Family Income by Number of Earners in West Wareham
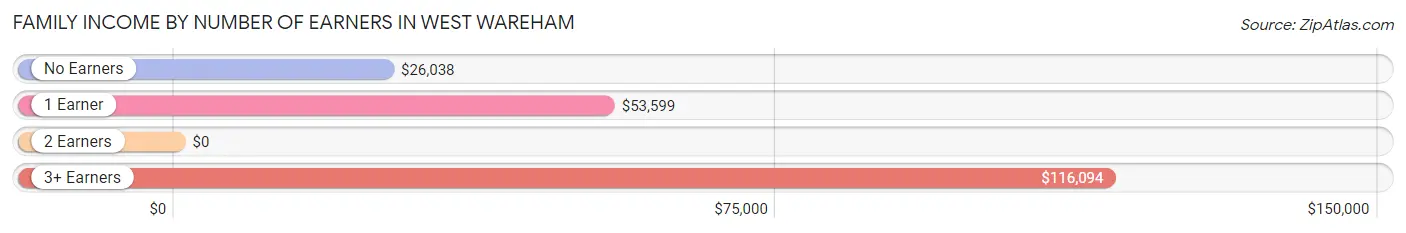
| Number of Earners | # Families | Median Income |
| No Earners | 172 (20.5%) | $26,038 |
| 1 Earner | 452 (53.9%) | $53,599 |
| 2 Earners | 178 (21.2%) | $0 |
| 3+ Earners | 37 (4.4%) | $116,094 |
| Total | 839 (100.0%) | $53,967 |
Household Income in West Wareham
Household Income Brackets in West Wareham
With 352 households falling in the category, the $50,000 to $74,999 income range is the most frequent in West Wareham, accounting for 29.4% of all households. In contrast, only 14 households (1.2%) fall into the $150,000 to $199,999 income bracket, making it the least populous group.
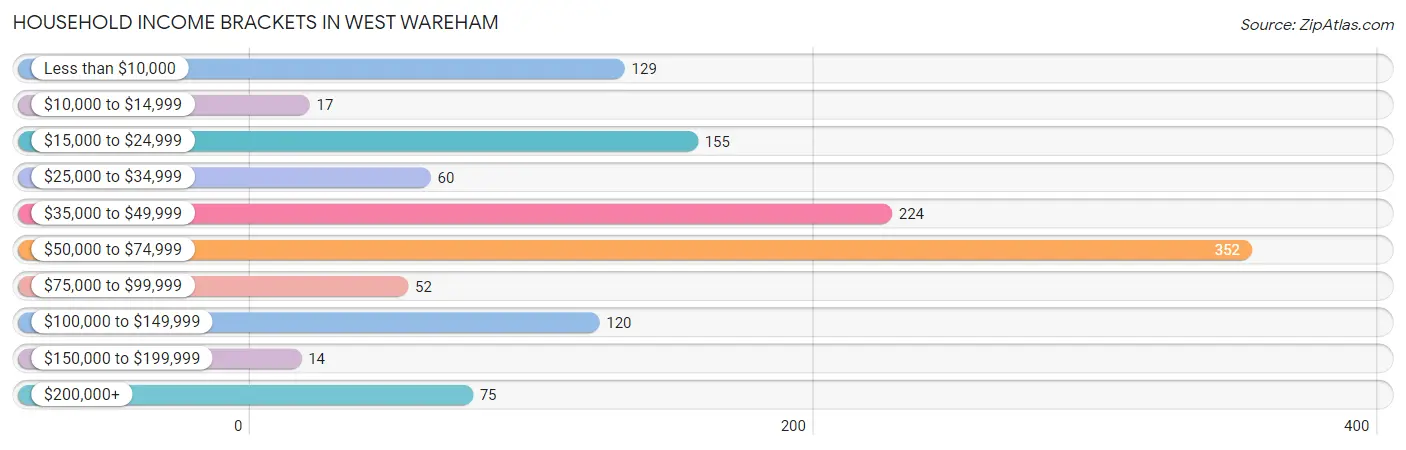
| Income Bracket | # Households | % Households |
| Less than $10,000 | 129 | 10.8% |
| $10,000 to $14,999 | 17 | 1.4% |
| $15,000 to $24,999 | 155 | 12.9% |
| $25,000 to $34,999 | 60 | 5.0% |
| $35,000 to $49,999 | 224 | 18.7% |
| $50,000 to $74,999 | 352 | 29.4% |
| $75,000 to $99,999 | 52 | 4.3% |
| $100,000 to $149,999 | 120 | 10.0% |
| $150,000 to $199,999 | 14 | 1.2% |
| $200,000+ | 75 | 6.3% |
Household Income by Householder Age in West Wareham
The median household income in West Wareham is $52,771, with the highest median household income of $54,794 found in the 25 to 44 years age bracket for the primary householder. A total of 249 households (20.8%) fall into this category.
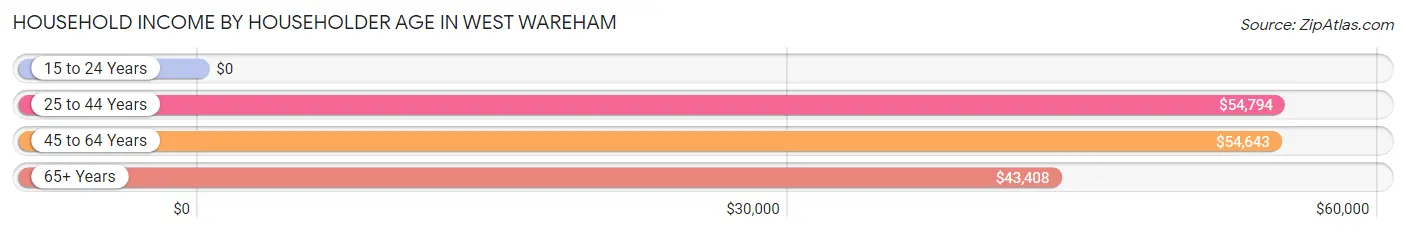
| Income Bracket | # Households | Median Income |
| 15 to 24 Years | 0 (0.0%) | $0 |
| 25 to 44 Years | 249 (20.8%) | $54,794 |
| 45 to 64 Years | 462 (38.6%) | $54,643 |
| 65+ Years | 487 (40.6%) | $43,408 |
| Total | 1,198 (100.0%) | $52,771 |
Poverty in West Wareham
Income Below Poverty by Sex and Age in West Wareham
With 6.9% poverty level for males and 13.0% for females among the residents of West Wareham, 15 year old males and under 5 year old females are the most vulnerable to poverty, with 20 males (100.0%) and 10 females (100.0%) in their respective age groups living below the poverty level.
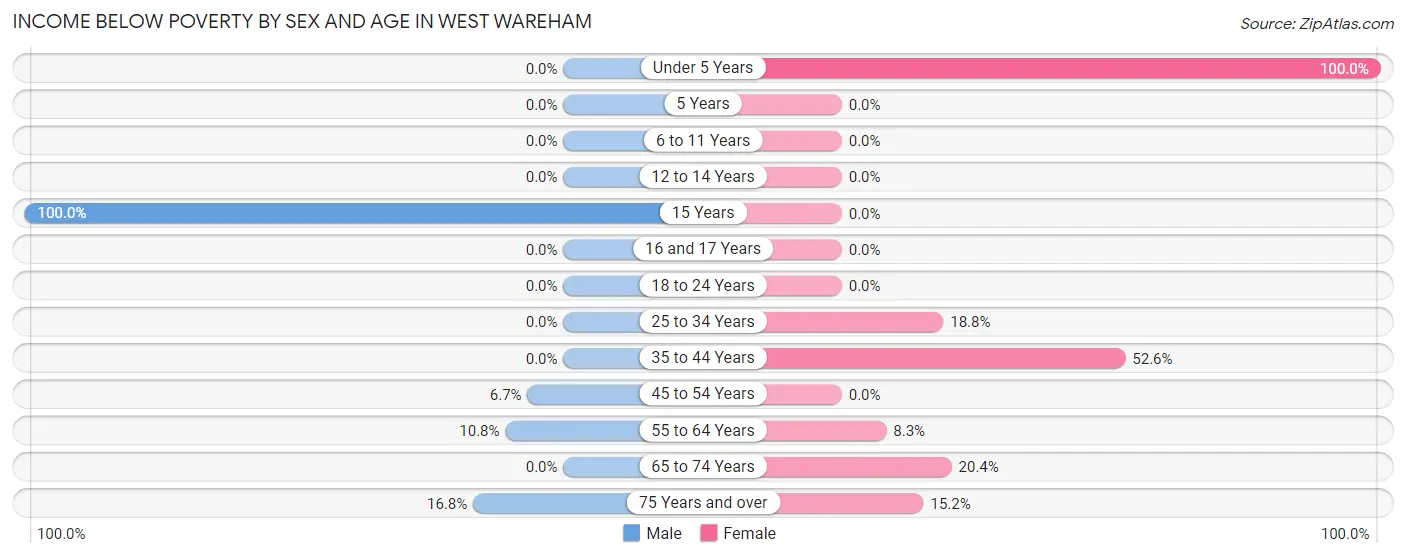
| Age Bracket | Male | Female |
| Under 5 Years | 0 (0.0%) | 10 (100.0%) |
| 5 Years | 0 (0.0%) | 0 (0.0%) |
| 6 to 11 Years | 0 (0.0%) | 0 (0.0%) |
| 12 to 14 Years | 0 (0.0%) | 0 (0.0%) |
| 15 Years | 20 (100.0%) | 0 (0.0%) |
| 16 and 17 Years | 0 (0.0%) | 0 (0.0%) |
| 18 to 24 Years | 0 (0.0%) | 0 (0.0%) |
| 25 to 34 Years | 0 (0.0%) | 55 (18.8%) |
| 35 to 44 Years | 0 (0.0%) | 20 (52.6%) |
| 45 to 54 Years | 2 (6.7%) | 0 (0.0%) |
| 55 to 64 Years | 17 (10.8%) | 31 (8.3%) |
| 65 to 74 Years | 0 (0.0%) | 43 (20.4%) |
| 75 Years and over | 32 (16.8%) | 46 (15.2%) |
| Total | 71 (6.9%) | 205 (13.0%) |
Income Above Poverty by Sex and Age in West Wareham
According to the poverty statistics in West Wareham, males aged under 5 years and females aged 6 to 11 years are the age groups that are most secure financially, with 100.0% of males and 100.0% of females in these age groups living above the poverty line.
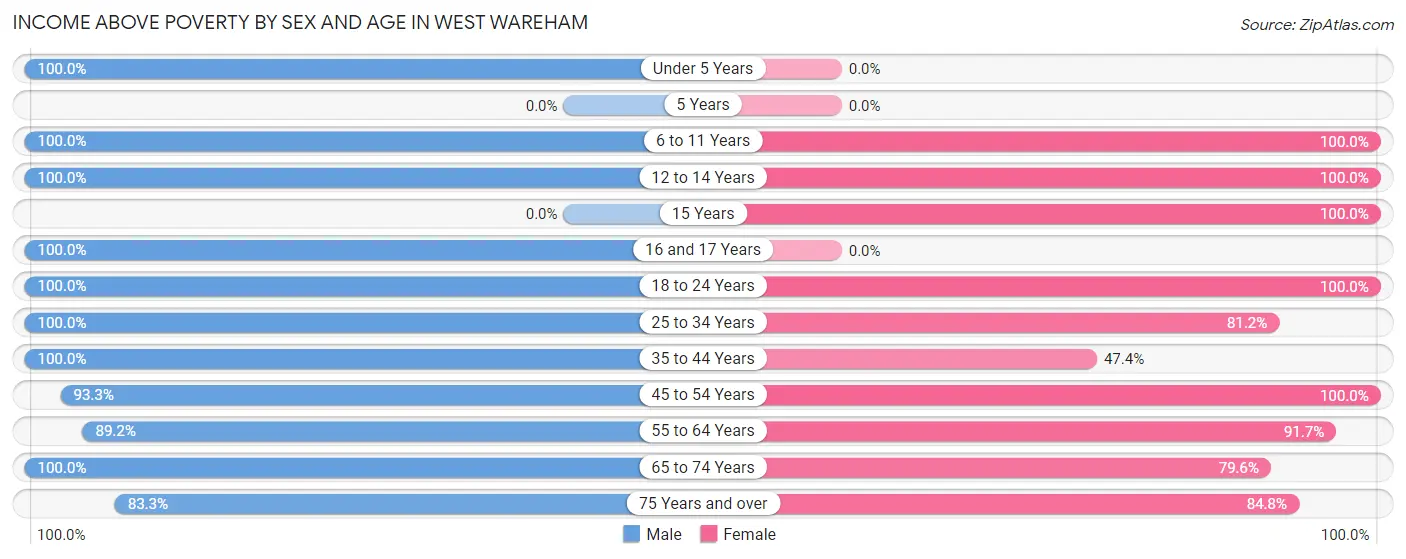
| Age Bracket | Male | Female |
| Under 5 Years | 9 (100.0%) | 0 (0.0%) |
| 5 Years | 0 (0.0%) | 0 (0.0%) |
| 6 to 11 Years | 82 (100.0%) | 129 (100.0%) |
| 12 to 14 Years | 77 (100.0%) | 6 (100.0%) |
| 15 Years | 0 (0.0%) | 67 (100.0%) |
| 16 and 17 Years | 13 (100.0%) | 0 (0.0%) |
| 18 to 24 Years | 25 (100.0%) | 50 (100.0%) |
| 25 to 34 Years | 184 (100.0%) | 237 (81.2%) |
| 35 to 44 Years | 69 (100.0%) | 18 (47.4%) |
| 45 to 54 Years | 28 (93.3%) | 95 (100.0%) |
| 55 to 64 Years | 141 (89.2%) | 344 (91.7%) |
| 65 to 74 Years | 171 (100.0%) | 168 (79.6%) |
| 75 Years and over | 159 (83.3%) | 257 (84.8%) |
| Total | 958 (93.1%) | 1,371 (87.0%) |
Income Below Poverty Among Married-Couple Families in West Wareham
The poverty statistics for married-couple families in West Wareham show that 8.0% or 32 of the total 401 families live below the poverty line. Families with no children have the highest poverty rate of 8.6%, comprising of 32 families. On the other hand, families with 1 or 2 children have the lowest poverty rate of 0.0%, which includes 0 families.
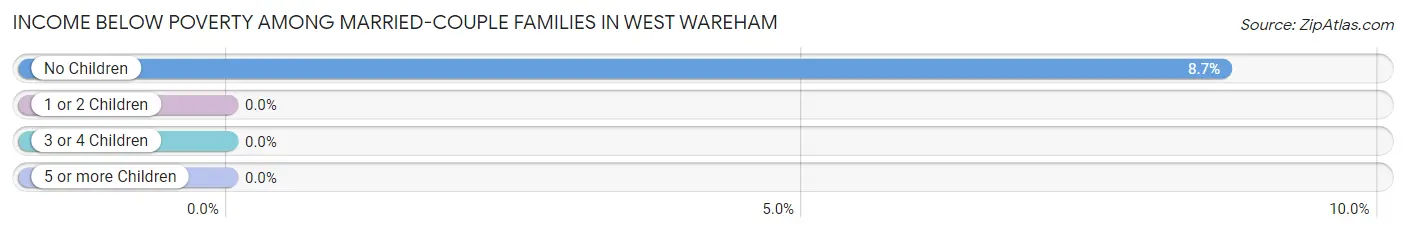
| Children | Above Poverty | Below Poverty |
| No Children | 338 (91.3%) | 32 (8.6%) |
| 1 or 2 Children | 31 (100.0%) | 0 (0.0%) |
| 3 or 4 Children | 0 (0.0%) | 0 (0.0%) |
| 5 or more Children | 0 (0.0%) | 0 (0.0%) |
| Total | 369 (92.0%) | 32 (8.0%) |
Income Below Poverty Among Single-Parent Households in West Wareham
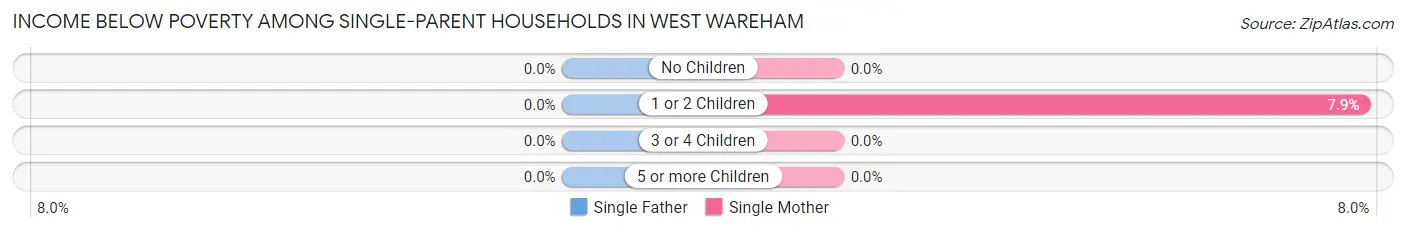
| Children | Single Father | Single Mother |
| No Children | 0 (0.0%) | 0 (0.0%) |
| 1 or 2 Children | 0 (0.0%) | 29 (7.9%) |
| 3 or 4 Children | 0 (0.0%) | 0 (0.0%) |
| 5 or more Children | 0 (0.0%) | 0 (0.0%) |
| Total | 0 (0.0%) | 29 (6.6%) |
Income Below Poverty Among Married-Couple vs Single-Parent Households in West Wareham
The poverty data for West Wareham shows that 32 of the married-couple family households (8.0%) and 29 of the single-parent households (6.6%) are living below the poverty level. Within the married-couple family households, those with no children have the highest poverty rate, with 32 households (8.6%) falling below the poverty line. Among the single-parent households, those with 1 or 2 children have the highest poverty rate, with 29 household (7.9%) living below poverty.
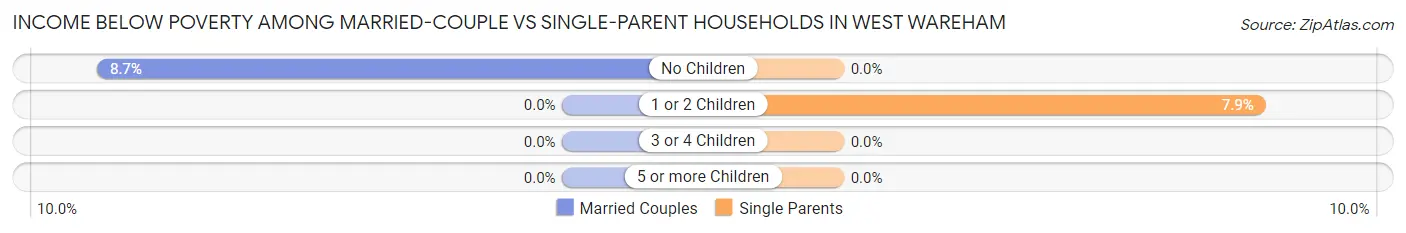
| Children | Married-Couple Families | Single-Parent Households |
| No Children | 32 (8.6%) | 0 (0.0%) |
| 1 or 2 Children | 0 (0.0%) | 29 (7.9%) |
| 3 or 4 Children | 0 (0.0%) | 0 (0.0%) |
| 5 or more Children | 0 (0.0%) | 0 (0.0%) |
| Total | 32 (8.0%) | 29 (6.6%) |
Race in West Wareham
The most populous races in West Wareham are White / Caucasian (2,167 | 83.2%), Two or more Races (280 | 10.7%), and Black / African American (96 | 3.7%).
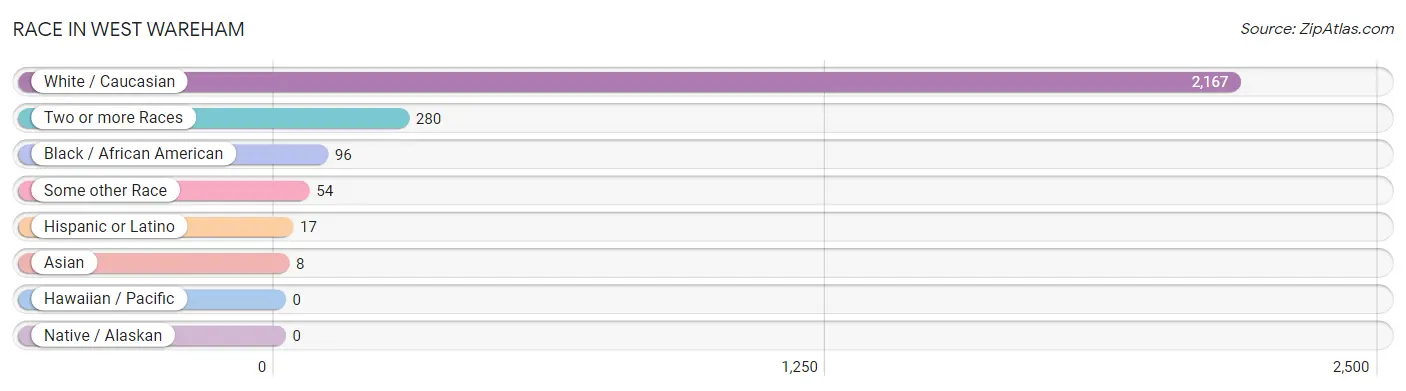
| Race | # Population | % Population |
| Asian | 8 | 0.3% |
| Black / African American | 96 | 3.7% |
| Hawaiian / Pacific | 0 | 0.0% |
| Hispanic or Latino | 17 | 0.6% |
| Native / Alaskan | 0 | 0.0% |
| White / Caucasian | 2,167 | 83.2% |
| Two or more Races | 280 | 10.7% |
| Some other Race | 54 | 2.1% |
| Total | 2,605 | 100.0% |
Ancestry in West Wareham
The most populous ancestries reported in West Wareham are English (486 | 18.7%), Irish (479 | 18.4%), French (267 | 10.2%), Cape Verdean (234 | 9.0%), and Subsaharan African (234 | 9.0%), together accounting for 65.3% of all West Wareham residents.
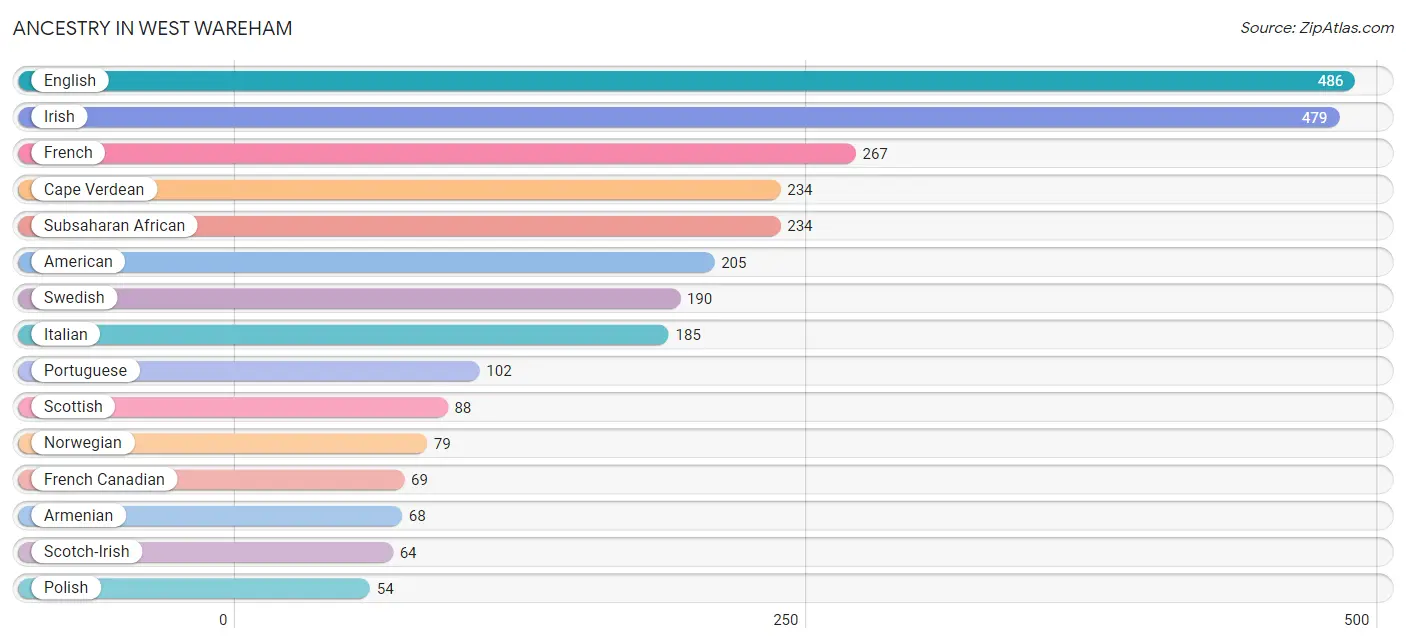
| Ancestry | # Population | % Population |
| American | 205 | 7.9% |
| Armenian | 68 | 2.6% |
| Blackfeet | 13 | 0.5% |
| Cape Verdean | 234 | 9.0% |
| English | 486 | 18.7% |
| European | 28 | 1.1% |
| French | 267 | 10.2% |
| French Canadian | 69 | 2.6% |
| German | 44 | 1.7% |
| Irish | 479 | 18.4% |
| Italian | 185 | 7.1% |
| Laotian | 19 | 0.7% |
| Norwegian | 79 | 3.0% |
| Polish | 54 | 2.1% |
| Portuguese | 102 | 3.9% |
| Puerto Rican | 17 | 0.6% |
| Russian | 18 | 0.7% |
| Scotch-Irish | 64 | 2.5% |
| Scottish | 88 | 3.4% |
| Subsaharan African | 234 | 9.0% |
| Swedish | 190 | 7.3% |
| Welsh | 17 | 0.6% | View All 22 Rows |
Immigrants in West Wareham
The most numerous immigrant groups reported in West Wareham came from Europe (73 | 2.8%), Portugal (55 | 2.1%), Southern Europe (55 | 2.1%), Northern Europe (18 | 0.7%), and Azores (14 | 0.5%), together accounting for 8.3% of all West Wareham residents.
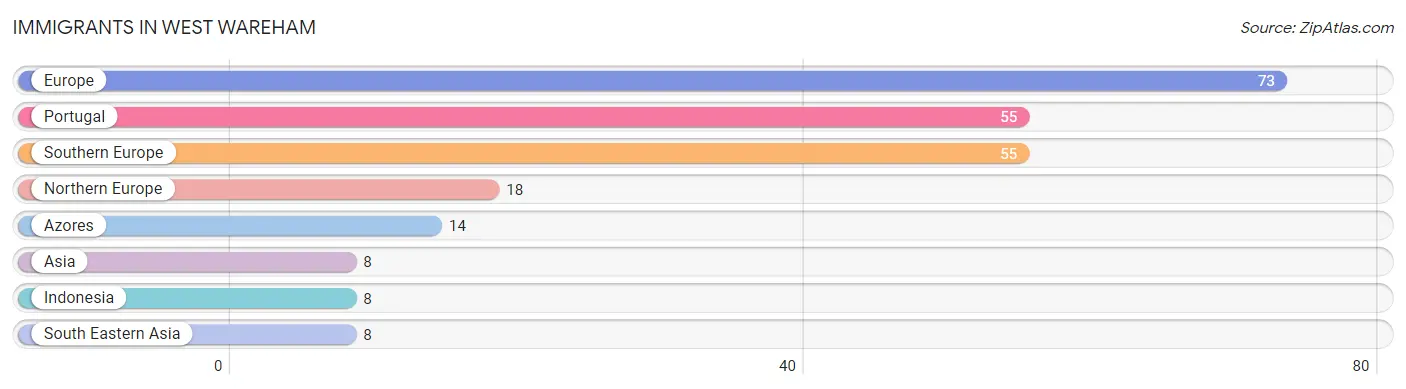
| Immigration Origin | # Population | % Population |
| Asia | 8 | 0.3% |
| Azores | 14 | 0.5% |
| Europe | 73 | 2.8% |
| Indonesia | 8 | 0.3% |
| Northern Europe | 18 | 0.7% |
| Portugal | 55 | 2.1% |
| South Eastern Asia | 8 | 0.3% |
| Southern Europe | 55 | 2.1% | View All 8 Rows |
Sex and Age in West Wareham
Sex and Age in West Wareham
The most populous age groups in West Wareham are 65 to 69 Years (113 | 11.0%) for men and 60 to 64 Years (241 | 15.3%) for women.
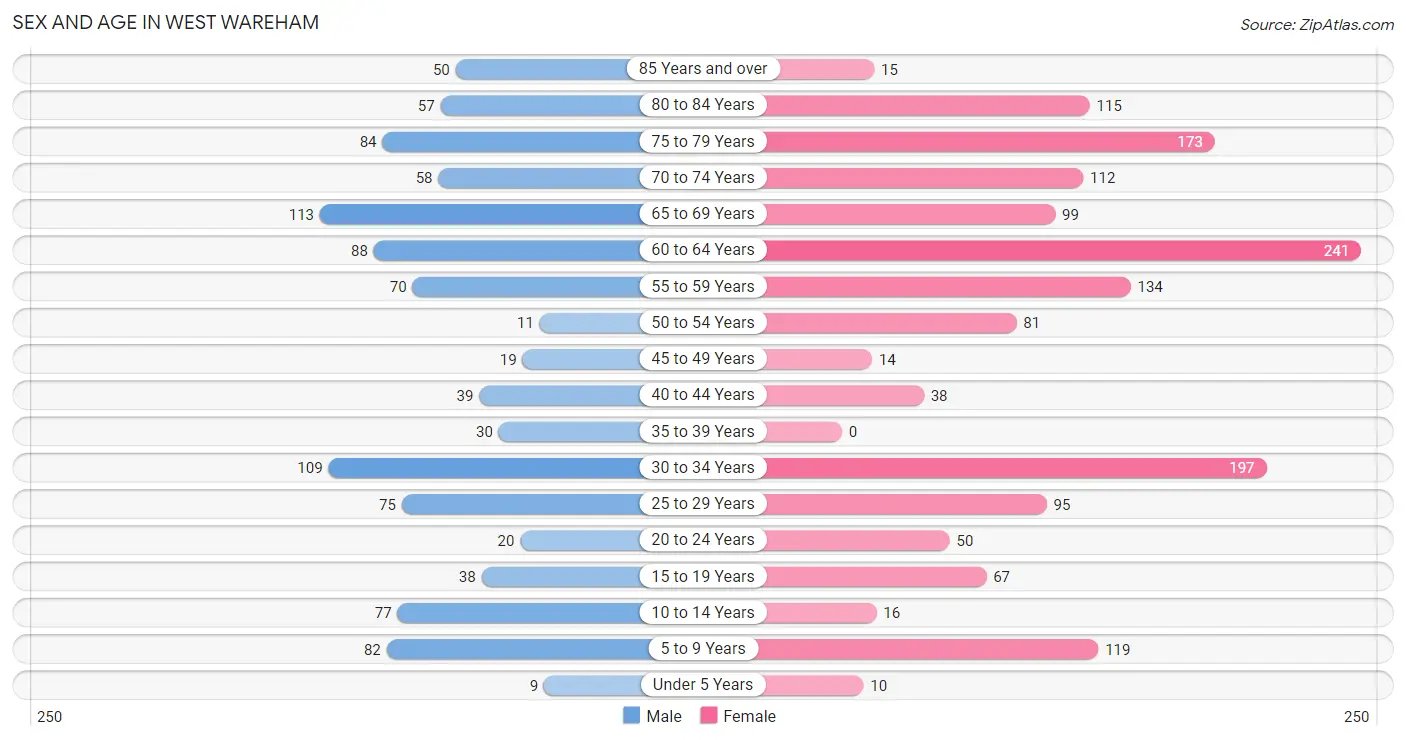
| Age Bracket | Male | Female |
| Under 5 Years | 9 (0.9%) | 10 (0.6%) |
| 5 to 9 Years | 82 (8.0%) | 119 (7.5%) |
| 10 to 14 Years | 77 (7.5%) | 16 (1.0%) |
| 15 to 19 Years | 38 (3.7%) | 67 (4.3%) |
| 20 to 24 Years | 20 (1.9%) | 50 (3.2%) |
| 25 to 29 Years | 75 (7.3%) | 95 (6.0%) |
| 30 to 34 Years | 109 (10.6%) | 197 (12.5%) |
| 35 to 39 Years | 30 (2.9%) | 0 (0.0%) |
| 40 to 44 Years | 39 (3.8%) | 38 (2.4%) |
| 45 to 49 Years | 19 (1.8%) | 14 (0.9%) |
| 50 to 54 Years | 11 (1.1%) | 81 (5.1%) |
| 55 to 59 Years | 70 (6.8%) | 134 (8.5%) |
| 60 to 64 Years | 88 (8.6%) | 241 (15.3%) |
| 65 to 69 Years | 113 (11.0%) | 99 (6.3%) |
| 70 to 74 Years | 58 (5.6%) | 112 (7.1%) |
| 75 to 79 Years | 84 (8.2%) | 173 (11.0%) |
| 80 to 84 Years | 57 (5.5%) | 115 (7.3%) |
| 85 Years and over | 50 (4.9%) | 15 (0.9%) |
| Total | 1,029 (100.0%) | 1,576 (100.0%) |
Families and Households in West Wareham
Median Family Size in West Wareham
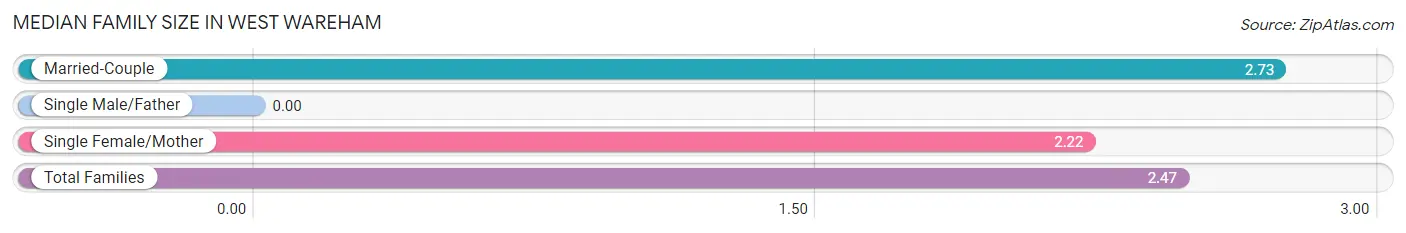
| Family Type | # Families | Family Size |
| Married-Couple | 401 (47.8%) | 2.73 |
| Single Male/Father | 0 (0.0%) | - |
| Single Female/Mother | 438 (52.2%) | 2.22 |
| Total Families | 839 (100.0%) | 2.47 |
Median Household Size in West Wareham
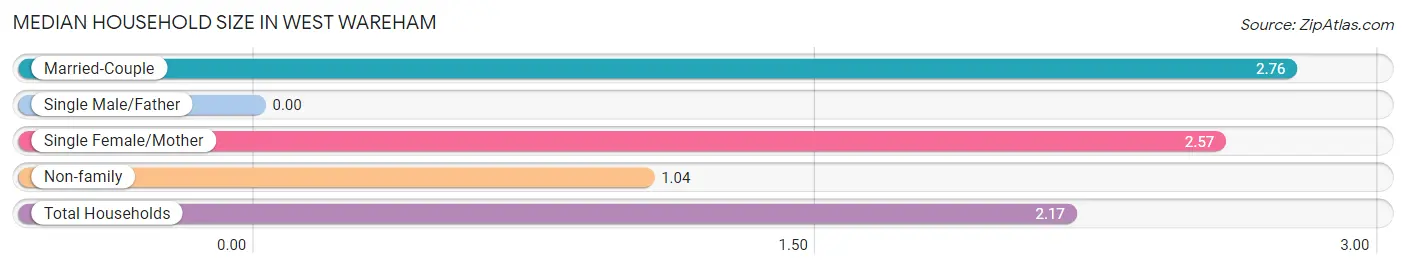
| Household Type | # Households | Household Size |
| Married-Couple | 401 (33.5%) | 2.76 |
| Single Male/Father | 0 (0.0%) | - |
| Single Female/Mother | 438 (36.6%) | 2.57 |
| Non-family | 359 (30.0%) | 1.04 |
| Total Households | 1,198 (100.0%) | 2.17 |
Household Size by Marriage Status in West Wareham
Out of a total of 1,198 households in West Wareham, 839 (70.0%) are family households, while 359 (30.0%) are nonfamily households. The most numerous type of family households are 2-person households, comprising 432, and the most common type of nonfamily households are 1-person households, comprising 345.
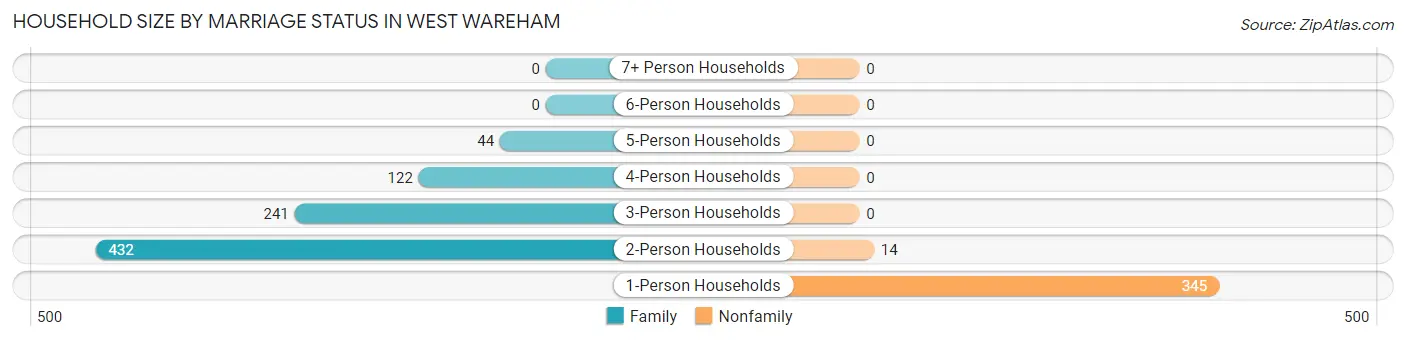
| Household Size | Family Households | Nonfamily Households |
| 1-Person Households | - | 345 (28.8%) |
| 2-Person Households | 432 (36.1%) | 14 (1.2%) |
| 3-Person Households | 241 (20.1%) | 0 (0.0%) |
| 4-Person Households | 122 (10.2%) | 0 (0.0%) |
| 5-Person Households | 44 (3.7%) | 0 (0.0%) |
| 6-Person Households | 0 (0.0%) | 0 (0.0%) |
| 7+ Person Households | 0 (0.0%) | 0 (0.0%) |
| Total | 839 (70.0%) | 359 (30.0%) |
Female Fertility in West Wareham
Fertility by Age in West Wareham
Average fertility rate in West Wareham is 43.0 births per 1,000 women. Women in the age bracket of 35 to 50 years have the highest fertility rate with 385.0 births per 1,000 women. Women in the age bracket of 35 to 50 years acount for 100.0% of all women with births.
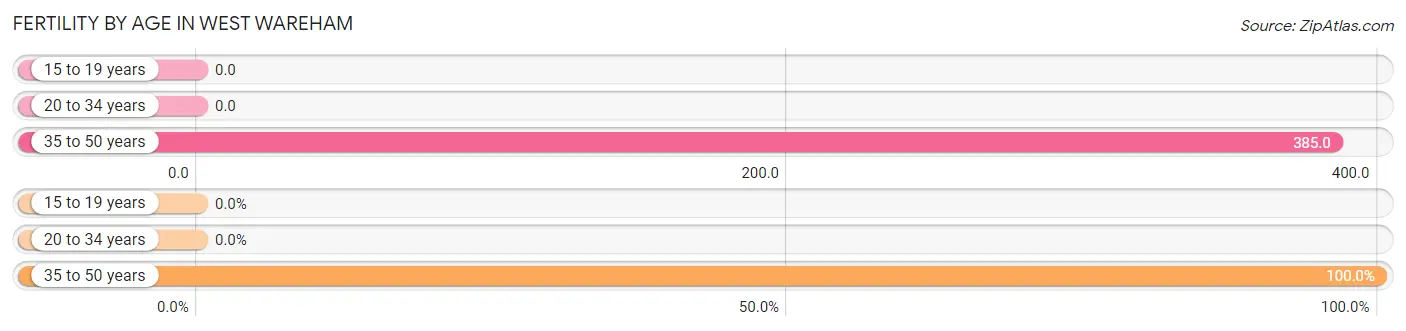
| Age Bracket | Women with Births | Births / 1,000 Women |
| 15 to 19 years | 0 (0.0%) | 0.0 |
| 20 to 34 years | 0 (0.0%) | 0.0 |
| 35 to 50 years | 20 (100.0%) | 385.0 |
| Total | 20 (100.0%) | 43.0 |
Fertility by Age by Marriage Status in West Wareham
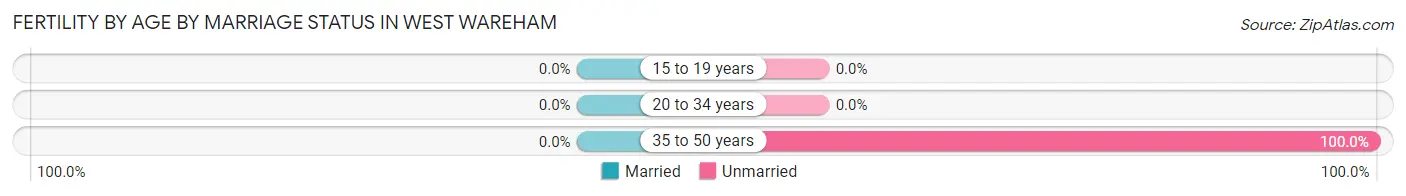
| Age Bracket | Married | Unmarried |
| 15 to 19 years | 0 (0.0%) | 0 (0.0%) |
| 20 to 34 years | 0 (0.0%) | 0 (0.0%) |
| 35 to 50 years | 0 (0.0%) | 20 (100.0%) |
| Total | 0 (0.0%) | 20 (100.0%) |
Fertility by Education in West Wareham
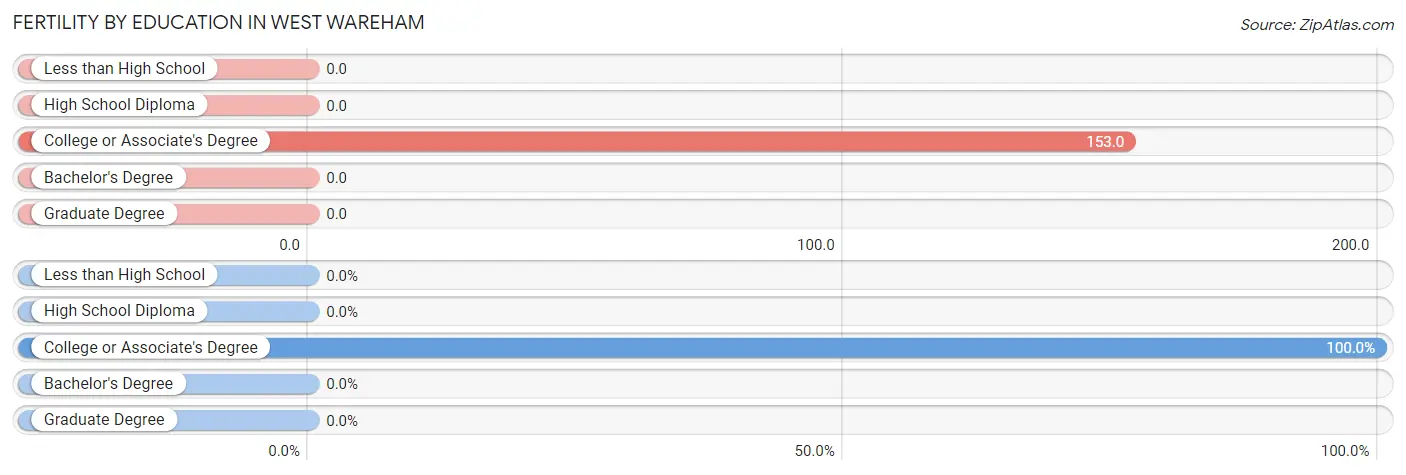
| Educational Attainment | Women with Births | Births / 1,000 Women |
| Less than High School | 0 (0.0%) | 0.0 |
| High School Diploma | 0 (0.0%) | 0.0 |
| College or Associate's Degree | 20 (100.0%) | 153.0 |
| Bachelor's Degree | 0 (0.0%) | 0.0 |
| Graduate Degree | 0 (0.0%) | 0.0 |
| Total | 20 (100.0%) | 43.0 |
Fertility by Education by Marriage Status in West Wareham

| Educational Attainment | Married | Unmarried |
| Less than High School | 0 (0.0%) | 0 (0.0%) |
| High School Diploma | 0 (0.0%) | 0 (0.0%) |
| College or Associate's Degree | 0 (0.0%) | 20 (100.0%) |
| Bachelor's Degree | 0 (0.0%) | 0 (0.0%) |
| Graduate Degree | 0 (0.0%) | 0 (0.0%) |
| Total | 0 (0.0%) | 20 (100.0%) |
Employment Characteristics in West Wareham
Employment by Class of Employer in West Wareham
Among the 1,084 employed individuals in West Wareham, private company employees (768 | 70.9%), not-for-profit organizations (139 | 12.8%), and self-employed (not incorporated) (57 | 5.3%) make up the most common classes of employment.
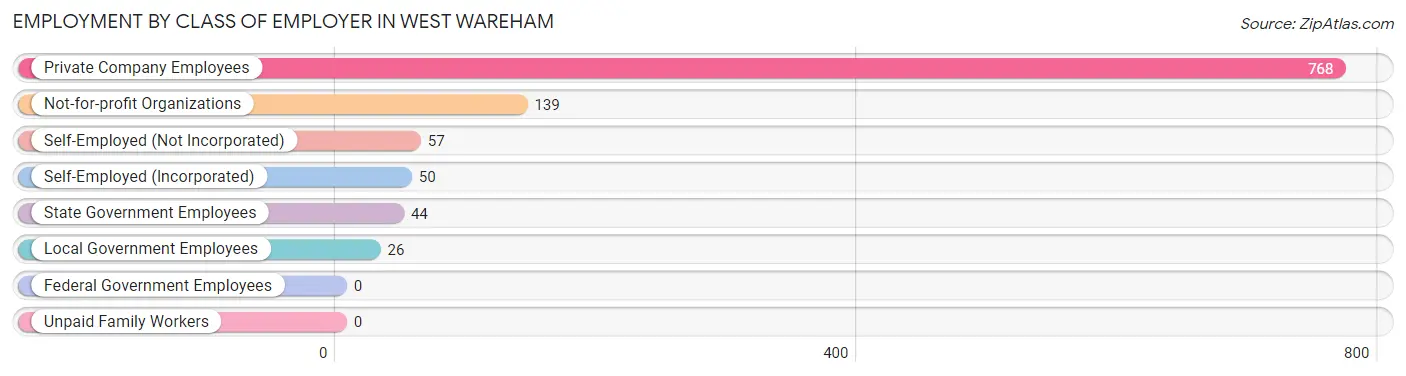
| Employer Class | # Employees | % Employees |
| Private Company Employees | 768 | 70.9% |
| Self-Employed (Incorporated) | 50 | 4.6% |
| Self-Employed (Not Incorporated) | 57 | 5.3% |
| Not-for-profit Organizations | 139 | 12.8% |
| Local Government Employees | 26 | 2.4% |
| State Government Employees | 44 | 4.1% |
| Federal Government Employees | 0 | 0.0% |
| Unpaid Family Workers | 0 | 0.0% |
| Total | 1,084 | 100.0% |
Employment Status by Age in West Wareham
According to the labor force statistics for West Wareham, out of the total population over 16 years of age (2,205), 52.7% or 1,162 individuals are in the labor force, with 5.6% or 65 of them unemployed. The age group with the highest labor force participation rate is 16 to 19 years, with 100.0% or 18 individuals in the labor force. Within the labor force, the 25 to 29 years age range has the highest percentage of unemployed individuals, with 26.5% or 45 of them being unemployed.
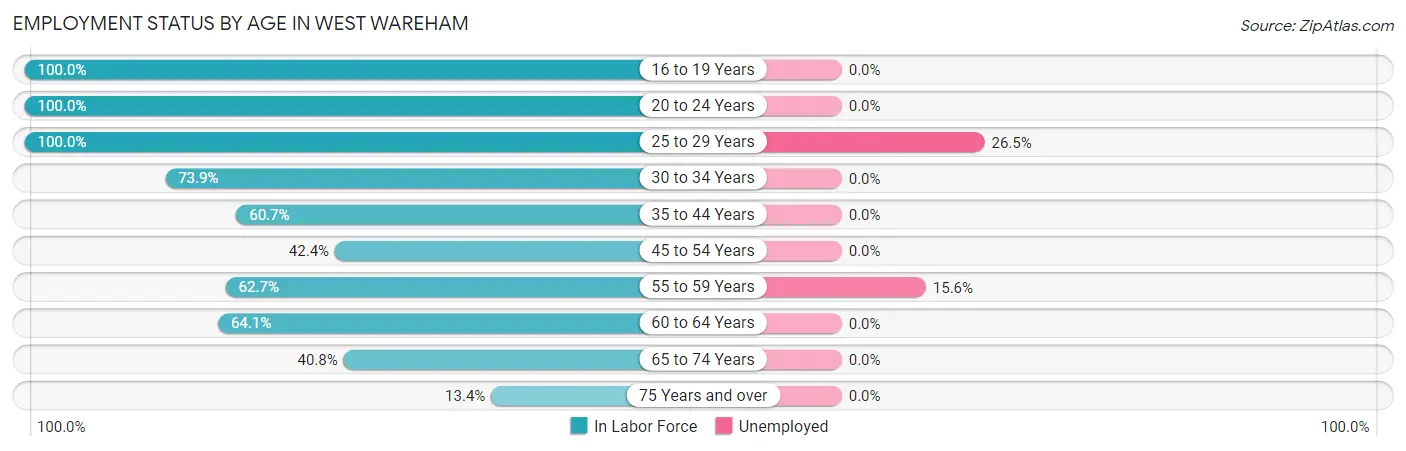
| Age Bracket | In Labor Force | Unemployed |
| 16 to 19 Years | 18 (100.0%) | 0 (0.0%) |
| 20 to 24 Years | 70 (100.0%) | 0 (0.0%) |
| 25 to 29 Years | 170 (100.0%) | 45 (26.5%) |
| 30 to 34 Years | 226 (73.9%) | 0 (0.0%) |
| 35 to 44 Years | 65 (60.7%) | 0 (0.0%) |
| 45 to 54 Years | 53 (42.4%) | 0 (0.0%) |
| 55 to 59 Years | 128 (62.7%) | 20 (15.6%) |
| 60 to 64 Years | 211 (64.1%) | 0 (0.0%) |
| 65 to 74 Years | 156 (40.8%) | 0 (0.0%) |
| 75 Years and over | 66 (13.4%) | 0 (0.0%) |
| Total | 1,162 (52.7%) | 65 (5.6%) |
Employment Status by Educational Attainment in West Wareham
According to labor force statistics for West Wareham, 68.7% of individuals (853) out of the total population between 25 and 64 years of age (1,241) are in the labor force, with 7.6% or 65 of them being unemployed. The group with the highest labor force participation rate are those with the educational attainment of high school diploma, with 75.7% or 564 individuals in the labor force. Within the labor force, individuals with high school diploma education have the highest percentage of unemployment, with 11.5% or 65 of them being unemployed.
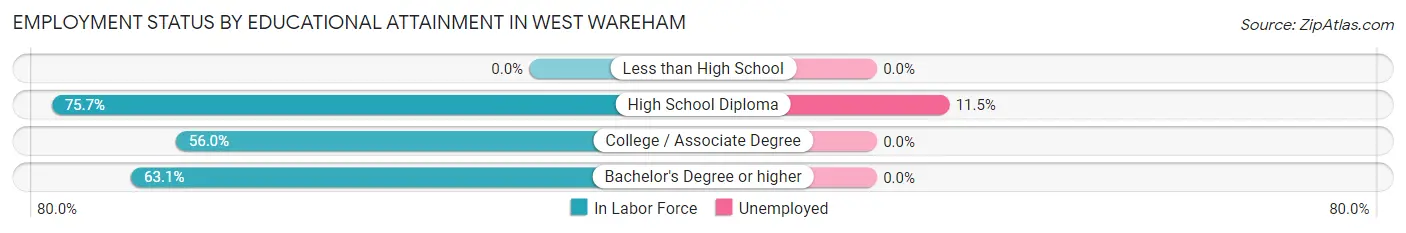
| Educational Attainment | In Labor Force | Unemployed |
| Less than High School | 0 (0.0%) | 0 (0.0%) |
| High School Diploma | 564 (75.7%) | 86 (11.5%) |
| College / Associate Degree | 190 (56.0%) | 0 (0.0%) |
| Bachelor's Degree or higher | 99 (63.1%) | 0 (0.0%) |
| Total | 853 (68.7%) | 94 (7.6%) |
Employment Occupations by Sex in West Wareham
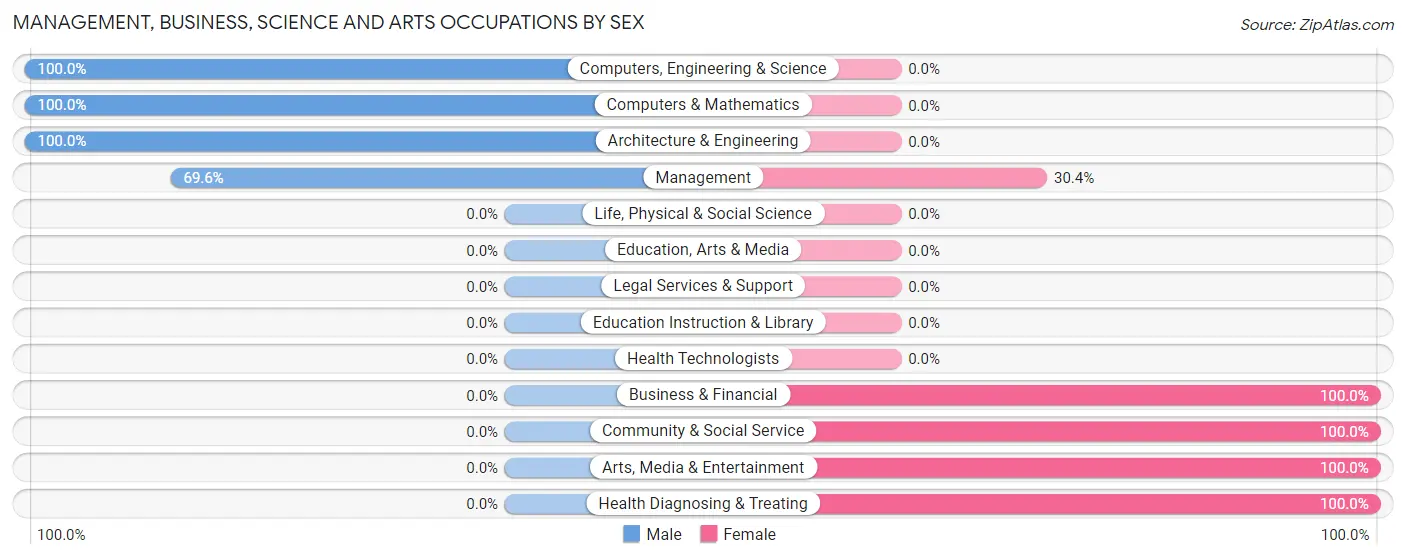
Management, Business, Science and Arts Occupations
The most common Management, Business, Science and Arts occupations in West Wareham are Community & Social Service (91 | 8.3%), Arts, Media & Entertainment (91 | 8.3%), Computers, Engineering & Science (82 | 7.5%), Computers & Mathematics (64 | 5.8%), and Health Diagnosing & Treating (64 | 5.8%).
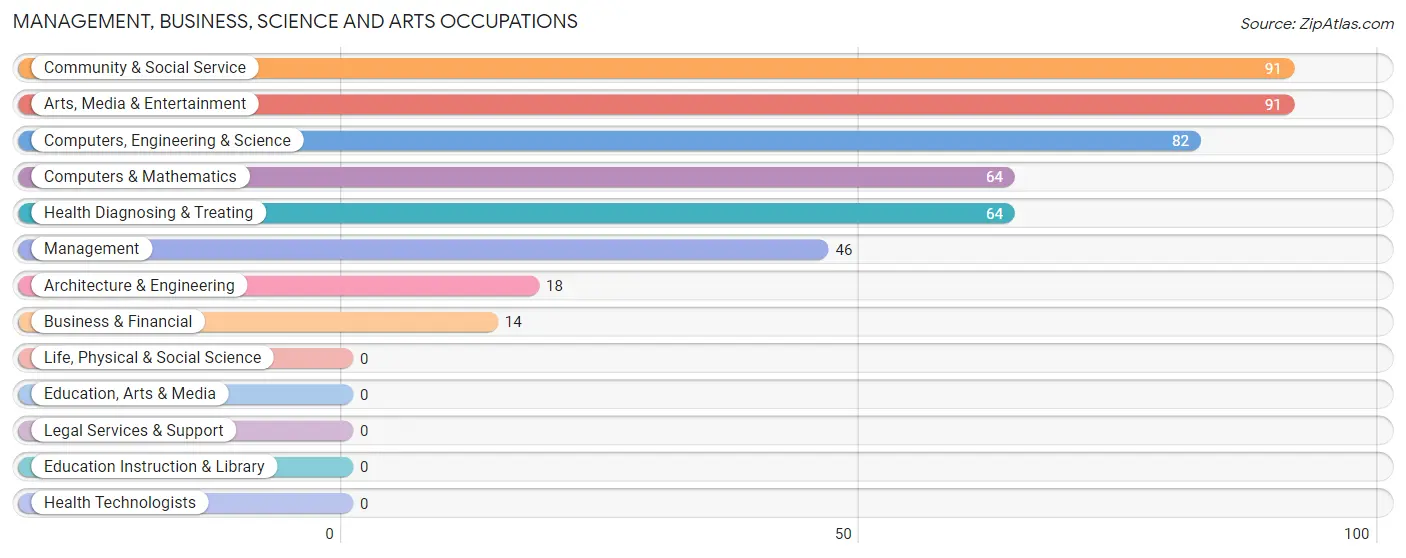
Management, Business, Science and Arts Occupations by Sex
Within the Management, Business, Science and Arts occupations in West Wareham, the most male-oriented occupations are Computers, Engineering & Science (100.0%), Computers & Mathematics (100.0%), and Architecture & Engineering (100.0%), while the most female-oriented occupations are Business & Financial (100.0%), Community & Social Service (100.0%), and Arts, Media & Entertainment (100.0%).
| Occupation | Male | Female |
| Management | 32 (69.6%) | 14 (30.4%) |
| Business & Financial | 0 (0.0%) | 14 (100.0%) |
| Computers, Engineering & Science | 82 (100.0%) | 0 (0.0%) |
| Computers & Mathematics | 64 (100.0%) | 0 (0.0%) |
| Architecture & Engineering | 18 (100.0%) | 0 (0.0%) |
| Life, Physical & Social Science | 0 (0.0%) | 0 (0.0%) |
| Community & Social Service | 0 (0.0%) | 91 (100.0%) |
| Education, Arts & Media | 0 (0.0%) | 0 (0.0%) |
| Legal Services & Support | 0 (0.0%) | 0 (0.0%) |
| Education Instruction & Library | 0 (0.0%) | 0 (0.0%) |
| Arts, Media & Entertainment | 0 (0.0%) | 91 (100.0%) |
| Health Diagnosing & Treating | 0 (0.0%) | 64 (100.0%) |
| Health Technologists | 0 (0.0%) | 0 (0.0%) |
| Total (Category) | 114 (38.4%) | 183 (61.6%) |
| Total (Overall) | 478 (43.5%) | 620 (56.5%) |
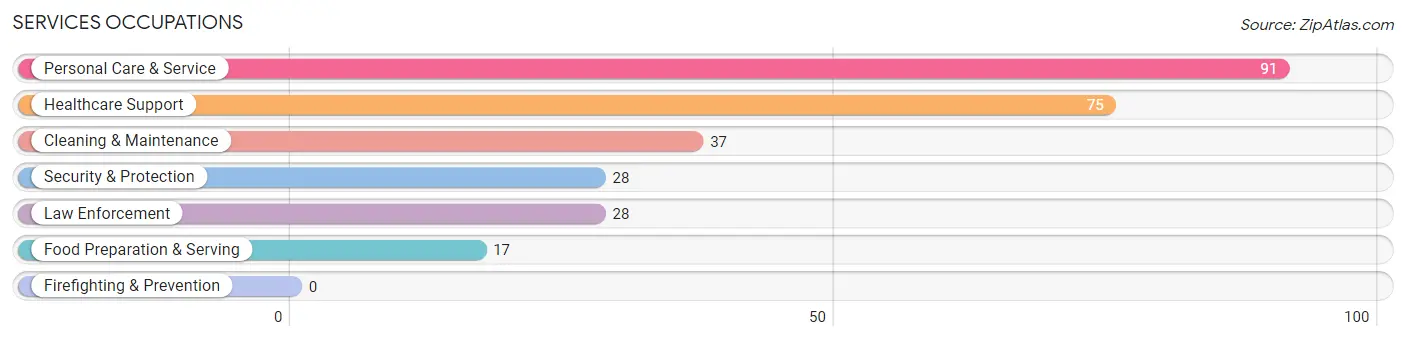
Services Occupations
The most common Services occupations in West Wareham are Personal Care & Service (91 | 8.3%), Healthcare Support (75 | 6.8%), Cleaning & Maintenance (37 | 3.4%), Security & Protection (28 | 2.5%), and Law Enforcement (28 | 2.5%).
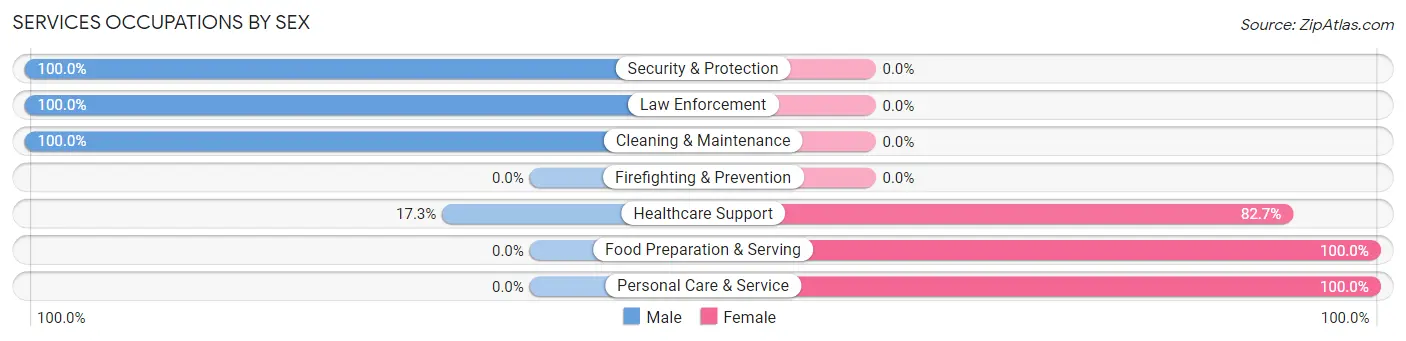
Services Occupations by Sex
Within the Services occupations in West Wareham, the most male-oriented occupations are Security & Protection (100.0%), Law Enforcement (100.0%), and Cleaning & Maintenance (100.0%), while the most female-oriented occupations are Food Preparation & Serving (100.0%), Personal Care & Service (100.0%), and Healthcare Support (82.7%).
| Occupation | Male | Female |
| Healthcare Support | 13 (17.3%) | 62 (82.7%) |
| Security & Protection | 28 (100.0%) | 0 (0.0%) |
| Firefighting & Prevention | 0 (0.0%) | 0 (0.0%) |
| Law Enforcement | 28 (100.0%) | 0 (0.0%) |
| Food Preparation & Serving | 0 (0.0%) | 17 (100.0%) |
| Cleaning & Maintenance | 37 (100.0%) | 0 (0.0%) |
| Personal Care & Service | 0 (0.0%) | 91 (100.0%) |
| Total (Category) | 78 (31.5%) | 170 (68.5%) |
| Total (Overall) | 478 (43.5%) | 620 (56.5%) |
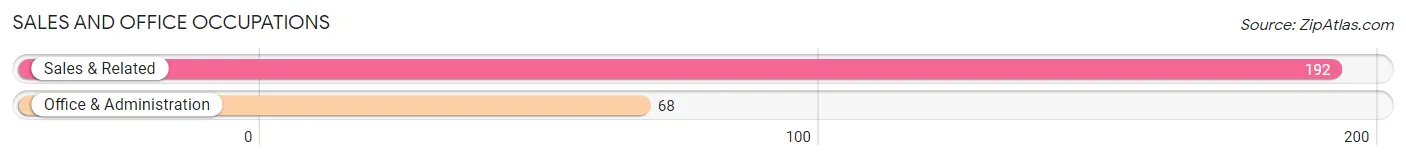
Sales and Office Occupations
The most common Sales and Office occupations in West Wareham are Sales & Related (192 | 17.5%), and Office & Administration (68 | 6.2%).
Sales and Office Occupations by Sex
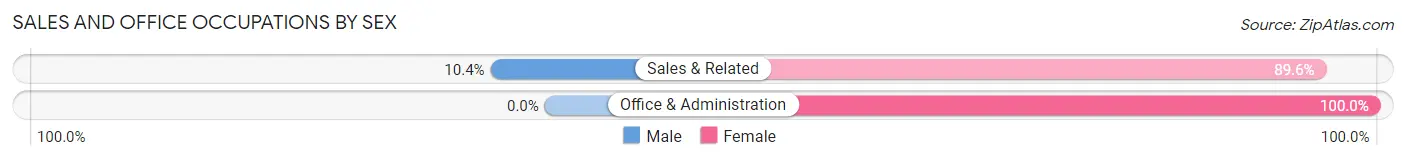
| Occupation | Male | Female |
| Sales & Related | 20 (10.4%) | 172 (89.6%) |
| Office & Administration | 0 (0.0%) | 68 (100.0%) |
| Total (Category) | 20 (7.7%) | 240 (92.3%) |
| Total (Overall) | 478 (43.5%) | 620 (56.5%) |
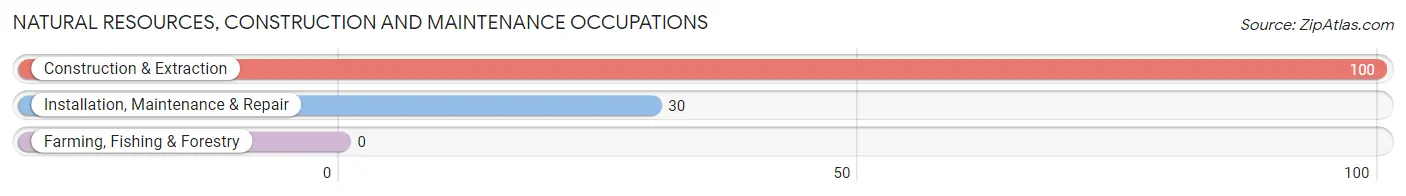
Natural Resources, Construction and Maintenance Occupations
The most common Natural Resources, Construction and Maintenance occupations in West Wareham are Construction & Extraction (100 | 9.1%), and Installation, Maintenance & Repair (30 | 2.7%).
Natural Resources, Construction and Maintenance Occupations by Sex
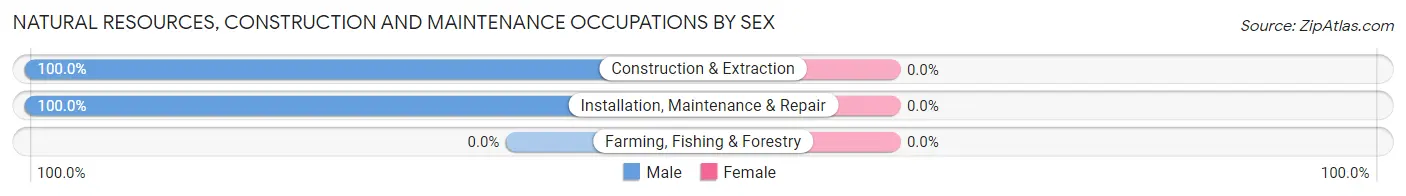
| Occupation | Male | Female |
| Farming, Fishing & Forestry | 0 (0.0%) | 0 (0.0%) |
| Construction & Extraction | 100 (100.0%) | 0 (0.0%) |
| Installation, Maintenance & Repair | 30 (100.0%) | 0 (0.0%) |
| Total (Category) | 130 (100.0%) | 0 (0.0%) |
| Total (Overall) | 478 (43.5%) | 620 (56.5%) |
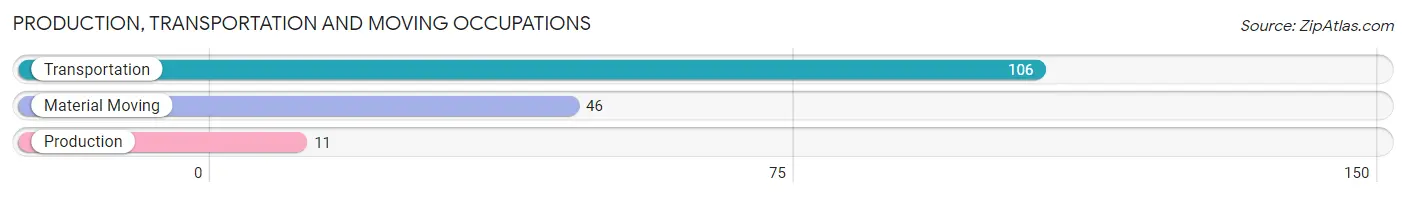
Production, Transportation and Moving Occupations
The most common Production, Transportation and Moving occupations in West Wareham are Transportation (106 | 9.7%), Material Moving (46 | 4.2%), and Production (11 | 1.0%).
Production, Transportation and Moving Occupations by Sex
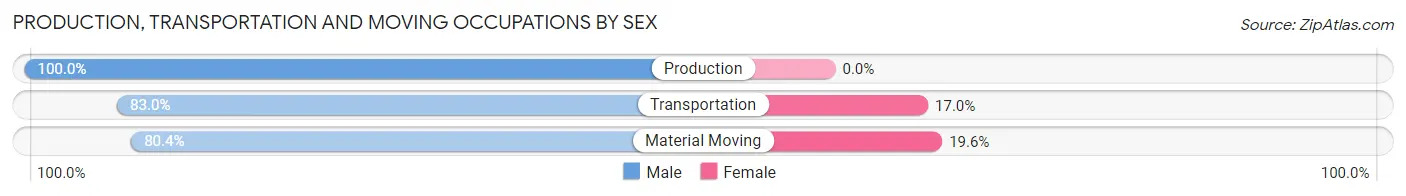
| Occupation | Male | Female |
| Production | 11 (100.0%) | 0 (0.0%) |
| Transportation | 88 (83.0%) | 18 (17.0%) |
| Material Moving | 37 (80.4%) | 9 (19.6%) |
| Total (Category) | 136 (83.4%) | 27 (16.6%) |
| Total (Overall) | 478 (43.5%) | 620 (56.5%) |
Employment Industries by Sex in West Wareham
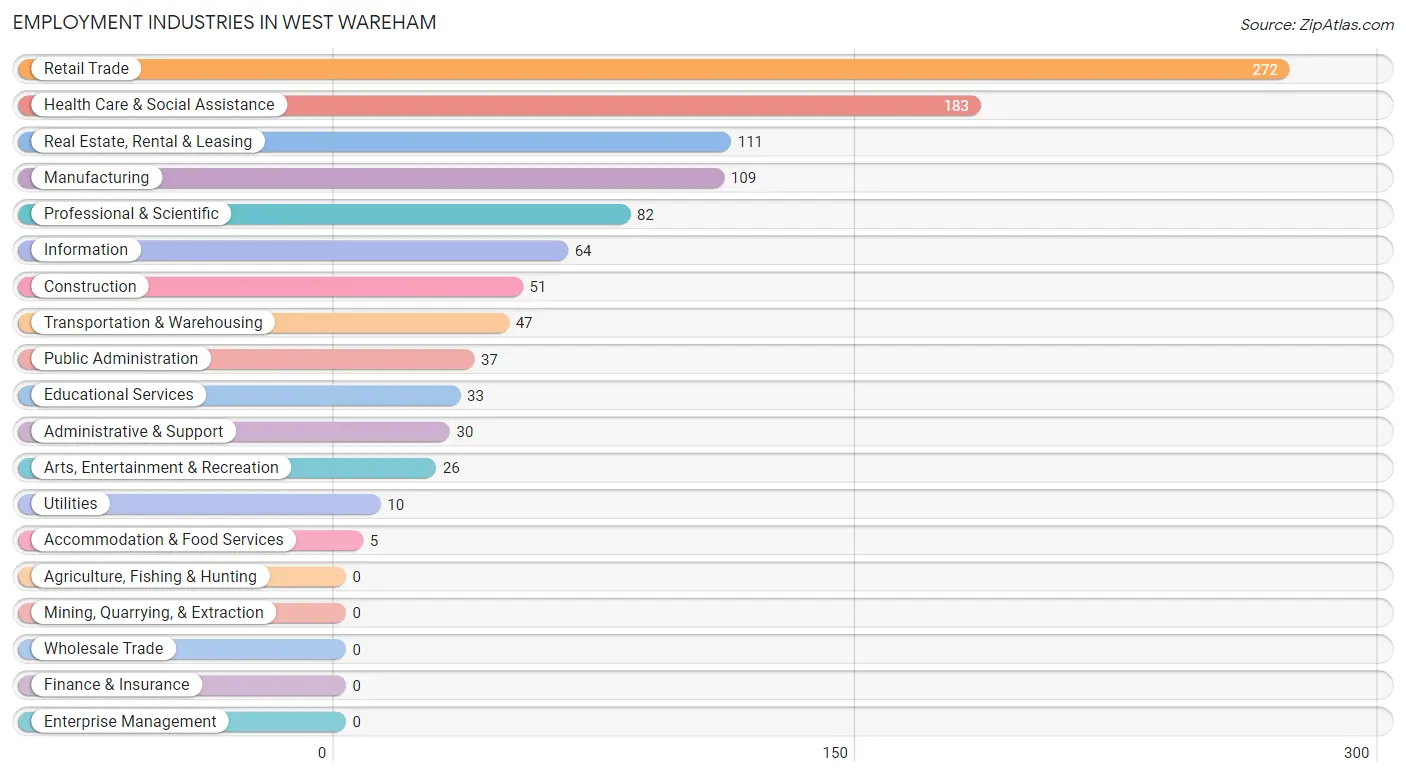
Employment Industries in West Wareham
The major employment industries in West Wareham include Retail Trade (272 | 24.8%), Health Care & Social Assistance (183 | 16.7%), Real Estate, Rental & Leasing (111 | 10.1%), Manufacturing (109 | 9.9%), and Professional & Scientific (82 | 7.5%).
Employment Industries by Sex in West Wareham
The West Wareham industries that see more men than women are Construction (100.0%), Information (100.0%), and Accommodation & Food Services (100.0%), whereas the industries that tend to have a higher number of women are Utilities (100.0%), Administrative & Support (100.0%), and Educational Services (100.0%).
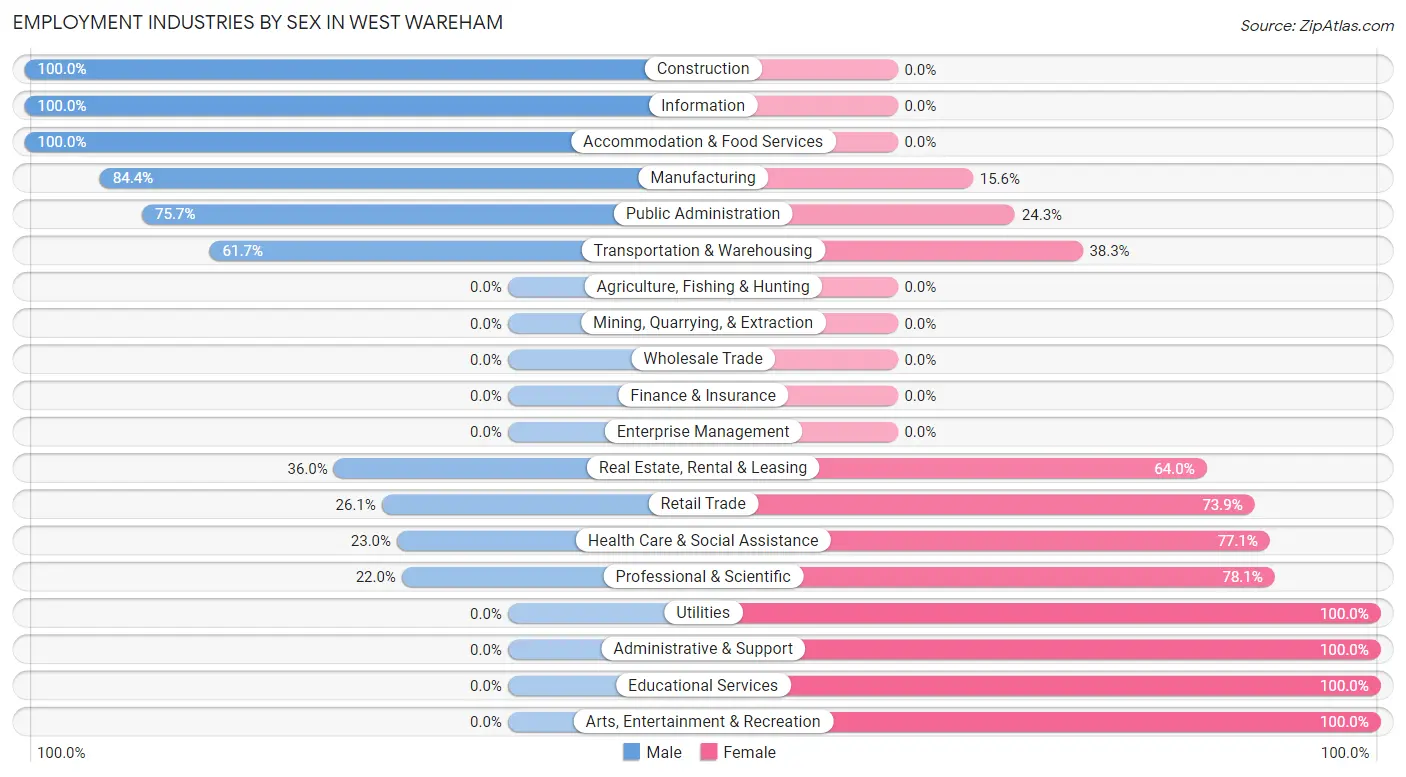
| Industry | Male | Female |
| Agriculture, Fishing & Hunting | 0 (0.0%) | 0 (0.0%) |
| Mining, Quarrying, & Extraction | 0 (0.0%) | 0 (0.0%) |
| Construction | 51 (100.0%) | 0 (0.0%) |
| Manufacturing | 92 (84.4%) | 17 (15.6%) |
| Wholesale Trade | 0 (0.0%) | 0 (0.0%) |
| Retail Trade | 71 (26.1%) | 201 (73.9%) |
| Transportation & Warehousing | 29 (61.7%) | 18 (38.3%) |
| Utilities | 0 (0.0%) | 10 (100.0%) |
| Information | 64 (100.0%) | 0 (0.0%) |
| Finance & Insurance | 0 (0.0%) | 0 (0.0%) |
| Real Estate, Rental & Leasing | 40 (36.0%) | 71 (64.0%) |
| Professional & Scientific | 18 (22.0%) | 64 (78.0%) |
| Enterprise Management | 0 (0.0%) | 0 (0.0%) |
| Administrative & Support | 0 (0.0%) | 30 (100.0%) |
| Educational Services | 0 (0.0%) | 33 (100.0%) |
| Health Care & Social Assistance | 42 (23.0%) | 141 (77.0%) |
| Arts, Entertainment & Recreation | 0 (0.0%) | 26 (100.0%) |
| Accommodation & Food Services | 5 (100.0%) | 0 (0.0%) |
| Public Administration | 28 (75.7%) | 9 (24.3%) |
| Total | 478 (43.5%) | 620 (56.5%) |
Education in West Wareham
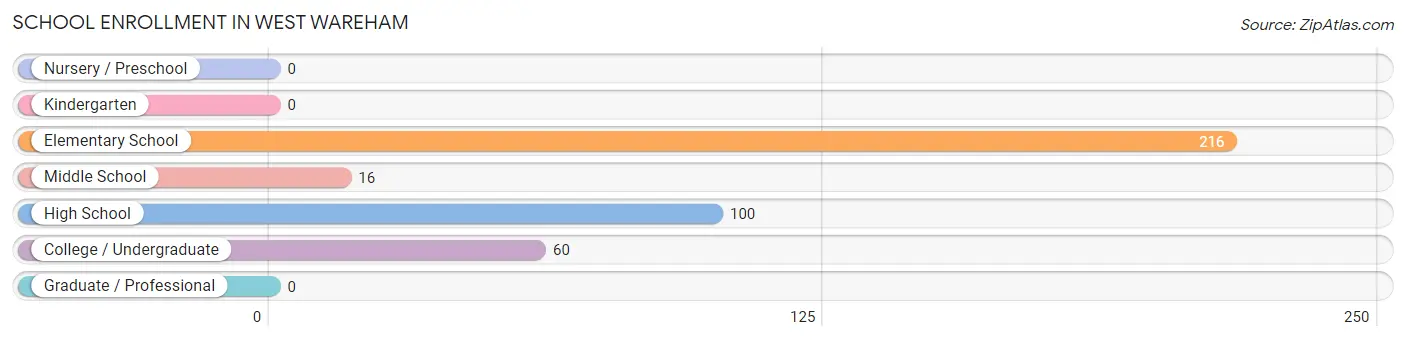
School Enrollment in West Wareham
The most common levels of schooling among the 392 students in West Wareham are elementary school (216 | 55.1%), high school (100 | 25.5%), and college / undergraduate (60 | 15.3%).
| School Level | # Students | % Students |
| Nursery / Preschool | 0 | 0.0% |
| Kindergarten | 0 | 0.0% |
| Elementary School | 216 | 55.1% |
| Middle School | 16 | 4.1% |
| High School | 100 | 25.5% |
| College / Undergraduate | 60 | 15.3% |
| Graduate / Professional | 0 | 0.0% |
| Total | 392 | 100.0% |
School Enrollment by Age by Funding Source in West Wareham
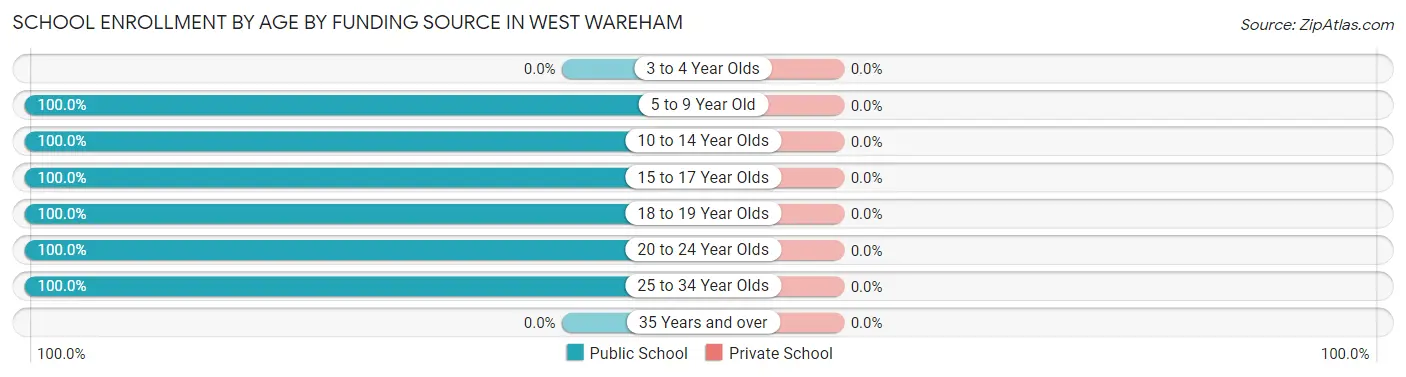
| Age Bracket | Public School | Private School |
| 3 to 4 Year Olds | 0 (0.0%) | 0 (0.0%) |
| 5 to 9 Year Old | 201 (100.0%) | 0 (0.0%) |
| 10 to 14 Year Olds | 31 (100.0%) | 0 (0.0%) |
| 15 to 17 Year Olds | 100 (100.0%) | 0 (0.0%) |
| 18 to 19 Year Olds | 5 (100.0%) | 0 (0.0%) |
| 20 to 24 Year Olds | 24 (100.0%) | 0 (0.0%) |
| 25 to 34 Year Olds | 31 (100.0%) | 0 (0.0%) |
| 35 Years and over | 0 (0.0%) | 0 (0.0%) |
| Total | 392 (100.0%) | 0 (0.0%) |
Educational Attainment by Field of Study in West Wareham
Business (103 | 43.3%), science & technology (36 | 15.1%), engineering (28 | 11.8%), literature & languages (24 | 10.1%), and social sciences (18 | 7.6%) are the most common fields of study among 238 individuals in West Wareham who have obtained a bachelor's degree or higher.
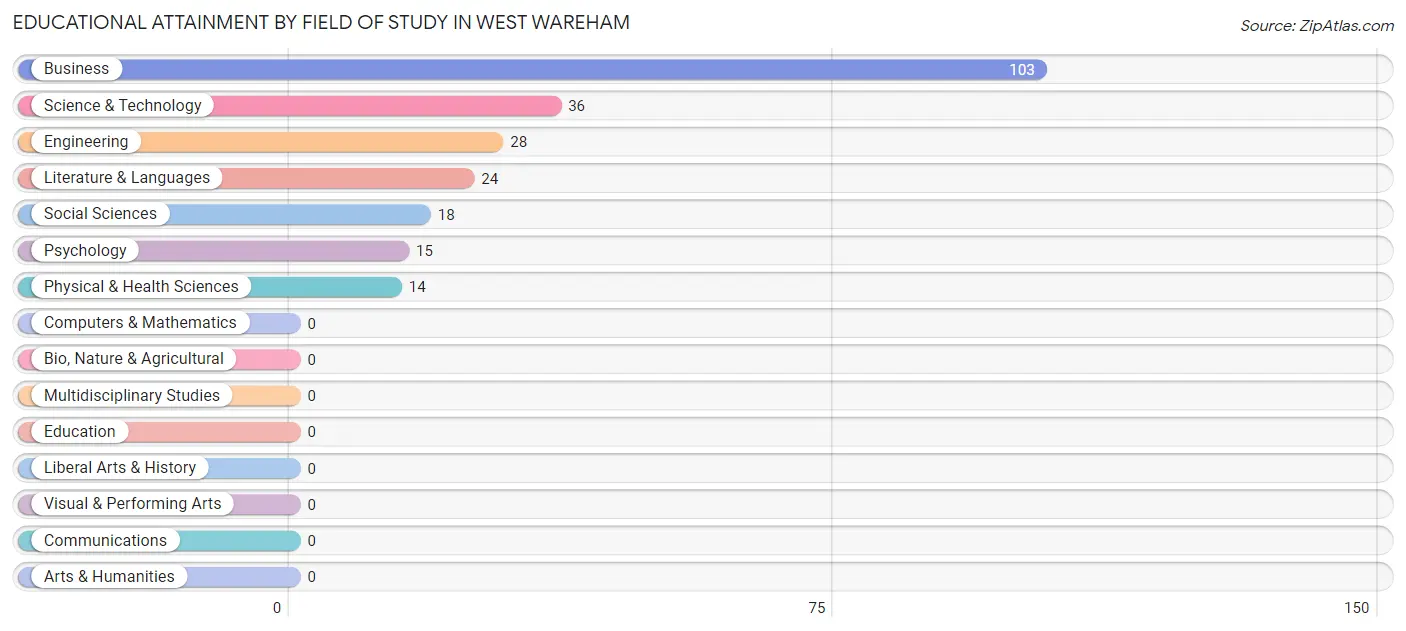
| Field of Study | # Graduates | % Graduates |
| Computers & Mathematics | 0 | 0.0% |
| Bio, Nature & Agricultural | 0 | 0.0% |
| Physical & Health Sciences | 14 | 5.9% |
| Psychology | 15 | 6.3% |
| Social Sciences | 18 | 7.6% |
| Engineering | 28 | 11.8% |
| Multidisciplinary Studies | 0 | 0.0% |
| Science & Technology | 36 | 15.1% |
| Business | 103 | 43.3% |
| Education | 0 | 0.0% |
| Literature & Languages | 24 | 10.1% |
| Liberal Arts & History | 0 | 0.0% |
| Visual & Performing Arts | 0 | 0.0% |
| Communications | 0 | 0.0% |
| Arts & Humanities | 0 | 0.0% |
| Total | 238 | 100.0% |
Transportation & Commute in West Wareham
Vehicle Availability by Sex in West Wareham
The most prevalent vehicle ownership categories in West Wareham are males with 2 vehicles (179, accounting for 38.6%) and females with 2 vehicles (116, making up 28.9%).
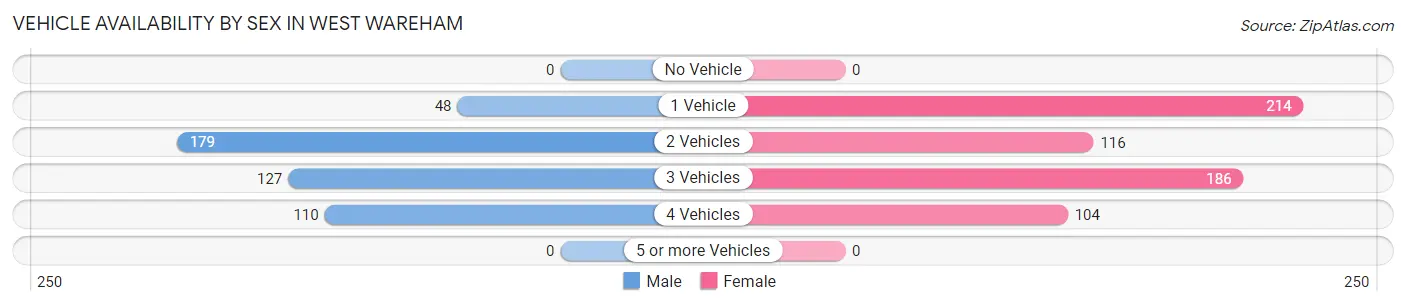
| Vehicles Available | Male | Female |
| No Vehicle | 0 (0.0%) | 0 (0.0%) |
| 1 Vehicle | 48 (10.3%) | 214 (34.5%) |
| 2 Vehicles | 179 (38.6%) | 116 (18.7%) |
| 3 Vehicles | 127 (27.4%) | 186 (30.0%) |
| 4 Vehicles | 110 (23.7%) | 104 (16.8%) |
| 5 or more Vehicles | 0 (0.0%) | 0 (0.0%) |
| Total | 464 (100.0%) | 620 (100.0%) |
Commute Time in West Wareham
The most frequently occuring commute durations in West Wareham are 30 to 34 minutes (265 commuters, 31.6%), 15 to 19 minutes (106 commuters, 12.6%), and 5 to 9 minutes (105 commuters, 12.5%).
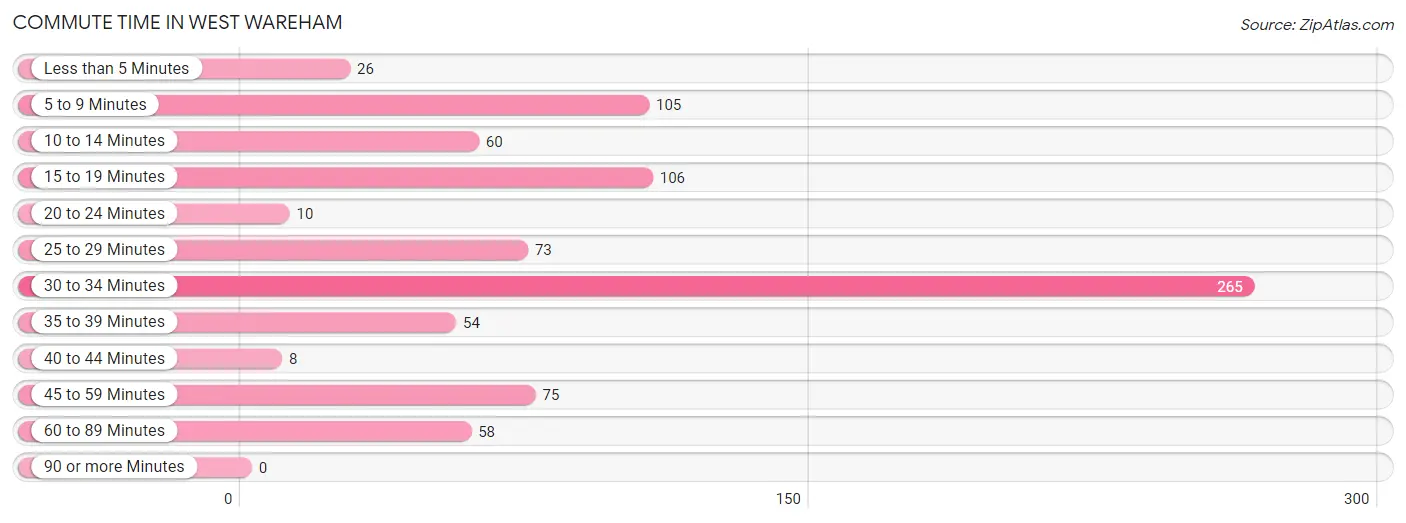
| Commute Time | # Commuters | % Commuters |
| Less than 5 Minutes | 26 | 3.1% |
| 5 to 9 Minutes | 105 | 12.5% |
| 10 to 14 Minutes | 60 | 7.1% |
| 15 to 19 Minutes | 106 | 12.6% |
| 20 to 24 Minutes | 10 | 1.2% |
| 25 to 29 Minutes | 73 | 8.7% |
| 30 to 34 Minutes | 265 | 31.6% |
| 35 to 39 Minutes | 54 | 6.4% |
| 40 to 44 Minutes | 8 | 0.9% |
| 45 to 59 Minutes | 75 | 8.9% |
| 60 to 89 Minutes | 58 | 6.9% |
| 90 or more Minutes | 0 | 0.0% |
Commute Time by Sex in West Wareham
The most common commute times in West Wareham are 10 to 14 minutes (60 commuters, 18.5%) for males and 30 to 34 minutes (236 commuters, 45.8%) for females.
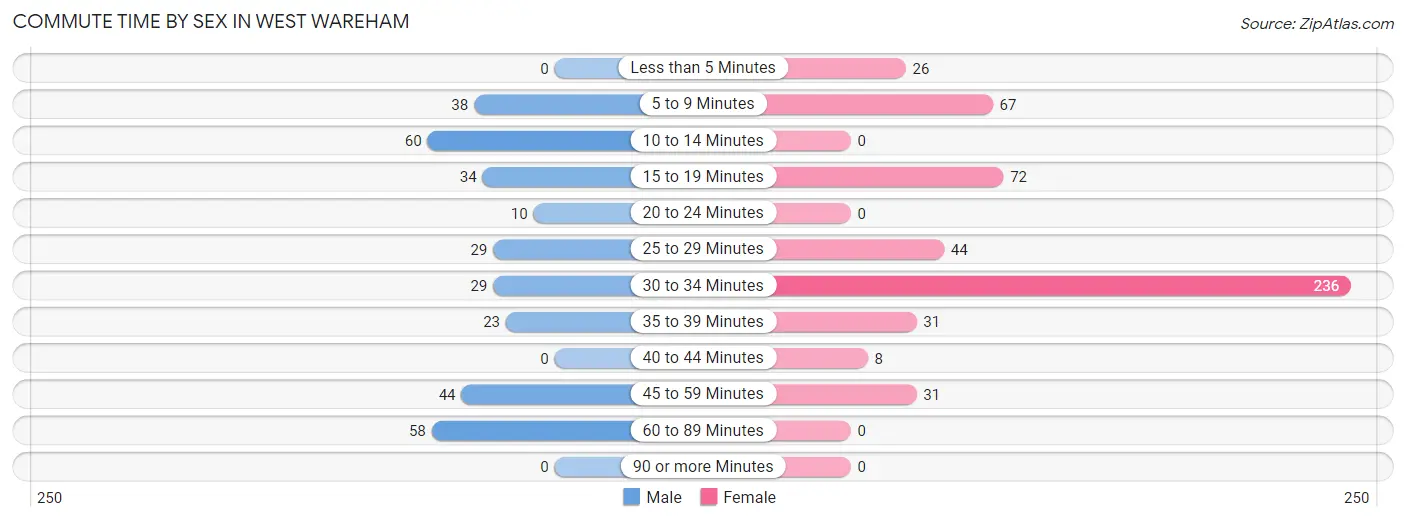
| Commute Time | Male | Female |
| Less than 5 Minutes | 0 (0.0%) | 26 (5.1%) |
| 5 to 9 Minutes | 38 (11.7%) | 67 (13.0%) |
| 10 to 14 Minutes | 60 (18.5%) | 0 (0.0%) |
| 15 to 19 Minutes | 34 (10.5%) | 72 (14.0%) |
| 20 to 24 Minutes | 10 (3.1%) | 0 (0.0%) |
| 25 to 29 Minutes | 29 (8.9%) | 44 (8.5%) |
| 30 to 34 Minutes | 29 (8.9%) | 236 (45.8%) |
| 35 to 39 Minutes | 23 (7.1%) | 31 (6.0%) |
| 40 to 44 Minutes | 0 (0.0%) | 8 (1.5%) |
| 45 to 59 Minutes | 44 (13.5%) | 31 (6.0%) |
| 60 to 89 Minutes | 58 (17.8%) | 0 (0.0%) |
| 90 or more Minutes | 0 (0.0%) | 0 (0.0%) |
Time of Departure to Work by Sex in West Wareham
The most frequent times of departure to work in West Wareham are 6:30 AM to 6:59 AM (81, 24.9%) for males and 9:00 AM to 9:59 AM (150, 29.1%) for females.
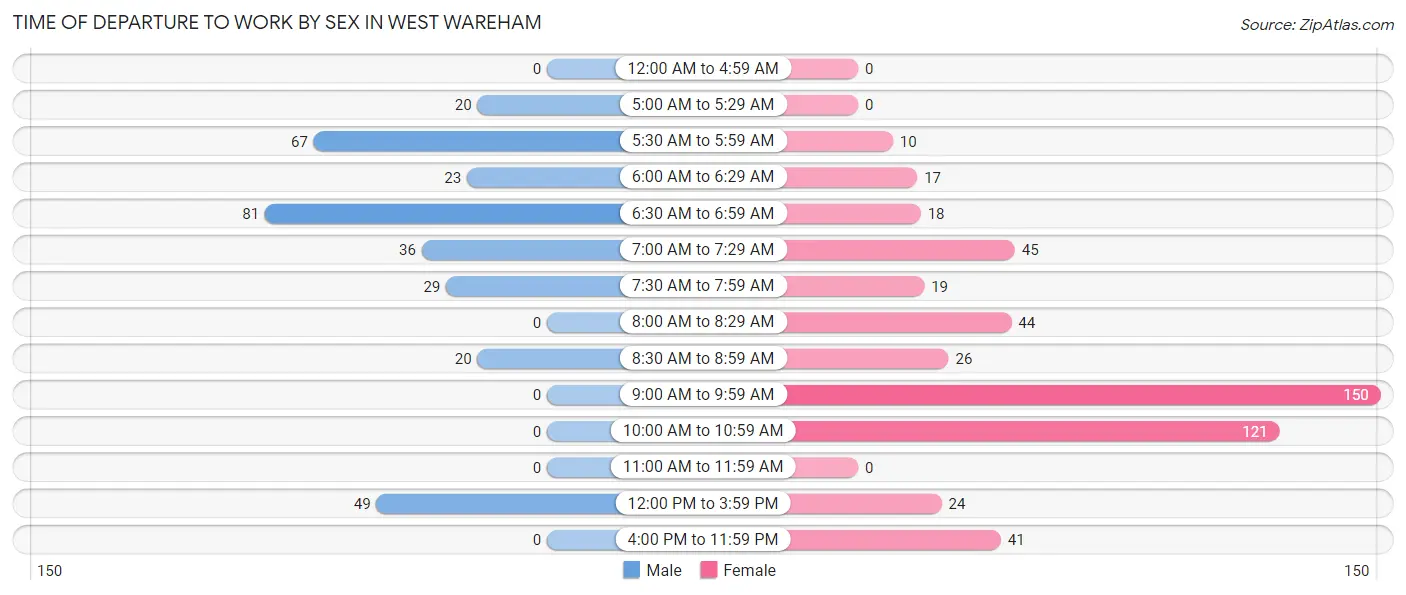
| Time of Departure | Male | Female |
| 12:00 AM to 4:59 AM | 0 (0.0%) | 0 (0.0%) |
| 5:00 AM to 5:29 AM | 20 (6.1%) | 0 (0.0%) |
| 5:30 AM to 5:59 AM | 67 (20.6%) | 10 (1.9%) |
| 6:00 AM to 6:29 AM | 23 (7.1%) | 17 (3.3%) |
| 6:30 AM to 6:59 AM | 81 (24.9%) | 18 (3.5%) |
| 7:00 AM to 7:29 AM | 36 (11.1%) | 45 (8.7%) |
| 7:30 AM to 7:59 AM | 29 (8.9%) | 19 (3.7%) |
| 8:00 AM to 8:29 AM | 0 (0.0%) | 44 (8.5%) |
| 8:30 AM to 8:59 AM | 20 (6.1%) | 26 (5.1%) |
| 9:00 AM to 9:59 AM | 0 (0.0%) | 150 (29.1%) |
| 10:00 AM to 10:59 AM | 0 (0.0%) | 121 (23.5%) |
| 11:00 AM to 11:59 AM | 0 (0.0%) | 0 (0.0%) |
| 12:00 PM to 3:59 PM | 49 (15.1%) | 24 (4.7%) |
| 4:00 PM to 11:59 PM | 0 (0.0%) | 41 (8.0%) |
| Total | 325 (100.0%) | 515 (100.0%) |
Housing Occupancy in West Wareham
Occupancy by Ownership in West Wareham
Of the total 1,198 dwellings in West Wareham, owner-occupied units account for 943 (78.7%), while renter-occupied units make up 255 (21.3%).
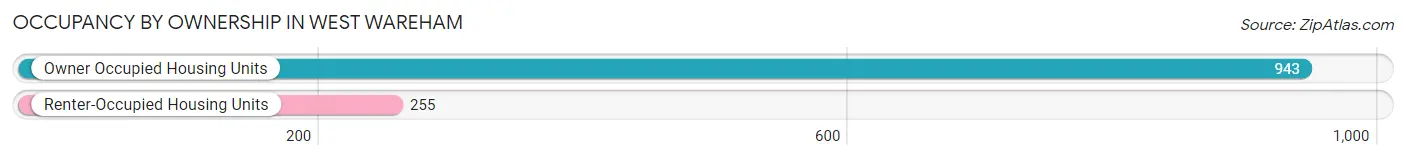
| Occupancy | # Housing Units | % Housing Units |
| Owner Occupied Housing Units | 943 | 78.7% |
| Renter-Occupied Housing Units | 255 | 21.3% |
| Total Occupied Housing Units | 1,198 | 100.0% |
Occupancy by Household Size in West Wareham
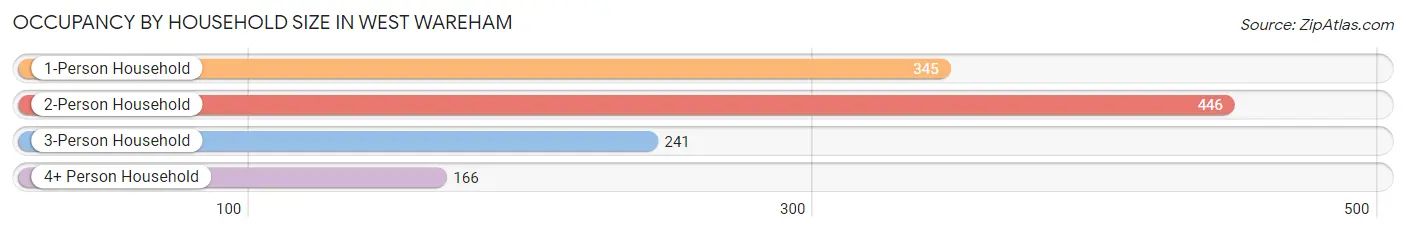
| Household Size | # Housing Units | % Housing Units |
| 1-Person Household | 345 | 28.8% |
| 2-Person Household | 446 | 37.2% |
| 3-Person Household | 241 | 20.1% |
| 4+ Person Household | 166 | 13.9% |
| Total Housing Units | 1,198 | 100.0% |
Occupancy by Ownership by Household Size in West Wareham
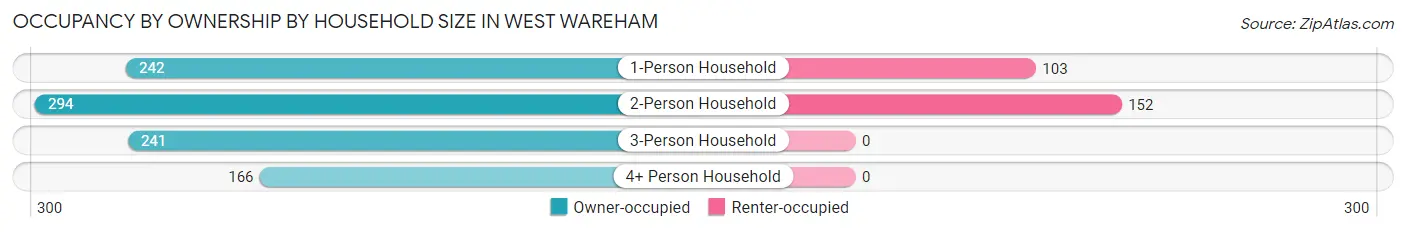
| Household Size | Owner-occupied | Renter-occupied |
| 1-Person Household | 242 (70.1%) | 103 (29.9%) |
| 2-Person Household | 294 (65.9%) | 152 (34.1%) |
| 3-Person Household | 241 (100.0%) | 0 (0.0%) |
| 4+ Person Household | 166 (100.0%) | 0 (0.0%) |
| Total Housing Units | 943 (78.7%) | 255 (21.3%) |
Occupancy by Educational Attainment in West Wareham
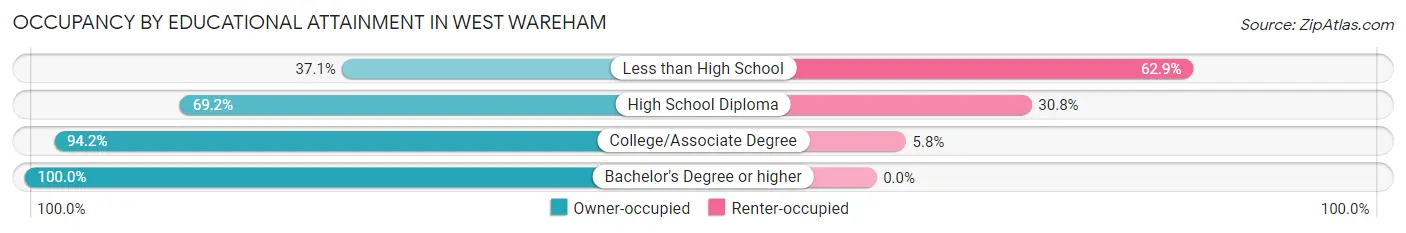
| Household Size | Owner-occupied | Renter-occupied |
| Less than High School | 13 (37.1%) | 22 (62.9%) |
| High School Diploma | 479 (69.2%) | 213 (30.8%) |
| College/Associate Degree | 323 (94.2%) | 20 (5.8%) |
| Bachelor's Degree or higher | 128 (100.0%) | 0 (0.0%) |
Occupancy by Age of Householder in West Wareham
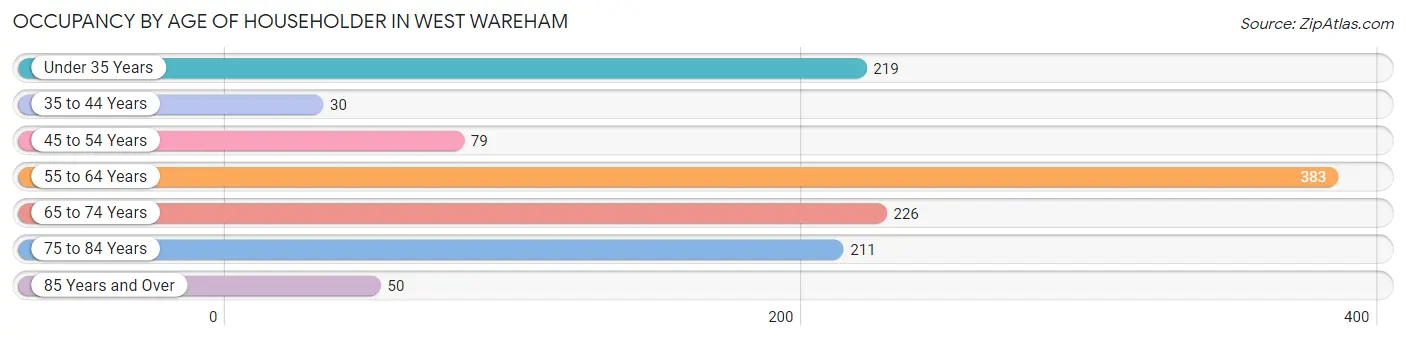
| Age Bracket | # Households | % Households |
| Under 35 Years | 219 | 18.3% |
| 35 to 44 Years | 30 | 2.5% |
| 45 to 54 Years | 79 | 6.6% |
| 55 to 64 Years | 383 | 32.0% |
| 65 to 74 Years | 226 | 18.9% |
| 75 to 84 Years | 211 | 17.6% |
| 85 Years and Over | 50 | 4.2% |
| Total | 1,198 | 100.0% |
Housing Finances in West Wareham
Median Income by Occupancy in West Wareham
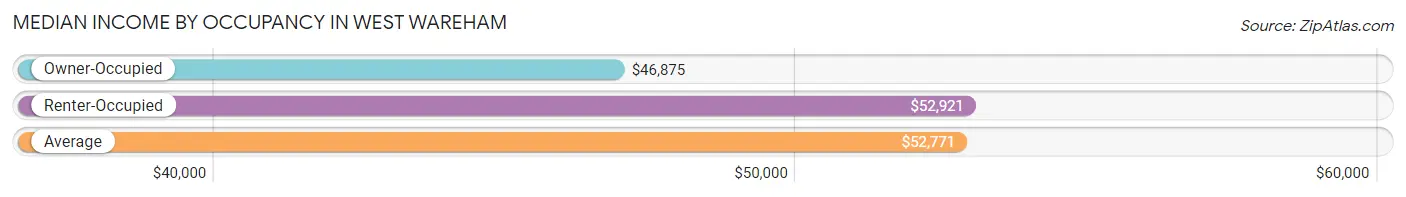
| Occupancy Type | # Households | Median Income |
| Owner-Occupied | 943 (78.7%) | $46,875 |
| Renter-Occupied | 255 (21.3%) | $52,921 |
| Average | 1,198 (100.0%) | $52,771 |
Occupancy by Householder Income Bracket in West Wareham
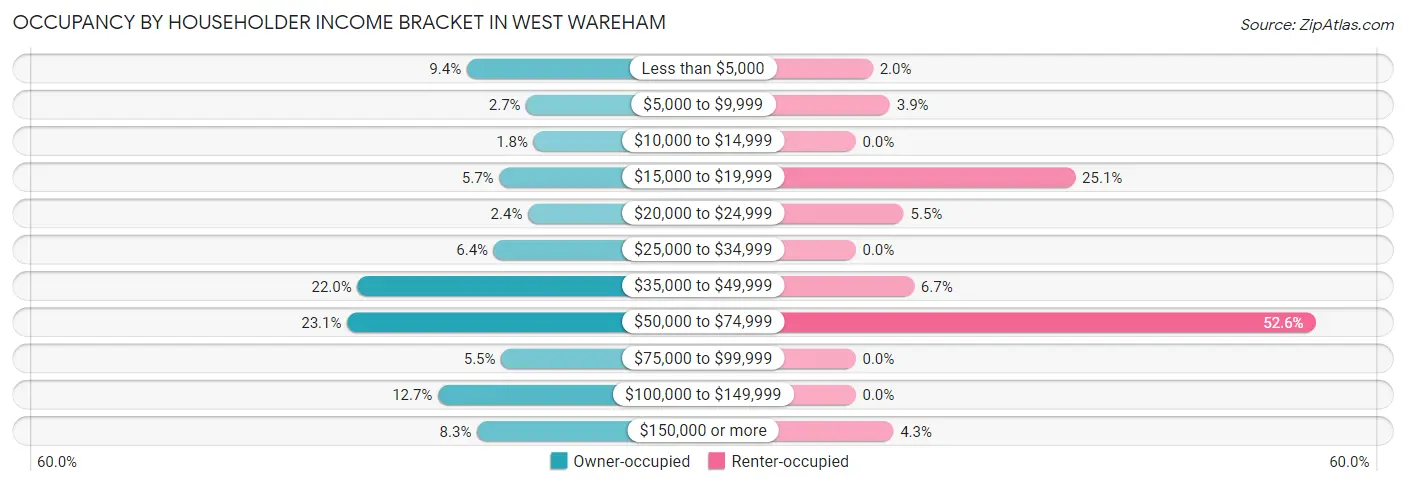
| Income Bracket | Owner-occupied | Renter-occupied |
| Less than $5,000 | 89 (9.4%) | 5 (2.0%) |
| $5,000 to $9,999 | 25 (2.6%) | 10 (3.9%) |
| $10,000 to $14,999 | 17 (1.8%) | 0 (0.0%) |
| $15,000 to $19,999 | 54 (5.7%) | 64 (25.1%) |
| $20,000 to $24,999 | 23 (2.4%) | 14 (5.5%) |
| $25,000 to $34,999 | 60 (6.4%) | 0 (0.0%) |
| $35,000 to $49,999 | 207 (22.0%) | 17 (6.7%) |
| $50,000 to $74,999 | 218 (23.1%) | 134 (52.5%) |
| $75,000 to $99,999 | 52 (5.5%) | 0 (0.0%) |
| $100,000 to $149,999 | 120 (12.7%) | 0 (0.0%) |
| $150,000 or more | 78 (8.3%) | 11 (4.3%) |
| Total | 943 (100.0%) | 255 (100.0%) |
Monthly Housing Cost Tiers in West Wareham
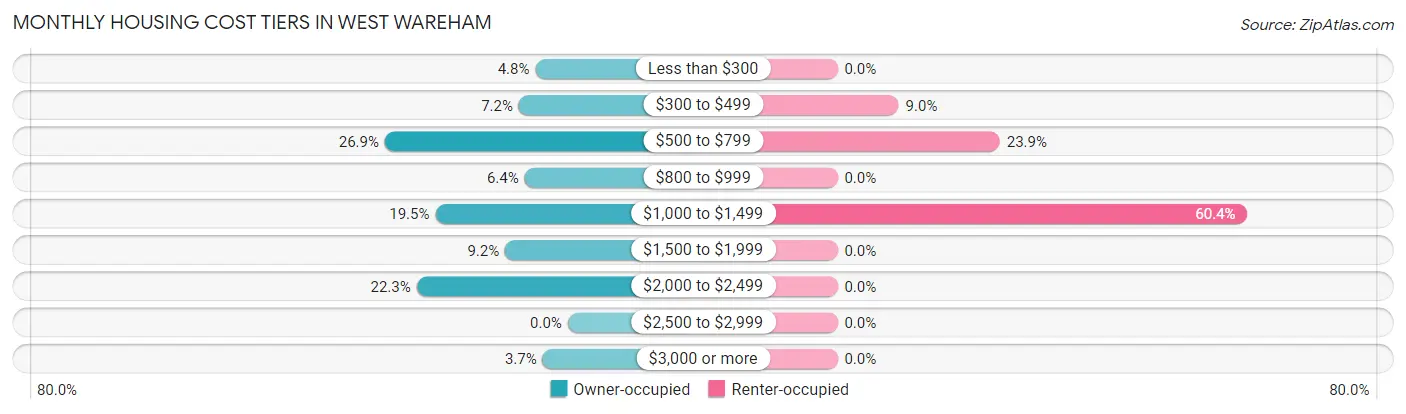
| Monthly Cost | Owner-occupied | Renter-occupied |
| Less than $300 | 45 (4.8%) | 0 (0.0%) |
| $300 to $499 | 68 (7.2%) | 23 (9.0%) |
| $500 to $799 | 254 (26.9%) | 61 (23.9%) |
| $800 to $999 | 60 (6.4%) | 0 (0.0%) |
| $1,000 to $1,499 | 184 (19.5%) | 154 (60.4%) |
| $1,500 to $1,999 | 87 (9.2%) | 0 (0.0%) |
| $2,000 to $2,499 | 210 (22.3%) | 0 (0.0%) |
| $2,500 to $2,999 | 0 (0.0%) | 0 (0.0%) |
| $3,000 or more | 35 (3.7%) | 0 (0.0%) |
| Total | 943 (100.0%) | 255 (100.0%) |
Physical Housing Characteristics in West Wareham
Housing Structures in West Wareham
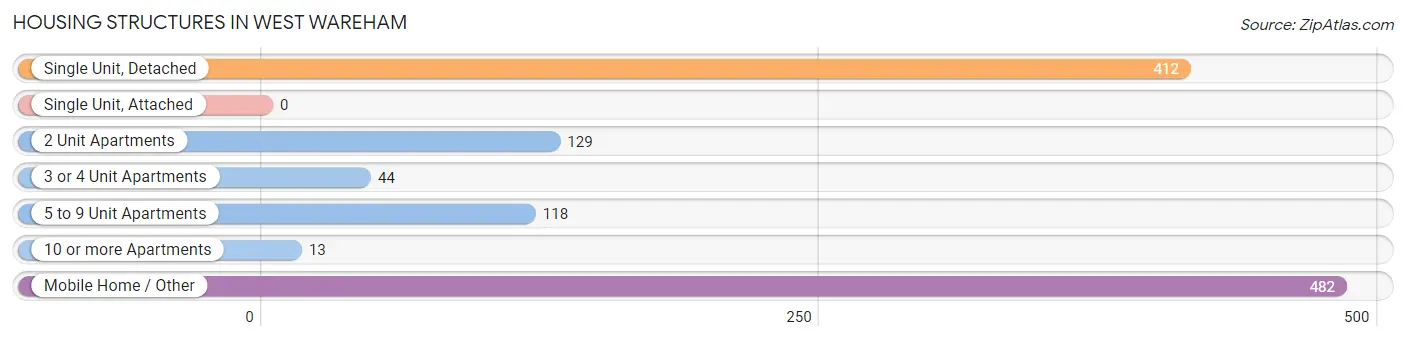
| Structure Type | # Housing Units | % Housing Units |
| Single Unit, Detached | 412 | 34.4% |
| Single Unit, Attached | 0 | 0.0% |
| 2 Unit Apartments | 129 | 10.8% |
| 3 or 4 Unit Apartments | 44 | 3.7% |
| 5 to 9 Unit Apartments | 118 | 9.9% |
| 10 or more Apartments | 13 | 1.1% |
| Mobile Home / Other | 482 | 40.2% |
| Total | 1,198 | 100.0% |
Housing Structures by Occupancy in West Wareham
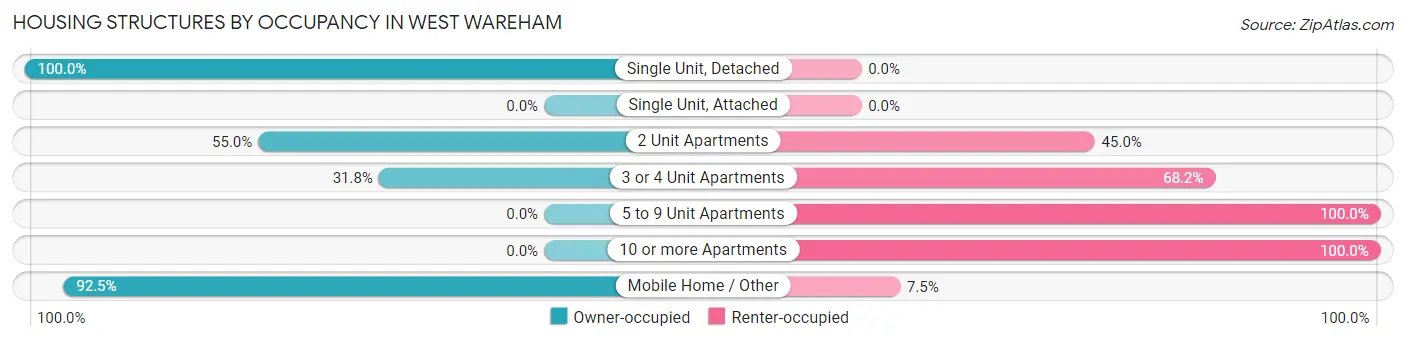
| Structure Type | Owner-occupied | Renter-occupied |
| Single Unit, Detached | 412 (100.0%) | 0 (0.0%) |
| Single Unit, Attached | 0 (0.0%) | 0 (0.0%) |
| 2 Unit Apartments | 71 (55.0%) | 58 (45.0%) |
| 3 or 4 Unit Apartments | 14 (31.8%) | 30 (68.2%) |
| 5 to 9 Unit Apartments | 0 (0.0%) | 118 (100.0%) |
| 10 or more Apartments | 0 (0.0%) | 13 (100.0%) |
| Mobile Home / Other | 446 (92.5%) | 36 (7.5%) |
| Total | 943 (78.7%) | 255 (21.3%) |
Housing Structures by Number of Rooms in West Wareham
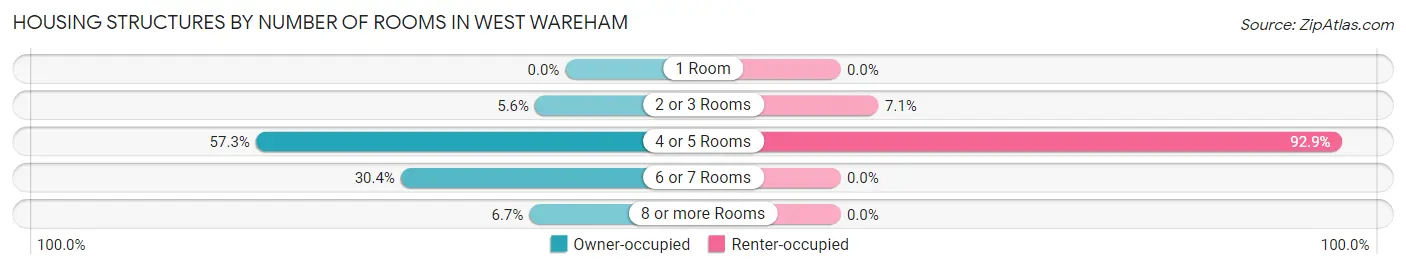
| Number of Rooms | Owner-occupied | Renter-occupied |
| 1 Room | 0 (0.0%) | 0 (0.0%) |
| 2 or 3 Rooms | 53 (5.6%) | 18 (7.1%) |
| 4 or 5 Rooms | 540 (57.3%) | 237 (92.9%) |
| 6 or 7 Rooms | 287 (30.4%) | 0 (0.0%) |
| 8 or more Rooms | 63 (6.7%) | 0 (0.0%) |
| Total | 943 (100.0%) | 255 (100.0%) |
Housing Structure by Heating Type in West Wareham
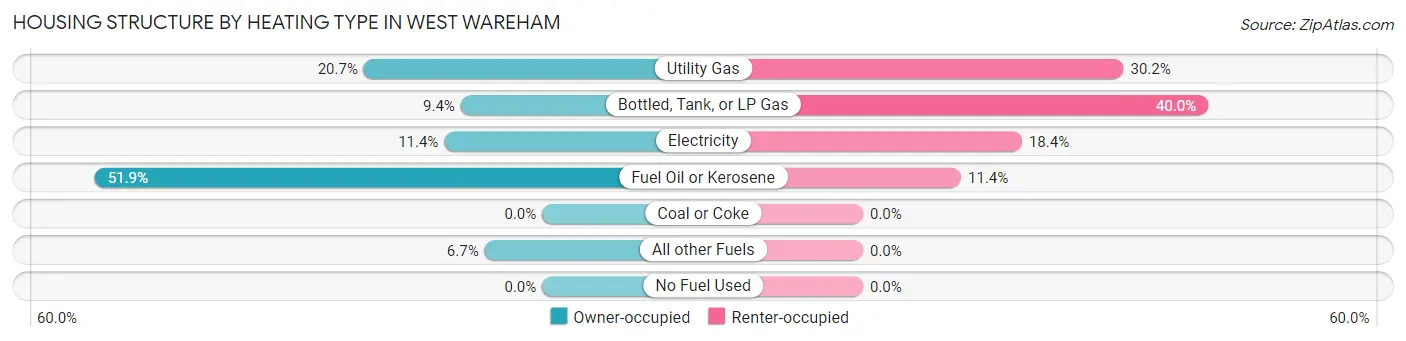
| Heating Type | Owner-occupied | Renter-occupied |
| Utility Gas | 195 (20.7%) | 77 (30.2%) |
| Bottled, Tank, or LP Gas | 89 (9.4%) | 102 (40.0%) |
| Electricity | 107 (11.4%) | 47 (18.4%) |
| Fuel Oil or Kerosene | 489 (51.9%) | 29 (11.4%) |
| Coal or Coke | 0 (0.0%) | 0 (0.0%) |
| All other Fuels | 63 (6.7%) | 0 (0.0%) |
| No Fuel Used | 0 (0.0%) | 0 (0.0%) |
| Total | 943 (100.0%) | 255 (100.0%) |
Household Vehicle Usage in West Wareham
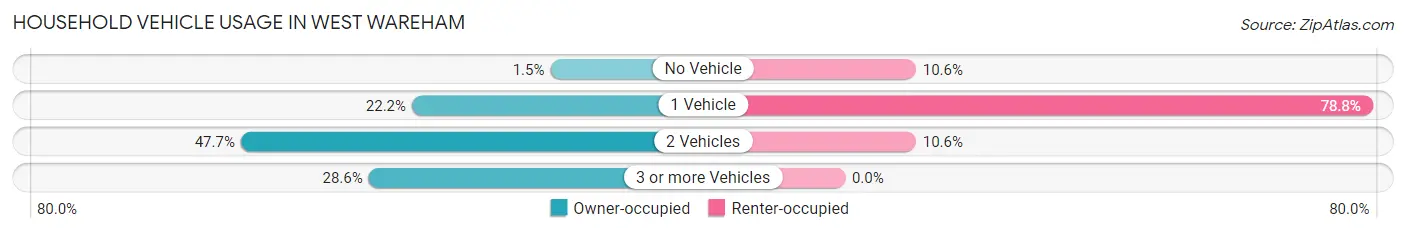
| Vehicles per Household | Owner-occupied | Renter-occupied |
| No Vehicle | 14 (1.5%) | 27 (10.6%) |
| 1 Vehicle | 209 (22.2%) | 201 (78.8%) |
| 2 Vehicles | 450 (47.7%) | 27 (10.6%) |
| 3 or more Vehicles | 270 (28.6%) | 0 (0.0%) |
| Total | 943 (100.0%) | 255 (100.0%) |
Real Estate & Mortgages in West Wareham
Real Estate and Mortgage Overview in West Wareham
| Characteristic | Without Mortgage | With Mortgage |
| Housing Units | 508 | 435 |
| Median Property Value | $184,800 | $366,500 |
| Median Household Income | $39,848 | $14 |
| Monthly Housing Costs | $723 | $35 |
| Real Estate Taxes | $2,986 | $109 |
Property Value by Mortgage Status in West Wareham
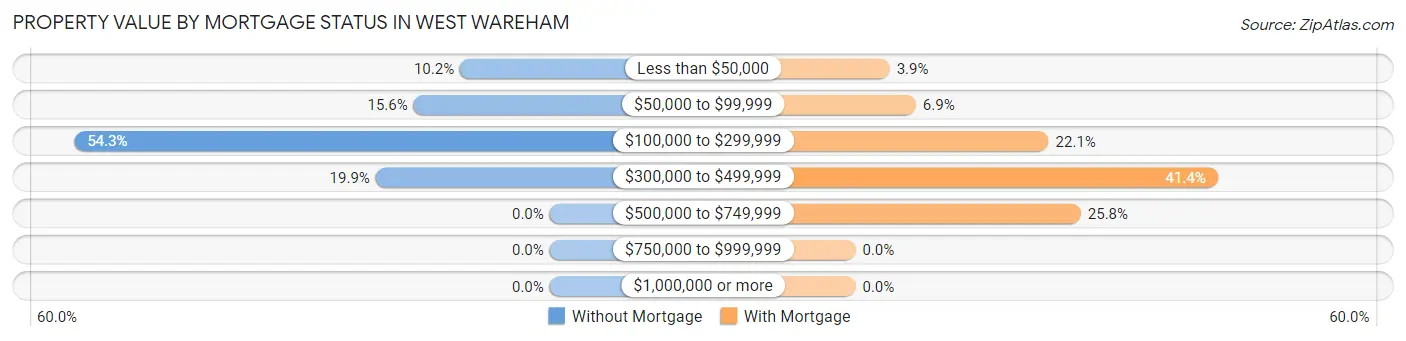
| Property Value | Without Mortgage | With Mortgage |
| Less than $50,000 | 52 (10.2%) | 17 (3.9%) |
| $50,000 to $99,999 | 79 (15.5%) | 30 (6.9%) |
| $100,000 to $299,999 | 276 (54.3%) | 96 (22.1%) |
| $300,000 to $499,999 | 101 (19.9%) | 180 (41.4%) |
| $500,000 to $749,999 | 0 (0.0%) | 112 (25.8%) |
| $750,000 to $999,999 | 0 (0.0%) | 0 (0.0%) |
| $1,000,000 or more | 0 (0.0%) | 0 (0.0%) |
| Total | 508 (100.0%) | 435 (100.0%) |
Household Income by Mortgage Status in West Wareham
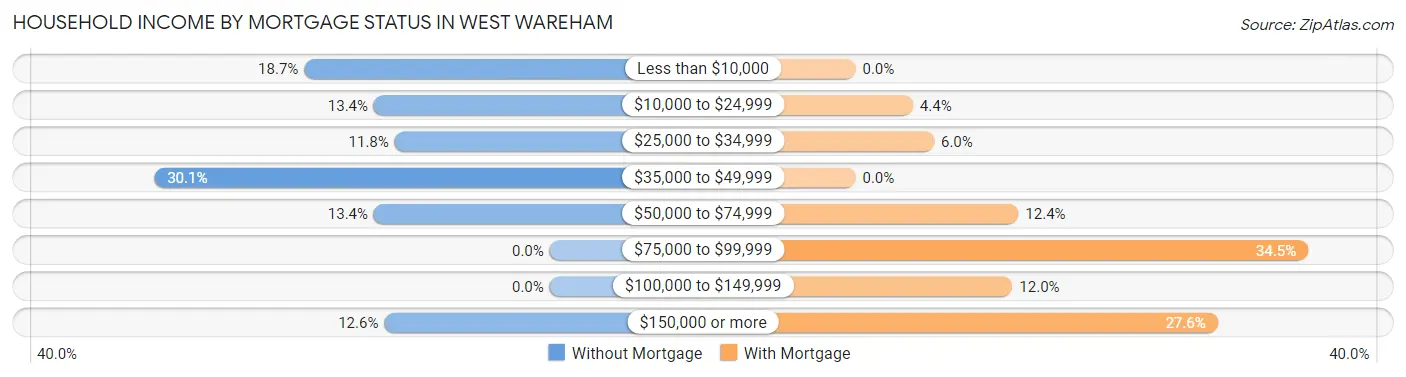
| Household Income | Without Mortgage | With Mortgage |
| Less than $10,000 | 95 (18.7%) | 0 (0.0%) |
| $10,000 to $24,999 | 68 (13.4%) | 19 (4.4%) |
| $25,000 to $34,999 | 60 (11.8%) | 26 (6.0%) |
| $35,000 to $49,999 | 153 (30.1%) | 0 (0.0%) |
| $50,000 to $74,999 | 68 (13.4%) | 54 (12.4%) |
| $75,000 to $99,999 | 0 (0.0%) | 150 (34.5%) |
| $100,000 to $149,999 | 0 (0.0%) | 52 (11.9%) |
| $150,000 or more | 64 (12.6%) | 120 (27.6%) |
| Total | 508 (100.0%) | 435 (100.0%) |
Property Value to Household Income Ratio in West Wareham
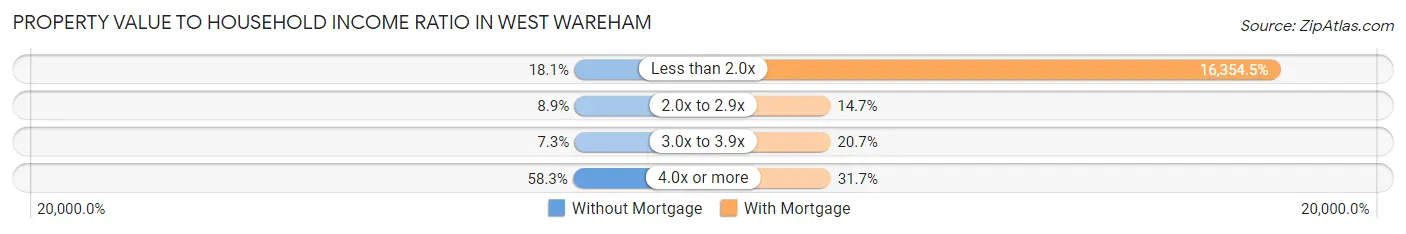
| Value-to-Income Ratio | Without Mortgage | With Mortgage |
| Less than 2.0x | 92 (18.1%) | 71,142 (16,354.5%) |
| 2.0x to 2.9x | 45 (8.9%) | 64 (14.7%) |
| 3.0x to 3.9x | 37 (7.3%) | 90 (20.7%) |
| 4.0x or more | 296 (58.3%) | 138 (31.7%) |
| Total | 508 (100.0%) | 435 (100.0%) |
Real Estate Taxes by Mortgage Status in West Wareham
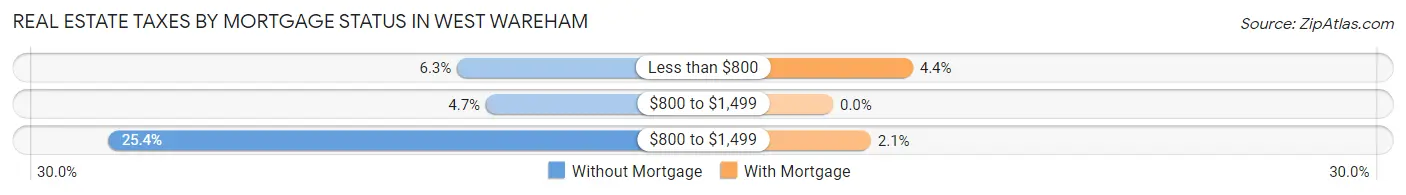
| Property Taxes | Without Mortgage | With Mortgage |
| Less than $800 | 32 (6.3%) | 19 (4.4%) |
| $800 to $1,499 | 24 (4.7%) | 0 (0.0%) |
| $800 to $1,499 | 129 (25.4%) | 9 (2.1%) |
| Total | 508 (100.0%) | 435 (100.0%) |
Health & Disability in West Wareham
Health Insurance Coverage by Age in West Wareham
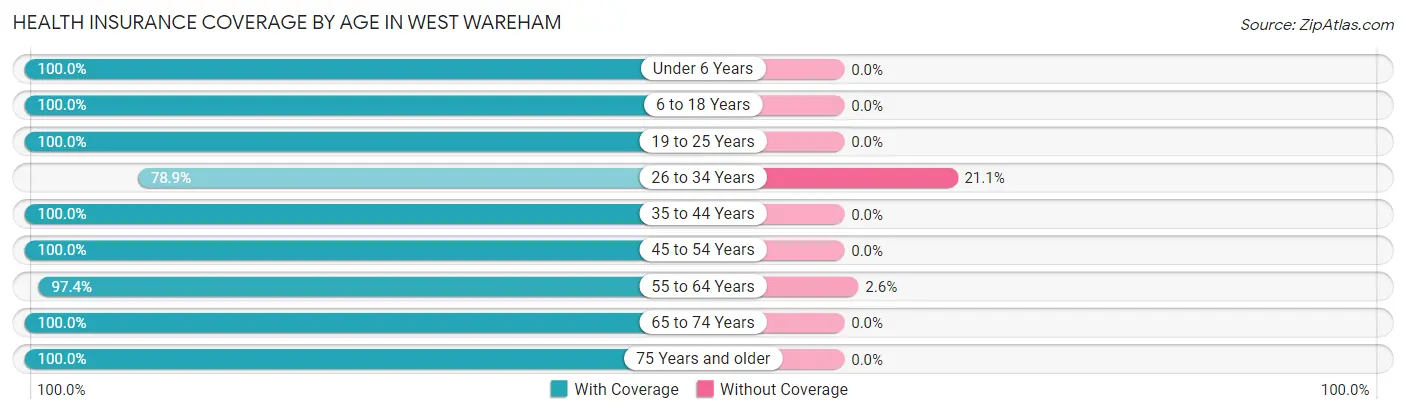
| Age Bracket | With Coverage | Without Coverage |
| Under 6 Years | 19 (100.0%) | 0 (0.0%) |
| 6 to 18 Years | 394 (100.0%) | 0 (0.0%) |
| 19 to 25 Years | 120 (100.0%) | 0 (0.0%) |
| 26 to 34 Years | 340 (78.9%) | 91 (21.1%) |
| 35 to 44 Years | 107 (100.0%) | 0 (0.0%) |
| 45 to 54 Years | 125 (100.0%) | 0 (0.0%) |
| 55 to 64 Years | 519 (97.4%) | 14 (2.6%) |
| 65 to 74 Years | 382 (100.0%) | 0 (0.0%) |
| 75 Years and older | 494 (100.0%) | 0 (0.0%) |
| Total | 2,500 (96.0%) | 105 (4.0%) |
Health Insurance Coverage by Citizenship Status in West Wareham
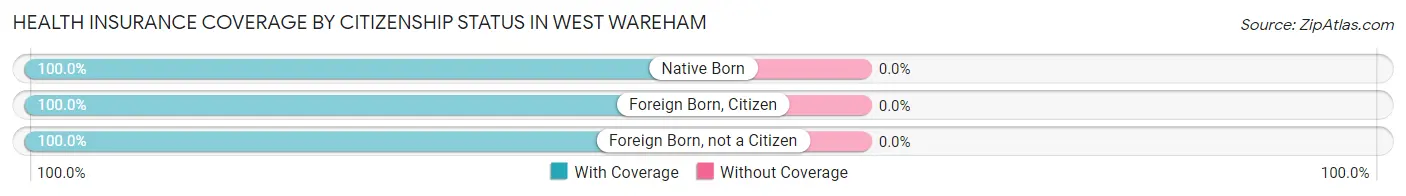
| Citizenship Status | With Coverage | Without Coverage |
| Native Born | 19 (100.0%) | 0 (0.0%) |
| Foreign Born, Citizen | 394 (100.0%) | 0 (0.0%) |
| Foreign Born, not a Citizen | 120 (100.0%) | 0 (0.0%) |
Health Insurance Coverage by Household Income in West Wareham
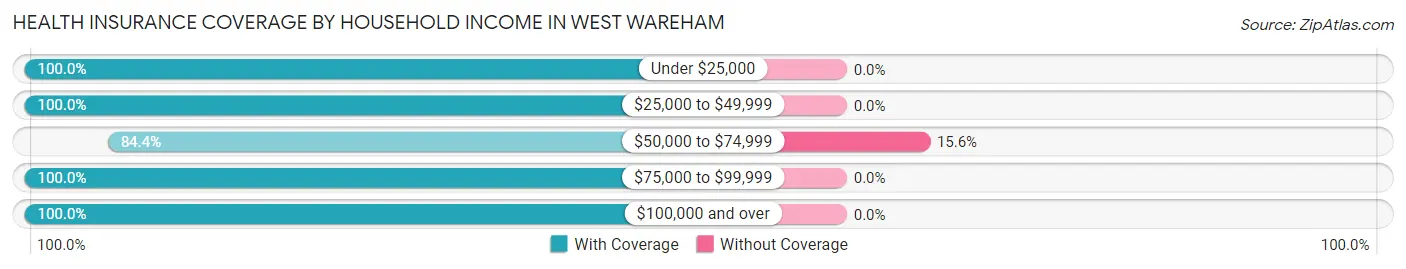
| Household Income | With Coverage | Without Coverage |
| Under $25,000 | 384 (100.0%) | 0 (0.0%) |
| $25,000 to $49,999 | 616 (100.0%) | 0 (0.0%) |
| $50,000 to $74,999 | 569 (84.4%) | 105 (15.6%) |
| $75,000 to $99,999 | 128 (100.0%) | 0 (0.0%) |
| $100,000 and over | 801 (100.0%) | 0 (0.0%) |
Public vs Private Health Insurance Coverage by Age in West Wareham
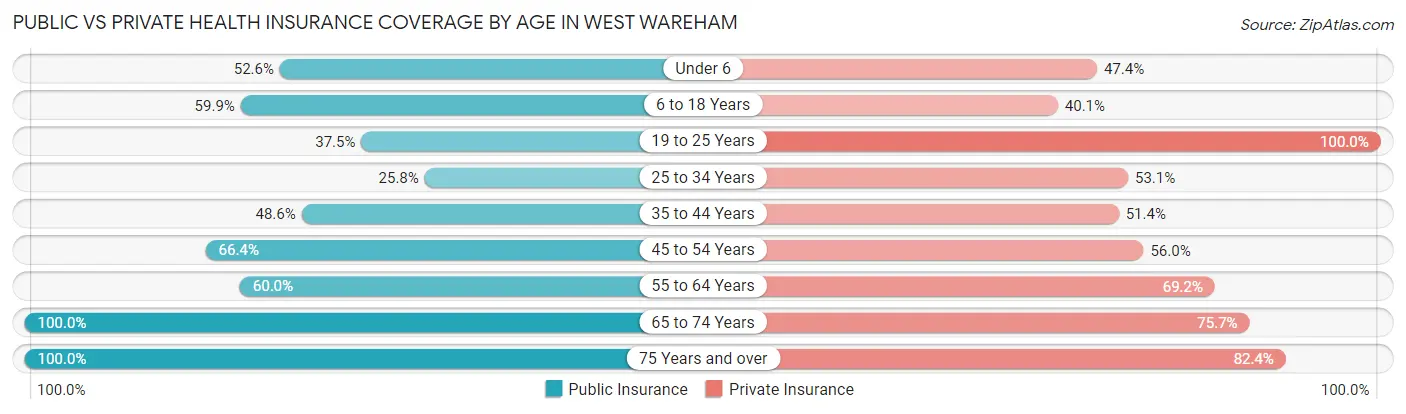
| Age Bracket | Public Insurance | Private Insurance |
| Under 6 | 10 (52.6%) | 9 (47.4%) |
| 6 to 18 Years | 236 (59.9%) | 158 (40.1%) |
| 19 to 25 Years | 45 (37.5%) | 120 (100.0%) |
| 25 to 34 Years | 111 (25.8%) | 229 (53.1%) |
| 35 to 44 Years | 52 (48.6%) | 55 (51.4%) |
| 45 to 54 Years | 83 (66.4%) | 70 (56.0%) |
| 55 to 64 Years | 320 (60.0%) | 369 (69.2%) |
| 65 to 74 Years | 382 (100.0%) | 289 (75.6%) |
| 75 Years and over | 494 (100.0%) | 407 (82.4%) |
| Total | 1,733 (66.5%) | 1,706 (65.5%) |
Disability Status by Sex by Age in West Wareham
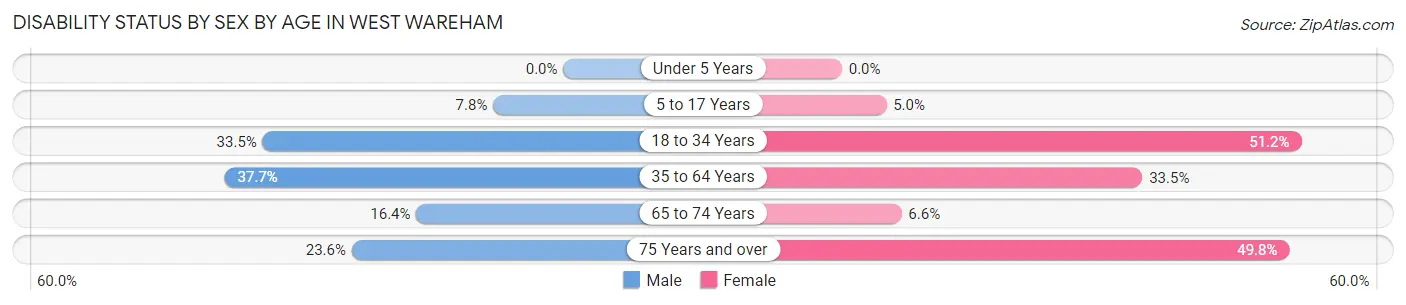
| Age Bracket | Male | Female |
| Under 5 Years | 0 (0.0%) | 0 (0.0%) |
| 5 to 17 Years | 15 (7.8%) | 10 (5.0%) |
| 18 to 34 Years | 70 (33.5%) | 175 (51.2%) |
| 35 to 64 Years | 97 (37.7%) | 170 (33.5%) |
| 65 to 74 Years | 28 (16.4%) | 14 (6.6%) |
| 75 Years and over | 45 (23.6%) | 151 (49.8%) |
Disability Class by Sex by Age in West Wareham
Disability Class: Hearing Difficulty
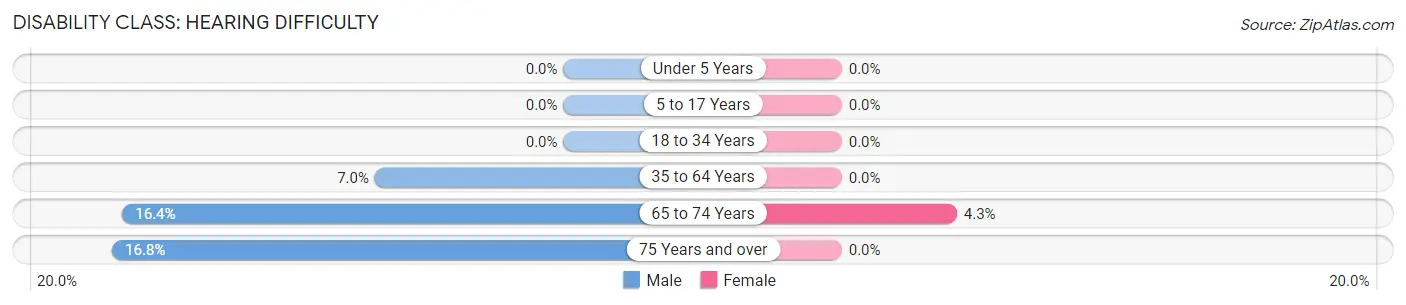
| Age Bracket | Male | Female |
| Under 5 Years | 0 (0.0%) | 0 (0.0%) |
| 5 to 17 Years | 0 (0.0%) | 0 (0.0%) |
| 18 to 34 Years | 0 (0.0%) | 0 (0.0%) |
| 35 to 64 Years | 18 (7.0%) | 0 (0.0%) |
| 65 to 74 Years | 28 (16.4%) | 9 (4.3%) |
| 75 Years and over | 32 (16.8%) | 0 (0.0%) |
Disability Class: Vision Difficulty
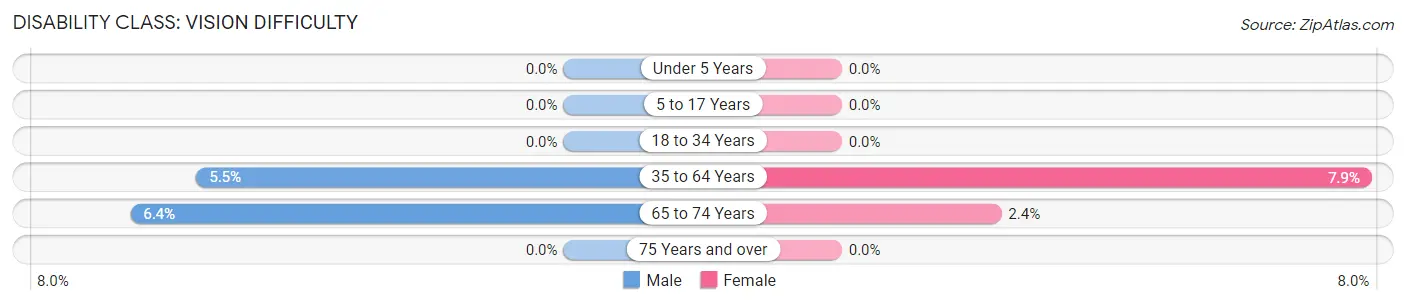
| Age Bracket | Male | Female |
| Under 5 Years | 0 (0.0%) | 0 (0.0%) |
| 5 to 17 Years | 0 (0.0%) | 0 (0.0%) |
| 18 to 34 Years | 0 (0.0%) | 0 (0.0%) |
| 35 to 64 Years | 14 (5.4%) | 40 (7.9%) |
| 65 to 74 Years | 11 (6.4%) | 5 (2.4%) |
| 75 Years and over | 0 (0.0%) | 0 (0.0%) |
Disability Class: Cognitive Difficulty
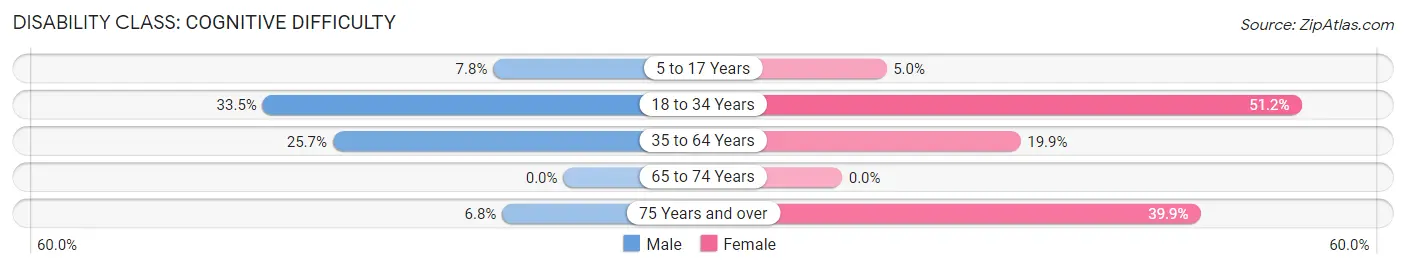
| Age Bracket | Male | Female |
| 5 to 17 Years | 15 (7.8%) | 10 (5.0%) |
| 18 to 34 Years | 70 (33.5%) | 175 (51.2%) |
| 35 to 64 Years | 66 (25.7%) | 101 (19.9%) |
| 65 to 74 Years | 0 (0.0%) | 0 (0.0%) |
| 75 Years and over | 13 (6.8%) | 121 (39.9%) |
Disability Class: Ambulatory Difficulty
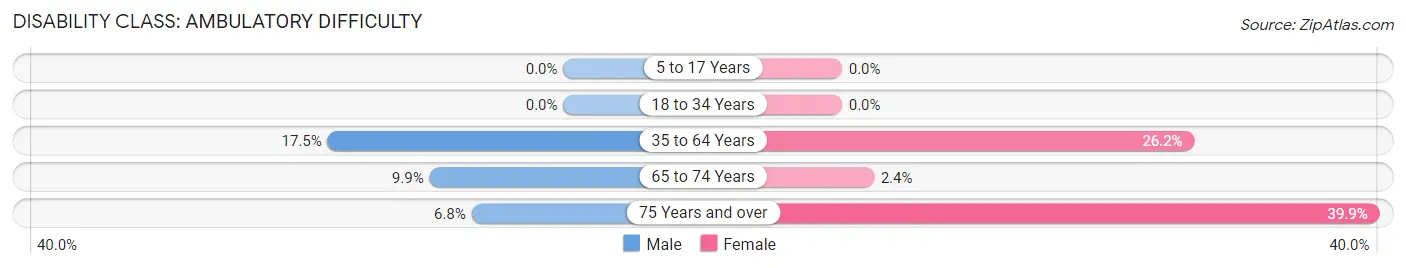
| Age Bracket | Male | Female |
| 5 to 17 Years | 0 (0.0%) | 0 (0.0%) |
| 18 to 34 Years | 0 (0.0%) | 0 (0.0%) |
| 35 to 64 Years | 45 (17.5%) | 133 (26.2%) |
| 65 to 74 Years | 17 (9.9%) | 5 (2.4%) |
| 75 Years and over | 13 (6.8%) | 121 (39.9%) |
Disability Class: Self-Care Difficulty
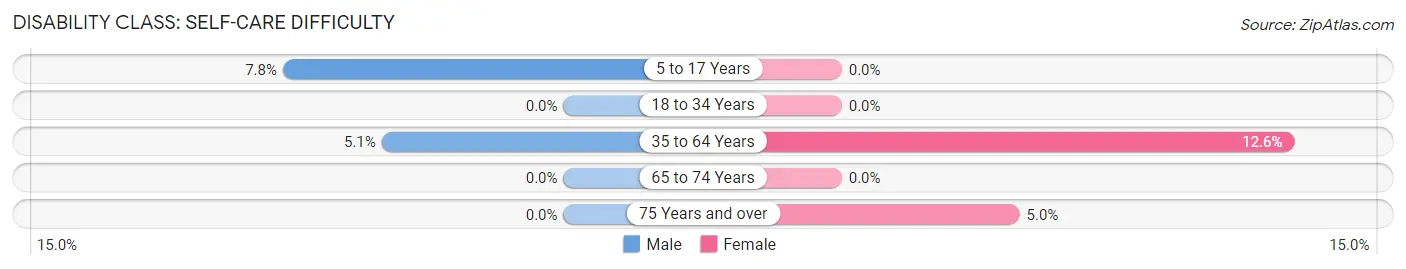
| Age Bracket | Male | Female |
| 5 to 17 Years | 15 (7.8%) | 0 (0.0%) |
| 18 to 34 Years | 0 (0.0%) | 0 (0.0%) |
| 35 to 64 Years | 13 (5.1%) | 64 (12.6%) |
| 65 to 74 Years | 0 (0.0%) | 0 (0.0%) |
| 75 Years and over | 0 (0.0%) | 15 (5.0%) |
Technology Access in West Wareham
Computing Device Access in West Wareham
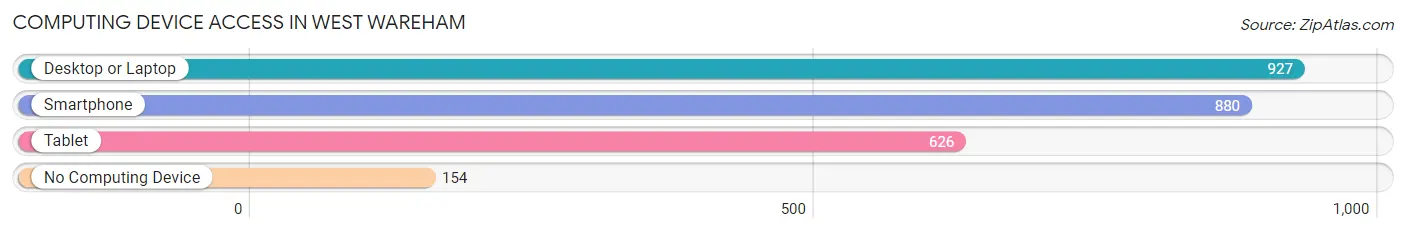
| Device Type | # Households | % Households |
| Desktop or Laptop | 927 | 77.4% |
| Smartphone | 880 | 73.5% |
| Tablet | 626 | 52.2% |
| No Computing Device | 154 | 12.9% |
| Total | 1,198 | 100.0% |
Internet Access in West Wareham
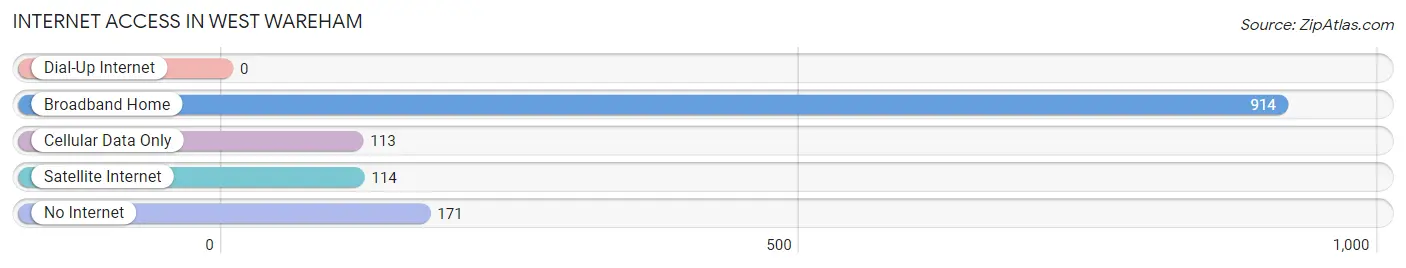
| Internet Type | # Households | % Households |
| Dial-Up Internet | 0 | 0.0% |
| Broadband Home | 914 | 76.3% |
| Cellular Data Only | 113 | 9.4% |
| Satellite Internet | 114 | 9.5% |
| No Internet | 171 | 14.3% |
| Total | 1,198 | 100.0% |
West Wareham Summary
Wareham is a town located in Plymouth County, Massachusetts, United States. It is situated on the western shore of Buzzards Bay, approximately 50 miles south of Boston. The town is bordered by Marion to the northeast, Rochester to the southeast, and Bourne to the southwest. Wareham is part of the Greater Boston metropolitan area and is home to a population of approximately 21,000 people.
History
The area that is now Wareham was originally inhabited by the Wampanoag people. The town was first settled in 1678 by Europeans, who named it Agawam Plantation. The town was incorporated in 1739 and renamed Wareham. The town was named after Wareham, England, which was the hometown of the first settlers.
In the late 18th century, Wareham became a major shipbuilding center. The town was also home to several whaling and fishing fleets. During the 19th century, Wareham was a popular summer resort destination for wealthy Bostonians.
Geography
Wareham is located in southeastern Massachusetts, on the western shore of Buzzards Bay. The town is bordered by Marion to the northeast, Rochester to the southeast, and Bourne to the southwest. Wareham is approximately 50 miles south of Boston.
The town has a total area of 33.2 square miles, of which 28.2 square miles is land and 5.0 square miles is water. The town is located on the western shore of Buzzards Bay, and is home to several small islands, including Little Island, Great Island, and Round Island.
Economy
The economy of Wareham is largely based on tourism and retail. The town is home to several popular tourist attractions, including the Wareham Village Historic District, the Onset Bay Marina, and the Weweantic River. The town is also home to several retail stores, restaurants, and other businesses.
The town is also home to several manufacturing companies, including the Wareham Forge, which produces metal products, and the Wareham Foundry, which produces cast iron products.
Demographics
As of the 2010 census, there were 21,822 people, 8,845 households, and 5,845 families residing in the town. The population density was 771.3 people per square mile. The racial makeup of the town was 94.2% White, 2.2% African American, 0.5% Native American, 0.7% Asian, 0.1% Pacific Islander, 0.9% from other races, and 1.4% from two or more races. Hispanic or Latino of any race were 2.2% of the population.
The median income for a household in the town was $50,945, and the median income for a family was $60,945. The per capita income for the town was $25,945. About 6.2% of families and 8.3% of the population were below the poverty line, including 11.2% of those under age 18 and 6.2% of those age 65 or over.
Common Questions
What is Per Capita Income in West Wareham?
Per Capita income in West Wareham is $32,046.
What is the Median Family Income in West Wareham?
Median Family Income in West Wareham is $53,967.
What is the Median Household income in West Wareham?
Median Household Income in West Wareham is $52,771.
What is Income or Wage Gap in West Wareham?
Income or Wage Gap in West Wareham is 32.4%.
Women in West Wareham earn 67.6 cents for every dollar earned by a man.
What is Inequality or Gini Index in West Wareham?
Inequality or Gini Index in West Wareham is 0.49.
What is the Total Population of West Wareham?
Total Population of West Wareham is 2,605.
What is the Total Male Population of West Wareham?
Total Male Population of West Wareham is 1,029.
What is the Total Female Population of West Wareham?
Total Female Population of West Wareham is 1,576.
What is the Ratio of Males per 100 Females in West Wareham?
There are 65.29 Males per 100 Females in West Wareham.
What is the Ratio of Females per 100 Males in West Wareham?
There are 153.16 Females per 100 Males in West Wareham.
What is the Median Population Age in West Wareham?
Median Population Age in West Wareham is 58.4 Years.
What is the Average Family Size in West Wareham
Average Family Size in West Wareham is 2.5 People.
What is the Average Household Size in West Wareham
Average Household Size in West Wareham is 2.2 People.
How Large is the Labor Force in West Wareham?
There are 1,162 People in the Labor Forcein in West Wareham.
What is the Percentage of People in the Labor Force in West Wareham?
52.7% of People are in the Labor Force in West Wareham.
What is the Unemployment Rate in West Wareham?
Unemployment Rate in West Wareham is 5.6%.