West Melbourne, FL Map & Demographics
West Melbourne Map
West Melbourne Overview
$38,330
PER CAPITA INCOME
$103,182
AVG FAMILY INCOME
$86,398
AVG HOUSEHOLD INCOME
40.7%
WAGE / INCOME GAP [ % ]
59.3¢/ $1
WAGE / INCOME GAP [ $ ]
0.36
INEQUALITY / GINI INDEX
26,762
TOTAL POPULATION
13,359
MALE POPULATION
13,403
FEMALE POPULATION
99.67
MALES / 100 FEMALES
100.33
FEMALES / 100 MALES
40.9
MEDIAN AGE
3.3
AVG FAMILY SIZE
2.6
AVG HOUSEHOLD SIZE
13,066
LABOR FORCE [ PEOPLE ]
60.2%
PERCENT IN LABOR FORCE
4.9%
UNEMPLOYMENT RATE
West Melbourne Area Codes
Income in West Melbourne
Income Overview in West Melbourne
Per Capita Income in West Melbourne is $38,330, while median incomes of families and households are $103,182 and $86,398 respectively.
| Characteristic | Number | Measure |
| Per Capita Income | 26,762 | $38,330 |
| Median Family Income | 6,468 | $103,182 |
| Mean Family Income | 6,468 | $116,306 |
| Median Household Income | 9,980 | $86,398 |
| Mean Household Income | 9,980 | $99,475 |
| Income Deficit | 6,468 | $0 |
| Wage / Income Gap (%) | 26,762 | 40.68% |
| Wage / Income Gap ($) | 26,762 | 59.32¢ per $1 |
| Gini / Inequality Index | 26,762 | 0.36 |
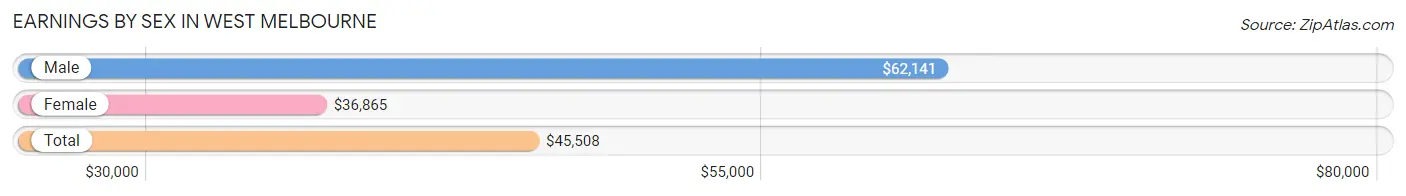
Earnings by Sex in West Melbourne
Average Earnings in West Melbourne are $45,508, $62,141 for men and $36,865 for women, a difference of 40.7%.
| Sex | Number | Average Earnings |
| Male | 7,103 (53.3%) | $62,141 |
| Female | 6,226 (46.7%) | $36,865 |
| Total | 13,329 (100.0%) | $45,508 |
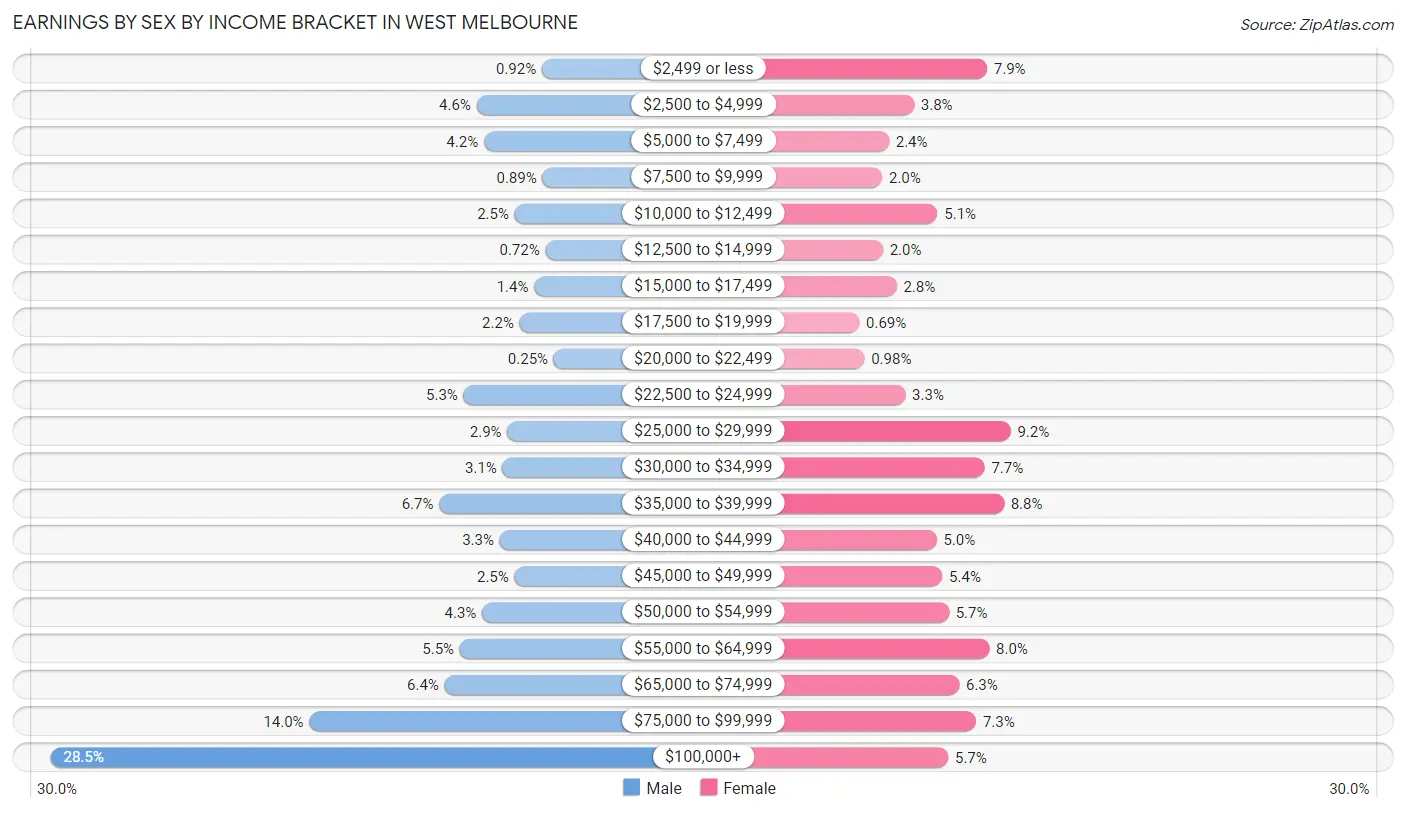
Earnings by Sex by Income Bracket in West Melbourne
The most common earnings brackets in West Melbourne are $100,000+ for men (2,027 | 28.5%) and $25,000 to $29,999 for women (573 | 9.2%).
| Income | Male | Female |
| $2,499 or less | 65 (0.9%) | 490 (7.9%) |
| $2,500 to $4,999 | 326 (4.6%) | 235 (3.8%) |
| $5,000 to $7,499 | 297 (4.2%) | 147 (2.4%) |
| $7,500 to $9,999 | 63 (0.9%) | 123 (2.0%) |
| $10,000 to $12,499 | 174 (2.5%) | 317 (5.1%) |
| $12,500 to $14,999 | 51 (0.7%) | 126 (2.0%) |
| $15,000 to $17,499 | 96 (1.3%) | 174 (2.8%) |
| $17,500 to $19,999 | 154 (2.2%) | 43 (0.7%) |
| $20,000 to $22,499 | 18 (0.3%) | 61 (1.0%) |
| $22,500 to $24,999 | 378 (5.3%) | 204 (3.3%) |
| $25,000 to $29,999 | 203 (2.9%) | 573 (9.2%) |
| $30,000 to $34,999 | 222 (3.1%) | 482 (7.7%) |
| $35,000 to $39,999 | 475 (6.7%) | 549 (8.8%) |
| $40,000 to $44,999 | 234 (3.3%) | 314 (5.0%) |
| $45,000 to $49,999 | 175 (2.5%) | 334 (5.4%) |
| $50,000 to $54,999 | 304 (4.3%) | 357 (5.7%) |
| $55,000 to $64,999 | 393 (5.5%) | 498 (8.0%) |
| $65,000 to $74,999 | 454 (6.4%) | 393 (6.3%) |
| $75,000 to $99,999 | 994 (14.0%) | 452 (7.3%) |
| $100,000+ | 2,027 (28.5%) | 354 (5.7%) |
| Total | 7,103 (100.0%) | 6,226 (100.0%) |
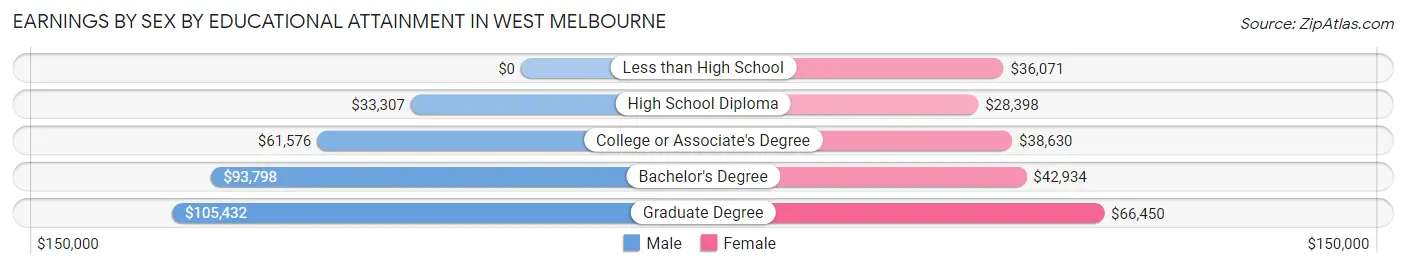
Earnings by Sex by Educational Attainment in West Melbourne
Average earnings in West Melbourne are $73,871 for men and $40,856 for women, a difference of 44.7%. Men with an educational attainment of graduate degree enjoy the highest average annual earnings of $105,432, while those with high school diploma education earn the least with $33,307. Women with an educational attainment of graduate degree earn the most with the average annual earnings of $66,450, while those with high school diploma education have the smallest earnings of $28,398.
| Educational Attainment | Male Income | Female Income |
| Less than High School | - | - |
| High School Diploma | $33,307 | $28,398 |
| College or Associate's Degree | $61,576 | $38,630 |
| Bachelor's Degree | $93,798 | $42,934 |
| Graduate Degree | $105,432 | $66,450 |
| Total | $73,871 | $40,856 |
Family Income in West Melbourne
Family Income Brackets in West Melbourne
According to the West Melbourne family income data, there are 1,656 families falling into the $100,000 to $149,999 income range, which is the most common income bracket and makes up 25.6% of all families. Conversely, the less than $10,000 income bracket is the least frequent group with only 19 families (0.3%) belonging to this category.
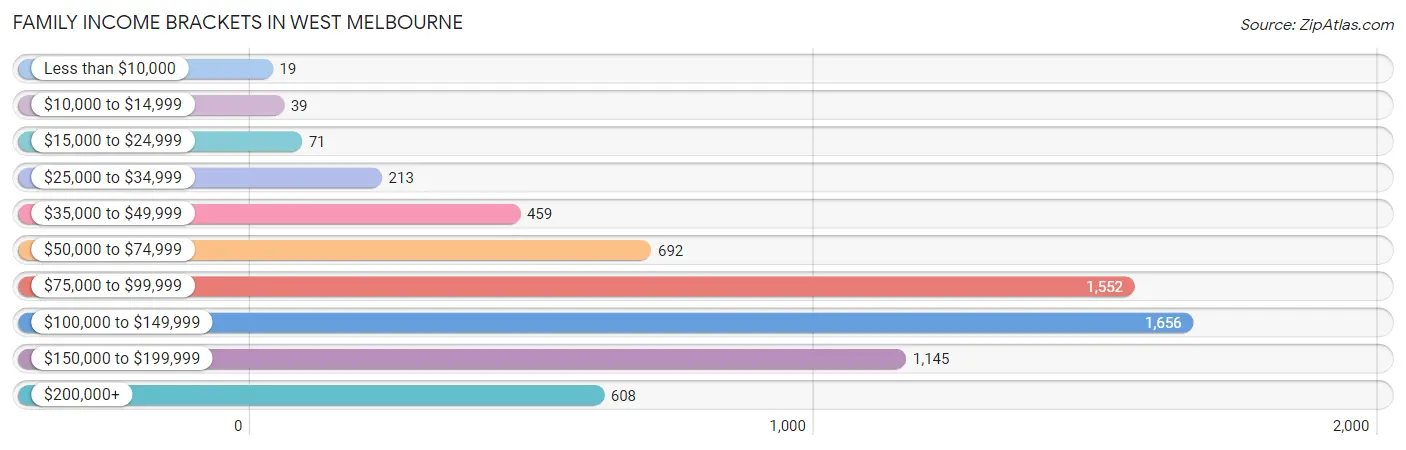
| Income Bracket | # Families | % Families |
| Less than $10,000 | 19 | 0.3% |
| $10,000 to $14,999 | 39 | 0.6% |
| $15,000 to $24,999 | 71 | 1.1% |
| $25,000 to $34,999 | 213 | 3.3% |
| $35,000 to $49,999 | 459 | 7.1% |
| $50,000 to $74,999 | 692 | 10.7% |
| $75,000 to $99,999 | 1,552 | 24.0% |
| $100,000 to $149,999 | 1,656 | 25.6% |
| $150,000 to $199,999 | 1,145 | 17.7% |
| $200,000+ | 608 | 9.4% |
Family Income by Famaliy Size in West Melbourne
5-person families (460 | 7.1%) account for the highest median family income in West Melbourne with $177,287 per family, while 2-person families (2,782 | 43.0%) have the highest median income of $40,214 per family member.
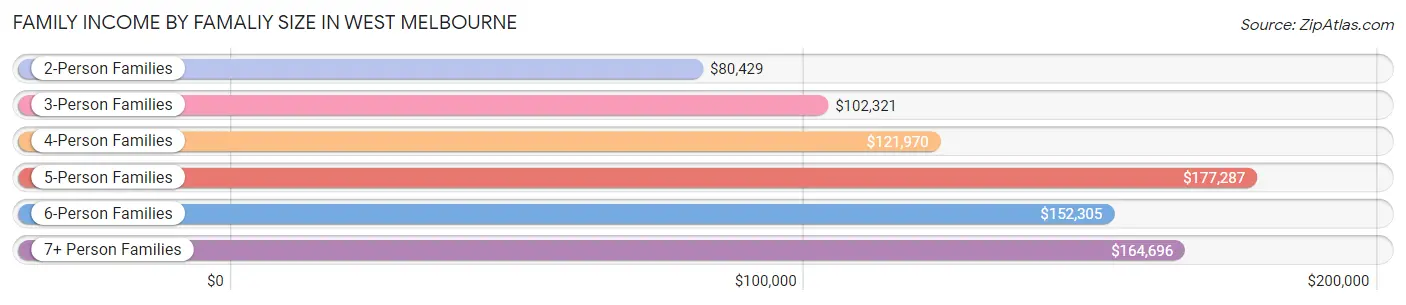
| Income Bracket | # Families | Median Income |
| 2-Person Families | 2,782 (43.0%) | $80,429 |
| 3-Person Families | 1,598 (24.7%) | $102,321 |
| 4-Person Families | 1,197 (18.5%) | $121,970 |
| 5-Person Families | 460 (7.1%) | $177,287 |
| 6-Person Families | 356 (5.5%) | $152,305 |
| 7+ Person Families | 75 (1.2%) | $164,696 |
| Total | 6,468 (100.0%) | $103,182 |
Family Income by Number of Earners in West Melbourne
The median family income in West Melbourne is $103,182, with families comprising 3+ earners (765) having the highest median family income of $142,986, while families with no earners (1,062) have the lowest median family income of $76,769, accounting for 11.8% and 16.4% of families, respectively.
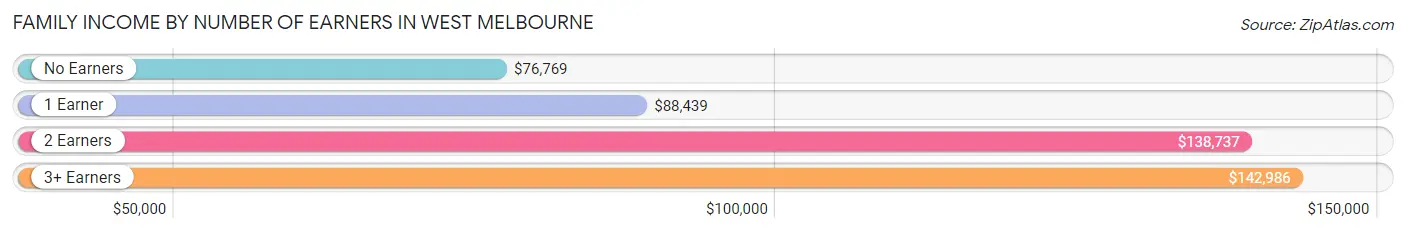
| Number of Earners | # Families | Median Income |
| No Earners | 1,062 (16.4%) | $76,769 |
| 1 Earner | 2,260 (34.9%) | $88,439 |
| 2 Earners | 2,381 (36.8%) | $138,737 |
| 3+ Earners | 765 (11.8%) | $142,986 |
| Total | 6,468 (100.0%) | $103,182 |
Household Income in West Melbourne
Household Income Brackets in West Melbourne
With 2,216 households falling in the category, the $100,000 to $149,999 income range is the most frequent in West Melbourne, accounting for 22.2% of all households. In contrast, only 80 households (0.8%) fall into the $10,000 to $14,999 income bracket, making it the least populous group.
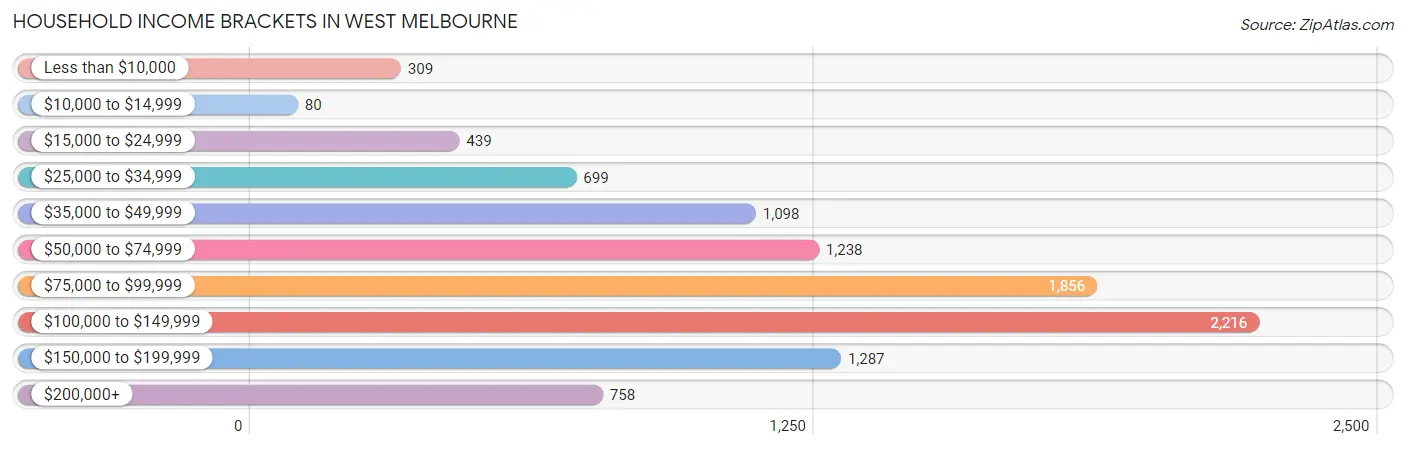
| Income Bracket | # Households | % Households |
| Less than $10,000 | 309 | 3.1% |
| $10,000 to $14,999 | 80 | 0.8% |
| $15,000 to $24,999 | 439 | 4.4% |
| $25,000 to $34,999 | 699 | 7.0% |
| $35,000 to $49,999 | 1,098 | 11.0% |
| $50,000 to $74,999 | 1,238 | 12.4% |
| $75,000 to $99,999 | 1,856 | 18.6% |
| $100,000 to $149,999 | 2,216 | 22.2% |
| $150,000 to $199,999 | 1,287 | 12.9% |
| $200,000+ | 758 | 7.6% |
Household Income by Householder Age in West Melbourne
The median household income in West Melbourne is $86,398, with the highest median household income of $120,420 found in the 25 to 44 years age bracket for the primary householder. A total of 2,811 households (28.2%) fall into this category. Meanwhile, the 15 to 24 years age bracket for the primary householder has the lowest median household income of $46,875, with 302 households (3.0%) in this group.
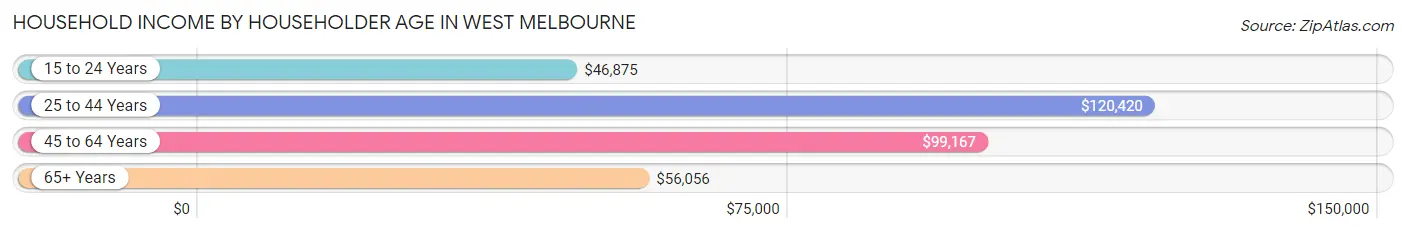
| Income Bracket | # Households | Median Income |
| 15 to 24 Years | 302 (3.0%) | $46,875 |
| 25 to 44 Years | 2,811 (28.2%) | $120,420 |
| 45 to 64 Years | 3,694 (37.0%) | $99,167 |
| 65+ Years | 3,173 (31.8%) | $56,056 |
| Total | 9,980 (100.0%) | $86,398 |
Poverty in West Melbourne
Income Below Poverty by Sex and Age in West Melbourne
With 5.9% poverty level for males and 4.4% for females among the residents of West Melbourne, 15 year old males and 18 to 24 year old females are the most vulnerable to poverty, with 18 males (19.6%) and 210 females (23.2%) in their respective age groups living below the poverty level.
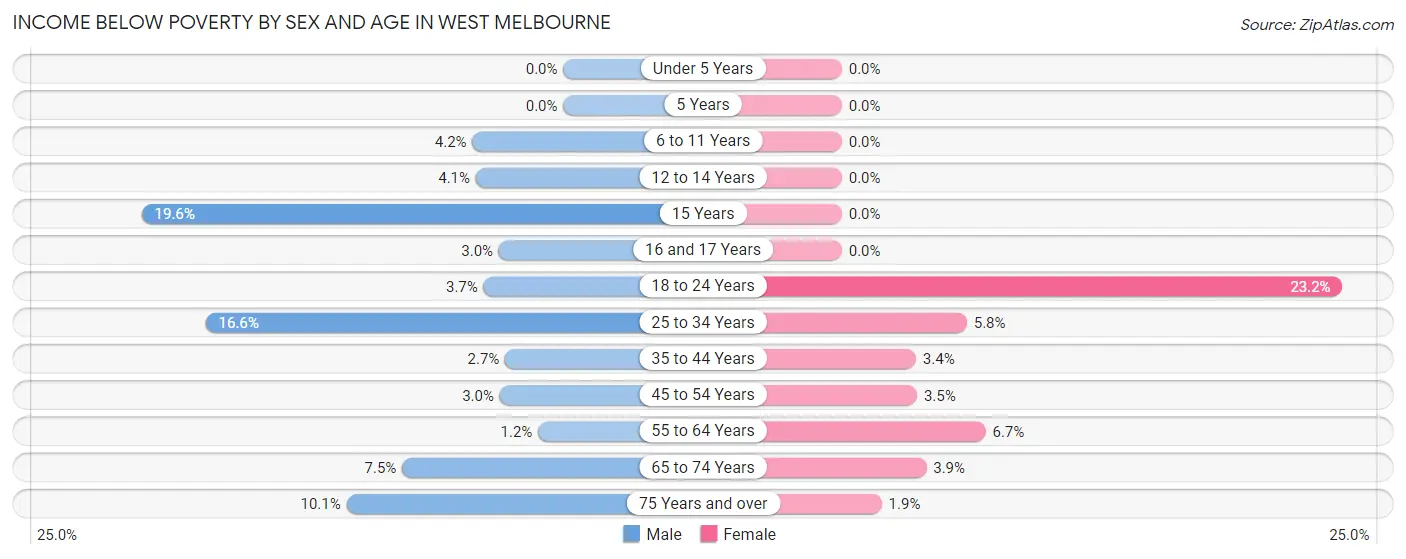
| Age Bracket | Male | Female |
| Under 5 Years | 0 (0.0%) | 0 (0.0%) |
| 5 Years | 0 (0.0%) | 0 (0.0%) |
| 6 to 11 Years | 51 (4.2%) | 0 (0.0%) |
| 12 to 14 Years | 22 (4.1%) | 0 (0.0%) |
| 15 Years | 18 (19.6%) | 0 (0.0%) |
| 16 and 17 Years | 11 (3.0%) | 0 (0.0%) |
| 18 to 24 Years | 48 (3.7%) | 210 (23.2%) |
| 25 to 34 Years | 339 (16.6%) | 77 (5.8%) |
| 35 to 44 Years | 43 (2.7%) | 52 (3.4%) |
| 45 to 54 Years | 54 (2.9%) | 74 (3.5%) |
| 55 to 64 Years | 17 (1.2%) | 86 (6.7%) |
| 65 to 74 Years | 78 (7.5%) | 55 (3.9%) |
| 75 Years and over | 99 (10.1%) | 30 (1.8%) |
| Total | 780 (5.9%) | 584 (4.4%) |
Income Above Poverty by Sex and Age in West Melbourne
According to the poverty statistics in West Melbourne, males aged under 5 years and females aged under 5 years are the age groups that are most secure financially, with 100.0% of males and 100.0% of females in these age groups living above the poverty line.
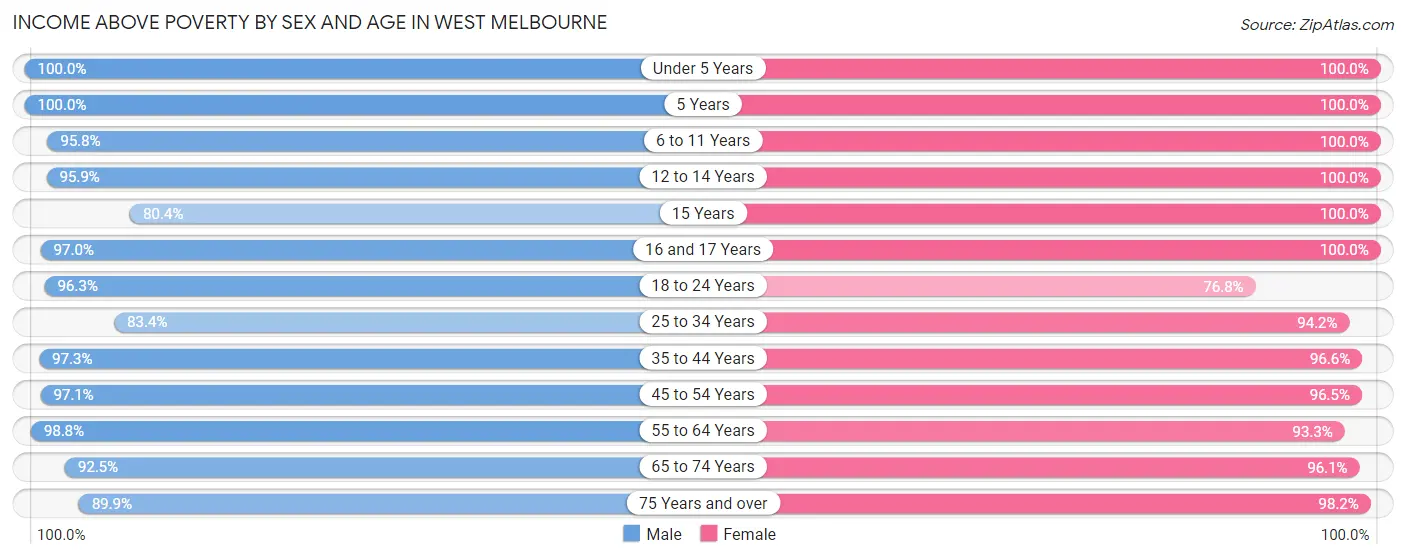
| Age Bracket | Male | Female |
| Under 5 Years | 558 (100.0%) | 885 (100.0%) |
| 5 Years | 112 (100.0%) | 71 (100.0%) |
| 6 to 11 Years | 1,158 (95.8%) | 796 (100.0%) |
| 12 to 14 Years | 520 (95.9%) | 593 (100.0%) |
| 15 Years | 74 (80.4%) | 147 (100.0%) |
| 16 and 17 Years | 357 (97.0%) | 472 (100.0%) |
| 18 to 24 Years | 1,248 (96.3%) | 694 (76.8%) |
| 25 to 34 Years | 1,703 (83.4%) | 1,250 (94.2%) |
| 35 to 44 Years | 1,550 (97.3%) | 1,460 (96.6%) |
| 45 to 54 Years | 1,779 (97.1%) | 2,049 (96.5%) |
| 55 to 64 Years | 1,436 (98.8%) | 1,203 (93.3%) |
| 65 to 74 Years | 965 (92.5%) | 1,349 (96.1%) |
| 75 Years and over | 885 (89.9%) | 1,594 (98.2%) |
| Total | 12,345 (94.1%) | 12,563 (95.6%) |
Income Below Poverty Among Married-Couple Families in West Melbourne
The poverty statistics for married-couple families in West Melbourne show that 1.2% or 60 of the total 5,069 families live below the poverty line. Families with 1 or 2 children have the highest poverty rate of 2.1%, comprising of 42 families. On the other hand, families with 3 or 4 children have the lowest poverty rate of 0.0%, which includes 0 families.
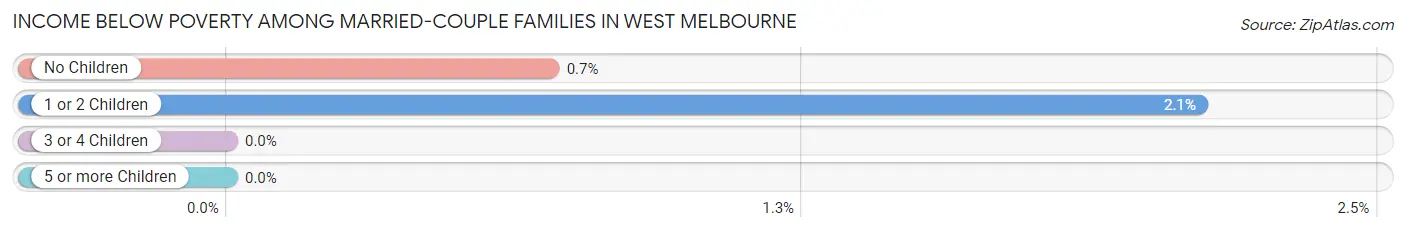
| Children | Above Poverty | Below Poverty |
| No Children | 2,558 (99.3%) | 18 (0.7%) |
| 1 or 2 Children | 1,948 (97.9%) | 42 (2.1%) |
| 3 or 4 Children | 461 (100.0%) | 0 (0.0%) |
| 5 or more Children | 42 (100.0%) | 0 (0.0%) |
| Total | 5,009 (98.8%) | 60 (1.2%) |
Income Below Poverty Among Single-Parent Households in West Melbourne
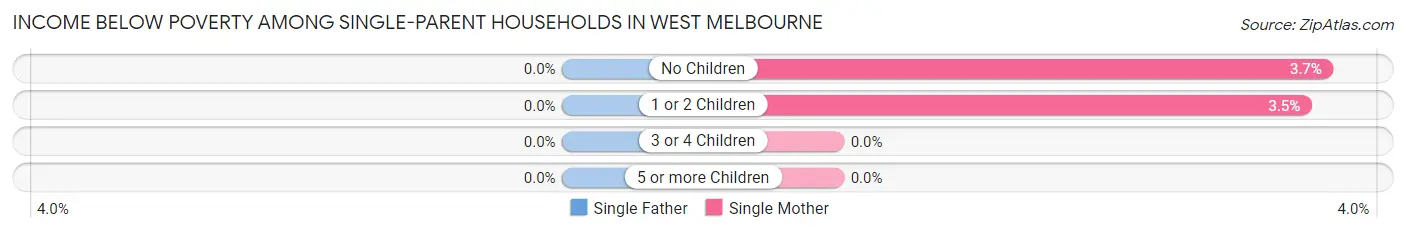
| Children | Single Father | Single Mother |
| No Children | 0 (0.0%) | 22 (3.6%) |
| 1 or 2 Children | 0 (0.0%) | 17 (3.5%) |
| 3 or 4 Children | 0 (0.0%) | 0 (0.0%) |
| 5 or more Children | 0 (0.0%) | 0 (0.0%) |
| Total | 0 (0.0%) | 39 (3.6%) |
Income Below Poverty Among Married-Couple vs Single-Parent Households in West Melbourne
The poverty data for West Melbourne shows that 60 of the married-couple family households (1.2%) and 39 of the single-parent households (2.8%) are living below the poverty level. Within the married-couple family households, those with 1 or 2 children have the highest poverty rate, with 42 households (2.1%) falling below the poverty line. Among the single-parent households, those with no children have the highest poverty rate, with 22 household (2.9%) living below poverty.
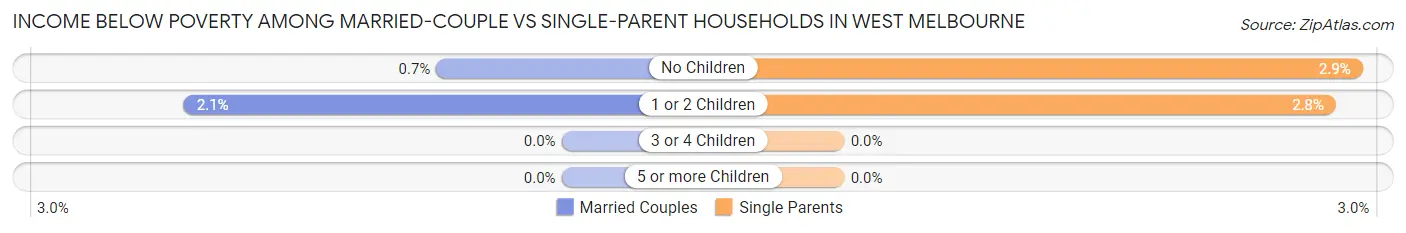
| Children | Married-Couple Families | Single-Parent Households |
| No Children | 18 (0.7%) | 22 (2.9%) |
| 1 or 2 Children | 42 (2.1%) | 17 (2.8%) |
| 3 or 4 Children | 0 (0.0%) | 0 (0.0%) |
| 5 or more Children | 0 (0.0%) | 0 (0.0%) |
| Total | 60 (1.2%) | 39 (2.8%) |
Race in West Melbourne
The most populous races in West Melbourne are White / Caucasian (20,492 | 76.6%), Hispanic or Latino (3,855 | 14.4%), and Two or more Races (2,314 | 8.6%).
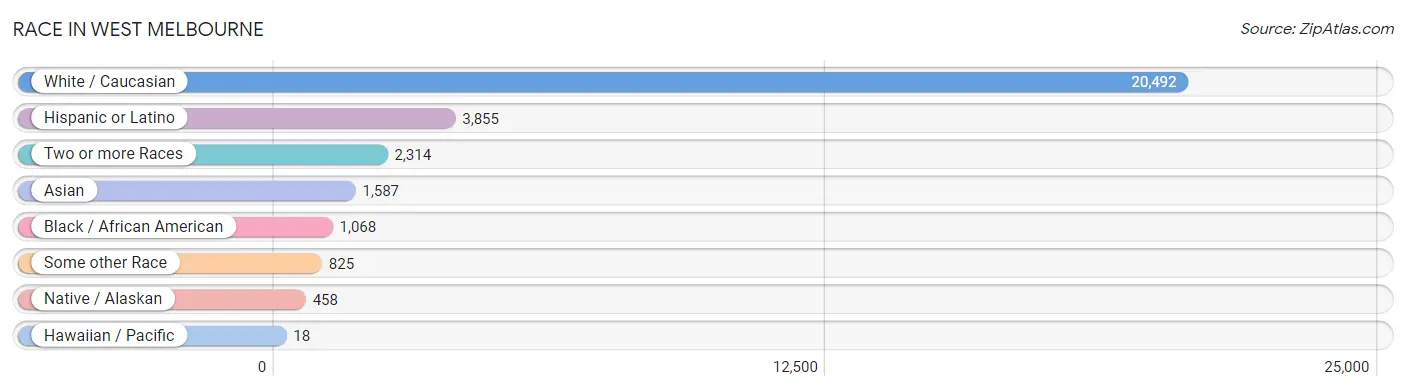
| Race | # Population | % Population |
| Asian | 1,587 | 5.9% |
| Black / African American | 1,068 | 4.0% |
| Hawaiian / Pacific | 18 | 0.1% |
| Hispanic or Latino | 3,855 | 14.4% |
| Native / Alaskan | 458 | 1.7% |
| White / Caucasian | 20,492 | 76.6% |
| Two or more Races | 2,314 | 8.6% |
| Some other Race | 825 | 3.1% |
| Total | 26,762 | 100.0% |
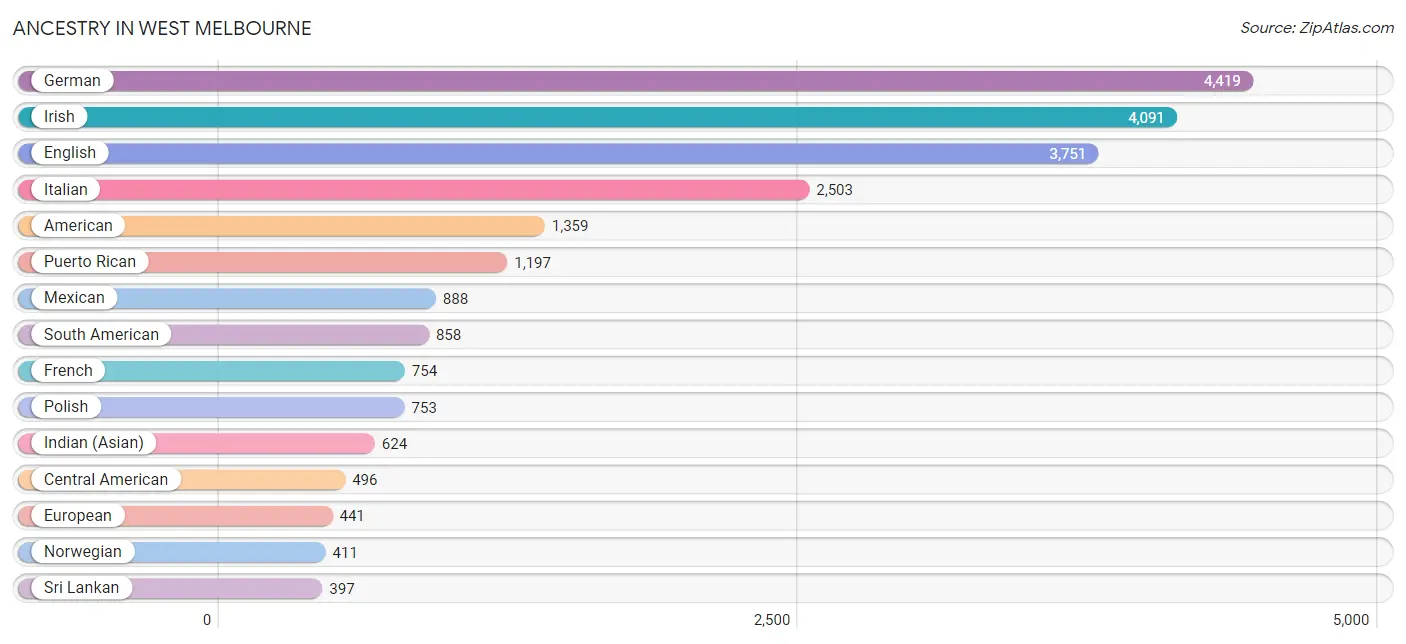
Ancestry in West Melbourne
The most populous ancestries reported in West Melbourne are German (4,419 | 16.5%), Irish (4,091 | 15.3%), English (3,751 | 14.0%), Italian (2,503 | 9.3%), and American (1,359 | 5.1%), together accounting for 60.2% of all West Melbourne residents.
| Ancestry | # Population | % Population |
| African | 21 | 0.1% |
| Albanian | 99 | 0.4% |
| American | 1,359 | 5.1% |
| Arab | 252 | 0.9% |
| Argentinean | 62 | 0.2% |
| Austrian | 41 | 0.2% |
| Bhutanese | 141 | 0.5% |
| Blackfeet | 21 | 0.1% |
| Brazilian | 13 | 0.1% |
| British | 174 | 0.6% |
| British West Indian | 7 | 0.0% |
| Burmese | 24 | 0.1% |
| Canadian | 125 | 0.5% |
| Central American | 496 | 1.8% |
| Central American Indian | 363 | 1.4% |
| Cherokee | 244 | 0.9% |
| Colombian | 395 | 1.5% |
| Costa Rican | 25 | 0.1% |
| Croatian | 18 | 0.1% |
| Cuban | 142 | 0.5% |
| Czech | 52 | 0.2% |
| Czechoslovakian | 14 | 0.1% |
| Danish | 15 | 0.1% |
| Dominican | 114 | 0.4% |
| Dutch | 266 | 1.0% |
| Eastern European | 189 | 0.7% |
| Ecuadorian | 69 | 0.3% |
| English | 3,751 | 14.0% |
| European | 441 | 1.7% |
| Finnish | 9 | 0.0% |
| French | 754 | 2.8% |
| French Canadian | 61 | 0.2% |
| German | 4,419 | 16.5% |
| Greek | 96 | 0.4% |
| Hungarian | 127 | 0.5% |
| Indian (Asian) | 624 | 2.3% |
| Irish | 4,091 | 15.3% |
| Iroquois | 30 | 0.1% |
| Israeli | 10 | 0.0% |
| Italian | 2,503 | 9.3% |
| Jamaican | 45 | 0.2% |
| Korean | 169 | 0.6% |
| Lebanese | 196 | 0.7% |
| Lithuanian | 60 | 0.2% |
| Lumbee | 7 | 0.0% |
| Mexican | 888 | 3.3% |
| Native Hawaiian | 60 | 0.2% |
| Navajo | 59 | 0.2% |
| Nicaraguan | 70 | 0.3% |
| Northern European | 30 | 0.1% |
| Norwegian | 411 | 1.5% |
| Pakistani | 18 | 0.1% |
| Panamanian | 123 | 0.5% |
| Pennsylvania German | 10 | 0.0% |
| Peruvian | 139 | 0.5% |
| Polish | 753 | 2.8% |
| Portuguese | 223 | 0.8% |
| Puerto Rican | 1,197 | 4.5% |
| Romanian | 37 | 0.1% |
| Russian | 343 | 1.3% |
| Salvadoran | 278 | 1.0% |
| Scandinavian | 152 | 0.6% |
| Scotch-Irish | 318 | 1.2% |
| Scottish | 326 | 1.2% |
| Sioux | 21 | 0.1% |
| Slovak | 36 | 0.1% |
| South American | 858 | 3.2% |
| Spaniard | 68 | 0.3% |
| Sri Lankan | 397 | 1.5% |
| Subsaharan African | 32 | 0.1% |
| Swedish | 179 | 0.7% |
| Swiss | 53 | 0.2% |
| Thai | 302 | 1.1% |
| Trinidadian and Tobagonian | 22 | 0.1% |
| Ukrainian | 73 | 0.3% |
| Venezuelan | 193 | 0.7% |
| Welsh | 145 | 0.5% |
| Zimbabwean | 11 | 0.0% | View All 78 Rows |
Immigrants in West Melbourne
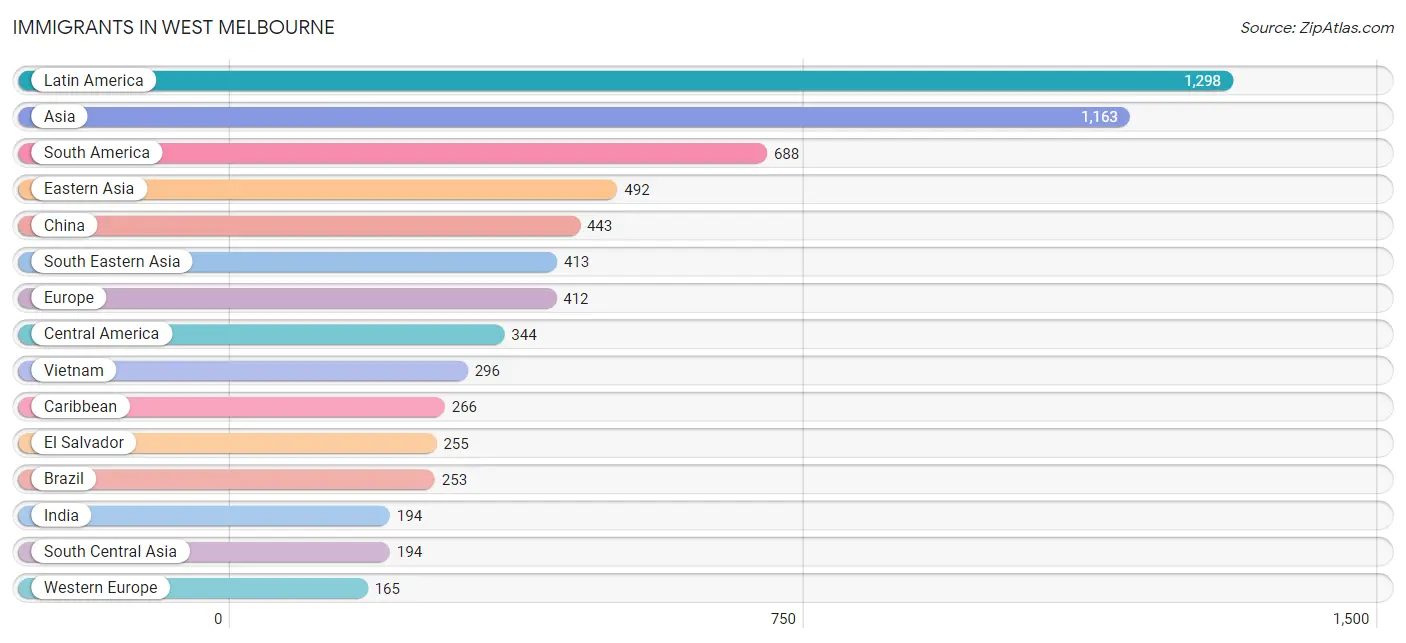
The most numerous immigrant groups reported in West Melbourne came from Latin America (1,298 | 4.9%), Asia (1,163 | 4.3%), South America (688 | 2.6%), Eastern Asia (492 | 1.8%), and China (443 | 1.7%), together accounting for 15.3% of all West Melbourne residents.
| Immigration Origin | # Population | % Population |
| Africa | 32 | 0.1% |
| Asia | 1,163 | 4.3% |
| Azores | 43 | 0.2% |
| Brazil | 253 | 0.9% |
| Canada | 16 | 0.1% |
| Caribbean | 266 | 1.0% |
| Central America | 344 | 1.3% |
| China | 443 | 1.7% |
| Colombia | 87 | 0.3% |
| Costa Rica | 15 | 0.1% |
| Cuba | 125 | 0.5% |
| Dominican Republic | 39 | 0.2% |
| Eastern Africa | 23 | 0.1% |
| Eastern Asia | 492 | 1.8% |
| Eastern Europe | 143 | 0.5% |
| Ecuador | 63 | 0.2% |
| El Salvador | 255 | 0.9% |
| England | 15 | 0.1% |
| Europe | 412 | 1.5% |
| Germany | 141 | 0.5% |
| Ghana | 9 | 0.0% |
| Greece | 9 | 0.0% |
| Grenada | 25 | 0.1% |
| Haiti | 21 | 0.1% |
| Hungary | 6 | 0.0% |
| India | 194 | 0.7% |
| Italy | 14 | 0.1% |
| Jamaica | 56 | 0.2% |
| Japan | 30 | 0.1% |
| Korea | 19 | 0.1% |
| Latin America | 1,298 | 4.9% |
| Mexico | 34 | 0.1% |
| Nicaragua | 36 | 0.1% |
| Northern Europe | 15 | 0.1% |
| Panama | 4 | 0.0% |
| Peru | 115 | 0.4% |
| Philippines | 99 | 0.4% |
| Portugal | 66 | 0.3% |
| Romania | 37 | 0.1% |
| Russia | 90 | 0.3% |
| Saudi Arabia | 56 | 0.2% |
| South America | 688 | 2.6% |
| South Central Asia | 194 | 0.7% |
| South Eastern Asia | 413 | 1.5% |
| Southern Europe | 89 | 0.3% |
| Switzerland | 24 | 0.1% |
| Thailand | 18 | 0.1% |
| Ukraine | 10 | 0.0% |
| Venezuela | 141 | 0.5% |
| Vietnam | 296 | 1.1% |
| Western Africa | 9 | 0.0% |
| Western Asia | 64 | 0.2% |
| Western Europe | 165 | 0.6% |
| Zimbabwe | 23 | 0.1% | View All 54 Rows |
Sex and Age in West Melbourne
Sex and Age in West Melbourne
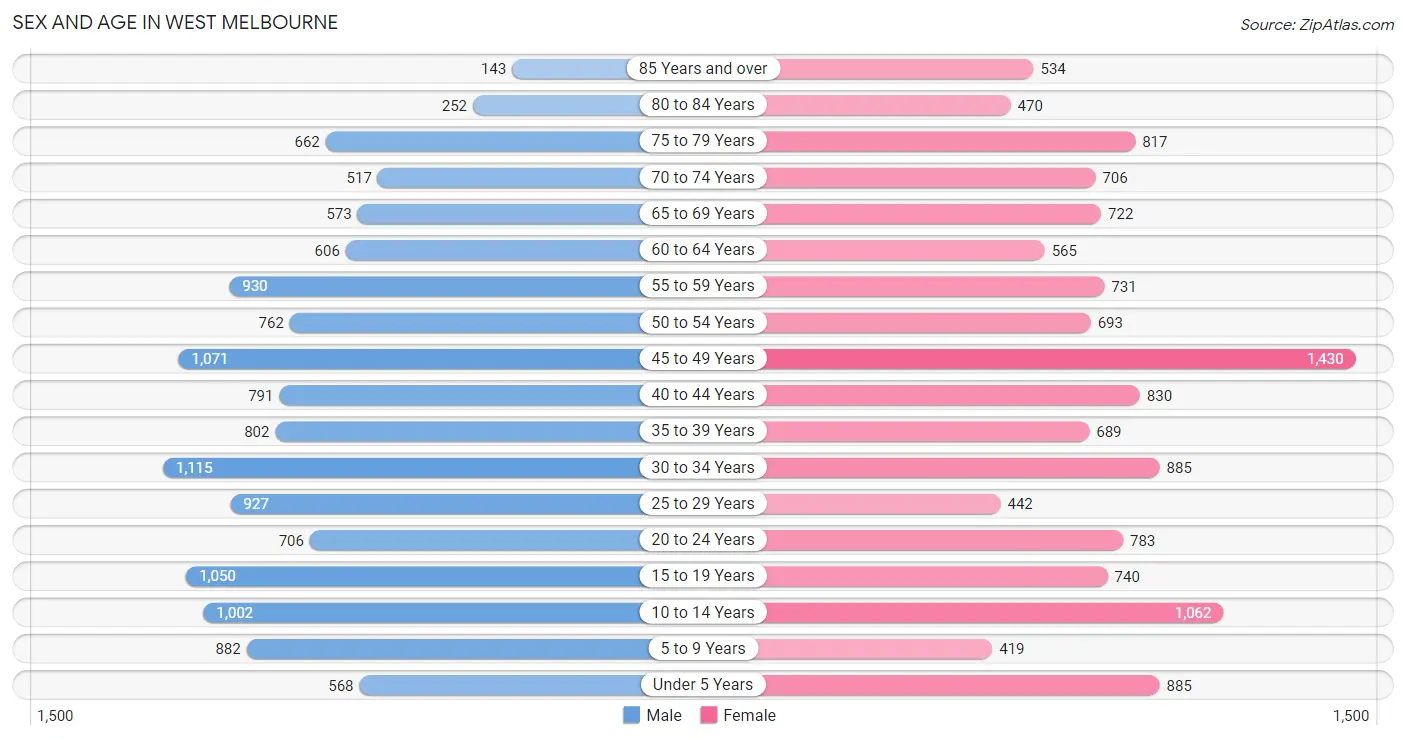
The most populous age groups in West Melbourne are 30 to 34 Years (1,115 | 8.4%) for men and 45 to 49 Years (1,430 | 10.7%) for women.
| Age Bracket | Male | Female |
| Under 5 Years | 568 (4.3%) | 885 (6.6%) |
| 5 to 9 Years | 882 (6.6%) | 419 (3.1%) |
| 10 to 14 Years | 1,002 (7.5%) | 1,062 (7.9%) |
| 15 to 19 Years | 1,050 (7.9%) | 740 (5.5%) |
| 20 to 24 Years | 706 (5.3%) | 783 (5.8%) |
| 25 to 29 Years | 927 (6.9%) | 442 (3.3%) |
| 30 to 34 Years | 1,115 (8.4%) | 885 (6.6%) |
| 35 to 39 Years | 802 (6.0%) | 689 (5.1%) |
| 40 to 44 Years | 791 (5.9%) | 830 (6.2%) |
| 45 to 49 Years | 1,071 (8.0%) | 1,430 (10.7%) |
| 50 to 54 Years | 762 (5.7%) | 693 (5.2%) |
| 55 to 59 Years | 930 (7.0%) | 731 (5.4%) |
| 60 to 64 Years | 606 (4.5%) | 565 (4.2%) |
| 65 to 69 Years | 573 (4.3%) | 722 (5.4%) |
| 70 to 74 Years | 517 (3.9%) | 706 (5.3%) |
| 75 to 79 Years | 662 (5.0%) | 817 (6.1%) |
| 80 to 84 Years | 252 (1.9%) | 470 (3.5%) |
| 85 Years and over | 143 (1.1%) | 534 (4.0%) |
| Total | 13,359 (100.0%) | 13,403 (100.0%) |
Families and Households in West Melbourne
Median Family Size in West Melbourne
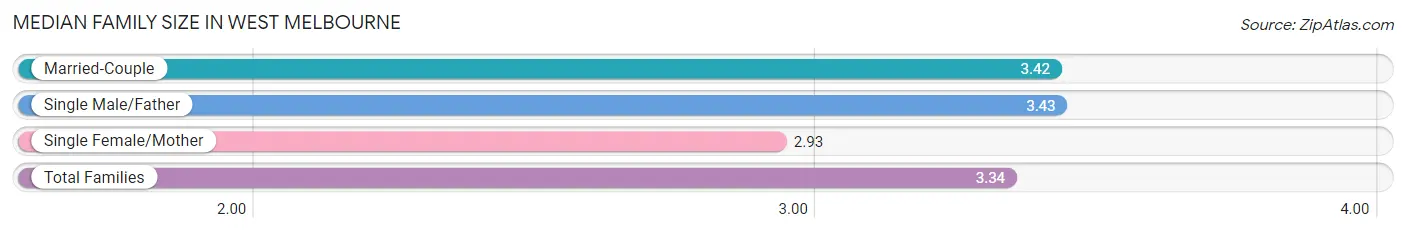
The median family size in West Melbourne is 3.34 persons per family, with single male/father families (309 | 4.8%) accounting for the largest median family size of 3.43 persons per family. On the other hand, single female/mother families (1,090 | 16.9%) represent the smallest median family size with 2.93 persons per family.
| Family Type | # Families | Family Size |
| Married-Couple | 5,069 (78.4%) | 3.42 |
| Single Male/Father | 309 (4.8%) | 3.43 |
| Single Female/Mother | 1,090 (16.9%) | 2.93 |
| Total Families | 6,468 (100.0%) | 3.34 |
Median Household Size in West Melbourne
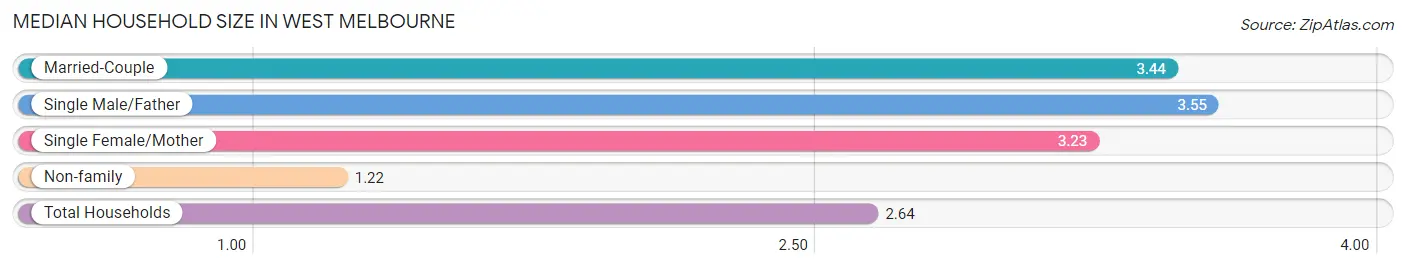
The median household size in West Melbourne is 2.64 persons per household, with single male/father households (309 | 3.1%) accounting for the largest median household size of 3.55 persons per household. non-family households (3,512 | 35.2%) represent the smallest median household size with 1.22 persons per household.
| Household Type | # Households | Household Size |
| Married-Couple | 5,069 (50.8%) | 3.44 |
| Single Male/Father | 309 (3.1%) | 3.55 |
| Single Female/Mother | 1,090 (10.9%) | 3.23 |
| Non-family | 3,512 (35.2%) | 1.22 |
| Total Households | 9,980 (100.0%) | 2.64 |
Household Size by Marriage Status in West Melbourne
Out of a total of 9,980 households in West Melbourne, 6,468 (64.8%) are family households, while 3,512 (35.2%) are nonfamily households. The most numerous type of family households are 2-person households, comprising 2,538, and the most common type of nonfamily households are 1-person households, comprising 2,945.
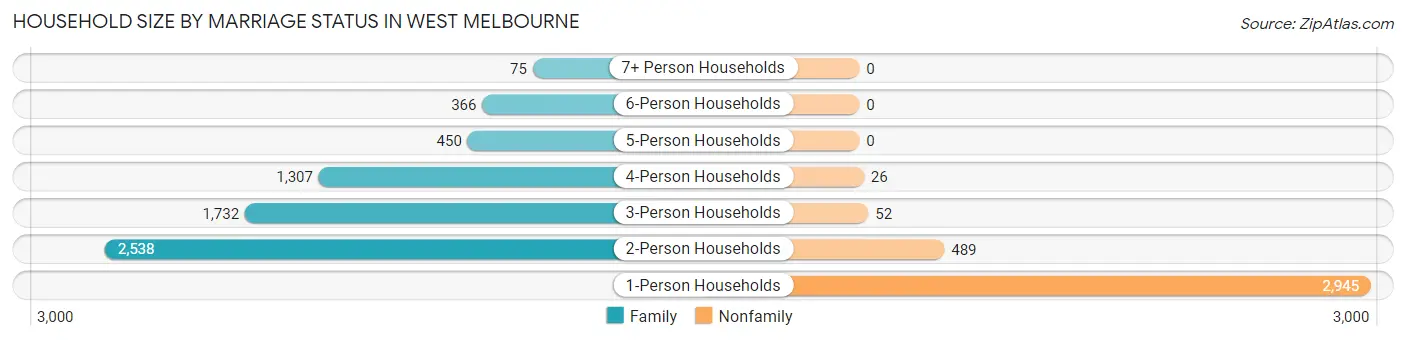
| Household Size | Family Households | Nonfamily Households |
| 1-Person Households | - | 2,945 (29.5%) |
| 2-Person Households | 2,538 (25.4%) | 489 (4.9%) |
| 3-Person Households | 1,732 (17.3%) | 52 (0.5%) |
| 4-Person Households | 1,307 (13.1%) | 26 (0.3%) |
| 5-Person Households | 450 (4.5%) | 0 (0.0%) |
| 6-Person Households | 366 (3.7%) | 0 (0.0%) |
| 7+ Person Households | 75 (0.7%) | 0 (0.0%) |
| Total | 6,468 (64.8%) | 3,512 (35.2%) |
Female Fertility in West Melbourne
Fertility by Age in West Melbourne
Average fertility rate in West Melbourne is 70.0 births per 1,000 women. Women in the age bracket of 20 to 34 years have the highest fertility rate with 131.0 births per 1,000 women. Women in the age bracket of 20 to 34 years acount for 67.0% of all women with births.
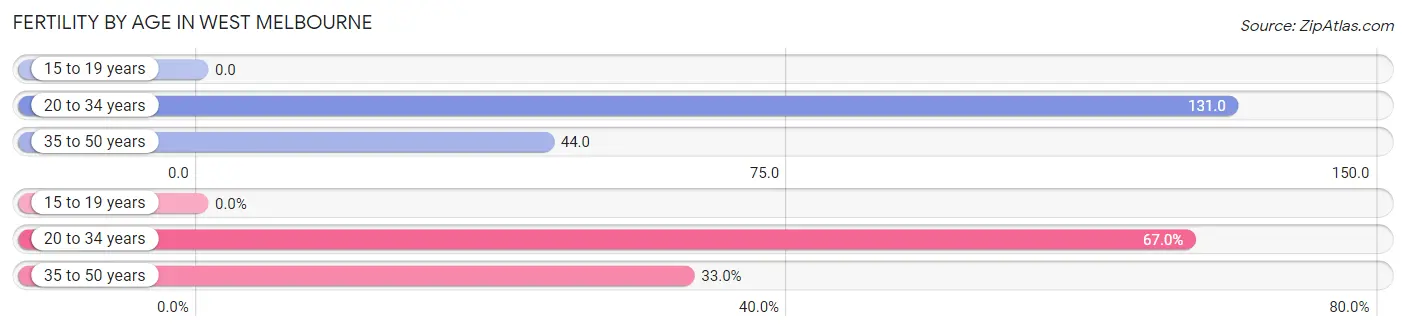
| Age Bracket | Women with Births | Births / 1,000 Women |
| 15 to 19 years | 0 (0.0%) | 0.0 |
| 20 to 34 years | 276 (67.0%) | 131.0 |
| 35 to 50 years | 136 (33.0%) | 44.0 |
| Total | 412 (100.0%) | 70.0 |
Fertility by Age by Marriage Status in West Melbourne
80.6% of women with births (412) in West Melbourne are married. The highest percentage of unmarried women with births falls into 20 to 34 years age bracket with 29.0% of them unmarried at the time of birth, while the lowest percentage of unmarried women with births belong to 35 to 50 years age bracket with 0.0% of them unmarried.
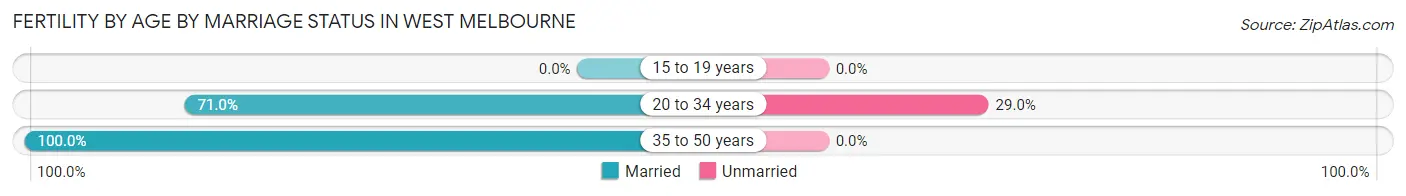
| Age Bracket | Married | Unmarried |
| 15 to 19 years | 0 (0.0%) | 0 (0.0%) |
| 20 to 34 years | 196 (71.0%) | 80 (29.0%) |
| 35 to 50 years | 136 (100.0%) | 0 (0.0%) |
| Total | 332 (80.6%) | 80 (19.4%) |
Fertility by Education in West Melbourne
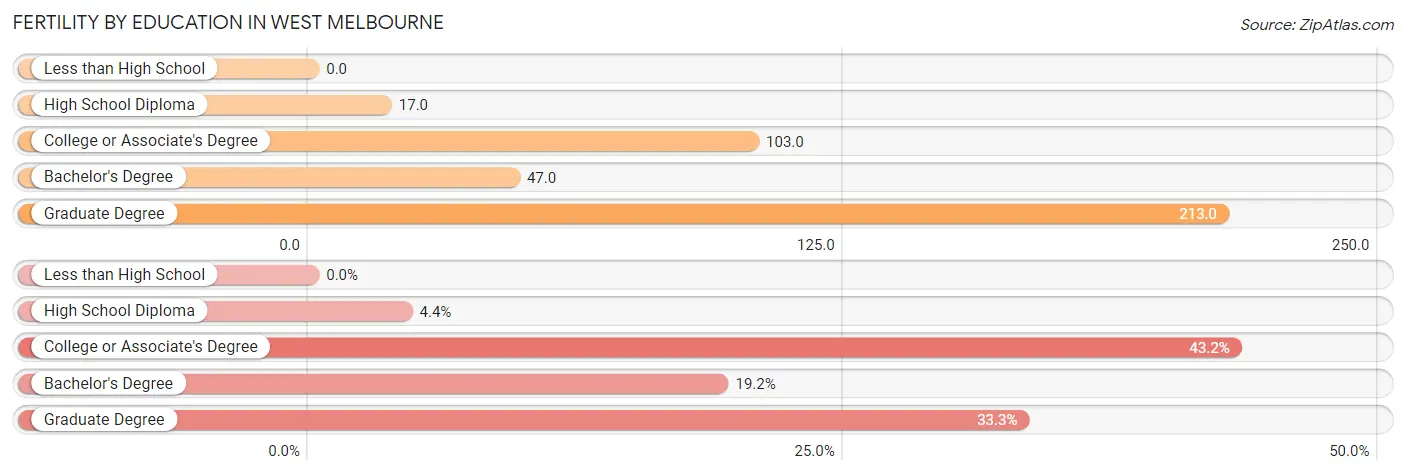
| Educational Attainment | Women with Births | Births / 1,000 Women |
| Less than High School | 0 (0.0%) | 0.0 |
| High School Diploma | 18 (4.4%) | 17.0 |
| College or Associate's Degree | 178 (43.2%) | 103.0 |
| Bachelor's Degree | 79 (19.2%) | 47.0 |
| Graduate Degree | 137 (33.3%) | 213.0 |
| Total | 412 (100.0%) | 70.0 |
Fertility by Education by Marriage Status in West Melbourne
19.4% of women with births in West Melbourne are unmarried. Women with the educational attainment of bachelor's degree are most likely to be married with 100.0% of them married at childbirth, while women with the educational attainment of high school diploma are least likely to be married with 100.0% of them unmarried at childbirth.
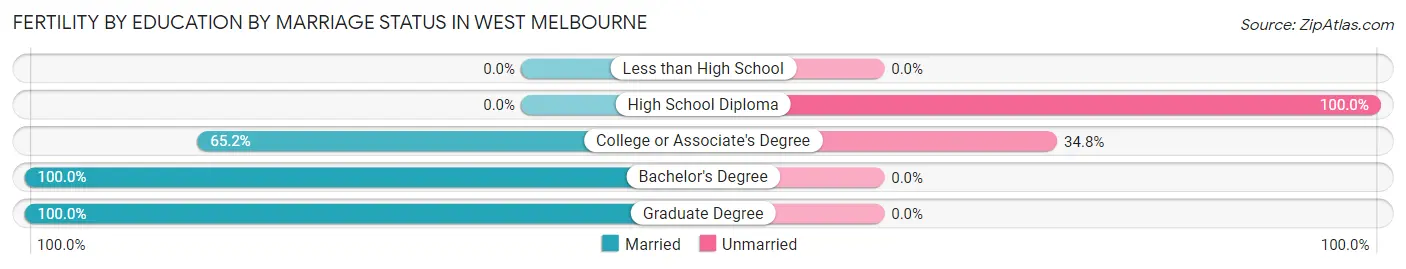
| Educational Attainment | Married | Unmarried |
| Less than High School | 0 (0.0%) | 0 (0.0%) |
| High School Diploma | 0 (0.0%) | 18 (100.0%) |
| College or Associate's Degree | 116 (65.2%) | 62 (34.8%) |
| Bachelor's Degree | 79 (100.0%) | 0 (0.0%) |
| Graduate Degree | 137 (100.0%) | 0 (0.0%) |
| Total | 332 (80.6%) | 80 (19.4%) |
Employment Characteristics in West Melbourne
Employment by Class of Employer in West Melbourne
Among the 12,225 employed individuals in West Melbourne, private company employees (9,472 | 77.5%), self-employed (incorporated) (757 | 6.2%), and not-for-profit organizations (689 | 5.6%) make up the most common classes of employment.
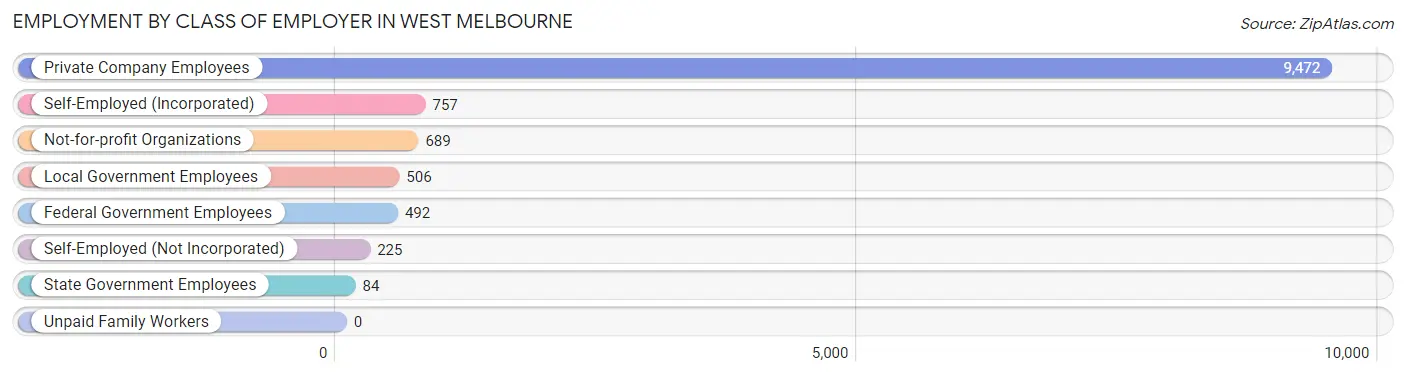
| Employer Class | # Employees | % Employees |
| Private Company Employees | 9,472 | 77.5% |
| Self-Employed (Incorporated) | 757 | 6.2% |
| Self-Employed (Not Incorporated) | 225 | 1.8% |
| Not-for-profit Organizations | 689 | 5.6% |
| Local Government Employees | 506 | 4.1% |
| State Government Employees | 84 | 0.7% |
| Federal Government Employees | 492 | 4.0% |
| Unpaid Family Workers | 0 | 0.0% |
| Total | 12,225 | 100.0% |
Employment Status by Age in West Melbourne
According to the labor force statistics for West Melbourne, out of the total population over 16 years of age (21,705), 60.2% or 13,066 individuals are in the labor force, with 4.9% or 640 of them unemployed. The age group with the highest labor force participation rate is 25 to 29 years, with 87.6% or 1,199 individuals in the labor force. Within the labor force, the 75 years and over age range has the highest percentage of unemployed individuals, with 25.0% or 17 of them being unemployed.
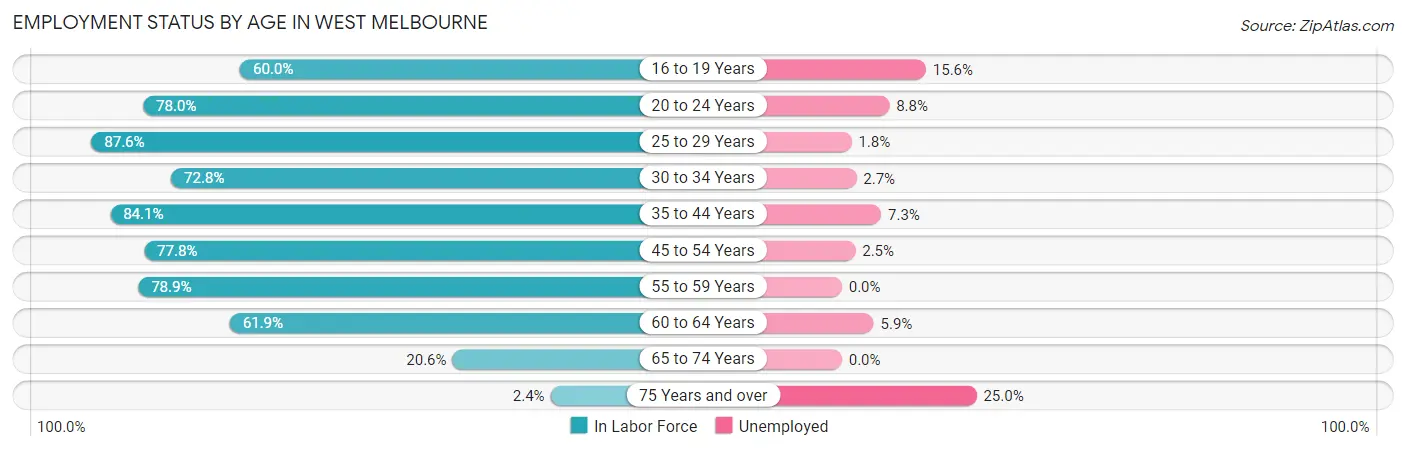
| Age Bracket | In Labor Force | Unemployed |
| 16 to 19 Years | 931 (60.0%) | 145 (15.6%) |
| 20 to 24 Years | 1,161 (78.0%) | 102 (8.8%) |
| 25 to 29 Years | 1,199 (87.6%) | 22 (1.8%) |
| 30 to 34 Years | 1,456 (72.8%) | 39 (2.7%) |
| 35 to 44 Years | 2,617 (84.1%) | 191 (7.3%) |
| 45 to 54 Years | 3,078 (77.8%) | 77 (2.5%) |
| 55 to 59 Years | 1,311 (78.9%) | 0 (0.0%) |
| 60 to 64 Years | 725 (61.9%) | 43 (5.9%) |
| 65 to 74 Years | 519 (20.6%) | 0 (0.0%) |
| 75 Years and over | 69 (2.4%) | 17 (25.0%) |
| Total | 13,066 (60.2%) | 640 (4.9%) |
Employment Status by Educational Attainment in West Melbourne
According to labor force statistics for West Melbourne, 78.3% of individuals (10,390) out of the total population between 25 and 64 years of age (13,269) are in the labor force, with 3.6% or 374 of them being unemployed. The group with the highest labor force participation rate are those with the educational attainment of college / associate degree, with 83.4% or 3,289 individuals in the labor force. Within the labor force, individuals with less than high school education have the highest percentage of unemployment, with 16.5% or 56 of them being unemployed.
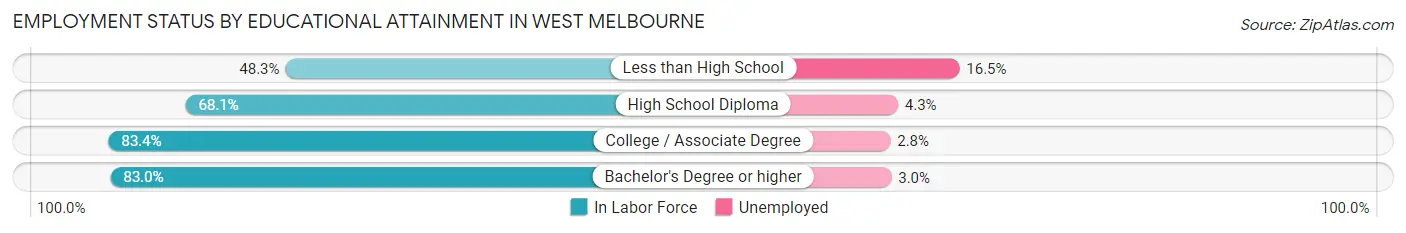
| Educational Attainment | In Labor Force | Unemployed |
| Less than High School | 340 (48.3%) | 116 (16.5%) |
| High School Diploma | 1,799 (68.1%) | 114 (4.3%) |
| College / Associate Degree | 3,289 (83.4%) | 110 (2.8%) |
| Bachelor's Degree or higher | 4,963 (83.0%) | 179 (3.0%) |
| Total | 10,390 (78.3%) | 478 (3.6%) |
Employment Occupations by Sex in West Melbourne
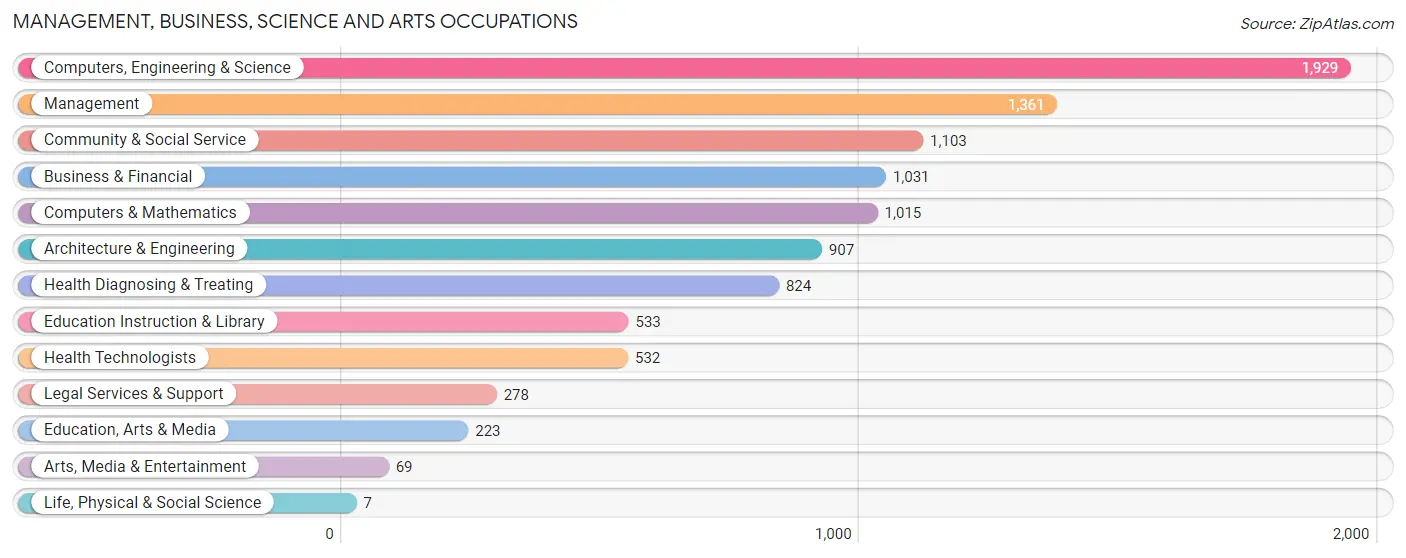
Management, Business, Science and Arts Occupations
The most common Management, Business, Science and Arts occupations in West Melbourne are Computers, Engineering & Science (1,929 | 15.5%), Management (1,361 | 11.0%), Community & Social Service (1,103 | 8.9%), Business & Financial (1,031 | 8.3%), and Computers & Mathematics (1,015 | 8.2%).
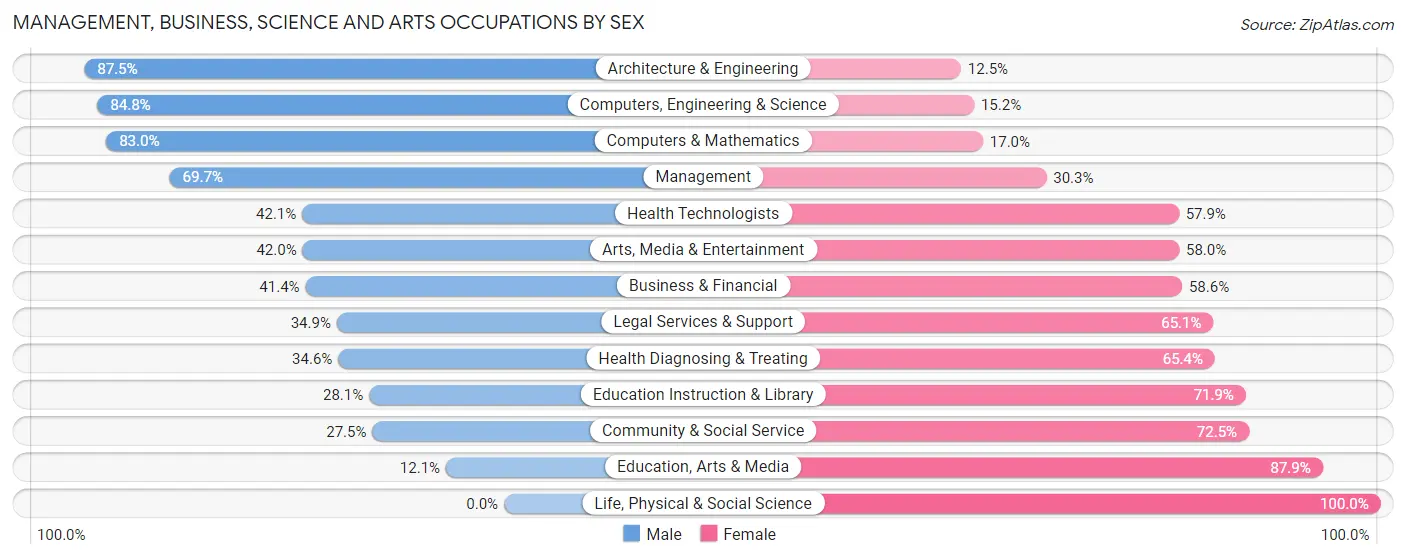
Management, Business, Science and Arts Occupations by Sex
Within the Management, Business, Science and Arts occupations in West Melbourne, the most male-oriented occupations are Architecture & Engineering (87.5%), Computers, Engineering & Science (84.8%), and Computers & Mathematics (83.0%), while the most female-oriented occupations are Life, Physical & Social Science (100.0%), Education, Arts & Media (87.9%), and Community & Social Service (72.5%).
| Occupation | Male | Female |
| Management | 949 (69.7%) | 412 (30.3%) |
| Business & Financial | 427 (41.4%) | 604 (58.6%) |
| Computers, Engineering & Science | 1,636 (84.8%) | 293 (15.2%) |
| Computers & Mathematics | 842 (83.0%) | 173 (17.0%) |
| Architecture & Engineering | 794 (87.5%) | 113 (12.5%) |
| Life, Physical & Social Science | 0 (0.0%) | 7 (100.0%) |
| Community & Social Service | 303 (27.5%) | 800 (72.5%) |
| Education, Arts & Media | 27 (12.1%) | 196 (87.9%) |
| Legal Services & Support | 97 (34.9%) | 181 (65.1%) |
| Education Instruction & Library | 150 (28.1%) | 383 (71.9%) |
| Arts, Media & Entertainment | 29 (42.0%) | 40 (58.0%) |
| Health Diagnosing & Treating | 285 (34.6%) | 539 (65.4%) |
| Health Technologists | 224 (42.1%) | 308 (57.9%) |
| Total (Category) | 3,600 (57.6%) | 2,648 (42.4%) |
| Total (Overall) | 6,839 (55.0%) | 5,589 (45.0%) |
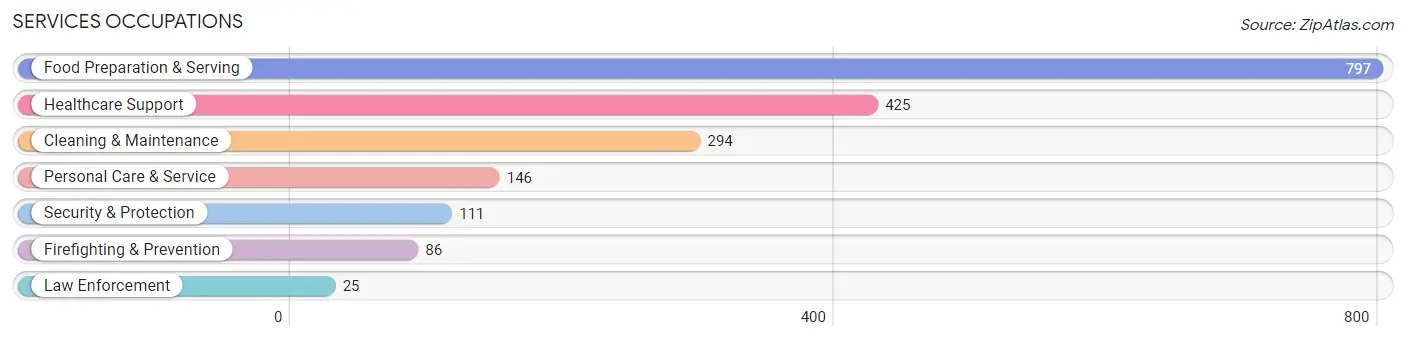
Services Occupations
The most common Services occupations in West Melbourne are Food Preparation & Serving (797 | 6.4%), Healthcare Support (425 | 3.4%), Cleaning & Maintenance (294 | 2.4%), Personal Care & Service (146 | 1.2%), and Security & Protection (111 | 0.9%).
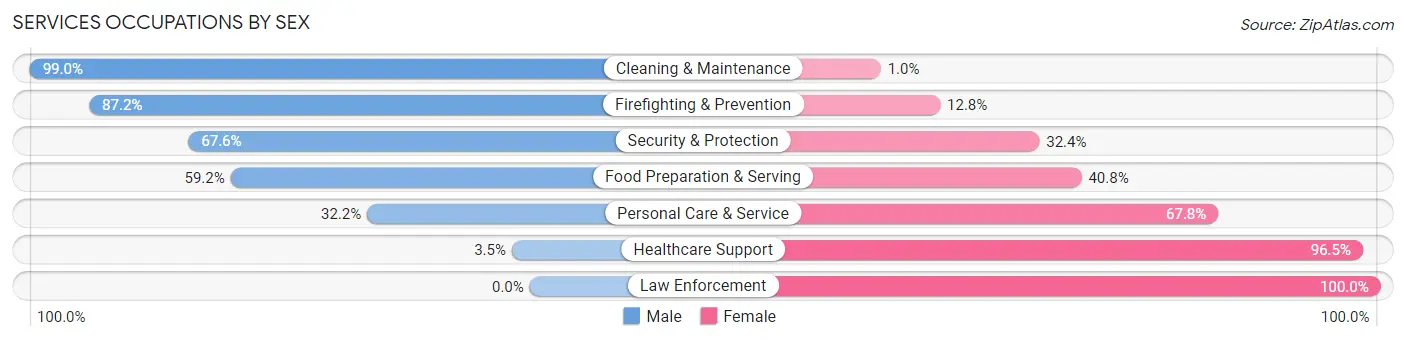
Services Occupations by Sex
Within the Services occupations in West Melbourne, the most male-oriented occupations are Cleaning & Maintenance (99.0%), Firefighting & Prevention (87.2%), and Security & Protection (67.6%), while the most female-oriented occupations are Law Enforcement (100.0%), Healthcare Support (96.5%), and Personal Care & Service (67.8%).
| Occupation | Male | Female |
| Healthcare Support | 15 (3.5%) | 410 (96.5%) |
| Security & Protection | 75 (67.6%) | 36 (32.4%) |
| Firefighting & Prevention | 75 (87.2%) | 11 (12.8%) |
| Law Enforcement | 0 (0.0%) | 25 (100.0%) |
| Food Preparation & Serving | 472 (59.2%) | 325 (40.8%) |
| Cleaning & Maintenance | 291 (99.0%) | 3 (1.0%) |
| Personal Care & Service | 47 (32.2%) | 99 (67.8%) |
| Total (Category) | 900 (50.8%) | 873 (49.2%) |
| Total (Overall) | 6,839 (55.0%) | 5,589 (45.0%) |
Sales and Office Occupations
The most common Sales and Office occupations in West Melbourne are Office & Administration (1,224 | 9.9%), and Sales & Related (1,172 | 9.4%).
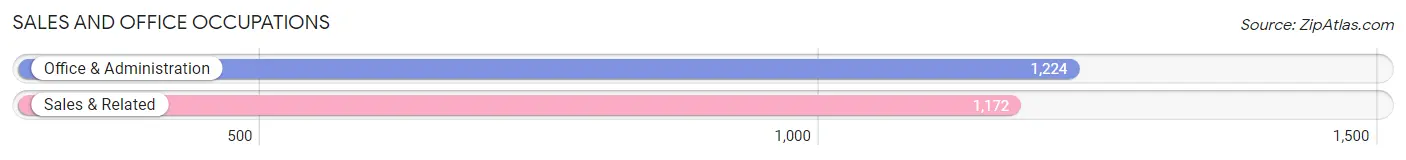
Sales and Office Occupations by Sex
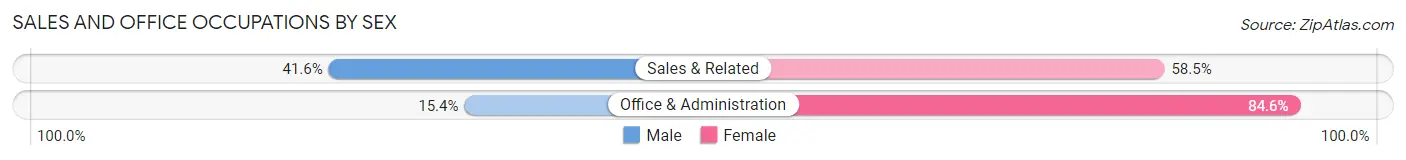
| Occupation | Male | Female |
| Sales & Related | 487 (41.5%) | 685 (58.5%) |
| Office & Administration | 189 (15.4%) | 1,035 (84.6%) |
| Total (Category) | 676 (28.2%) | 1,720 (71.8%) |
| Total (Overall) | 6,839 (55.0%) | 5,589 (45.0%) |
Natural Resources, Construction and Maintenance Occupations
The most common Natural Resources, Construction and Maintenance occupations in West Melbourne are Construction & Extraction (635 | 5.1%), Installation, Maintenance & Repair (295 | 2.4%), and Farming, Fishing & Forestry (55 | 0.4%).
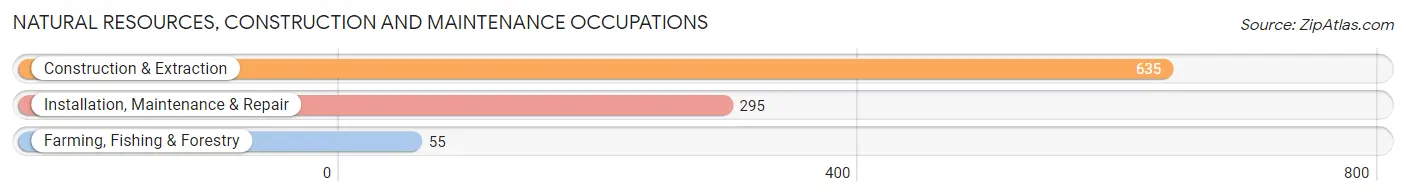
Natural Resources, Construction and Maintenance Occupations by Sex
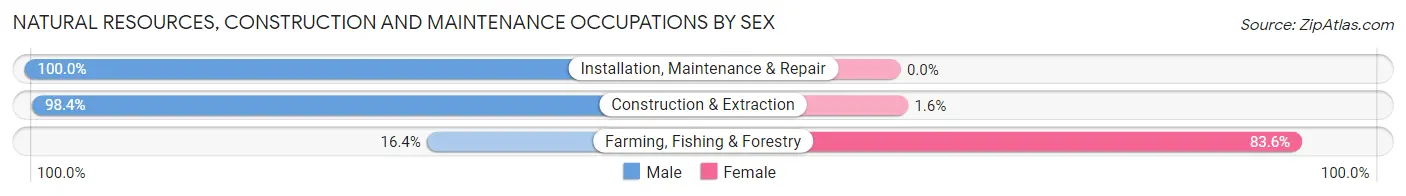
| Occupation | Male | Female |
| Farming, Fishing & Forestry | 9 (16.4%) | 46 (83.6%) |
| Construction & Extraction | 625 (98.4%) | 10 (1.6%) |
| Installation, Maintenance & Repair | 295 (100.0%) | 0 (0.0%) |
| Total (Category) | 929 (94.3%) | 56 (5.7%) |
| Total (Overall) | 6,839 (55.0%) | 5,589 (45.0%) |
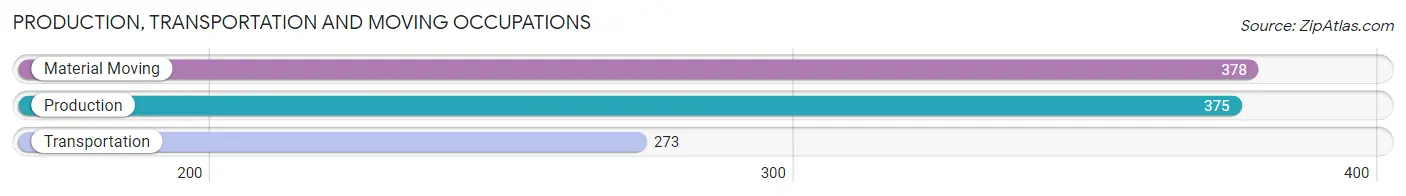
Production, Transportation and Moving Occupations
The most common Production, Transportation and Moving occupations in West Melbourne are Material Moving (378 | 3.0%), Production (375 | 3.0%), and Transportation (273 | 2.2%).
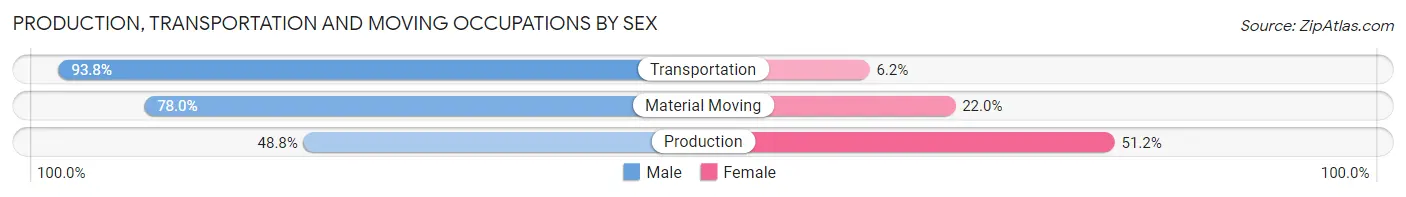
Production, Transportation and Moving Occupations by Sex
| Occupation | Male | Female |
| Production | 183 (48.8%) | 192 (51.2%) |
| Transportation | 256 (93.8%) | 17 (6.2%) |
| Material Moving | 295 (78.0%) | 83 (22.0%) |
| Total (Category) | 734 (71.5%) | 292 (28.5%) |
| Total (Overall) | 6,839 (55.0%) | 5,589 (45.0%) |
Employment Industries by Sex in West Melbourne
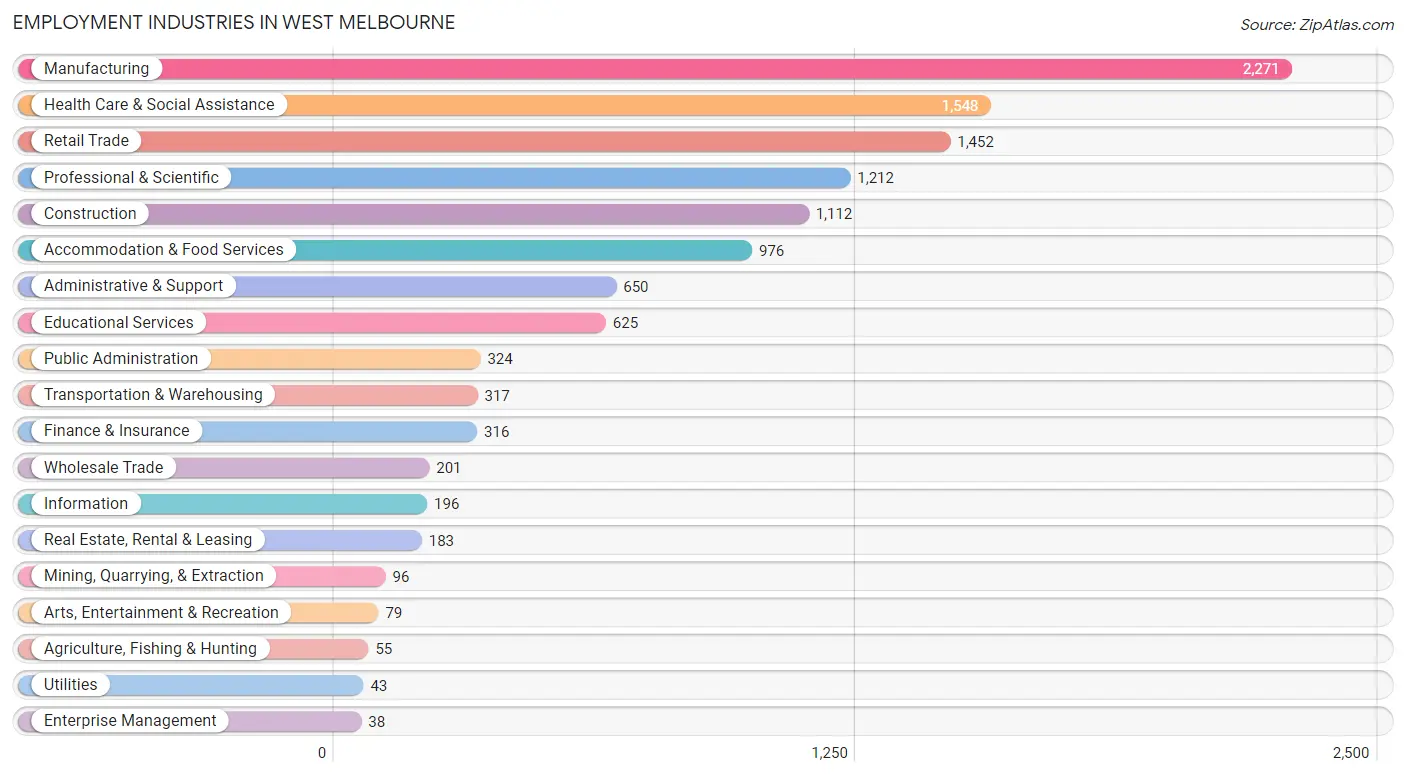
Employment Industries in West Melbourne
The major employment industries in West Melbourne include Manufacturing (2,271 | 18.3%), Health Care & Social Assistance (1,548 | 12.5%), Retail Trade (1,452 | 11.7%), Professional & Scientific (1,212 | 9.8%), and Construction (1,112 | 8.9%).
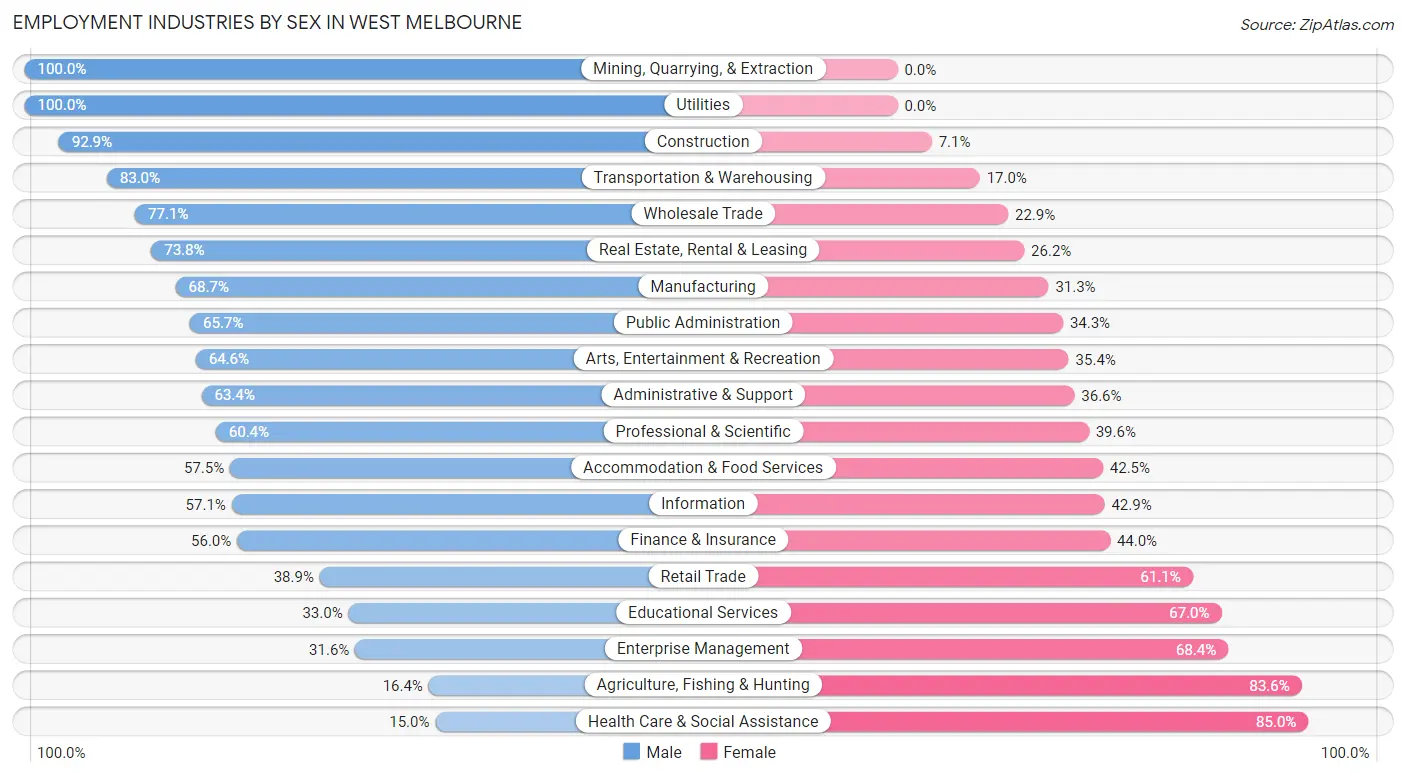
Employment Industries by Sex in West Melbourne
The West Melbourne industries that see more men than women are Mining, Quarrying, & Extraction (100.0%), Utilities (100.0%), and Construction (92.9%), whereas the industries that tend to have a higher number of women are Health Care & Social Assistance (85.0%), Agriculture, Fishing & Hunting (83.6%), and Enterprise Management (68.4%).
| Industry | Male | Female |
| Agriculture, Fishing & Hunting | 9 (16.4%) | 46 (83.6%) |
| Mining, Quarrying, & Extraction | 96 (100.0%) | 0 (0.0%) |
| Construction | 1,033 (92.9%) | 79 (7.1%) |
| Manufacturing | 1,561 (68.7%) | 710 (31.3%) |
| Wholesale Trade | 155 (77.1%) | 46 (22.9%) |
| Retail Trade | 565 (38.9%) | 887 (61.1%) |
| Transportation & Warehousing | 263 (83.0%) | 54 (17.0%) |
| Utilities | 43 (100.0%) | 0 (0.0%) |
| Information | 112 (57.1%) | 84 (42.9%) |
| Finance & Insurance | 177 (56.0%) | 139 (44.0%) |
| Real Estate, Rental & Leasing | 135 (73.8%) | 48 (26.2%) |
| Professional & Scientific | 732 (60.4%) | 480 (39.6%) |
| Enterprise Management | 12 (31.6%) | 26 (68.4%) |
| Administrative & Support | 412 (63.4%) | 238 (36.6%) |
| Educational Services | 206 (33.0%) | 419 (67.0%) |
| Health Care & Social Assistance | 232 (15.0%) | 1,316 (85.0%) |
| Arts, Entertainment & Recreation | 51 (64.6%) | 28 (35.4%) |
| Accommodation & Food Services | 561 (57.5%) | 415 (42.5%) |
| Public Administration | 213 (65.7%) | 111 (34.3%) |
| Total | 6,839 (55.0%) | 5,589 (45.0%) |
Education in West Melbourne
School Enrollment in West Melbourne
The most common levels of schooling among the 5,786 students in West Melbourne are middle school (1,700 | 29.4%), elementary school (1,297 | 22.4%), and high school (1,211 | 20.9%).
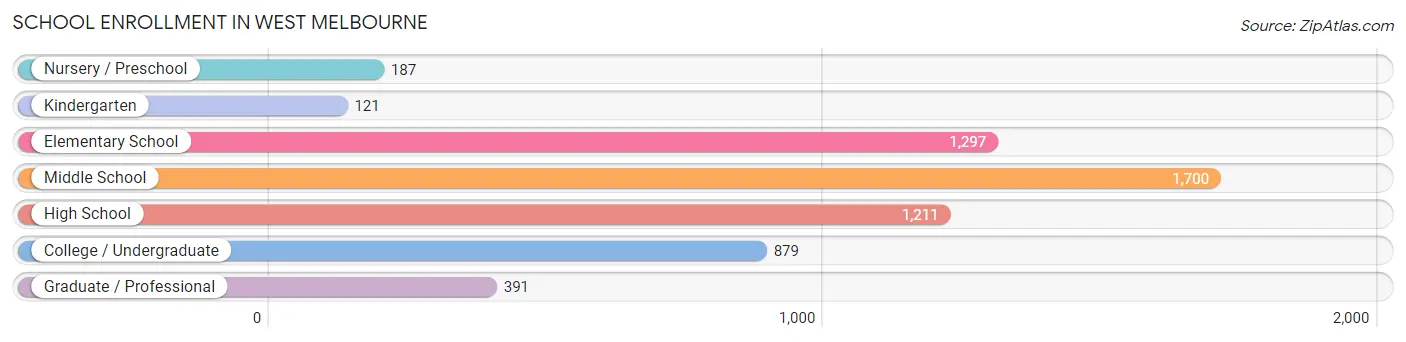
| School Level | # Students | % Students |
| Nursery / Preschool | 187 | 3.2% |
| Kindergarten | 121 | 2.1% |
| Elementary School | 1,297 | 22.4% |
| Middle School | 1,700 | 29.4% |
| High School | 1,211 | 20.9% |
| College / Undergraduate | 879 | 15.2% |
| Graduate / Professional | 391 | 6.8% |
| Total | 5,786 | 100.0% |
School Enrollment by Age by Funding Source in West Melbourne
Out of a total of 5,786 students who are enrolled in schools in West Melbourne, 1,828 (31.6%) attend a private institution, while the remaining 3,958 (68.4%) are enrolled in public schools. The age group of 3 to 4 year olds has the highest likelihood of being enrolled in private schools, with 67 (59.3% in the age bracket) enrolled. Conversely, the age group of 5 to 9 year old has the lowest likelihood of being enrolled in a private school, with 1,057 (84.4% in the age bracket) attending a public institution.
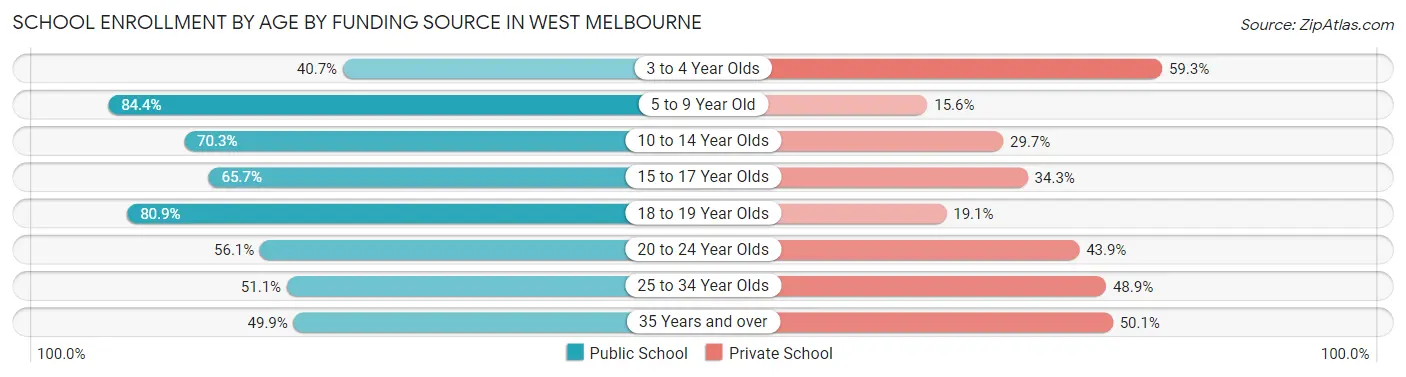
| Age Bracket | Public School | Private School |
| 3 to 4 Year Olds | 46 (40.7%) | 67 (59.3%) |
| 5 to 9 Year Old | 1,057 (84.4%) | 195 (15.6%) |
| 10 to 14 Year Olds | 1,451 (70.3%) | 613 (29.7%) |
| 15 to 17 Year Olds | 656 (65.7%) | 342 (34.3%) |
| 18 to 19 Year Olds | 110 (80.9%) | 26 (19.1%) |
| 20 to 24 Year Olds | 229 (56.1%) | 179 (43.9%) |
| 25 to 34 Year Olds | 180 (51.1%) | 172 (48.9%) |
| 35 Years and over | 231 (49.9%) | 232 (50.1%) |
| Total | 3,958 (68.4%) | 1,828 (31.6%) |
Educational Attainment by Field of Study in West Melbourne
Engineering (1,852 | 23.1%), business (1,645 | 20.5%), science & technology (795 | 9.9%), computers & mathematics (680 | 8.5%), and arts & humanities (492 | 6.1%) are the most common fields of study among 8,014 individuals in West Melbourne who have obtained a bachelor's degree or higher.
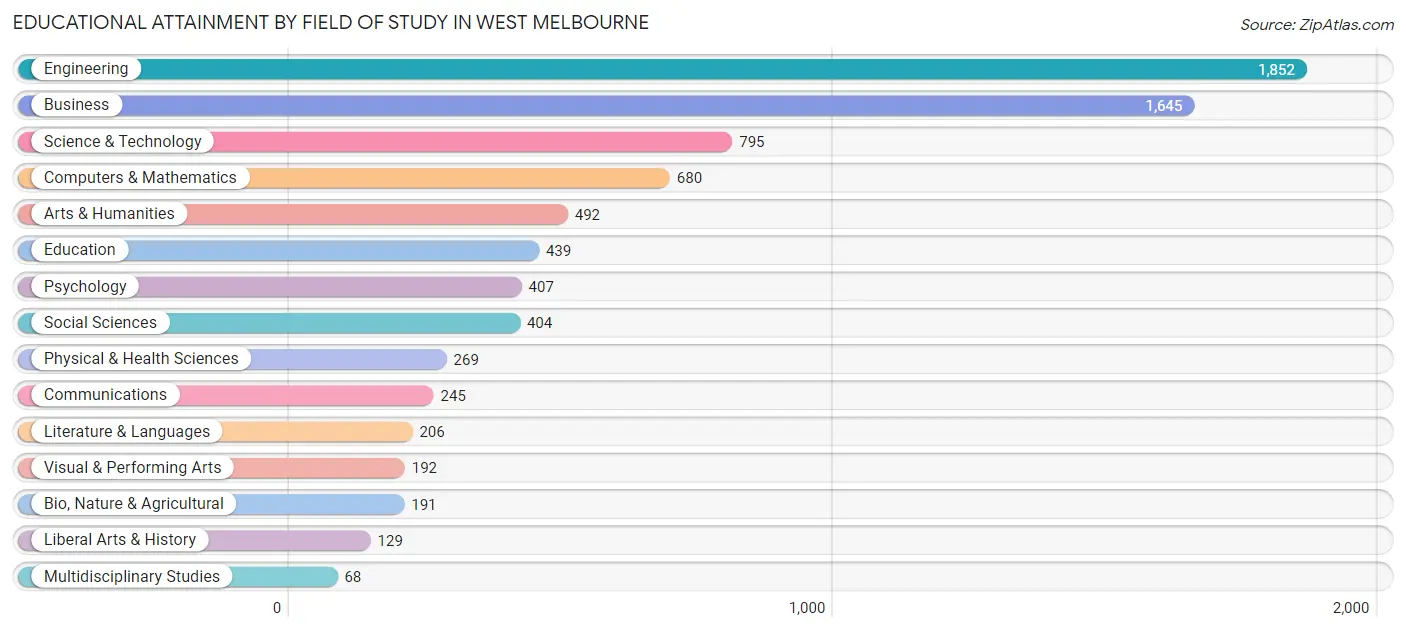
| Field of Study | # Graduates | % Graduates |
| Computers & Mathematics | 680 | 8.5% |
| Bio, Nature & Agricultural | 191 | 2.4% |
| Physical & Health Sciences | 269 | 3.4% |
| Psychology | 407 | 5.1% |
| Social Sciences | 404 | 5.0% |
| Engineering | 1,852 | 23.1% |
| Multidisciplinary Studies | 68 | 0.9% |
| Science & Technology | 795 | 9.9% |
| Business | 1,645 | 20.5% |
| Education | 439 | 5.5% |
| Literature & Languages | 206 | 2.6% |
| Liberal Arts & History | 129 | 1.6% |
| Visual & Performing Arts | 192 | 2.4% |
| Communications | 245 | 3.1% |
| Arts & Humanities | 492 | 6.1% |
| Total | 8,014 | 100.0% |
Transportation & Commute in West Melbourne
Vehicle Availability by Sex in West Melbourne
The most prevalent vehicle ownership categories in West Melbourne are males with 2 vehicles (3,068, accounting for 45.3%) and females with 2 vehicles (2,266, making up 56.2%).
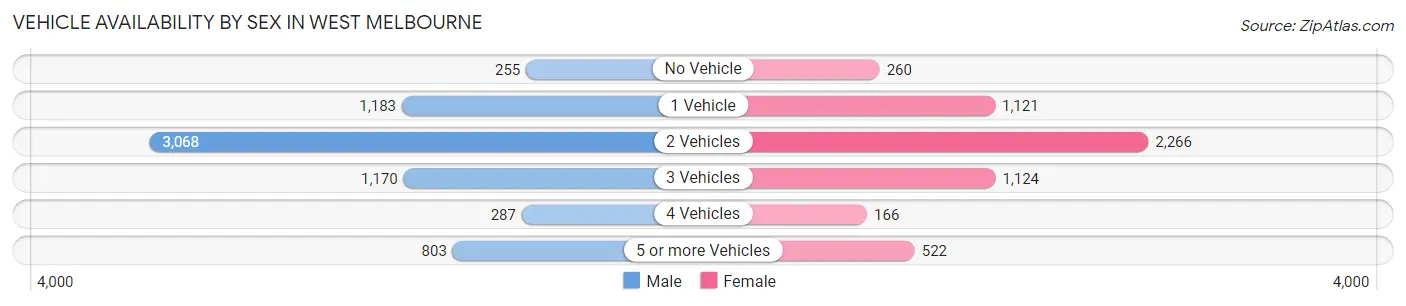
| Vehicles Available | Male | Female |
| No Vehicle | 255 (3.8%) | 260 (4.8%) |
| 1 Vehicle | 1,183 (17.5%) | 1,121 (20.5%) |
| 2 Vehicles | 3,068 (45.3%) | 2,266 (41.5%) |
| 3 Vehicles | 1,170 (17.3%) | 1,124 (20.6%) |
| 4 Vehicles | 287 (4.2%) | 166 (3.0%) |
| 5 or more Vehicles | 803 (11.9%) | 522 (9.6%) |
| Total | 6,766 (100.0%) | 5,459 (100.0%) |
Commute Time in West Melbourne
The most frequently occuring commute durations in West Melbourne are 10 to 14 minutes (2,245 commuters, 21.3%), 20 to 24 minutes (1,908 commuters, 18.1%), and 15 to 19 minutes (1,816 commuters, 17.2%).
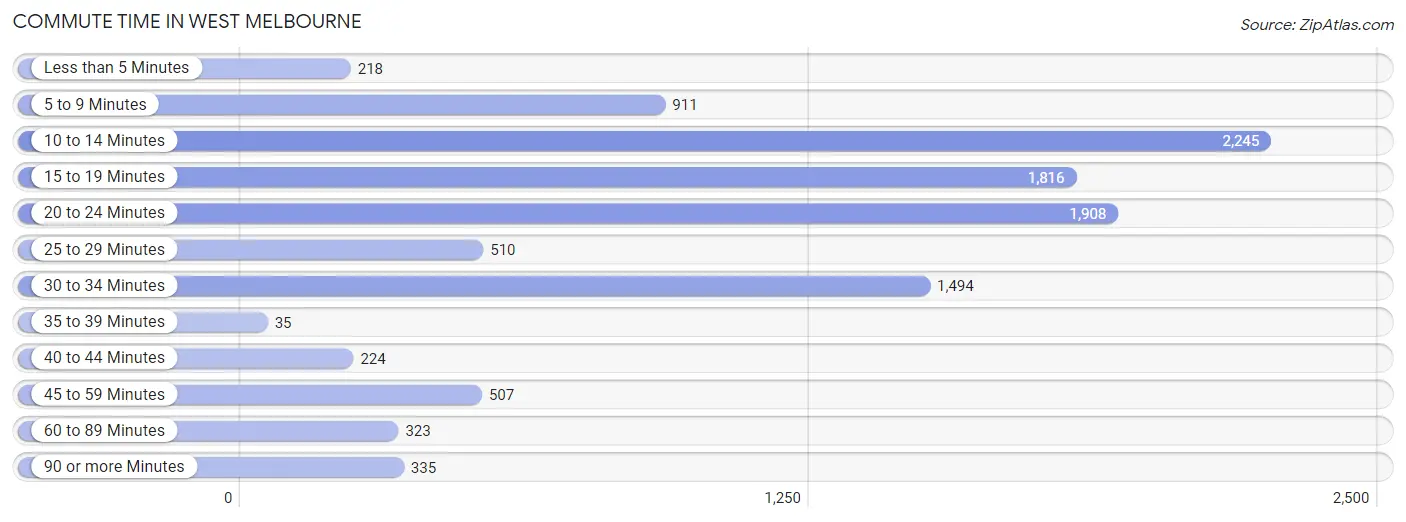
| Commute Time | # Commuters | % Commuters |
| Less than 5 Minutes | 218 | 2.1% |
| 5 to 9 Minutes | 911 | 8.6% |
| 10 to 14 Minutes | 2,245 | 21.3% |
| 15 to 19 Minutes | 1,816 | 17.2% |
| 20 to 24 Minutes | 1,908 | 18.1% |
| 25 to 29 Minutes | 510 | 4.9% |
| 30 to 34 Minutes | 1,494 | 14.2% |
| 35 to 39 Minutes | 35 | 0.3% |
| 40 to 44 Minutes | 224 | 2.1% |
| 45 to 59 Minutes | 507 | 4.8% |
| 60 to 89 Minutes | 323 | 3.1% |
| 90 or more Minutes | 335 | 3.2% |
Commute Time by Sex in West Melbourne
The most common commute times in West Melbourne are 10 to 14 minutes (1,387 commuters, 22.3%) for males and 20 to 24 minutes (905 commuters, 21.1%) for females.
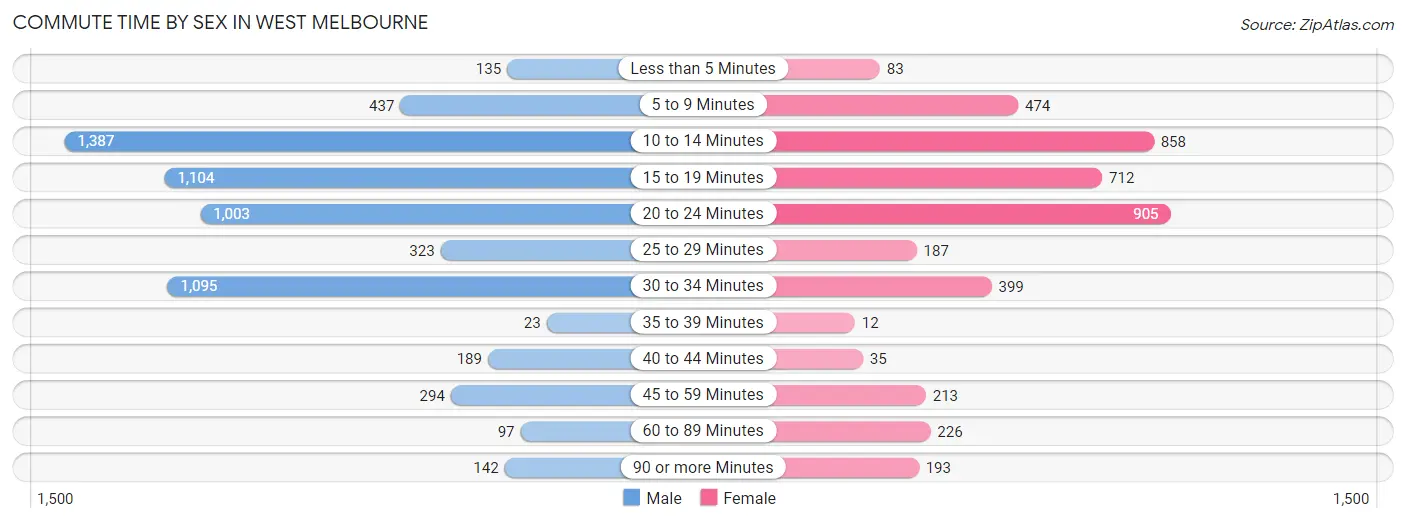
| Commute Time | Male | Female |
| Less than 5 Minutes | 135 (2.2%) | 83 (1.9%) |
| 5 to 9 Minutes | 437 (7.0%) | 474 (11.0%) |
| 10 to 14 Minutes | 1,387 (22.3%) | 858 (20.0%) |
| 15 to 19 Minutes | 1,104 (17.7%) | 712 (16.6%) |
| 20 to 24 Minutes | 1,003 (16.1%) | 905 (21.1%) |
| 25 to 29 Minutes | 323 (5.2%) | 187 (4.3%) |
| 30 to 34 Minutes | 1,095 (17.6%) | 399 (9.3%) |
| 35 to 39 Minutes | 23 (0.4%) | 12 (0.3%) |
| 40 to 44 Minutes | 189 (3.0%) | 35 (0.8%) |
| 45 to 59 Minutes | 294 (4.7%) | 213 (5.0%) |
| 60 to 89 Minutes | 97 (1.6%) | 226 (5.3%) |
| 90 or more Minutes | 142 (2.3%) | 193 (4.5%) |
Time of Departure to Work by Sex in West Melbourne
The most frequent times of departure to work in West Melbourne are 8:00 AM to 8:29 AM (1,288, 20.7%) for males and 8:00 AM to 8:29 AM (757, 17.6%) for females.
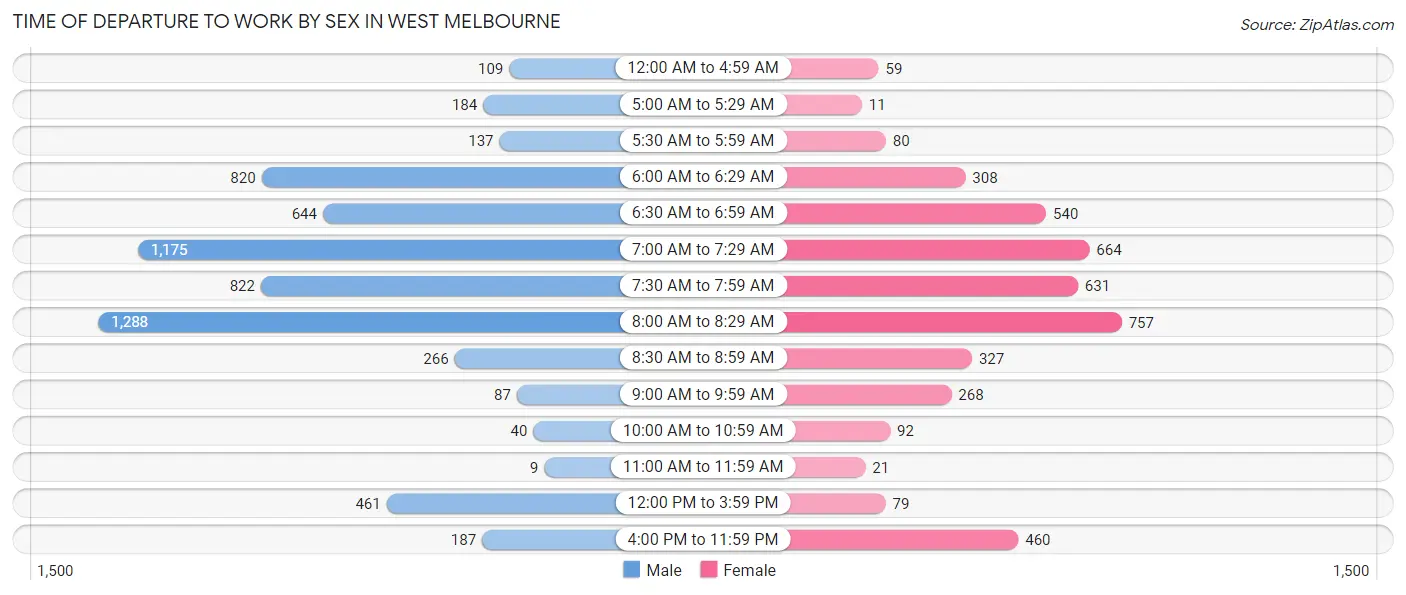
| Time of Departure | Male | Female |
| 12:00 AM to 4:59 AM | 109 (1.8%) | 59 (1.4%) |
| 5:00 AM to 5:29 AM | 184 (2.9%) | 11 (0.3%) |
| 5:30 AM to 5:59 AM | 137 (2.2%) | 80 (1.9%) |
| 6:00 AM to 6:29 AM | 820 (13.2%) | 308 (7.2%) |
| 6:30 AM to 6:59 AM | 644 (10.3%) | 540 (12.6%) |
| 7:00 AM to 7:29 AM | 1,175 (18.9%) | 664 (15.4%) |
| 7:30 AM to 7:59 AM | 822 (13.2%) | 631 (14.7%) |
| 8:00 AM to 8:29 AM | 1,288 (20.7%) | 757 (17.6%) |
| 8:30 AM to 8:59 AM | 266 (4.3%) | 327 (7.6%) |
| 9:00 AM to 9:59 AM | 87 (1.4%) | 268 (6.2%) |
| 10:00 AM to 10:59 AM | 40 (0.6%) | 92 (2.1%) |
| 11:00 AM to 11:59 AM | 9 (0.1%) | 21 (0.5%) |
| 12:00 PM to 3:59 PM | 461 (7.4%) | 79 (1.8%) |
| 4:00 PM to 11:59 PM | 187 (3.0%) | 460 (10.7%) |
| Total | 6,229 (100.0%) | 4,297 (100.0%) |
Housing Occupancy in West Melbourne
Occupancy by Ownership in West Melbourne
Of the total 9,980 dwellings in West Melbourne, owner-occupied units account for 7,831 (78.5%), while renter-occupied units make up 2,149 (21.5%).
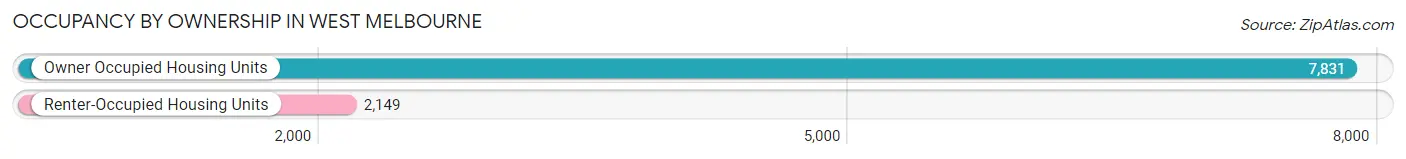
| Occupancy | # Housing Units | % Housing Units |
| Owner Occupied Housing Units | 7,831 | 78.5% |
| Renter-Occupied Housing Units | 2,149 | 21.5% |
| Total Occupied Housing Units | 9,980 | 100.0% |
Occupancy by Household Size in West Melbourne
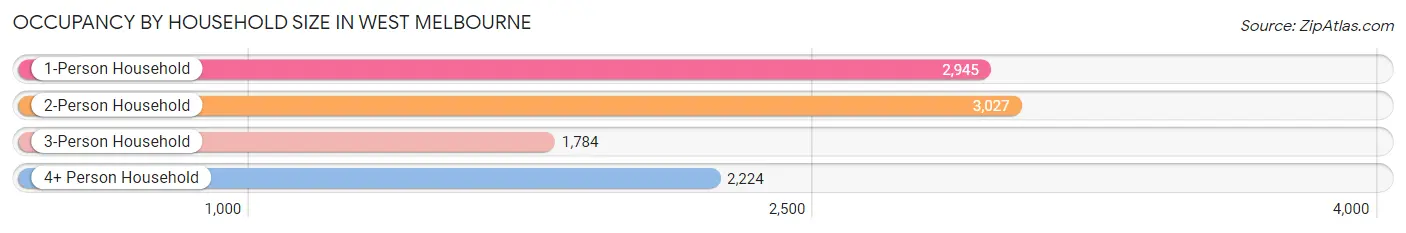
| Household Size | # Housing Units | % Housing Units |
| 1-Person Household | 2,945 | 29.5% |
| 2-Person Household | 3,027 | 30.3% |
| 3-Person Household | 1,784 | 17.9% |
| 4+ Person Household | 2,224 | 22.3% |
| Total Housing Units | 9,980 | 100.0% |
Occupancy by Ownership by Household Size in West Melbourne
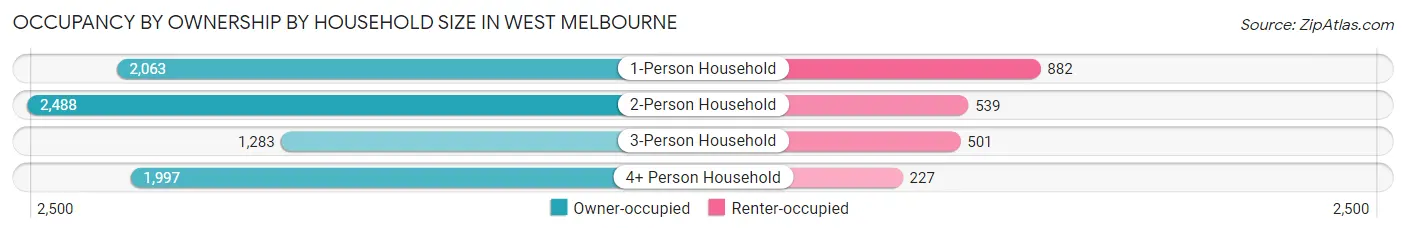
| Household Size | Owner-occupied | Renter-occupied |
| 1-Person Household | 2,063 (70.1%) | 882 (29.9%) |
| 2-Person Household | 2,488 (82.2%) | 539 (17.8%) |
| 3-Person Household | 1,283 (71.9%) | 501 (28.1%) |
| 4+ Person Household | 1,997 (89.8%) | 227 (10.2%) |
| Total Housing Units | 7,831 (78.5%) | 2,149 (21.5%) |
Occupancy by Educational Attainment in West Melbourne
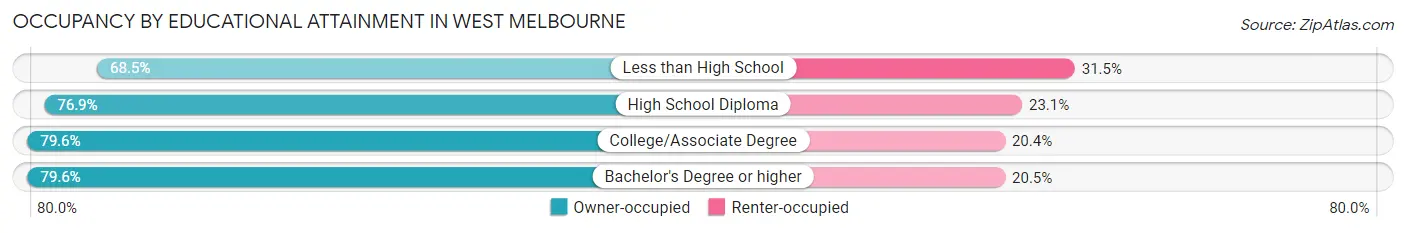
| Household Size | Owner-occupied | Renter-occupied |
| Less than High School | 363 (68.5%) | 167 (31.5%) |
| High School Diploma | 1,435 (76.9%) | 432 (23.1%) |
| College/Associate Degree | 2,419 (79.6%) | 621 (20.4%) |
| Bachelor's Degree or higher | 3,614 (79.5%) | 929 (20.4%) |
Occupancy by Age of Householder in West Melbourne
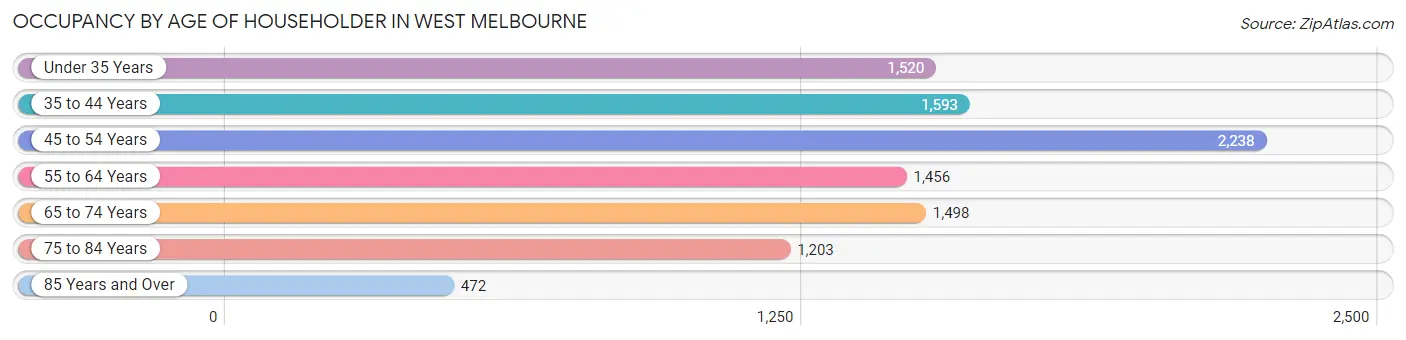
| Age Bracket | # Households | % Households |
| Under 35 Years | 1,520 | 15.2% |
| 35 to 44 Years | 1,593 | 16.0% |
| 45 to 54 Years | 2,238 | 22.4% |
| 55 to 64 Years | 1,456 | 14.6% |
| 65 to 74 Years | 1,498 | 15.0% |
| 75 to 84 Years | 1,203 | 12.0% |
| 85 Years and Over | 472 | 4.7% |
| Total | 9,980 | 100.0% |
Housing Finances in West Melbourne
Median Income by Occupancy in West Melbourne
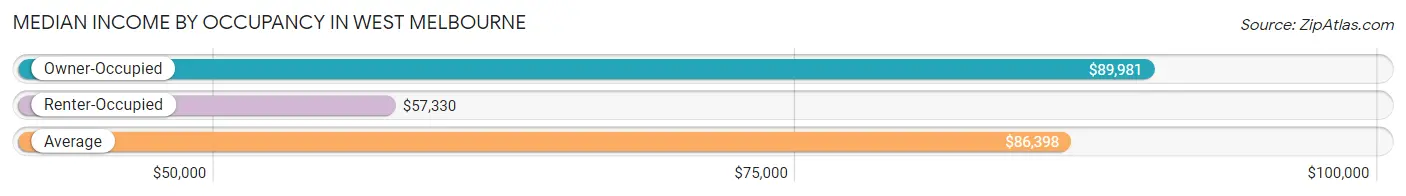
| Occupancy Type | # Households | Median Income |
| Owner-Occupied | 7,831 (78.5%) | $89,981 |
| Renter-Occupied | 2,149 (21.5%) | $57,330 |
| Average | 9,980 (100.0%) | $86,398 |
Occupancy by Householder Income Bracket in West Melbourne
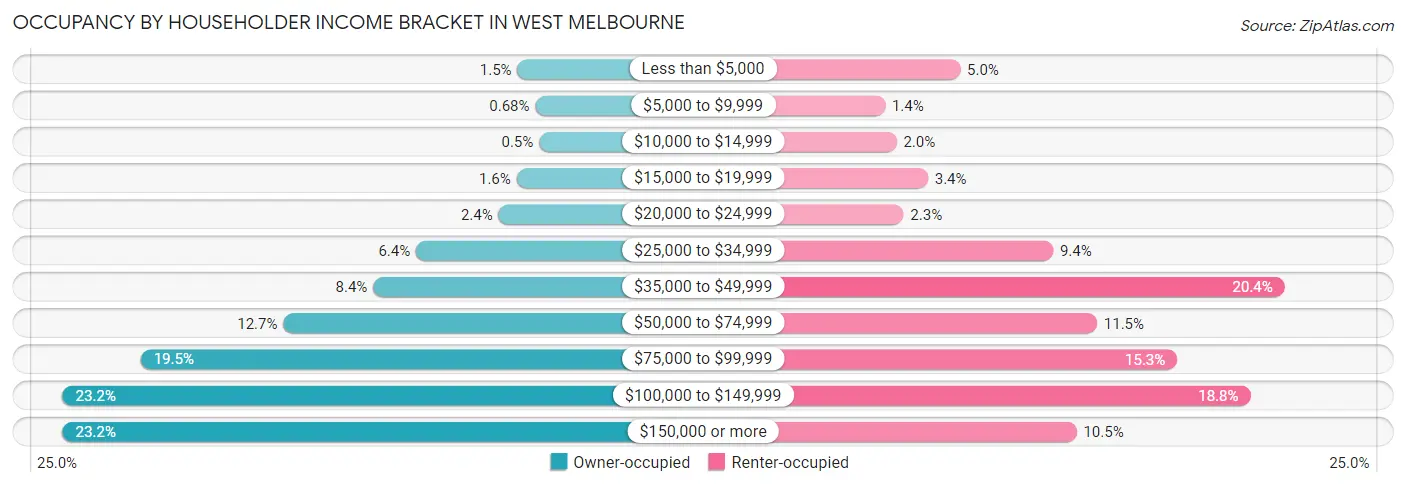
| Income Bracket | Owner-occupied | Renter-occupied |
| Less than $5,000 | 120 (1.5%) | 107 (5.0%) |
| $5,000 to $9,999 | 53 (0.7%) | 30 (1.4%) |
| $10,000 to $14,999 | 39 (0.5%) | 42 (1.9%) |
| $15,000 to $19,999 | 123 (1.6%) | 74 (3.4%) |
| $20,000 to $24,999 | 190 (2.4%) | 49 (2.3%) |
| $25,000 to $34,999 | 498 (6.4%) | 202 (9.4%) |
| $35,000 to $49,999 | 658 (8.4%) | 439 (20.4%) |
| $50,000 to $74,999 | 993 (12.7%) | 247 (11.5%) |
| $75,000 to $99,999 | 1,525 (19.5%) | 329 (15.3%) |
| $100,000 to $149,999 | 1,816 (23.2%) | 404 (18.8%) |
| $150,000 or more | 1,816 (23.2%) | 226 (10.5%) |
| Total | 7,831 (100.0%) | 2,149 (100.0%) |
Monthly Housing Cost Tiers in West Melbourne
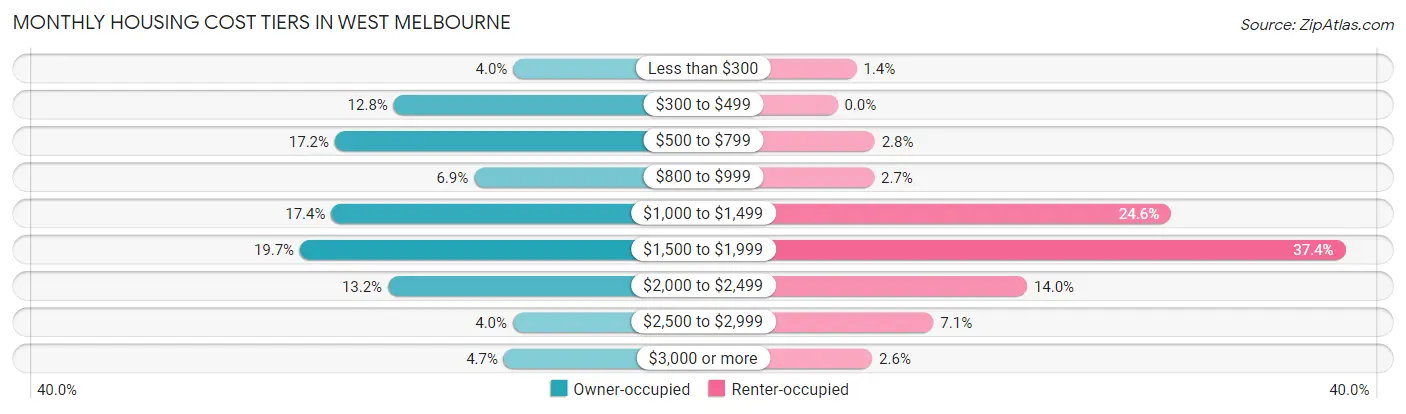
| Monthly Cost | Owner-occupied | Renter-occupied |
| Less than $300 | 315 (4.0%) | 30 (1.4%) |
| $300 to $499 | 1,004 (12.8%) | 0 (0.0%) |
| $500 to $799 | 1,343 (17.2%) | 59 (2.8%) |
| $800 to $999 | 540 (6.9%) | 58 (2.7%) |
| $1,000 to $1,499 | 1,363 (17.4%) | 528 (24.6%) |
| $1,500 to $1,999 | 1,544 (19.7%) | 804 (37.4%) |
| $2,000 to $2,499 | 1,037 (13.2%) | 300 (14.0%) |
| $2,500 to $2,999 | 316 (4.0%) | 152 (7.1%) |
| $3,000 or more | 369 (4.7%) | 55 (2.6%) |
| Total | 7,831 (100.0%) | 2,149 (100.0%) |
Physical Housing Characteristics in West Melbourne
Housing Structures in West Melbourne
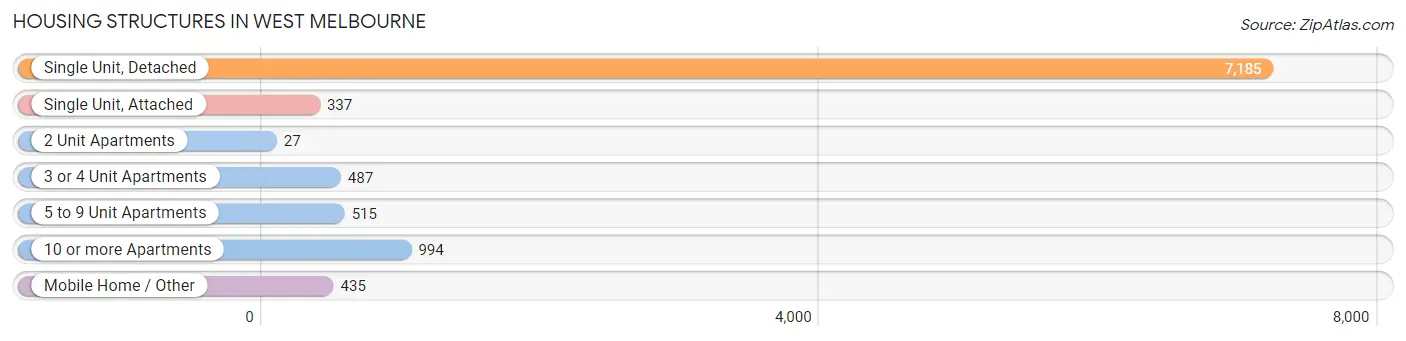
| Structure Type | # Housing Units | % Housing Units |
| Single Unit, Detached | 7,185 | 72.0% |
| Single Unit, Attached | 337 | 3.4% |
| 2 Unit Apartments | 27 | 0.3% |
| 3 or 4 Unit Apartments | 487 | 4.9% |
| 5 to 9 Unit Apartments | 515 | 5.2% |
| 10 or more Apartments | 994 | 10.0% |
| Mobile Home / Other | 435 | 4.4% |
| Total | 9,980 | 100.0% |
Housing Structures by Occupancy in West Melbourne
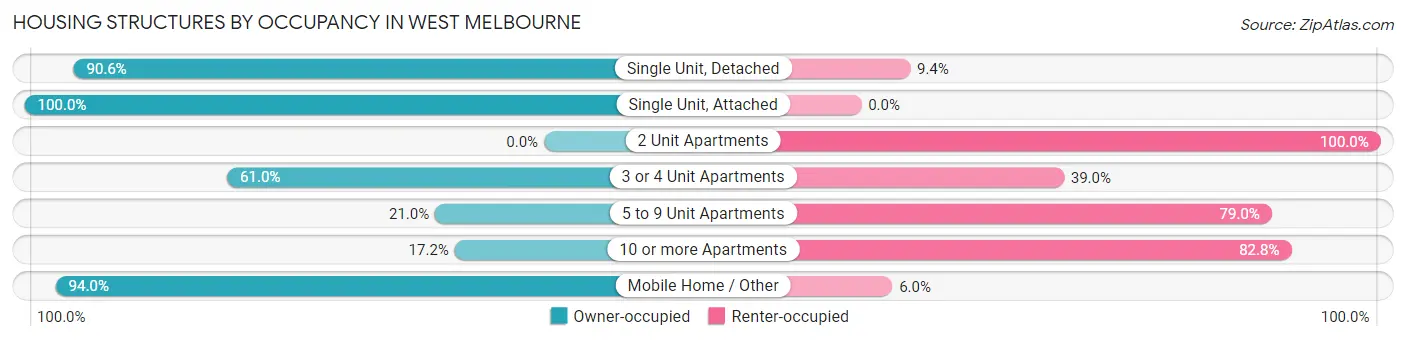
| Structure Type | Owner-occupied | Renter-occupied |
| Single Unit, Detached | 6,509 (90.6%) | 676 (9.4%) |
| Single Unit, Attached | 337 (100.0%) | 0 (0.0%) |
| 2 Unit Apartments | 0 (0.0%) | 27 (100.0%) |
| 3 or 4 Unit Apartments | 297 (61.0%) | 190 (39.0%) |
| 5 to 9 Unit Apartments | 108 (21.0%) | 407 (79.0%) |
| 10 or more Apartments | 171 (17.2%) | 823 (82.8%) |
| Mobile Home / Other | 409 (94.0%) | 26 (6.0%) |
| Total | 7,831 (78.5%) | 2,149 (21.5%) |
Housing Structures by Number of Rooms in West Melbourne
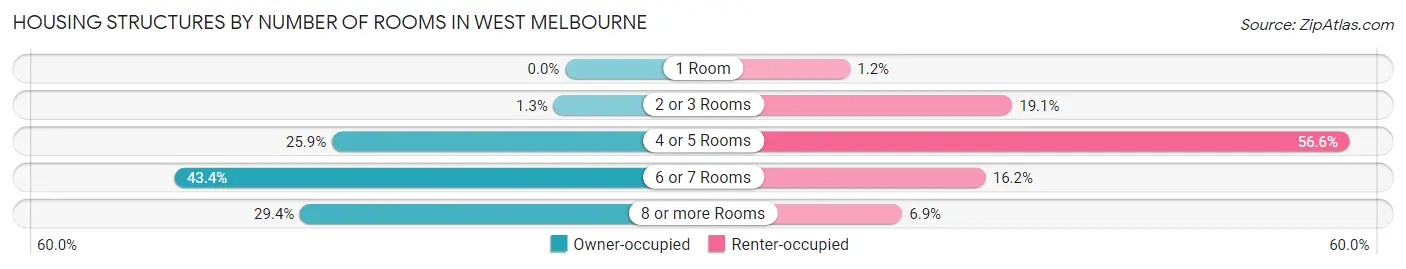
| Number of Rooms | Owner-occupied | Renter-occupied |
| 1 Room | 0 (0.0%) | 25 (1.2%) |
| 2 or 3 Rooms | 100 (1.3%) | 411 (19.1%) |
| 4 or 5 Rooms | 2,027 (25.9%) | 1,216 (56.6%) |
| 6 or 7 Rooms | 3,400 (43.4%) | 348 (16.2%) |
| 8 or more Rooms | 2,304 (29.4%) | 149 (6.9%) |
| Total | 7,831 (100.0%) | 2,149 (100.0%) |
Housing Structure by Heating Type in West Melbourne
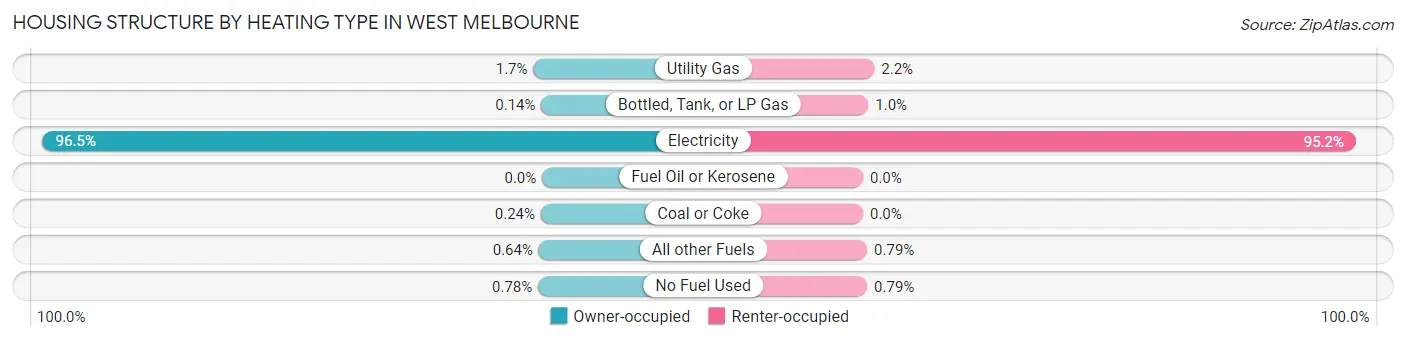
| Heating Type | Owner-occupied | Renter-occupied |
| Utility Gas | 132 (1.7%) | 47 (2.2%) |
| Bottled, Tank, or LP Gas | 11 (0.1%) | 22 (1.0%) |
| Electricity | 7,558 (96.5%) | 2,046 (95.2%) |
| Fuel Oil or Kerosene | 0 (0.0%) | 0 (0.0%) |
| Coal or Coke | 19 (0.2%) | 0 (0.0%) |
| All other Fuels | 50 (0.6%) | 17 (0.8%) |
| No Fuel Used | 61 (0.8%) | 17 (0.8%) |
| Total | 7,831 (100.0%) | 2,149 (100.0%) |
Household Vehicle Usage in West Melbourne
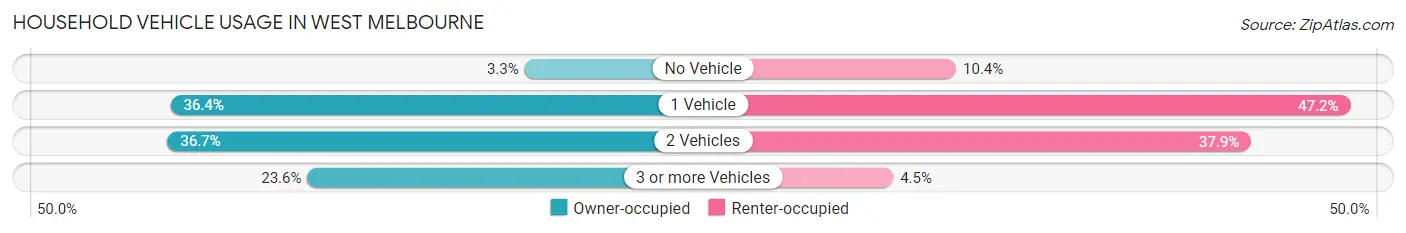
| Vehicles per Household | Owner-occupied | Renter-occupied |
| No Vehicle | 261 (3.3%) | 223 (10.4%) |
| 1 Vehicle | 2,849 (36.4%) | 1,014 (47.2%) |
| 2 Vehicles | 2,872 (36.7%) | 815 (37.9%) |
| 3 or more Vehicles | 1,849 (23.6%) | 97 (4.5%) |
| Total | 7,831 (100.0%) | 2,149 (100.0%) |
Real Estate & Mortgages in West Melbourne
Real Estate and Mortgage Overview in West Melbourne
| Characteristic | Without Mortgage | With Mortgage |
| Housing Units | 2,859 | 4,972 |
| Median Property Value | $263,600 | $339,300 |
| Median Household Income | $69,933 | $1,477 |
| Monthly Housing Costs | $553 | $369 |
| Real Estate Taxes | $1,543 | $37 |
Property Value by Mortgage Status in West Melbourne
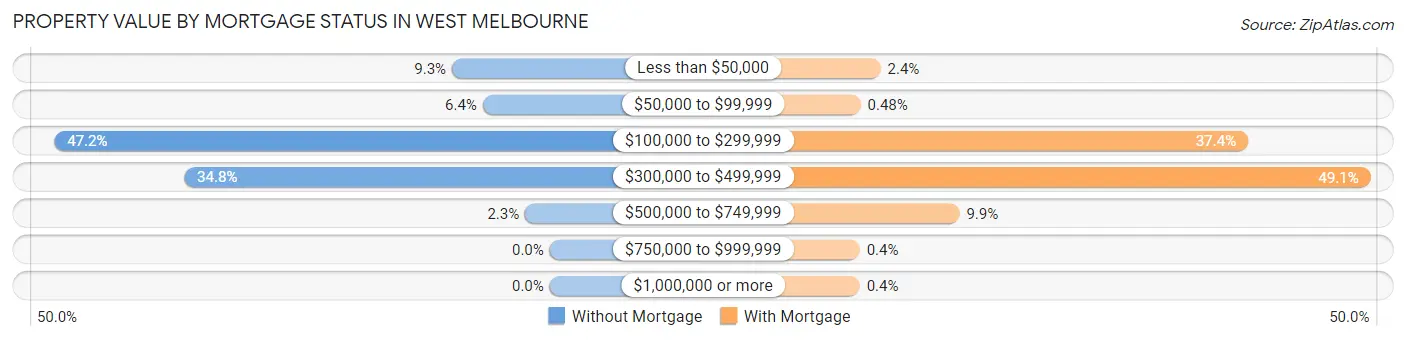
| Property Value | Without Mortgage | With Mortgage |
| Less than $50,000 | 266 (9.3%) | 119 (2.4%) |
| $50,000 to $99,999 | 182 (6.4%) | 24 (0.5%) |
| $100,000 to $299,999 | 1,349 (47.2%) | 1,858 (37.4%) |
| $300,000 to $499,999 | 995 (34.8%) | 2,439 (49.0%) |
| $500,000 to $749,999 | 67 (2.3%) | 492 (9.9%) |
| $750,000 to $999,999 | 0 (0.0%) | 20 (0.4%) |
| $1,000,000 or more | 0 (0.0%) | 20 (0.4%) |
| Total | 2,859 (100.0%) | 4,972 (100.0%) |
Household Income by Mortgage Status in West Melbourne
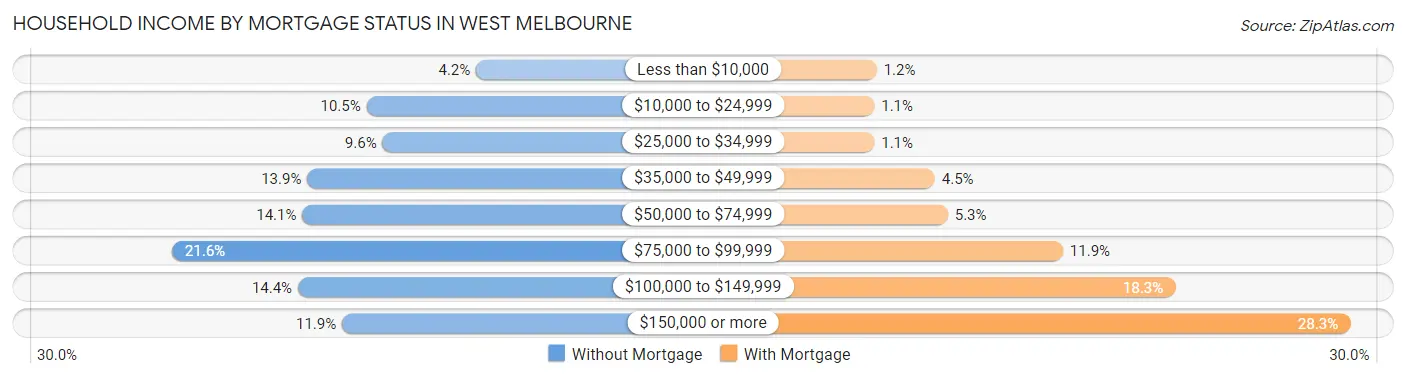
| Household Income | Without Mortgage | With Mortgage |
| Less than $10,000 | 120 (4.2%) | 60 (1.2%) |
| $10,000 to $24,999 | 299 (10.5%) | 53 (1.1%) |
| $25,000 to $34,999 | 273 (9.6%) | 53 (1.1%) |
| $35,000 to $49,999 | 396 (13.9%) | 225 (4.5%) |
| $50,000 to $74,999 | 404 (14.1%) | 262 (5.3%) |
| $75,000 to $99,999 | 617 (21.6%) | 589 (11.8%) |
| $100,000 to $149,999 | 411 (14.4%) | 908 (18.3%) |
| $150,000 or more | 339 (11.9%) | 1,405 (28.3%) |
| Total | 2,859 (100.0%) | 4,972 (100.0%) |
Property Value to Household Income Ratio in West Melbourne
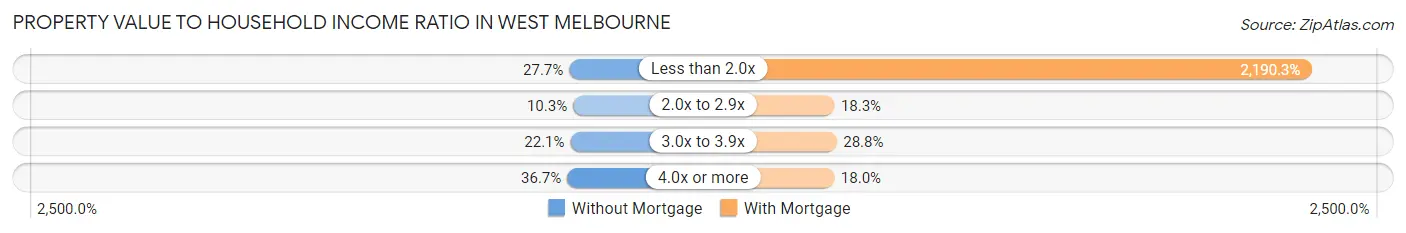
| Value-to-Income Ratio | Without Mortgage | With Mortgage |
| Less than 2.0x | 792 (27.7%) | 108,900 (2,190.3%) |
| 2.0x to 2.9x | 294 (10.3%) | 908 (18.3%) |
| 3.0x to 3.9x | 631 (22.1%) | 1,434 (28.8%) |
| 4.0x or more | 1,050 (36.7%) | 896 (18.0%) |
| Total | 2,859 (100.0%) | 4,972 (100.0%) |
Real Estate Taxes by Mortgage Status in West Melbourne
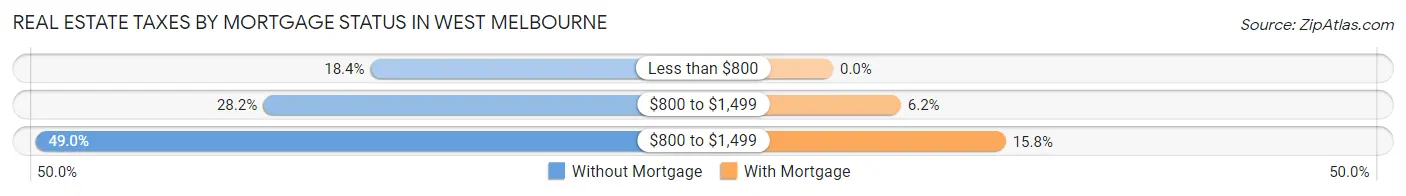
| Property Taxes | Without Mortgage | With Mortgage |
| Less than $800 | 527 (18.4%) | 0 (0.0%) |
| $800 to $1,499 | 807 (28.2%) | 308 (6.2%) |
| $800 to $1,499 | 1,401 (49.0%) | 784 (15.8%) |
| Total | 2,859 (100.0%) | 4,972 (100.0%) |
Health & Disability in West Melbourne
Health Insurance Coverage by Age in West Melbourne
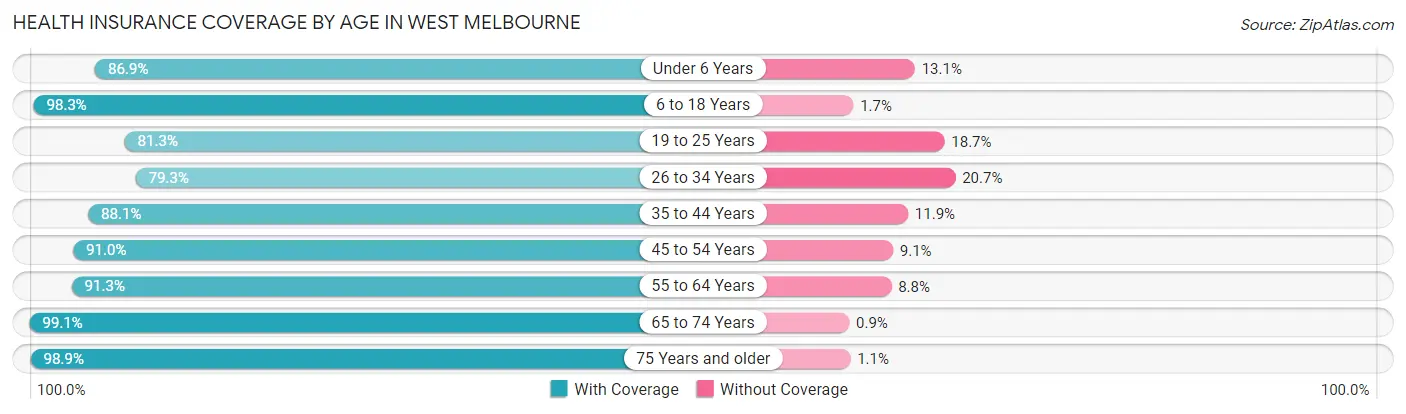
| Age Bracket | With Coverage | Without Coverage |
| Under 6 Years | 1,421 (86.9%) | 215 (13.1%) |
| 6 to 18 Years | 4,574 (98.3%) | 77 (1.7%) |
| 19 to 25 Years | 1,665 (81.3%) | 382 (18.7%) |
| 26 to 34 Years | 2,484 (79.3%) | 648 (20.7%) |
| 35 to 44 Years | 2,734 (88.1%) | 368 (11.9%) |
| 45 to 54 Years | 3,598 (90.9%) | 358 (9.0%) |
| 55 to 64 Years | 2,502 (91.2%) | 240 (8.7%) |
| 65 to 74 Years | 2,425 (99.1%) | 22 (0.9%) |
| 75 Years and older | 2,579 (98.9%) | 29 (1.1%) |
| Total | 23,982 (91.1%) | 2,339 (8.9%) |
Health Insurance Coverage by Citizenship Status in West Melbourne
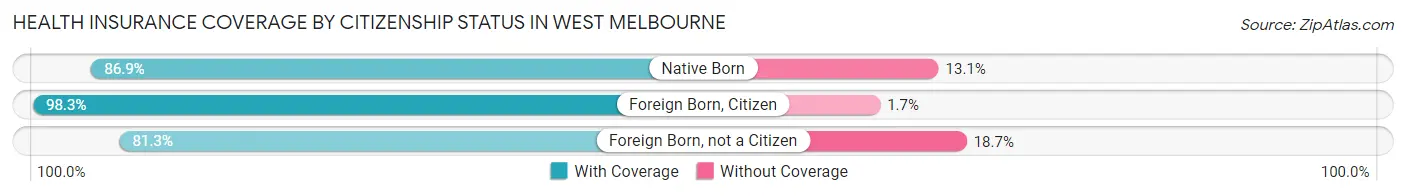
| Citizenship Status | With Coverage | Without Coverage |
| Native Born | 1,421 (86.9%) | 215 (13.1%) |
| Foreign Born, Citizen | 4,574 (98.3%) | 77 (1.7%) |
| Foreign Born, not a Citizen | 1,665 (81.3%) | 382 (18.7%) |
Health Insurance Coverage by Household Income in West Melbourne
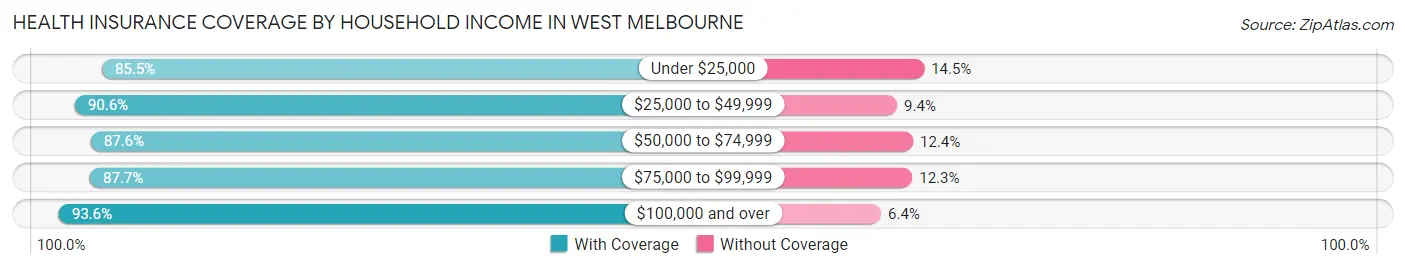
| Household Income | With Coverage | Without Coverage |
| Under $25,000 | 1,073 (85.5%) | 182 (14.5%) |
| $25,000 to $49,999 | 2,603 (90.6%) | 271 (9.4%) |
| $50,000 to $74,999 | 2,442 (87.6%) | 346 (12.4%) |
| $75,000 to $99,999 | 4,415 (87.7%) | 618 (12.3%) |
| $100,000 and over | 13,449 (93.6%) | 922 (6.4%) |
Public vs Private Health Insurance Coverage by Age in West Melbourne
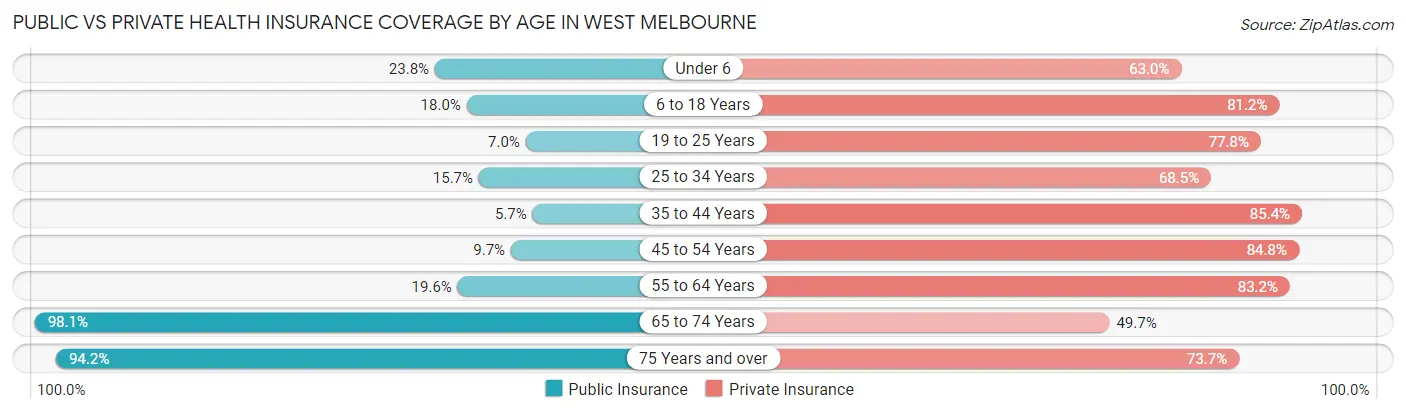
| Age Bracket | Public Insurance | Private Insurance |
| Under 6 | 390 (23.8%) | 1,031 (63.0%) |
| 6 to 18 Years | 835 (17.9%) | 3,776 (81.2%) |
| 19 to 25 Years | 143 (7.0%) | 1,592 (77.8%) |
| 25 to 34 Years | 491 (15.7%) | 2,146 (68.5%) |
| 35 to 44 Years | 177 (5.7%) | 2,649 (85.4%) |
| 45 to 54 Years | 385 (9.7%) | 3,355 (84.8%) |
| 55 to 64 Years | 538 (19.6%) | 2,280 (83.2%) |
| 65 to 74 Years | 2,401 (98.1%) | 1,216 (49.7%) |
| 75 Years and over | 2,456 (94.2%) | 1,923 (73.7%) |
| Total | 7,816 (29.7%) | 19,968 (75.9%) |
Disability Status by Sex by Age in West Melbourne
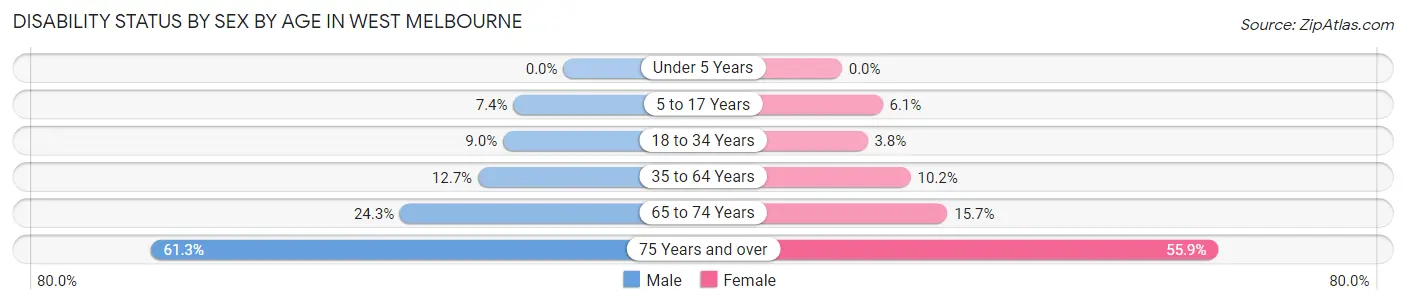
| Age Bracket | Male | Female |
| Under 5 Years | 0 (0.0%) | 0 (0.0%) |
| 5 to 17 Years | 174 (7.4%) | 127 (6.0%) |
| 18 to 34 Years | 299 (9.0%) | 85 (3.8%) |
| 35 to 64 Years | 619 (12.7%) | 503 (10.2%) |
| 65 to 74 Years | 253 (24.3%) | 220 (15.7%) |
| 75 Years and over | 603 (61.3%) | 908 (55.9%) |
Disability Class by Sex by Age in West Melbourne
Disability Class: Hearing Difficulty
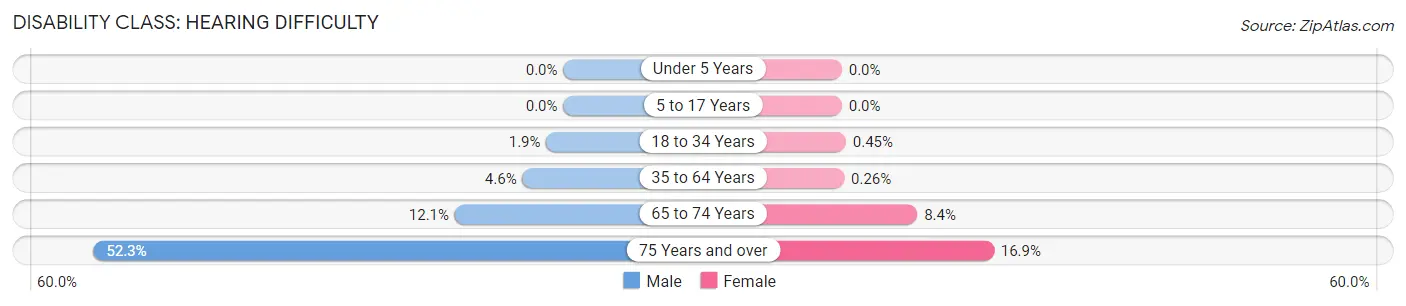
| Age Bracket | Male | Female |
| Under 5 Years | 0 (0.0%) | 0 (0.0%) |
| 5 to 17 Years | 0 (0.0%) | 0 (0.0%) |
| 18 to 34 Years | 63 (1.9%) | 10 (0.4%) |
| 35 to 64 Years | 222 (4.5%) | 13 (0.3%) |
| 65 to 74 Years | 126 (12.1%) | 118 (8.4%) |
| 75 Years and over | 515 (52.3%) | 275 (16.9%) |
Disability Class: Vision Difficulty
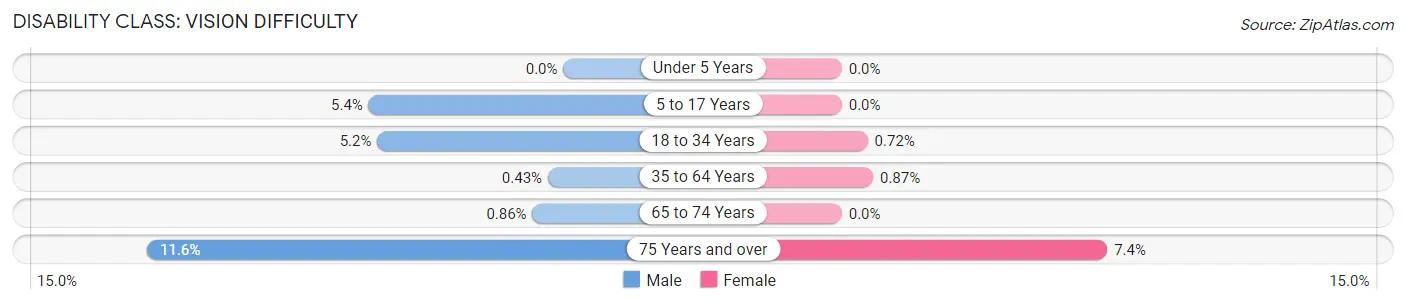
| Age Bracket | Male | Female |
| Under 5 Years | 0 (0.0%) | 0 (0.0%) |
| 5 to 17 Years | 127 (5.4%) | 0 (0.0%) |
| 18 to 34 Years | 173 (5.2%) | 16 (0.7%) |
| 35 to 64 Years | 21 (0.4%) | 43 (0.9%) |
| 65 to 74 Years | 9 (0.9%) | 0 (0.0%) |
| 75 Years and over | 114 (11.6%) | 120 (7.4%) |
Disability Class: Cognitive Difficulty
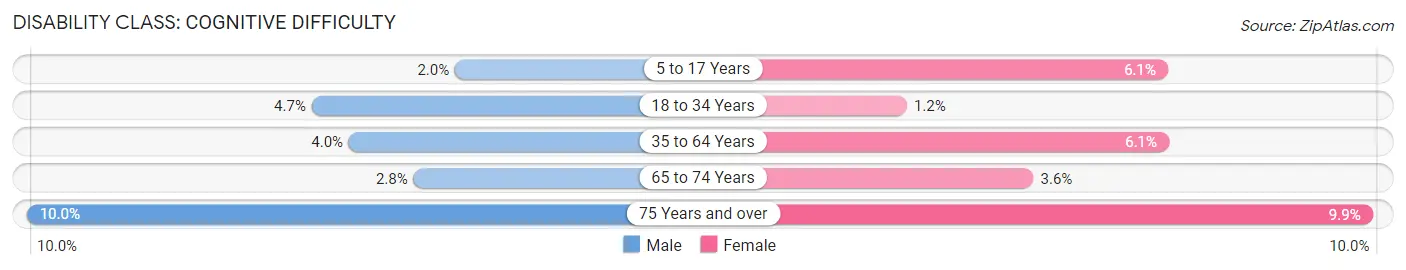
| Age Bracket | Male | Female |
| 5 to 17 Years | 47 (2.0%) | 127 (6.0%) |
| 18 to 34 Years | 156 (4.7%) | 27 (1.2%) |
| 35 to 64 Years | 194 (4.0%) | 299 (6.1%) |
| 65 to 74 Years | 29 (2.8%) | 50 (3.6%) |
| 75 Years and over | 98 (10.0%) | 160 (9.9%) |
Disability Class: Ambulatory Difficulty
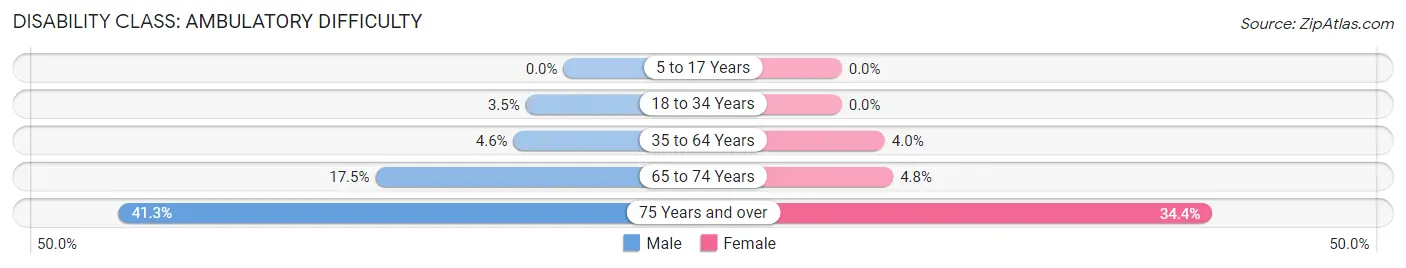
| Age Bracket | Male | Female |
| 5 to 17 Years | 0 (0.0%) | 0 (0.0%) |
| 18 to 34 Years | 117 (3.5%) | 0 (0.0%) |
| 35 to 64 Years | 226 (4.6%) | 197 (4.0%) |
| 65 to 74 Years | 182 (17.4%) | 67 (4.8%) |
| 75 Years and over | 406 (41.3%) | 558 (34.4%) |
Disability Class: Self-Care Difficulty
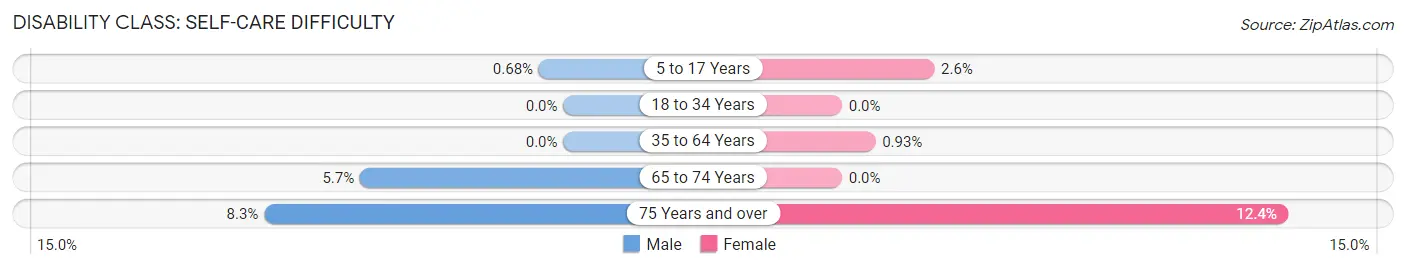
| Age Bracket | Male | Female |
| 5 to 17 Years | 16 (0.7%) | 54 (2.6%) |
| 18 to 34 Years | 0 (0.0%) | 0 (0.0%) |
| 35 to 64 Years | 0 (0.0%) | 46 (0.9%) |
| 65 to 74 Years | 59 (5.7%) | 0 (0.0%) |
| 75 Years and over | 82 (8.3%) | 202 (12.4%) |
Technology Access in West Melbourne
Computing Device Access in West Melbourne
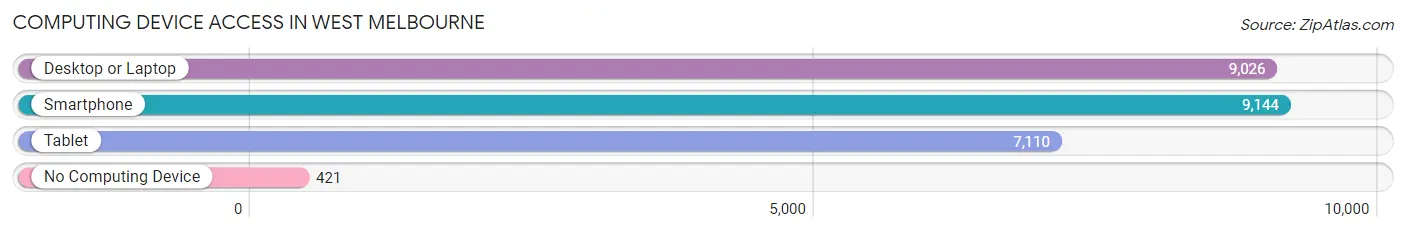
| Device Type | # Households | % Households |
| Desktop or Laptop | 9,026 | 90.4% |
| Smartphone | 9,144 | 91.6% |
| Tablet | 7,110 | 71.2% |
| No Computing Device | 421 | 4.2% |
| Total | 9,980 | 100.0% |
Internet Access in West Melbourne
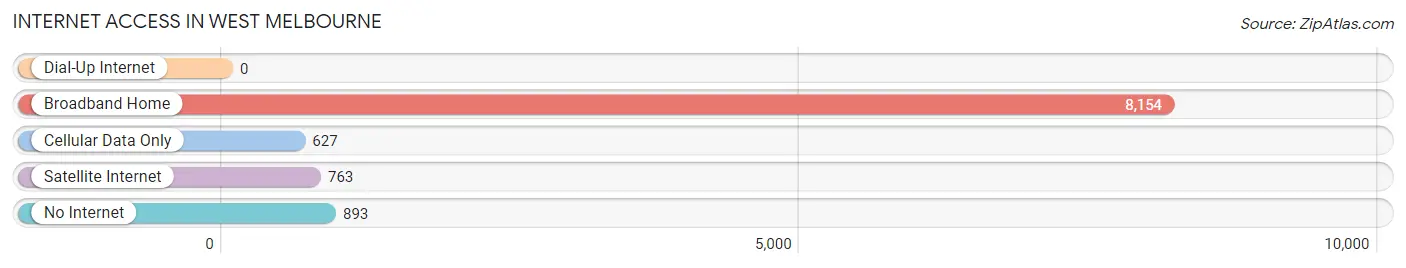
| Internet Type | # Households | % Households |
| Dial-Up Internet | 0 | 0.0% |
| Broadband Home | 8,154 | 81.7% |
| Cellular Data Only | 627 | 6.3% |
| Satellite Internet | 763 | 7.6% |
| No Internet | 893 | 8.9% |
| Total | 9,980 | 100.0% |
West Melbourne Summary
History
West Melbourne is a city located in Brevard County, Florida. It is situated on the Indian River Lagoon, just south of Melbourne. The city was incorporated in 1959 and is part of the Palm Bay-Melbourne-Titusville Metropolitan Statistical Area.
The area that is now West Melbourne was originally inhabited by the Ais Indians, who were part of the Seminole tribe. The Ais were known for their fishing and hunting skills, and they lived in the area for centuries before the arrival of Europeans.
In the late 1700s, the area was explored by Spanish explorers, who named it “La Florida”. The area was later settled by British colonists, who established a trading post in the area. The trading post was destroyed by Seminole Indians in 1835, during the Second Seminole War.
In the late 1800s, the area was settled by settlers from the North, who established a small farming community. The area was known as “West Melbourne”, and the settlers built a school, a church, and a post office.
In the early 1900s, the area began to grow as more settlers moved to the area. The population of West Melbourne grew steadily throughout the 20th century, and the city was officially incorporated in 1959.
Geography
West Melbourne is located in Brevard County, Florida, on the Indian River Lagoon. The city is situated on the western side of the lagoon, just south of Melbourne. The city covers an area of 8.3 square miles, and has a population of approximately 22,000 people.
The city is bordered by the cities of Melbourne, Palm Bay, and Titusville. The city is located in a humid subtropical climate zone, and experiences hot, humid summers and mild winters.
Economy
West Melbourne is a growing city with a diverse economy. The city is home to a variety of businesses, including manufacturing, retail, and healthcare. The city is also home to several large employers, including Harris Corporation, Northrop Grumman, and DRS Technologies.
The city is also home to a number of small businesses, including restaurants, shops, and services. The city is also home to a number of tourist attractions, including the Brevard Zoo, the Brevard Museum of Natural History, and the Brevard County Manatee Sanctuary.
Demographics
As of the 2010 census, West Melbourne had a population of 22,733 people. The racial makeup of the city was 87.3% White, 6.2% African American, 0.5% Native American, 1.7% Asian, 0.1% Pacific Islander, 1.7% from other races, and 2.5% from two or more races. Hispanic or Latino of any race were 8.2% of the population.
The median income for a household in the city was $45,845, and the median income for a family was $54,845. The per capita income for the city was $25,845. About 8.2% of families and 10.3% of the population were below the poverty line, including 14.2% of those under age 18 and 6.2% of those age 65 or over.
Common Questions
What is Per Capita Income in West Melbourne?
Per Capita income in West Melbourne is $38,330.
What is the Median Family Income in West Melbourne?
Median Family Income in West Melbourne is $103,182.
What is the Median Household income in West Melbourne?
Median Household Income in West Melbourne is $86,398.
What is Income or Wage Gap in West Melbourne?
Income or Wage Gap in West Melbourne is 40.7%.
Women in West Melbourne earn 59.3 cents for every dollar earned by a man.
What is Inequality or Gini Index in West Melbourne?
Inequality or Gini Index in West Melbourne is 0.36.
What is the Total Population of West Melbourne?
Total Population of West Melbourne is 26,762.
What is the Total Male Population of West Melbourne?
Total Male Population of West Melbourne is 13,359.
What is the Total Female Population of West Melbourne?
Total Female Population of West Melbourne is 13,403.
What is the Ratio of Males per 100 Females in West Melbourne?
There are 99.67 Males per 100 Females in West Melbourne.
What is the Ratio of Females per 100 Males in West Melbourne?
There are 100.33 Females per 100 Males in West Melbourne.
What is the Median Population Age in West Melbourne?
Median Population Age in West Melbourne is 40.9 Years.
What is the Average Family Size in West Melbourne
Average Family Size in West Melbourne is 3.3 People.
What is the Average Household Size in West Melbourne
Average Household Size in West Melbourne is 2.6 People.
How Large is the Labor Force in West Melbourne?
There are 13,066 People in the Labor Forcein in West Melbourne.
What is the Percentage of People in the Labor Force in West Melbourne?
60.2% of People are in the Labor Force in West Melbourne.
What is the Unemployment Rate in West Melbourne?
Unemployment Rate in West Melbourne is 4.9%.