Roseto borough, PA Map & Demographics
Roseto borough Overview
$34,253
PER CAPITA INCOME
$91,250
AVG FAMILY INCOME
$81,000
AVG HOUSEHOLD INCOME
39.5%
WAGE / INCOME GAP [ % ]
60.5¢/ $1
WAGE / INCOME GAP [ $ ]
0.40
INEQUALITY / GINI INDEX
1,950
TOTAL POPULATION
1,017
MALE POPULATION
933
FEMALE POPULATION
109.00
MALES / 100 FEMALES
91.74
FEMALES / 100 MALES
31.6
MEDIAN AGE
3.2
AVG FAMILY SIZE
3.0
AVG HOUSEHOLD SIZE
1,033
LABOR FORCE [ PEOPLE ]
74.5%
PERCENT IN LABOR FORCE
6.7%
UNEMPLOYMENT RATE
Income in Roseto borough
Income Overview in Roseto borough
Per Capita Income in Roseto borough is $34,253, while median incomes of families and households are $91,250 and $81,000 respectively.
| Characteristic | Number | Measure |
| Per Capita Income | 1,950 | $34,253 |
| Median Family Income | 528 | $91,250 |
| Mean Family Income | 528 | $101,697 |
| Median Household Income | 660 | $81,000 |
| Mean Household Income | 660 | $100,620 |
| Income Deficit | 528 | $0 |
| Wage / Income Gap (%) | 1,950 | 39.46% |
| Wage / Income Gap ($) | 1,950 | 60.54¢ per $1 |
| Gini / Inequality Index | 1,950 | 0.40 |
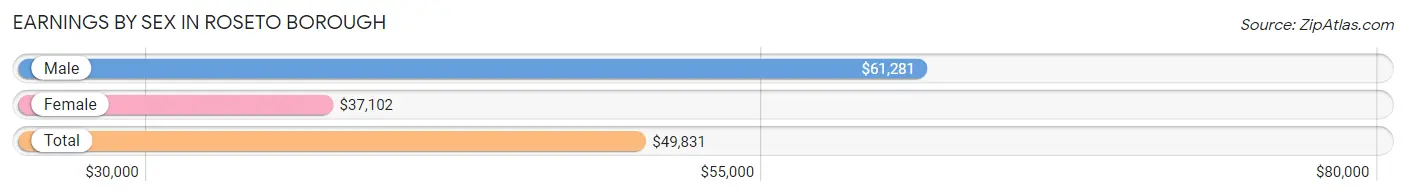
Earnings by Sex in Roseto borough
Average Earnings in Roseto borough are $49,831, $61,281 for men and $37,102 for women, a difference of 39.5%.
| Sex | Number | Average Earnings |
| Male | 493 (48.7%) | $61,281 |
| Female | 520 (51.3%) | $37,102 |
| Total | 1,013 (100.0%) | $49,831 |
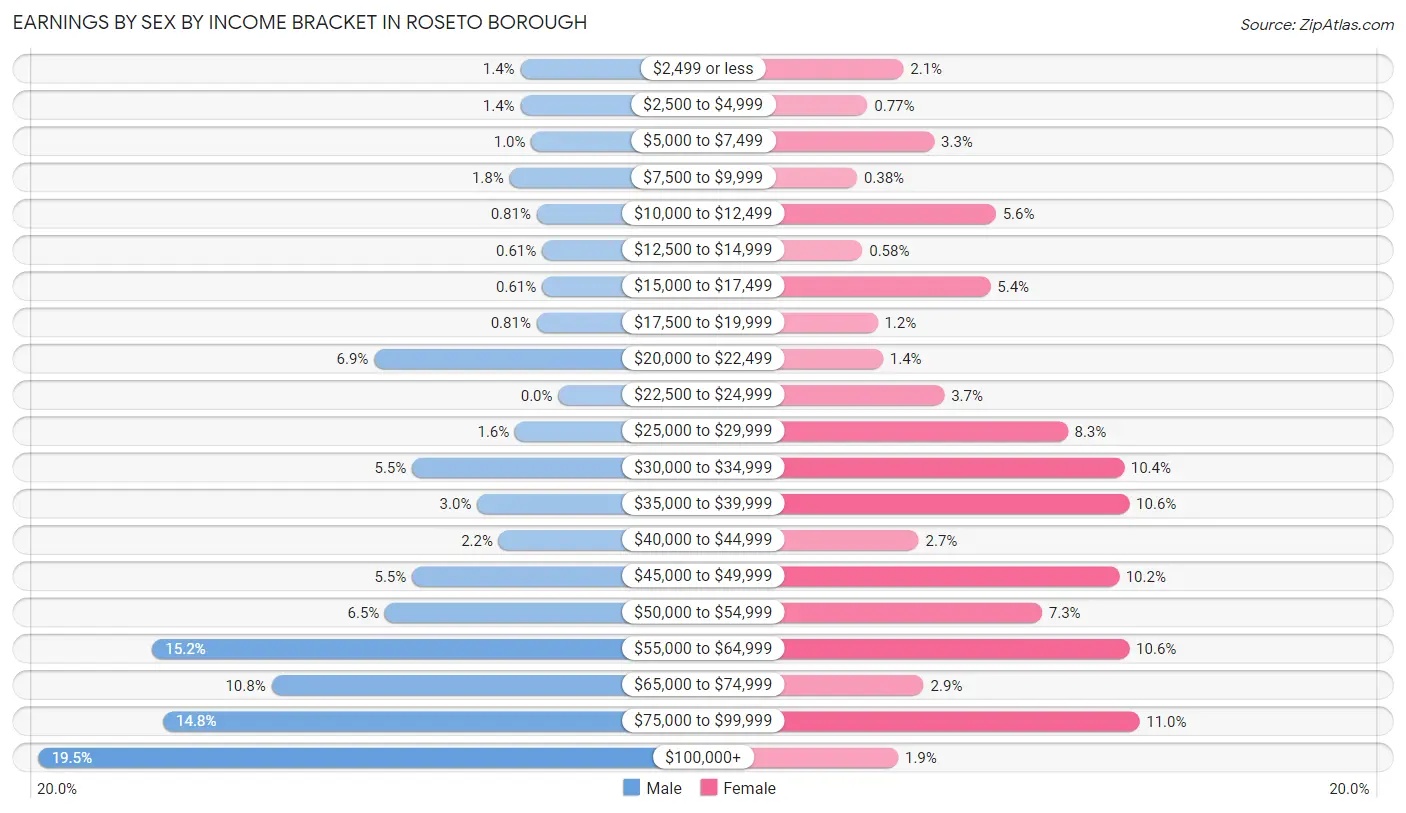
Earnings by Sex by Income Bracket in Roseto borough
The most common earnings brackets in Roseto borough are $100,000+ for men (96 | 19.5%) and $75,000 to $99,999 for women (57 | 11.0%).
| Income | Male | Female |
| $2,499 or less | 7 (1.4%) | 11 (2.1%) |
| $2,500 to $4,999 | 7 (1.4%) | 4 (0.8%) |
| $5,000 to $7,499 | 5 (1.0%) | 17 (3.3%) |
| $7,500 to $9,999 | 9 (1.8%) | 2 (0.4%) |
| $10,000 to $12,499 | 4 (0.8%) | 29 (5.6%) |
| $12,500 to $14,999 | 3 (0.6%) | 3 (0.6%) |
| $15,000 to $17,499 | 3 (0.6%) | 28 (5.4%) |
| $17,500 to $19,999 | 4 (0.8%) | 6 (1.1%) |
| $20,000 to $22,499 | 34 (6.9%) | 7 (1.3%) |
| $22,500 to $24,999 | 0 (0.0%) | 19 (3.6%) |
| $25,000 to $29,999 | 8 (1.6%) | 43 (8.3%) |
| $30,000 to $34,999 | 27 (5.5%) | 54 (10.4%) |
| $35,000 to $39,999 | 15 (3.0%) | 55 (10.6%) |
| $40,000 to $44,999 | 11 (2.2%) | 14 (2.7%) |
| $45,000 to $49,999 | 27 (5.5%) | 53 (10.2%) |
| $50,000 to $54,999 | 32 (6.5%) | 38 (7.3%) |
| $55,000 to $64,999 | 75 (15.2%) | 55 (10.6%) |
| $65,000 to $74,999 | 53 (10.7%) | 15 (2.9%) |
| $75,000 to $99,999 | 73 (14.8%) | 57 (11.0%) |
| $100,000+ | 96 (19.5%) | 10 (1.9%) |
| Total | 493 (100.0%) | 520 (100.0%) |
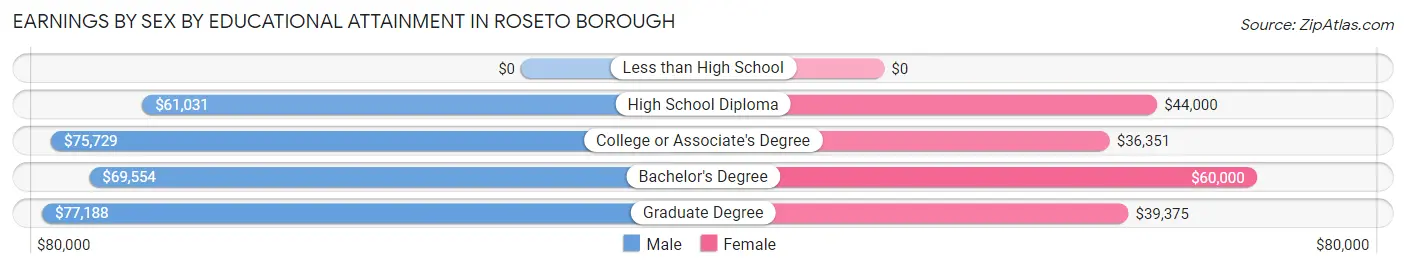
Earnings by Sex by Educational Attainment in Roseto borough
Average earnings in Roseto borough are $64,500 for men and $41,111 for women, a difference of 36.3%. Men with an educational attainment of graduate degree enjoy the highest average annual earnings of $77,188, while those with high school diploma education earn the least with $61,031. Women with an educational attainment of bachelor's degree earn the most with the average annual earnings of $60,000, while those with college or associate's degree education have the smallest earnings of $36,351.
| Educational Attainment | Male Income | Female Income |
| Less than High School | - | - |
| High School Diploma | $61,031 | $44,000 |
| College or Associate's Degree | $75,729 | $36,351 |
| Bachelor's Degree | $69,554 | $60,000 |
| Graduate Degree | $77,188 | $39,375 |
| Total | $64,500 | $41,111 |
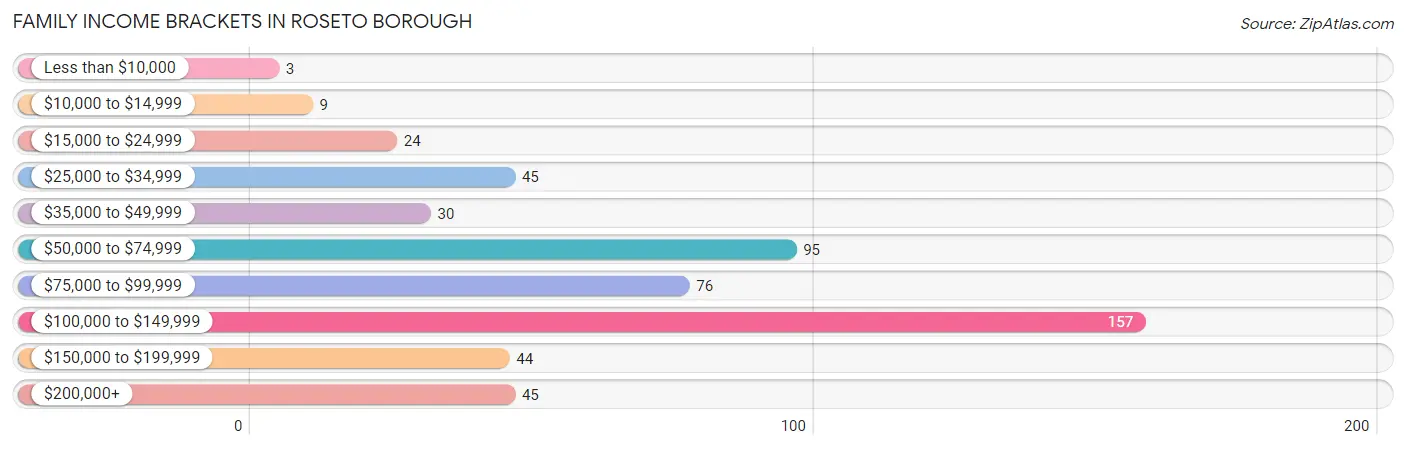
Family Income in Roseto borough
Family Income Brackets in Roseto borough
According to the Roseto borough family income data, there are 157 families falling into the $100,000 to $149,999 income range, which is the most common income bracket and makes up 29.7% of all families. Conversely, the less than $10,000 income bracket is the least frequent group with only 3 families (0.6%) belonging to this category.
| Income Bracket | # Families | % Families |
| Less than $10,000 | 3 | 0.6% |
| $10,000 to $14,999 | 9 | 1.7% |
| $15,000 to $24,999 | 24 | 4.5% |
| $25,000 to $34,999 | 45 | 8.5% |
| $35,000 to $49,999 | 30 | 5.7% |
| $50,000 to $74,999 | 95 | 18.0% |
| $75,000 to $99,999 | 76 | 14.4% |
| $100,000 to $149,999 | 157 | 29.7% |
| $150,000 to $199,999 | 44 | 8.3% |
| $200,000+ | 45 | 8.5% |
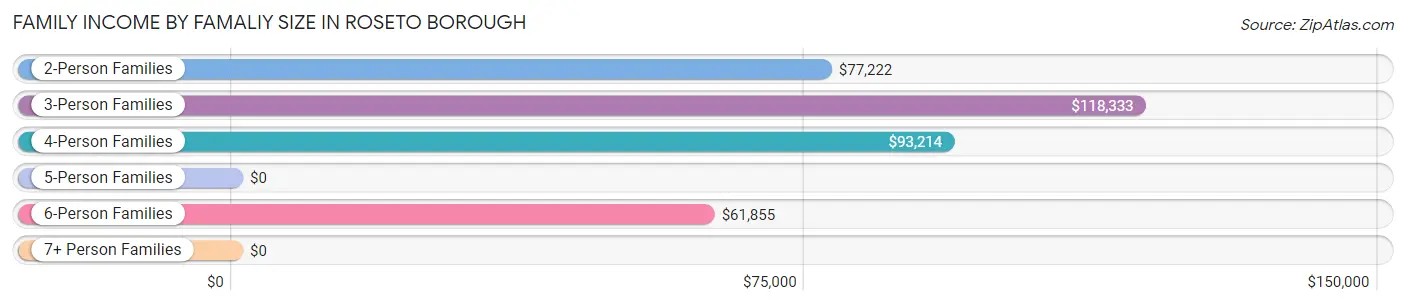
Family Income by Famaliy Size in Roseto borough
3-person families (122 | 23.1%) account for the highest median family income in Roseto borough with $118,333 per family, while 3-person families (122 | 23.1%) have the highest median income of $39,444 per family member.
| Income Bracket | # Families | Median Income |
| 2-Person Families | 186 (35.2%) | $77,222 |
| 3-Person Families | 122 (23.1%) | $118,333 |
| 4-Person Families | 144 (27.3%) | $93,214 |
| 5-Person Families | 27 (5.1%) | $0 |
| 6-Person Families | 46 (8.7%) | $61,855 |
| 7+ Person Families | 3 (0.6%) | $0 |
| Total | 528 (100.0%) | $91,250 |
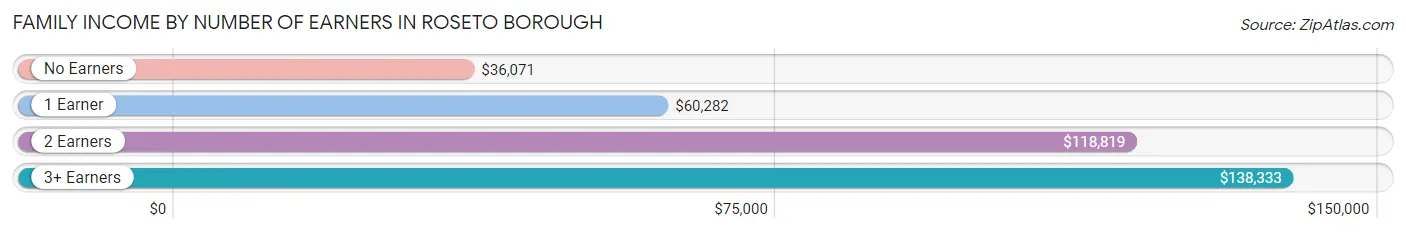
Family Income by Number of Earners in Roseto borough
The median family income in Roseto borough is $91,250, with families comprising 3+ earners (74) having the highest median family income of $138,333, while families with no earners (58) have the lowest median family income of $36,071, accounting for 14.0% and 11.0% of families, respectively.
| Number of Earners | # Families | Median Income |
| No Earners | 58 (11.0%) | $36,071 |
| 1 Earner | 169 (32.0%) | $60,282 |
| 2 Earners | 227 (43.0%) | $118,819 |
| 3+ Earners | 74 (14.0%) | $138,333 |
| Total | 528 (100.0%) | $91,250 |
Household Income in Roseto borough
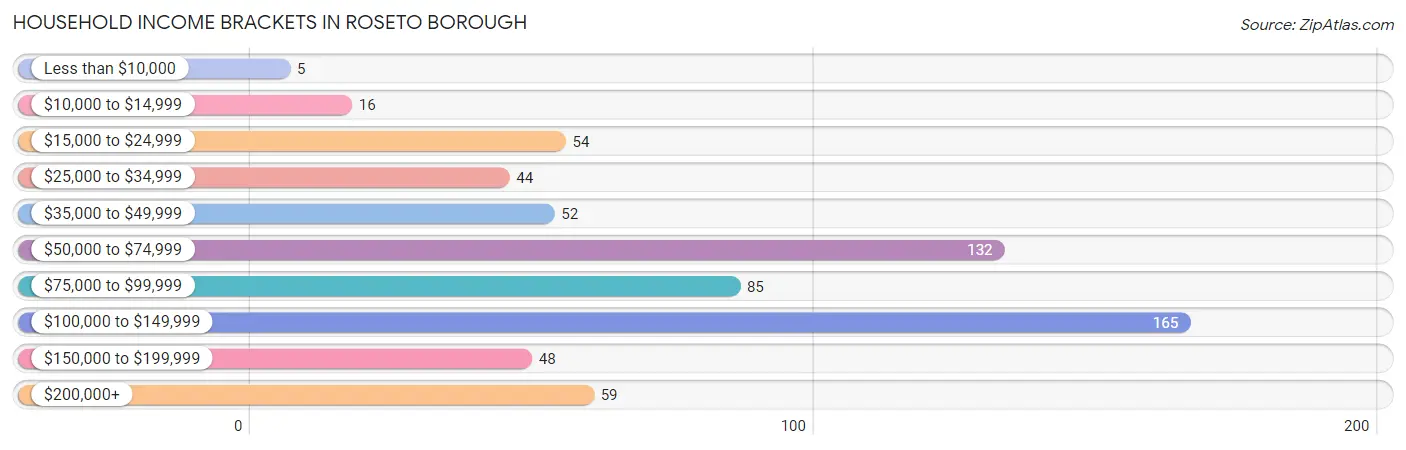
Household Income Brackets in Roseto borough
With 165 households falling in the category, the $100,000 to $149,999 income range is the most frequent in Roseto borough, accounting for 25.0% of all households. In contrast, only 5 households (0.8%) fall into the less than $10,000 income bracket, making it the least populous group.
| Income Bracket | # Households | % Households |
| Less than $10,000 | 5 | 0.8% |
| $10,000 to $14,999 | 16 | 2.4% |
| $15,000 to $24,999 | 54 | 8.2% |
| $25,000 to $34,999 | 44 | 6.7% |
| $35,000 to $49,999 | 52 | 7.9% |
| $50,000 to $74,999 | 132 | 20.0% |
| $75,000 to $99,999 | 85 | 12.9% |
| $100,000 to $149,999 | 165 | 25.0% |
| $150,000 to $199,999 | 48 | 7.3% |
| $200,000+ | 59 | 8.9% |
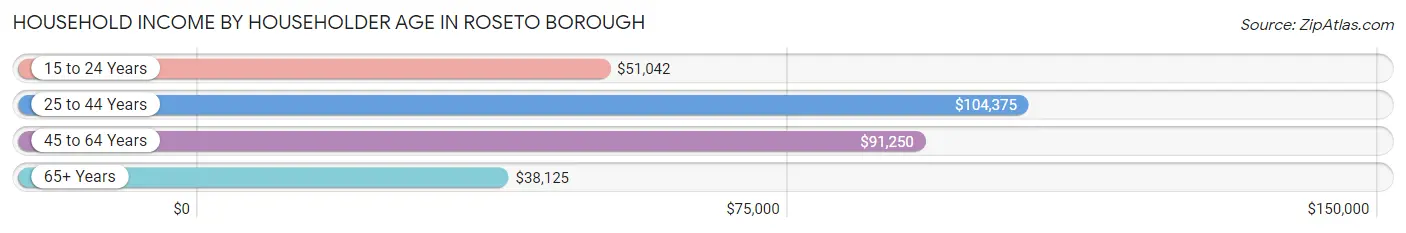
Household Income by Householder Age in Roseto borough
The median household income in Roseto borough is $81,000, with the highest median household income of $104,375 found in the 25 to 44 years age bracket for the primary householder. A total of 299 households (45.3%) fall into this category. Meanwhile, the 65+ years age bracket for the primary householder has the lowest median household income of $38,125, with 124 households (18.8%) in this group.
| Income Bracket | # Households | Median Income |
| 15 to 24 Years | 21 (3.2%) | $51,042 |
| 25 to 44 Years | 299 (45.3%) | $104,375 |
| 45 to 64 Years | 216 (32.7%) | $91,250 |
| 65+ Years | 124 (18.8%) | $38,125 |
| Total | 660 (100.0%) | $81,000 |
Poverty in Roseto borough
Income Below Poverty by Sex and Age in Roseto borough
With 15.0% poverty level for males and 12.1% for females among the residents of Roseto borough, 5 year old males and 6 to 11 year old females are the most vulnerable to poverty, with 11 males (100.0%) and 18 females (27.7%) in their respective age groups living below the poverty level.
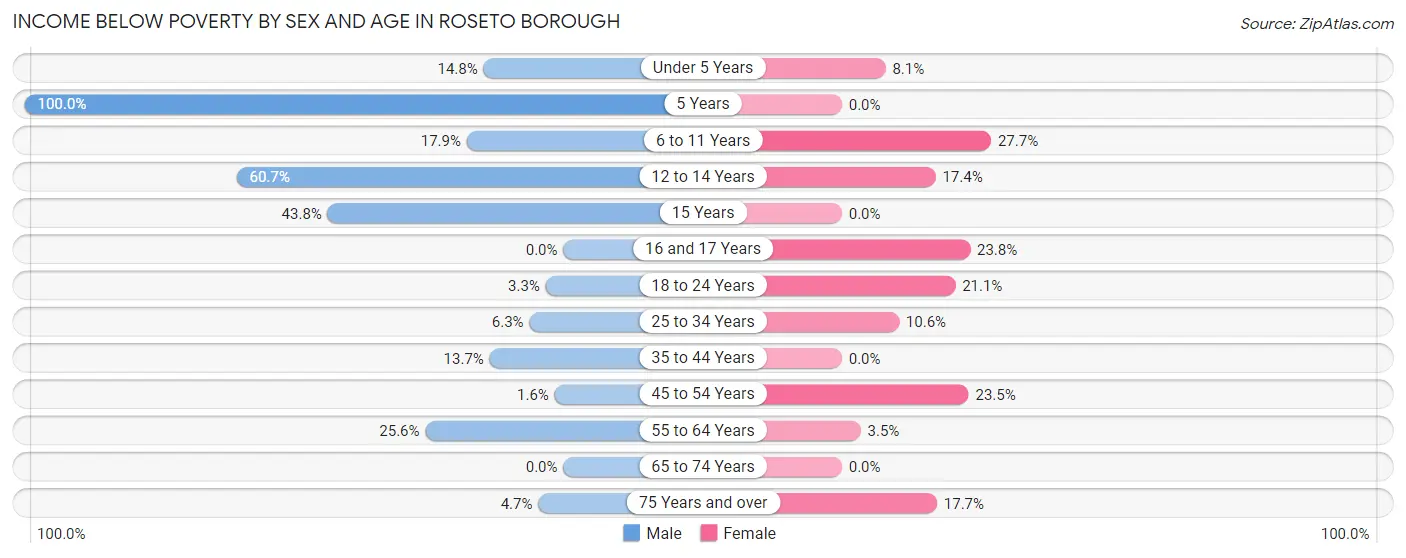
| Age Bracket | Male | Female |
| Under 5 Years | 16 (14.8%) | 3 (8.1%) |
| 5 Years | 11 (100.0%) | 0 (0.0%) |
| 6 to 11 Years | 31 (17.9%) | 18 (27.7%) |
| 12 to 14 Years | 37 (60.7%) | 8 (17.4%) |
| 15 Years | 7 (43.8%) | 0 (0.0%) |
| 16 and 17 Years | 0 (0.0%) | 5 (23.8%) |
| 18 to 24 Years | 2 (3.3%) | 12 (21.0%) |
| 25 to 34 Years | 11 (6.3%) | 23 (10.6%) |
| 35 to 44 Years | 13 (13.7%) | 0 (0.0%) |
| 45 to 54 Years | 2 (1.6%) | 28 (23.5%) |
| 55 to 64 Years | 21 (25.6%) | 3 (3.5%) |
| 65 to 74 Years | 0 (0.0%) | 0 (0.0%) |
| 75 Years and over | 2 (4.6%) | 12 (17.6%) |
| Total | 153 (15.0%) | 112 (12.1%) |
Income Above Poverty by Sex and Age in Roseto borough
According to the poverty statistics in Roseto borough, males aged 16 and 17 years and females aged 5 years are the age groups that are most secure financially, with 100.0% of males and 100.0% of females in these age groups living above the poverty line.
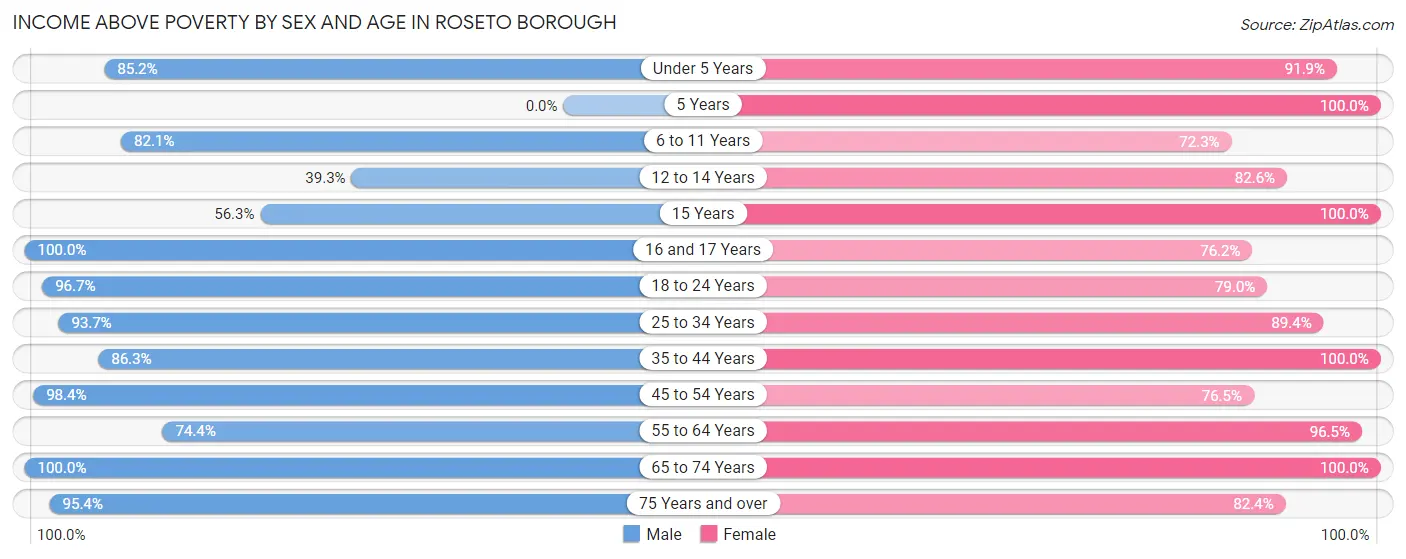
| Age Bracket | Male | Female |
| Under 5 Years | 92 (85.2%) | 34 (91.9%) |
| 5 Years | 0 (0.0%) | 27 (100.0%) |
| 6 to 11 Years | 142 (82.1%) | 47 (72.3%) |
| 12 to 14 Years | 24 (39.3%) | 38 (82.6%) |
| 15 Years | 9 (56.2%) | 13 (100.0%) |
| 16 and 17 Years | 35 (100.0%) | 16 (76.2%) |
| 18 to 24 Years | 59 (96.7%) | 45 (78.9%) |
| 25 to 34 Years | 164 (93.7%) | 194 (89.4%) |
| 35 to 44 Years | 82 (86.3%) | 121 (100.0%) |
| 45 to 54 Years | 122 (98.4%) | 91 (76.5%) |
| 55 to 64 Years | 61 (74.4%) | 83 (96.5%) |
| 65 to 74 Years | 33 (100.0%) | 49 (100.0%) |
| 75 Years and over | 41 (95.4%) | 56 (82.4%) |
| Total | 864 (85.0%) | 814 (87.9%) |
Income Below Poverty Among Married-Couple Families in Roseto borough
The poverty statistics for married-couple families in Roseto borough show that 3.9% or 16 of the total 410 families live below the poverty line. Families with 5 or more children have the highest poverty rate of 100.0%, comprising of 3 families. On the other hand, families with 3 or 4 children have the lowest poverty rate of 0.0%, which includes 0 families.
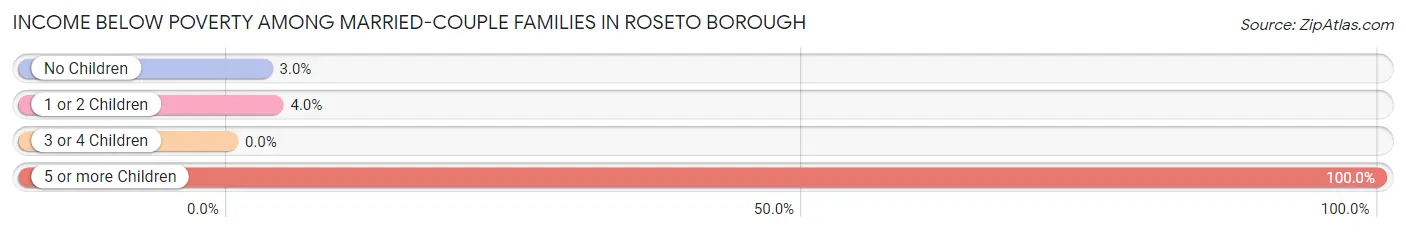
| Children | Above Poverty | Below Poverty |
| No Children | 161 (97.0%) | 5 (3.0%) |
| 1 or 2 Children | 194 (96.0%) | 8 (4.0%) |
| 3 or 4 Children | 39 (100.0%) | 0 (0.0%) |
| 5 or more Children | 0 (0.0%) | 3 (100.0%) |
| Total | 394 (96.1%) | 16 (3.9%) |
Income Below Poverty Among Single-Parent Households in Roseto borough
According to the poverty data in Roseto borough, 23.8% or 5 single-father households and 34.0% or 33 single-mother households are living below the poverty line. Among single-father households, those with 1 or 2 children have the highest poverty rate, with 5 households (55.6%) experiencing poverty. Likewise, among single-mother households, those with 3 or 4 children have the highest poverty rate, with 30 households (90.9%) falling below the poverty line.
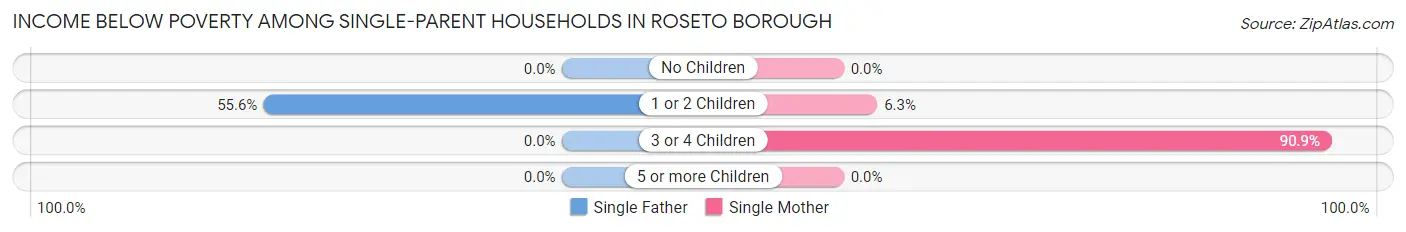
| Children | Single Father | Single Mother |
| No Children | 0 (0.0%) | 0 (0.0%) |
| 1 or 2 Children | 5 (55.6%) | 3 (6.2%) |
| 3 or 4 Children | 0 (0.0%) | 30 (90.9%) |
| 5 or more Children | 0 (0.0%) | 0 (0.0%) |
| Total | 5 (23.8%) | 33 (34.0%) |
Income Below Poverty Among Married-Couple vs Single-Parent Households in Roseto borough
The poverty data for Roseto borough shows that 16 of the married-couple family households (3.9%) and 38 of the single-parent households (32.2%) are living below the poverty level. Within the married-couple family households, those with 5 or more children have the highest poverty rate, with 3 households (100.0%) falling below the poverty line. Among the single-parent households, those with 3 or 4 children have the highest poverty rate, with 30 household (85.7%) living below poverty.
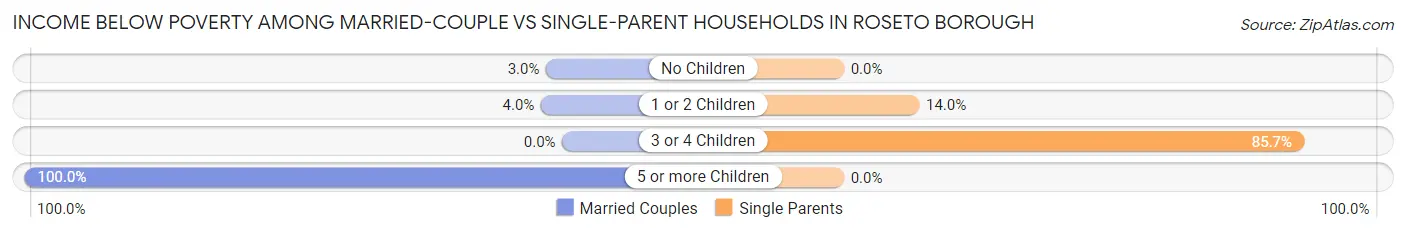
| Children | Married-Couple Families | Single-Parent Households |
| No Children | 5 (3.0%) | 0 (0.0%) |
| 1 or 2 Children | 8 (4.0%) | 8 (14.0%) |
| 3 or 4 Children | 0 (0.0%) | 30 (85.7%) |
| 5 or more Children | 3 (100.0%) | 0 (0.0%) |
| Total | 16 (3.9%) | 38 (32.2%) |
Race in Roseto borough
The most populous races in Roseto borough are White / Caucasian (1,876 | 96.2%), Hispanic or Latino (169 | 8.7%), and Two or more Races (64 | 3.3%).
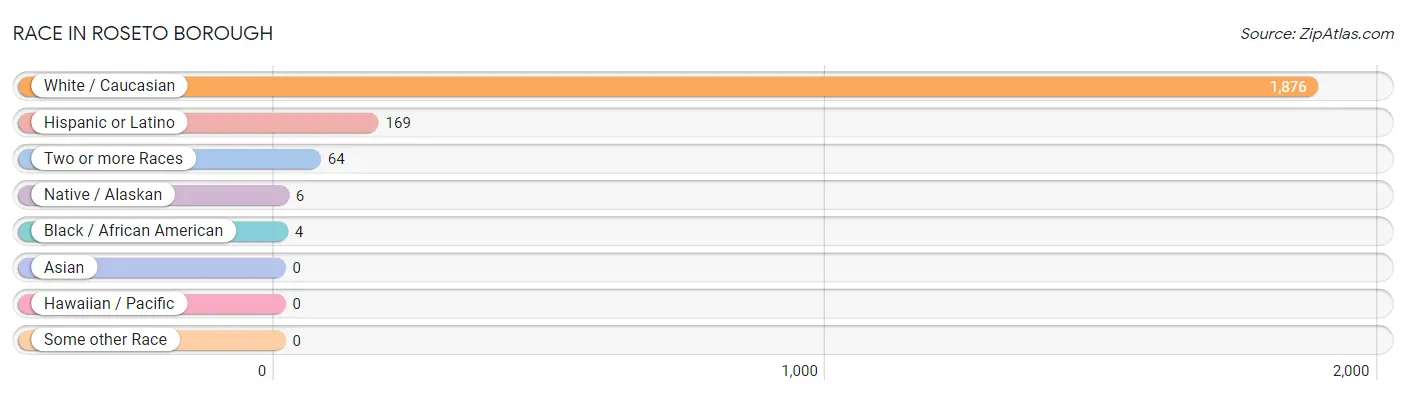
| Race | # Population | % Population |
| Asian | 0 | 0.0% |
| Black / African American | 4 | 0.2% |
| Hawaiian / Pacific | 0 | 0.0% |
| Hispanic or Latino | 169 | 8.7% |
| Native / Alaskan | 6 | 0.3% |
| White / Caucasian | 1,876 | 96.2% |
| Two or more Races | 64 | 3.3% |
| Some other Race | 0 | 0.0% |
| Total | 1,950 | 100.0% |
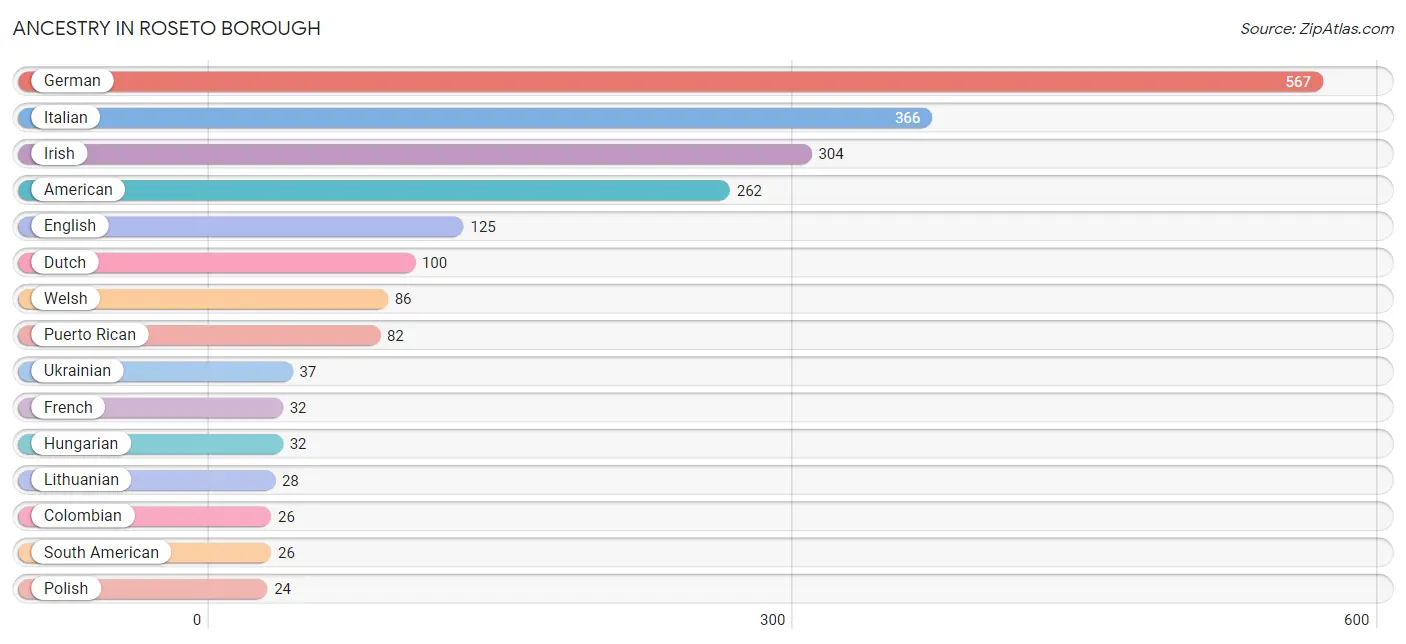
Ancestry in Roseto borough
The most populous ancestries reported in Roseto borough are German (567 | 29.1%), Italian (366 | 18.8%), Irish (304 | 15.6%), American (262 | 13.4%), and English (125 | 6.4%), together accounting for 83.3% of all Roseto borough residents.
| Ancestry | # Population | % Population |
| Albanian | 8 | 0.4% |
| American | 262 | 13.4% |
| Austrian | 12 | 0.6% |
| Blackfeet | 3 | 0.2% |
| British | 2 | 0.1% |
| Central American | 7 | 0.4% |
| Colombian | 26 | 1.3% |
| Cuban | 2 | 0.1% |
| Dutch | 100 | 5.1% |
| English | 125 | 6.4% |
| European | 10 | 0.5% |
| French | 32 | 1.6% |
| French Canadian | 8 | 0.4% |
| German | 567 | 29.1% |
| Greek | 4 | 0.2% |
| Hungarian | 32 | 1.6% |
| Irish | 304 | 15.6% |
| Italian | 366 | 18.8% |
| Korean | 17 | 0.9% |
| Lithuanian | 28 | 1.4% |
| Mexican | 8 | 0.4% |
| Pennsylvania German | 17 | 0.9% |
| Polish | 24 | 1.2% |
| Portuguese | 24 | 1.2% |
| Puerto Rican | 82 | 4.2% |
| Russian | 2 | 0.1% |
| Salvadoran | 7 | 0.4% |
| Scotch-Irish | 5 | 0.3% |
| Scottish | 4 | 0.2% |
| Sioux | 6 | 0.3% |
| Slovak | 8 | 0.4% |
| South American | 26 | 1.3% |
| Spanish | 19 | 1.0% |
| Thai | 3 | 0.2% |
| Trinidadian and Tobagonian | 12 | 0.6% |
| Ukrainian | 37 | 1.9% |
| Welsh | 86 | 4.4% | View All 37 Rows |
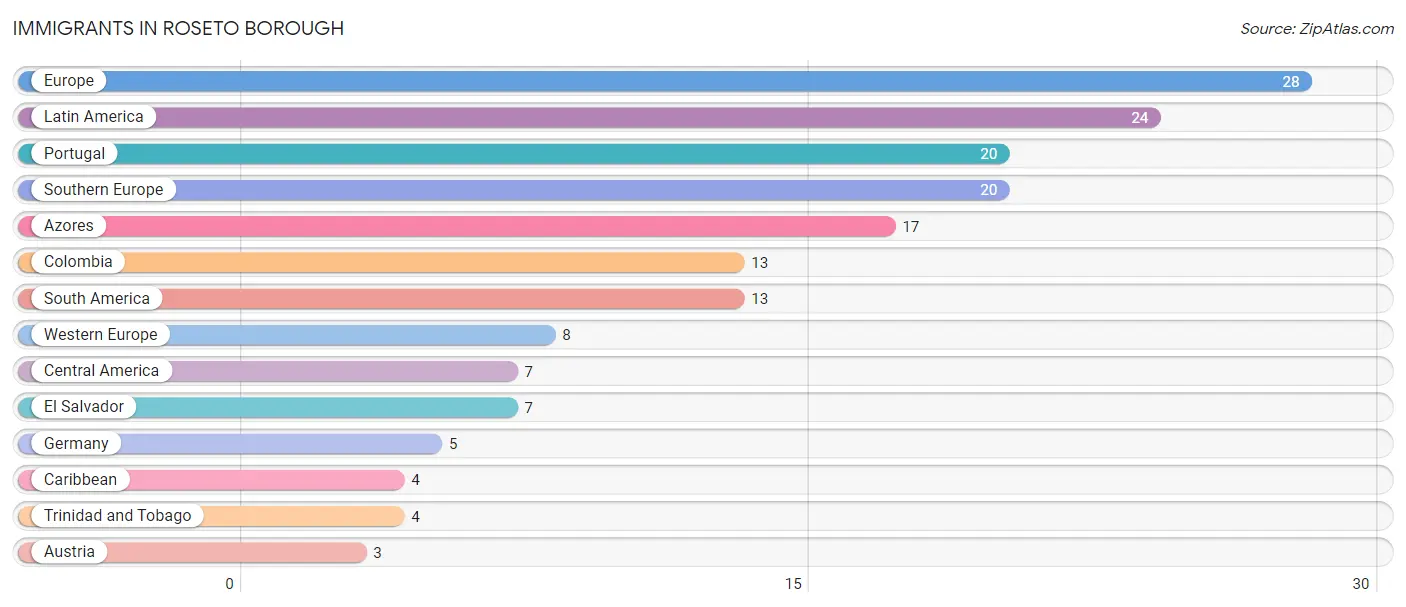
Immigrants in Roseto borough
The most numerous immigrant groups reported in Roseto borough came from Europe (28 | 1.4%), Latin America (24 | 1.2%), Portugal (20 | 1.0%), Southern Europe (20 | 1.0%), and Azores (17 | 0.9%), together accounting for 5.6% of all Roseto borough residents.
| Immigration Origin | # Population | % Population |
| Austria | 3 | 0.2% |
| Azores | 17 | 0.9% |
| Caribbean | 4 | 0.2% |
| Central America | 7 | 0.4% |
| Colombia | 13 | 0.7% |
| El Salvador | 7 | 0.4% |
| Europe | 28 | 1.4% |
| Germany | 5 | 0.3% |
| Latin America | 24 | 1.2% |
| Portugal | 20 | 1.0% |
| South America | 13 | 0.7% |
| Southern Europe | 20 | 1.0% |
| Trinidad and Tobago | 4 | 0.2% |
| Western Europe | 8 | 0.4% | View All 14 Rows |
Sex and Age in Roseto borough
Sex and Age in Roseto borough
The most populous age groups in Roseto borough are 5 to 9 Years (135 | 13.3%) for men and 30 to 34 Years (149 | 16.0%) for women.
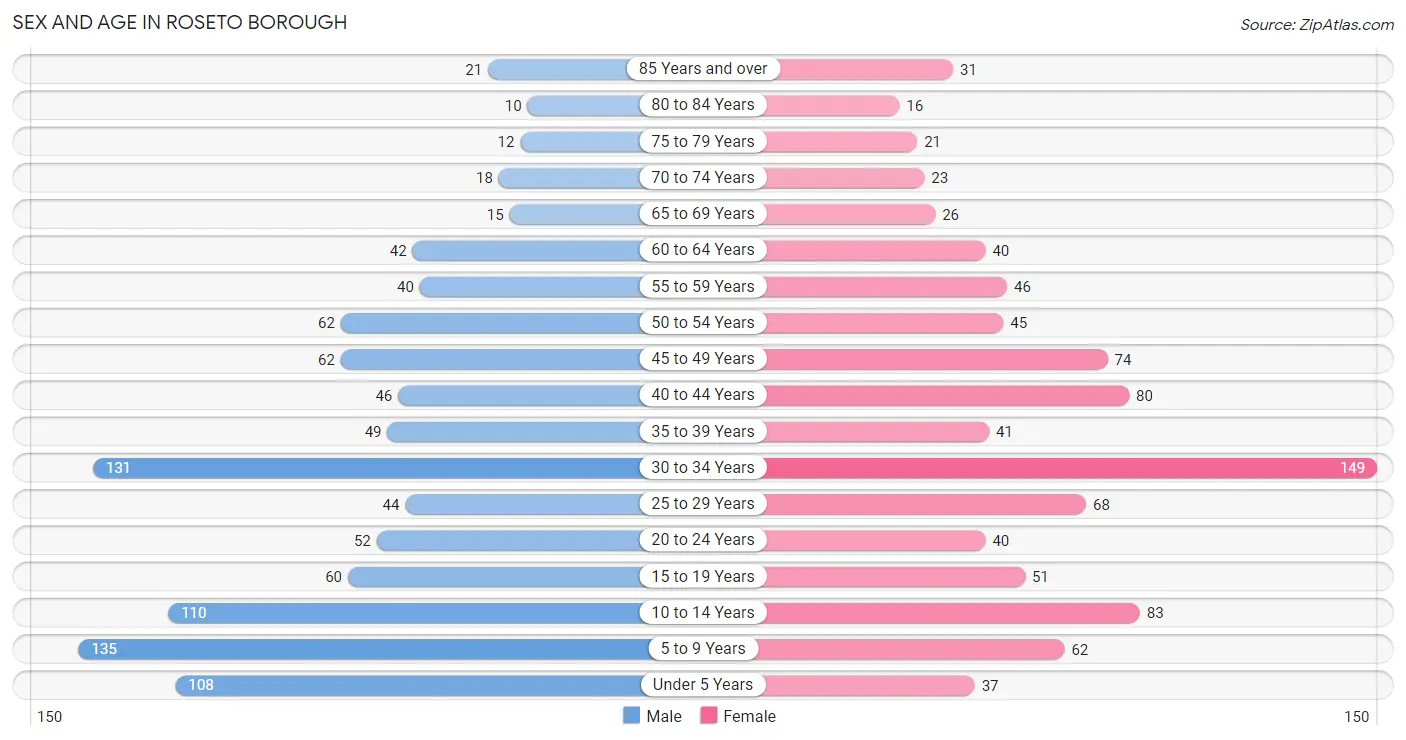
| Age Bracket | Male | Female |
| Under 5 Years | 108 (10.6%) | 37 (4.0%) |
| 5 to 9 Years | 135 (13.3%) | 62 (6.7%) |
| 10 to 14 Years | 110 (10.8%) | 83 (8.9%) |
| 15 to 19 Years | 60 (5.9%) | 51 (5.5%) |
| 20 to 24 Years | 52 (5.1%) | 40 (4.3%) |
| 25 to 29 Years | 44 (4.3%) | 68 (7.3%) |
| 30 to 34 Years | 131 (12.9%) | 149 (16.0%) |
| 35 to 39 Years | 49 (4.8%) | 41 (4.4%) |
| 40 to 44 Years | 46 (4.5%) | 80 (8.6%) |
| 45 to 49 Years | 62 (6.1%) | 74 (7.9%) |
| 50 to 54 Years | 62 (6.1%) | 45 (4.8%) |
| 55 to 59 Years | 40 (3.9%) | 46 (4.9%) |
| 60 to 64 Years | 42 (4.1%) | 40 (4.3%) |
| 65 to 69 Years | 15 (1.5%) | 26 (2.8%) |
| 70 to 74 Years | 18 (1.8%) | 23 (2.5%) |
| 75 to 79 Years | 12 (1.2%) | 21 (2.2%) |
| 80 to 84 Years | 10 (1.0%) | 16 (1.7%) |
| 85 Years and over | 21 (2.1%) | 31 (3.3%) |
| Total | 1,017 (100.0%) | 933 (100.0%) |
Families and Households in Roseto borough
Median Family Size in Roseto borough
The median family size in Roseto borough is 3.25 persons per family, with single male/father families (21 | 4.0%) accounting for the largest median family size of 3.29 persons per family. On the other hand, single female/mother families (97 | 18.4%) represent the smallest median family size with 3.23 persons per family.
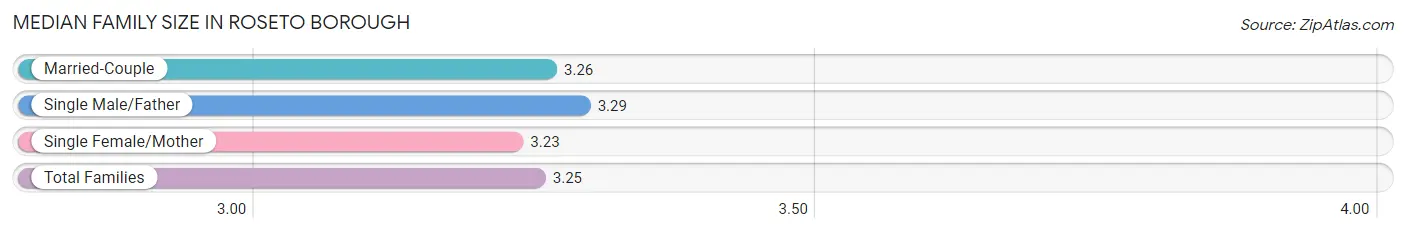
| Family Type | # Families | Family Size |
| Married-Couple | 410 (77.6%) | 3.26 |
| Single Male/Father | 21 (4.0%) | 3.29 |
| Single Female/Mother | 97 (18.4%) | 3.23 |
| Total Families | 528 (100.0%) | 3.25 |
Median Household Size in Roseto borough
The median household size in Roseto borough is 2.95 persons per household, with single male/father households (21 | 3.2%) accounting for the largest median household size of 4.29 persons per household. non-family households (132 | 20.0%) represent the smallest median household size with 1.30 persons per household.
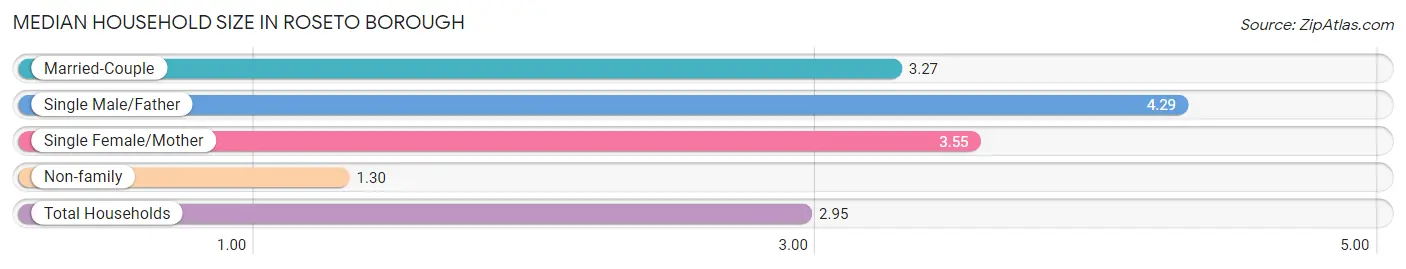
| Household Type | # Households | Household Size |
| Married-Couple | 410 (62.1%) | 3.27 |
| Single Male/Father | 21 (3.2%) | 4.29 |
| Single Female/Mother | 97 (14.7%) | 3.55 |
| Non-family | 132 (20.0%) | 1.30 |
| Total Households | 660 (100.0%) | 2.95 |
Household Size by Marriage Status in Roseto borough
Out of a total of 660 households in Roseto borough, 528 (80.0%) are family households, while 132 (20.0%) are nonfamily households. The most numerous type of family households are 2-person households, comprising 173, and the most common type of nonfamily households are 1-person households, comprising 102.
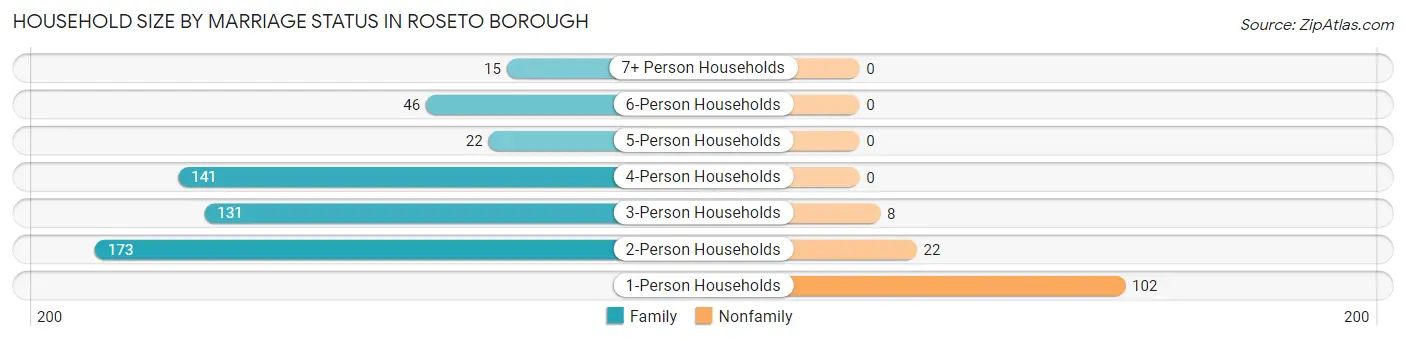
| Household Size | Family Households | Nonfamily Households |
| 1-Person Households | - | 102 (15.4%) |
| 2-Person Households | 173 (26.2%) | 22 (3.3%) |
| 3-Person Households | 131 (19.9%) | 8 (1.2%) |
| 4-Person Households | 141 (21.4%) | 0 (0.0%) |
| 5-Person Households | 22 (3.3%) | 0 (0.0%) |
| 6-Person Households | 46 (7.0%) | 0 (0.0%) |
| 7+ Person Households | 15 (2.3%) | 0 (0.0%) |
| Total | 528 (80.0%) | 132 (20.0%) |
Female Fertility in Roseto borough
Fertility by Age in Roseto borough
Average fertility rate in Roseto borough is 33.0 births per 1,000 women. Women in the age bracket of 20 to 34 years have the highest fertility rate with 66.0 births per 1,000 women. Women in the age bracket of 20 to 34 years acount for 100.0% of all women with births.
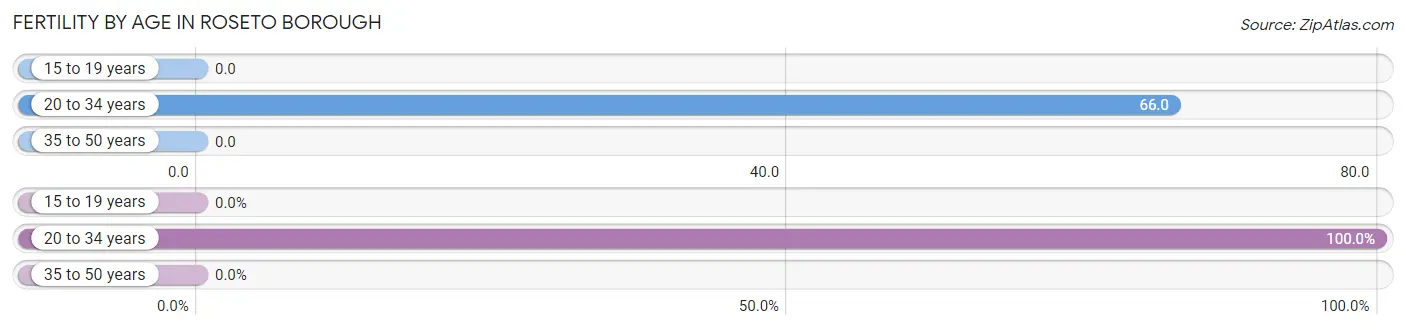
| Age Bracket | Women with Births | Births / 1,000 Women |
| 15 to 19 years | 0 (0.0%) | 0.0 |
| 20 to 34 years | 17 (100.0%) | 66.0 |
| 35 to 50 years | 0 (0.0%) | 0.0 |
| Total | 17 (100.0%) | 33.0 |
Fertility by Age by Marriage Status in Roseto borough
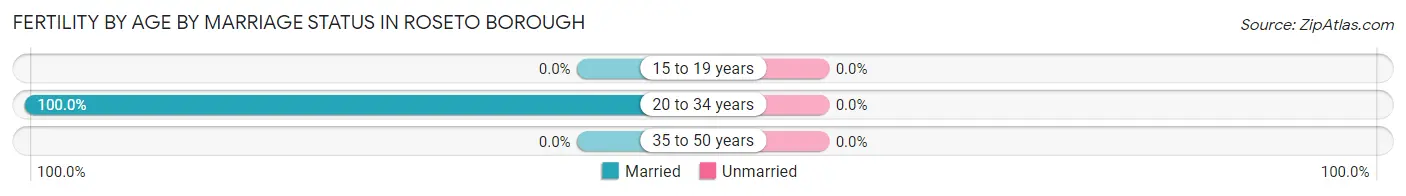
| Age Bracket | Married | Unmarried |
| 15 to 19 years | 0 (0.0%) | 0 (0.0%) |
| 20 to 34 years | 17 (100.0%) | 0 (0.0%) |
| 35 to 50 years | 0 (0.0%) | 0 (0.0%) |
| Total | 17 (100.0%) | 0 (0.0%) |
Fertility by Education in Roseto borough
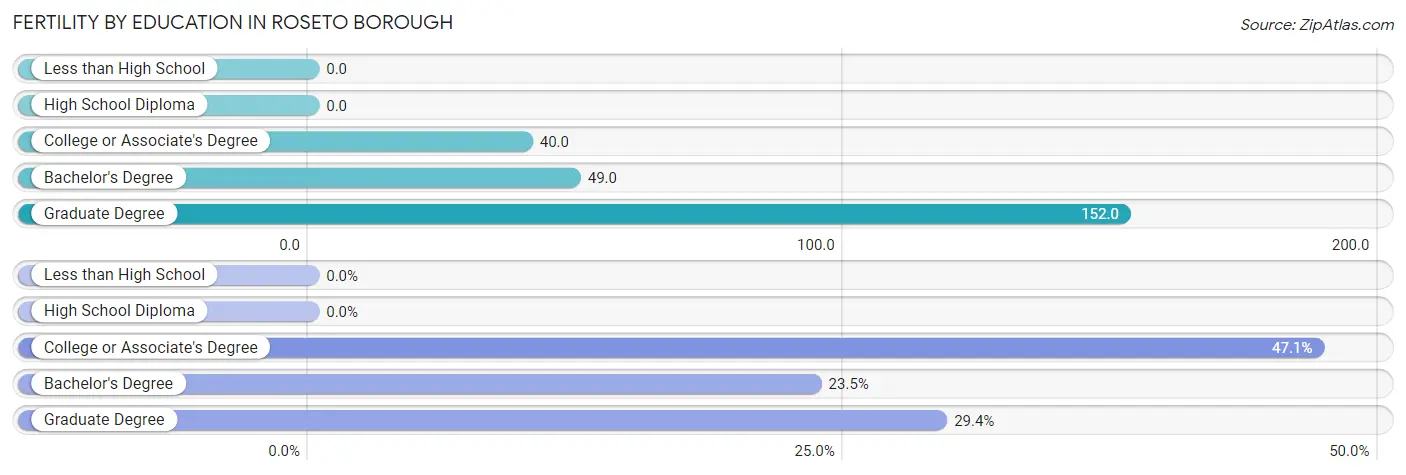
| Educational Attainment | Women with Births | Births / 1,000 Women |
| Less than High School | 0 (0.0%) | 0.0 |
| High School Diploma | 0 (0.0%) | 0.0 |
| College or Associate's Degree | 8 (47.1%) | 40.0 |
| Bachelor's Degree | 4 (23.5%) | 49.0 |
| Graduate Degree | 5 (29.4%) | 152.0 |
| Total | 17 (100.0%) | 33.0 |
Fertility by Education by Marriage Status in Roseto borough
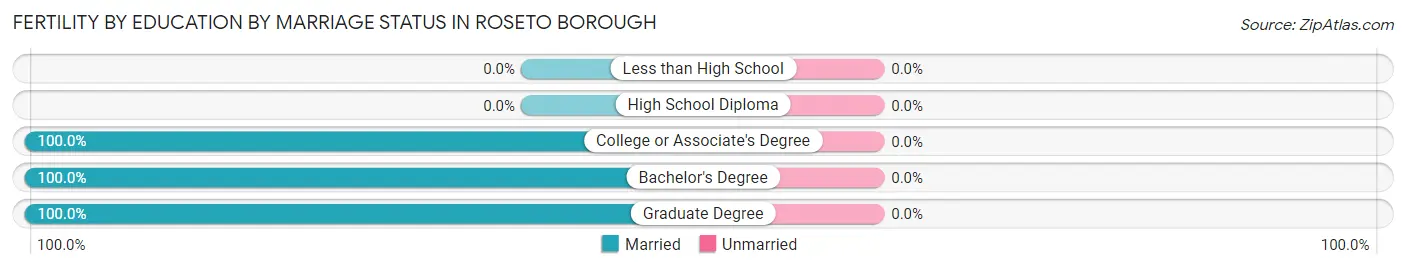
| Educational Attainment | Married | Unmarried |
| Less than High School | 0 (0.0%) | 0 (0.0%) |
| High School Diploma | 0 (0.0%) | 0 (0.0%) |
| College or Associate's Degree | 8 (100.0%) | 0 (0.0%) |
| Bachelor's Degree | 4 (100.0%) | 0 (0.0%) |
| Graduate Degree | 5 (100.0%) | 0 (0.0%) |
| Total | 17 (100.0%) | 0 (0.0%) |
Employment Characteristics in Roseto borough
Employment by Class of Employer in Roseto borough
Among the 964 employed individuals in Roseto borough, private company employees (645 | 66.9%), local government employees (90 | 9.3%), and not-for-profit organizations (76 | 7.9%) make up the most common classes of employment.
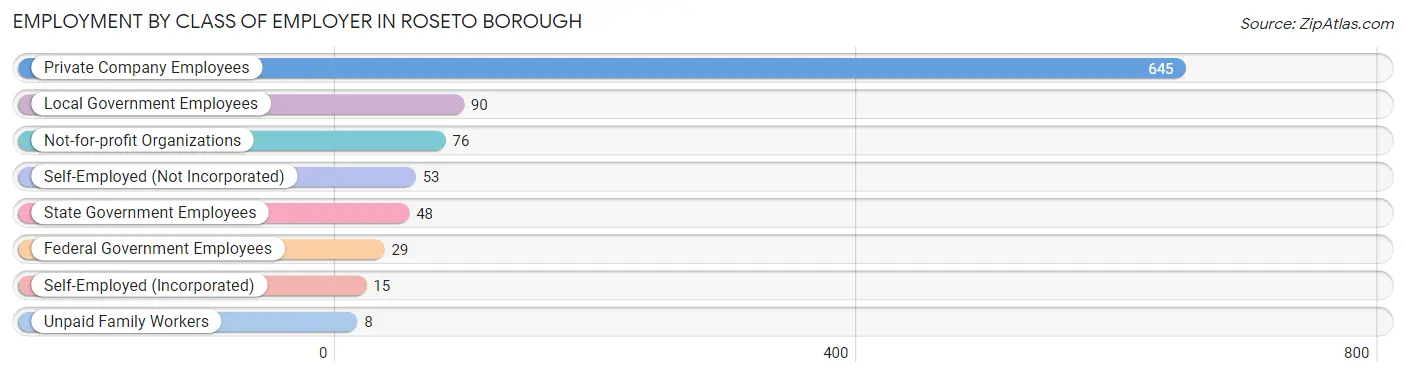
| Employer Class | # Employees | % Employees |
| Private Company Employees | 645 | 66.9% |
| Self-Employed (Incorporated) | 15 | 1.6% |
| Self-Employed (Not Incorporated) | 53 | 5.5% |
| Not-for-profit Organizations | 76 | 7.9% |
| Local Government Employees | 90 | 9.3% |
| State Government Employees | 48 | 5.0% |
| Federal Government Employees | 29 | 3.0% |
| Unpaid Family Workers | 8 | 0.8% |
| Total | 964 | 100.0% |
Employment Status by Age in Roseto borough
According to the labor force statistics for Roseto borough, out of the total population over 16 years of age (1,386), 74.5% or 1,033 individuals are in the labor force, with 6.7% or 69 of them unemployed. The age group with the highest labor force participation rate is 25 to 29 years, with 100.0% or 112 individuals in the labor force. Within the labor force, the 16 to 19 years age range has the highest percentage of unemployed individuals, with 36.1% or 13 of them being unemployed.
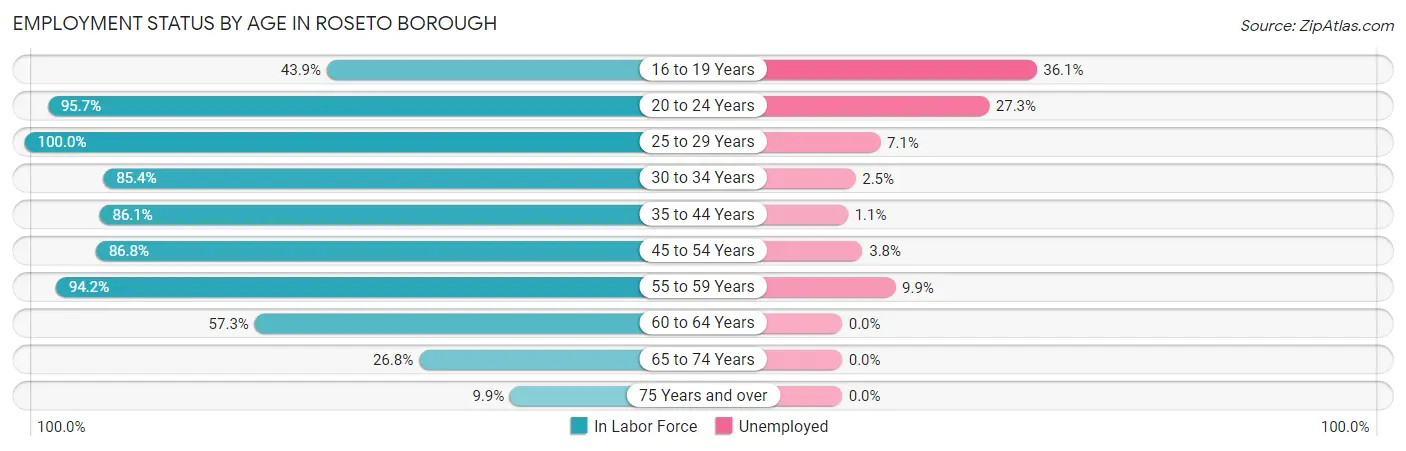
| Age Bracket | In Labor Force | Unemployed |
| 16 to 19 Years | 36 (43.9%) | 13 (36.1%) |
| 20 to 24 Years | 88 (95.7%) | 24 (27.3%) |
| 25 to 29 Years | 112 (100.0%) | 8 (7.1%) |
| 30 to 34 Years | 239 (85.4%) | 6 (2.5%) |
| 35 to 44 Years | 186 (86.1%) | 2 (1.1%) |
| 45 to 54 Years | 211 (86.8%) | 8 (3.8%) |
| 55 to 59 Years | 81 (94.2%) | 8 (9.9%) |
| 60 to 64 Years | 47 (57.3%) | 0 (0.0%) |
| 65 to 74 Years | 22 (26.8%) | 0 (0.0%) |
| 75 Years and over | 11 (9.9%) | 0 (0.0%) |
| Total | 1,033 (74.5%) | 69 (6.7%) |
Employment Status by Educational Attainment in Roseto borough
According to labor force statistics for Roseto borough, 86.0% of individuals (876) out of the total population between 25 and 64 years of age (1,019) are in the labor force, with 3.7% or 32 of them being unemployed. The group with the highest labor force participation rate are those with the educational attainment of bachelor's degree or higher, with 96.3% or 232 individuals in the labor force. Within the labor force, individuals with high school diploma education have the highest percentage of unemployment, with 6.9% or 22 of them being unemployed.
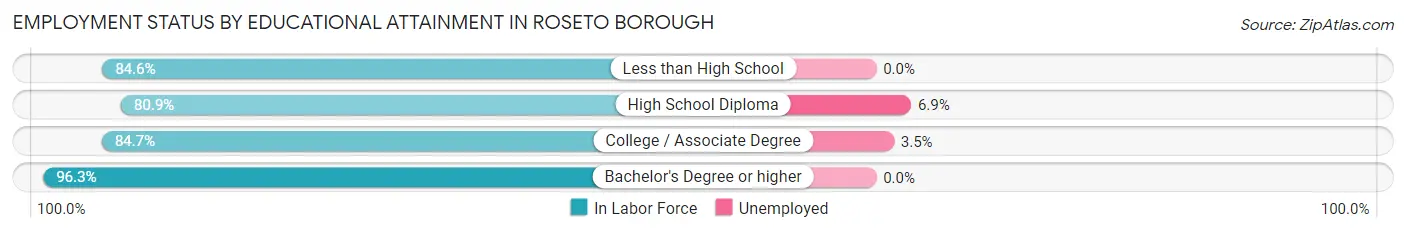
| Educational Attainment | In Labor Force | Unemployed |
| Less than High School | 44 (84.6%) | 0 (0.0%) |
| High School Diploma | 318 (80.9%) | 27 (6.9%) |
| College / Associate Degree | 282 (84.7%) | 12 (3.5%) |
| Bachelor's Degree or higher | 232 (96.3%) | 0 (0.0%) |
| Total | 876 (86.0%) | 38 (3.7%) |
Employment Occupations by Sex in Roseto borough
Management, Business, Science and Arts Occupations
The most common Management, Business, Science and Arts occupations in Roseto borough are Community & Social Service (82 | 8.5%), Health Diagnosing & Treating (71 | 7.4%), Management (68 | 7.0%), Health Technologists (40 | 4.2%), and Education Instruction & Library (28 | 2.9%).
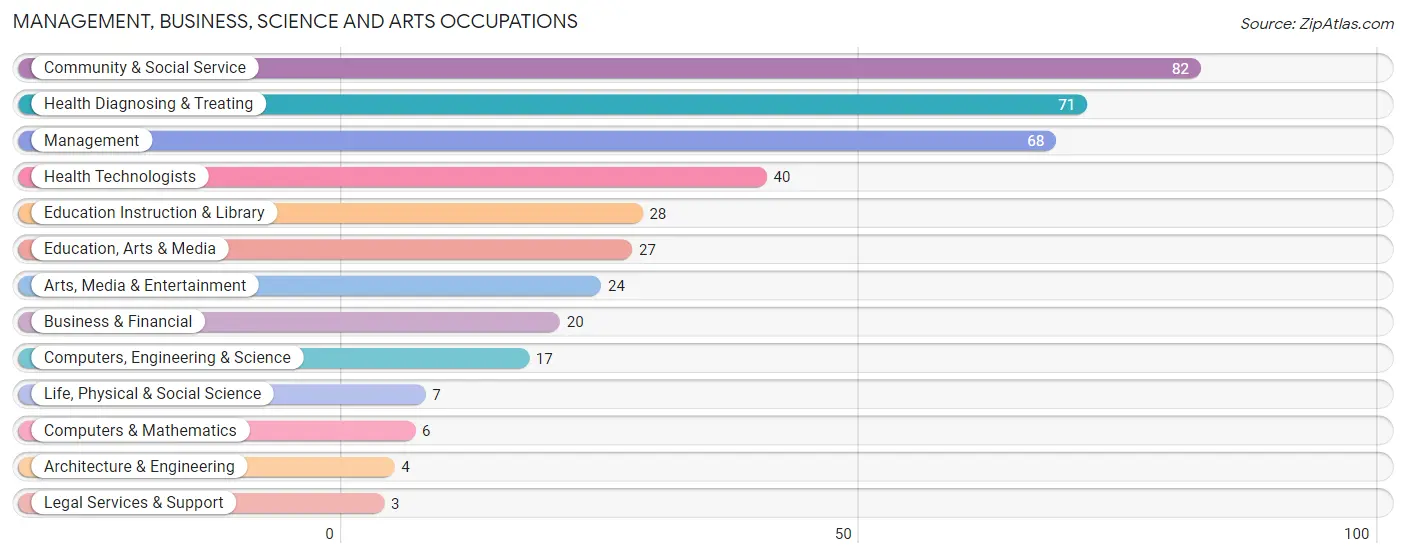
Management, Business, Science and Arts Occupations by Sex
Within the Management, Business, Science and Arts occupations in Roseto borough, the most male-oriented occupations are Architecture & Engineering (100.0%), Computers & Mathematics (66.7%), and Computers, Engineering & Science (58.8%), while the most female-oriented occupations are Legal Services & Support (100.0%), Health Technologists (87.5%), and Health Diagnosing & Treating (83.1%).
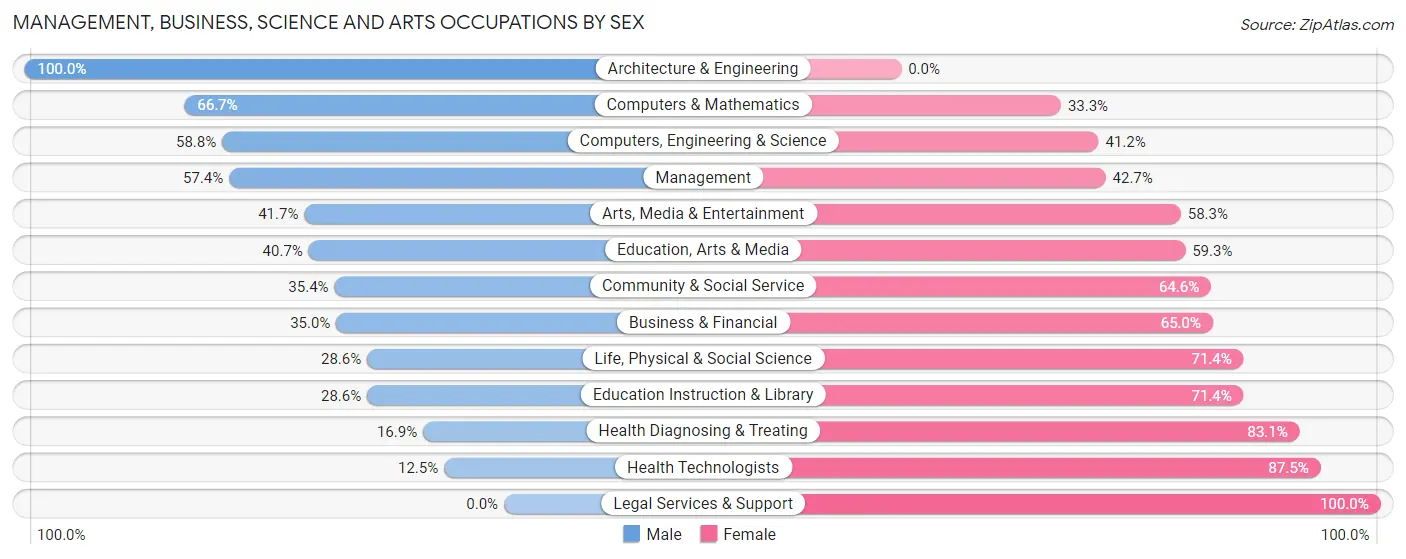
| Occupation | Male | Female |
| Management | 39 (57.4%) | 29 (42.6%) |
| Business & Financial | 7 (35.0%) | 13 (65.0%) |
| Computers, Engineering & Science | 10 (58.8%) | 7 (41.2%) |
| Computers & Mathematics | 4 (66.7%) | 2 (33.3%) |
| Architecture & Engineering | 4 (100.0%) | 0 (0.0%) |
| Life, Physical & Social Science | 2 (28.6%) | 5 (71.4%) |
| Community & Social Service | 29 (35.4%) | 53 (64.6%) |
| Education, Arts & Media | 11 (40.7%) | 16 (59.3%) |
| Legal Services & Support | 0 (0.0%) | 3 (100.0%) |
| Education Instruction & Library | 8 (28.6%) | 20 (71.4%) |
| Arts, Media & Entertainment | 10 (41.7%) | 14 (58.3%) |
| Health Diagnosing & Treating | 12 (16.9%) | 59 (83.1%) |
| Health Technologists | 5 (12.5%) | 35 (87.5%) |
| Total (Category) | 97 (37.6%) | 161 (62.4%) |
| Total (Overall) | 454 (47.1%) | 510 (52.9%) |
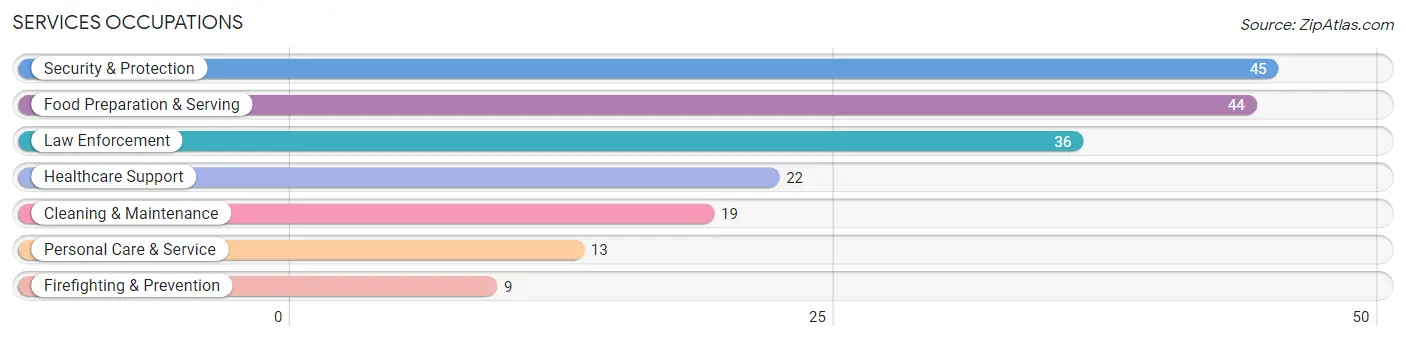
Services Occupations
The most common Services occupations in Roseto borough are Security & Protection (45 | 4.7%), Food Preparation & Serving (44 | 4.6%), Law Enforcement (36 | 3.7%), Healthcare Support (22 | 2.3%), and Cleaning & Maintenance (19 | 2.0%).
Services Occupations by Sex
Within the Services occupations in Roseto borough, the most male-oriented occupations are Security & Protection (100.0%), Firefighting & Prevention (100.0%), and Law Enforcement (100.0%), while the most female-oriented occupations are Healthcare Support (100.0%), Personal Care & Service (100.0%), and Cleaning & Maintenance (89.5%).
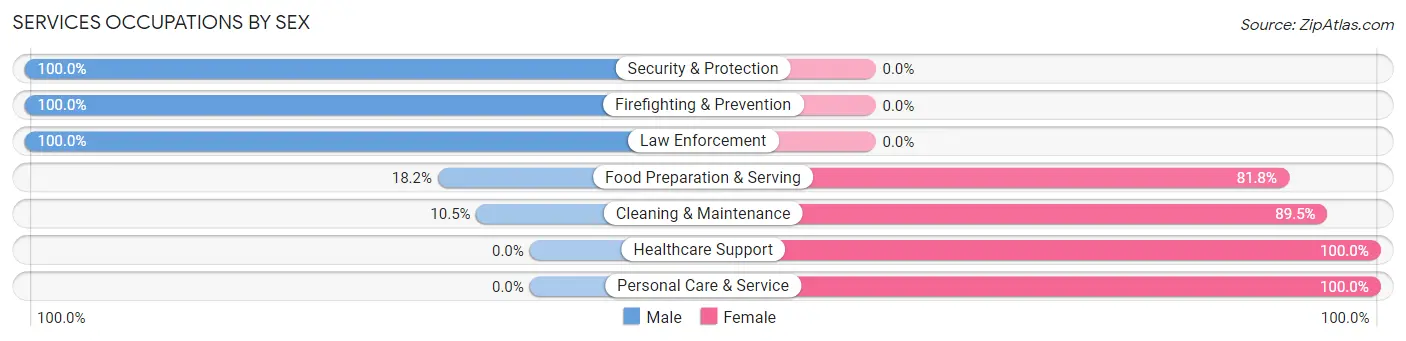
| Occupation | Male | Female |
| Healthcare Support | 0 (0.0%) | 22 (100.0%) |
| Security & Protection | 45 (100.0%) | 0 (0.0%) |
| Firefighting & Prevention | 9 (100.0%) | 0 (0.0%) |
| Law Enforcement | 36 (100.0%) | 0 (0.0%) |
| Food Preparation & Serving | 8 (18.2%) | 36 (81.8%) |
| Cleaning & Maintenance | 2 (10.5%) | 17 (89.5%) |
| Personal Care & Service | 0 (0.0%) | 13 (100.0%) |
| Total (Category) | 55 (38.5%) | 88 (61.5%) |
| Total (Overall) | 454 (47.1%) | 510 (52.9%) |
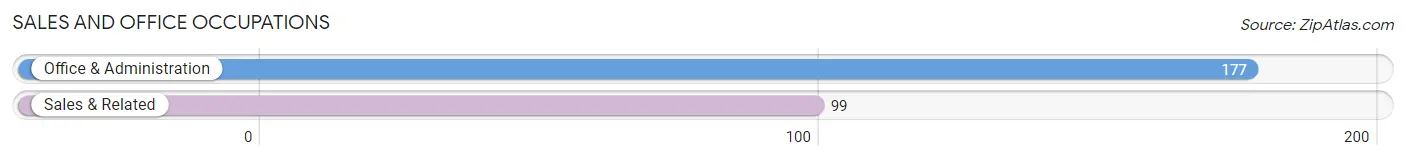
Sales and Office Occupations
The most common Sales and Office occupations in Roseto borough are Office & Administration (177 | 18.4%), and Sales & Related (99 | 10.3%).
Sales and Office Occupations by Sex
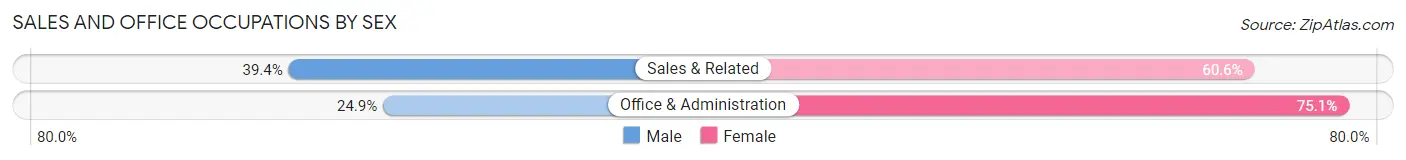
| Occupation | Male | Female |
| Sales & Related | 39 (39.4%) | 60 (60.6%) |
| Office & Administration | 44 (24.9%) | 133 (75.1%) |
| Total (Category) | 83 (30.1%) | 193 (69.9%) |
| Total (Overall) | 454 (47.1%) | 510 (52.9%) |
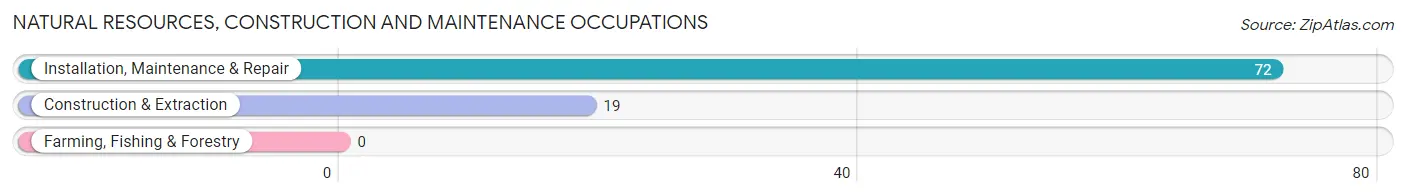
Natural Resources, Construction and Maintenance Occupations
The most common Natural Resources, Construction and Maintenance occupations in Roseto borough are Installation, Maintenance & Repair (72 | 7.5%), and Construction & Extraction (19 | 2.0%).
Natural Resources, Construction and Maintenance Occupations by Sex
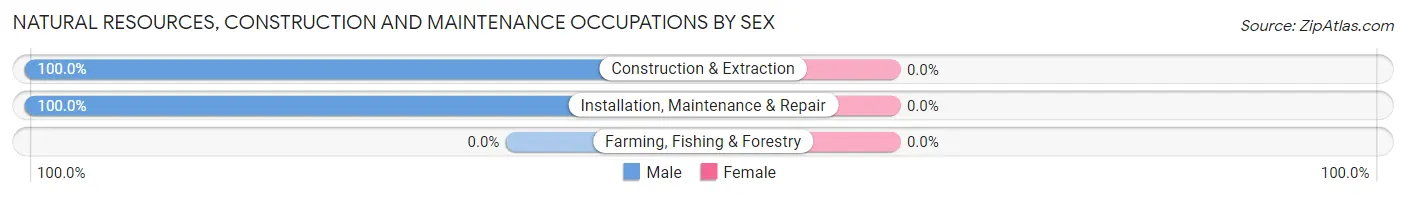
| Occupation | Male | Female |
| Farming, Fishing & Forestry | 0 (0.0%) | 0 (0.0%) |
| Construction & Extraction | 19 (100.0%) | 0 (0.0%) |
| Installation, Maintenance & Repair | 72 (100.0%) | 0 (0.0%) |
| Total (Category) | 91 (100.0%) | 0 (0.0%) |
| Total (Overall) | 454 (47.1%) | 510 (52.9%) |
Production, Transportation and Moving Occupations
The most common Production, Transportation and Moving occupations in Roseto borough are Production (105 | 10.9%), Transportation (51 | 5.3%), and Material Moving (40 | 4.2%).
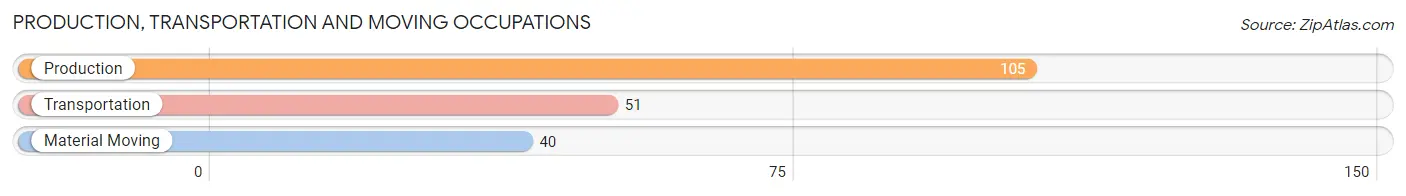
Production, Transportation and Moving Occupations by Sex
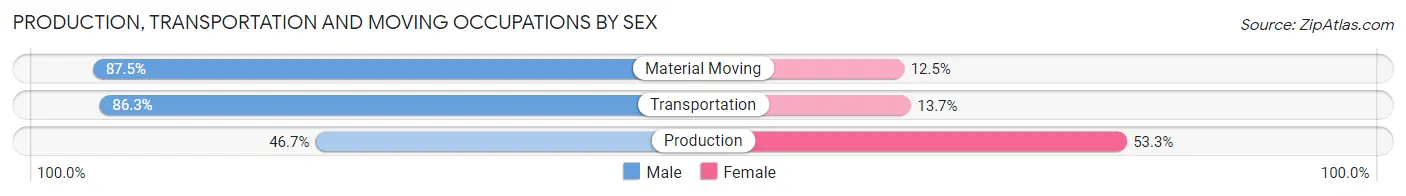
| Occupation | Male | Female |
| Production | 49 (46.7%) | 56 (53.3%) |
| Transportation | 44 (86.3%) | 7 (13.7%) |
| Material Moving | 35 (87.5%) | 5 (12.5%) |
| Total (Category) | 128 (65.3%) | 68 (34.7%) |
| Total (Overall) | 454 (47.1%) | 510 (52.9%) |
Employment Industries by Sex in Roseto borough
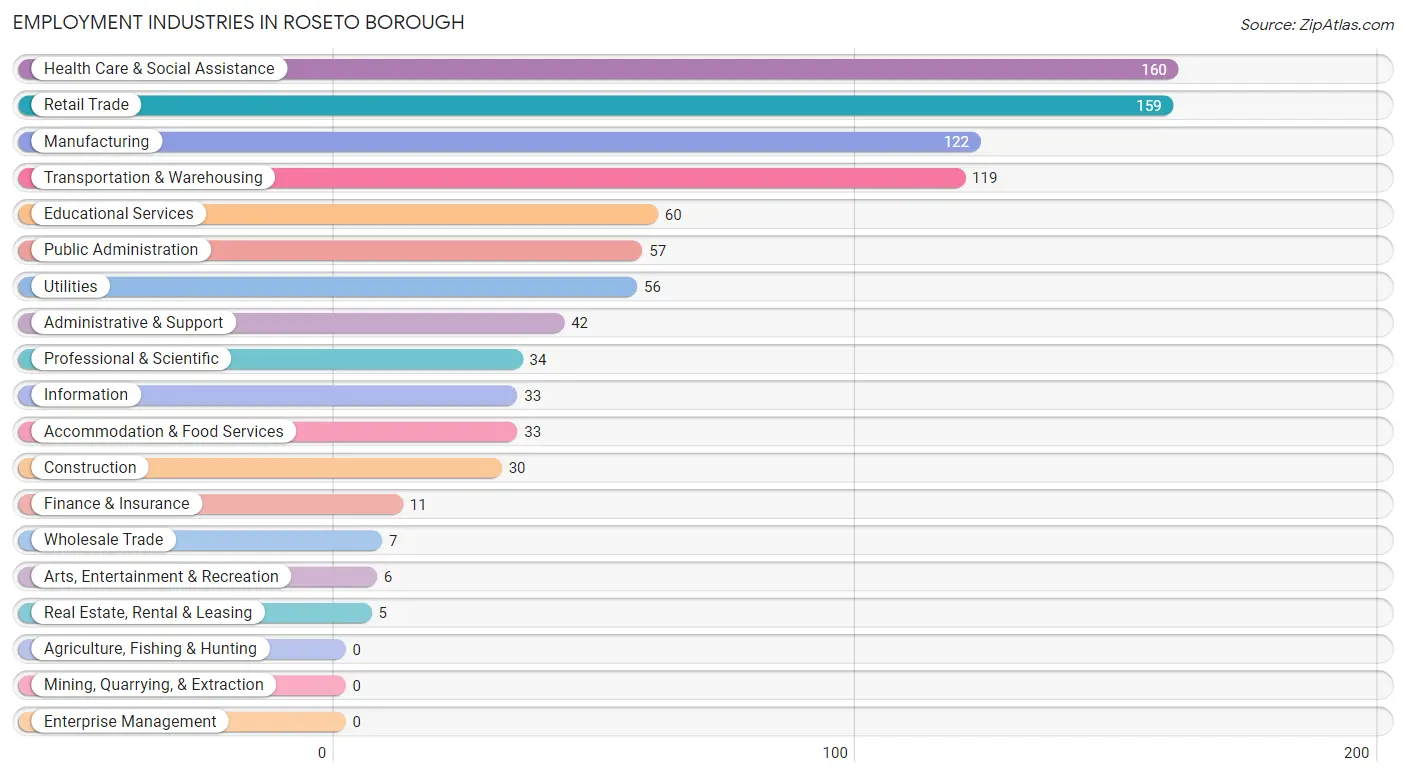
Employment Industries in Roseto borough
The major employment industries in Roseto borough include Health Care & Social Assistance (160 | 16.6%), Retail Trade (159 | 16.5%), Manufacturing (122 | 12.7%), Transportation & Warehousing (119 | 12.3%), and Educational Services (60 | 6.2%).
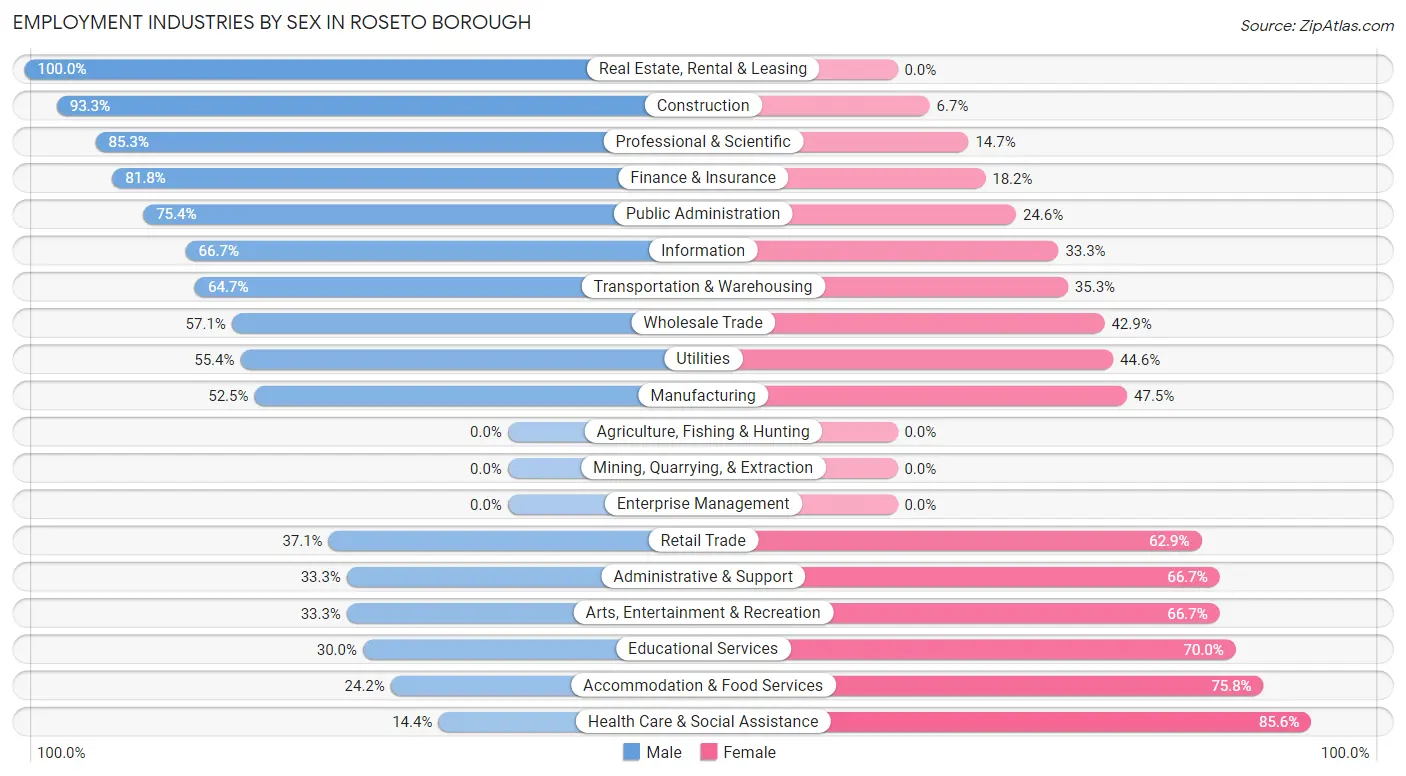
Employment Industries by Sex in Roseto borough
The Roseto borough industries that see more men than women are Real Estate, Rental & Leasing (100.0%), Construction (93.3%), and Professional & Scientific (85.3%), whereas the industries that tend to have a higher number of women are Health Care & Social Assistance (85.6%), Accommodation & Food Services (75.8%), and Educational Services (70.0%).
| Industry | Male | Female |
| Agriculture, Fishing & Hunting | 0 (0.0%) | 0 (0.0%) |
| Mining, Quarrying, & Extraction | 0 (0.0%) | 0 (0.0%) |
| Construction | 28 (93.3%) | 2 (6.7%) |
| Manufacturing | 64 (52.5%) | 58 (47.5%) |
| Wholesale Trade | 4 (57.1%) | 3 (42.9%) |
| Retail Trade | 59 (37.1%) | 100 (62.9%) |
| Transportation & Warehousing | 77 (64.7%) | 42 (35.3%) |
| Utilities | 31 (55.4%) | 25 (44.6%) |
| Information | 22 (66.7%) | 11 (33.3%) |
| Finance & Insurance | 9 (81.8%) | 2 (18.2%) |
| Real Estate, Rental & Leasing | 5 (100.0%) | 0 (0.0%) |
| Professional & Scientific | 29 (85.3%) | 5 (14.7%) |
| Enterprise Management | 0 (0.0%) | 0 (0.0%) |
| Administrative & Support | 14 (33.3%) | 28 (66.7%) |
| Educational Services | 18 (30.0%) | 42 (70.0%) |
| Health Care & Social Assistance | 23 (14.4%) | 137 (85.6%) |
| Arts, Entertainment & Recreation | 2 (33.3%) | 4 (66.7%) |
| Accommodation & Food Services | 8 (24.2%) | 25 (75.8%) |
| Public Administration | 43 (75.4%) | 14 (24.6%) |
| Total | 454 (47.1%) | 510 (52.9%) |
Education in Roseto borough
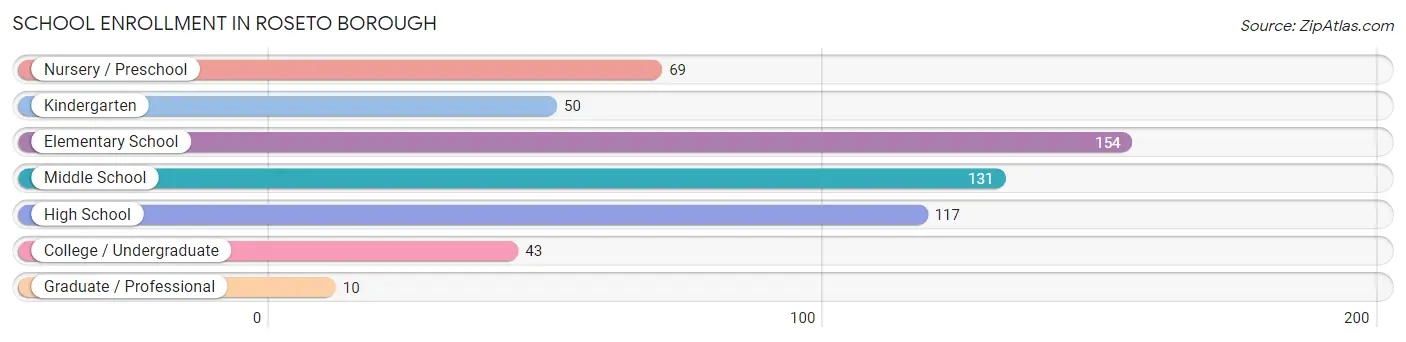
School Enrollment in Roseto borough
The most common levels of schooling among the 574 students in Roseto borough are elementary school (154 | 26.8%), middle school (131 | 22.8%), and high school (117 | 20.4%).
| School Level | # Students | % Students |
| Nursery / Preschool | 69 | 12.0% |
| Kindergarten | 50 | 8.7% |
| Elementary School | 154 | 26.8% |
| Middle School | 131 | 22.8% |
| High School | 117 | 20.4% |
| College / Undergraduate | 43 | 7.5% |
| Graduate / Professional | 10 | 1.7% |
| Total | 574 | 100.0% |
School Enrollment by Age by Funding Source in Roseto borough
Out of a total of 574 students who are enrolled in schools in Roseto borough, 68 (11.8%) attend a private institution, while the remaining 506 (88.2%) are enrolled in public schools. The age group of 35 years and over has the highest likelihood of being enrolled in private schools, with 13 (86.7% in the age bracket) enrolled. Conversely, the age group of 15 to 17 year olds has the lowest likelihood of being enrolled in a private school, with 85 (100.0% in the age bracket) attending a public institution.
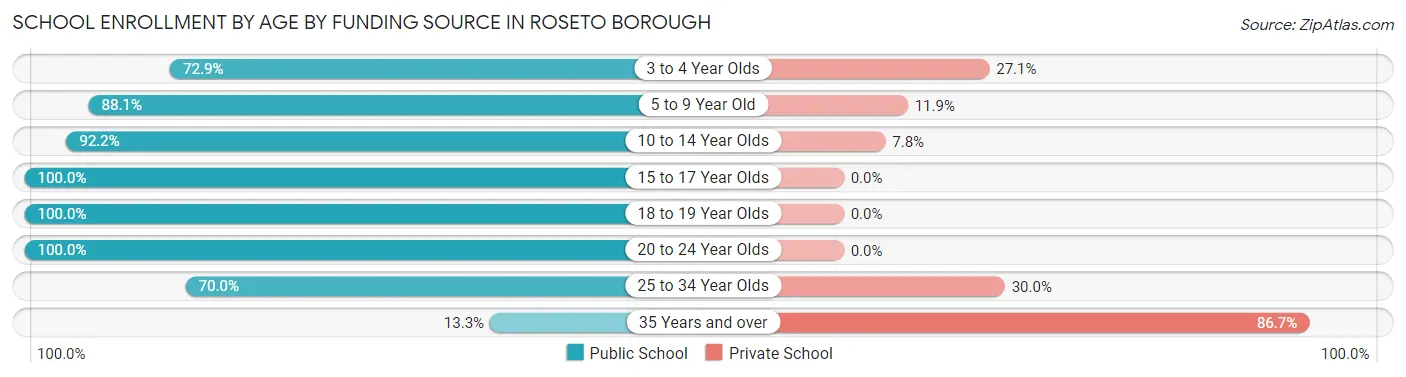
| Age Bracket | Public School | Private School |
| 3 to 4 Year Olds | 43 (72.9%) | 16 (27.1%) |
| 5 to 9 Year Old | 155 (88.1%) | 21 (11.9%) |
| 10 to 14 Year Olds | 178 (92.2%) | 15 (7.8%) |
| 15 to 17 Year Olds | 85 (100.0%) | 0 (0.0%) |
| 18 to 19 Year Olds | 6 (100.0%) | 0 (0.0%) |
| 20 to 24 Year Olds | 30 (100.0%) | 0 (0.0%) |
| 25 to 34 Year Olds | 7 (70.0%) | 3 (30.0%) |
| 35 Years and over | 2 (13.3%) | 13 (86.7%) |
| Total | 506 (88.2%) | 68 (11.8%) |
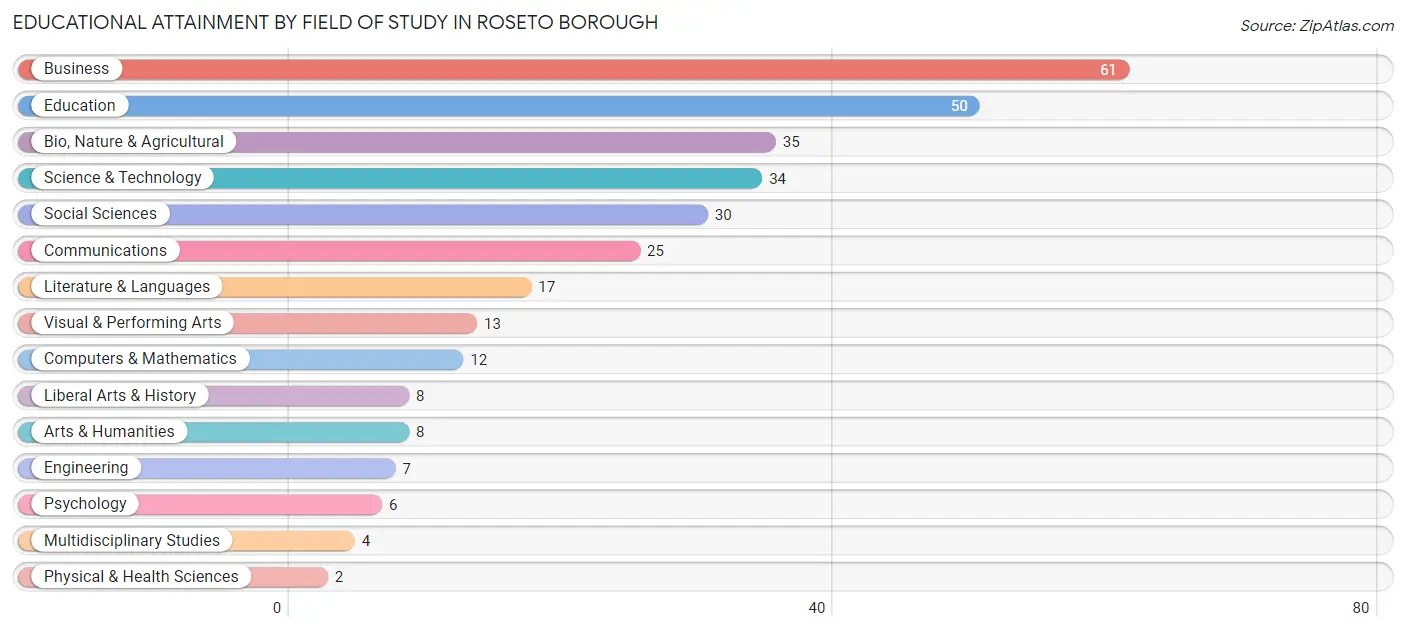
Educational Attainment by Field of Study in Roseto borough
Business (61 | 19.6%), education (50 | 16.0%), bio, nature & agricultural (35 | 11.2%), science & technology (34 | 10.9%), and social sciences (30 | 9.6%) are the most common fields of study among 312 individuals in Roseto borough who have obtained a bachelor's degree or higher.
| Field of Study | # Graduates | % Graduates |
| Computers & Mathematics | 12 | 3.8% |
| Bio, Nature & Agricultural | 35 | 11.2% |
| Physical & Health Sciences | 2 | 0.6% |
| Psychology | 6 | 1.9% |
| Social Sciences | 30 | 9.6% |
| Engineering | 7 | 2.2% |
| Multidisciplinary Studies | 4 | 1.3% |
| Science & Technology | 34 | 10.9% |
| Business | 61 | 19.6% |
| Education | 50 | 16.0% |
| Literature & Languages | 17 | 5.4% |
| Liberal Arts & History | 8 | 2.6% |
| Visual & Performing Arts | 13 | 4.2% |
| Communications | 25 | 8.0% |
| Arts & Humanities | 8 | 2.6% |
| Total | 312 | 100.0% |
Transportation & Commute in Roseto borough
Vehicle Availability by Sex in Roseto borough
The most prevalent vehicle ownership categories in Roseto borough are males with 2 vehicles (188, accounting for 41.4%) and females with 2 vehicles (228, making up 37.1%).
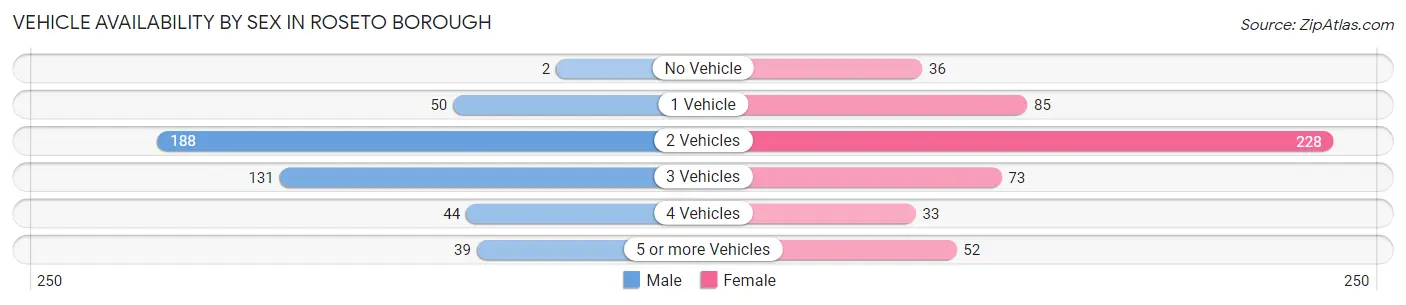
| Vehicles Available | Male | Female |
| No Vehicle | 2 (0.4%) | 36 (7.1%) |
| 1 Vehicle | 50 (11.0%) | 85 (16.8%) |
| 2 Vehicles | 188 (41.4%) | 228 (45.0%) |
| 3 Vehicles | 131 (28.8%) | 73 (14.4%) |
| 4 Vehicles | 44 (9.7%) | 33 (6.5%) |
| 5 or more Vehicles | 39 (8.6%) | 52 (10.3%) |
| Total | 454 (100.0%) | 507 (100.0%) |
Commute Time in Roseto borough
The most frequently occuring commute durations in Roseto borough are 30 to 34 minutes (152 commuters, 17.3%), 20 to 24 minutes (130 commuters, 14.8%), and 15 to 19 minutes (118 commuters, 13.4%).
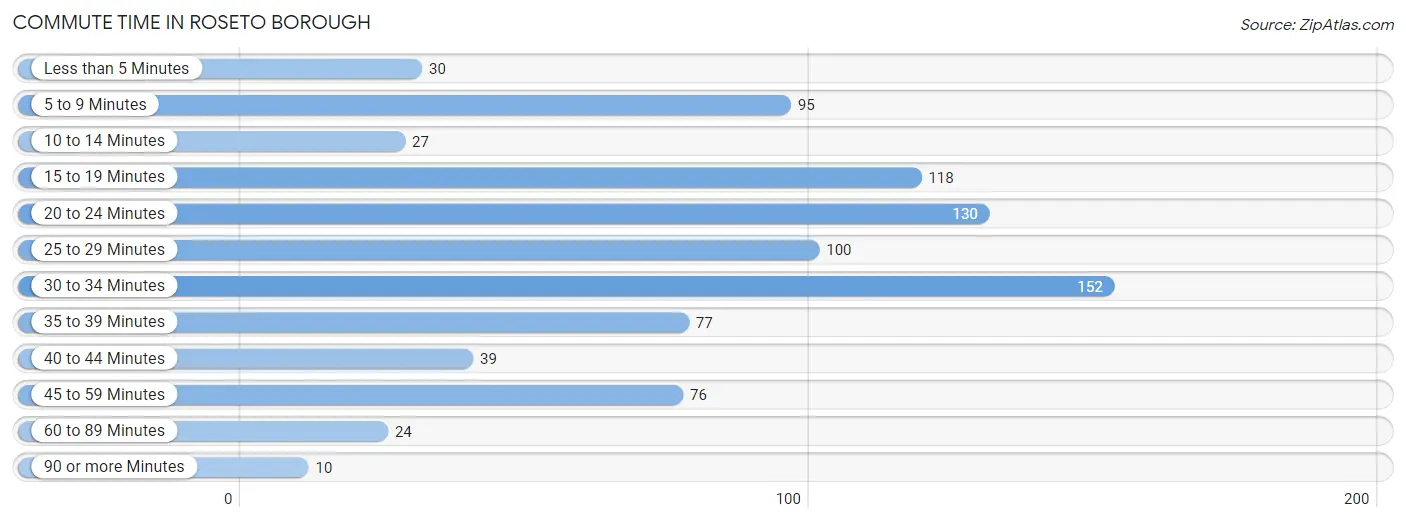
| Commute Time | # Commuters | % Commuters |
| Less than 5 Minutes | 30 | 3.4% |
| 5 to 9 Minutes | 95 | 10.8% |
| 10 to 14 Minutes | 27 | 3.1% |
| 15 to 19 Minutes | 118 | 13.4% |
| 20 to 24 Minutes | 130 | 14.8% |
| 25 to 29 Minutes | 100 | 11.4% |
| 30 to 34 Minutes | 152 | 17.3% |
| 35 to 39 Minutes | 77 | 8.8% |
| 40 to 44 Minutes | 39 | 4.4% |
| 45 to 59 Minutes | 76 | 8.7% |
| 60 to 89 Minutes | 24 | 2.7% |
| 90 or more Minutes | 10 | 1.1% |
Commute Time by Sex in Roseto borough
The most common commute times in Roseto borough are 30 to 34 minutes (101 commuters, 23.4%) for males and 15 to 19 minutes (74 commuters, 16.6%) for females.
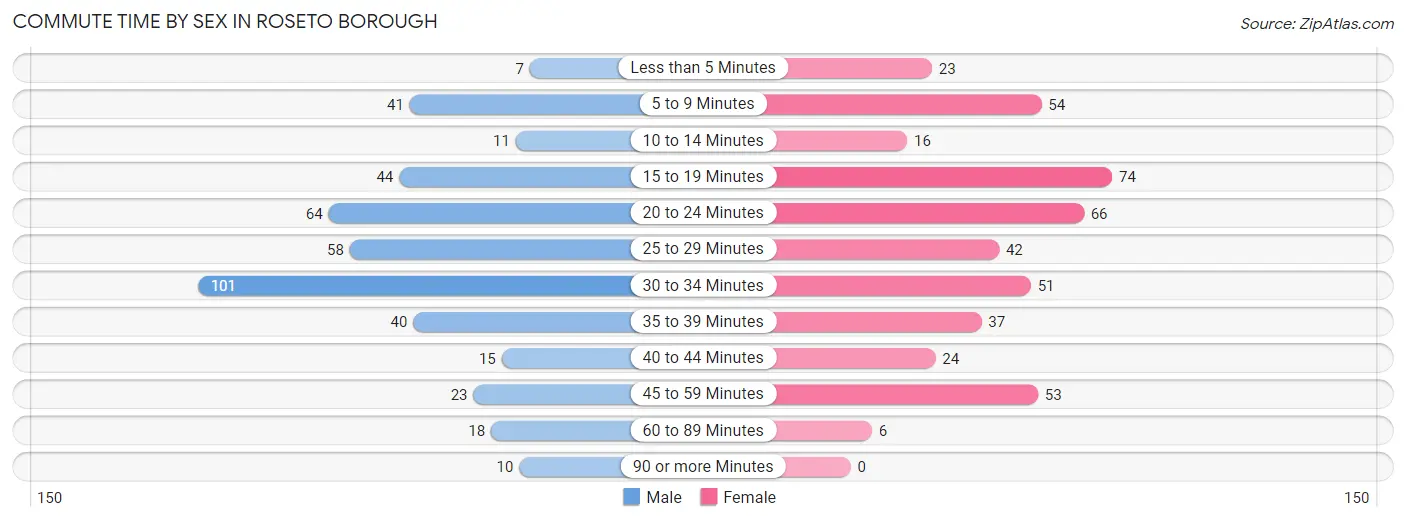
| Commute Time | Male | Female |
| Less than 5 Minutes | 7 (1.6%) | 23 (5.2%) |
| 5 to 9 Minutes | 41 (9.5%) | 54 (12.1%) |
| 10 to 14 Minutes | 11 (2.5%) | 16 (3.6%) |
| 15 to 19 Minutes | 44 (10.2%) | 74 (16.6%) |
| 20 to 24 Minutes | 64 (14.8%) | 66 (14.8%) |
| 25 to 29 Minutes | 58 (13.4%) | 42 (9.4%) |
| 30 to 34 Minutes | 101 (23.4%) | 51 (11.4%) |
| 35 to 39 Minutes | 40 (9.3%) | 37 (8.3%) |
| 40 to 44 Minutes | 15 (3.5%) | 24 (5.4%) |
| 45 to 59 Minutes | 23 (5.3%) | 53 (11.9%) |
| 60 to 89 Minutes | 18 (4.2%) | 6 (1.3%) |
| 90 or more Minutes | 10 (2.3%) | 0 (0.0%) |
Time of Departure to Work by Sex in Roseto borough
The most frequent times of departure to work in Roseto borough are 6:30 AM to 6:59 AM (84, 19.4%) for males and 6:30 AM to 6:59 AM (72, 16.1%) for females.
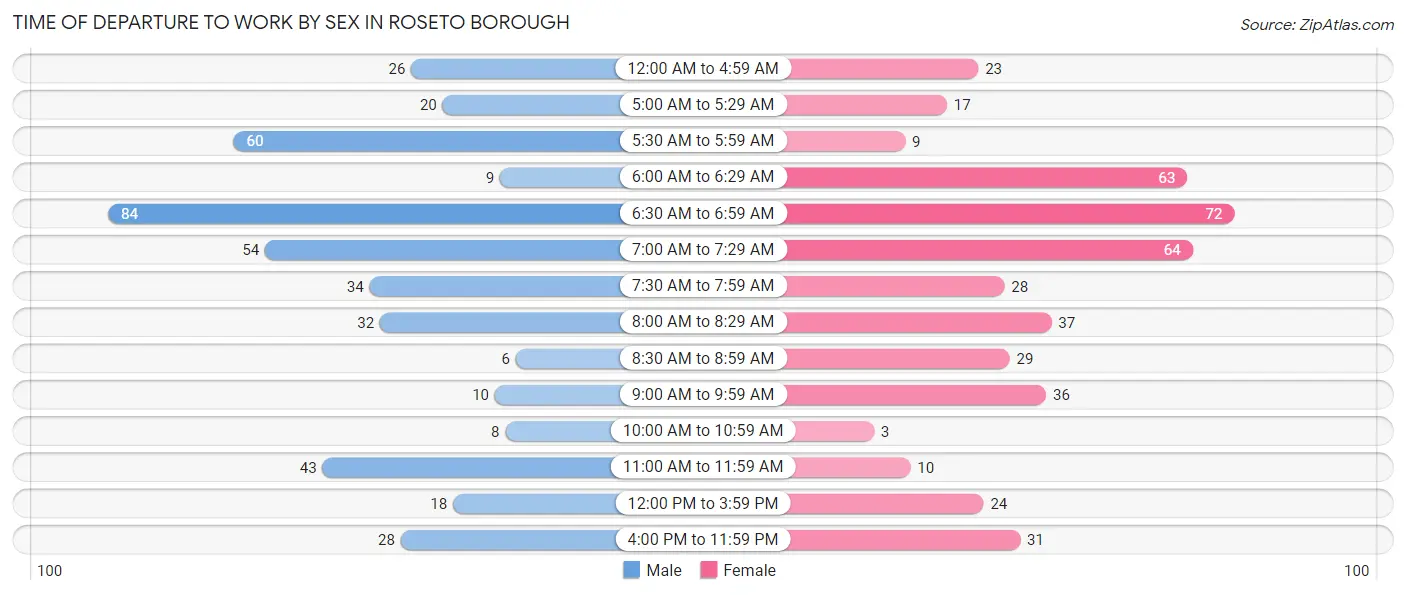
| Time of Departure | Male | Female |
| 12:00 AM to 4:59 AM | 26 (6.0%) | 23 (5.2%) |
| 5:00 AM to 5:29 AM | 20 (4.6%) | 17 (3.8%) |
| 5:30 AM to 5:59 AM | 60 (13.9%) | 9 (2.0%) |
| 6:00 AM to 6:29 AM | 9 (2.1%) | 63 (14.1%) |
| 6:30 AM to 6:59 AM | 84 (19.4%) | 72 (16.1%) |
| 7:00 AM to 7:29 AM | 54 (12.5%) | 64 (14.3%) |
| 7:30 AM to 7:59 AM | 34 (7.9%) | 28 (6.3%) |
| 8:00 AM to 8:29 AM | 32 (7.4%) | 37 (8.3%) |
| 8:30 AM to 8:59 AM | 6 (1.4%) | 29 (6.5%) |
| 9:00 AM to 9:59 AM | 10 (2.3%) | 36 (8.1%) |
| 10:00 AM to 10:59 AM | 8 (1.8%) | 3 (0.7%) |
| 11:00 AM to 11:59 AM | 43 (10.0%) | 10 (2.2%) |
| 12:00 PM to 3:59 PM | 18 (4.2%) | 24 (5.4%) |
| 4:00 PM to 11:59 PM | 28 (6.5%) | 31 (7.0%) |
| Total | 432 (100.0%) | 446 (100.0%) |
Housing Occupancy in Roseto borough
Occupancy by Ownership in Roseto borough
Of the total 660 dwellings in Roseto borough, owner-occupied units account for 475 (72.0%), while renter-occupied units make up 185 (28.0%).
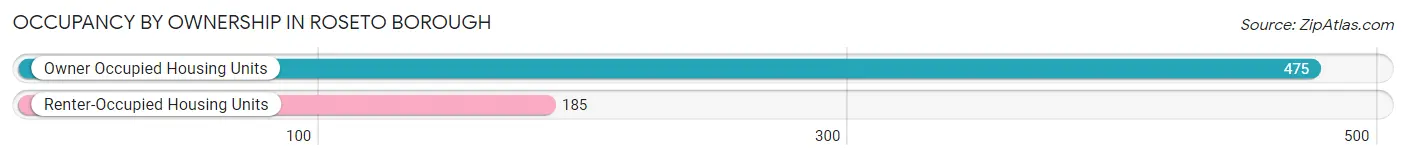
| Occupancy | # Housing Units | % Housing Units |
| Owner Occupied Housing Units | 475 | 72.0% |
| Renter-Occupied Housing Units | 185 | 28.0% |
| Total Occupied Housing Units | 660 | 100.0% |
Occupancy by Household Size in Roseto borough
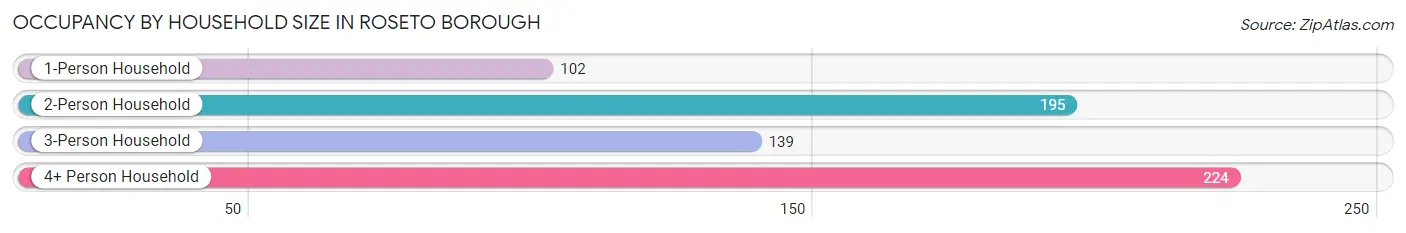
| Household Size | # Housing Units | % Housing Units |
| 1-Person Household | 102 | 15.4% |
| 2-Person Household | 195 | 29.5% |
| 3-Person Household | 139 | 21.1% |
| 4+ Person Household | 224 | 33.9% |
| Total Housing Units | 660 | 100.0% |
Occupancy by Ownership by Household Size in Roseto borough
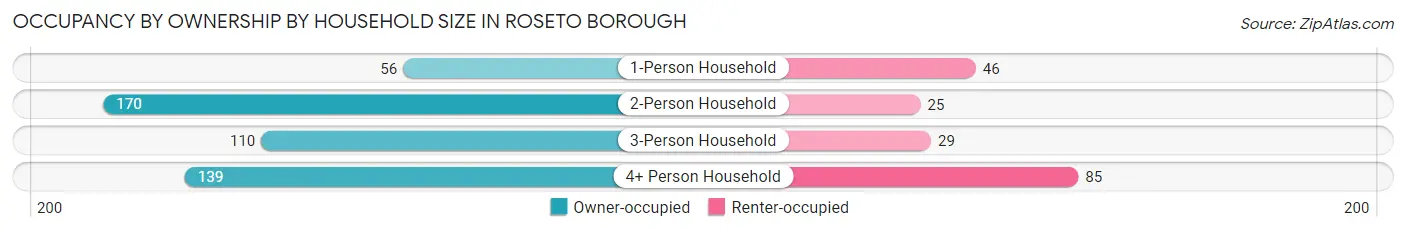
| Household Size | Owner-occupied | Renter-occupied |
| 1-Person Household | 56 (54.9%) | 46 (45.1%) |
| 2-Person Household | 170 (87.2%) | 25 (12.8%) |
| 3-Person Household | 110 (79.1%) | 29 (20.9%) |
| 4+ Person Household | 139 (62.1%) | 85 (38.0%) |
| Total Housing Units | 475 (72.0%) | 185 (28.0%) |
Occupancy by Educational Attainment in Roseto borough
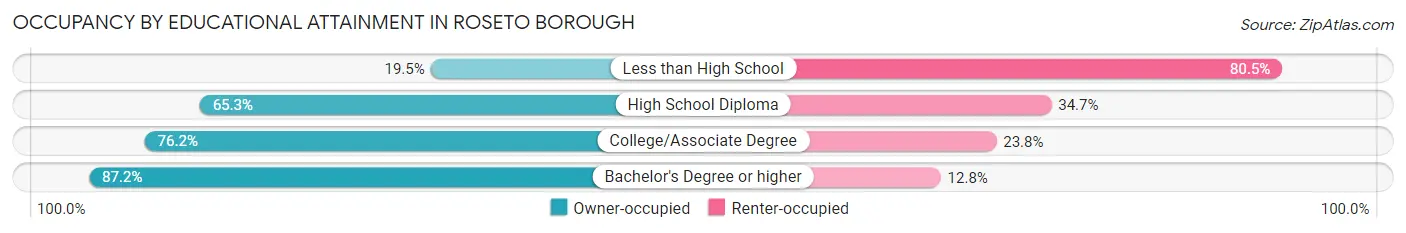
| Household Size | Owner-occupied | Renter-occupied |
| Less than High School | 8 (19.5%) | 33 (80.5%) |
| High School Diploma | 141 (65.3%) | 75 (34.7%) |
| College/Associate Degree | 176 (76.2%) | 55 (23.8%) |
| Bachelor's Degree or higher | 150 (87.2%) | 22 (12.8%) |
Occupancy by Age of Householder in Roseto borough
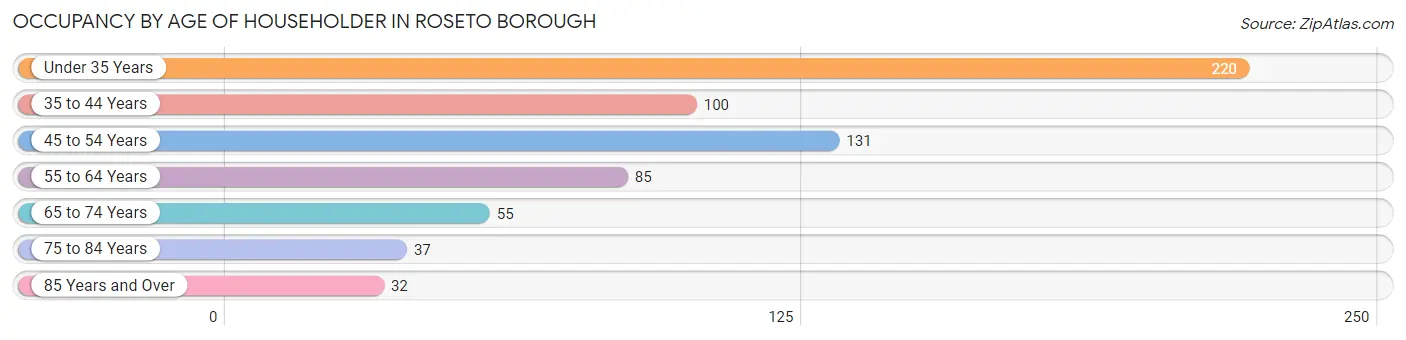
| Age Bracket | # Households | % Households |
| Under 35 Years | 220 | 33.3% |
| 35 to 44 Years | 100 | 15.1% |
| 45 to 54 Years | 131 | 19.9% |
| 55 to 64 Years | 85 | 12.9% |
| 65 to 74 Years | 55 | 8.3% |
| 75 to 84 Years | 37 | 5.6% |
| 85 Years and Over | 32 | 4.9% |
| Total | 660 | 100.0% |
Housing Finances in Roseto borough
Median Income by Occupancy in Roseto borough
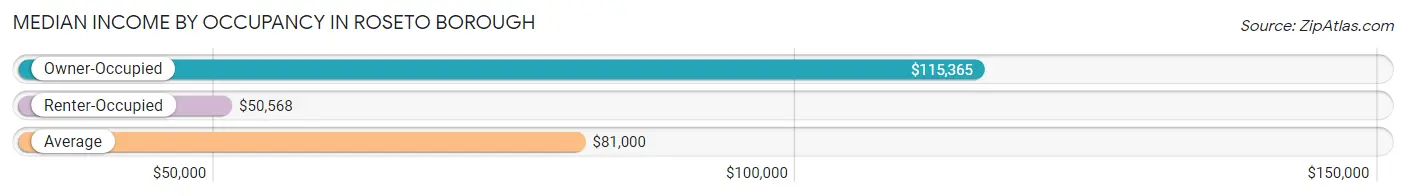
| Occupancy Type | # Households | Median Income |
| Owner-Occupied | 475 (72.0%) | $115,365 |
| Renter-Occupied | 185 (28.0%) | $50,568 |
| Average | 660 (100.0%) | $81,000 |
Occupancy by Householder Income Bracket in Roseto borough
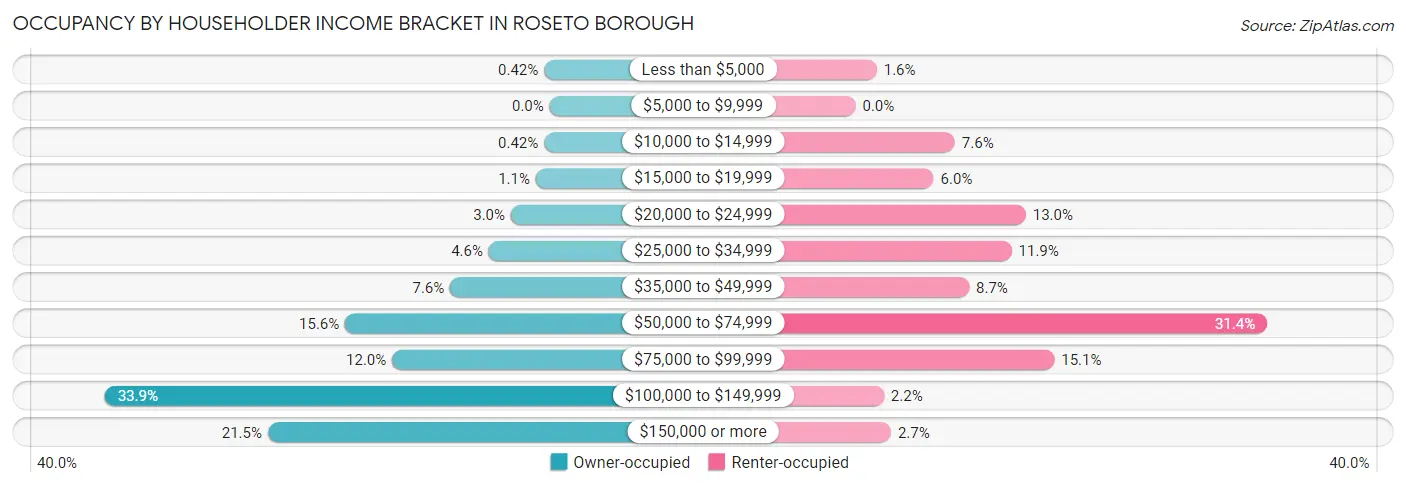
| Income Bracket | Owner-occupied | Renter-occupied |
| Less than $5,000 | 2 (0.4%) | 3 (1.6%) |
| $5,000 to $9,999 | 0 (0.0%) | 0 (0.0%) |
| $10,000 to $14,999 | 2 (0.4%) | 14 (7.6%) |
| $15,000 to $19,999 | 5 (1.1%) | 11 (5.9%) |
| $20,000 to $24,999 | 14 (2.9%) | 24 (13.0%) |
| $25,000 to $34,999 | 22 (4.6%) | 22 (11.9%) |
| $35,000 to $49,999 | 36 (7.6%) | 16 (8.6%) |
| $50,000 to $74,999 | 74 (15.6%) | 58 (31.4%) |
| $75,000 to $99,999 | 57 (12.0%) | 28 (15.1%) |
| $100,000 to $149,999 | 161 (33.9%) | 4 (2.2%) |
| $150,000 or more | 102 (21.5%) | 5 (2.7%) |
| Total | 475 (100.0%) | 185 (100.0%) |
Monthly Housing Cost Tiers in Roseto borough
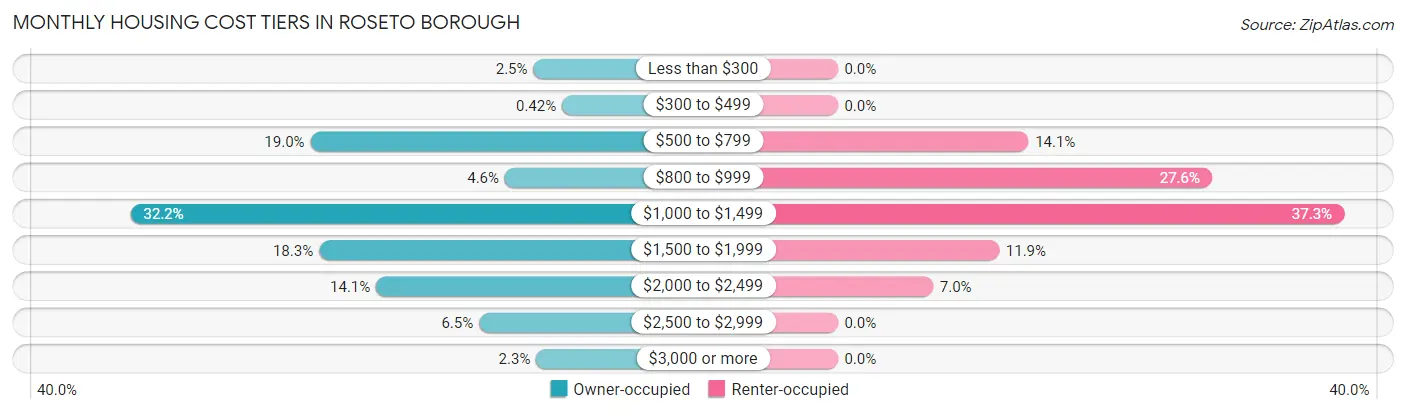
| Monthly Cost | Owner-occupied | Renter-occupied |
| Less than $300 | 12 (2.5%) | 0 (0.0%) |
| $300 to $499 | 2 (0.4%) | 0 (0.0%) |
| $500 to $799 | 90 (19.0%) | 26 (14.1%) |
| $800 to $999 | 22 (4.6%) | 51 (27.6%) |
| $1,000 to $1,499 | 153 (32.2%) | 69 (37.3%) |
| $1,500 to $1,999 | 87 (18.3%) | 22 (11.9%) |
| $2,000 to $2,499 | 67 (14.1%) | 13 (7.0%) |
| $2,500 to $2,999 | 31 (6.5%) | 0 (0.0%) |
| $3,000 or more | 11 (2.3%) | 0 (0.0%) |
| Total | 475 (100.0%) | 185 (100.0%) |
Physical Housing Characteristics in Roseto borough
Housing Structures in Roseto borough
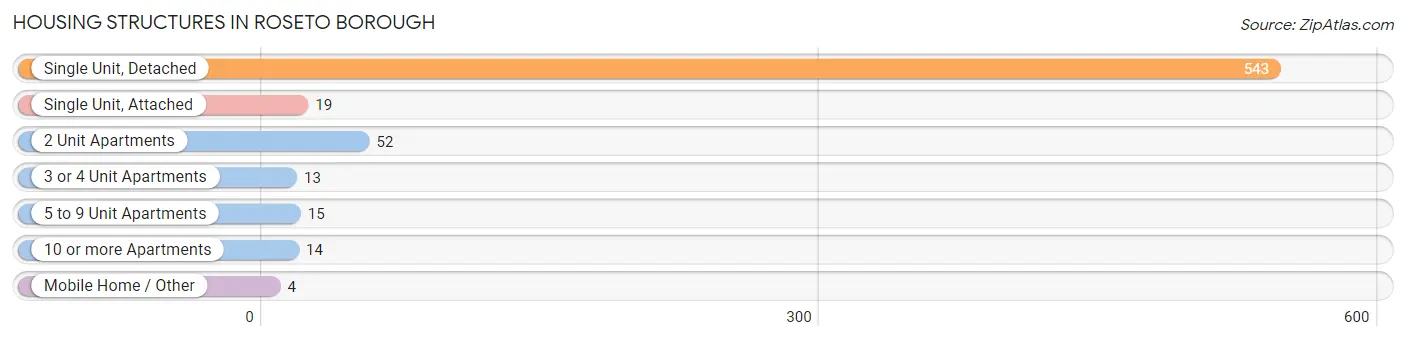
| Structure Type | # Housing Units | % Housing Units |
| Single Unit, Detached | 543 | 82.3% |
| Single Unit, Attached | 19 | 2.9% |
| 2 Unit Apartments | 52 | 7.9% |
| 3 or 4 Unit Apartments | 13 | 2.0% |
| 5 to 9 Unit Apartments | 15 | 2.3% |
| 10 or more Apartments | 14 | 2.1% |
| Mobile Home / Other | 4 | 0.6% |
| Total | 660 | 100.0% |
Housing Structures by Occupancy in Roseto borough
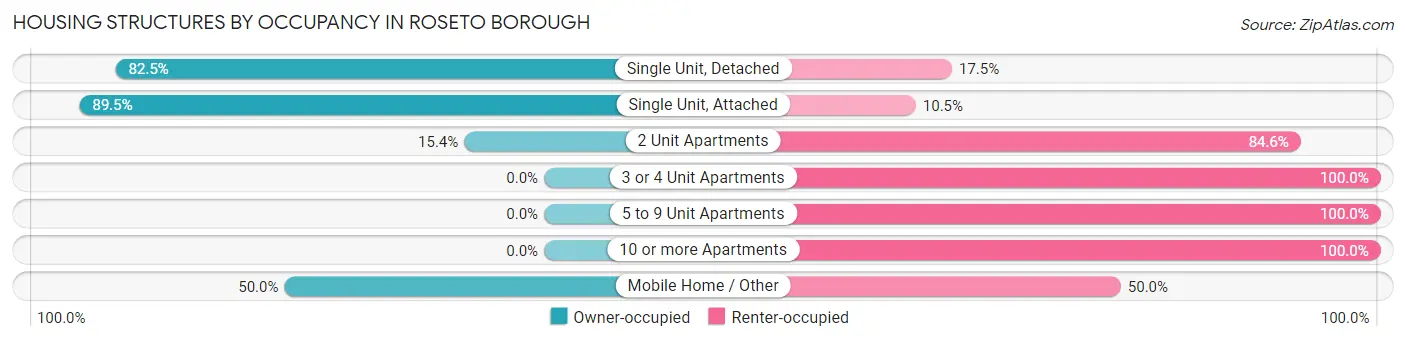
| Structure Type | Owner-occupied | Renter-occupied |
| Single Unit, Detached | 448 (82.5%) | 95 (17.5%) |
| Single Unit, Attached | 17 (89.5%) | 2 (10.5%) |
| 2 Unit Apartments | 8 (15.4%) | 44 (84.6%) |
| 3 or 4 Unit Apartments | 0 (0.0%) | 13 (100.0%) |
| 5 to 9 Unit Apartments | 0 (0.0%) | 15 (100.0%) |
| 10 or more Apartments | 0 (0.0%) | 14 (100.0%) |
| Mobile Home / Other | 2 (50.0%) | 2 (50.0%) |
| Total | 475 (72.0%) | 185 (28.0%) |
Housing Structures by Number of Rooms in Roseto borough
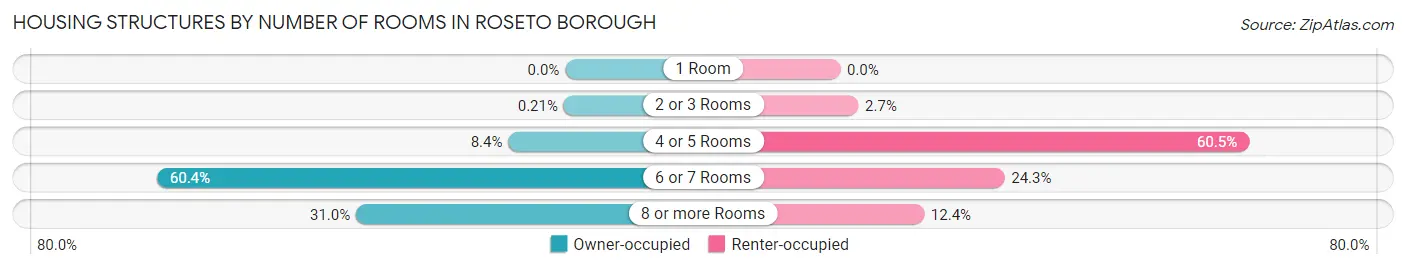
| Number of Rooms | Owner-occupied | Renter-occupied |
| 1 Room | 0 (0.0%) | 0 (0.0%) |
| 2 or 3 Rooms | 1 (0.2%) | 5 (2.7%) |
| 4 or 5 Rooms | 40 (8.4%) | 112 (60.5%) |
| 6 or 7 Rooms | 287 (60.4%) | 45 (24.3%) |
| 8 or more Rooms | 147 (30.9%) | 23 (12.4%) |
| Total | 475 (100.0%) | 185 (100.0%) |
Housing Structure by Heating Type in Roseto borough
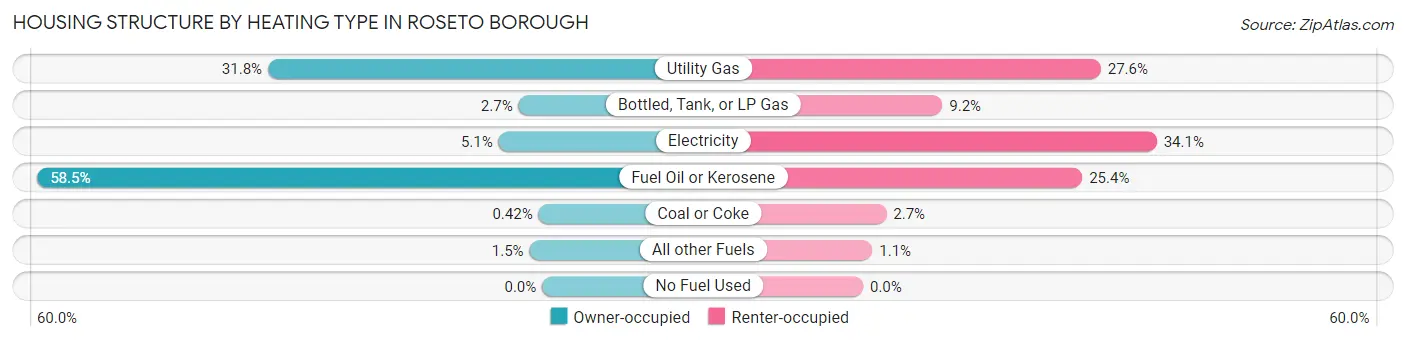
| Heating Type | Owner-occupied | Renter-occupied |
| Utility Gas | 151 (31.8%) | 51 (27.6%) |
| Bottled, Tank, or LP Gas | 13 (2.7%) | 17 (9.2%) |
| Electricity | 24 (5.1%) | 63 (34.1%) |
| Fuel Oil or Kerosene | 278 (58.5%) | 47 (25.4%) |
| Coal or Coke | 2 (0.4%) | 5 (2.7%) |
| All other Fuels | 7 (1.5%) | 2 (1.1%) |
| No Fuel Used | 0 (0.0%) | 0 (0.0%) |
| Total | 475 (100.0%) | 185 (100.0%) |
Household Vehicle Usage in Roseto borough
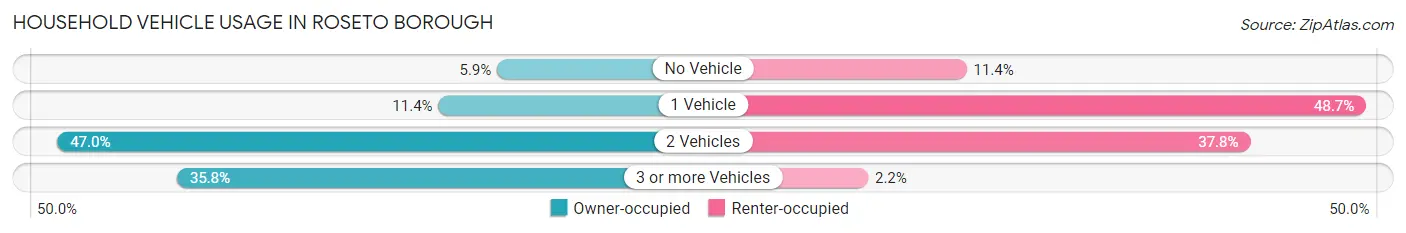
| Vehicles per Household | Owner-occupied | Renter-occupied |
| No Vehicle | 28 (5.9%) | 21 (11.4%) |
| 1 Vehicle | 54 (11.4%) | 90 (48.6%) |
| 2 Vehicles | 223 (46.9%) | 70 (37.8%) |
| 3 or more Vehicles | 170 (35.8%) | 4 (2.2%) |
| Total | 475 (100.0%) | 185 (100.0%) |
Real Estate & Mortgages in Roseto borough
Real Estate and Mortgage Overview in Roseto borough
| Characteristic | Without Mortgage | With Mortgage |
| Housing Units | 103 | 372 |
| Median Property Value | $211,300 | $188,100 |
| Median Household Income | $59,583 | $102 |
| Monthly Housing Costs | $647 | $11 |
| Real Estate Taxes | $3,500 | $2 |
Property Value by Mortgage Status in Roseto borough
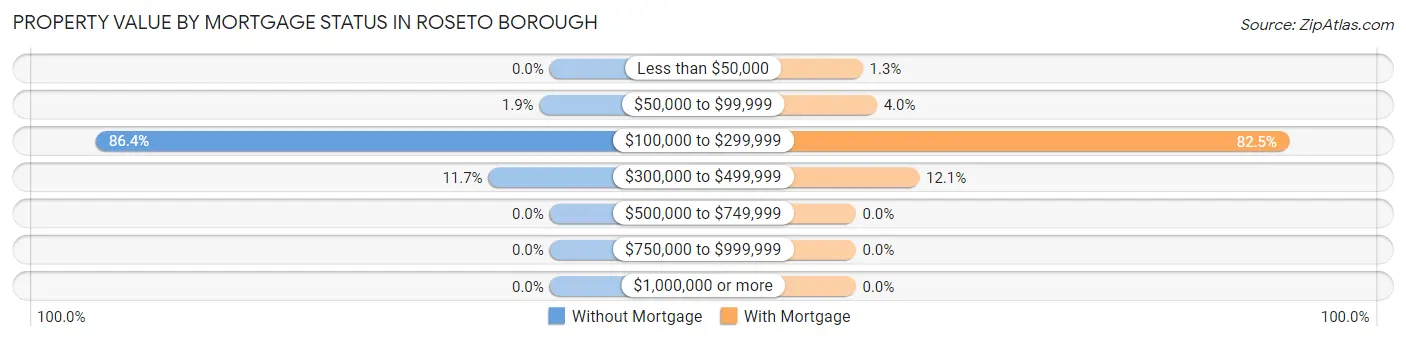
| Property Value | Without Mortgage | With Mortgage |
| Less than $50,000 | 0 (0.0%) | 5 (1.3%) |
| $50,000 to $99,999 | 2 (1.9%) | 15 (4.0%) |
| $100,000 to $299,999 | 89 (86.4%) | 307 (82.5%) |
| $300,000 to $499,999 | 12 (11.7%) | 45 (12.1%) |
| $500,000 to $749,999 | 0 (0.0%) | 0 (0.0%) |
| $750,000 to $999,999 | 0 (0.0%) | 0 (0.0%) |
| $1,000,000 or more | 0 (0.0%) | 0 (0.0%) |
| Total | 103 (100.0%) | 372 (100.0%) |
Household Income by Mortgage Status in Roseto borough
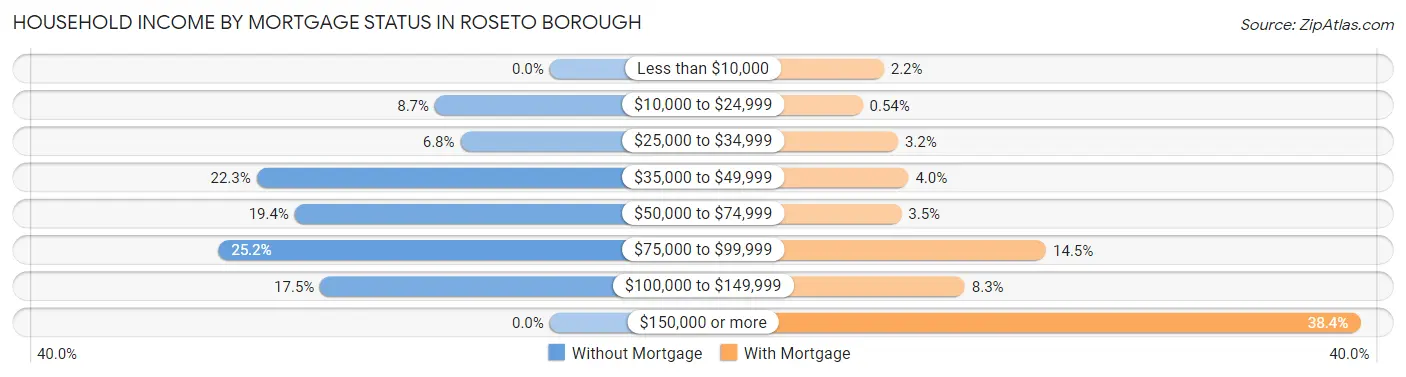
| Household Income | Without Mortgage | With Mortgage |
| Less than $10,000 | 0 (0.0%) | 8 (2.1%) |
| $10,000 to $24,999 | 9 (8.7%) | 2 (0.5%) |
| $25,000 to $34,999 | 7 (6.8%) | 12 (3.2%) |
| $35,000 to $49,999 | 23 (22.3%) | 15 (4.0%) |
| $50,000 to $74,999 | 20 (19.4%) | 13 (3.5%) |
| $75,000 to $99,999 | 26 (25.2%) | 54 (14.5%) |
| $100,000 to $149,999 | 18 (17.5%) | 31 (8.3%) |
| $150,000 or more | 0 (0.0%) | 143 (38.4%) |
| Total | 103 (100.0%) | 372 (100.0%) |
Property Value to Household Income Ratio in Roseto borough
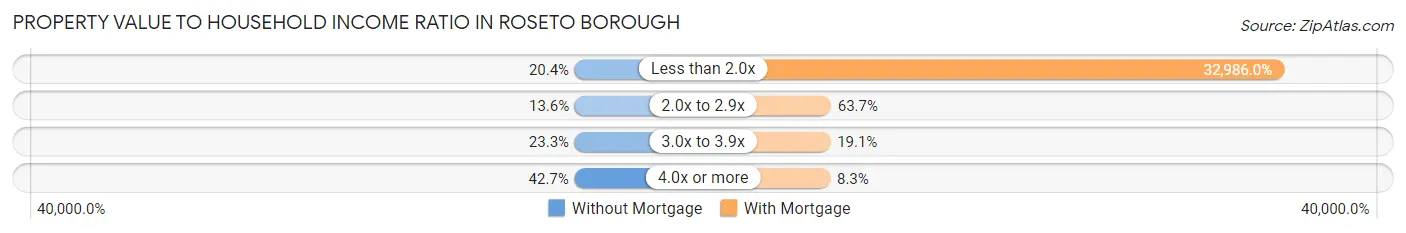
| Value-to-Income Ratio | Without Mortgage | With Mortgage |
| Less than 2.0x | 21 (20.4%) | 122,708 (32,986.0%) |
| 2.0x to 2.9x | 14 (13.6%) | 237 (63.7%) |
| 3.0x to 3.9x | 24 (23.3%) | 71 (19.1%) |
| 4.0x or more | 44 (42.7%) | 31 (8.3%) |
| Total | 103 (100.0%) | 372 (100.0%) |
Real Estate Taxes by Mortgage Status in Roseto borough
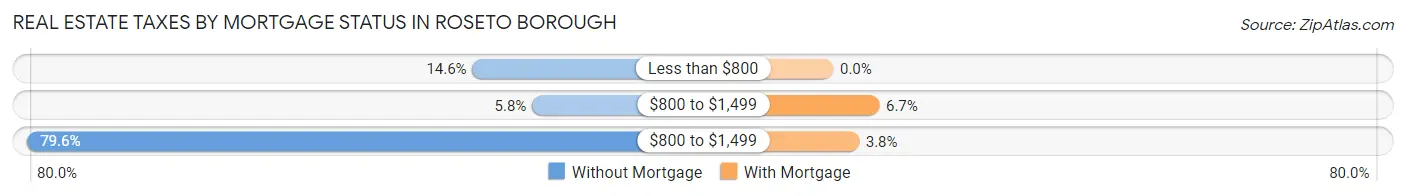
| Property Taxes | Without Mortgage | With Mortgage |
| Less than $800 | 15 (14.6%) | 0 (0.0%) |
| $800 to $1,499 | 6 (5.8%) | 25 (6.7%) |
| $800 to $1,499 | 82 (79.6%) | 14 (3.8%) |
| Total | 103 (100.0%) | 372 (100.0%) |
Health & Disability in Roseto borough
Health Insurance Coverage by Age in Roseto borough
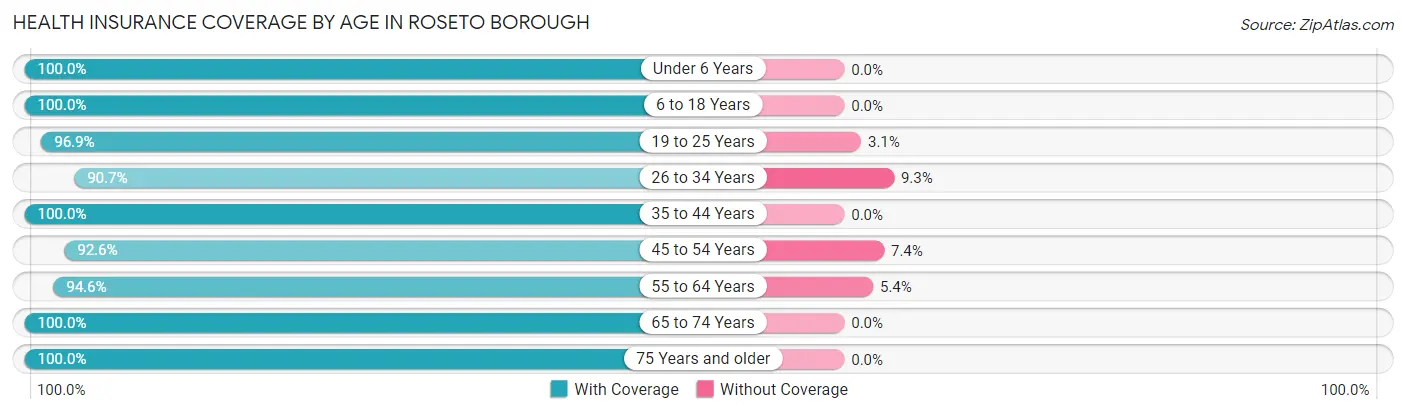
| Age Bracket | With Coverage | Without Coverage |
| Under 6 Years | 183 (100.0%) | 0 (0.0%) |
| 6 to 18 Years | 452 (100.0%) | 0 (0.0%) |
| 19 to 25 Years | 124 (96.9%) | 4 (3.1%) |
| 26 to 34 Years | 333 (90.7%) | 34 (9.3%) |
| 35 to 44 Years | 216 (100.0%) | 0 (0.0%) |
| 45 to 54 Years | 225 (92.6%) | 18 (7.4%) |
| 55 to 64 Years | 159 (94.6%) | 9 (5.4%) |
| 65 to 74 Years | 82 (100.0%) | 0 (0.0%) |
| 75 Years and older | 111 (100.0%) | 0 (0.0%) |
| Total | 1,885 (96.7%) | 65 (3.3%) |
Health Insurance Coverage by Citizenship Status in Roseto borough
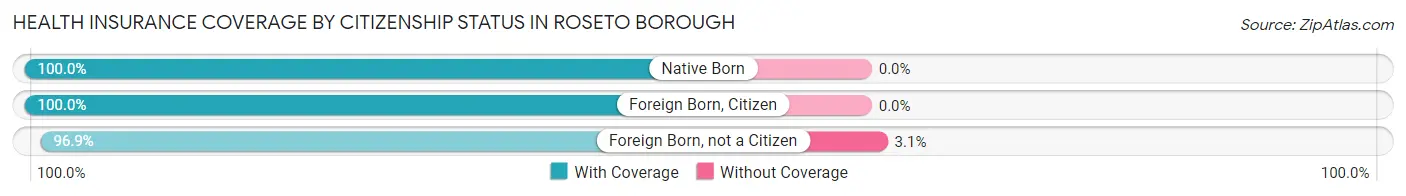
| Citizenship Status | With Coverage | Without Coverage |
| Native Born | 183 (100.0%) | 0 (0.0%) |
| Foreign Born, Citizen | 452 (100.0%) | 0 (0.0%) |
| Foreign Born, not a Citizen | 124 (96.9%) | 4 (3.1%) |
Health Insurance Coverage by Household Income in Roseto borough
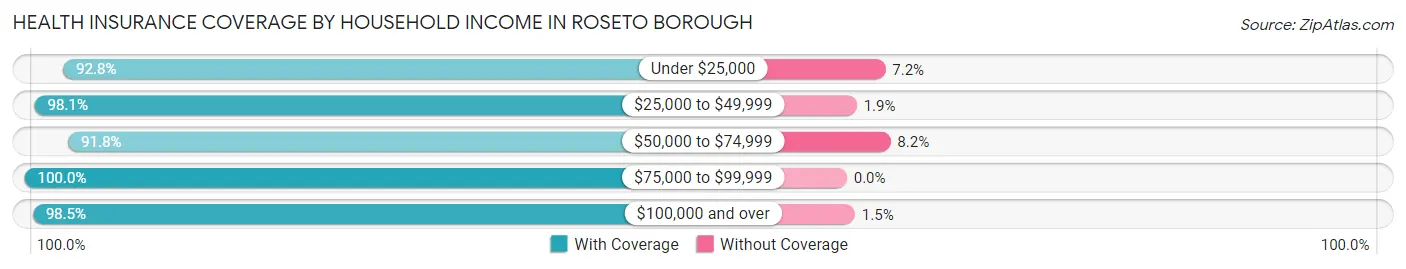
| Household Income | With Coverage | Without Coverage |
| Under $25,000 | 180 (92.8%) | 14 (7.2%) |
| $25,000 to $49,999 | 211 (98.1%) | 4 (1.9%) |
| $50,000 to $74,999 | 382 (91.8%) | 34 (8.2%) |
| $75,000 to $99,999 | 269 (100.0%) | 0 (0.0%) |
| $100,000 and over | 840 (98.5%) | 13 (1.5%) |
Public vs Private Health Insurance Coverage by Age in Roseto borough
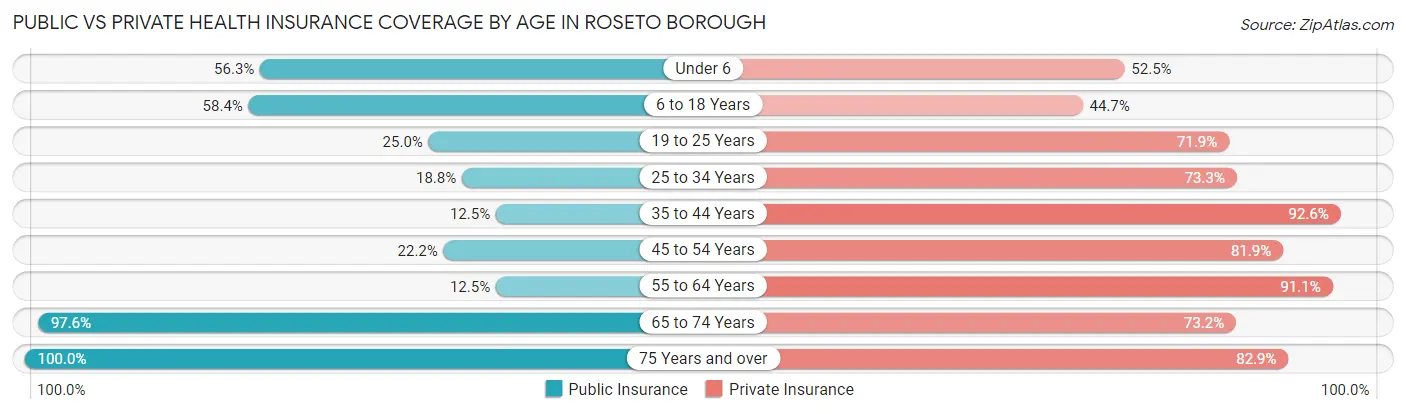
| Age Bracket | Public Insurance | Private Insurance |
| Under 6 | 103 (56.3%) | 96 (52.5%) |
| 6 to 18 Years | 264 (58.4%) | 202 (44.7%) |
| 19 to 25 Years | 32 (25.0%) | 92 (71.9%) |
| 25 to 34 Years | 69 (18.8%) | 269 (73.3%) |
| 35 to 44 Years | 27 (12.5%) | 200 (92.6%) |
| 45 to 54 Years | 54 (22.2%) | 199 (81.9%) |
| 55 to 64 Years | 21 (12.5%) | 153 (91.1%) |
| 65 to 74 Years | 80 (97.6%) | 60 (73.2%) |
| 75 Years and over | 111 (100.0%) | 92 (82.9%) |
| Total | 761 (39.0%) | 1,363 (69.9%) |
Disability Status by Sex by Age in Roseto borough
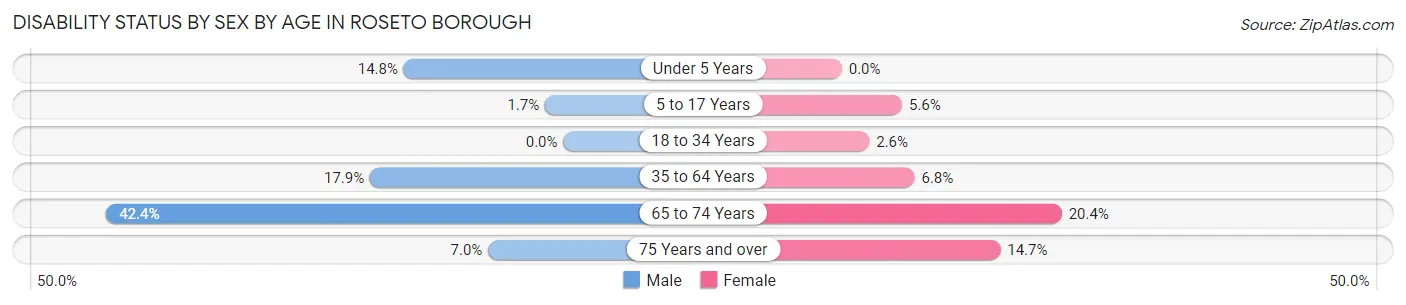
| Age Bracket | Male | Female |
| Under 5 Years | 16 (14.8%) | 0 (0.0%) |
| 5 to 17 Years | 5 (1.7%) | 10 (5.6%) |
| 18 to 34 Years | 0 (0.0%) | 7 (2.5%) |
| 35 to 64 Years | 54 (17.9%) | 22 (6.8%) |
| 65 to 74 Years | 14 (42.4%) | 10 (20.4%) |
| 75 Years and over | 3 (7.0%) | 10 (14.7%) |
Disability Class by Sex by Age in Roseto borough
Disability Class: Hearing Difficulty
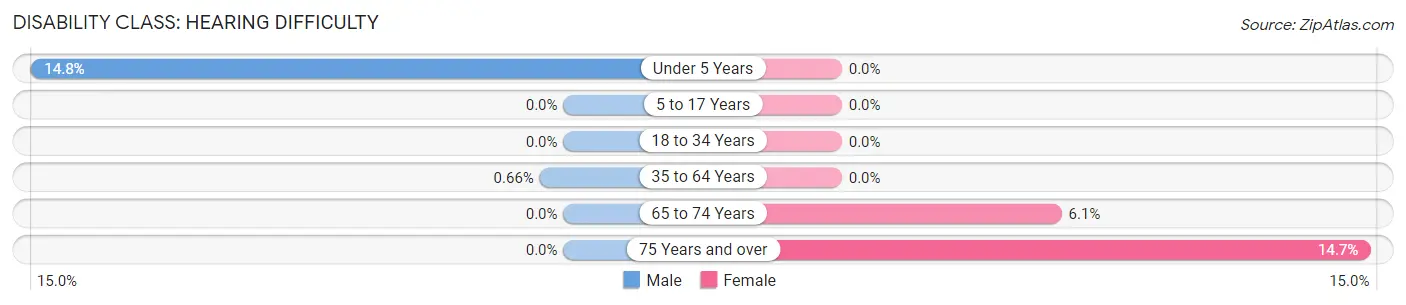
| Age Bracket | Male | Female |
| Under 5 Years | 16 (14.8%) | 0 (0.0%) |
| 5 to 17 Years | 0 (0.0%) | 0 (0.0%) |
| 18 to 34 Years | 0 (0.0%) | 0 (0.0%) |
| 35 to 64 Years | 2 (0.7%) | 0 (0.0%) |
| 65 to 74 Years | 0 (0.0%) | 3 (6.1%) |
| 75 Years and over | 0 (0.0%) | 10 (14.7%) |
Disability Class: Vision Difficulty
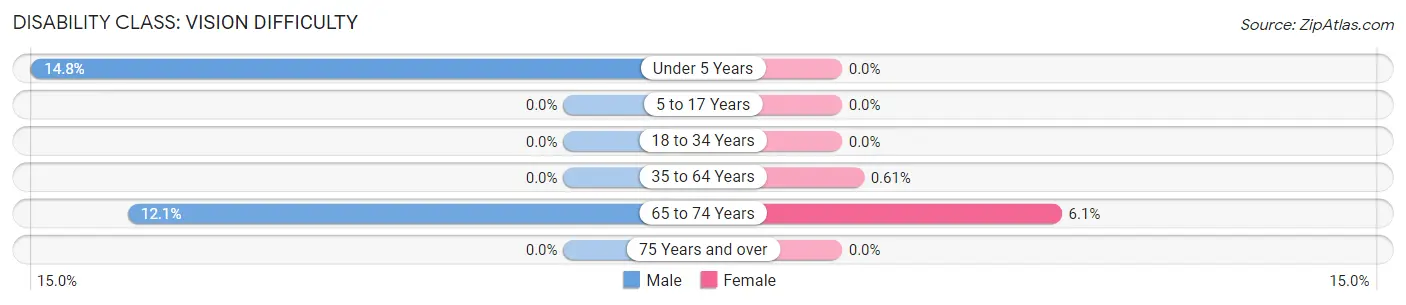
| Age Bracket | Male | Female |
| Under 5 Years | 16 (14.8%) | 0 (0.0%) |
| 5 to 17 Years | 0 (0.0%) | 0 (0.0%) |
| 18 to 34 Years | 0 (0.0%) | 0 (0.0%) |
| 35 to 64 Years | 0 (0.0%) | 2 (0.6%) |
| 65 to 74 Years | 4 (12.1%) | 3 (6.1%) |
| 75 Years and over | 0 (0.0%) | 0 (0.0%) |
Disability Class: Cognitive Difficulty
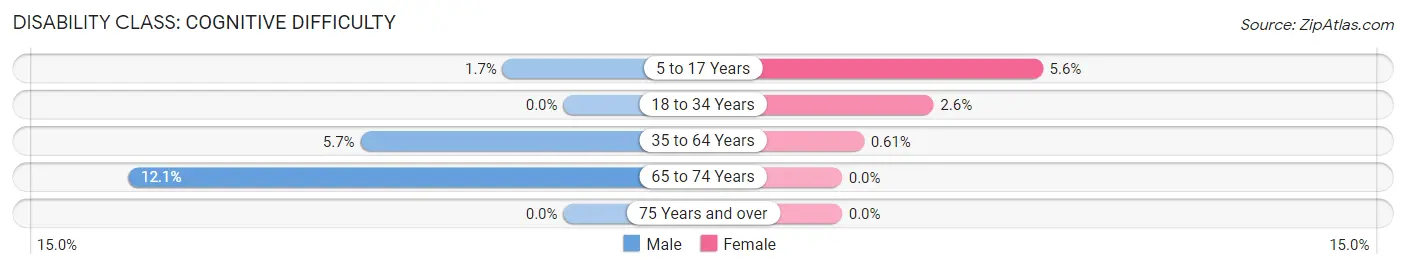
| Age Bracket | Male | Female |
| 5 to 17 Years | 5 (1.7%) | 10 (5.6%) |
| 18 to 34 Years | 0 (0.0%) | 7 (2.5%) |
| 35 to 64 Years | 17 (5.7%) | 2 (0.6%) |
| 65 to 74 Years | 4 (12.1%) | 0 (0.0%) |
| 75 Years and over | 0 (0.0%) | 0 (0.0%) |
Disability Class: Ambulatory Difficulty
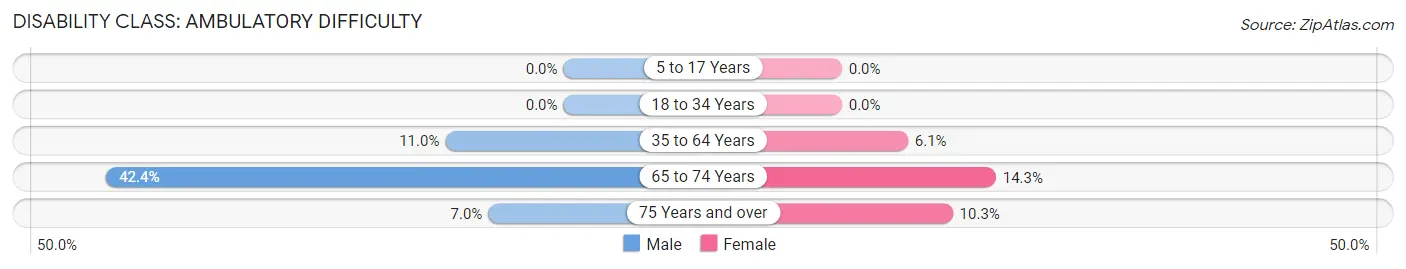
| Age Bracket | Male | Female |
| 5 to 17 Years | 0 (0.0%) | 0 (0.0%) |
| 18 to 34 Years | 0 (0.0%) | 0 (0.0%) |
| 35 to 64 Years | 33 (11.0%) | 20 (6.1%) |
| 65 to 74 Years | 14 (42.4%) | 7 (14.3%) |
| 75 Years and over | 3 (7.0%) | 7 (10.3%) |
Disability Class: Self-Care Difficulty
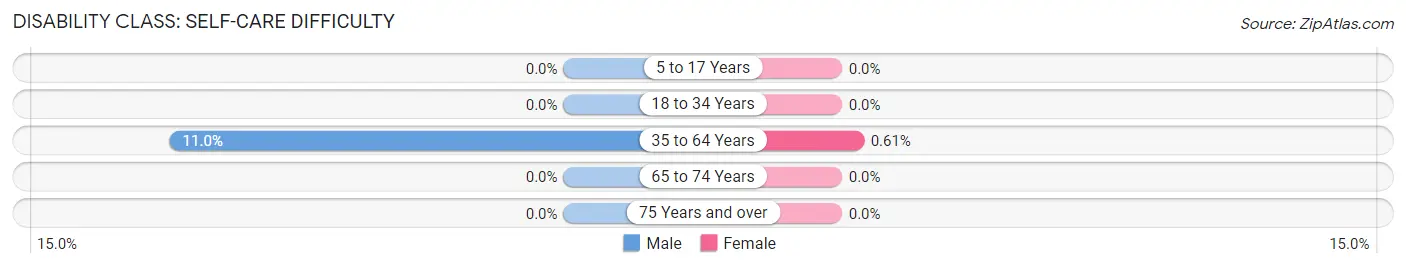
| Age Bracket | Male | Female |
| 5 to 17 Years | 0 (0.0%) | 0 (0.0%) |
| 18 to 34 Years | 0 (0.0%) | 0 (0.0%) |
| 35 to 64 Years | 33 (11.0%) | 2 (0.6%) |
| 65 to 74 Years | 0 (0.0%) | 0 (0.0%) |
| 75 Years and over | 0 (0.0%) | 0 (0.0%) |
Technology Access in Roseto borough
Computing Device Access in Roseto borough
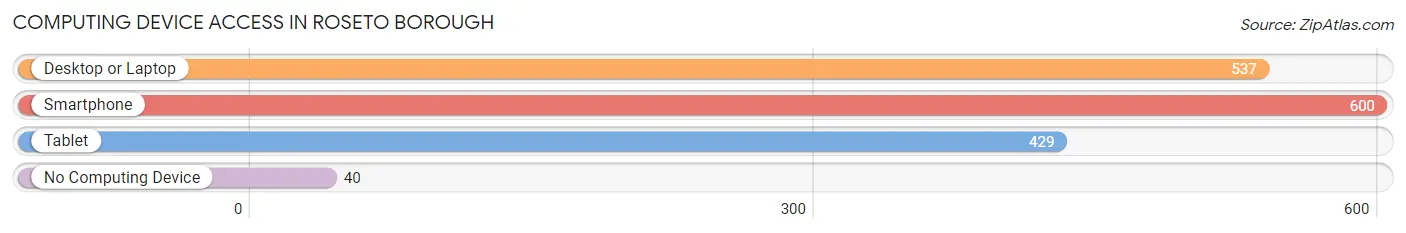
| Device Type | # Households | % Households |
| Desktop or Laptop | 537 | 81.4% |
| Smartphone | 600 | 90.9% |
| Tablet | 429 | 65.0% |
| No Computing Device | 40 | 6.1% |
| Total | 660 | 100.0% |
Internet Access in Roseto borough
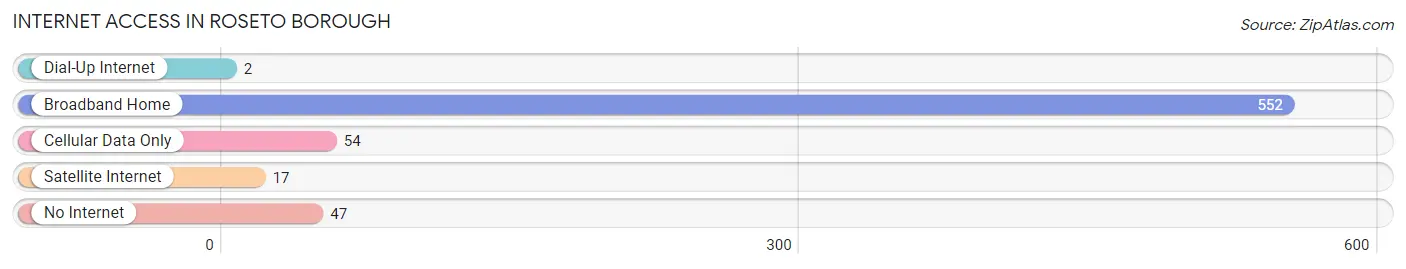
| Internet Type | # Households | % Households |
| Dial-Up Internet | 2 | 0.3% |
| Broadband Home | 552 | 83.6% |
| Cellular Data Only | 54 | 8.2% |
| Satellite Internet | 17 | 2.6% |
| No Internet | 47 | 7.1% |
| Total | 660 | 100.0% |
Roseto borough Summary
Roseto Borough is a small borough located in Northampton County, Pennsylvania. It is situated in the Lehigh Valley region of the state, and is part of the Easton Metropolitan Statistical Area. The borough has a population of approximately 2,500 people, and is located approximately 10 miles north of Easton.
History
Roseto Borough was founded in 1882 by Italian immigrants from the town of Roseto Valfortore in the province of Foggia, Italy. The immigrants were attracted to the area by the promise of work in the slate quarries and the coal mines. The immigrants established a tight-knit community, and the town was named after their hometown in Italy.
The town grew rapidly, and by the early 1900s, Roseto had become a thriving community. The town was known for its strong sense of community and its vibrant Italian culture. The town was also known for its unique architecture, which was a combination of Italian and American styles.
In the 1950s, Roseto was the subject of a study by Dr. Stewart Wolf, a physician from the University of Oklahoma. Dr. Wolf studied the town's residents and found that they had a much lower rate of heart disease than the national average. This was attributed to the strong sense of community and the traditional Italian diet.
Geography
Roseto Borough is located in Northampton County, Pennsylvania. It is situated in the Lehigh Valley region of the state, and is part of the Easton Metropolitan Statistical Area. The borough has a total area of 0.7 square miles, all of which is land.
The borough is located in the Lehigh Valley region of Pennsylvania, and is situated in the foothills of the Pocono Mountains. The borough is located approximately 10 miles north of Easton, and is bordered by the townships of Plainfield, Lower Mount Bethel, and Upper Mount Bethel.
Economy
The economy of Roseto Borough is largely based on tourism and small businesses. The borough is home to several small businesses, including restaurants, shops, and other services. The borough is also home to several tourist attractions, including the Roseto Historical Society Museum and the Roseto Italian Festival.
The borough is also home to several industrial and manufacturing businesses. The largest employer in the borough is the Roseto Slate Quarry, which produces slate for roofing and other construction projects. The quarry is the largest employer in the borough, and employs over 200 people.
Demographics
As of the 2010 census, Roseto Borough had a population of 2,541 people. The racial makeup of the borough was 97.2% White, 0.9% African American, 0.2% Native American, 0.4% Asian, 0.1% Pacific Islander, 0.3% from other races, and 0.9% from two or more races. Hispanic or Latino of any race were 1.3% of the population.
The median household income in Roseto Borough was $45,938, and the median family income was $51,938. The per capita income for the borough was $20,938. About 8.2% of families and 10.2% of the population were below the poverty line, including 14.2% of those under age 18 and 8.2% of those age 65 or over.
Common Questions
What is Per Capita Income in Roseto borough?
Per Capita income in Roseto borough is $34,253.
What is the Median Family Income in Roseto borough?
Median Family Income in Roseto borough is $91,250.
What is the Median Household income in Roseto borough?
Median Household Income in Roseto borough is $81,000.
What is Income or Wage Gap in Roseto borough?
Income or Wage Gap in Roseto borough is 39.5%.
Women in Roseto borough earn 60.5 cents for every dollar earned by a man.
What is Inequality or Gini Index in Roseto borough?
Inequality or Gini Index in Roseto borough is 0.40.
What is the Total Population of Roseto borough?
Total Population of Roseto borough is 1,950.
What is the Total Male Population of Roseto borough?
Total Male Population of Roseto borough is 1,017.
What is the Total Female Population of Roseto borough?
Total Female Population of Roseto borough is 933.
What is the Ratio of Males per 100 Females in Roseto borough?
There are 109.00 Males per 100 Females in Roseto borough.
What is the Ratio of Females per 100 Males in Roseto borough?
There are 91.74 Females per 100 Males in Roseto borough.
What is the Median Population Age in Roseto borough?
Median Population Age in Roseto borough is 31.6 Years.
What is the Average Family Size in Roseto borough
Average Family Size in Roseto borough is 3.2 People.
What is the Average Household Size in Roseto borough
Average Household Size in Roseto borough is 3.0 People.
How Large is the Labor Force in Roseto borough?
There are 1,033 People in the Labor Forcein in Roseto borough.
What is the Percentage of People in the Labor Force in Roseto borough?
74.5% of People are in the Labor Force in Roseto borough.
What is the Unemployment Rate in Roseto borough?
Unemployment Rate in Roseto borough is 6.7%.