Hinckley, UT Map & Demographics
Hinckley Map
Hinckley Overview
$28,289
PER CAPITA INCOME
$98,214
AVG FAMILY INCOME
$89,135
AVG HOUSEHOLD INCOME
43.9%
WAGE / INCOME GAP [ % ]
56.1¢/ $1
WAGE / INCOME GAP [ $ ]
0.33
INEQUALITY / GINI INDEX
790
TOTAL POPULATION
347
MALE POPULATION
443
FEMALE POPULATION
78.33
MALES / 100 FEMALES
127.67
FEMALES / 100 MALES
28.6
MEDIAN AGE
3.8
AVG FAMILY SIZE
3.5
AVG HOUSEHOLD SIZE
458
LABOR FORCE [ PEOPLE ]
78.3%
PERCENT IN LABOR FORCE
3.5%
UNEMPLOYMENT RATE
Hinckley Zip Codes
Hinckley Area Codes
Income in Hinckley
Income Overview in Hinckley
Per Capita Income in Hinckley is $28,289, while median incomes of families and households are $98,214 and $89,135 respectively.
| Characteristic | Number | Measure |
| Per Capita Income | 790 | $28,289 |
| Median Family Income | 194 | $98,214 |
| Mean Family Income | 194 | $101,719 |
| Median Household Income | 225 | $89,135 |
| Mean Household Income | 225 | $97,556 |
| Income Deficit | 194 | $0 |
| Wage / Income Gap (%) | 790 | 43.89% |
| Wage / Income Gap ($) | 790 | 56.11¢ per $1 |
| Gini / Inequality Index | 790 | 0.33 |
Earnings by Sex in Hinckley
Average Earnings in Hinckley are $28,795, $37,188 for men and $20,865 for women, a difference of 43.9%.
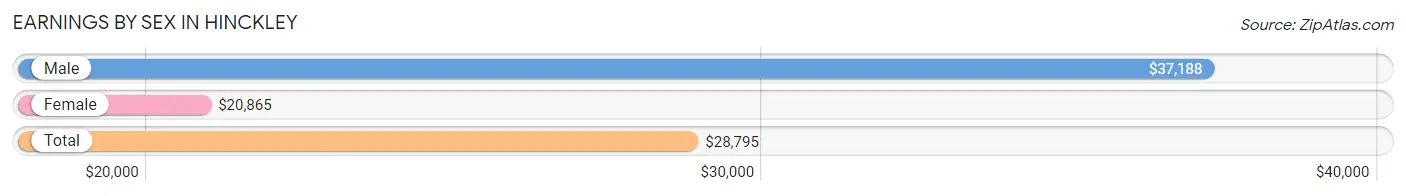
| Sex | Number | Average Earnings |
| Male | 234 (50.5%) | $37,188 |
| Female | 229 (49.5%) | $20,865 |
| Total | 463 (100.0%) | $28,795 |
Earnings by Sex by Income Bracket in Hinckley
The most common earnings brackets in Hinckley are $25,000 to $29,999 for men (59 | 25.2%) and $15,000 to $17,499 for women (46 | 20.1%).
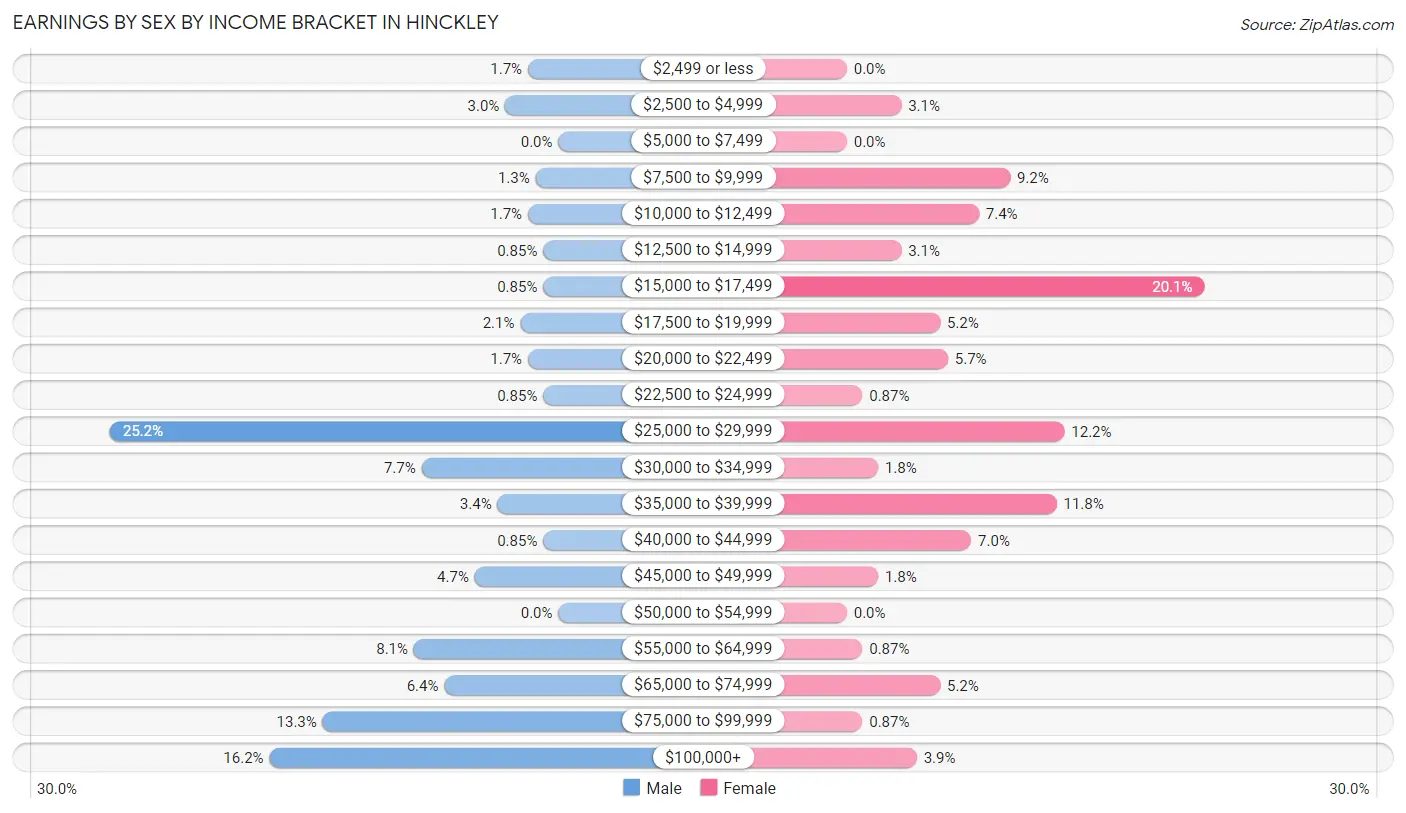
| Income | Male | Female |
| $2,499 or less | 4 (1.7%) | 0 (0.0%) |
| $2,500 to $4,999 | 7 (3.0%) | 7 (3.1%) |
| $5,000 to $7,499 | 0 (0.0%) | 0 (0.0%) |
| $7,500 to $9,999 | 3 (1.3%) | 21 (9.2%) |
| $10,000 to $12,499 | 4 (1.7%) | 17 (7.4%) |
| $12,500 to $14,999 | 2 (0.9%) | 7 (3.1%) |
| $15,000 to $17,499 | 2 (0.9%) | 46 (20.1%) |
| $17,500 to $19,999 | 5 (2.1%) | 12 (5.2%) |
| $20,000 to $22,499 | 4 (1.7%) | 13 (5.7%) |
| $22,500 to $24,999 | 2 (0.9%) | 2 (0.9%) |
| $25,000 to $29,999 | 59 (25.2%) | 28 (12.2%) |
| $30,000 to $34,999 | 18 (7.7%) | 4 (1.8%) |
| $35,000 to $39,999 | 8 (3.4%) | 27 (11.8%) |
| $40,000 to $44,999 | 2 (0.9%) | 16 (7.0%) |
| $45,000 to $49,999 | 11 (4.7%) | 4 (1.8%) |
| $50,000 to $54,999 | 0 (0.0%) | 0 (0.0%) |
| $55,000 to $64,999 | 19 (8.1%) | 2 (0.9%) |
| $65,000 to $74,999 | 15 (6.4%) | 12 (5.2%) |
| $75,000 to $99,999 | 31 (13.3%) | 2 (0.9%) |
| $100,000+ | 38 (16.2%) | 9 (3.9%) |
| Total | 234 (100.0%) | 229 (100.0%) |
Earnings by Sex by Educational Attainment in Hinckley
Average earnings in Hinckley are $46,719 for men and $21,250 for women, a difference of 54.5%. Men with an educational attainment of bachelor's degree enjoy the highest average annual earnings of $85,313, while those with less than high school education earn the least with $32,656. Women with an educational attainment of high school diploma earn the most with the average annual earnings of $29,375, while those with bachelor's degree education have the smallest earnings of $16,739.
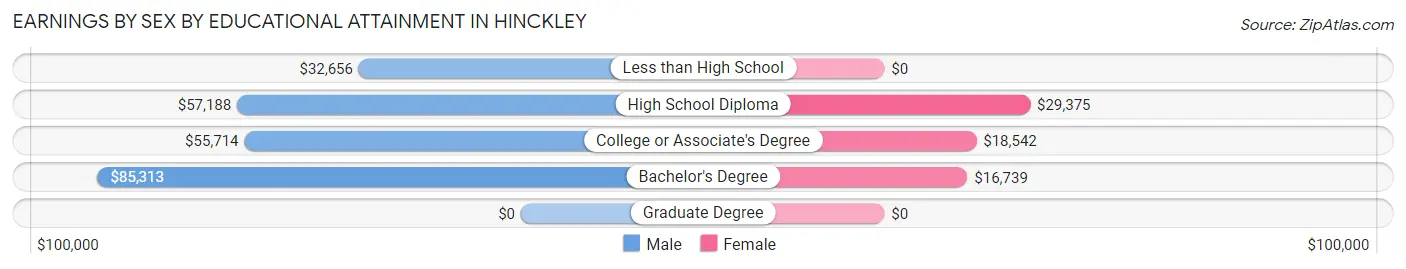
| Educational Attainment | Male Income | Female Income |
| Less than High School | $32,656 | $0 |
| High School Diploma | $57,188 | $29,375 |
| College or Associate's Degree | $55,714 | $18,542 |
| Bachelor's Degree | $85,313 | $16,739 |
| Graduate Degree | - | - |
| Total | $46,719 | $21,250 |
Family Income in Hinckley
Family Income Brackets in Hinckley
According to the Hinckley family income data, there are 55 families falling into the $150,000 to $199,999 income range, which is the most common income bracket and makes up 28.3% of all families.
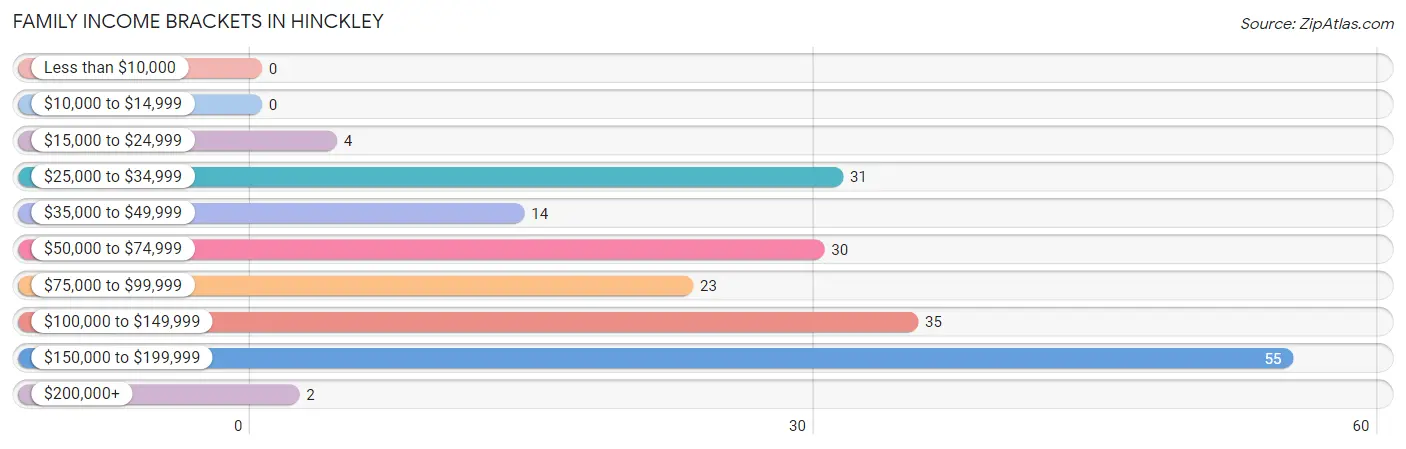
| Income Bracket | # Families | % Families |
| Less than $10,000 | 0 | 0.0% |
| $10,000 to $14,999 | 0 | 0.0% |
| $15,000 to $24,999 | 4 | 2.1% |
| $25,000 to $34,999 | 31 | 16.0% |
| $35,000 to $49,999 | 14 | 7.2% |
| $50,000 to $74,999 | 30 | 15.5% |
| $75,000 to $99,999 | 23 | 11.9% |
| $100,000 to $149,999 | 35 | 18.0% |
| $150,000 to $199,999 | 55 | 28.4% |
| $200,000+ | 2 | 1.0% |
Family Income by Famaliy Size in Hinckley
5-person families (14 | 7.2%) account for the highest median family income in Hinckley with $148,000 per family, while 2-person families (113 | 58.3%) have the highest median income of $49,125 per family member.
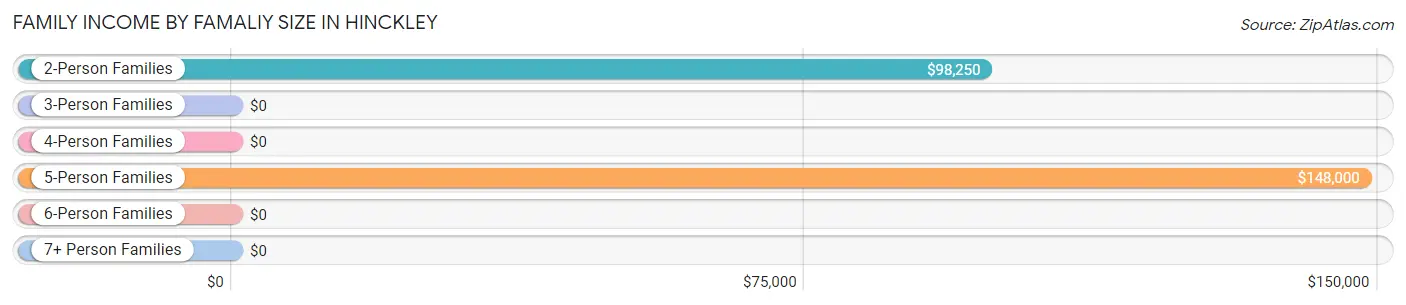
| Income Bracket | # Families | Median Income |
| 2-Person Families | 113 (58.3%) | $98,250 |
| 3-Person Families | 7 (3.6%) | $0 |
| 4-Person Families | 38 (19.6%) | $0 |
| 5-Person Families | 14 (7.2%) | $148,000 |
| 6-Person Families | 18 (9.3%) | $0 |
| 7+ Person Families | 4 (2.1%) | $0 |
| Total | 194 (100.0%) | $98,214 |
Family Income by Number of Earners in Hinckley
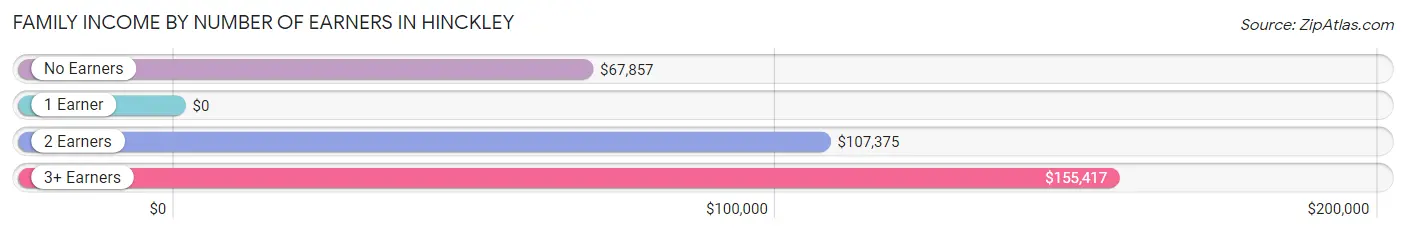
| Number of Earners | # Families | Median Income |
| No Earners | 18 (9.3%) | $67,857 |
| 1 Earner | 60 (30.9%) | $0 |
| 2 Earners | 81 (41.7%) | $107,375 |
| 3+ Earners | 35 (18.0%) | $155,417 |
| Total | 194 (100.0%) | $98,214 |
Household Income in Hinckley
Household Income Brackets in Hinckley
With 60 households falling in the category, the $50,000 to $74,999 income range is the most frequent in Hinckley, accounting for 26.7% of all households.
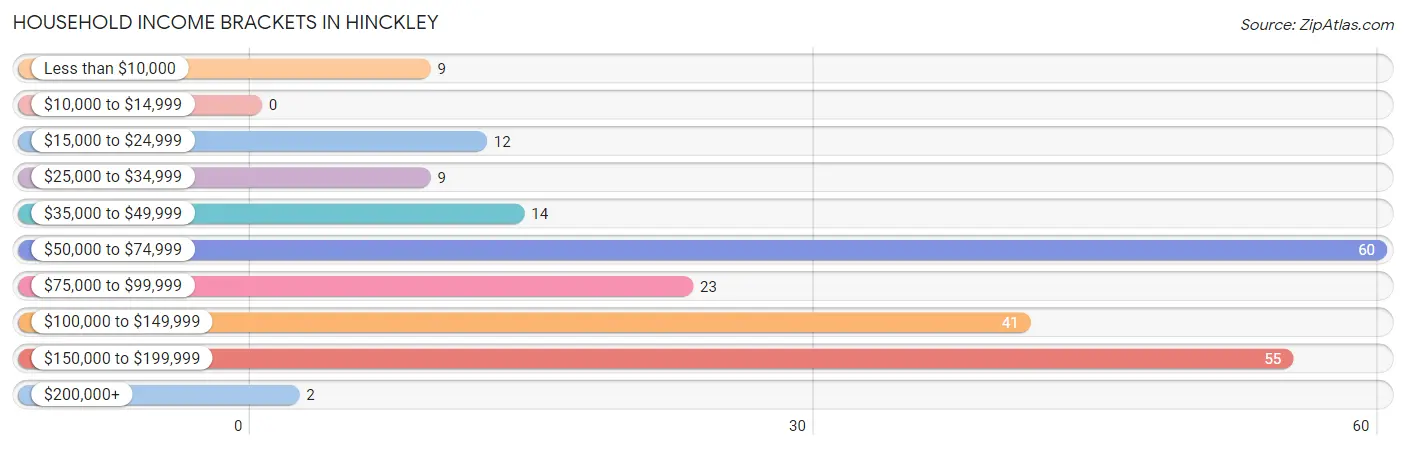
| Income Bracket | # Households | % Households |
| Less than $10,000 | 9 | 4.0% |
| $10,000 to $14,999 | 0 | 0.0% |
| $15,000 to $24,999 | 12 | 5.3% |
| $25,000 to $34,999 | 9 | 4.0% |
| $35,000 to $49,999 | 14 | 6.2% |
| $50,000 to $74,999 | 60 | 26.7% |
| $75,000 to $99,999 | 23 | 10.2% |
| $100,000 to $149,999 | 41 | 18.2% |
| $150,000 to $199,999 | 55 | 24.4% |
| $200,000+ | 2 | 0.9% |
Household Income by Householder Age in Hinckley
The median household income in Hinckley is $89,135, with the highest median household income of $149,250 found in the 45 to 64 years age bracket for the primary householder. A total of 97 households (43.1%) fall into this category.
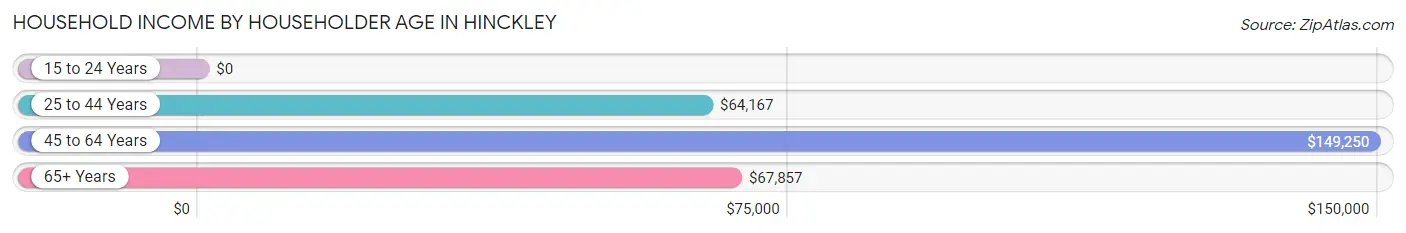
| Income Bracket | # Households | Median Income |
| 15 to 24 Years | 0 (0.0%) | $0 |
| 25 to 44 Years | 90 (40.0%) | $64,167 |
| 45 to 64 Years | 97 (43.1%) | $149,250 |
| 65+ Years | 38 (16.9%) | $67,857 |
| Total | 225 (100.0%) | $89,135 |
Poverty in Hinckley
Income Below Poverty by Sex and Age in Hinckley
With 1.4% poverty level for males and 5.9% for females among the residents of Hinckley, 15 year old males and 12 to 14 year old females are the most vulnerable to poverty, with 1 males (33.3%) and 6 females (40.0%) in their respective age groups living below the poverty level.
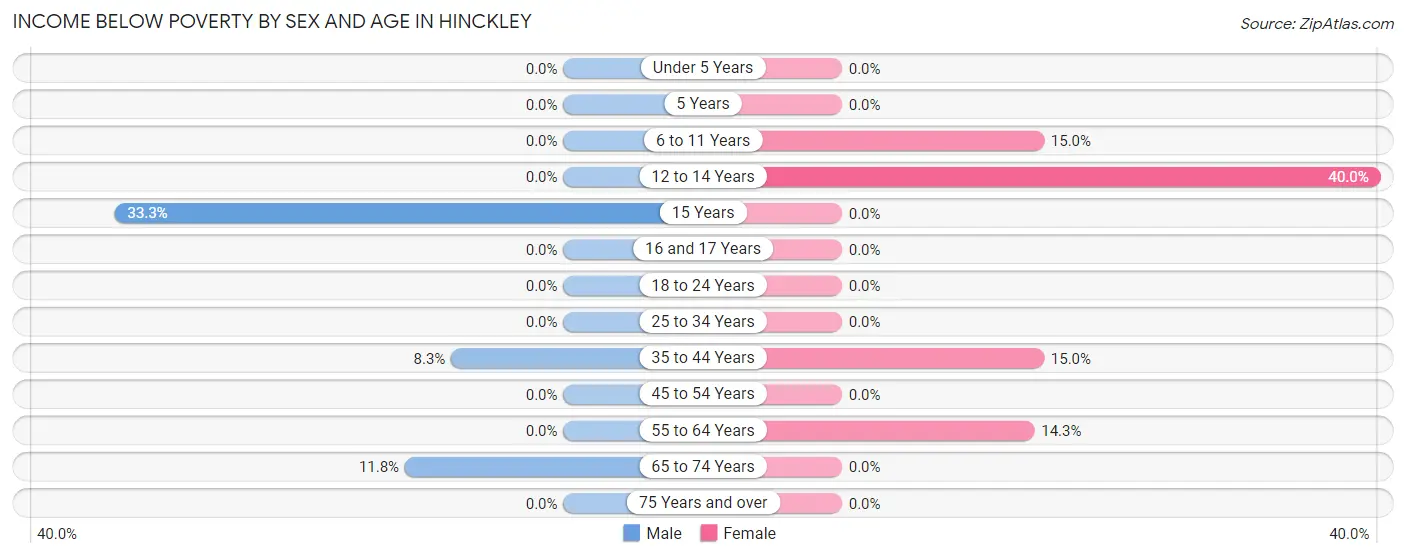
| Age Bracket | Male | Female |
| Under 5 Years | 0 (0.0%) | 0 (0.0%) |
| 5 Years | 0 (0.0%) | 0 (0.0%) |
| 6 to 11 Years | 0 (0.0%) | 9 (15.0%) |
| 12 to 14 Years | 0 (0.0%) | 6 (40.0%) |
| 15 Years | 1 (33.3%) | 0 (0.0%) |
| 16 and 17 Years | 0 (0.0%) | 0 (0.0%) |
| 18 to 24 Years | 0 (0.0%) | 0 (0.0%) |
| 25 to 34 Years | 0 (0.0%) | 0 (0.0%) |
| 35 to 44 Years | 2 (8.3%) | 3 (15.0%) |
| 45 to 54 Years | 0 (0.0%) | 0 (0.0%) |
| 55 to 64 Years | 0 (0.0%) | 7 (14.3%) |
| 65 to 74 Years | 2 (11.8%) | 0 (0.0%) |
| 75 Years and over | 0 (0.0%) | 0 (0.0%) |
| Total | 5 (1.4%) | 25 (5.9%) |
Income Above Poverty by Sex and Age in Hinckley
According to the poverty statistics in Hinckley, males aged under 5 years and females aged under 5 years are the age groups that are most secure financially, with 100.0% of males and 100.0% of females in these age groups living above the poverty line.
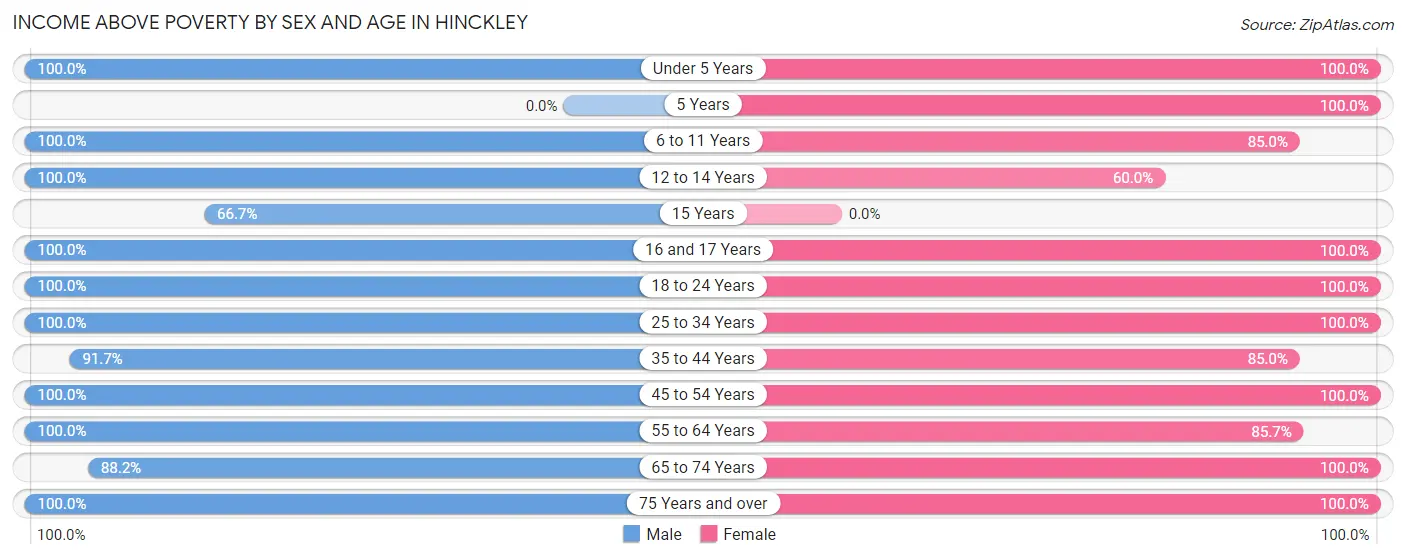
| Age Bracket | Male | Female |
| Under 5 Years | 47 (100.0%) | 24 (100.0%) |
| 5 Years | 0 (0.0%) | 5 (100.0%) |
| 6 to 11 Years | 32 (100.0%) | 51 (85.0%) |
| 12 to 14 Years | 2 (100.0%) | 9 (60.0%) |
| 15 Years | 2 (66.7%) | 0 (0.0%) |
| 16 and 17 Years | 2 (100.0%) | 1 (100.0%) |
| 18 to 24 Years | 15 (100.0%) | 27 (100.0%) |
| 25 to 34 Years | 105 (100.0%) | 139 (100.0%) |
| 35 to 44 Years | 22 (91.7%) | 17 (85.0%) |
| 45 to 54 Years | 39 (100.0%) | 62 (100.0%) |
| 55 to 64 Years | 37 (100.0%) | 42 (85.7%) |
| 65 to 74 Years | 15 (88.2%) | 15 (100.0%) |
| 75 Years and over | 24 (100.0%) | 9 (100.0%) |
| Total | 342 (98.6%) | 401 (94.1%) |
Income Below Poverty Among Married-Couple Families in Hinckley
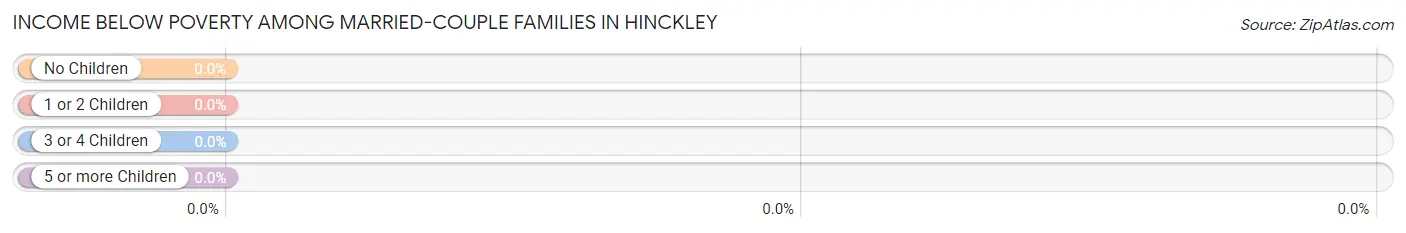
| Children | Above Poverty | Below Poverty |
| No Children | 92 (100.0%) | 0 (0.0%) |
| 1 or 2 Children | 30 (100.0%) | 0 (0.0%) |
| 3 or 4 Children | 27 (100.0%) | 0 (0.0%) |
| 5 or more Children | 0 (0.0%) | 0 (0.0%) |
| Total | 149 (100.0%) | 0 (0.0%) |
Income Below Poverty Among Single-Parent Households in Hinckley
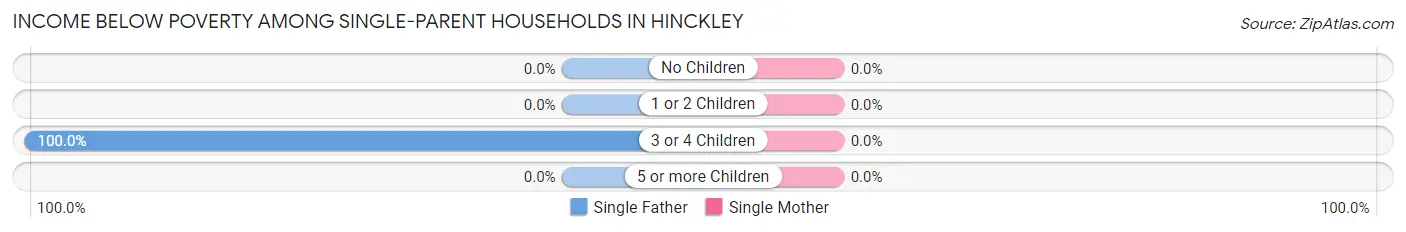
| Children | Single Father | Single Mother |
| No Children | 0 (0.0%) | 0 (0.0%) |
| 1 or 2 Children | 0 (0.0%) | 0 (0.0%) |
| 3 or 4 Children | 2 (100.0%) | 0 (0.0%) |
| 5 or more Children | 0 (0.0%) | 0 (0.0%) |
| Total | 2 (4.9%) | 0 (0.0%) |
Income Below Poverty Among Married-Couple vs Single-Parent Households in Hinckley
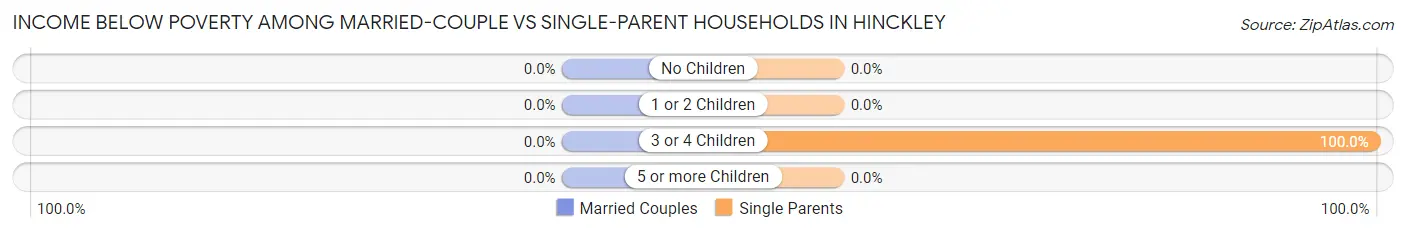
| Children | Married-Couple Families | Single-Parent Households |
| No Children | 0 (0.0%) | 0 (0.0%) |
| 1 or 2 Children | 0 (0.0%) | 0 (0.0%) |
| 3 or 4 Children | 0 (0.0%) | 2 (100.0%) |
| 5 or more Children | 0 (0.0%) | 0 (0.0%) |
| Total | 0 (0.0%) | 2 (4.4%) |
Race in Hinckley
The most populous races in Hinckley are White / Caucasian (589 | 74.6%), Hispanic or Latino (172 | 21.8%), and Some other Race (171 | 21.6%).
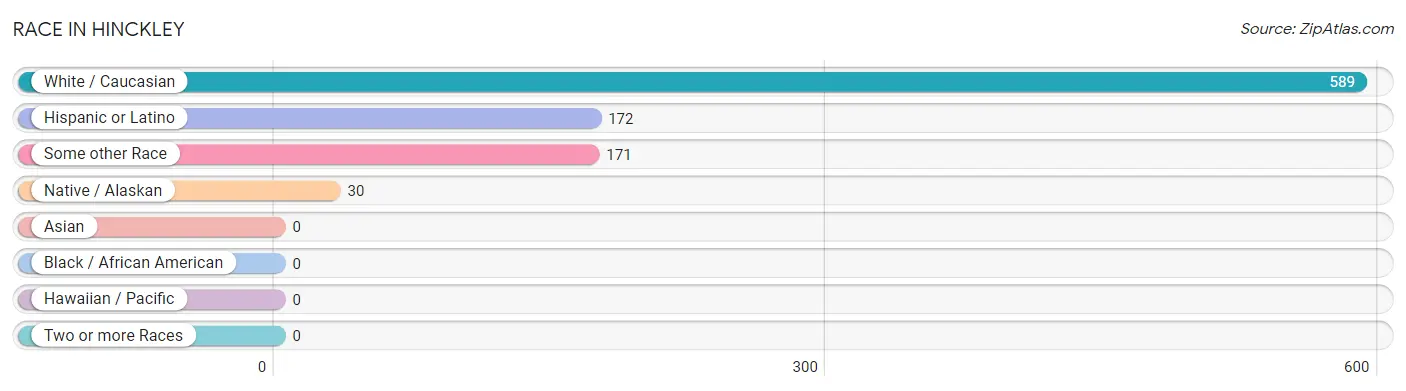
| Race | # Population | % Population |
| Asian | 0 | 0.0% |
| Black / African American | 0 | 0.0% |
| Hawaiian / Pacific | 0 | 0.0% |
| Hispanic or Latino | 172 | 21.8% |
| Native / Alaskan | 30 | 3.8% |
| White / Caucasian | 589 | 74.6% |
| Two or more Races | 0 | 0.0% |
| Some other Race | 171 | 21.6% |
| Total | 790 | 100.0% |
Ancestry in Hinckley
The most populous ancestries reported in Hinckley are English (164 | 20.8%), Mexican (161 | 20.4%), Irish (97 | 12.3%), German (68 | 8.6%), and American (56 | 7.1%), together accounting for 69.1% of all Hinckley residents.
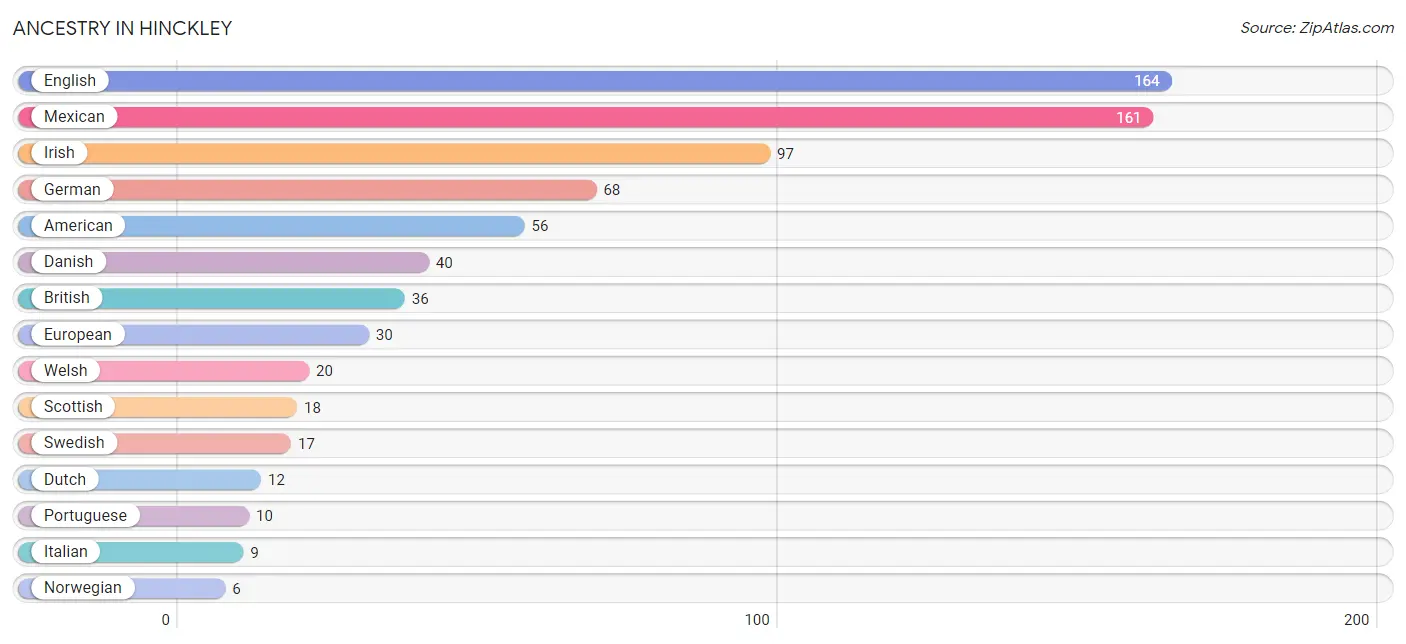
| Ancestry | # Population | % Population |
| American | 56 | 7.1% |
| British | 36 | 4.6% |
| Danish | 40 | 5.1% |
| Dutch | 12 | 1.5% |
| English | 164 | 20.8% |
| European | 30 | 3.8% |
| French | 2 | 0.3% |
| German | 68 | 8.6% |
| Irish | 97 | 12.3% |
| Italian | 9 | 1.1% |
| Mexican | 161 | 20.4% |
| Norwegian | 6 | 0.8% |
| Peruvian | 3 | 0.4% |
| Portuguese | 10 | 1.3% |
| Scottish | 18 | 2.3% |
| South American | 3 | 0.4% |
| Swedish | 17 | 2.1% |
| Welsh | 20 | 2.5% | View All 18 Rows |
Immigrants in Hinckley
The most numerous immigrant groups reported in Hinckley came from Latin America (57 | 7.2%), Central America (54 | 6.8%), Mexico (49 | 6.2%), Europe (11 | 1.4%), and Azores (6 | 0.8%), together accounting for 22.4% of all Hinckley residents.
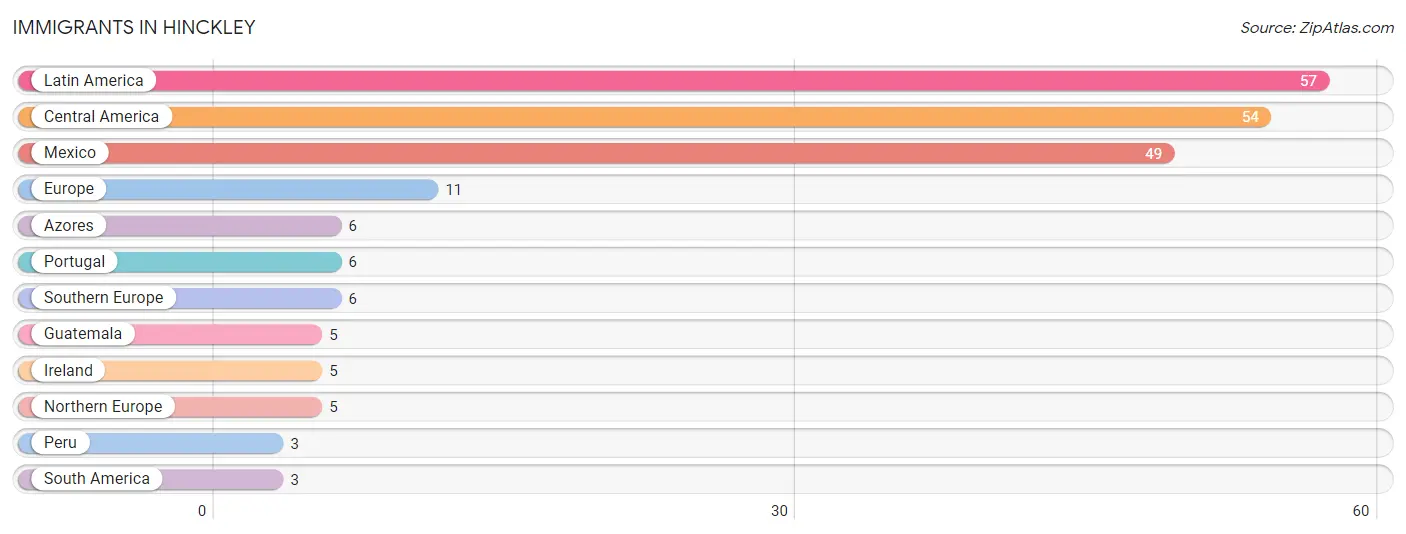
| Immigration Origin | # Population | % Population |
| Azores | 6 | 0.8% |
| Central America | 54 | 6.8% |
| Europe | 11 | 1.4% |
| Guatemala | 5 | 0.6% |
| Ireland | 5 | 0.6% |
| Latin America | 57 | 7.2% |
| Mexico | 49 | 6.2% |
| Northern Europe | 5 | 0.6% |
| Peru | 3 | 0.4% |
| Portugal | 6 | 0.8% |
| South America | 3 | 0.4% |
| Southern Europe | 6 | 0.8% | View All 12 Rows |
Sex and Age in Hinckley
Sex and Age in Hinckley
The most populous age groups in Hinckley are 25 to 29 Years (79 | 22.8%) for men and 25 to 29 Years (128 | 28.9%) for women.
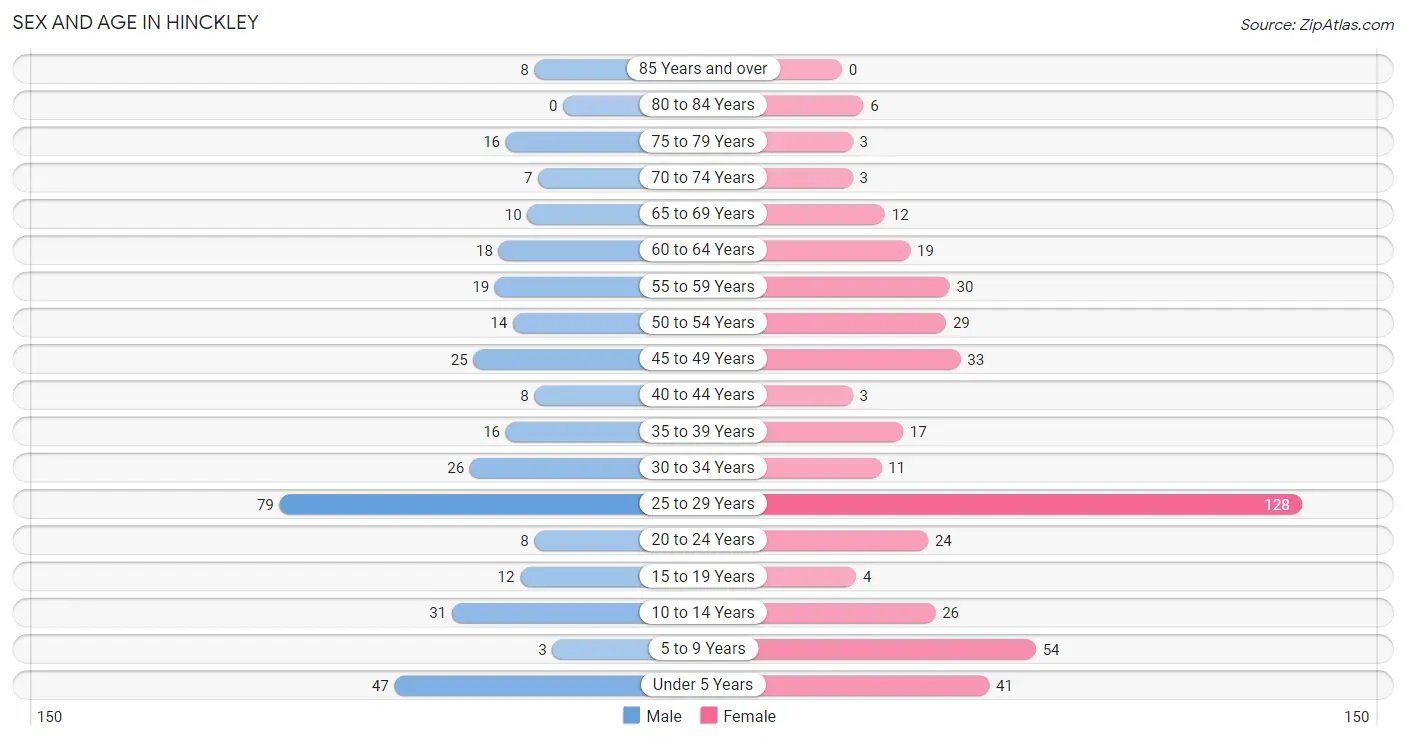
| Age Bracket | Male | Female |
| Under 5 Years | 47 (13.5%) | 41 (9.3%) |
| 5 to 9 Years | 3 (0.9%) | 54 (12.2%) |
| 10 to 14 Years | 31 (8.9%) | 26 (5.9%) |
| 15 to 19 Years | 12 (3.5%) | 4 (0.9%) |
| 20 to 24 Years | 8 (2.3%) | 24 (5.4%) |
| 25 to 29 Years | 79 (22.8%) | 128 (28.9%) |
| 30 to 34 Years | 26 (7.5%) | 11 (2.5%) |
| 35 to 39 Years | 16 (4.6%) | 17 (3.8%) |
| 40 to 44 Years | 8 (2.3%) | 3 (0.7%) |
| 45 to 49 Years | 25 (7.2%) | 33 (7.4%) |
| 50 to 54 Years | 14 (4.0%) | 29 (6.6%) |
| 55 to 59 Years | 19 (5.5%) | 30 (6.8%) |
| 60 to 64 Years | 18 (5.2%) | 19 (4.3%) |
| 65 to 69 Years | 10 (2.9%) | 12 (2.7%) |
| 70 to 74 Years | 7 (2.0%) | 3 (0.7%) |
| 75 to 79 Years | 16 (4.6%) | 3 (0.7%) |
| 80 to 84 Years | 0 (0.0%) | 6 (1.3%) |
| 85 Years and over | 8 (2.3%) | 0 (0.0%) |
| Total | 347 (100.0%) | 443 (100.0%) |
Families and Households in Hinckley
Median Family Size in Hinckley
The median family size in Hinckley is 3.76 persons per family, with single female/mother families (4 | 2.1%) accounting for the largest median family size of 4.5 persons per family. On the other hand, single male/father families (41 | 21.1%) represent the smallest median family size with 2.54 persons per family.
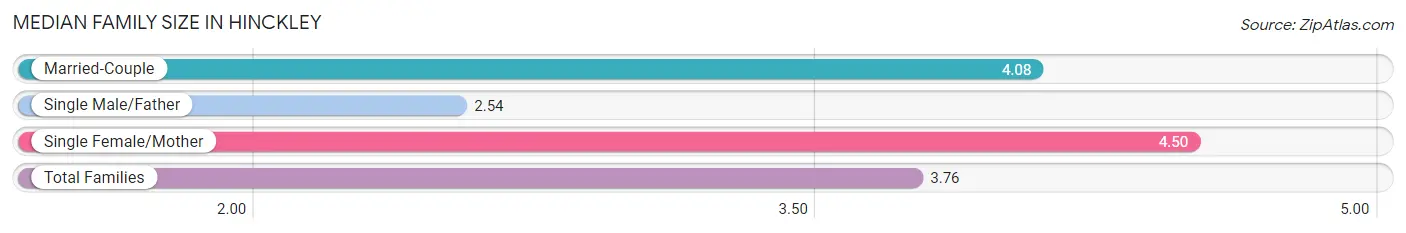
| Family Type | # Families | Family Size |
| Married-Couple | 149 (76.8%) | 4.08 |
| Single Male/Father | 41 (21.1%) | 2.54 |
| Single Female/Mother | 4 (2.1%) | 4.50 |
| Total Families | 194 (100.0%) | 3.76 |
Median Household Size in Hinckley
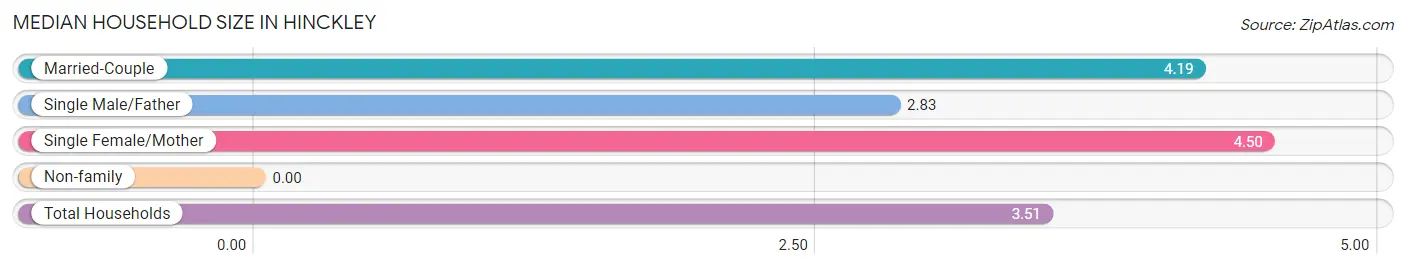
| Household Type | # Households | Household Size |
| Married-Couple | 149 (66.2%) | 4.19 |
| Single Male/Father | 41 (18.2%) | 2.83 |
| Single Female/Mother | 4 (1.8%) | 4.50 |
| Non-family | 31 (13.8%) | - |
| Total Households | 225 (100.0%) | 3.51 |
Household Size by Marriage Status in Hinckley
Out of a total of 225 households in Hinckley, 194 (86.2%) are family households, while 31 (13.8%) are nonfamily households. The most numerous type of family households are 2-person households, comprising 83, and the most common type of nonfamily households are 1-person households, comprising 31.
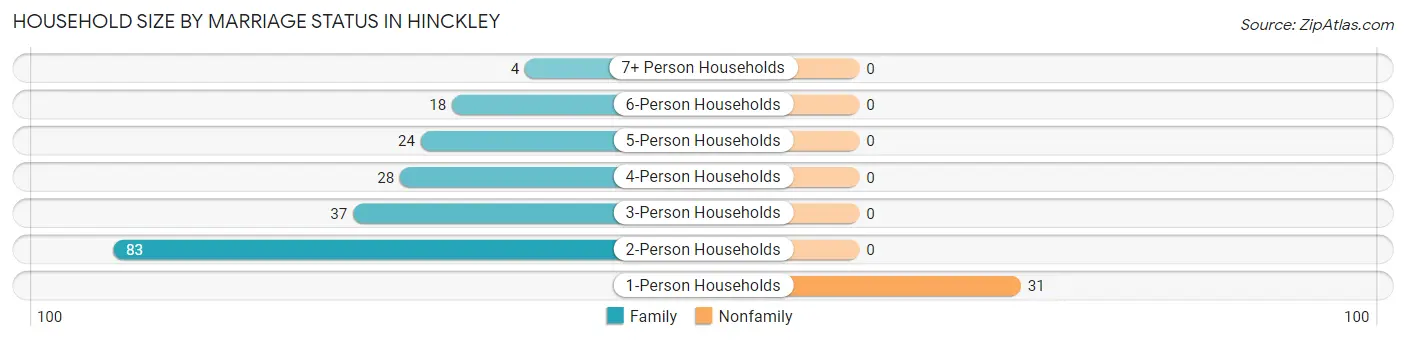
| Household Size | Family Households | Nonfamily Households |
| 1-Person Households | - | 31 (13.8%) |
| 2-Person Households | 83 (36.9%) | 0 (0.0%) |
| 3-Person Households | 37 (16.4%) | 0 (0.0%) |
| 4-Person Households | 28 (12.4%) | 0 (0.0%) |
| 5-Person Households | 24 (10.7%) | 0 (0.0%) |
| 6-Person Households | 18 (8.0%) | 0 (0.0%) |
| 7+ Person Households | 4 (1.8%) | 0 (0.0%) |
| Total | 194 (86.2%) | 31 (13.8%) |
Female Fertility in Hinckley
Fertility by Age in Hinckley
Average fertility rate in Hinckley is 26.0 births per 1,000 women. Women in the age bracket of 35 to 50 years have the highest fertility rate with 94.0 births per 1,000 women. Women in the age bracket of 35 to 50 years acount for 100.0% of all women with births.
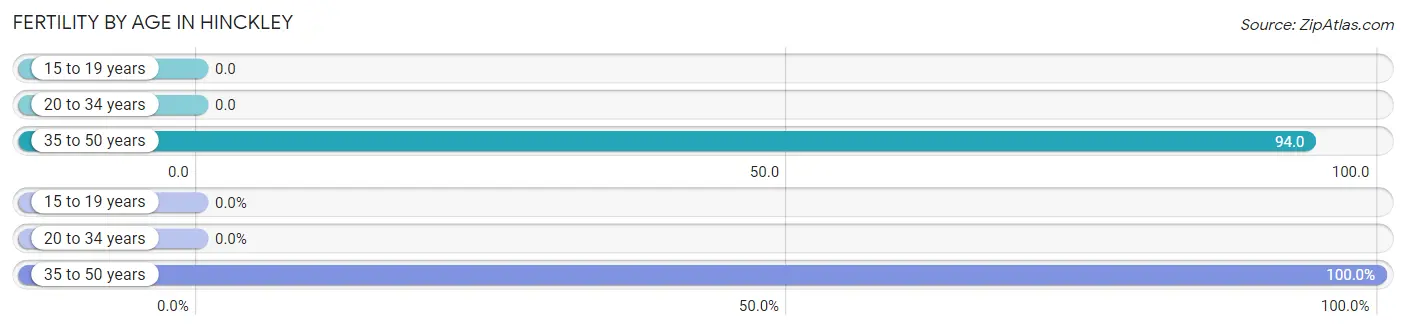
| Age Bracket | Women with Births | Births / 1,000 Women |
| 15 to 19 years | 0 (0.0%) | 0.0 |
| 20 to 34 years | 0 (0.0%) | 0.0 |
| 35 to 50 years | 6 (100.0%) | 94.0 |
| Total | 6 (100.0%) | 26.0 |
Fertility by Age by Marriage Status in Hinckley
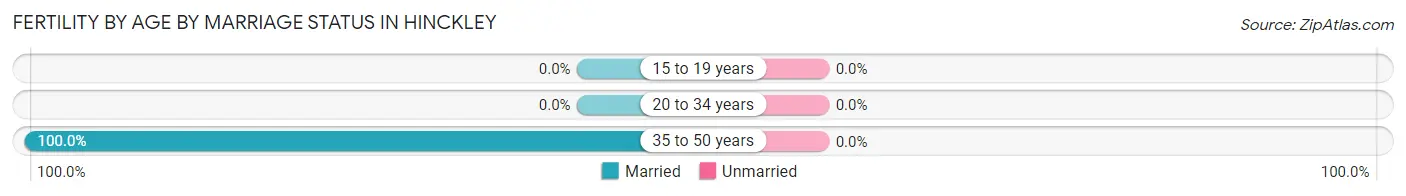
| Age Bracket | Married | Unmarried |
| 15 to 19 years | 0 (0.0%) | 0 (0.0%) |
| 20 to 34 years | 0 (0.0%) | 0 (0.0%) |
| 35 to 50 years | 6 (100.0%) | 0 (0.0%) |
| Total | 6 (100.0%) | 0 (0.0%) |
Fertility by Education in Hinckley
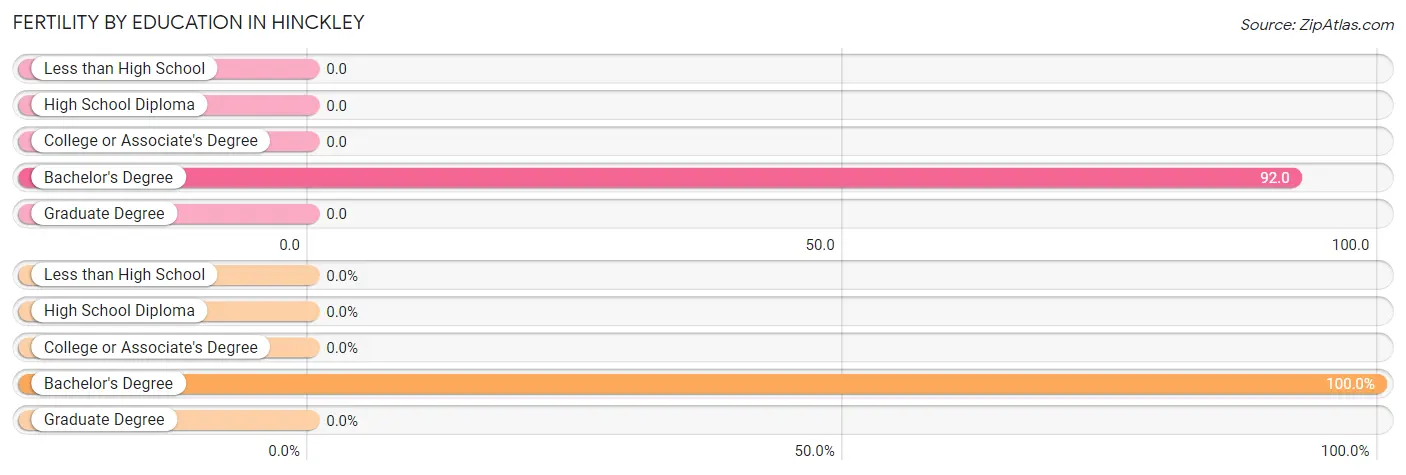
| Educational Attainment | Women with Births | Births / 1,000 Women |
| Less than High School | 0 (0.0%) | 0.0 |
| High School Diploma | 0 (0.0%) | 0.0 |
| College or Associate's Degree | 0 (0.0%) | 0.0 |
| Bachelor's Degree | 6 (100.0%) | 92.0 |
| Graduate Degree | 0 (0.0%) | 0.0 |
| Total | 6 (100.0%) | 26.0 |
Fertility by Education by Marriage Status in Hinckley
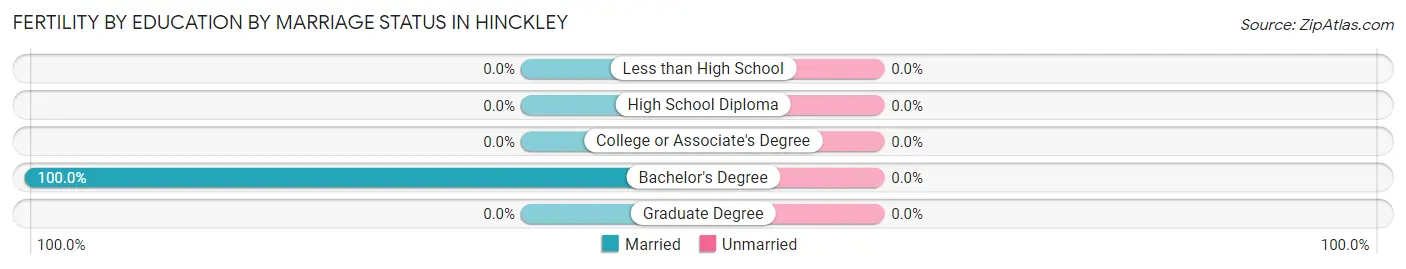
| Educational Attainment | Married | Unmarried |
| Less than High School | 0 (0.0%) | 0 (0.0%) |
| High School Diploma | 0 (0.0%) | 0 (0.0%) |
| College or Associate's Degree | 0 (0.0%) | 0 (0.0%) |
| Bachelor's Degree | 6 (100.0%) | 0 (0.0%) |
| Graduate Degree | 0 (0.0%) | 0 (0.0%) |
| Total | 6 (100.0%) | 0 (0.0%) |
Employment Characteristics in Hinckley
Employment by Class of Employer in Hinckley
Among the 442 employed individuals in Hinckley, private company employees (271 | 61.3%), state government employees (58 | 13.1%), and local government employees (56 | 12.7%) make up the most common classes of employment.
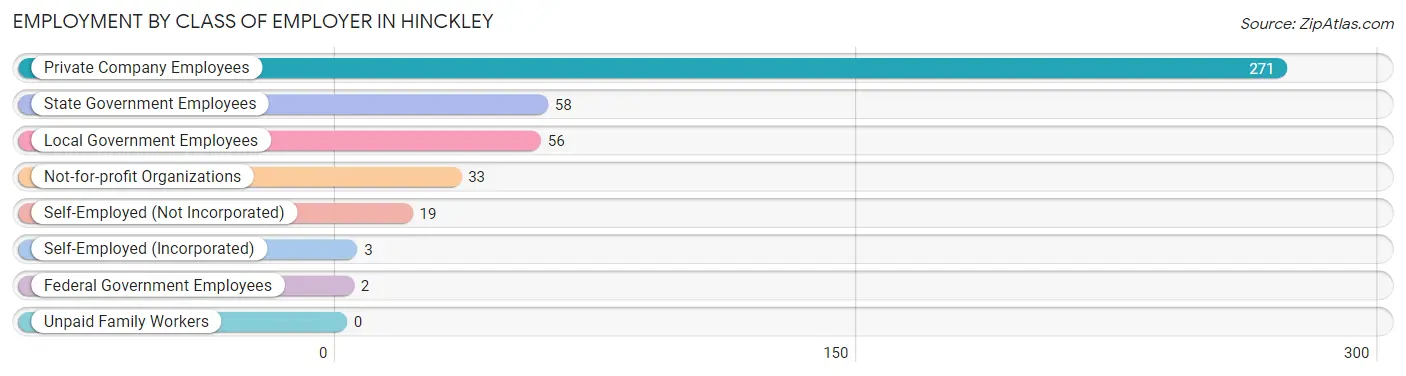
| Employer Class | # Employees | % Employees |
| Private Company Employees | 271 | 61.3% |
| Self-Employed (Incorporated) | 3 | 0.7% |
| Self-Employed (Not Incorporated) | 19 | 4.3% |
| Not-for-profit Organizations | 33 | 7.5% |
| Local Government Employees | 56 | 12.7% |
| State Government Employees | 58 | 13.1% |
| Federal Government Employees | 2 | 0.4% |
| Unpaid Family Workers | 0 | 0.0% |
| Total | 442 | 100.0% |
Employment Status by Age in Hinckley
According to the labor force statistics for Hinckley, out of the total population over 16 years of age (585), 78.3% or 458 individuals are in the labor force, with 3.5% or 16 of them unemployed. The age group with the highest labor force participation rate is 30 to 34 years, with 100.0% or 37 individuals in the labor force. Within the labor force, the 16 to 19 years age range has the highest percentage of unemployed individuals, with 25.0% or 3 of them being unemployed.
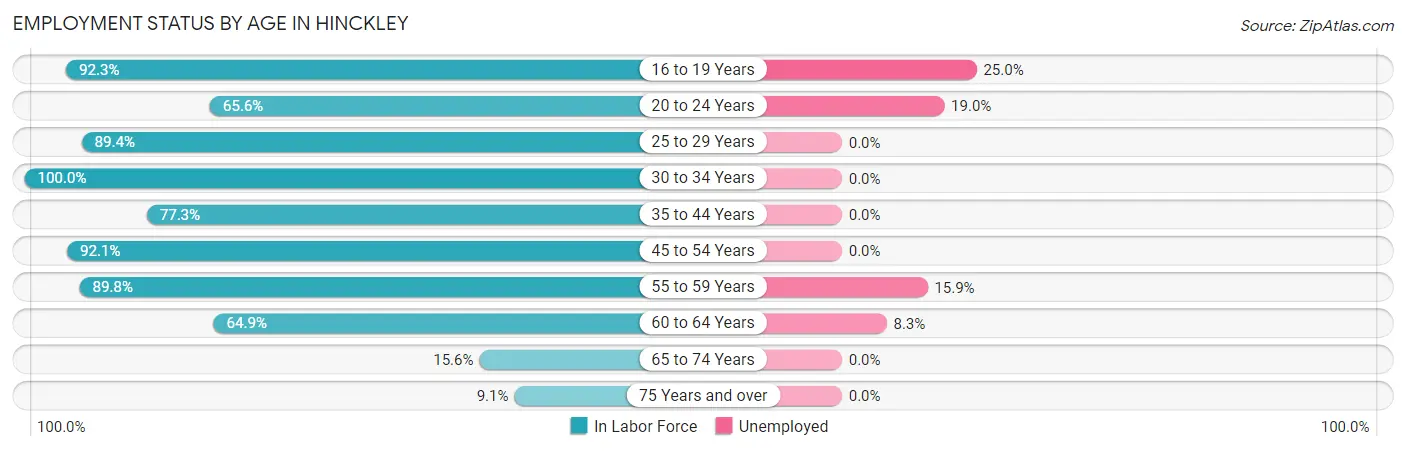
| Age Bracket | In Labor Force | Unemployed |
| 16 to 19 Years | 12 (92.3%) | 3 (25.0%) |
| 20 to 24 Years | 21 (65.6%) | 4 (19.0%) |
| 25 to 29 Years | 185 (89.4%) | 0 (0.0%) |
| 30 to 34 Years | 37 (100.0%) | 0 (0.0%) |
| 35 to 44 Years | 34 (77.3%) | 0 (0.0%) |
| 45 to 54 Years | 93 (92.1%) | 0 (0.0%) |
| 55 to 59 Years | 44 (89.8%) | 7 (15.9%) |
| 60 to 64 Years | 24 (64.9%) | 2 (8.3%) |
| 65 to 74 Years | 5 (15.6%) | 0 (0.0%) |
| 75 Years and over | 3 (9.1%) | 0 (0.0%) |
| Total | 458 (78.3%) | 16 (3.5%) |
Employment Status by Educational Attainment in Hinckley
According to labor force statistics for Hinckley, 87.8% of individuals (417) out of the total population between 25 and 64 years of age (475) are in the labor force, with 2.2% or 9 of them being unemployed. The group with the highest labor force participation rate are those with the educational attainment of bachelor's degree or higher, with 100.0% or 95 individuals in the labor force. Within the labor force, individuals with college / associate degree education have the highest percentage of unemployment, with 9.3% or 7 of them being unemployed.
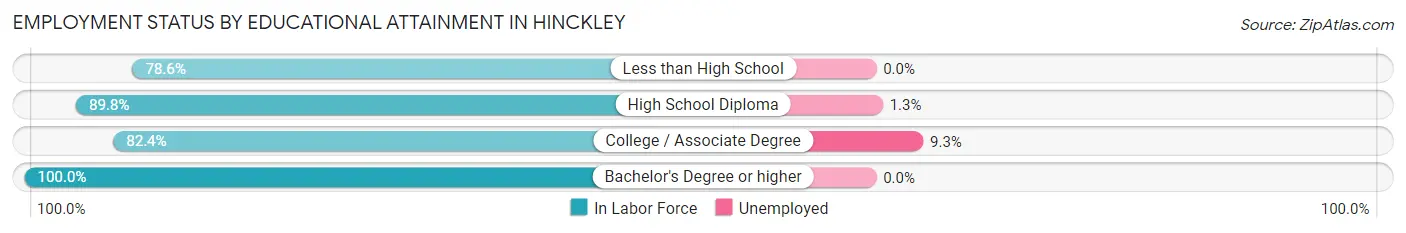
| Educational Attainment | In Labor Force | Unemployed |
| Less than High School | 88 (78.6%) | 0 (0.0%) |
| High School Diploma | 159 (89.8%) | 2 (1.3%) |
| College / Associate Degree | 75 (82.4%) | 8 (9.3%) |
| Bachelor's Degree or higher | 95 (100.0%) | 0 (0.0%) |
| Total | 417 (87.8%) | 10 (2.2%) |
Employment Occupations by Sex in Hinckley
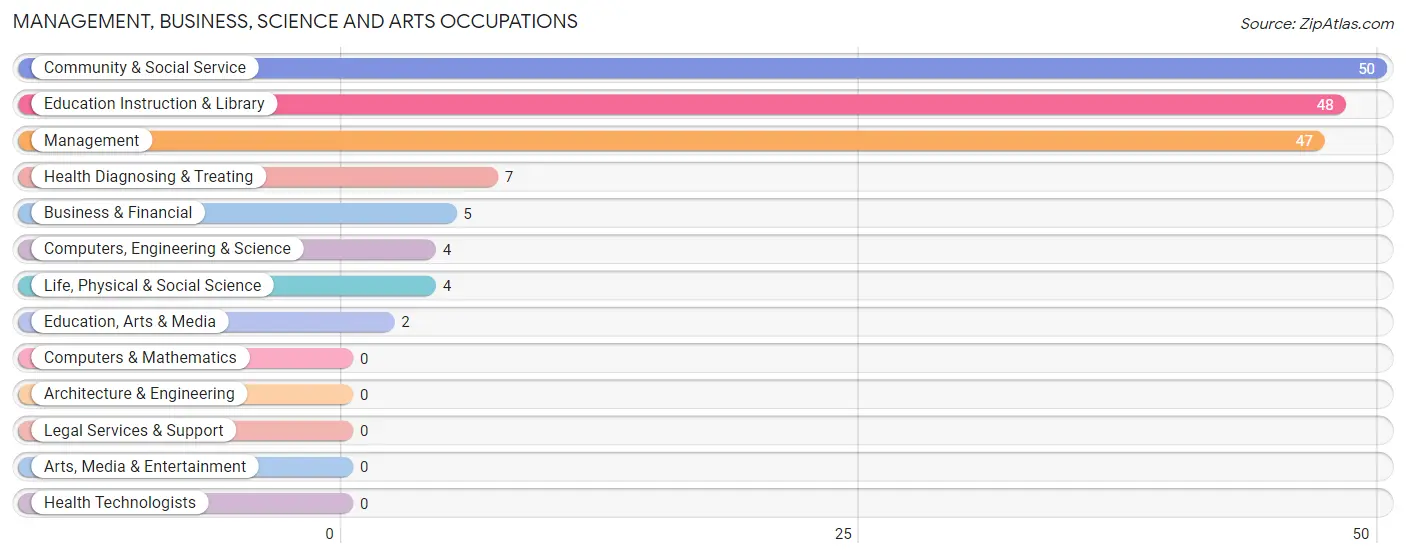
Management, Business, Science and Arts Occupations
The most common Management, Business, Science and Arts occupations in Hinckley are Community & Social Service (50 | 11.3%), Education Instruction & Library (48 | 10.9%), Management (47 | 10.6%), Health Diagnosing & Treating (7 | 1.6%), and Business & Financial (5 | 1.1%).
Management, Business, Science and Arts Occupations by Sex
Within the Management, Business, Science and Arts occupations in Hinckley, the most male-oriented occupations are Computers, Engineering & Science (100.0%), Life, Physical & Social Science (100.0%), and Management (72.3%), while the most female-oriented occupations are Business & Financial (100.0%), Education, Arts & Media (100.0%), and Health Diagnosing & Treating (100.0%).
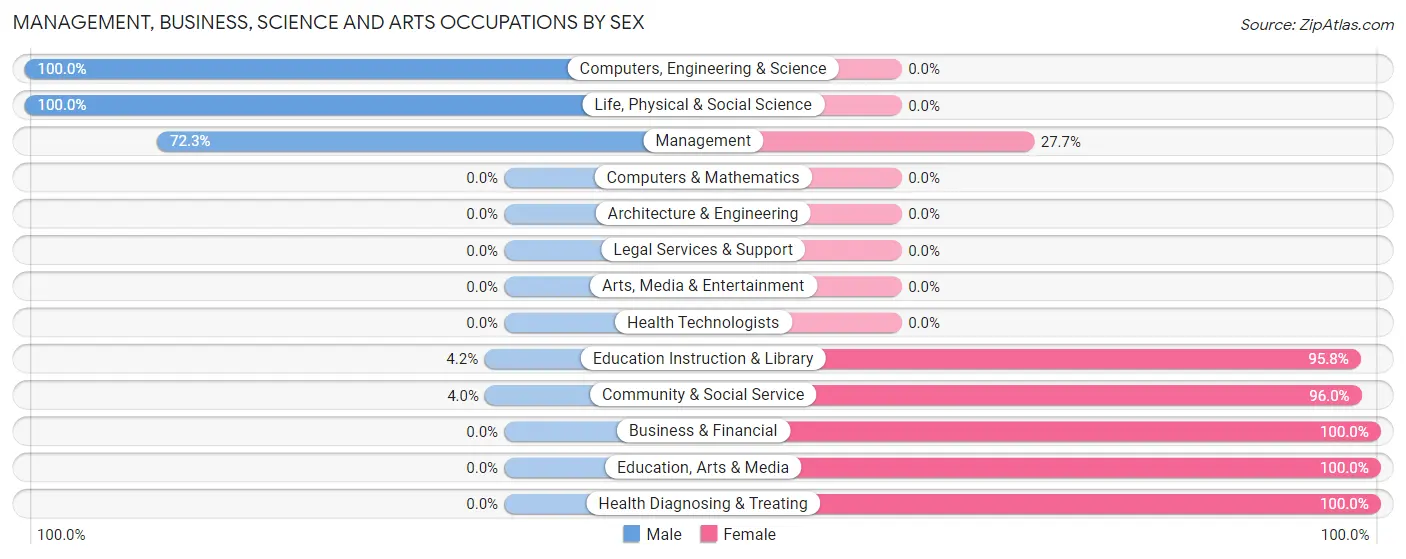
| Occupation | Male | Female |
| Management | 34 (72.3%) | 13 (27.7%) |
| Business & Financial | 0 (0.0%) | 5 (100.0%) |
| Computers, Engineering & Science | 4 (100.0%) | 0 (0.0%) |
| Computers & Mathematics | 0 (0.0%) | 0 (0.0%) |
| Architecture & Engineering | 0 (0.0%) | 0 (0.0%) |
| Life, Physical & Social Science | 4 (100.0%) | 0 (0.0%) |
| Community & Social Service | 2 (4.0%) | 48 (96.0%) |
| Education, Arts & Media | 0 (0.0%) | 2 (100.0%) |
| Legal Services & Support | 0 (0.0%) | 0 (0.0%) |
| Education Instruction & Library | 2 (4.2%) | 46 (95.8%) |
| Arts, Media & Entertainment | 0 (0.0%) | 0 (0.0%) |
| Health Diagnosing & Treating | 0 (0.0%) | 7 (100.0%) |
| Health Technologists | 0 (0.0%) | 0 (0.0%) |
| Total (Category) | 40 (35.4%) | 73 (64.6%) |
| Total (Overall) | 224 (50.7%) | 218 (49.3%) |
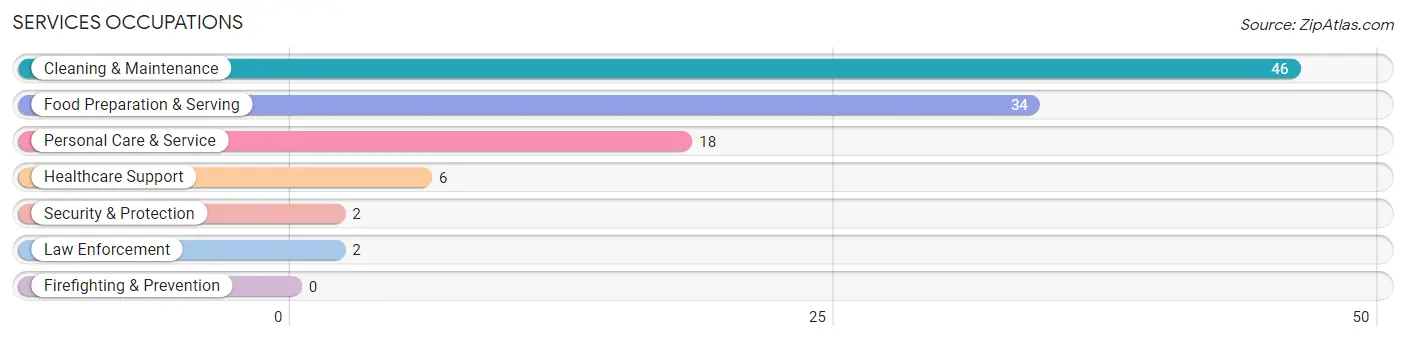
Services Occupations
The most common Services occupations in Hinckley are Cleaning & Maintenance (46 | 10.4%), Food Preparation & Serving (34 | 7.7%), Personal Care & Service (18 | 4.1%), Healthcare Support (6 | 1.4%), and Security & Protection (2 | 0.4%).
Services Occupations by Sex
Within the Services occupations in Hinckley, the most male-oriented occupations are Security & Protection (100.0%), Law Enforcement (100.0%), and Cleaning & Maintenance (65.2%), while the most female-oriented occupations are Healthcare Support (100.0%), Food Preparation & Serving (100.0%), and Personal Care & Service (100.0%).
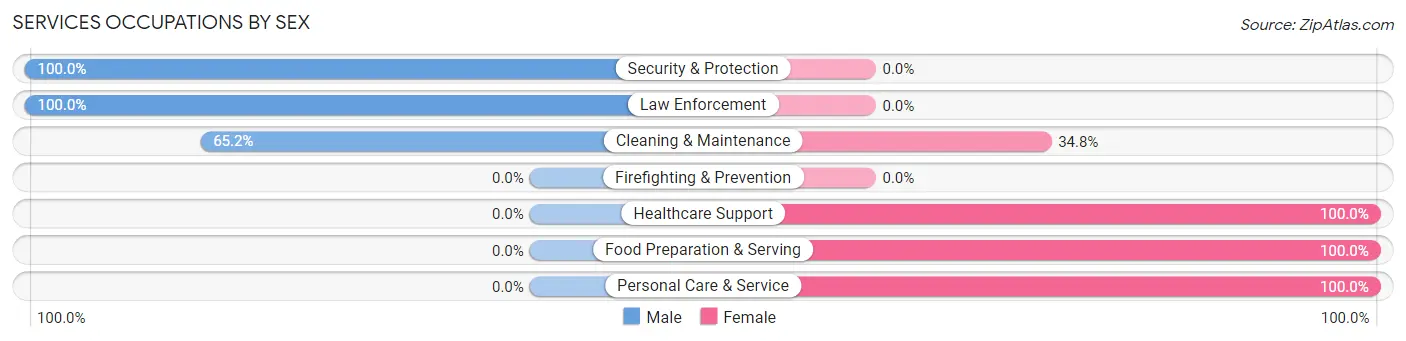
| Occupation | Male | Female |
| Healthcare Support | 0 (0.0%) | 6 (100.0%) |
| Security & Protection | 2 (100.0%) | 0 (0.0%) |
| Firefighting & Prevention | 0 (0.0%) | 0 (0.0%) |
| Law Enforcement | 2 (100.0%) | 0 (0.0%) |
| Food Preparation & Serving | 0 (0.0%) | 34 (100.0%) |
| Cleaning & Maintenance | 30 (65.2%) | 16 (34.8%) |
| Personal Care & Service | 0 (0.0%) | 18 (100.0%) |
| Total (Category) | 32 (30.2%) | 74 (69.8%) |
| Total (Overall) | 224 (50.7%) | 218 (49.3%) |
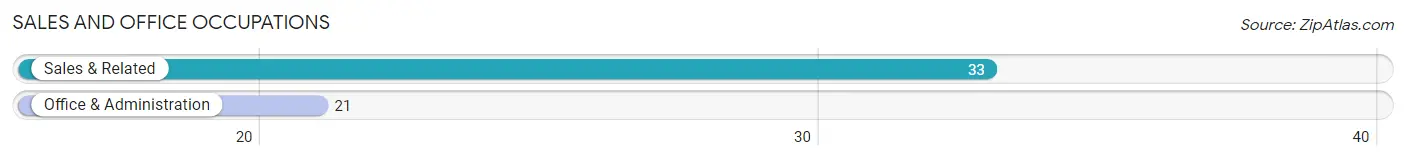
Sales and Office Occupations
The most common Sales and Office occupations in Hinckley are Sales & Related (33 | 7.5%), and Office & Administration (21 | 4.8%).
Sales and Office Occupations by Sex
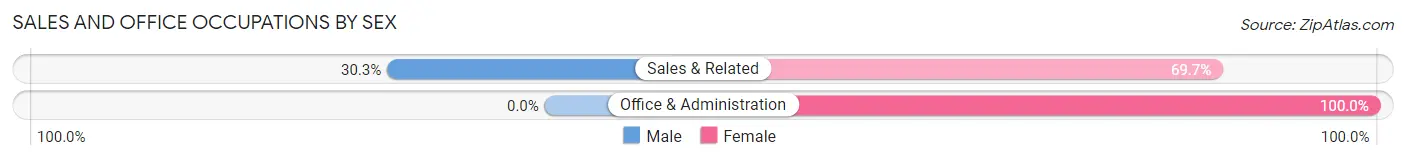
| Occupation | Male | Female |
| Sales & Related | 10 (30.3%) | 23 (69.7%) |
| Office & Administration | 0 (0.0%) | 21 (100.0%) |
| Total (Category) | 10 (18.5%) | 44 (81.5%) |
| Total (Overall) | 224 (50.7%) | 218 (49.3%) |
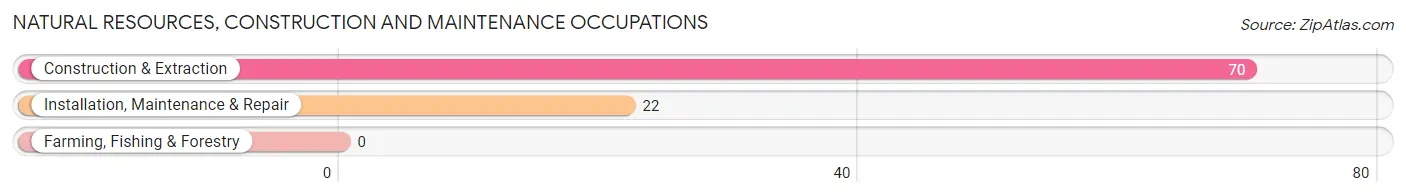
Natural Resources, Construction and Maintenance Occupations
The most common Natural Resources, Construction and Maintenance occupations in Hinckley are Construction & Extraction (70 | 15.8%), and Installation, Maintenance & Repair (22 | 5.0%).
Natural Resources, Construction and Maintenance Occupations by Sex
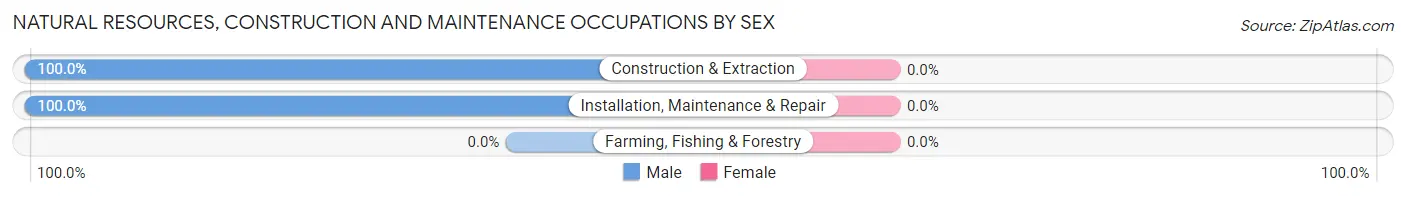
| Occupation | Male | Female |
| Farming, Fishing & Forestry | 0 (0.0%) | 0 (0.0%) |
| Construction & Extraction | 70 (100.0%) | 0 (0.0%) |
| Installation, Maintenance & Repair | 22 (100.0%) | 0 (0.0%) |
| Total (Category) | 92 (100.0%) | 0 (0.0%) |
| Total (Overall) | 224 (50.7%) | 218 (49.3%) |
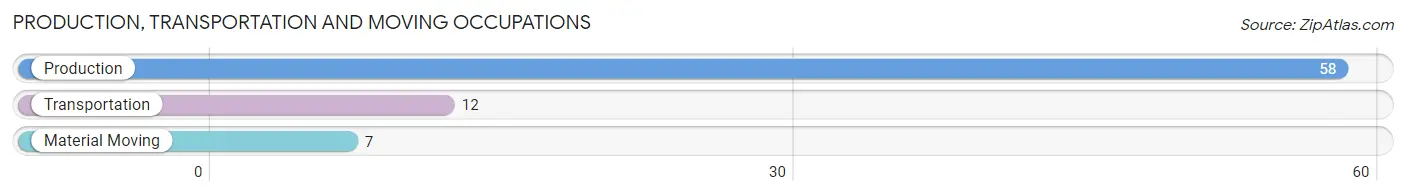
Production, Transportation and Moving Occupations
The most common Production, Transportation and Moving occupations in Hinckley are Production (58 | 13.1%), Transportation (12 | 2.7%), and Material Moving (7 | 1.6%).
Production, Transportation and Moving Occupations by Sex
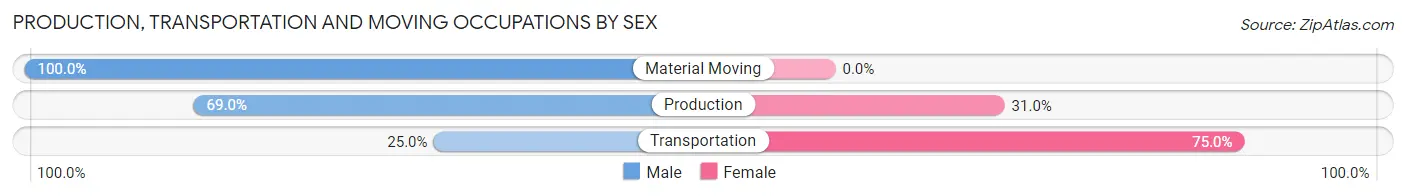
| Occupation | Male | Female |
| Production | 40 (69.0%) | 18 (31.0%) |
| Transportation | 3 (25.0%) | 9 (75.0%) |
| Material Moving | 7 (100.0%) | 0 (0.0%) |
| Total (Category) | 50 (64.9%) | 27 (35.1%) |
| Total (Overall) | 224 (50.7%) | 218 (49.3%) |
Employment Industries by Sex in Hinckley
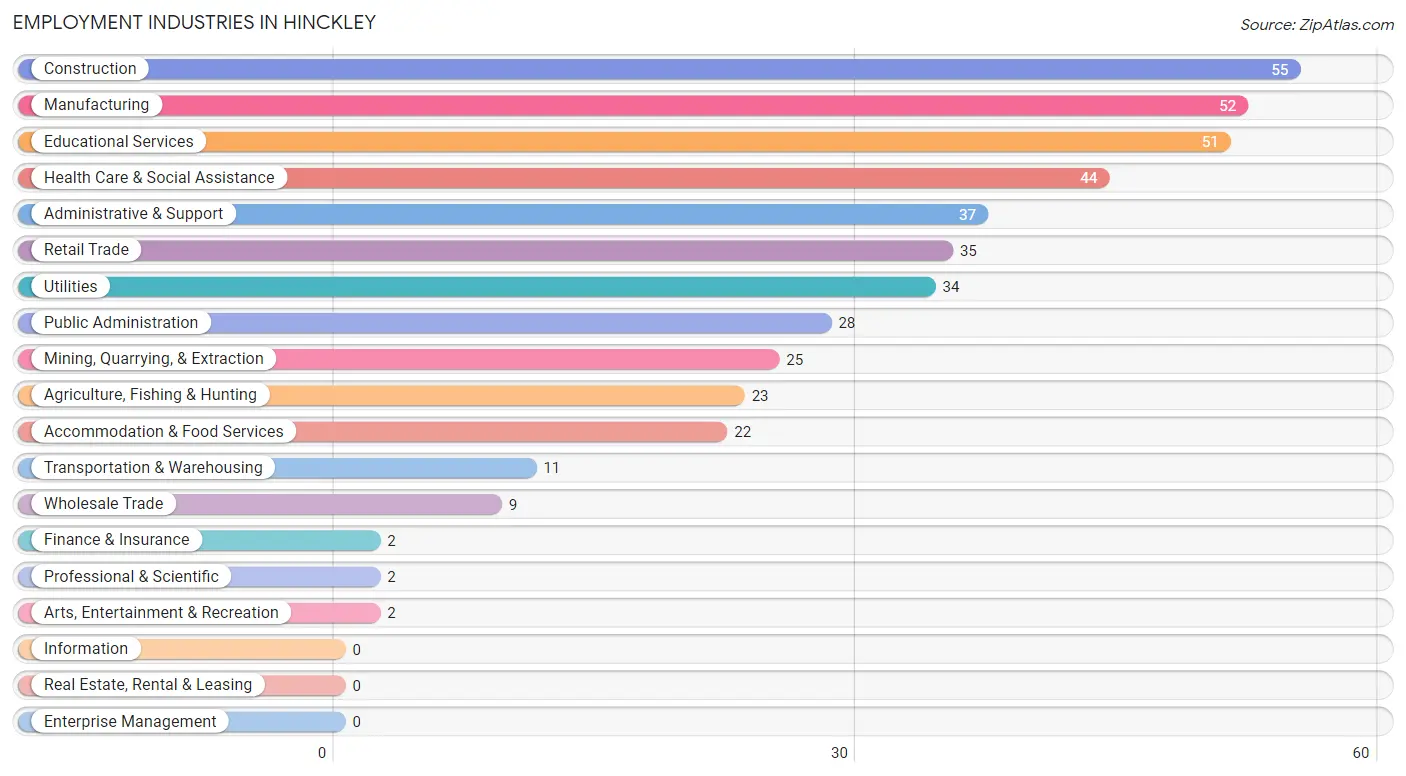
Employment Industries in Hinckley
The major employment industries in Hinckley include Construction (55 | 12.4%), Manufacturing (52 | 11.8%), Educational Services (51 | 11.5%), Health Care & Social Assistance (44 | 10.0%), and Administrative & Support (37 | 8.4%).
Employment Industries by Sex in Hinckley
The Hinckley industries that see more men than women are Construction (100.0%), Wholesale Trade (100.0%), and Professional & Scientific (100.0%), whereas the industries that tend to have a higher number of women are Finance & Insurance (100.0%), Arts, Entertainment & Recreation (100.0%), and Accommodation & Food Services (100.0%).
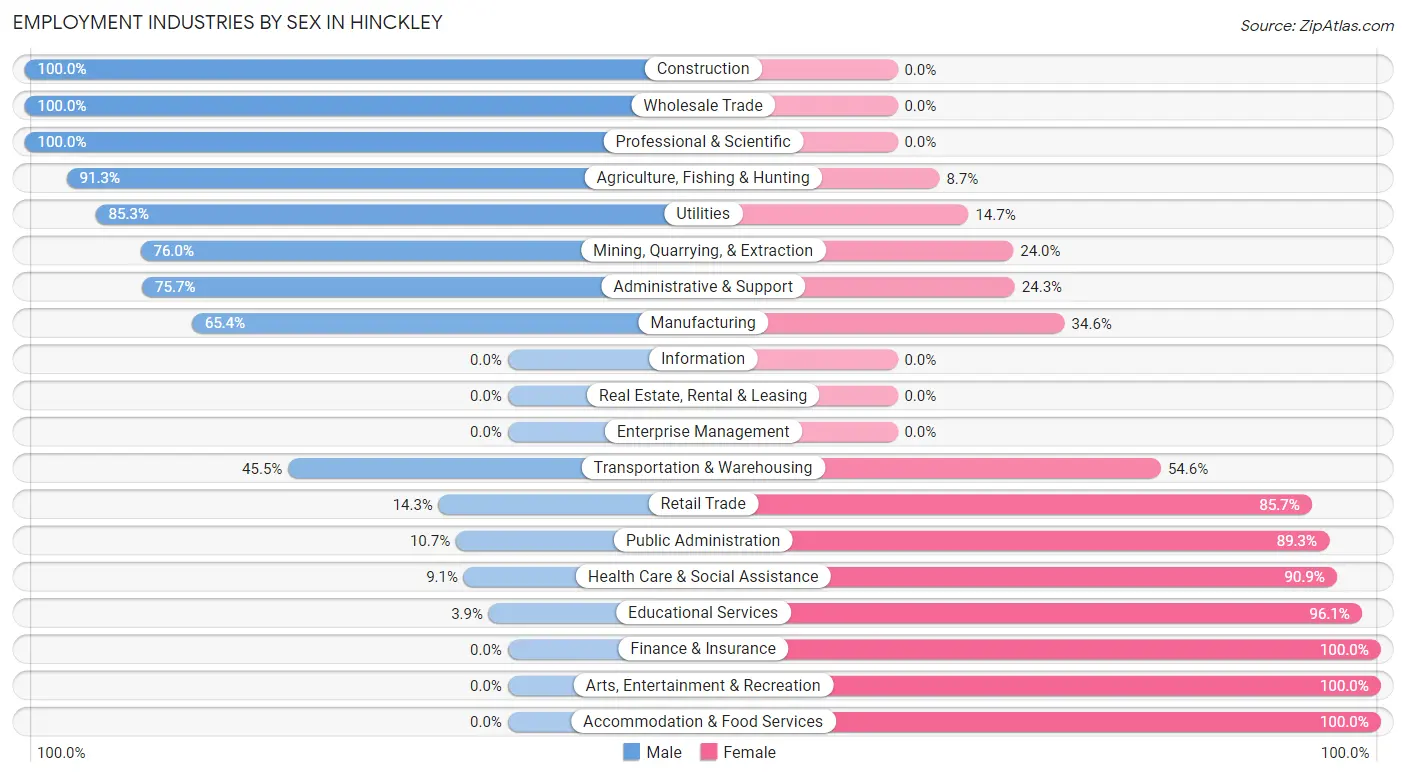
| Industry | Male | Female |
| Agriculture, Fishing & Hunting | 21 (91.3%) | 2 (8.7%) |
| Mining, Quarrying, & Extraction | 19 (76.0%) | 6 (24.0%) |
| Construction | 55 (100.0%) | 0 (0.0%) |
| Manufacturing | 34 (65.4%) | 18 (34.6%) |
| Wholesale Trade | 9 (100.0%) | 0 (0.0%) |
| Retail Trade | 5 (14.3%) | 30 (85.7%) |
| Transportation & Warehousing | 5 (45.5%) | 6 (54.5%) |
| Utilities | 29 (85.3%) | 5 (14.7%) |
| Information | 0 (0.0%) | 0 (0.0%) |
| Finance & Insurance | 0 (0.0%) | 2 (100.0%) |
| Real Estate, Rental & Leasing | 0 (0.0%) | 0 (0.0%) |
| Professional & Scientific | 2 (100.0%) | 0 (0.0%) |
| Enterprise Management | 0 (0.0%) | 0 (0.0%) |
| Administrative & Support | 28 (75.7%) | 9 (24.3%) |
| Educational Services | 2 (3.9%) | 49 (96.1%) |
| Health Care & Social Assistance | 4 (9.1%) | 40 (90.9%) |
| Arts, Entertainment & Recreation | 0 (0.0%) | 2 (100.0%) |
| Accommodation & Food Services | 0 (0.0%) | 22 (100.0%) |
| Public Administration | 3 (10.7%) | 25 (89.3%) |
| Total | 224 (50.7%) | 218 (49.3%) |
Education in Hinckley
School Enrollment in Hinckley
The most common levels of schooling among the 138 students in Hinckley are elementary school (78 | 56.5%), middle school (28 | 20.3%), and college / undergraduate (13 | 9.4%).
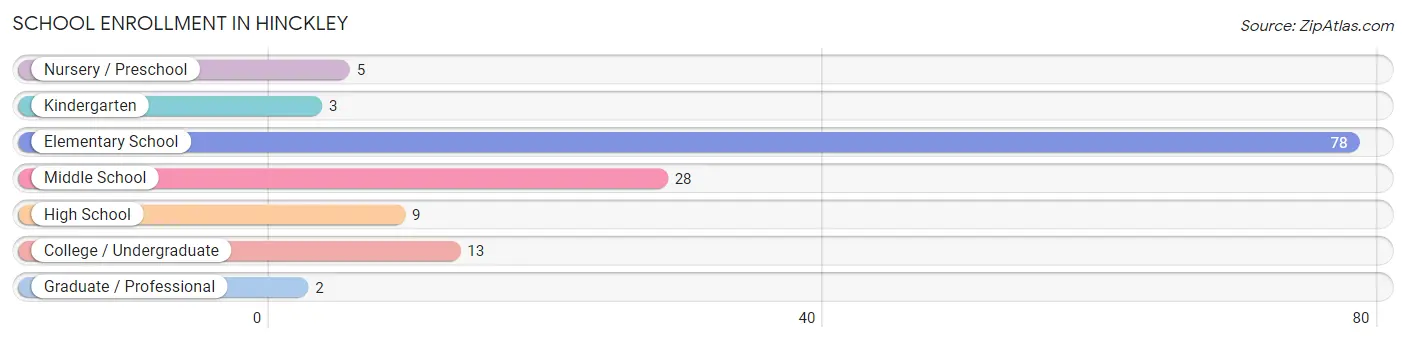
| School Level | # Students | % Students |
| Nursery / Preschool | 5 | 3.6% |
| Kindergarten | 3 | 2.2% |
| Elementary School | 78 | 56.5% |
| Middle School | 28 | 20.3% |
| High School | 9 | 6.5% |
| College / Undergraduate | 13 | 9.4% |
| Graduate / Professional | 2 | 1.5% |
| Total | 138 | 100.0% |
School Enrollment by Age by Funding Source in Hinckley
Out of a total of 138 students who are enrolled in schools in Hinckley, 22 (15.9%) attend a private institution, while the remaining 116 (84.1%) are enrolled in public schools. The age group of 20 to 24 year olds has the highest likelihood of being enrolled in private schools, with 11 (100.0% in the age bracket) enrolled. Conversely, the age group of 5 to 9 year old has the lowest likelihood of being enrolled in a private school, with 57 (100.0% in the age bracket) attending a public institution.
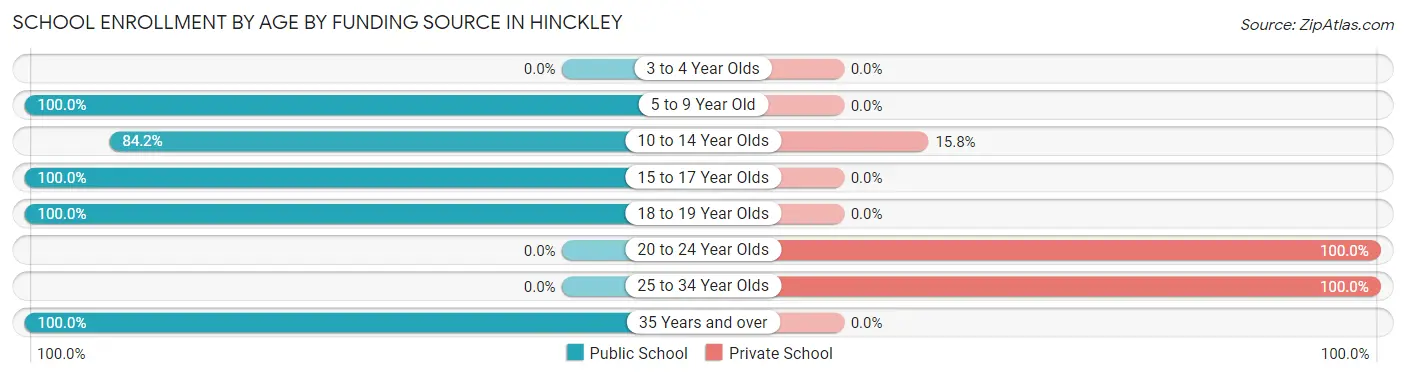
| Age Bracket | Public School | Private School |
| 3 to 4 Year Olds | 0 (0.0%) | 0 (0.0%) |
| 5 to 9 Year Old | 57 (100.0%) | 0 (0.0%) |
| 10 to 14 Year Olds | 48 (84.2%) | 9 (15.8%) |
| 15 to 17 Year Olds | 6 (100.0%) | 0 (0.0%) |
| 18 to 19 Year Olds | 3 (100.0%) | 0 (0.0%) |
| 20 to 24 Year Olds | 0 (0.0%) | 11 (100.0%) |
| 25 to 34 Year Olds | 0 (0.0%) | 2 (100.0%) |
| 35 Years and over | 2 (100.0%) | 0 (0.0%) |
| Total | 116 (84.1%) | 22 (15.9%) |
Educational Attainment by Field of Study in Hinckley
Visual & performing arts (46 | 40.4%), bio, nature & agricultural (15 | 13.2%), arts & humanities (13 | 11.4%), business (11 | 9.7%), and education (7 | 6.1%) are the most common fields of study among 114 individuals in Hinckley who have obtained a bachelor's degree or higher.
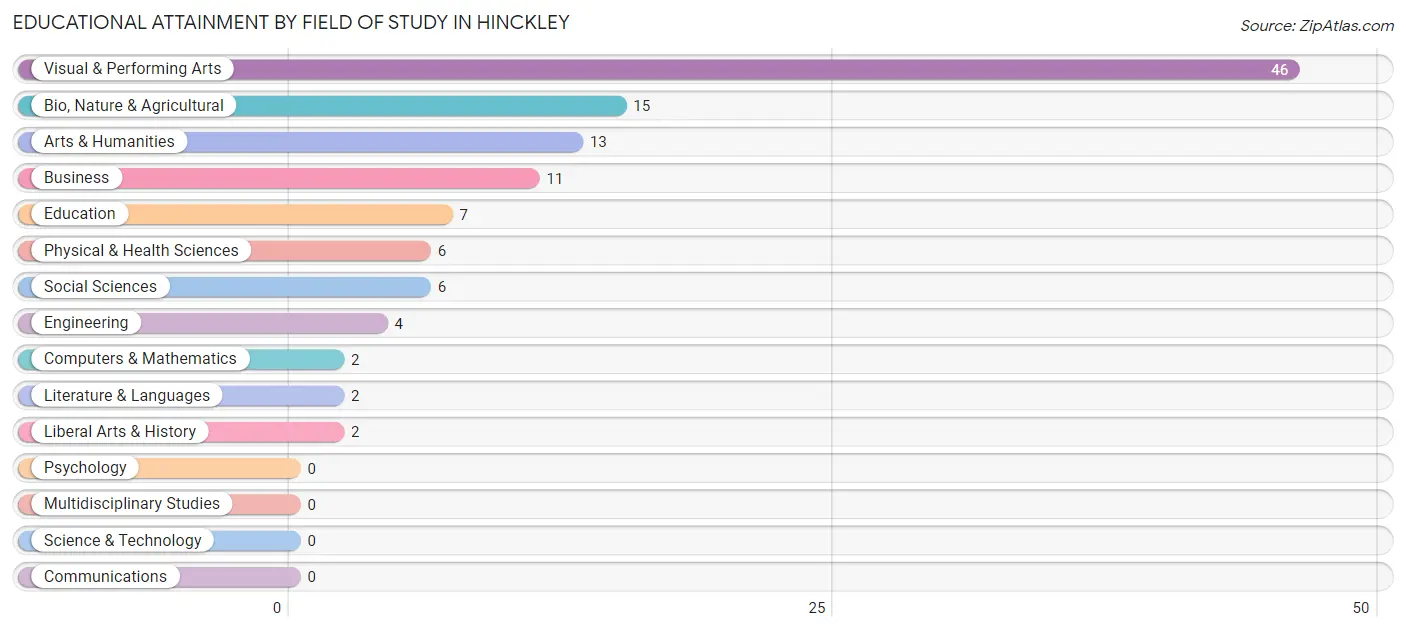
| Field of Study | # Graduates | % Graduates |
| Computers & Mathematics | 2 | 1.8% |
| Bio, Nature & Agricultural | 15 | 13.2% |
| Physical & Health Sciences | 6 | 5.3% |
| Psychology | 0 | 0.0% |
| Social Sciences | 6 | 5.3% |
| Engineering | 4 | 3.5% |
| Multidisciplinary Studies | 0 | 0.0% |
| Science & Technology | 0 | 0.0% |
| Business | 11 | 9.7% |
| Education | 7 | 6.1% |
| Literature & Languages | 2 | 1.8% |
| Liberal Arts & History | 2 | 1.8% |
| Visual & Performing Arts | 46 | 40.4% |
| Communications | 0 | 0.0% |
| Arts & Humanities | 13 | 11.4% |
| Total | 114 | 100.0% |
Transportation & Commute in Hinckley
Vehicle Availability by Sex in Hinckley
The most prevalent vehicle ownership categories in Hinckley are males with 3 vehicles (96, accounting for 42.9%) and females with 3 vehicles (75, making up 44.0%).
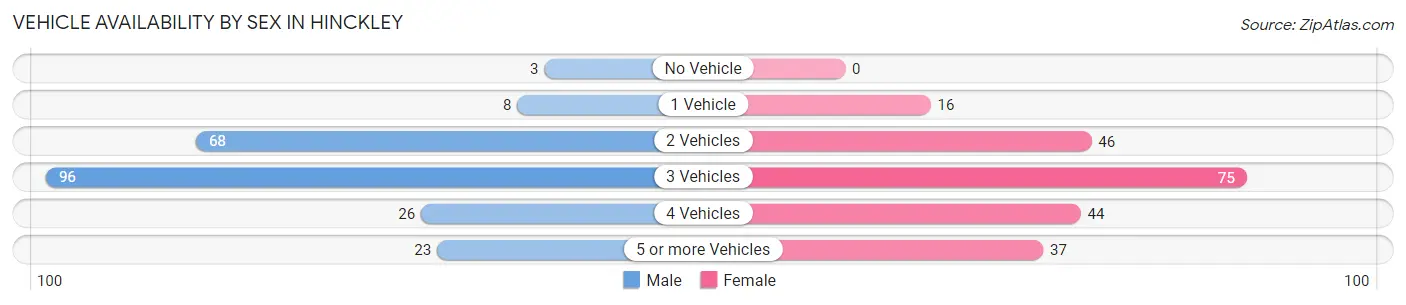
| Vehicles Available | Male | Female |
| No Vehicle | 3 (1.3%) | 0 (0.0%) |
| 1 Vehicle | 8 (3.6%) | 16 (7.3%) |
| 2 Vehicles | 68 (30.4%) | 46 (21.1%) |
| 3 Vehicles | 96 (42.9%) | 75 (34.4%) |
| 4 Vehicles | 26 (11.6%) | 44 (20.2%) |
| 5 or more Vehicles | 23 (10.3%) | 37 (17.0%) |
| Total | 224 (100.0%) | 218 (100.0%) |
Commute Time in Hinckley
The most frequently occuring commute durations in Hinckley are 10 to 14 minutes (160 commuters, 36.9%), 20 to 24 minutes (89 commuters, 20.5%), and 15 to 19 minutes (49 commuters, 11.3%).
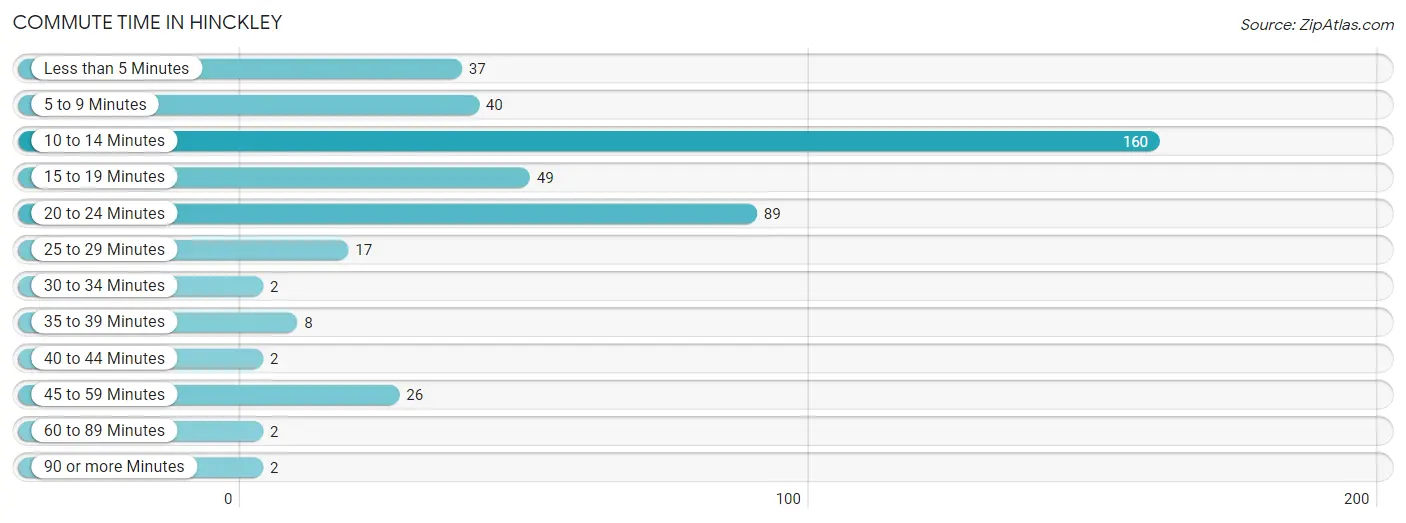
| Commute Time | # Commuters | % Commuters |
| Less than 5 Minutes | 37 | 8.5% |
| 5 to 9 Minutes | 40 | 9.2% |
| 10 to 14 Minutes | 160 | 36.9% |
| 15 to 19 Minutes | 49 | 11.3% |
| 20 to 24 Minutes | 89 | 20.5% |
| 25 to 29 Minutes | 17 | 3.9% |
| 30 to 34 Minutes | 2 | 0.5% |
| 35 to 39 Minutes | 8 | 1.8% |
| 40 to 44 Minutes | 2 | 0.5% |
| 45 to 59 Minutes | 26 | 6.0% |
| 60 to 89 Minutes | 2 | 0.5% |
| 90 or more Minutes | 2 | 0.5% |
Commute Time by Sex in Hinckley
The most common commute times in Hinckley are 20 to 24 minutes (73 commuters, 32.6%) for males and 10 to 14 minutes (137 commuters, 65.2%) for females.
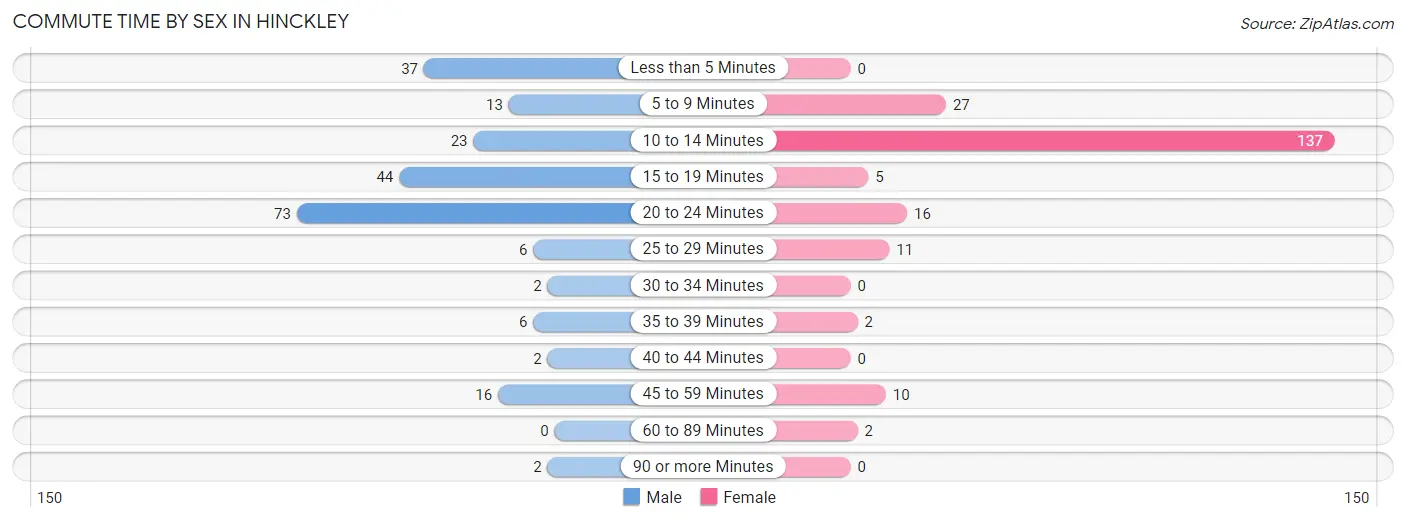
| Commute Time | Male | Female |
| Less than 5 Minutes | 37 (16.5%) | 0 (0.0%) |
| 5 to 9 Minutes | 13 (5.8%) | 27 (12.9%) |
| 10 to 14 Minutes | 23 (10.3%) | 137 (65.2%) |
| 15 to 19 Minutes | 44 (19.6%) | 5 (2.4%) |
| 20 to 24 Minutes | 73 (32.6%) | 16 (7.6%) |
| 25 to 29 Minutes | 6 (2.7%) | 11 (5.2%) |
| 30 to 34 Minutes | 2 (0.9%) | 0 (0.0%) |
| 35 to 39 Minutes | 6 (2.7%) | 2 (0.9%) |
| 40 to 44 Minutes | 2 (0.9%) | 0 (0.0%) |
| 45 to 59 Minutes | 16 (7.1%) | 10 (4.8%) |
| 60 to 89 Minutes | 0 (0.0%) | 2 (0.9%) |
| 90 or more Minutes | 2 (0.9%) | 0 (0.0%) |
Time of Departure to Work by Sex in Hinckley
The most frequent times of departure to work in Hinckley are 12:00 AM to 4:59 AM (57, 25.5%) for males and 7:30 AM to 7:59 AM (75, 35.7%) for females.
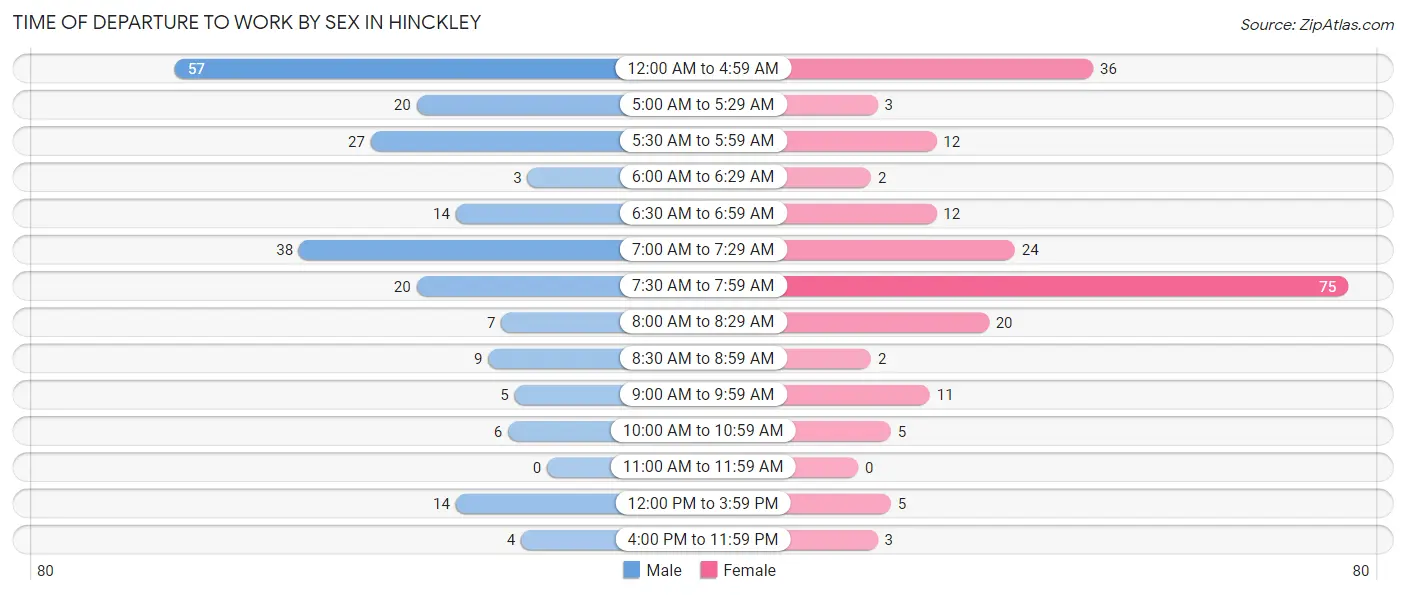
| Time of Departure | Male | Female |
| 12:00 AM to 4:59 AM | 57 (25.5%) | 36 (17.1%) |
| 5:00 AM to 5:29 AM | 20 (8.9%) | 3 (1.4%) |
| 5:30 AM to 5:59 AM | 27 (12.0%) | 12 (5.7%) |
| 6:00 AM to 6:29 AM | 3 (1.3%) | 2 (0.9%) |
| 6:30 AM to 6:59 AM | 14 (6.2%) | 12 (5.7%) |
| 7:00 AM to 7:29 AM | 38 (17.0%) | 24 (11.4%) |
| 7:30 AM to 7:59 AM | 20 (8.9%) | 75 (35.7%) |
| 8:00 AM to 8:29 AM | 7 (3.1%) | 20 (9.5%) |
| 8:30 AM to 8:59 AM | 9 (4.0%) | 2 (0.9%) |
| 9:00 AM to 9:59 AM | 5 (2.2%) | 11 (5.2%) |
| 10:00 AM to 10:59 AM | 6 (2.7%) | 5 (2.4%) |
| 11:00 AM to 11:59 AM | 0 (0.0%) | 0 (0.0%) |
| 12:00 PM to 3:59 PM | 14 (6.2%) | 5 (2.4%) |
| 4:00 PM to 11:59 PM | 4 (1.8%) | 3 (1.4%) |
| Total | 224 (100.0%) | 210 (100.0%) |
Housing Occupancy in Hinckley
Occupancy by Ownership in Hinckley
Of the total 225 dwellings in Hinckley, owner-occupied units account for 141 (62.7%), while renter-occupied units make up 84 (37.3%).
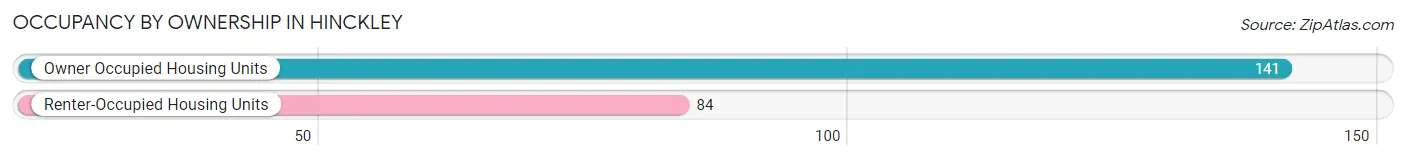
| Occupancy | # Housing Units | % Housing Units |
| Owner Occupied Housing Units | 141 | 62.7% |
| Renter-Occupied Housing Units | 84 | 37.3% |
| Total Occupied Housing Units | 225 | 100.0% |
Occupancy by Household Size in Hinckley
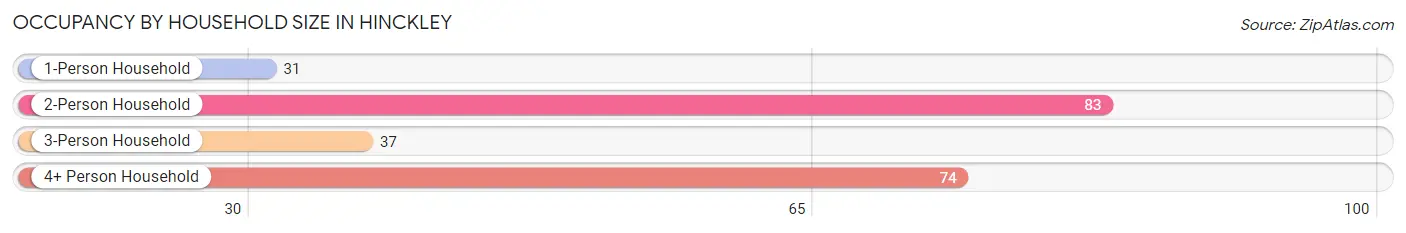
| Household Size | # Housing Units | % Housing Units |
| 1-Person Household | 31 | 13.8% |
| 2-Person Household | 83 | 36.9% |
| 3-Person Household | 37 | 16.4% |
| 4+ Person Household | 74 | 32.9% |
| Total Housing Units | 225 | 100.0% |
Occupancy by Ownership by Household Size in Hinckley
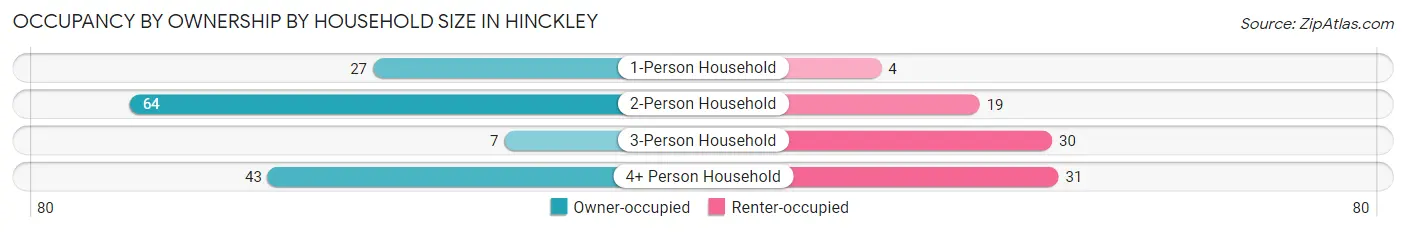
| Household Size | Owner-occupied | Renter-occupied |
| 1-Person Household | 27 (87.1%) | 4 (12.9%) |
| 2-Person Household | 64 (77.1%) | 19 (22.9%) |
| 3-Person Household | 7 (18.9%) | 30 (81.1%) |
| 4+ Person Household | 43 (58.1%) | 31 (41.9%) |
| Total Housing Units | 141 (62.7%) | 84 (37.3%) |
Occupancy by Educational Attainment in Hinckley
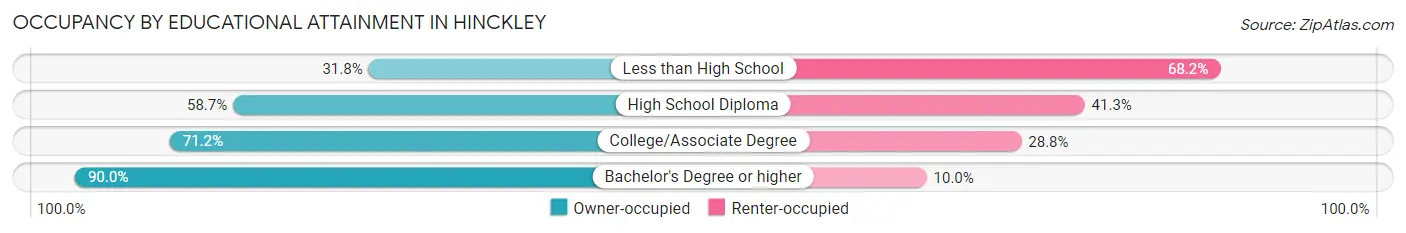
| Household Size | Owner-occupied | Renter-occupied |
| Less than High School | 14 (31.8%) | 30 (68.2%) |
| High School Diploma | 44 (58.7%) | 31 (41.3%) |
| College/Associate Degree | 47 (71.2%) | 19 (28.8%) |
| Bachelor's Degree or higher | 36 (90.0%) | 4 (10.0%) |
Occupancy by Age of Householder in Hinckley
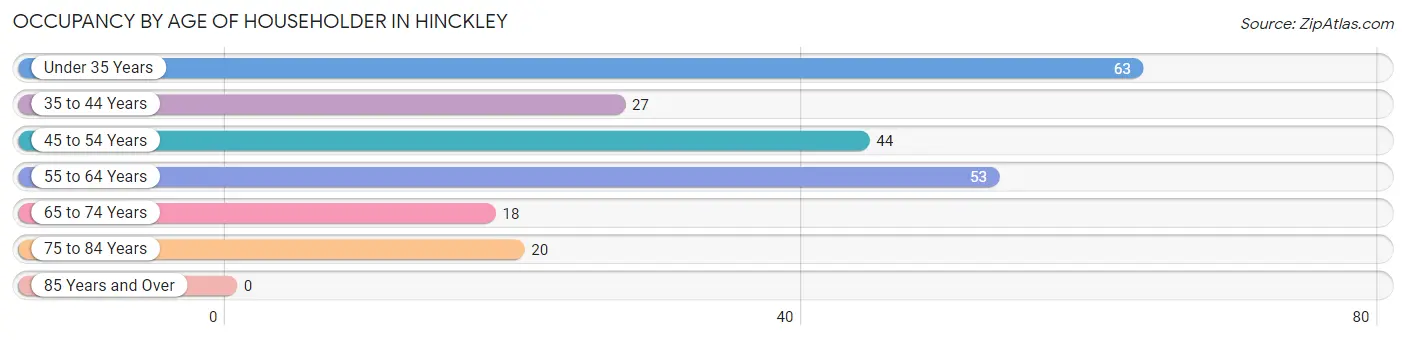
| Age Bracket | # Households | % Households |
| Under 35 Years | 63 | 28.0% |
| 35 to 44 Years | 27 | 12.0% |
| 45 to 54 Years | 44 | 19.6% |
| 55 to 64 Years | 53 | 23.6% |
| 65 to 74 Years | 18 | 8.0% |
| 75 to 84 Years | 20 | 8.9% |
| 85 Years and Over | 0 | 0.0% |
| Total | 225 | 100.0% |
Housing Finances in Hinckley
Median Income by Occupancy in Hinckley
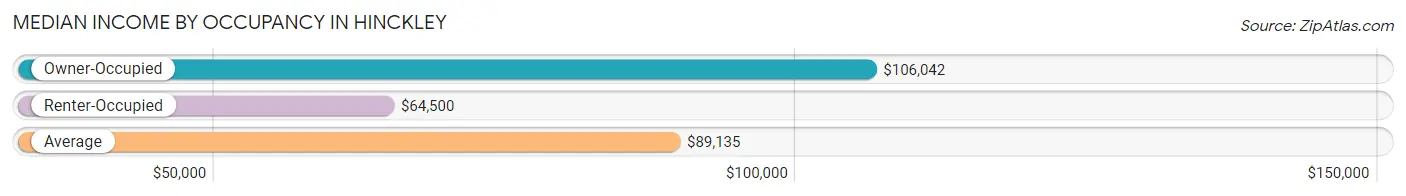
| Occupancy Type | # Households | Median Income |
| Owner-Occupied | 141 (62.7%) | $106,042 |
| Renter-Occupied | 84 (37.3%) | $64,500 |
| Average | 225 (100.0%) | $89,135 |
Occupancy by Householder Income Bracket in Hinckley
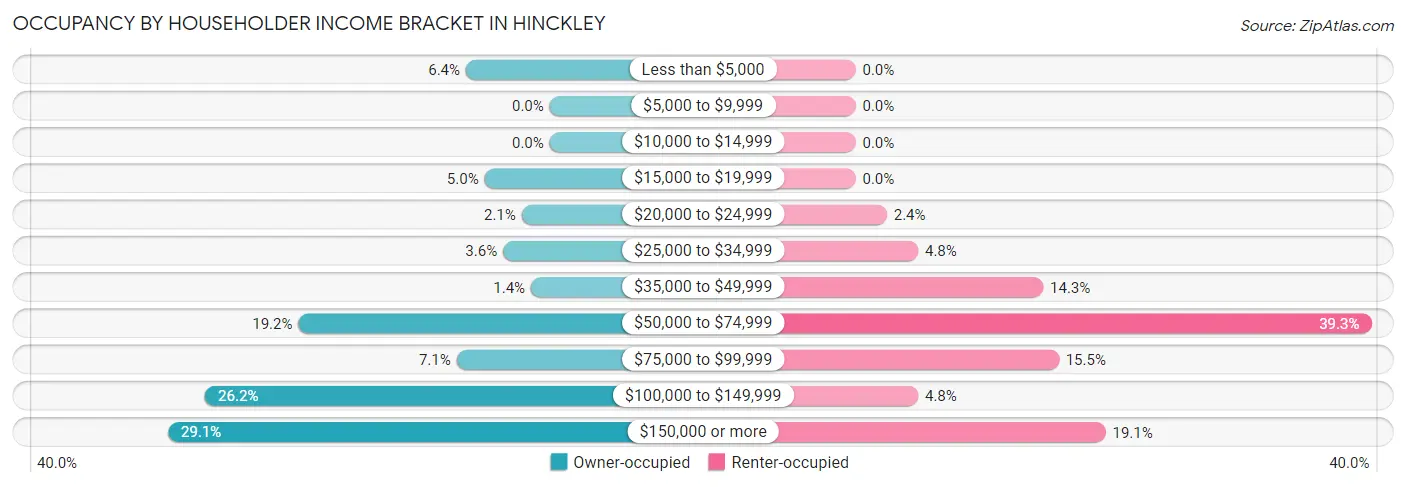
| Income Bracket | Owner-occupied | Renter-occupied |
| Less than $5,000 | 9 (6.4%) | 0 (0.0%) |
| $5,000 to $9,999 | 0 (0.0%) | 0 (0.0%) |
| $10,000 to $14,999 | 0 (0.0%) | 0 (0.0%) |
| $15,000 to $19,999 | 7 (5.0%) | 0 (0.0%) |
| $20,000 to $24,999 | 3 (2.1%) | 2 (2.4%) |
| $25,000 to $34,999 | 5 (3.5%) | 4 (4.8%) |
| $35,000 to $49,999 | 2 (1.4%) | 12 (14.3%) |
| $50,000 to $74,999 | 27 (19.2%) | 33 (39.3%) |
| $75,000 to $99,999 | 10 (7.1%) | 13 (15.5%) |
| $100,000 to $149,999 | 37 (26.2%) | 4 (4.8%) |
| $150,000 or more | 41 (29.1%) | 16 (19.1%) |
| Total | 141 (100.0%) | 84 (100.0%) |
Monthly Housing Cost Tiers in Hinckley
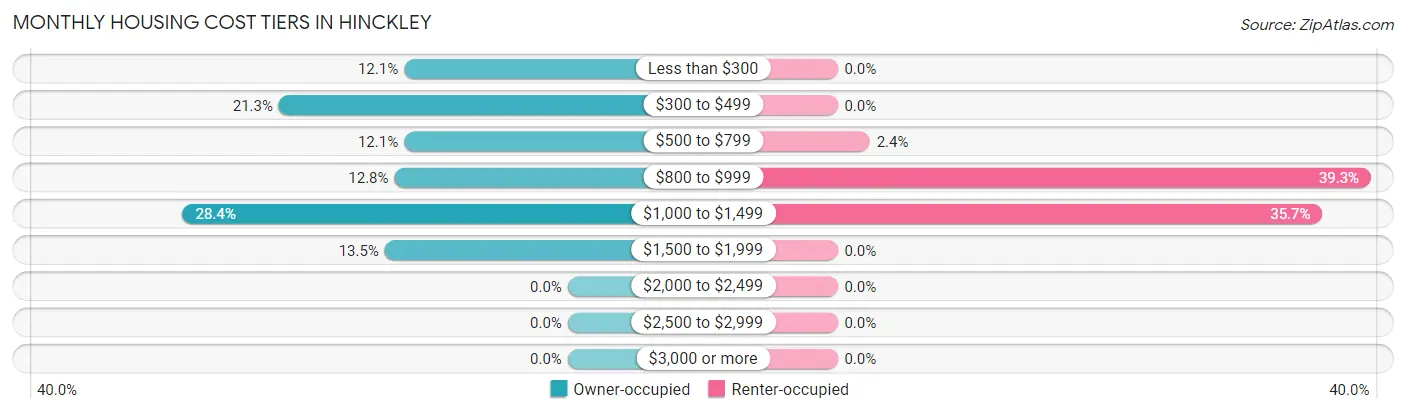
| Monthly Cost | Owner-occupied | Renter-occupied |
| Less than $300 | 17 (12.1%) | 0 (0.0%) |
| $300 to $499 | 30 (21.3%) | 0 (0.0%) |
| $500 to $799 | 17 (12.1%) | 2 (2.4%) |
| $800 to $999 | 18 (12.8%) | 33 (39.3%) |
| $1,000 to $1,499 | 40 (28.4%) | 30 (35.7%) |
| $1,500 to $1,999 | 19 (13.5%) | 0 (0.0%) |
| $2,000 to $2,499 | 0 (0.0%) | 0 (0.0%) |
| $2,500 to $2,999 | 0 (0.0%) | 0 (0.0%) |
| $3,000 or more | 0 (0.0%) | 0 (0.0%) |
| Total | 141 (100.0%) | 84 (100.0%) |
Physical Housing Characteristics in Hinckley
Housing Structures in Hinckley
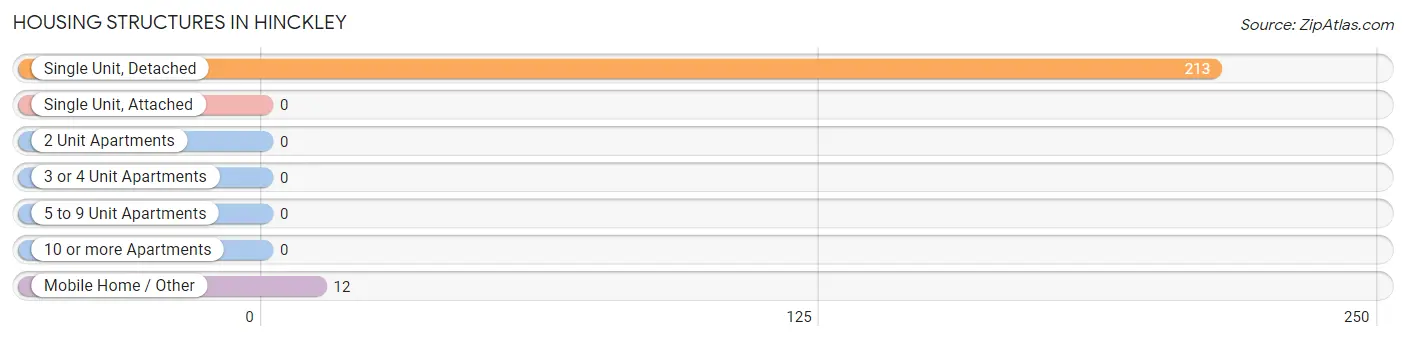
| Structure Type | # Housing Units | % Housing Units |
| Single Unit, Detached | 213 | 94.7% |
| Single Unit, Attached | 0 | 0.0% |
| 2 Unit Apartments | 0 | 0.0% |
| 3 or 4 Unit Apartments | 0 | 0.0% |
| 5 to 9 Unit Apartments | 0 | 0.0% |
| 10 or more Apartments | 0 | 0.0% |
| Mobile Home / Other | 12 | 5.3% |
| Total | 225 | 100.0% |
Housing Structures by Occupancy in Hinckley
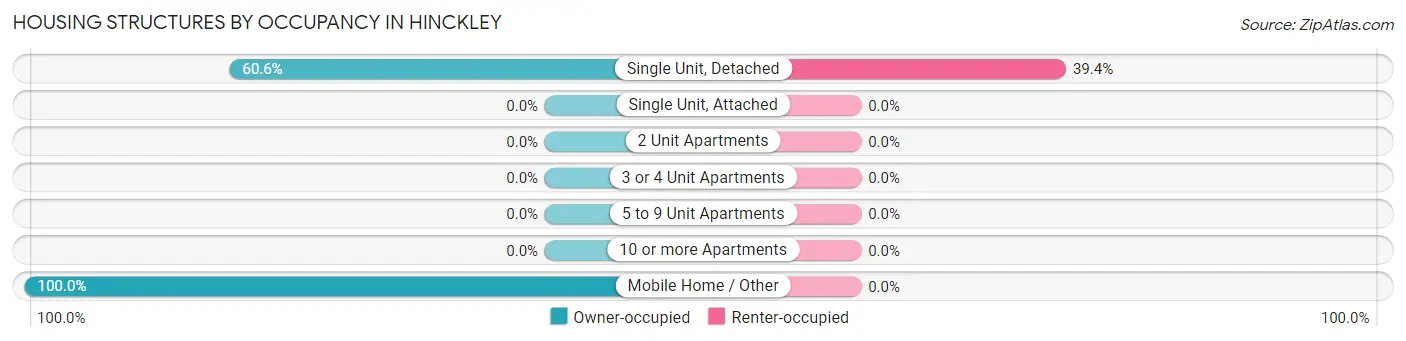
| Structure Type | Owner-occupied | Renter-occupied |
| Single Unit, Detached | 129 (60.6%) | 84 (39.4%) |
| Single Unit, Attached | 0 (0.0%) | 0 (0.0%) |
| 2 Unit Apartments | 0 (0.0%) | 0 (0.0%) |
| 3 or 4 Unit Apartments | 0 (0.0%) | 0 (0.0%) |
| 5 to 9 Unit Apartments | 0 (0.0%) | 0 (0.0%) |
| 10 or more Apartments | 0 (0.0%) | 0 (0.0%) |
| Mobile Home / Other | 12 (100.0%) | 0 (0.0%) |
| Total | 141 (62.7%) | 84 (37.3%) |
Housing Structures by Number of Rooms in Hinckley
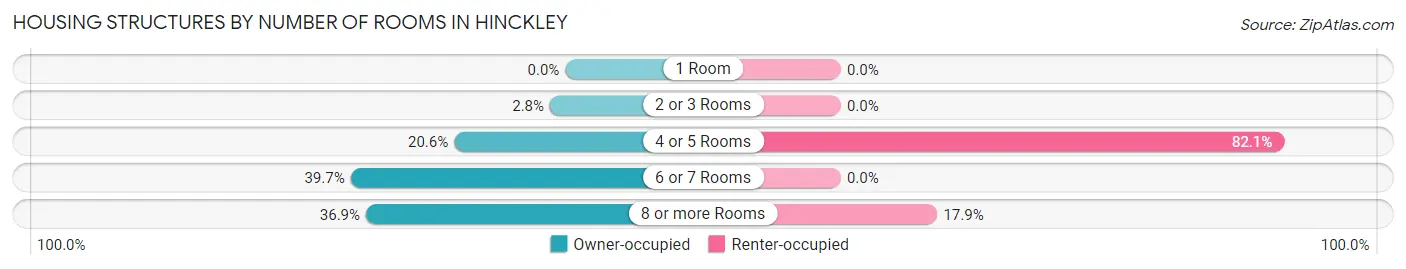
| Number of Rooms | Owner-occupied | Renter-occupied |
| 1 Room | 0 (0.0%) | 0 (0.0%) |
| 2 or 3 Rooms | 4 (2.8%) | 0 (0.0%) |
| 4 or 5 Rooms | 29 (20.6%) | 69 (82.1%) |
| 6 or 7 Rooms | 56 (39.7%) | 0 (0.0%) |
| 8 or more Rooms | 52 (36.9%) | 15 (17.9%) |
| Total | 141 (100.0%) | 84 (100.0%) |
Housing Structure by Heating Type in Hinckley
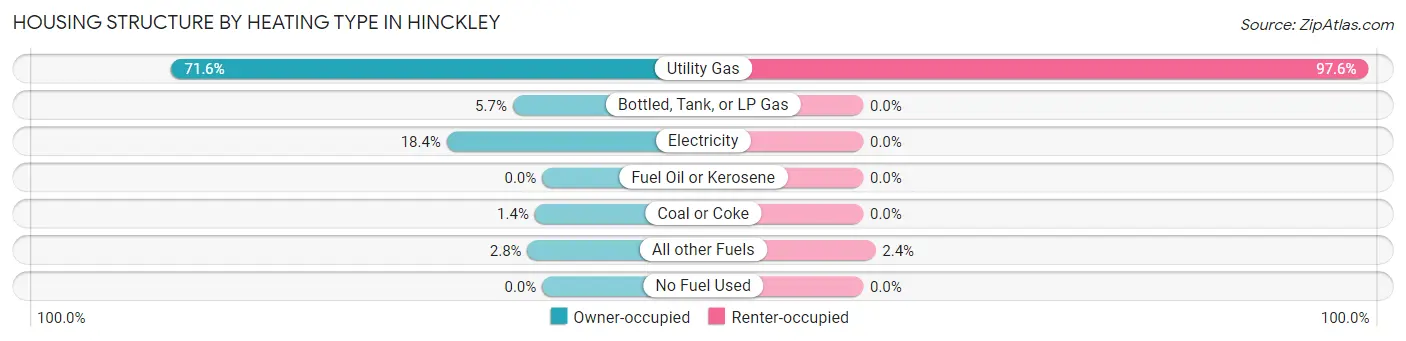
| Heating Type | Owner-occupied | Renter-occupied |
| Utility Gas | 101 (71.6%) | 82 (97.6%) |
| Bottled, Tank, or LP Gas | 8 (5.7%) | 0 (0.0%) |
| Electricity | 26 (18.4%) | 0 (0.0%) |
| Fuel Oil or Kerosene | 0 (0.0%) | 0 (0.0%) |
| Coal or Coke | 2 (1.4%) | 0 (0.0%) |
| All other Fuels | 4 (2.8%) | 2 (2.4%) |
| No Fuel Used | 0 (0.0%) | 0 (0.0%) |
| Total | 141 (100.0%) | 84 (100.0%) |
Household Vehicle Usage in Hinckley
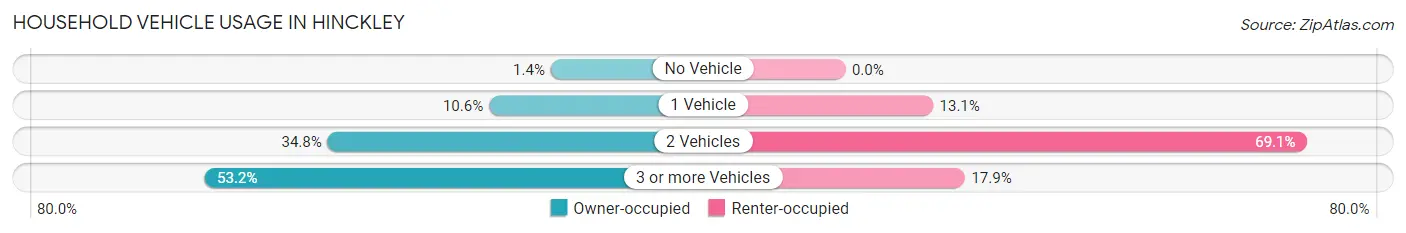
| Vehicles per Household | Owner-occupied | Renter-occupied |
| No Vehicle | 2 (1.4%) | 0 (0.0%) |
| 1 Vehicle | 15 (10.6%) | 11 (13.1%) |
| 2 Vehicles | 49 (34.7%) | 58 (69.1%) |
| 3 or more Vehicles | 75 (53.2%) | 15 (17.9%) |
| Total | 141 (100.0%) | 84 (100.0%) |
Real Estate & Mortgages in Hinckley
Real Estate and Mortgage Overview in Hinckley
| Characteristic | Without Mortgage | With Mortgage |
| Housing Units | 60 | 81 |
| Median Property Value | $108,300 | $148,400 |
| Median Household Income | - | - |
| Monthly Housing Costs | $346 | $0 |
| Real Estate Taxes | $732 | $7 |
Property Value by Mortgage Status in Hinckley
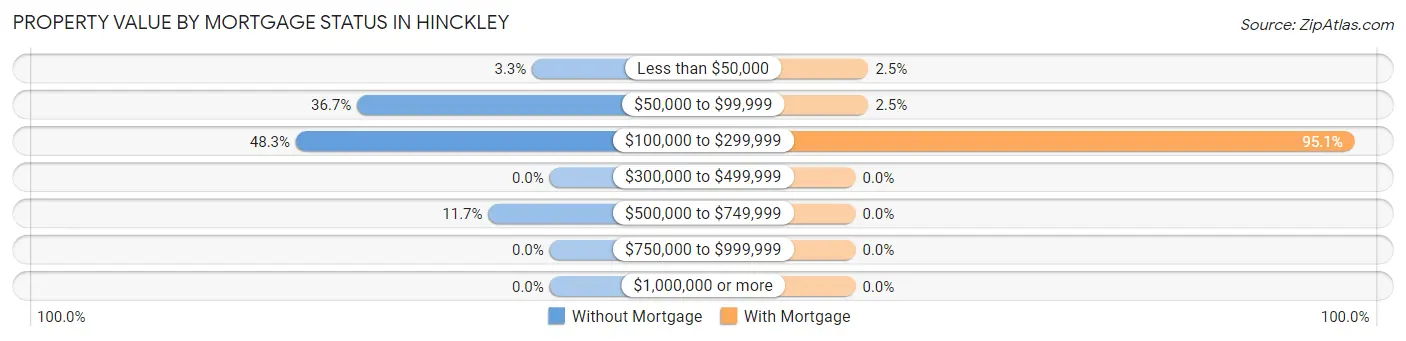
| Property Value | Without Mortgage | With Mortgage |
| Less than $50,000 | 2 (3.3%) | 2 (2.5%) |
| $50,000 to $99,999 | 22 (36.7%) | 2 (2.5%) |
| $100,000 to $299,999 | 29 (48.3%) | 77 (95.1%) |
| $300,000 to $499,999 | 0 (0.0%) | 0 (0.0%) |
| $500,000 to $749,999 | 7 (11.7%) | 0 (0.0%) |
| $750,000 to $999,999 | 0 (0.0%) | 0 (0.0%) |
| $1,000,000 or more | 0 (0.0%) | 0 (0.0%) |
| Total | 60 (100.0%) | 81 (100.0%) |
Household Income by Mortgage Status in Hinckley
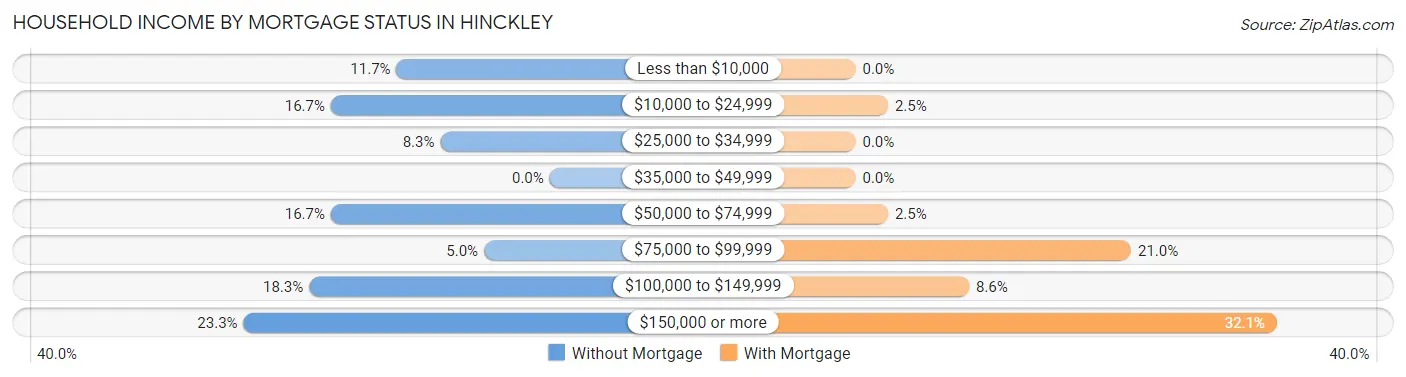
| Household Income | Without Mortgage | With Mortgage |
| Less than $10,000 | 7 (11.7%) | 0 (0.0%) |
| $10,000 to $24,999 | 10 (16.7%) | 2 (2.5%) |
| $25,000 to $34,999 | 5 (8.3%) | 0 (0.0%) |
| $35,000 to $49,999 | 0 (0.0%) | 0 (0.0%) |
| $50,000 to $74,999 | 10 (16.7%) | 2 (2.5%) |
| $75,000 to $99,999 | 3 (5.0%) | 17 (21.0%) |
| $100,000 to $149,999 | 11 (18.3%) | 7 (8.6%) |
| $150,000 or more | 14 (23.3%) | 26 (32.1%) |
| Total | 60 (100.0%) | 81 (100.0%) |
Property Value to Household Income Ratio in Hinckley
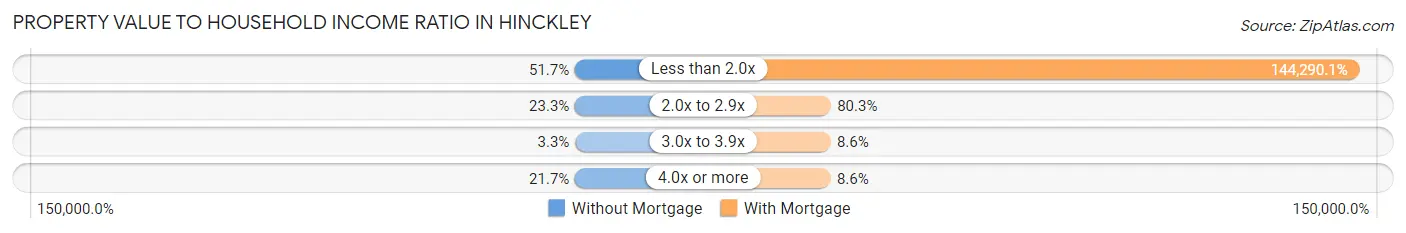
| Value-to-Income Ratio | Without Mortgage | With Mortgage |
| Less than 2.0x | 31 (51.7%) | 116,875 (144,290.1%) |
| 2.0x to 2.9x | 14 (23.3%) | 65 (80.2%) |
| 3.0x to 3.9x | 2 (3.3%) | 7 (8.6%) |
| 4.0x or more | 13 (21.7%) | 7 (8.6%) |
| Total | 60 (100.0%) | 81 (100.0%) |
Real Estate Taxes by Mortgage Status in Hinckley
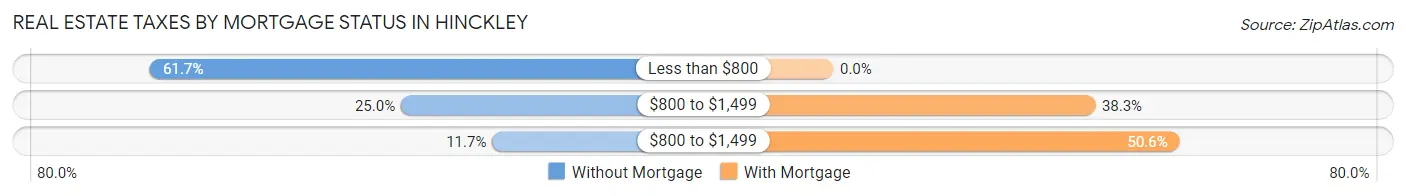
| Property Taxes | Without Mortgage | With Mortgage |
| Less than $800 | 37 (61.7%) | 0 (0.0%) |
| $800 to $1,499 | 15 (25.0%) | 31 (38.3%) |
| $800 to $1,499 | 7 (11.7%) | 41 (50.6%) |
| Total | 60 (100.0%) | 81 (100.0%) |
Health & Disability in Hinckley
Health Insurance Coverage by Age in Hinckley
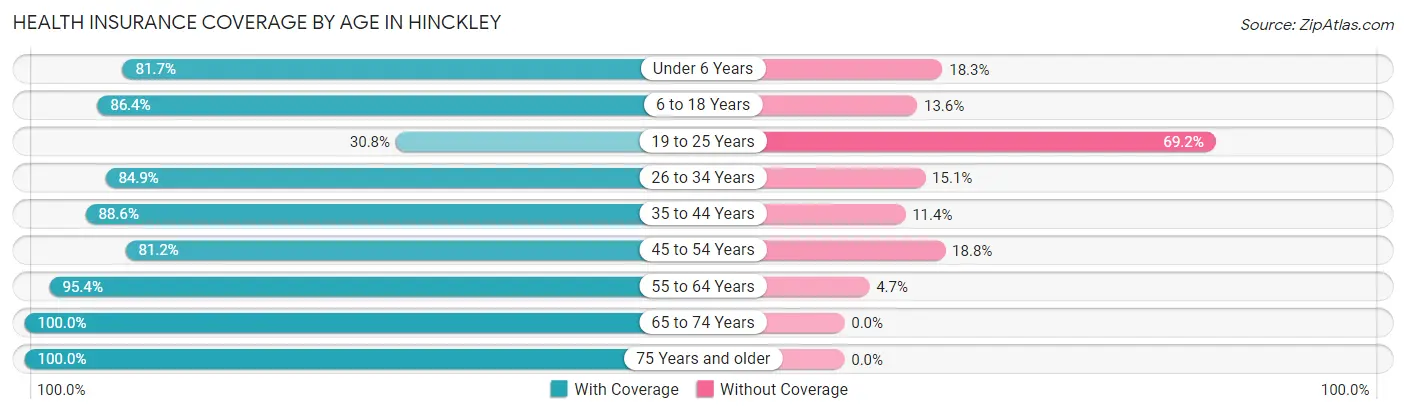
| Age Bracket | With Coverage | Without Coverage |
| Under 6 Years | 76 (81.7%) | 17 (18.3%) |
| 6 to 18 Years | 102 (86.4%) | 16 (13.6%) |
| 19 to 25 Years | 32 (30.8%) | 72 (69.2%) |
| 26 to 34 Years | 152 (84.9%) | 27 (15.1%) |
| 35 to 44 Years | 39 (88.6%) | 5 (11.4%) |
| 45 to 54 Years | 82 (81.2%) | 19 (18.8%) |
| 55 to 64 Years | 82 (95.4%) | 4 (4.6%) |
| 65 to 74 Years | 32 (100.0%) | 0 (0.0%) |
| 75 Years and older | 33 (100.0%) | 0 (0.0%) |
| Total | 630 (79.7%) | 160 (20.3%) |
Health Insurance Coverage by Citizenship Status in Hinckley
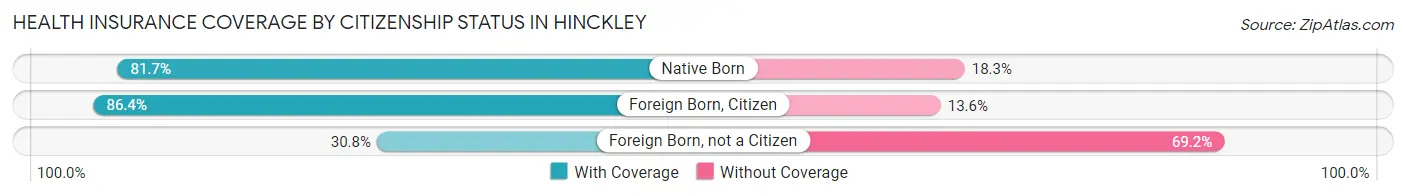
| Citizenship Status | With Coverage | Without Coverage |
| Native Born | 76 (81.7%) | 17 (18.3%) |
| Foreign Born, Citizen | 102 (86.4%) | 16 (13.6%) |
| Foreign Born, not a Citizen | 32 (30.8%) | 72 (69.2%) |
Health Insurance Coverage by Household Income in Hinckley
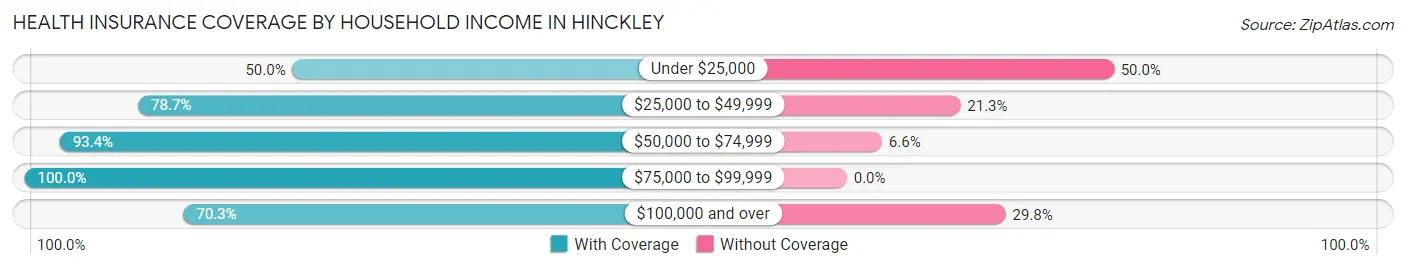
| Household Income | With Coverage | Without Coverage |
| Under $25,000 | 21 (50.0%) | 21 (50.0%) |
| $25,000 to $49,999 | 37 (78.7%) | 10 (21.3%) |
| $50,000 to $74,999 | 142 (93.4%) | 10 (6.6%) |
| $75,000 to $99,999 | 149 (100.0%) | 0 (0.0%) |
| $100,000 and over | 281 (70.3%) | 119 (29.7%) |
Public vs Private Health Insurance Coverage by Age in Hinckley
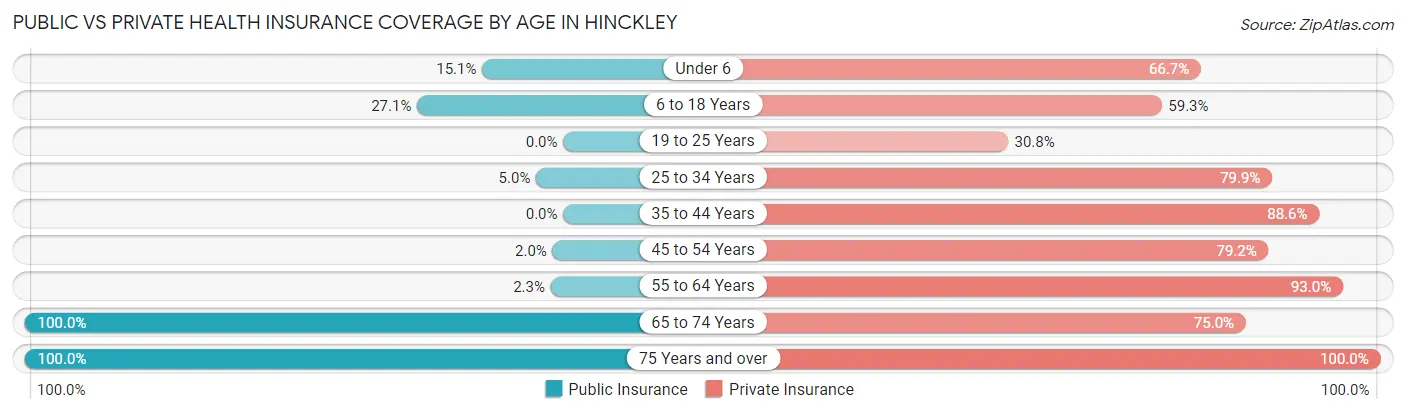
| Age Bracket | Public Insurance | Private Insurance |
| Under 6 | 14 (15.0%) | 62 (66.7%) |
| 6 to 18 Years | 32 (27.1%) | 70 (59.3%) |
| 19 to 25 Years | 0 (0.0%) | 32 (30.8%) |
| 25 to 34 Years | 9 (5.0%) | 143 (79.9%) |
| 35 to 44 Years | 0 (0.0%) | 39 (88.6%) |
| 45 to 54 Years | 2 (2.0%) | 80 (79.2%) |
| 55 to 64 Years | 2 (2.3%) | 80 (93.0%) |
| 65 to 74 Years | 32 (100.0%) | 24 (75.0%) |
| 75 Years and over | 33 (100.0%) | 33 (100.0%) |
| Total | 124 (15.7%) | 563 (71.3%) |
Disability Status by Sex by Age in Hinckley
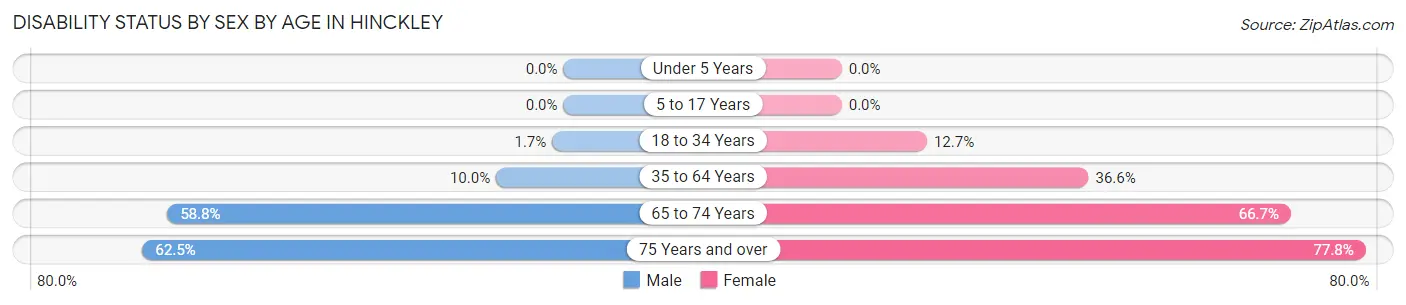
| Age Bracket | Male | Female |
| Under 5 Years | 0 (0.0%) | 0 (0.0%) |
| 5 to 17 Years | 0 (0.0%) | 0 (0.0%) |
| 18 to 34 Years | 2 (1.7%) | 21 (12.7%) |
| 35 to 64 Years | 10 (10.0%) | 48 (36.6%) |
| 65 to 74 Years | 10 (58.8%) | 10 (66.7%) |
| 75 Years and over | 15 (62.5%) | 7 (77.8%) |
Disability Class by Sex by Age in Hinckley
Disability Class: Hearing Difficulty
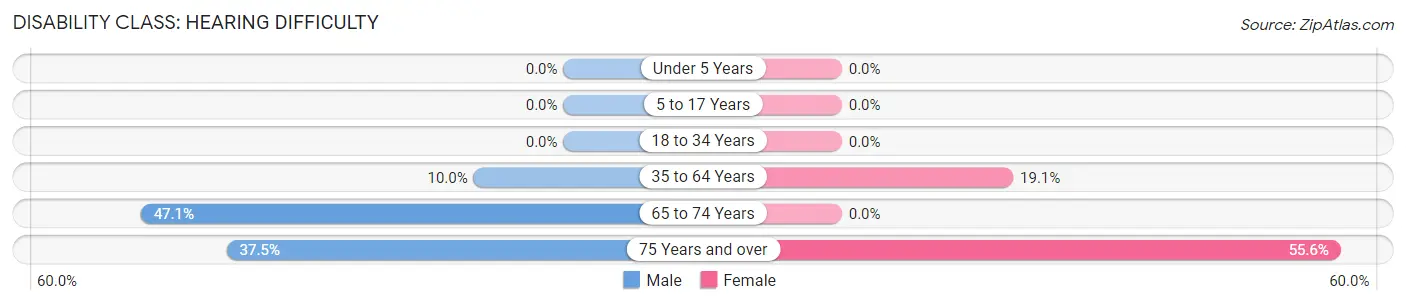
| Age Bracket | Male | Female |
| Under 5 Years | 0 (0.0%) | 0 (0.0%) |
| 5 to 17 Years | 0 (0.0%) | 0 (0.0%) |
| 18 to 34 Years | 0 (0.0%) | 0 (0.0%) |
| 35 to 64 Years | 10 (10.0%) | 25 (19.1%) |
| 65 to 74 Years | 8 (47.1%) | 0 (0.0%) |
| 75 Years and over | 9 (37.5%) | 5 (55.6%) |
Disability Class: Vision Difficulty
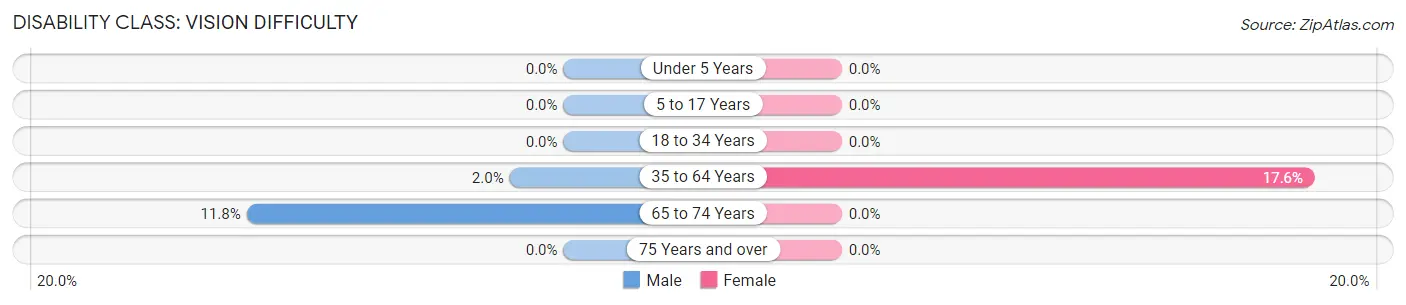
| Age Bracket | Male | Female |
| Under 5 Years | 0 (0.0%) | 0 (0.0%) |
| 5 to 17 Years | 0 (0.0%) | 0 (0.0%) |
| 18 to 34 Years | 0 (0.0%) | 0 (0.0%) |
| 35 to 64 Years | 2 (2.0%) | 23 (17.6%) |
| 65 to 74 Years | 2 (11.8%) | 0 (0.0%) |
| 75 Years and over | 0 (0.0%) | 0 (0.0%) |
Disability Class: Cognitive Difficulty
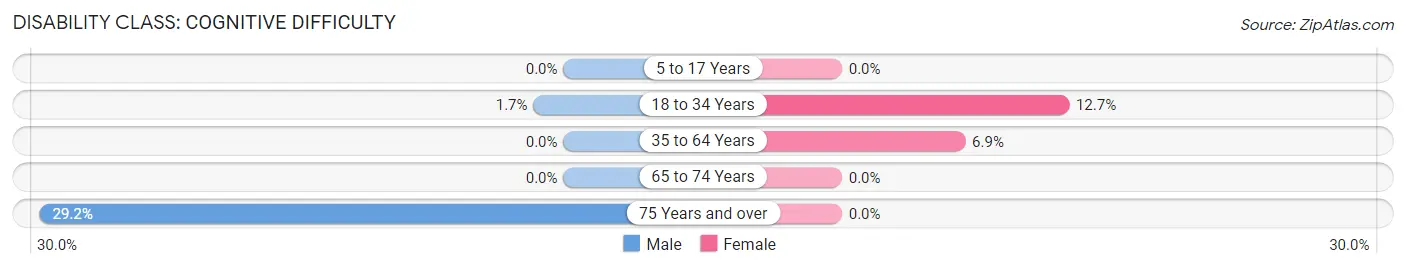
| Age Bracket | Male | Female |
| 5 to 17 Years | 0 (0.0%) | 0 (0.0%) |
| 18 to 34 Years | 2 (1.7%) | 21 (12.7%) |
| 35 to 64 Years | 0 (0.0%) | 9 (6.9%) |
| 65 to 74 Years | 0 (0.0%) | 0 (0.0%) |
| 75 Years and over | 7 (29.2%) | 0 (0.0%) |
Disability Class: Ambulatory Difficulty
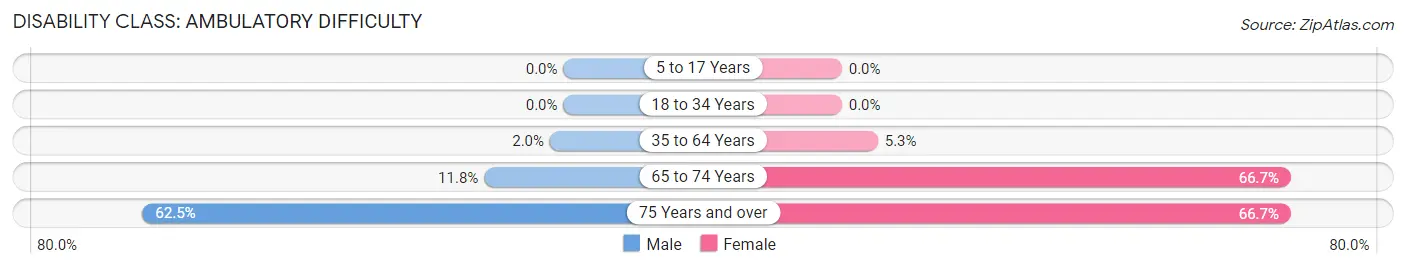
| Age Bracket | Male | Female |
| 5 to 17 Years | 0 (0.0%) | 0 (0.0%) |
| 18 to 34 Years | 0 (0.0%) | 0 (0.0%) |
| 35 to 64 Years | 2 (2.0%) | 7 (5.3%) |
| 65 to 74 Years | 2 (11.8%) | 10 (66.7%) |
| 75 Years and over | 15 (62.5%) | 6 (66.7%) |
Disability Class: Self-Care Difficulty
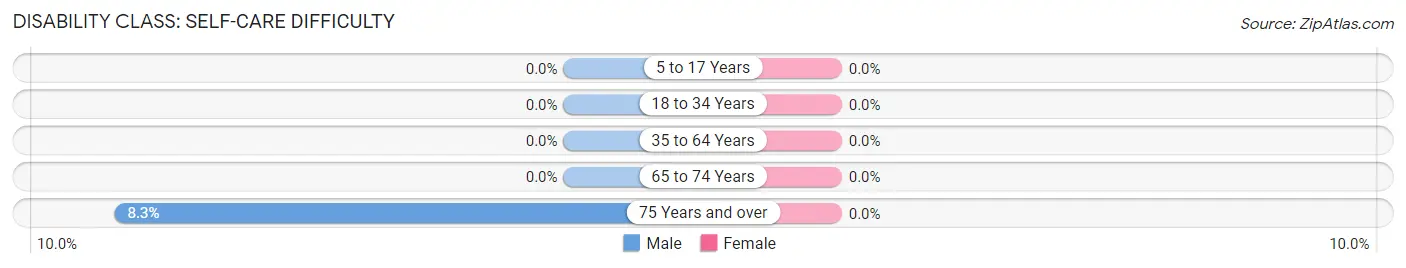
| Age Bracket | Male | Female |
| 5 to 17 Years | 0 (0.0%) | 0 (0.0%) |
| 18 to 34 Years | 0 (0.0%) | 0 (0.0%) |
| 35 to 64 Years | 0 (0.0%) | 0 (0.0%) |
| 65 to 74 Years | 0 (0.0%) | 0 (0.0%) |
| 75 Years and over | 2 (8.3%) | 0 (0.0%) |
Technology Access in Hinckley
Computing Device Access in Hinckley
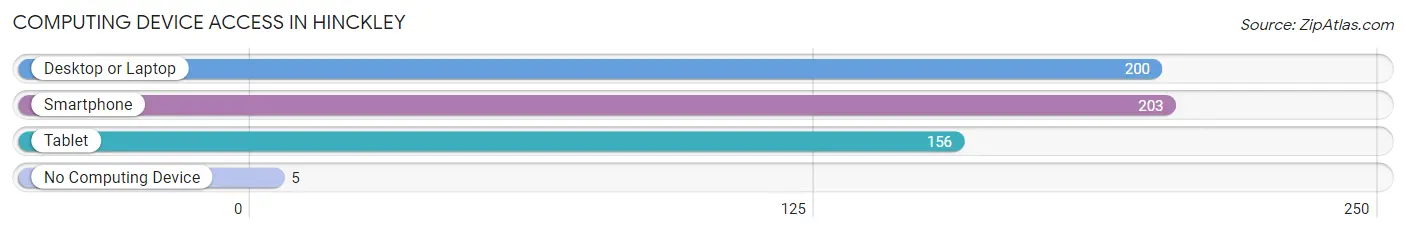
| Device Type | # Households | % Households |
| Desktop or Laptop | 200 | 88.9% |
| Smartphone | 203 | 90.2% |
| Tablet | 156 | 69.3% |
| No Computing Device | 5 | 2.2% |
| Total | 225 | 100.0% |
Internet Access in Hinckley
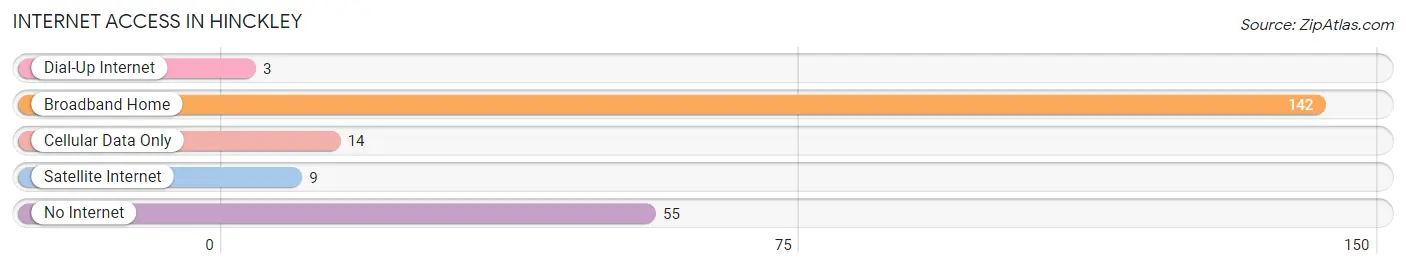
| Internet Type | # Households | % Households |
| Dial-Up Internet | 3 | 1.3% |
| Broadband Home | 142 | 63.1% |
| Cellular Data Only | 14 | 6.2% |
| Satellite Internet | 9 | 4.0% |
| No Internet | 55 | 24.4% |
| Total | 225 | 100.0% |
Hinckley Summary
Hinckley, Utah is a small town located in Millard County, Utah. It is situated in the western part of the state, approximately 30 miles south of the city of Fillmore. The town was founded in 1877 by a group of Mormon settlers led by John Hinckley, who was the first mayor of the town. The population of Hinckley was estimated to be around 500 in 2020.
Geography
Hinckley is located in the western part of Millard County, Utah. It is situated in the Great Basin Desert, which is characterized by its dry climate and sparse vegetation. The town is located at an elevation of 4,890 feet above sea level. The nearest major city is Fillmore, which is located approximately 30 miles to the north. The town is surrounded by the Sevier Desert to the east, the Fishlake National Forest to the south, and the Tushar Mountains to the west.
Economy
Hinckley’s economy is largely based on agriculture and ranching. The town is home to several farms and ranches, which produce a variety of crops and livestock. The town is also home to a number of small businesses, including a grocery store, a hardware store, and a few restaurants.
Demographics
According to the 2010 census, the population of Hinckley was 498. The racial makeup of the town was 97.2% White, 0.2% African American, 0.2% Native American, 0.2% Asian, 0.2% Pacific Islander, 0.4% from other races, and 1.8% from two or more races. The median household income was $37,500, and the median family income was $41,250.
History
Hinckley was founded in 1877 by a group of Mormon settlers led by John Hinckley. The town was originally named “Hinckleyville”, but the name was later changed to “Hinckley”. The town was incorporated in 1883 and was designated as the county seat of Millard County.
In the early 1900s, Hinckley was a thriving agricultural community. The town was home to several farms and ranches, which produced a variety of crops and livestock. The town also had a number of small businesses, including a grocery store, a hardware store, and a few restaurants.
In the late 1950s, Hinckley began to experience a decline in population as many of its residents moved away in search of better economic opportunities. The town’s population continued to decline until the early 2000s, when it began to experience a resurgence. Today, Hinckley is a small but vibrant community with a population of around 500.
Common Questions
What is Per Capita Income in Hinckley?
Per Capita income in Hinckley is $28,289.
What is the Median Family Income in Hinckley?
Median Family Income in Hinckley is $98,214.
What is the Median Household income in Hinckley?
Median Household Income in Hinckley is $89,135.
What is Income or Wage Gap in Hinckley?
Income or Wage Gap in Hinckley is 43.9%.
Women in Hinckley earn 56.1 cents for every dollar earned by a man.
What is Inequality or Gini Index in Hinckley?
Inequality or Gini Index in Hinckley is 0.33.
What is the Total Population of Hinckley?
Total Population of Hinckley is 790.
What is the Total Male Population of Hinckley?
Total Male Population of Hinckley is 347.
What is the Total Female Population of Hinckley?
Total Female Population of Hinckley is 443.
What is the Ratio of Males per 100 Females in Hinckley?
There are 78.33 Males per 100 Females in Hinckley.
What is the Ratio of Females per 100 Males in Hinckley?
There are 127.67 Females per 100 Males in Hinckley.
What is the Median Population Age in Hinckley?
Median Population Age in Hinckley is 28.6 Years.
What is the Average Family Size in Hinckley
Average Family Size in Hinckley is 3.8 People.
What is the Average Household Size in Hinckley
Average Household Size in Hinckley is 3.5 People.
How Large is the Labor Force in Hinckley?
There are 458 People in the Labor Forcein in Hinckley.
What is the Percentage of People in the Labor Force in Hinckley?
78.3% of People are in the Labor Force in Hinckley.
What is the Unemployment Rate in Hinckley?
Unemployment Rate in Hinckley is 3.5%.