Nipomo, CA Map & Demographics
Nipomo Map
Nipomo Overview
$38,491
PER CAPITA INCOME
$105,395
AVG FAMILY INCOME
$95,982
AVG HOUSEHOLD INCOME
23.9%
WAGE / INCOME GAP [ % ]
76.1¢/ $1
WAGE / INCOME GAP [ $ ]
0.40
INEQUALITY / GINI INDEX
18,009
TOTAL POPULATION
8,992
MALE POPULATION
9,017
FEMALE POPULATION
99.72
MALES / 100 FEMALES
100.28
FEMALES / 100 MALES
37.9
MEDIAN AGE
3.5
AVG FAMILY SIZE
3.2
AVG HOUSEHOLD SIZE
8,472
LABOR FORCE [ PEOPLE ]
58.7%
PERCENT IN LABOR FORCE
4.0%
UNEMPLOYMENT RATE
Nipomo Zip Codes
Nipomo Area Codes
Income in Nipomo
Income Overview in Nipomo
Per Capita Income in Nipomo is $38,491, while median incomes of families and households are $105,395 and $95,982 respectively.
| Characteristic | Number | Measure |
| Per Capita Income | 18,009 | $38,491 |
| Median Family Income | 4,374 | $105,395 |
| Mean Family Income | 4,374 | $120,483 |
| Median Household Income | 5,694 | $95,982 |
| Mean Household Income | 5,694 | $120,869 |
| Income Deficit | 4,374 | $0 |
| Wage / Income Gap (%) | 18,009 | 23.93% |
| Wage / Income Gap ($) | 18,009 | 76.07¢ per $1 |
| Gini / Inequality Index | 18,009 | 0.40 |
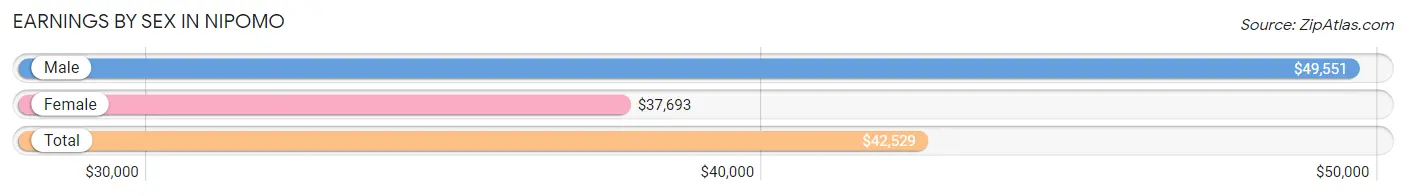
Earnings by Sex in Nipomo
Average Earnings in Nipomo are $42,529, $49,551 for men and $37,693 for women, a difference of 23.9%.
| Sex | Number | Average Earnings |
| Male | 4,855 (54.8%) | $49,551 |
| Female | 3,997 (45.2%) | $37,693 |
| Total | 8,852 (100.0%) | $42,529 |
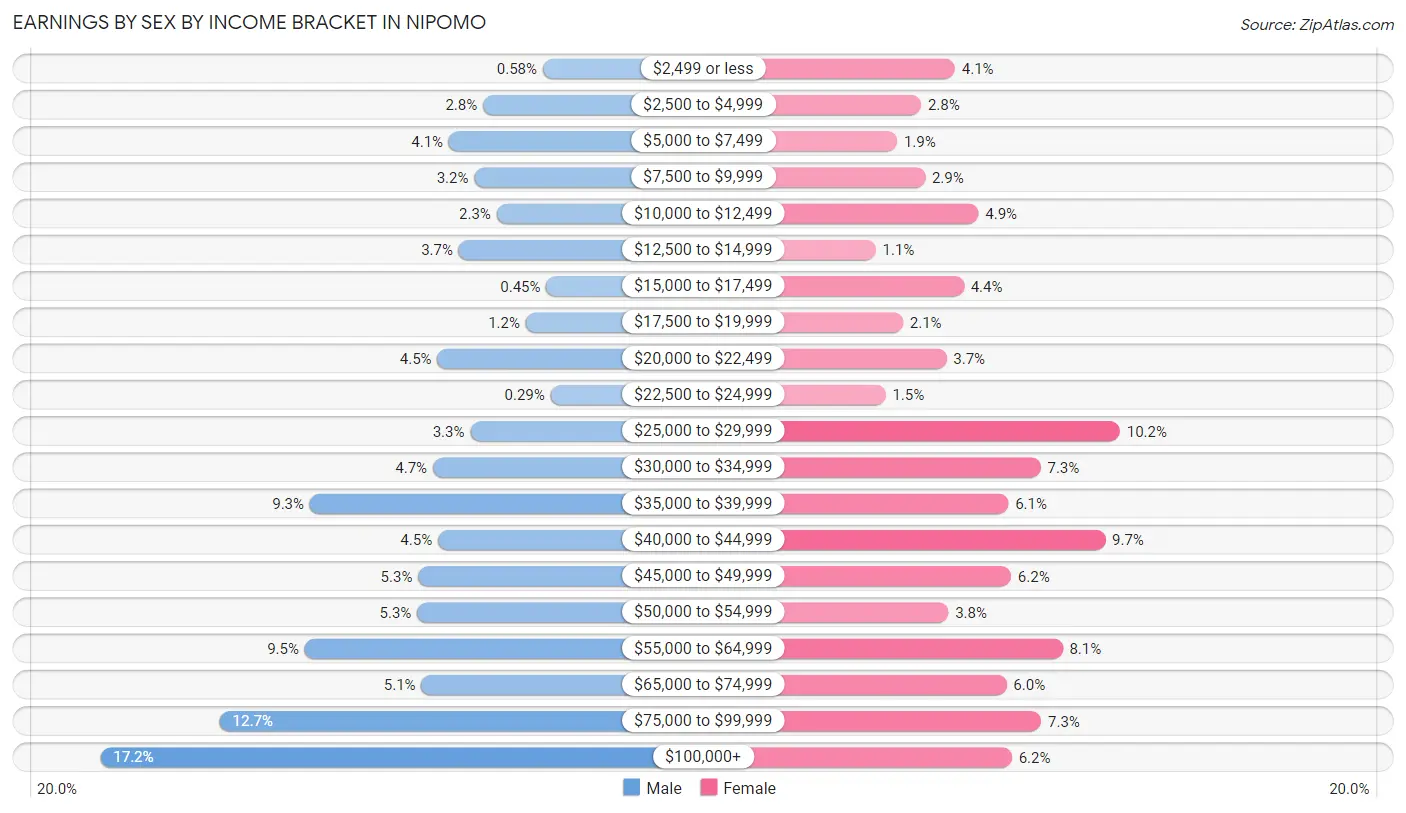
Earnings by Sex by Income Bracket in Nipomo
The most common earnings brackets in Nipomo are $100,000+ for men (833 | 17.2%) and $25,000 to $29,999 for women (409 | 10.2%).
| Income | Male | Female |
| $2,499 or less | 28 (0.6%) | 162 (4.1%) |
| $2,500 to $4,999 | 137 (2.8%) | 111 (2.8%) |
| $5,000 to $7,499 | 199 (4.1%) | 75 (1.9%) |
| $7,500 to $9,999 | 153 (3.2%) | 117 (2.9%) |
| $10,000 to $12,499 | 112 (2.3%) | 197 (4.9%) |
| $12,500 to $14,999 | 181 (3.7%) | 43 (1.1%) |
| $15,000 to $17,499 | 22 (0.4%) | 175 (4.4%) |
| $17,500 to $19,999 | 59 (1.2%) | 84 (2.1%) |
| $20,000 to $22,499 | 220 (4.5%) | 149 (3.7%) |
| $22,500 to $24,999 | 14 (0.3%) | 58 (1.5%) |
| $25,000 to $29,999 | 160 (3.3%) | 409 (10.2%) |
| $30,000 to $34,999 | 228 (4.7%) | 290 (7.3%) |
| $35,000 to $39,999 | 452 (9.3%) | 242 (6.0%) |
| $40,000 to $44,999 | 219 (4.5%) | 387 (9.7%) |
| $45,000 to $49,999 | 255 (5.2%) | 246 (6.1%) |
| $50,000 to $54,999 | 257 (5.3%) | 152 (3.8%) |
| $55,000 to $64,999 | 461 (9.5%) | 323 (8.1%) |
| $65,000 to $74,999 | 249 (5.1%) | 239 (6.0%) |
| $75,000 to $99,999 | 616 (12.7%) | 291 (7.3%) |
| $100,000+ | 833 (17.2%) | 247 (6.2%) |
| Total | 4,855 (100.0%) | 3,997 (100.0%) |
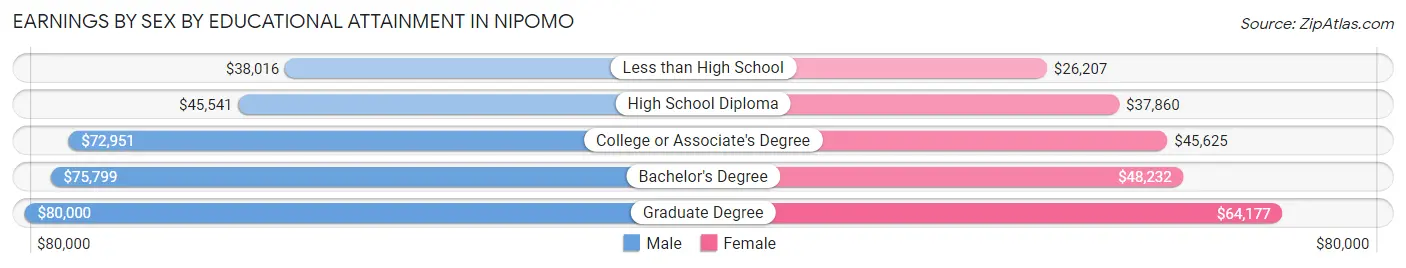
Earnings by Sex by Educational Attainment in Nipomo
Average earnings in Nipomo are $55,178 for men and $41,156 for women, a difference of 25.4%. Men with an educational attainment of graduate degree enjoy the highest average annual earnings of $80,000, while those with less than high school education earn the least with $38,016. Women with an educational attainment of graduate degree earn the most with the average annual earnings of $64,177, while those with less than high school education have the smallest earnings of $26,207.
| Educational Attainment | Male Income | Female Income |
| Less than High School | $38,016 | $26,207 |
| High School Diploma | $45,541 | $37,860 |
| College or Associate's Degree | $72,951 | $45,625 |
| Bachelor's Degree | $75,799 | $48,232 |
| Graduate Degree | $80,000 | $64,177 |
| Total | $55,178 | $41,156 |
Family Income in Nipomo
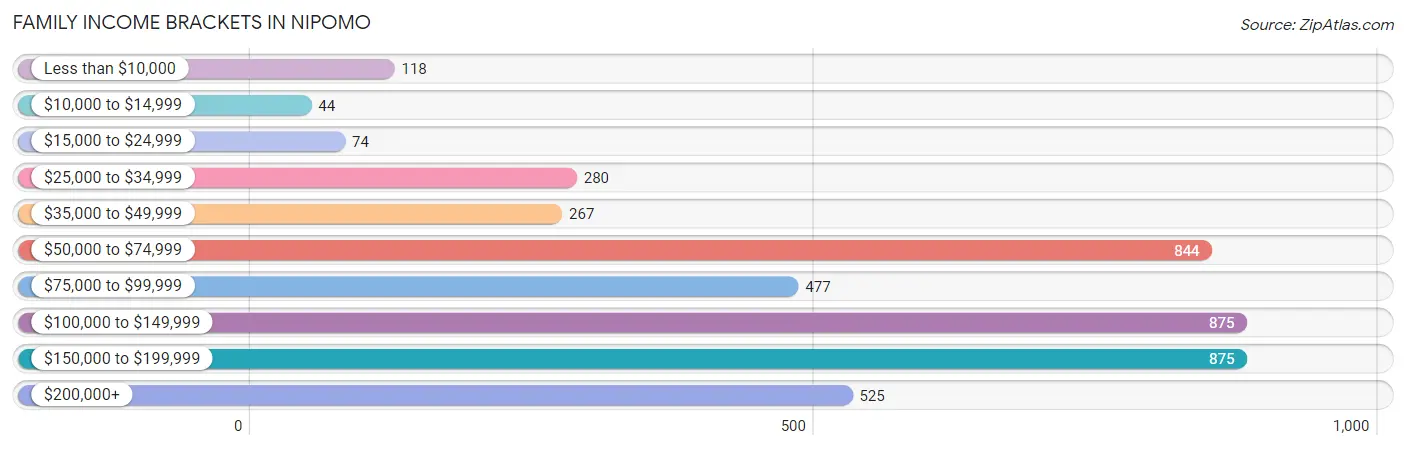
Family Income Brackets in Nipomo
According to the Nipomo family income data, there are 875 families falling into the $100,000 to $149,999 income range, which is the most common income bracket and makes up 20.0% of all families. Conversely, the $10,000 to $14,999 income bracket is the least frequent group with only 44 families (1.0%) belonging to this category.
| Income Bracket | # Families | % Families |
| Less than $10,000 | 118 | 2.7% |
| $10,000 to $14,999 | 44 | 1.0% |
| $15,000 to $24,999 | 74 | 1.7% |
| $25,000 to $34,999 | 280 | 6.4% |
| $35,000 to $49,999 | 267 | 6.1% |
| $50,000 to $74,999 | 844 | 19.3% |
| $75,000 to $99,999 | 477 | 10.9% |
| $100,000 to $149,999 | 875 | 20.0% |
| $150,000 to $199,999 | 875 | 20.0% |
| $200,000+ | 525 | 12.0% |
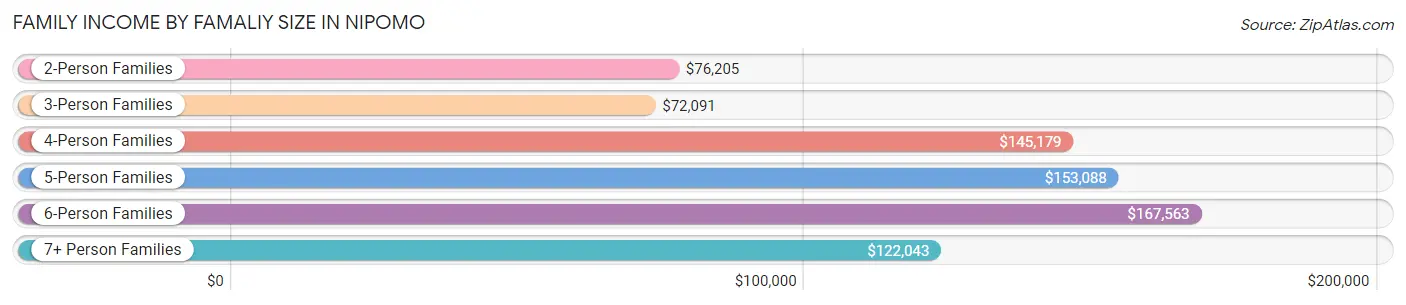
Family Income by Famaliy Size in Nipomo
6-person families (193 | 4.4%) account for the highest median family income in Nipomo with $167,563 per family, while 2-person families (1,785 | 40.8%) have the highest median income of $38,102 per family member.
| Income Bracket | # Families | Median Income |
| 2-Person Families | 1,785 (40.8%) | $76,205 |
| 3-Person Families | 847 (19.4%) | $72,091 |
| 4-Person Families | 942 (21.5%) | $145,179 |
| 5-Person Families | 440 (10.1%) | $153,088 |
| 6-Person Families | 193 (4.4%) | $167,563 |
| 7+ Person Families | 167 (3.8%) | $122,043 |
| Total | 4,374 (100.0%) | $105,395 |
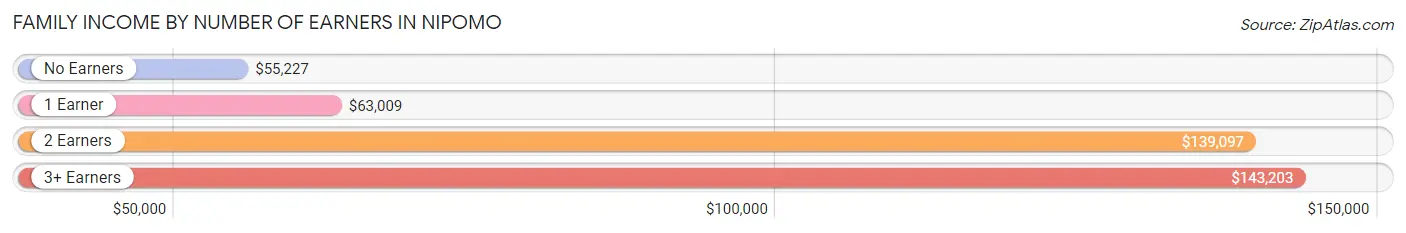
Family Income by Number of Earners in Nipomo
The median family income in Nipomo is $105,395, with families comprising 3+ earners (570) having the highest median family income of $143,203, while families with no earners (644) have the lowest median family income of $55,227, accounting for 13.0% and 14.7% of families, respectively.
| Number of Earners | # Families | Median Income |
| No Earners | 644 (14.7%) | $55,227 |
| 1 Earner | 1,281 (29.3%) | $63,009 |
| 2 Earners | 1,879 (43.0%) | $139,097 |
| 3+ Earners | 570 (13.0%) | $143,203 |
| Total | 4,374 (100.0%) | $105,395 |
Household Income in Nipomo
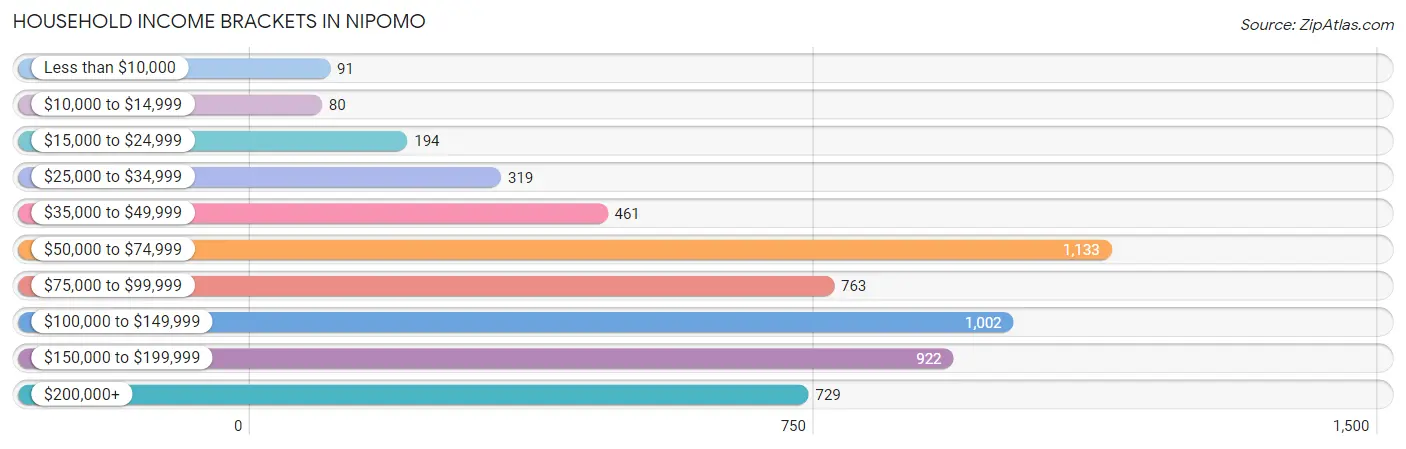
Household Income Brackets in Nipomo
With 1,133 households falling in the category, the $50,000 to $74,999 income range is the most frequent in Nipomo, accounting for 19.9% of all households. In contrast, only 80 households (1.4%) fall into the $10,000 to $14,999 income bracket, making it the least populous group.
| Income Bracket | # Households | % Households |
| Less than $10,000 | 91 | 1.6% |
| $10,000 to $14,999 | 80 | 1.4% |
| $15,000 to $24,999 | 194 | 3.4% |
| $25,000 to $34,999 | 319 | 5.6% |
| $35,000 to $49,999 | 461 | 8.1% |
| $50,000 to $74,999 | 1,133 | 19.9% |
| $75,000 to $99,999 | 763 | 13.4% |
| $100,000 to $149,999 | 1,002 | 17.6% |
| $150,000 to $199,999 | 922 | 16.2% |
| $200,000+ | 729 | 12.8% |
Household Income by Householder Age in Nipomo
The median household income in Nipomo is $95,982, with the highest median household income of $115,323 found in the 45 to 64 years age bracket for the primary householder. A total of 2,005 households (35.2%) fall into this category. Meanwhile, the 15 to 24 years age bracket for the primary householder has the lowest median household income of $0, with 142 households (2.5%) in this group.
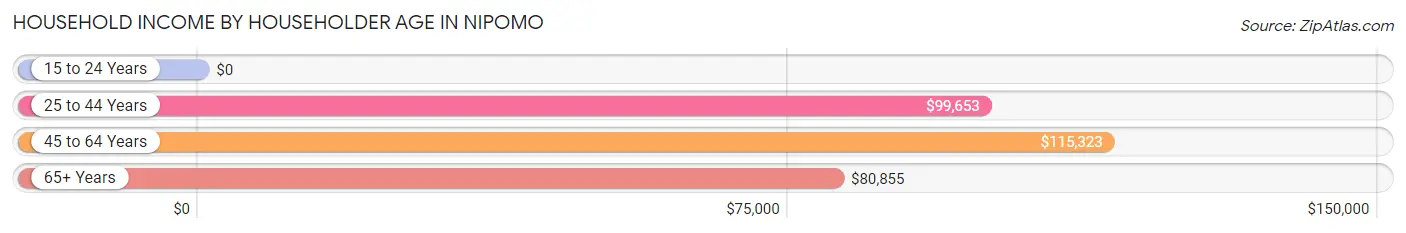
| Income Bracket | # Households | Median Income |
| 15 to 24 Years | 142 (2.5%) | $0 |
| 25 to 44 Years | 1,593 (28.0%) | $99,653 |
| 45 to 64 Years | 2,005 (35.2%) | $115,323 |
| 65+ Years | 1,954 (34.3%) | $80,855 |
| Total | 5,694 (100.0%) | $95,982 |
Poverty in Nipomo
Income Below Poverty by Sex and Age in Nipomo
With 4.4% poverty level for males and 10.4% for females among the residents of Nipomo, 12 to 14 year old males and 5 year old females are the most vulnerable to poverty, with 126 males (17.1%) and 22 females (23.2%) in their respective age groups living below the poverty level.
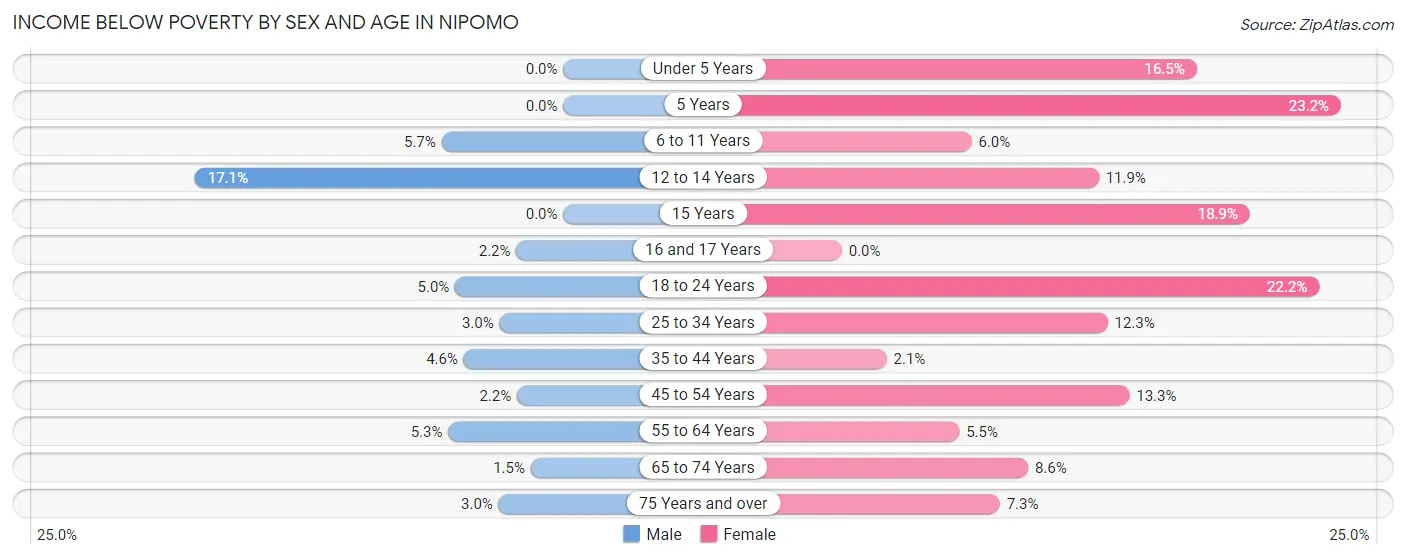
| Age Bracket | Male | Female |
| Under 5 Years | 0 (0.0%) | 80 (16.5%) |
| 5 Years | 0 (0.0%) | 22 (23.2%) |
| 6 to 11 Years | 24 (5.7%) | 34 (6.0%) |
| 12 to 14 Years | 126 (17.1%) | 46 (11.9%) |
| 15 Years | 0 (0.0%) | 39 (18.9%) |
| 16 and 17 Years | 9 (2.2%) | 0 (0.0%) |
| 18 to 24 Years | 44 (5.0%) | 218 (22.2%) |
| 25 to 34 Years | 27 (3.0%) | 124 (12.3%) |
| 35 to 44 Years | 59 (4.6%) | 23 (2.1%) |
| 45 to 54 Years | 27 (2.1%) | 162 (13.3%) |
| 55 to 64 Years | 49 (5.3%) | 54 (5.4%) |
| 65 to 74 Years | 14 (1.5%) | 96 (8.6%) |
| 75 Years and over | 18 (3.0%) | 40 (7.3%) |
| Total | 397 (4.4%) | 938 (10.4%) |
Income Above Poverty by Sex and Age in Nipomo
According to the poverty statistics in Nipomo, males aged under 5 years and females aged 16 and 17 years are the age groups that are most secure financially, with 100.0% of males and 100.0% of females in these age groups living above the poverty line.
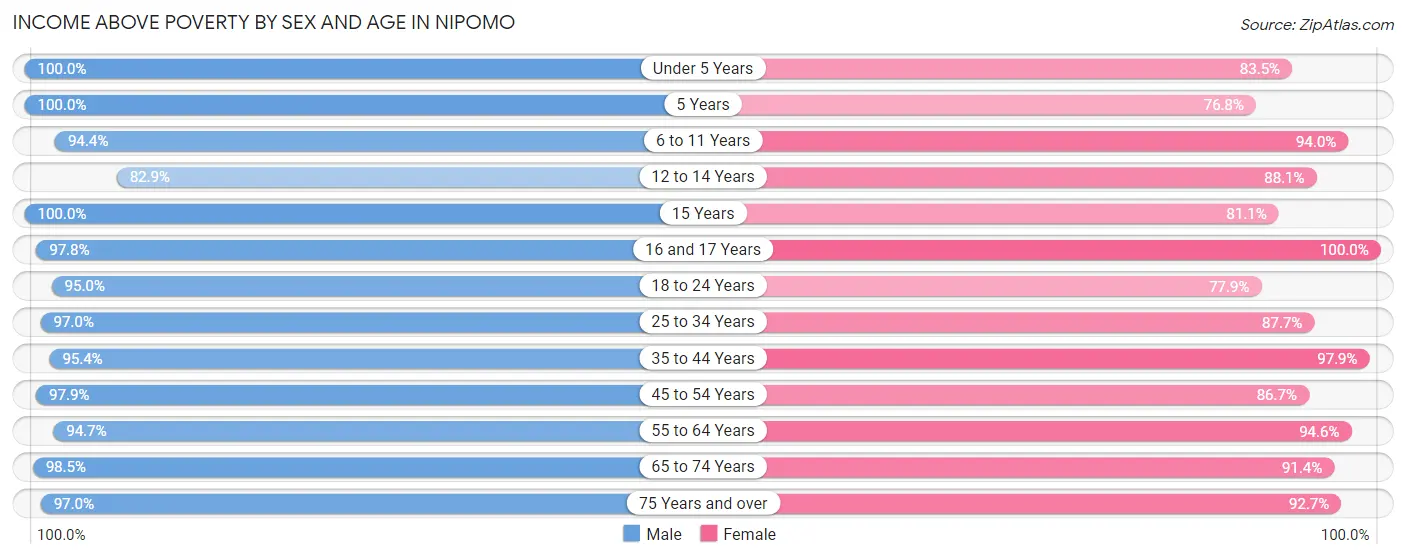
| Age Bracket | Male | Female |
| Under 5 Years | 468 (100.0%) | 406 (83.5%) |
| 5 Years | 76 (100.0%) | 73 (76.8%) |
| 6 to 11 Years | 401 (94.4%) | 531 (94.0%) |
| 12 to 14 Years | 611 (82.9%) | 340 (88.1%) |
| 15 Years | 50 (100.0%) | 167 (81.1%) |
| 16 and 17 Years | 404 (97.8%) | 291 (100.0%) |
| 18 to 24 Years | 833 (95.0%) | 766 (77.8%) |
| 25 to 34 Years | 884 (97.0%) | 882 (87.7%) |
| 35 to 44 Years | 1,218 (95.4%) | 1,085 (97.9%) |
| 45 to 54 Years | 1,229 (97.9%) | 1,052 (86.7%) |
| 55 to 64 Years | 868 (94.7%) | 937 (94.6%) |
| 65 to 74 Years | 914 (98.5%) | 1,015 (91.4%) |
| 75 Years and over | 583 (97.0%) | 506 (92.7%) |
| Total | 8,539 (95.6%) | 8,051 (89.6%) |
Income Below Poverty Among Married-Couple Families in Nipomo
The poverty statistics for married-couple families in Nipomo show that 0.6% or 20 of the total 3,236 families live below the poverty line. Families with 3 or 4 children have the highest poverty rate of 8.0%, comprising of 20 families. On the other hand, families with no children have the lowest poverty rate of 0.0%, which includes 0 families.
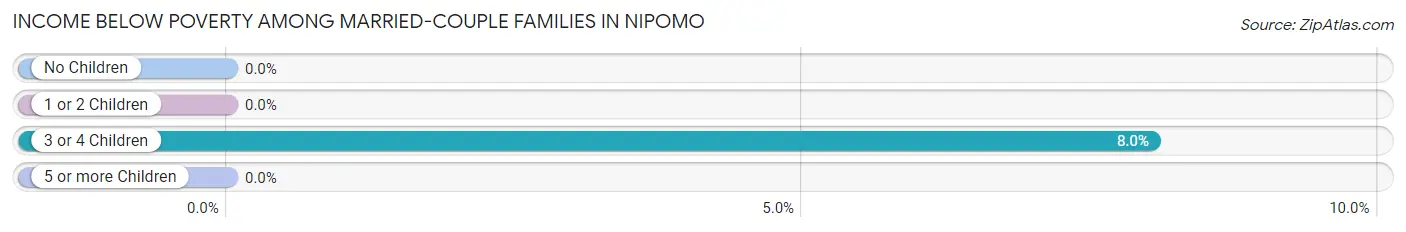
| Children | Above Poverty | Below Poverty |
| No Children | 1,681 (100.0%) | 0 (0.0%) |
| 1 or 2 Children | 1,251 (100.0%) | 0 (0.0%) |
| 3 or 4 Children | 229 (92.0%) | 20 (8.0%) |
| 5 or more Children | 55 (100.0%) | 0 (0.0%) |
| Total | 3,216 (99.4%) | 20 (0.6%) |
Income Below Poverty Among Single-Parent Households in Nipomo
According to the poverty data in Nipomo, 5.5% or 17 single-father households and 25.2% or 209 single-mother households are living below the poverty line. Among single-father households, those with 1 or 2 children have the highest poverty rate, with 17 households (15.6%) experiencing poverty. Likewise, among single-mother households, those with 3 or 4 children have the highest poverty rate, with 40 households (55.6%) falling below the poverty line.
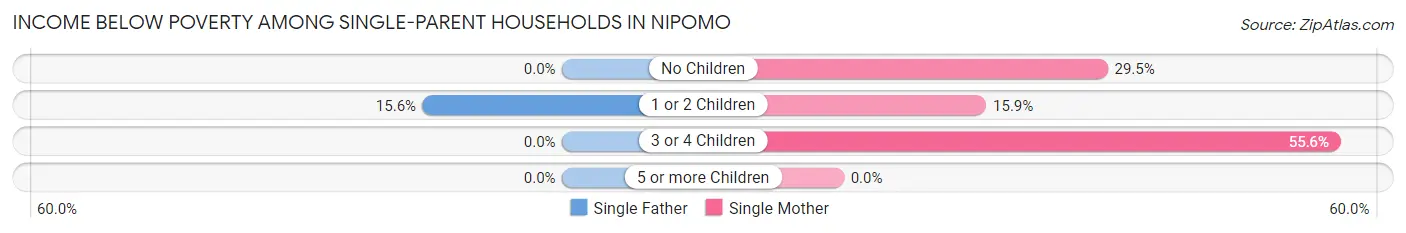
| Children | Single Father | Single Mother |
| No Children | 0 (0.0%) | 105 (29.5%) |
| 1 or 2 Children | 17 (15.6%) | 64 (15.9%) |
| 3 or 4 Children | 0 (0.0%) | 40 (55.6%) |
| 5 or more Children | 0 (0.0%) | 0 (0.0%) |
| Total | 17 (5.5%) | 209 (25.2%) |
Income Below Poverty Among Married-Couple vs Single-Parent Households in Nipomo
The poverty data for Nipomo shows that 20 of the married-couple family households (0.6%) and 226 of the single-parent households (19.9%) are living below the poverty level. Within the married-couple family households, those with 3 or 4 children have the highest poverty rate, with 20 households (8.0%) falling below the poverty line. Among the single-parent households, those with 3 or 4 children have the highest poverty rate, with 40 household (46.0%) living below poverty.
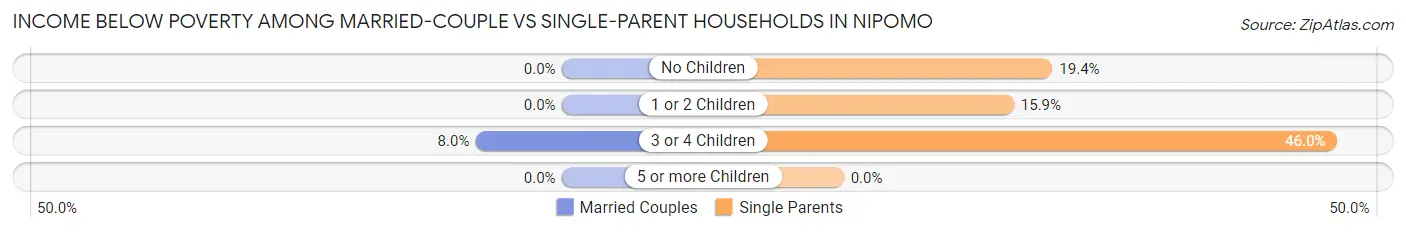
| Children | Married-Couple Families | Single-Parent Households |
| No Children | 0 (0.0%) | 105 (19.4%) |
| 1 or 2 Children | 0 (0.0%) | 81 (15.9%) |
| 3 or 4 Children | 20 (8.0%) | 40 (46.0%) |
| 5 or more Children | 0 (0.0%) | 0 (0.0%) |
| Total | 20 (0.6%) | 226 (19.9%) |
Race in Nipomo
The most populous races in Nipomo are White / Caucasian (11,337 | 62.9%), Hispanic or Latino (9,275 | 51.5%), and Two or more Races (3,563 | 19.8%).
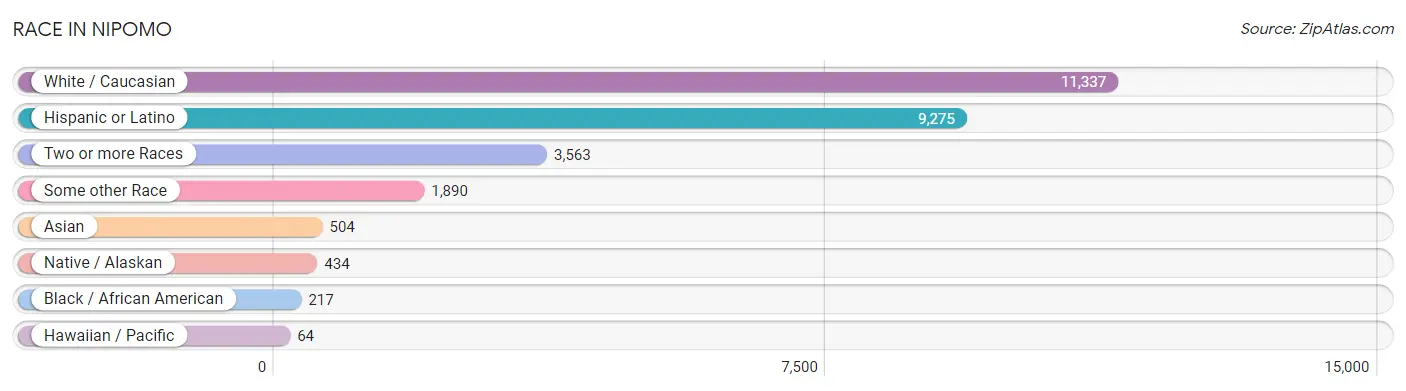
| Race | # Population | % Population |
| Asian | 504 | 2.8% |
| Black / African American | 217 | 1.2% |
| Hawaiian / Pacific | 64 | 0.4% |
| Hispanic or Latino | 9,275 | 51.5% |
| Native / Alaskan | 434 | 2.4% |
| White / Caucasian | 11,337 | 62.9% |
| Two or more Races | 3,563 | 19.8% |
| Some other Race | 1,890 | 10.5% |
| Total | 18,009 | 100.0% |
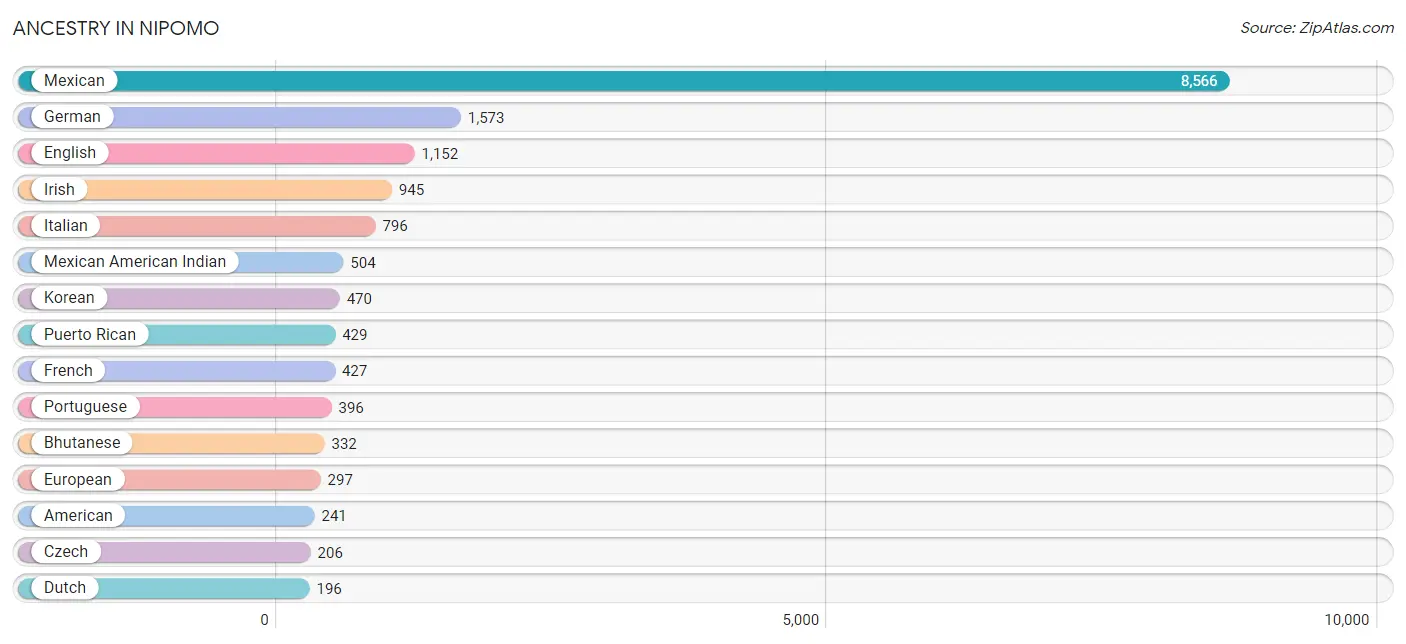
Ancestry in Nipomo
The most populous ancestries reported in Nipomo are Mexican (8,566 | 47.6%), German (1,573 | 8.7%), English (1,152 | 6.4%), Irish (945 | 5.2%), and Italian (796 | 4.4%), together accounting for 72.4% of all Nipomo residents.
| Ancestry | # Population | % Population |
| African | 10 | 0.1% |
| American | 241 | 1.3% |
| Arab | 99 | 0.5% |
| Argentinean | 20 | 0.1% |
| Armenian | 66 | 0.4% |
| Belgian | 14 | 0.1% |
| Bhutanese | 332 | 1.8% |
| Blackfeet | 30 | 0.2% |
| British | 153 | 0.9% |
| Bulgarian | 26 | 0.1% |
| Burmese | 132 | 0.7% |
| Canadian | 111 | 0.6% |
| Central American | 32 | 0.2% |
| Cherokee | 6 | 0.0% |
| Creek | 6 | 0.0% |
| Czech | 206 | 1.1% |
| Danish | 70 | 0.4% |
| Dutch | 196 | 1.1% |
| Eastern European | 51 | 0.3% |
| English | 1,152 | 6.4% |
| European | 297 | 1.7% |
| Filipino | 20 | 0.1% |
| Finnish | 11 | 0.1% |
| French | 427 | 2.4% |
| French Canadian | 52 | 0.3% |
| German | 1,573 | 8.7% |
| Guamanian / Chamorro | 37 | 0.2% |
| Guatemalan | 32 | 0.2% |
| Hungarian | 5 | 0.0% |
| Indian (Asian) | 11 | 0.1% |
| Irish | 945 | 5.2% |
| Italian | 796 | 4.4% |
| Korean | 470 | 2.6% |
| Lithuanian | 13 | 0.1% |
| Mexican | 8,566 | 47.6% |
| Mexican American Indian | 504 | 2.8% |
| Northern European | 116 | 0.6% |
| Norwegian | 114 | 0.6% |
| Palestinian | 74 | 0.4% |
| Polish | 132 | 0.7% |
| Portuguese | 396 | 2.2% |
| Puerto Rican | 429 | 2.4% |
| Russian | 136 | 0.8% |
| Samoan | 133 | 0.7% |
| Scandinavian | 31 | 0.2% |
| Scotch-Irish | 62 | 0.3% |
| Scottish | 130 | 0.7% |
| Slovak | 15 | 0.1% |
| South American | 20 | 0.1% |
| Spaniard | 93 | 0.5% |
| Spanish | 71 | 0.4% |
| Sri Lankan | 1 | 0.0% |
| Subsaharan African | 10 | 0.1% |
| Swedish | 125 | 0.7% |
| Swiss | 60 | 0.3% |
| Thai | 23 | 0.1% |
| Welsh | 19 | 0.1% |
| Yugoslavian | 19 | 0.1% | View All 58 Rows |
Immigrants in Nipomo
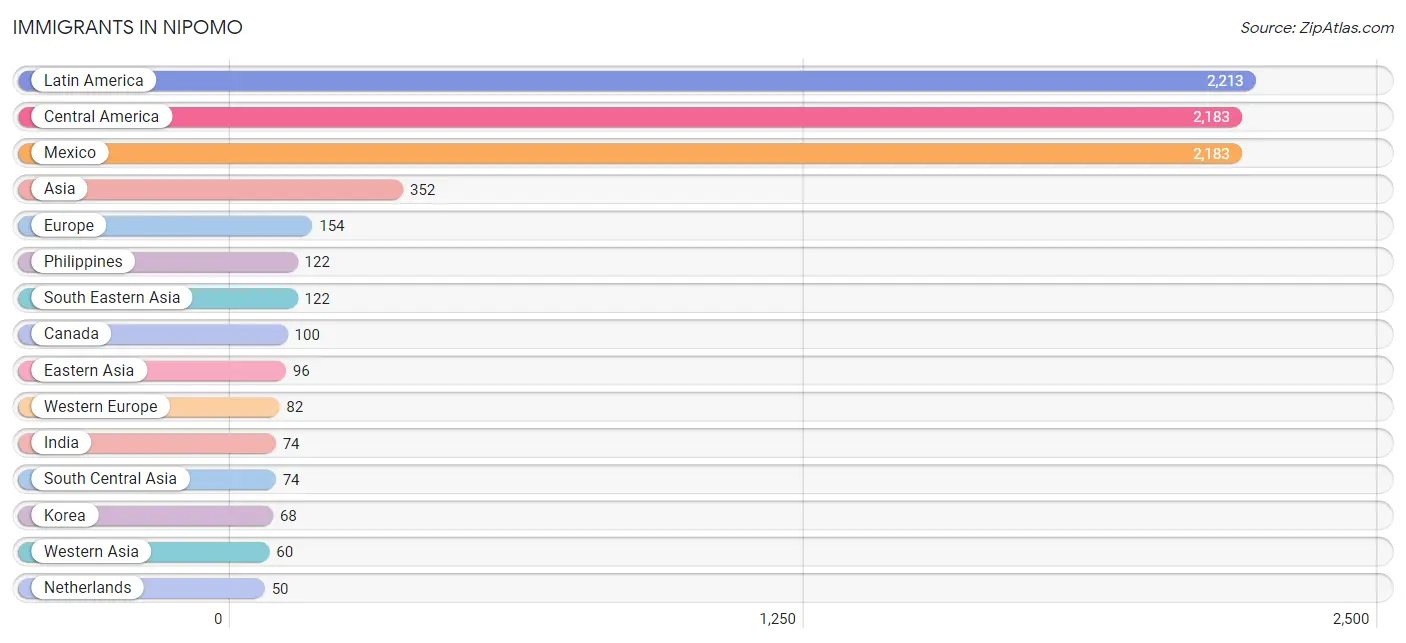
The most numerous immigrant groups reported in Nipomo came from Latin America (2,213 | 12.3%), Central America (2,183 | 12.1%), Mexico (2,183 | 12.1%), Asia (352 | 1.9%), and Europe (154 | 0.9%), together accounting for 39.3% of all Nipomo residents.
| Immigration Origin | # Population | % Population |
| Argentina | 30 | 0.2% |
| Asia | 352 | 1.9% |
| Azores | 30 | 0.2% |
| Bulgaria | 13 | 0.1% |
| Canada | 100 | 0.6% |
| Central America | 2,183 | 12.1% |
| China | 5 | 0.0% |
| Eastern Asia | 96 | 0.5% |
| Eastern Europe | 13 | 0.1% |
| England | 7 | 0.0% |
| Europe | 154 | 0.9% |
| Germany | 32 | 0.2% |
| India | 74 | 0.4% |
| Iraq | 25 | 0.1% |
| Japan | 23 | 0.1% |
| Jordan | 35 | 0.2% |
| Korea | 68 | 0.4% |
| Latin America | 2,213 | 12.3% |
| Mexico | 2,183 | 12.1% |
| Netherlands | 50 | 0.3% |
| Northern Europe | 29 | 0.2% |
| Oceania | 14 | 0.1% |
| Philippines | 122 | 0.7% |
| Portugal | 30 | 0.2% |
| Scotland | 14 | 0.1% |
| South America | 30 | 0.2% |
| South Central Asia | 74 | 0.4% |
| South Eastern Asia | 122 | 0.7% |
| Southern Europe | 30 | 0.2% |
| Taiwan | 5 | 0.0% |
| Western Asia | 60 | 0.3% |
| Western Europe | 82 | 0.5% | View All 32 Rows |
Sex and Age in Nipomo
Sex and Age in Nipomo
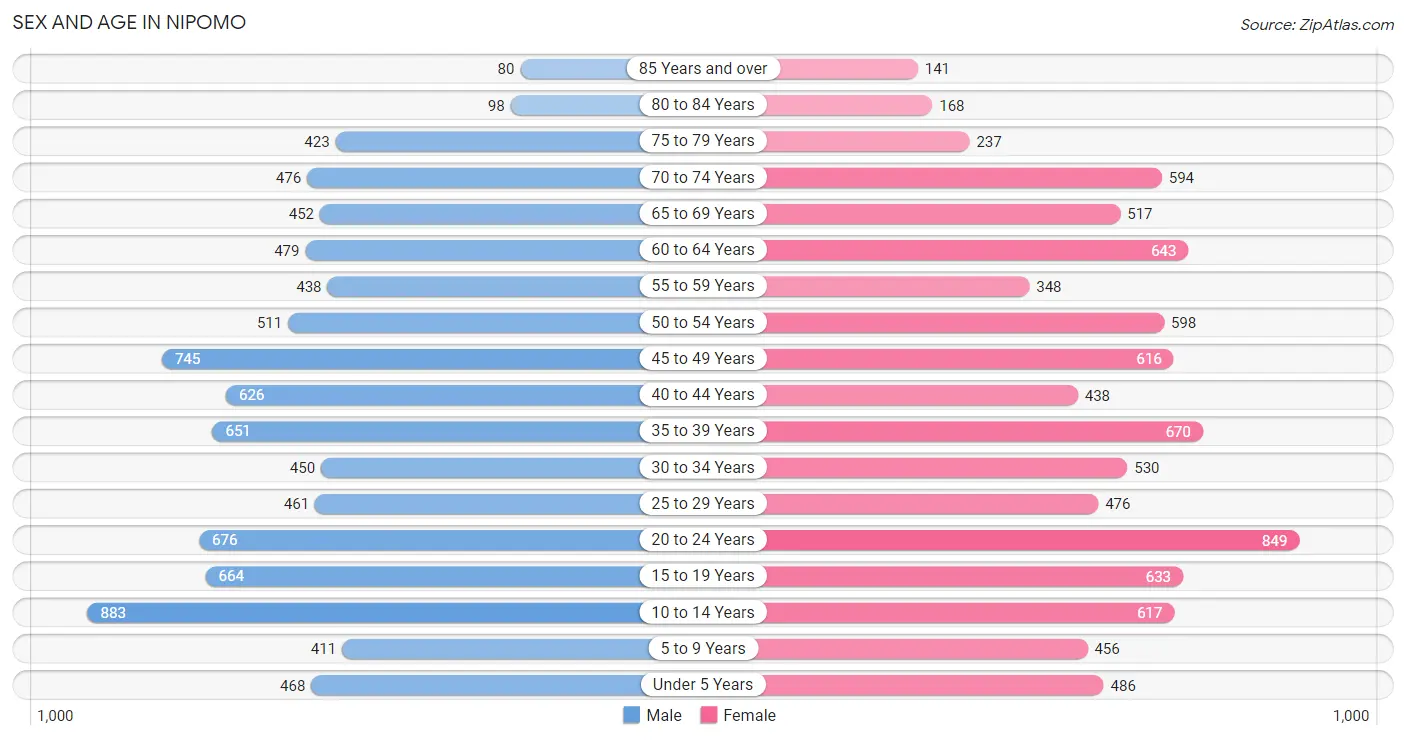
The most populous age groups in Nipomo are 10 to 14 Years (883 | 9.8%) for men and 20 to 24 Years (849 | 9.4%) for women.
| Age Bracket | Male | Female |
| Under 5 Years | 468 (5.2%) | 486 (5.4%) |
| 5 to 9 Years | 411 (4.6%) | 456 (5.1%) |
| 10 to 14 Years | 883 (9.8%) | 617 (6.8%) |
| 15 to 19 Years | 664 (7.4%) | 633 (7.0%) |
| 20 to 24 Years | 676 (7.5%) | 849 (9.4%) |
| 25 to 29 Years | 461 (5.1%) | 476 (5.3%) |
| 30 to 34 Years | 450 (5.0%) | 530 (5.9%) |
| 35 to 39 Years | 651 (7.2%) | 670 (7.4%) |
| 40 to 44 Years | 626 (7.0%) | 438 (4.9%) |
| 45 to 49 Years | 745 (8.3%) | 616 (6.8%) |
| 50 to 54 Years | 511 (5.7%) | 598 (6.6%) |
| 55 to 59 Years | 438 (4.9%) | 348 (3.9%) |
| 60 to 64 Years | 479 (5.3%) | 643 (7.1%) |
| 65 to 69 Years | 452 (5.0%) | 517 (5.7%) |
| 70 to 74 Years | 476 (5.3%) | 594 (6.6%) |
| 75 to 79 Years | 423 (4.7%) | 237 (2.6%) |
| 80 to 84 Years | 98 (1.1%) | 168 (1.9%) |
| 85 Years and over | 80 (0.9%) | 141 (1.6%) |
| Total | 8,992 (100.0%) | 9,017 (100.0%) |
Families and Households in Nipomo
Median Family Size in Nipomo
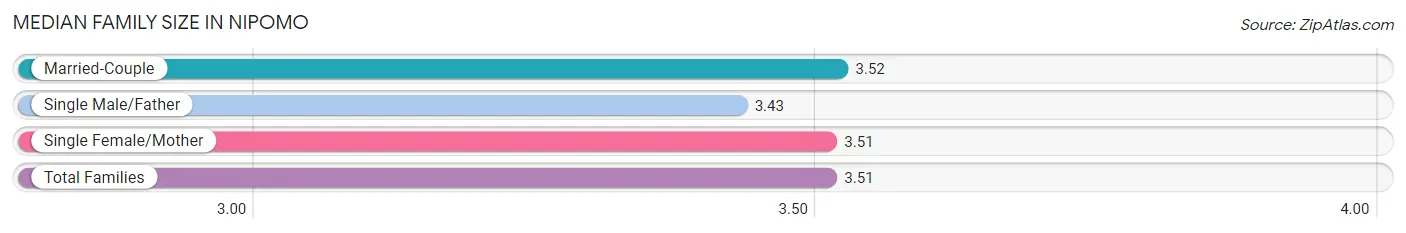
The median family size in Nipomo is 3.51 persons per family, with married-couple families (3,236 | 74.0%) accounting for the largest median family size of 3.52 persons per family. On the other hand, single male/father families (308 | 7.0%) represent the smallest median family size with 3.43 persons per family.
| Family Type | # Families | Family Size |
| Married-Couple | 3,236 (74.0%) | 3.52 |
| Single Male/Father | 308 (7.0%) | 3.43 |
| Single Female/Mother | 830 (19.0%) | 3.51 |
| Total Families | 4,374 (100.0%) | 3.51 |
Median Household Size in Nipomo
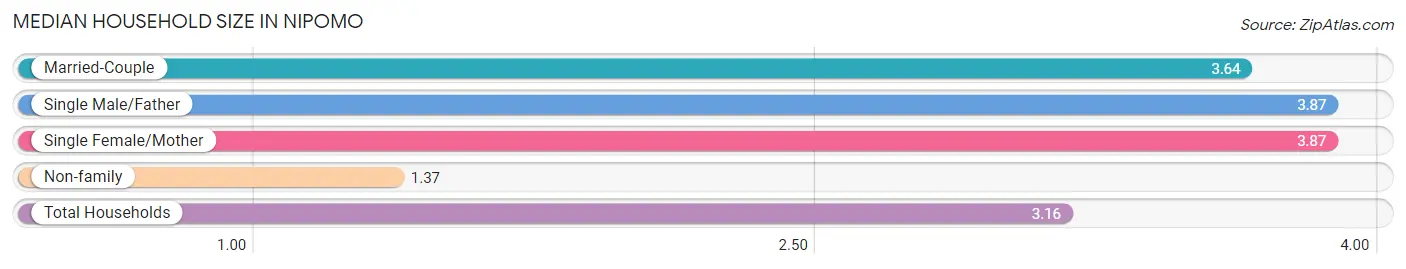
The median household size in Nipomo is 3.16 persons per household, with single male/father households (308 | 5.4%) accounting for the largest median household size of 3.87 persons per household. non-family households (1,320 | 23.2%) represent the smallest median household size with 1.37 persons per household.
| Household Type | # Households | Household Size |
| Married-Couple | 3,236 (56.8%) | 3.64 |
| Single Male/Father | 308 (5.4%) | 3.87 |
| Single Female/Mother | 830 (14.6%) | 3.87 |
| Non-family | 1,320 (23.2%) | 1.37 |
| Total Households | 5,694 (100.0%) | 3.16 |
Household Size by Marriage Status in Nipomo
Out of a total of 5,694 households in Nipomo, 4,374 (76.8%) are family households, while 1,320 (23.2%) are nonfamily households. The most numerous type of family households are 2-person households, comprising 1,522, and the most common type of nonfamily households are 1-person households, comprising 929.
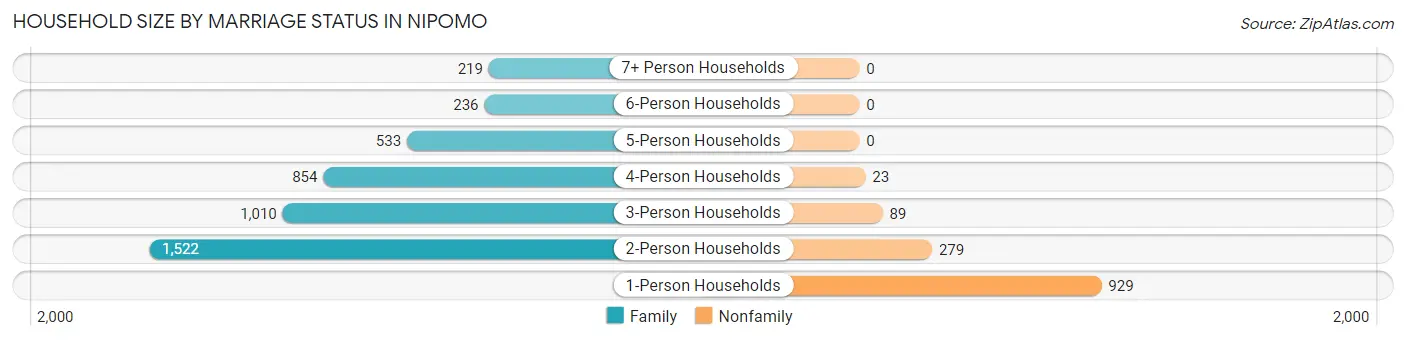
| Household Size | Family Households | Nonfamily Households |
| 1-Person Households | - | 929 (16.3%) |
| 2-Person Households | 1,522 (26.7%) | 279 (4.9%) |
| 3-Person Households | 1,010 (17.7%) | 89 (1.6%) |
| 4-Person Households | 854 (15.0%) | 23 (0.4%) |
| 5-Person Households | 533 (9.4%) | 0 (0.0%) |
| 6-Person Households | 236 (4.1%) | 0 (0.0%) |
| 7+ Person Households | 219 (3.8%) | 0 (0.0%) |
| Total | 4,374 (76.8%) | 1,320 (23.2%) |
Female Fertility in Nipomo
Fertility by Age in Nipomo
Average fertility rate in Nipomo is 42.0 births per 1,000 women. Women in the age bracket of 20 to 34 years have the highest fertility rate with 99.0 births per 1,000 women. Women in the age bracket of 20 to 34 years acount for 100.0% of all women with births.
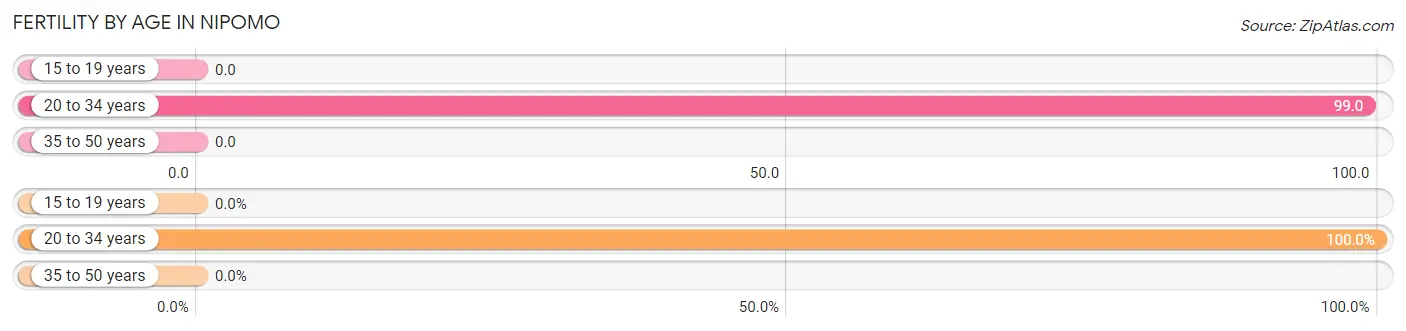
| Age Bracket | Women with Births | Births / 1,000 Women |
| 15 to 19 years | 0 (0.0%) | 0.0 |
| 20 to 34 years | 184 (100.0%) | 99.0 |
| 35 to 50 years | 0 (0.0%) | 0.0 |
| Total | 184 (100.0%) | 42.0 |
Fertility by Age by Marriage Status in Nipomo
54.9% of women with births (184) in Nipomo are married. The highest percentage of unmarried women with births falls into 20 to 34 years age bracket with 45.1% of them unmarried at the time of birth, while the lowest percentage of unmarried women with births belong to 20 to 34 years age bracket with 45.1% of them unmarried.
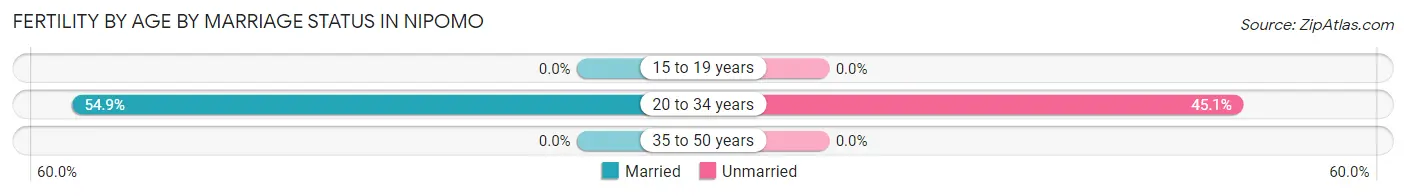
| Age Bracket | Married | Unmarried |
| 15 to 19 years | 0 (0.0%) | 0 (0.0%) |
| 20 to 34 years | 101 (54.9%) | 83 (45.1%) |
| 35 to 50 years | 0 (0.0%) | 0 (0.0%) |
| Total | 101 (54.9%) | 83 (45.1%) |
Fertility by Education in Nipomo
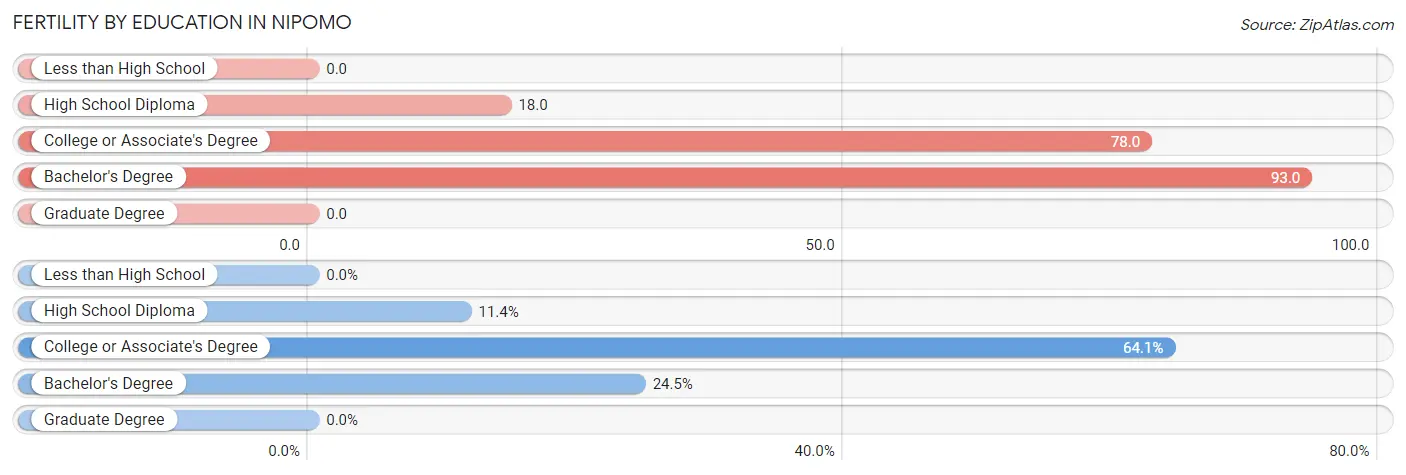
| Educational Attainment | Women with Births | Births / 1,000 Women |
| Less than High School | 0 (0.0%) | 0.0 |
| High School Diploma | 21 (11.4%) | 18.0 |
| College or Associate's Degree | 118 (64.1%) | 78.0 |
| Bachelor's Degree | 45 (24.5%) | 93.0 |
| Graduate Degree | 0 (0.0%) | 0.0 |
| Total | 184 (100.0%) | 42.0 |
Fertility by Education by Marriage Status in Nipomo
45.1% of women with births in Nipomo are unmarried. Women with the educational attainment of bachelor's degree are most likely to be married with 100.0% of them married at childbirth, while women with the educational attainment of college or associate's degree are least likely to be married with 64.4% of them unmarried at childbirth.
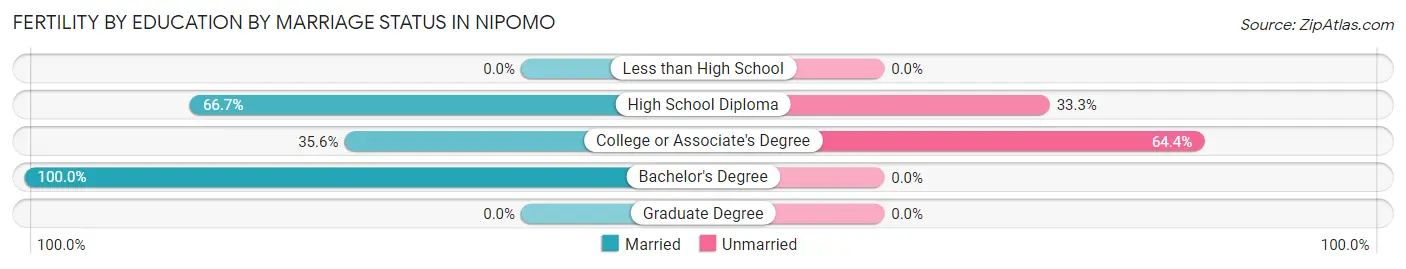
| Educational Attainment | Married | Unmarried |
| Less than High School | 0 (0.0%) | 0 (0.0%) |
| High School Diploma | 14 (66.7%) | 7 (33.3%) |
| College or Associate's Degree | 42 (35.6%) | 76 (64.4%) |
| Bachelor's Degree | 45 (100.0%) | 0 (0.0%) |
| Graduate Degree | 0 (0.0%) | 0 (0.0%) |
| Total | 101 (54.9%) | 83 (45.1%) |
Employment Characteristics in Nipomo
Employment by Class of Employer in Nipomo
Among the 7,957 employed individuals in Nipomo, private company employees (5,298 | 66.6%), local government employees (698 | 8.8%), and self-employed (not incorporated) (502 | 6.3%) make up the most common classes of employment.
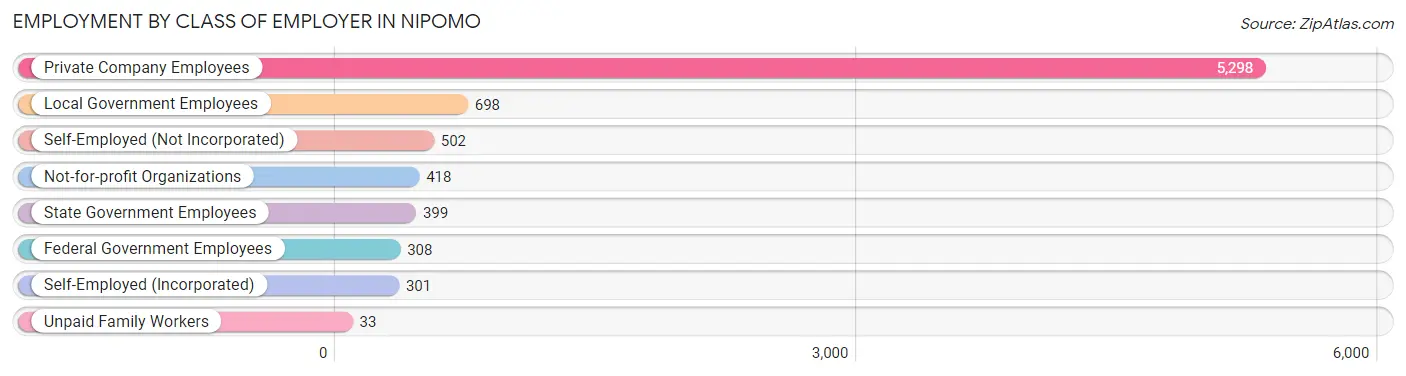
| Employer Class | # Employees | % Employees |
| Private Company Employees | 5,298 | 66.6% |
| Self-Employed (Incorporated) | 301 | 3.8% |
| Self-Employed (Not Incorporated) | 502 | 6.3% |
| Not-for-profit Organizations | 418 | 5.2% |
| Local Government Employees | 698 | 8.8% |
| State Government Employees | 399 | 5.0% |
| Federal Government Employees | 308 | 3.9% |
| Unpaid Family Workers | 33 | 0.4% |
| Total | 7,957 | 100.0% |
Employment Status by Age in Nipomo
According to the labor force statistics for Nipomo, out of the total population over 16 years of age (14,432), 58.7% or 8,472 individuals are in the labor force, with 4.0% or 339 of them unemployed. The age group with the highest labor force participation rate is 35 to 44 years, with 90.7% or 2,163 individuals in the labor force. Within the labor force, the 65 to 74 years age range has the highest percentage of unemployed individuals, with 25.4% or 104 of them being unemployed.
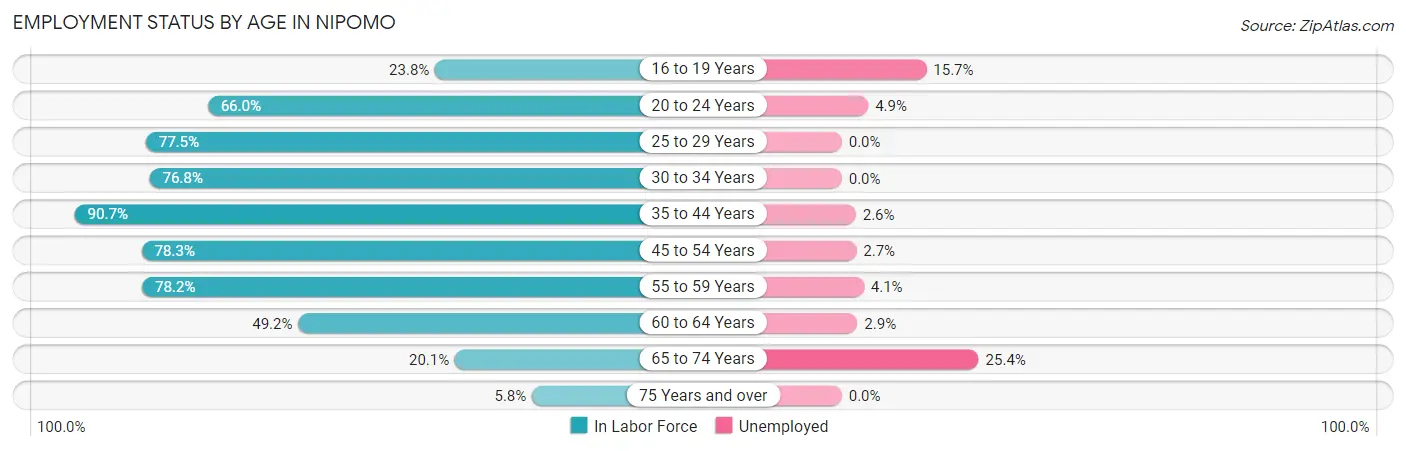
| Age Bracket | In Labor Force | Unemployed |
| 16 to 19 Years | 248 (23.8%) | 39 (15.7%) |
| 20 to 24 Years | 1,006 (66.0%) | 49 (4.9%) |
| 25 to 29 Years | 726 (77.5%) | 0 (0.0%) |
| 30 to 34 Years | 753 (76.8%) | 0 (0.0%) |
| 35 to 44 Years | 2,163 (90.7%) | 56 (2.6%) |
| 45 to 54 Years | 1,934 (78.3%) | 52 (2.7%) |
| 55 to 59 Years | 615 (78.2%) | 25 (4.1%) |
| 60 to 64 Years | 552 (49.2%) | 16 (2.9%) |
| 65 to 74 Years | 410 (20.1%) | 104 (25.4%) |
| 75 Years and over | 67 (5.8%) | 0 (0.0%) |
| Total | 8,472 (58.7%) | 339 (4.0%) |
Employment Status by Educational Attainment in Nipomo
According to labor force statistics for Nipomo, 77.7% of individuals (6,744) out of the total population between 25 and 64 years of age (8,680) are in the labor force, with 2.2% or 148 of them being unemployed. The group with the highest labor force participation rate are those with the educational attainment of high school diploma, with 81.4% or 1,809 individuals in the labor force. Within the labor force, individuals with college / associate degree education have the highest percentage of unemployment, with 3.0% or 74 of them being unemployed.
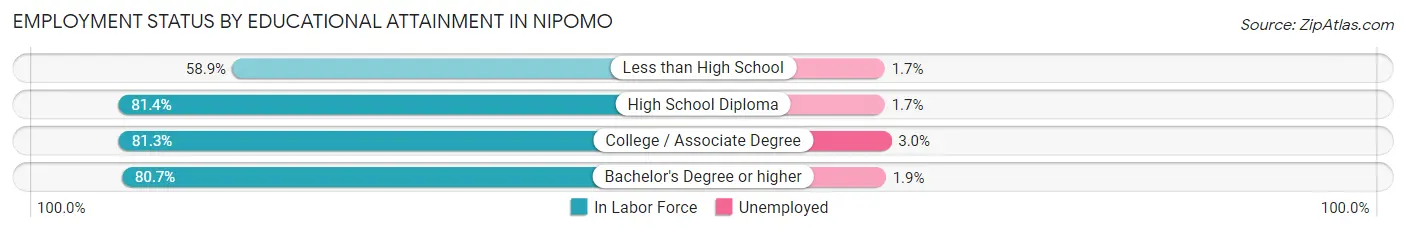
| Educational Attainment | In Labor Force | Unemployed |
| Less than High School | 802 (58.9%) | 23 (1.7%) |
| High School Diploma | 1,809 (81.4%) | 38 (1.7%) |
| College / Associate Degree | 2,451 (81.3%) | 90 (3.0%) |
| Bachelor's Degree or higher | 1,680 (80.7%) | 40 (1.9%) |
| Total | 6,744 (77.7%) | 191 (2.2%) |
Employment Occupations by Sex in Nipomo
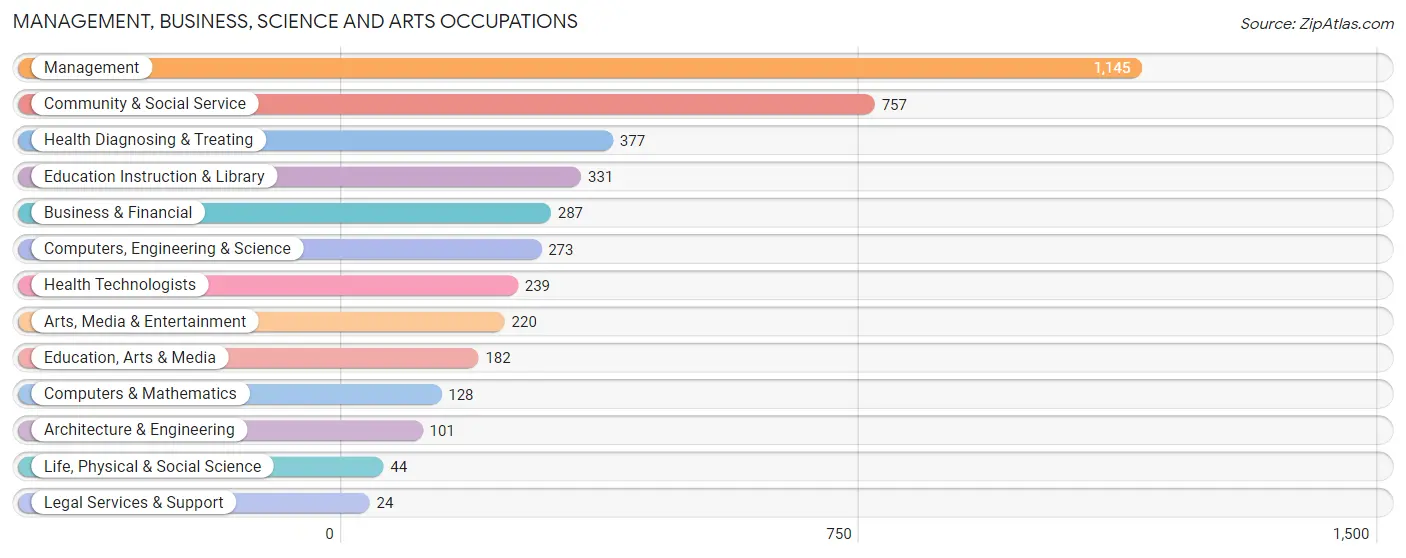
Management, Business, Science and Arts Occupations
The most common Management, Business, Science and Arts occupations in Nipomo are Management (1,145 | 14.1%), Community & Social Service (757 | 9.3%), Health Diagnosing & Treating (377 | 4.6%), Education Instruction & Library (331 | 4.1%), and Business & Financial (287 | 3.5%).
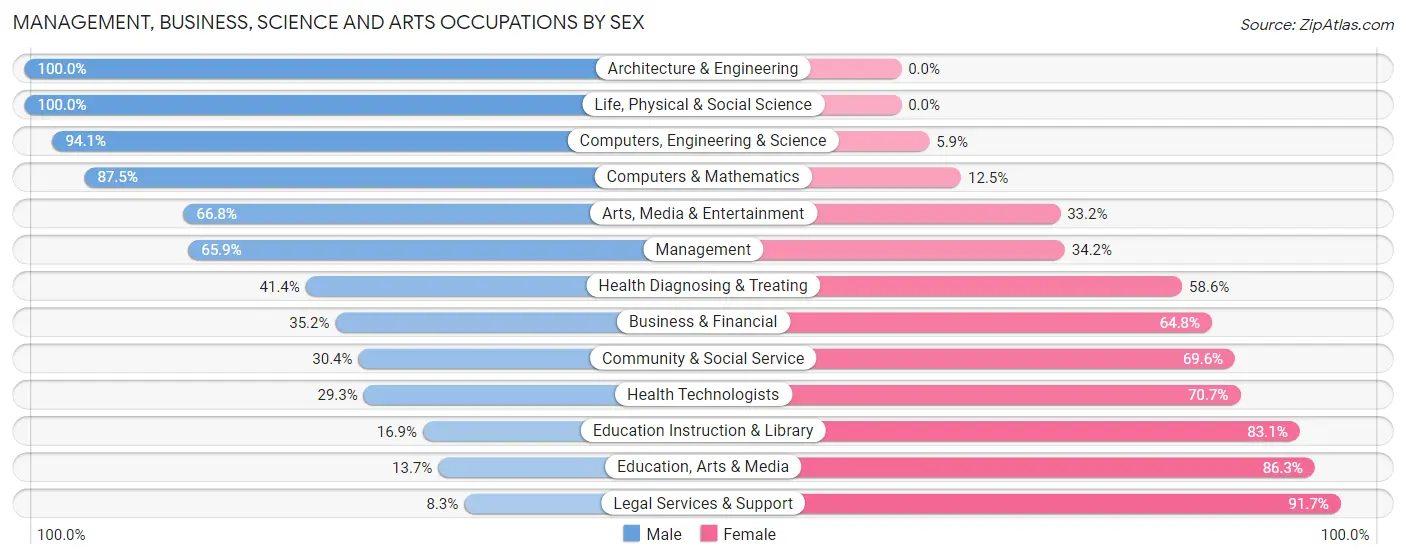
Management, Business, Science and Arts Occupations by Sex
Within the Management, Business, Science and Arts occupations in Nipomo, the most male-oriented occupations are Architecture & Engineering (100.0%), Life, Physical & Social Science (100.0%), and Computers, Engineering & Science (94.1%), while the most female-oriented occupations are Legal Services & Support (91.7%), Education, Arts & Media (86.3%), and Education Instruction & Library (83.1%).
| Occupation | Male | Female |
| Management | 754 (65.8%) | 391 (34.2%) |
| Business & Financial | 101 (35.2%) | 186 (64.8%) |
| Computers, Engineering & Science | 257 (94.1%) | 16 (5.9%) |
| Computers & Mathematics | 112 (87.5%) | 16 (12.5%) |
| Architecture & Engineering | 101 (100.0%) | 0 (0.0%) |
| Life, Physical & Social Science | 44 (100.0%) | 0 (0.0%) |
| Community & Social Service | 230 (30.4%) | 527 (69.6%) |
| Education, Arts & Media | 25 (13.7%) | 157 (86.3%) |
| Legal Services & Support | 2 (8.3%) | 22 (91.7%) |
| Education Instruction & Library | 56 (16.9%) | 275 (83.1%) |
| Arts, Media & Entertainment | 147 (66.8%) | 73 (33.2%) |
| Health Diagnosing & Treating | 156 (41.4%) | 221 (58.6%) |
| Health Technologists | 70 (29.3%) | 169 (70.7%) |
| Total (Category) | 1,498 (52.8%) | 1,341 (47.2%) |
| Total (Overall) | 4,615 (56.7%) | 3,518 (43.3%) |
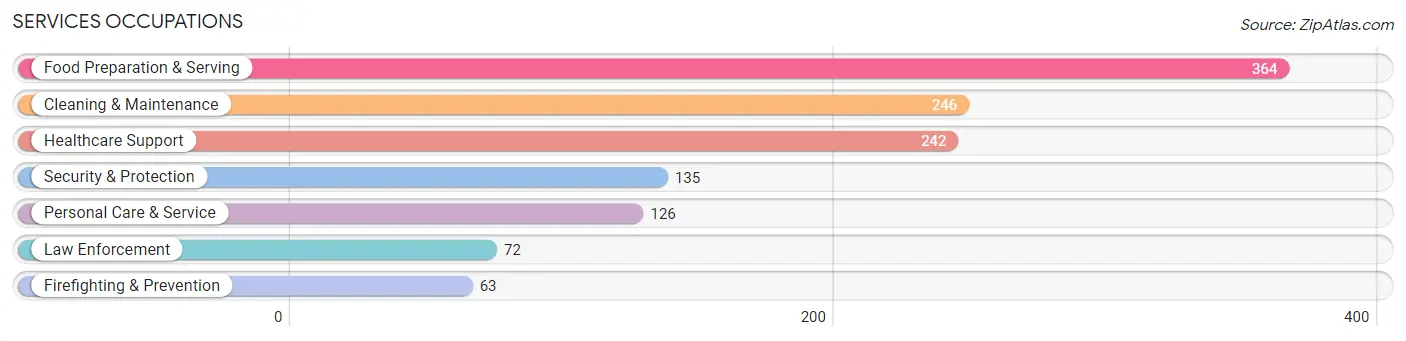
Services Occupations
The most common Services occupations in Nipomo are Food Preparation & Serving (364 | 4.5%), Cleaning & Maintenance (246 | 3.0%), Healthcare Support (242 | 3.0%), Security & Protection (135 | 1.7%), and Personal Care & Service (126 | 1.5%).
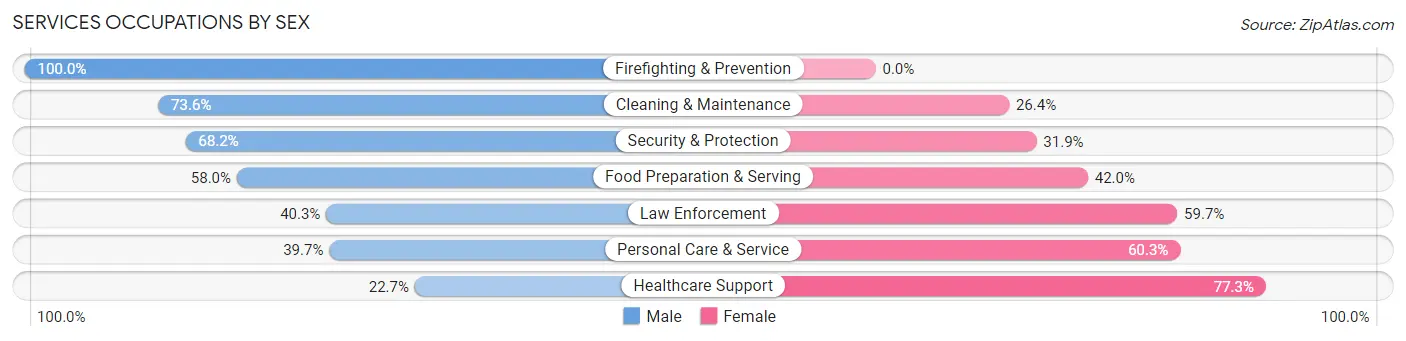
Services Occupations by Sex
Within the Services occupations in Nipomo, the most male-oriented occupations are Firefighting & Prevention (100.0%), Cleaning & Maintenance (73.6%), and Security & Protection (68.1%), while the most female-oriented occupations are Healthcare Support (77.3%), Personal Care & Service (60.3%), and Law Enforcement (59.7%).
| Occupation | Male | Female |
| Healthcare Support | 55 (22.7%) | 187 (77.3%) |
| Security & Protection | 92 (68.1%) | 43 (31.9%) |
| Firefighting & Prevention | 63 (100.0%) | 0 (0.0%) |
| Law Enforcement | 29 (40.3%) | 43 (59.7%) |
| Food Preparation & Serving | 211 (58.0%) | 153 (42.0%) |
| Cleaning & Maintenance | 181 (73.6%) | 65 (26.4%) |
| Personal Care & Service | 50 (39.7%) | 76 (60.3%) |
| Total (Category) | 589 (52.9%) | 524 (47.1%) |
| Total (Overall) | 4,615 (56.7%) | 3,518 (43.3%) |
Sales and Office Occupations
The most common Sales and Office occupations in Nipomo are Office & Administration (1,269 | 15.6%), and Sales & Related (707 | 8.7%).
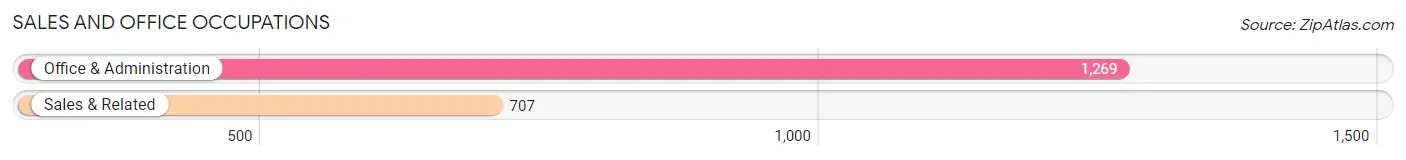
Sales and Office Occupations by Sex
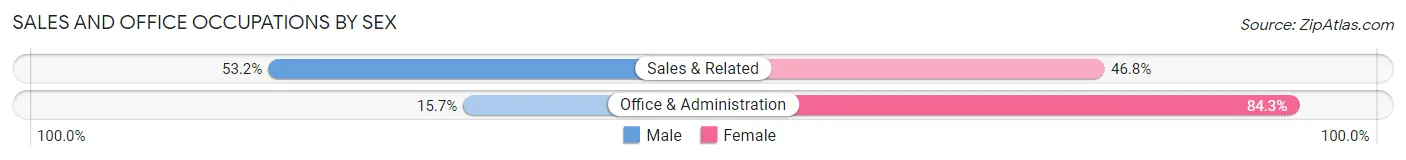
| Occupation | Male | Female |
| Sales & Related | 376 (53.2%) | 331 (46.8%) |
| Office & Administration | 199 (15.7%) | 1,070 (84.3%) |
| Total (Category) | 575 (29.1%) | 1,401 (70.9%) |
| Total (Overall) | 4,615 (56.7%) | 3,518 (43.3%) |
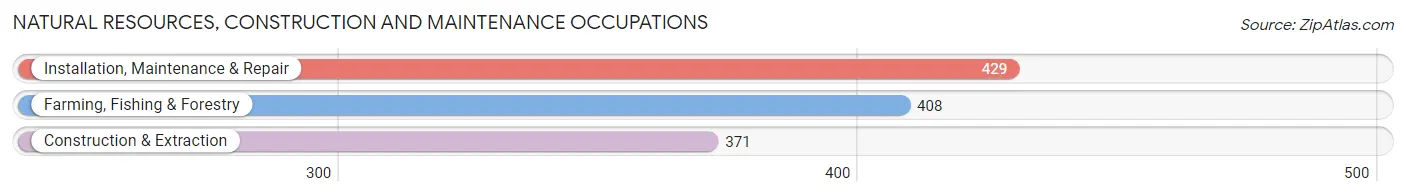
Natural Resources, Construction and Maintenance Occupations
The most common Natural Resources, Construction and Maintenance occupations in Nipomo are Installation, Maintenance & Repair (429 | 5.3%), Farming, Fishing & Forestry (408 | 5.0%), and Construction & Extraction (371 | 4.6%).
Natural Resources, Construction and Maintenance Occupations by Sex
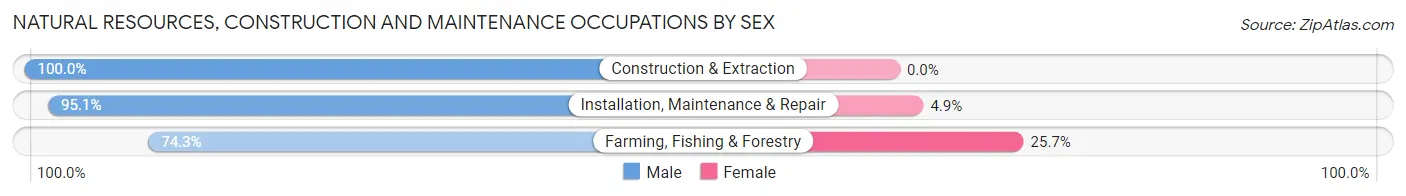
| Occupation | Male | Female |
| Farming, Fishing & Forestry | 303 (74.3%) | 105 (25.7%) |
| Construction & Extraction | 371 (100.0%) | 0 (0.0%) |
| Installation, Maintenance & Repair | 408 (95.1%) | 21 (4.9%) |
| Total (Category) | 1,082 (89.6%) | 126 (10.4%) |
| Total (Overall) | 4,615 (56.7%) | 3,518 (43.3%) |
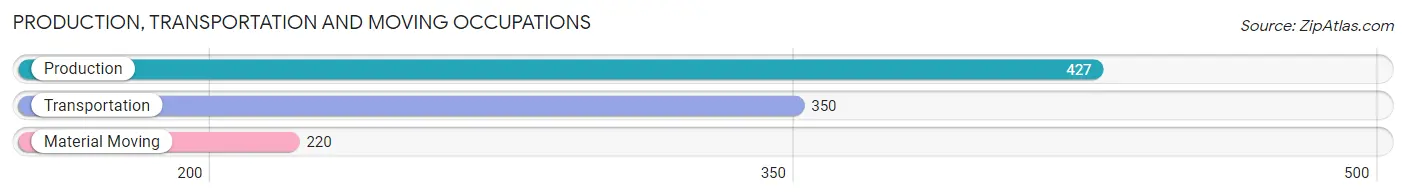
Production, Transportation and Moving Occupations
The most common Production, Transportation and Moving occupations in Nipomo are Production (427 | 5.2%), Transportation (350 | 4.3%), and Material Moving (220 | 2.7%).
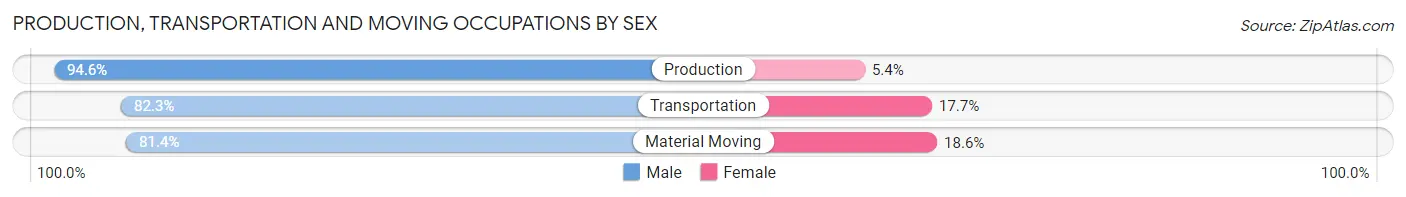
Production, Transportation and Moving Occupations by Sex
| Occupation | Male | Female |
| Production | 404 (94.6%) | 23 (5.4%) |
| Transportation | 288 (82.3%) | 62 (17.7%) |
| Material Moving | 179 (81.4%) | 41 (18.6%) |
| Total (Category) | 871 (87.4%) | 126 (12.6%) |
| Total (Overall) | 4,615 (56.7%) | 3,518 (43.3%) |
Employment Industries by Sex in Nipomo
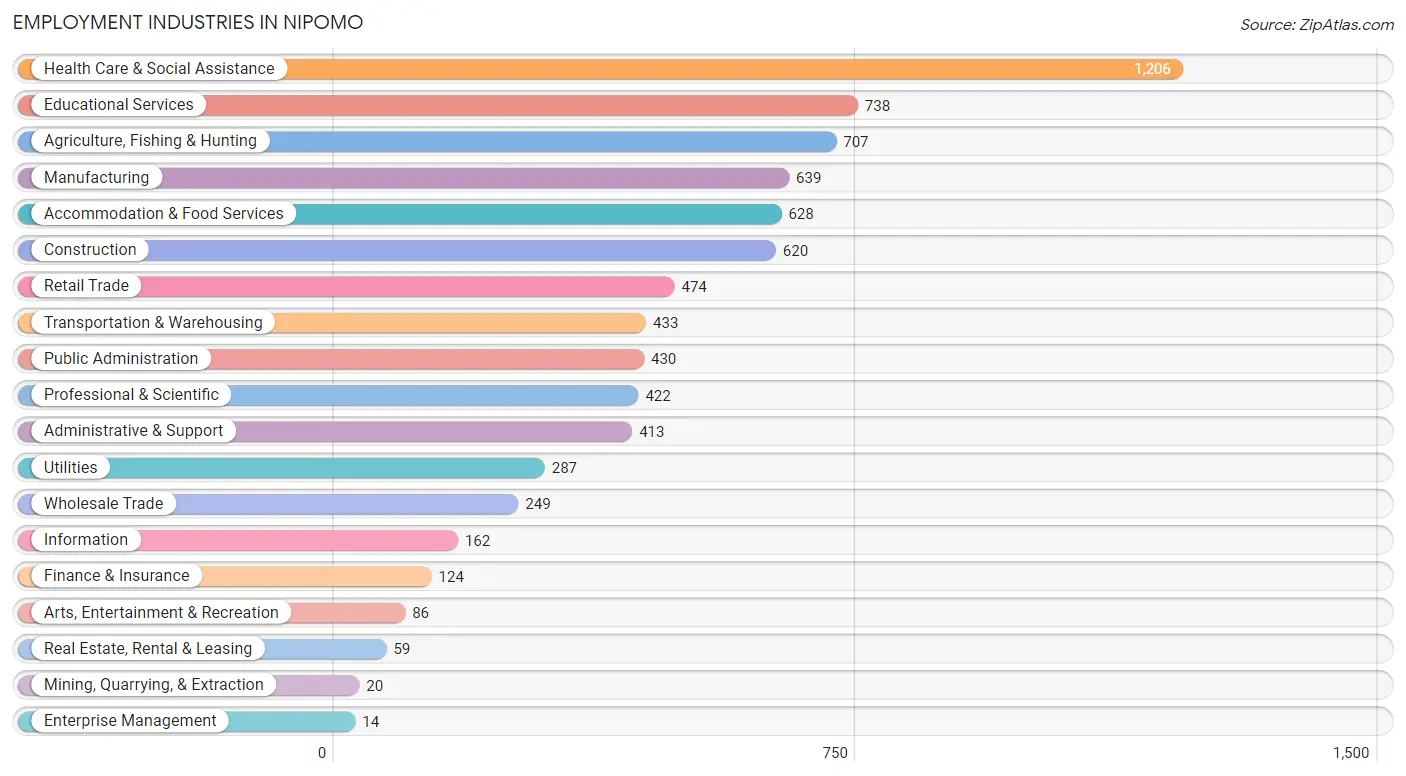
Employment Industries in Nipomo
The major employment industries in Nipomo include Health Care & Social Assistance (1,206 | 14.8%), Educational Services (738 | 9.1%), Agriculture, Fishing & Hunting (707 | 8.7%), Manufacturing (639 | 7.9%), and Accommodation & Food Services (628 | 7.7%).
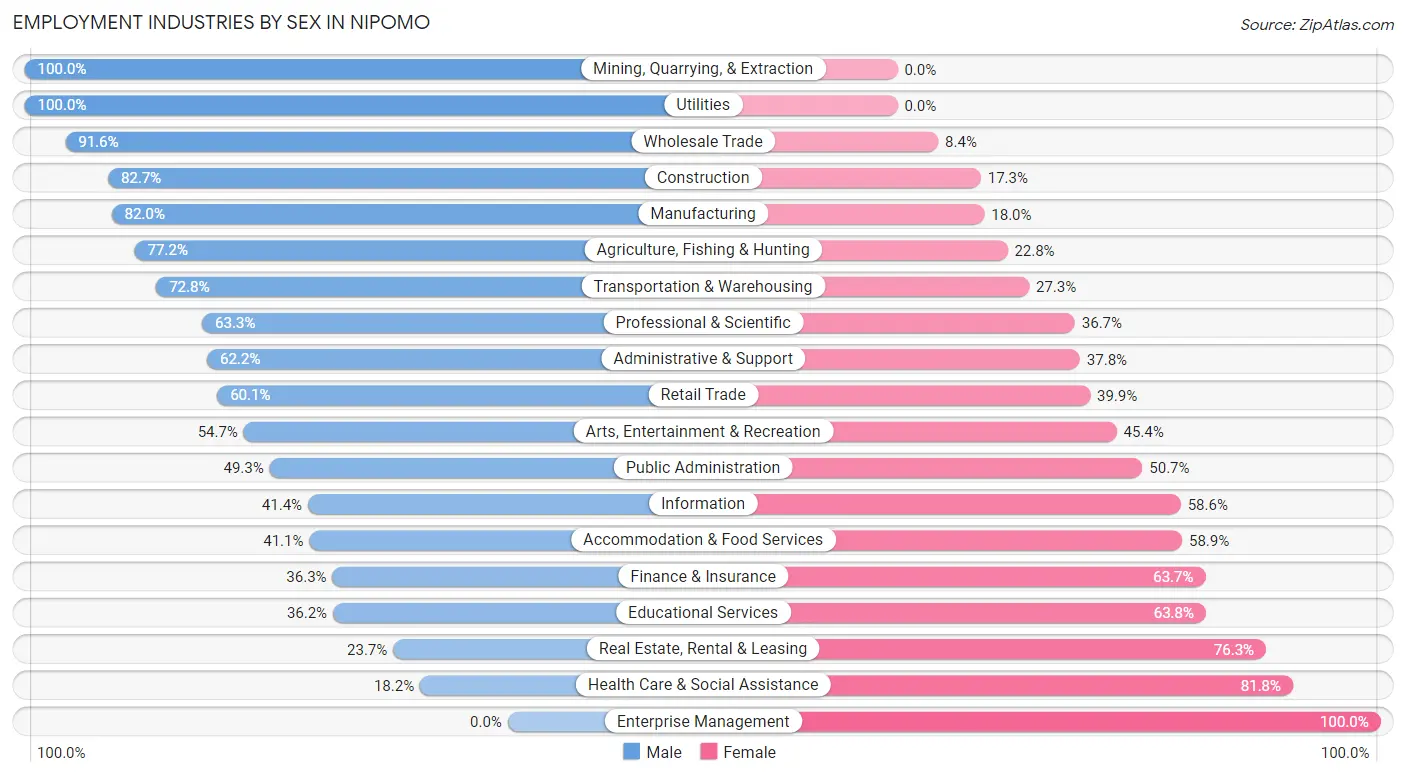
Employment Industries by Sex in Nipomo
The Nipomo industries that see more men than women are Mining, Quarrying, & Extraction (100.0%), Utilities (100.0%), and Wholesale Trade (91.6%), whereas the industries that tend to have a higher number of women are Enterprise Management (100.0%), Health Care & Social Assistance (81.8%), and Real Estate, Rental & Leasing (76.3%).
| Industry | Male | Female |
| Agriculture, Fishing & Hunting | 546 (77.2%) | 161 (22.8%) |
| Mining, Quarrying, & Extraction | 20 (100.0%) | 0 (0.0%) |
| Construction | 513 (82.7%) | 107 (17.3%) |
| Manufacturing | 524 (82.0%) | 115 (18.0%) |
| Wholesale Trade | 228 (91.6%) | 21 (8.4%) |
| Retail Trade | 285 (60.1%) | 189 (39.9%) |
| Transportation & Warehousing | 315 (72.8%) | 118 (27.3%) |
| Utilities | 287 (100.0%) | 0 (0.0%) |
| Information | 67 (41.4%) | 95 (58.6%) |
| Finance & Insurance | 45 (36.3%) | 79 (63.7%) |
| Real Estate, Rental & Leasing | 14 (23.7%) | 45 (76.3%) |
| Professional & Scientific | 267 (63.3%) | 155 (36.7%) |
| Enterprise Management | 0 (0.0%) | 14 (100.0%) |
| Administrative & Support | 257 (62.2%) | 156 (37.8%) |
| Educational Services | 267 (36.2%) | 471 (63.8%) |
| Health Care & Social Assistance | 219 (18.2%) | 987 (81.8%) |
| Arts, Entertainment & Recreation | 47 (54.6%) | 39 (45.4%) |
| Accommodation & Food Services | 258 (41.1%) | 370 (58.9%) |
| Public Administration | 212 (49.3%) | 218 (50.7%) |
| Total | 4,615 (56.7%) | 3,518 (43.3%) |
Education in Nipomo
School Enrollment in Nipomo
The most common levels of schooling among the 4,449 students in Nipomo are high school (1,279 | 28.7%), middle school (1,141 | 25.7%), and college / undergraduate (898 | 20.2%).
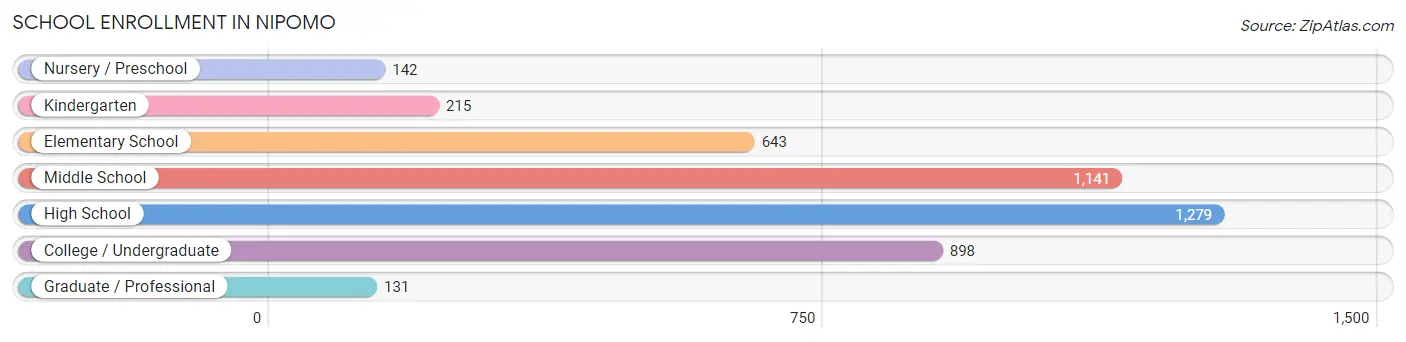
| School Level | # Students | % Students |
| Nursery / Preschool | 142 | 3.2% |
| Kindergarten | 215 | 4.8% |
| Elementary School | 643 | 14.4% |
| Middle School | 1,141 | 25.7% |
| High School | 1,279 | 28.7% |
| College / Undergraduate | 898 | 20.2% |
| Graduate / Professional | 131 | 2.9% |
| Total | 4,449 | 100.0% |
School Enrollment by Age by Funding Source in Nipomo
Out of a total of 4,449 students who are enrolled in schools in Nipomo, 222 (5.0%) attend a private institution, while the remaining 4,227 (95.0%) are enrolled in public schools. The age group of 3 to 4 year olds has the highest likelihood of being enrolled in private schools, with 78 (49.4% in the age bracket) enrolled. Conversely, the age group of 18 to 19 year olds has the lowest likelihood of being enrolled in a private school, with 228 (100.0% in the age bracket) attending a public institution.
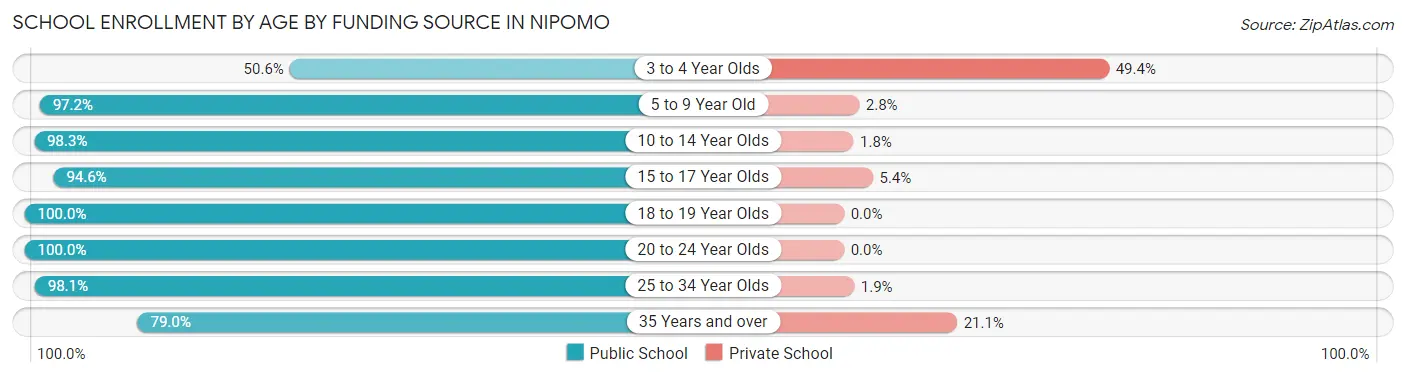
| Age Bracket | Public School | Private School |
| 3 to 4 Year Olds | 80 (50.6%) | 78 (49.4%) |
| 5 to 9 Year Old | 725 (97.2%) | 21 (2.8%) |
| 10 to 14 Year Olds | 1,462 (98.3%) | 26 (1.8%) |
| 15 to 17 Year Olds | 897 (94.6%) | 51 (5.4%) |
| 18 to 19 Year Olds | 228 (100.0%) | 0 (0.0%) |
| 20 to 24 Year Olds | 514 (100.0%) | 0 (0.0%) |
| 25 to 34 Year Olds | 155 (98.1%) | 3 (1.9%) |
| 35 Years and over | 165 (78.9%) | 44 (21.0%) |
| Total | 4,227 (95.0%) | 222 (5.0%) |
Educational Attainment by Field of Study in Nipomo
Business (423 | 13.6%), bio, nature & agricultural (400 | 12.8%), education (354 | 11.4%), science & technology (286 | 9.2%), and social sciences (254 | 8.1%) are the most common fields of study among 3,120 individuals in Nipomo who have obtained a bachelor's degree or higher.
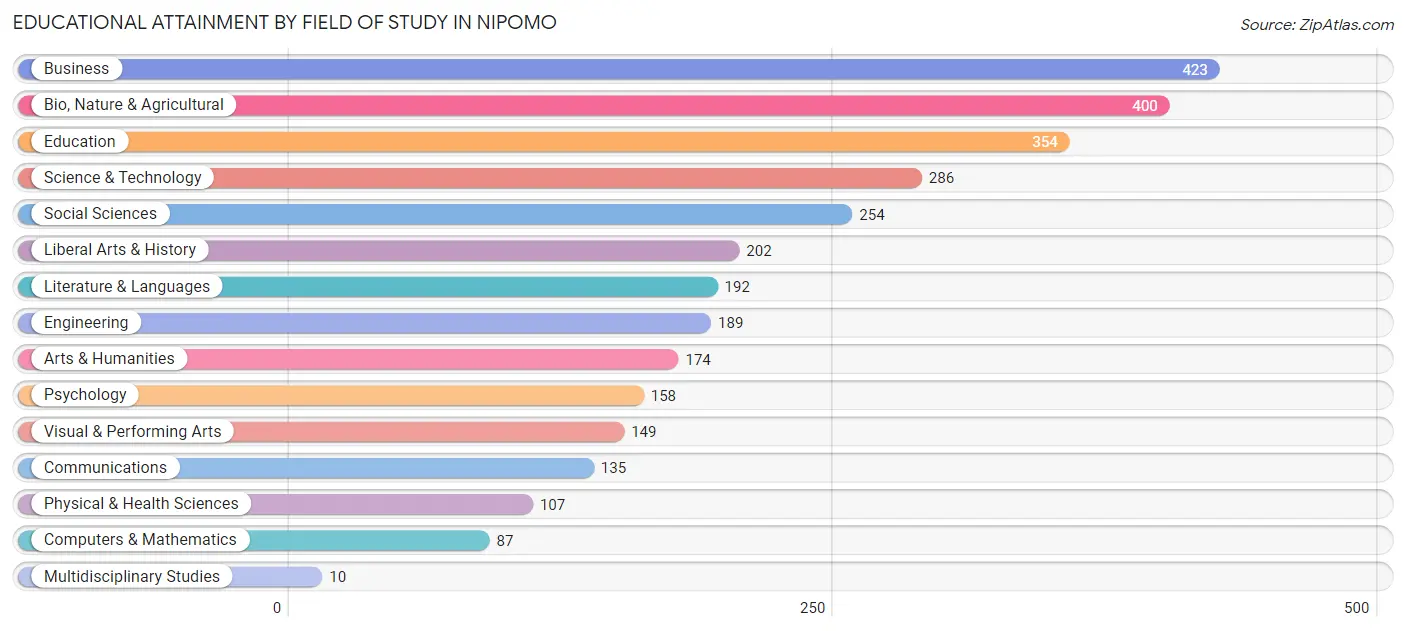
| Field of Study | # Graduates | % Graduates |
| Computers & Mathematics | 87 | 2.8% |
| Bio, Nature & Agricultural | 400 | 12.8% |
| Physical & Health Sciences | 107 | 3.4% |
| Psychology | 158 | 5.1% |
| Social Sciences | 254 | 8.1% |
| Engineering | 189 | 6.1% |
| Multidisciplinary Studies | 10 | 0.3% |
| Science & Technology | 286 | 9.2% |
| Business | 423 | 13.6% |
| Education | 354 | 11.4% |
| Literature & Languages | 192 | 6.1% |
| Liberal Arts & History | 202 | 6.5% |
| Visual & Performing Arts | 149 | 4.8% |
| Communications | 135 | 4.3% |
| Arts & Humanities | 174 | 5.6% |
| Total | 3,120 | 100.0% |
Transportation & Commute in Nipomo
Vehicle Availability by Sex in Nipomo
The most prevalent vehicle ownership categories in Nipomo are males with 3 vehicles (1,444, accounting for 32.1%) and females with 3 vehicles (939, making up 41.8%).
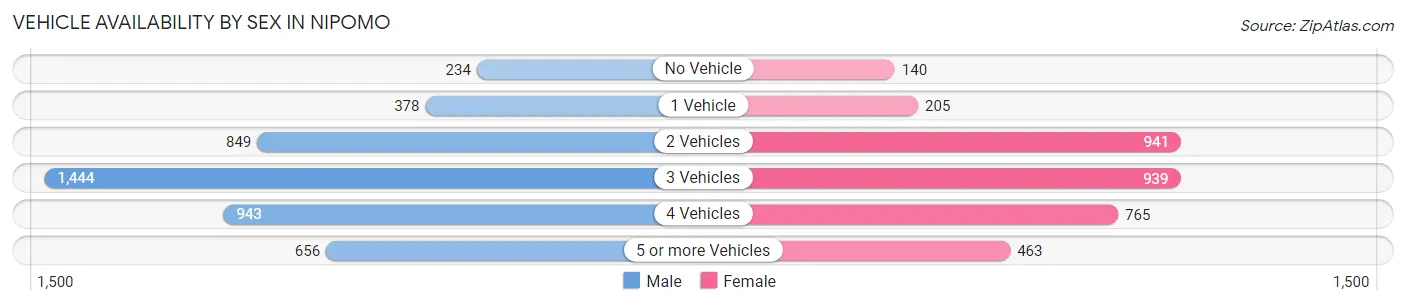
| Vehicles Available | Male | Female |
| No Vehicle | 234 (5.2%) | 140 (4.1%) |
| 1 Vehicle | 378 (8.4%) | 205 (5.9%) |
| 2 Vehicles | 849 (18.9%) | 941 (27.3%) |
| 3 Vehicles | 1,444 (32.1%) | 939 (27.2%) |
| 4 Vehicles | 943 (20.9%) | 765 (22.2%) |
| 5 or more Vehicles | 656 (14.6%) | 463 (13.4%) |
| Total | 4,504 (100.0%) | 3,453 (100.0%) |
Commute Time in Nipomo
The most frequently occuring commute durations in Nipomo are 15 to 19 minutes (1,628 commuters, 22.2%), 20 to 24 minutes (1,466 commuters, 20.0%), and 10 to 14 minutes (782 commuters, 10.6%).
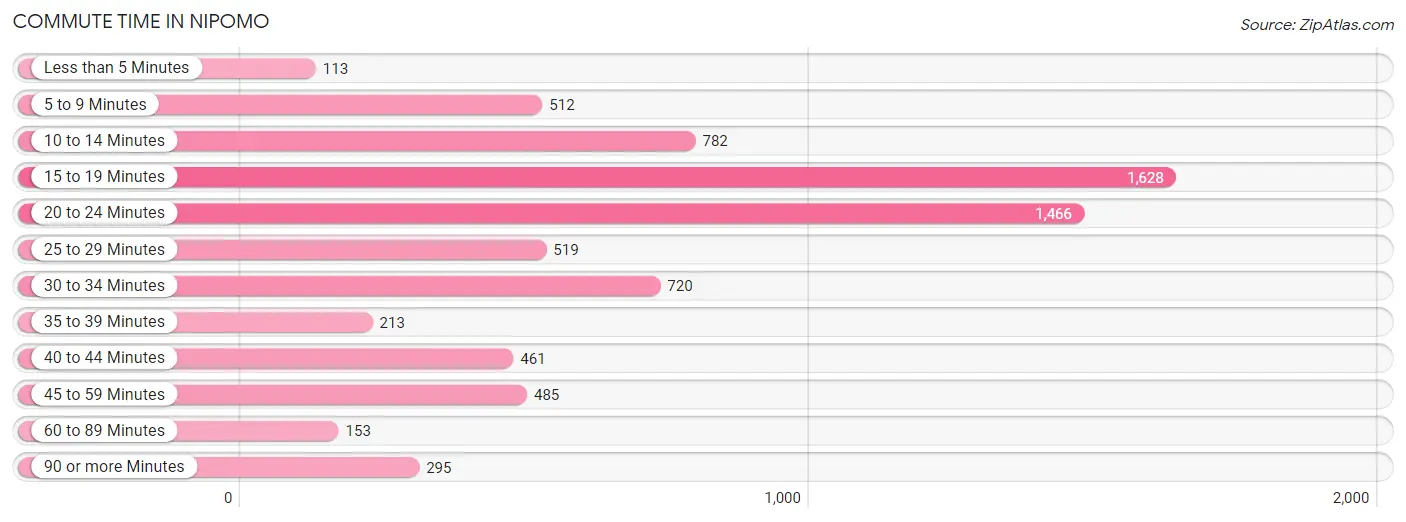
| Commute Time | # Commuters | % Commuters |
| Less than 5 Minutes | 113 | 1.5% |
| 5 to 9 Minutes | 512 | 7.0% |
| 10 to 14 Minutes | 782 | 10.6% |
| 15 to 19 Minutes | 1,628 | 22.2% |
| 20 to 24 Minutes | 1,466 | 20.0% |
| 25 to 29 Minutes | 519 | 7.1% |
| 30 to 34 Minutes | 720 | 9.8% |
| 35 to 39 Minutes | 213 | 2.9% |
| 40 to 44 Minutes | 461 | 6.3% |
| 45 to 59 Minutes | 485 | 6.6% |
| 60 to 89 Minutes | 153 | 2.1% |
| 90 or more Minutes | 295 | 4.0% |
Commute Time by Sex in Nipomo
The most common commute times in Nipomo are 15 to 19 minutes (1,010 commuters, 24.5%) for males and 20 to 24 minutes (698 commuters, 21.6%) for females.
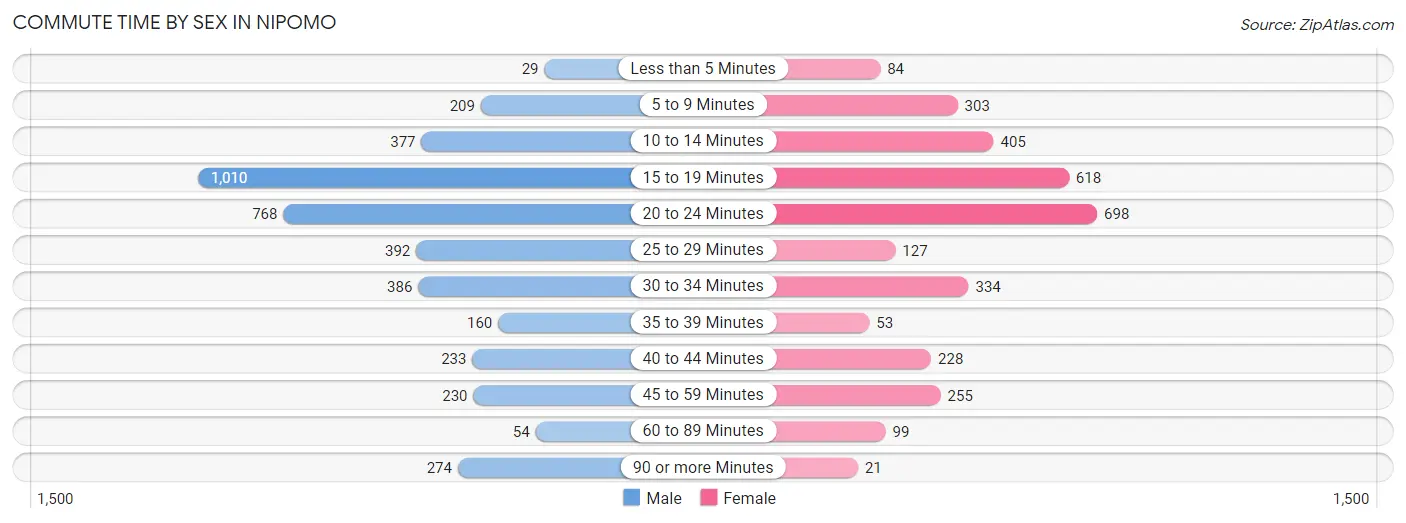
| Commute Time | Male | Female |
| Less than 5 Minutes | 29 (0.7%) | 84 (2.6%) |
| 5 to 9 Minutes | 209 (5.1%) | 303 (9.4%) |
| 10 to 14 Minutes | 377 (9.1%) | 405 (12.6%) |
| 15 to 19 Minutes | 1,010 (24.5%) | 618 (19.2%) |
| 20 to 24 Minutes | 768 (18.6%) | 698 (21.6%) |
| 25 to 29 Minutes | 392 (9.5%) | 127 (3.9%) |
| 30 to 34 Minutes | 386 (9.4%) | 334 (10.4%) |
| 35 to 39 Minutes | 160 (3.9%) | 53 (1.6%) |
| 40 to 44 Minutes | 233 (5.7%) | 228 (7.1%) |
| 45 to 59 Minutes | 230 (5.6%) | 255 (7.9%) |
| 60 to 89 Minutes | 54 (1.3%) | 99 (3.1%) |
| 90 or more Minutes | 274 (6.7%) | 21 (0.6%) |
Time of Departure to Work by Sex in Nipomo
The most frequent times of departure to work in Nipomo are 7:30 AM to 7:59 AM (608, 14.7%) for males and 7:00 AM to 7:29 AM (504, 15.6%) for females.
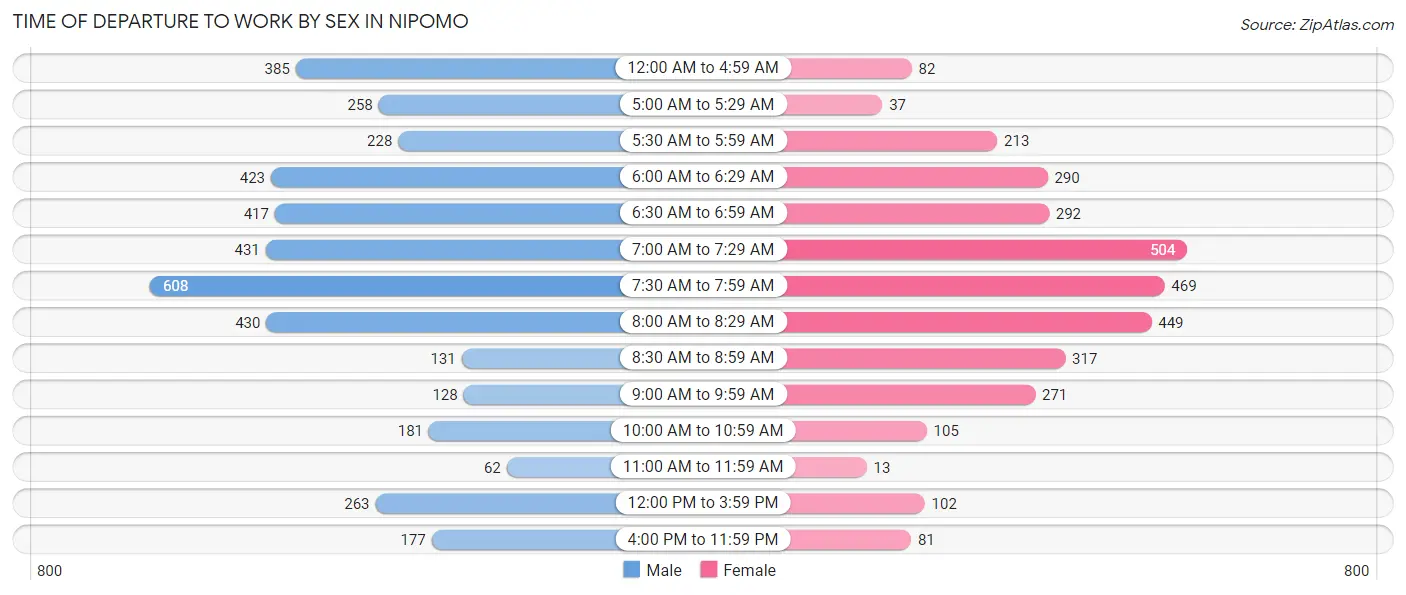
| Time of Departure | Male | Female |
| 12:00 AM to 4:59 AM | 385 (9.3%) | 82 (2.5%) |
| 5:00 AM to 5:29 AM | 258 (6.3%) | 37 (1.1%) |
| 5:30 AM to 5:59 AM | 228 (5.5%) | 213 (6.6%) |
| 6:00 AM to 6:29 AM | 423 (10.3%) | 290 (9.0%) |
| 6:30 AM to 6:59 AM | 417 (10.1%) | 292 (9.0%) |
| 7:00 AM to 7:29 AM | 431 (10.5%) | 504 (15.6%) |
| 7:30 AM to 7:59 AM | 608 (14.7%) | 469 (14.5%) |
| 8:00 AM to 8:29 AM | 430 (10.4%) | 449 (13.9%) |
| 8:30 AM to 8:59 AM | 131 (3.2%) | 317 (9.8%) |
| 9:00 AM to 9:59 AM | 128 (3.1%) | 271 (8.4%) |
| 10:00 AM to 10:59 AM | 181 (4.4%) | 105 (3.3%) |
| 11:00 AM to 11:59 AM | 62 (1.5%) | 13 (0.4%) |
| 12:00 PM to 3:59 PM | 263 (6.4%) | 102 (3.2%) |
| 4:00 PM to 11:59 PM | 177 (4.3%) | 81 (2.5%) |
| Total | 4,122 (100.0%) | 3,225 (100.0%) |
Housing Occupancy in Nipomo
Occupancy by Ownership in Nipomo
Of the total 5,694 dwellings in Nipomo, owner-occupied units account for 3,939 (69.2%), while renter-occupied units make up 1,755 (30.8%).
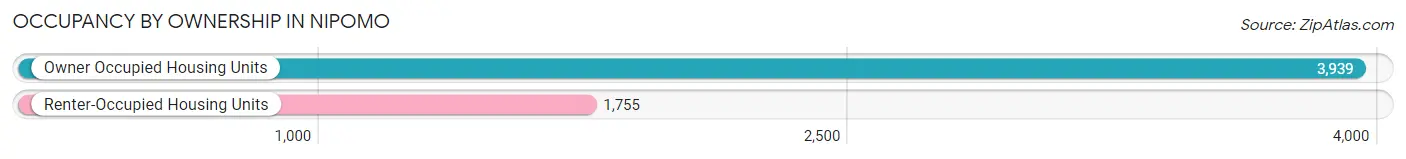
| Occupancy | # Housing Units | % Housing Units |
| Owner Occupied Housing Units | 3,939 | 69.2% |
| Renter-Occupied Housing Units | 1,755 | 30.8% |
| Total Occupied Housing Units | 5,694 | 100.0% |
Occupancy by Household Size in Nipomo
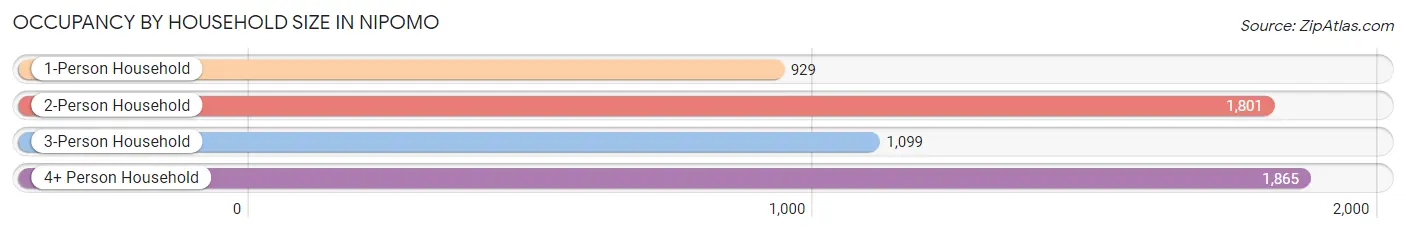
| Household Size | # Housing Units | % Housing Units |
| 1-Person Household | 929 | 16.3% |
| 2-Person Household | 1,801 | 31.6% |
| 3-Person Household | 1,099 | 19.3% |
| 4+ Person Household | 1,865 | 32.8% |
| Total Housing Units | 5,694 | 100.0% |
Occupancy by Ownership by Household Size in Nipomo
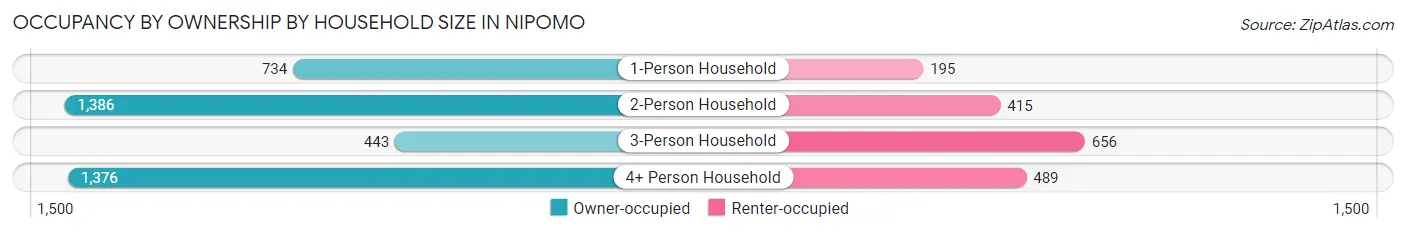
| Household Size | Owner-occupied | Renter-occupied |
| 1-Person Household | 734 (79.0%) | 195 (21.0%) |
| 2-Person Household | 1,386 (77.0%) | 415 (23.0%) |
| 3-Person Household | 443 (40.3%) | 656 (59.7%) |
| 4+ Person Household | 1,376 (73.8%) | 489 (26.2%) |
| Total Housing Units | 3,939 (69.2%) | 1,755 (30.8%) |
Occupancy by Educational Attainment in Nipomo
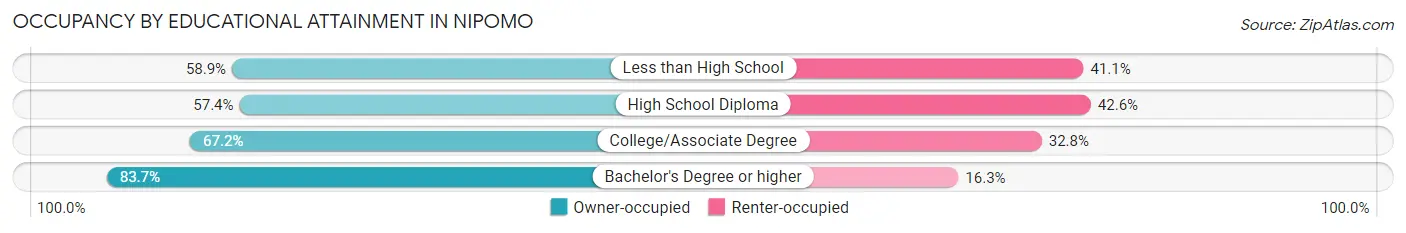
| Household Size | Owner-occupied | Renter-occupied |
| Less than High School | 308 (58.9%) | 215 (41.1%) |
| High School Diploma | 658 (57.4%) | 488 (42.6%) |
| College/Associate Degree | 1,608 (67.2%) | 786 (32.8%) |
| Bachelor's Degree or higher | 1,365 (83.7%) | 266 (16.3%) |
Occupancy by Age of Householder in Nipomo
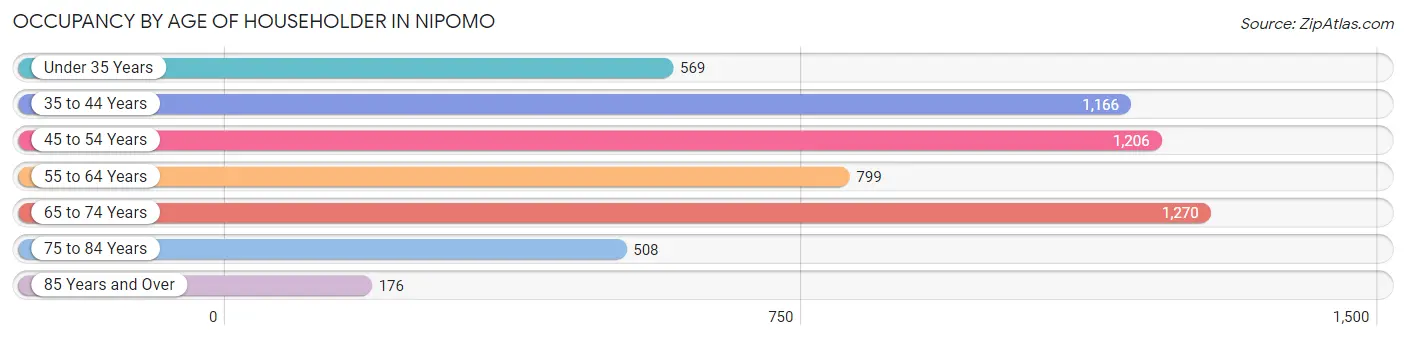
| Age Bracket | # Households | % Households |
| Under 35 Years | 569 | 10.0% |
| 35 to 44 Years | 1,166 | 20.5% |
| 45 to 54 Years | 1,206 | 21.2% |
| 55 to 64 Years | 799 | 14.0% |
| 65 to 74 Years | 1,270 | 22.3% |
| 75 to 84 Years | 508 | 8.9% |
| 85 Years and Over | 176 | 3.1% |
| Total | 5,694 | 100.0% |
Housing Finances in Nipomo
Median Income by Occupancy in Nipomo
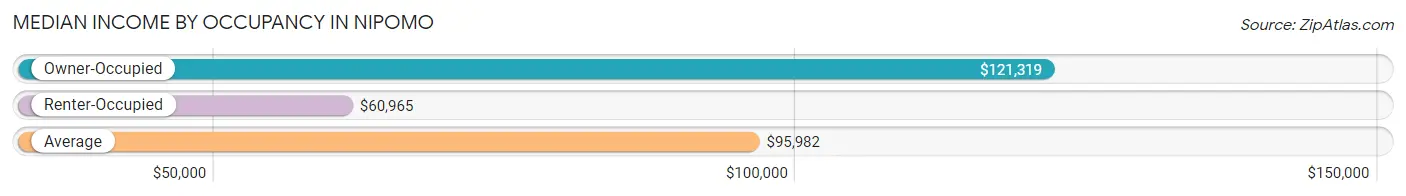
| Occupancy Type | # Households | Median Income |
| Owner-Occupied | 3,939 (69.2%) | $121,319 |
| Renter-Occupied | 1,755 (30.8%) | $60,965 |
| Average | 5,694 (100.0%) | $95,982 |
Occupancy by Householder Income Bracket in Nipomo
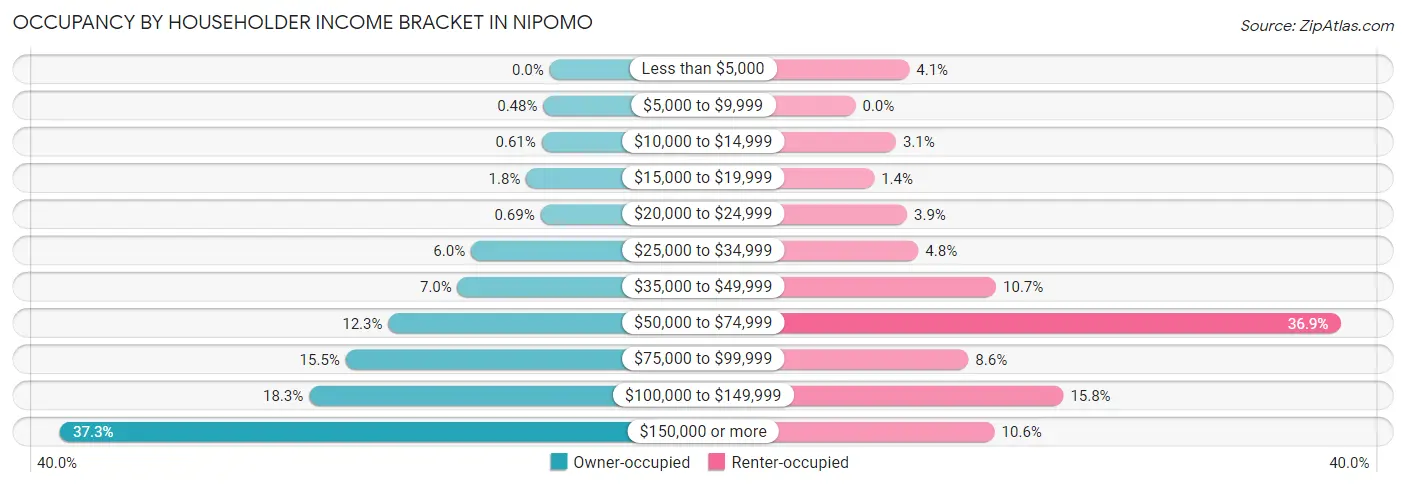
| Income Bracket | Owner-occupied | Renter-occupied |
| Less than $5,000 | 0 (0.0%) | 72 (4.1%) |
| $5,000 to $9,999 | 19 (0.5%) | 0 (0.0%) |
| $10,000 to $14,999 | 24 (0.6%) | 54 (3.1%) |
| $15,000 to $19,999 | 70 (1.8%) | 25 (1.4%) |
| $20,000 to $24,999 | 27 (0.7%) | 69 (3.9%) |
| $25,000 to $34,999 | 236 (6.0%) | 84 (4.8%) |
| $35,000 to $49,999 | 276 (7.0%) | 188 (10.7%) |
| $50,000 to $74,999 | 484 (12.3%) | 648 (36.9%) |
| $75,000 to $99,999 | 612 (15.5%) | 151 (8.6%) |
| $100,000 to $149,999 | 722 (18.3%) | 278 (15.8%) |
| $150,000 or more | 1,469 (37.3%) | 186 (10.6%) |
| Total | 3,939 (100.0%) | 1,755 (100.0%) |
Monthly Housing Cost Tiers in Nipomo
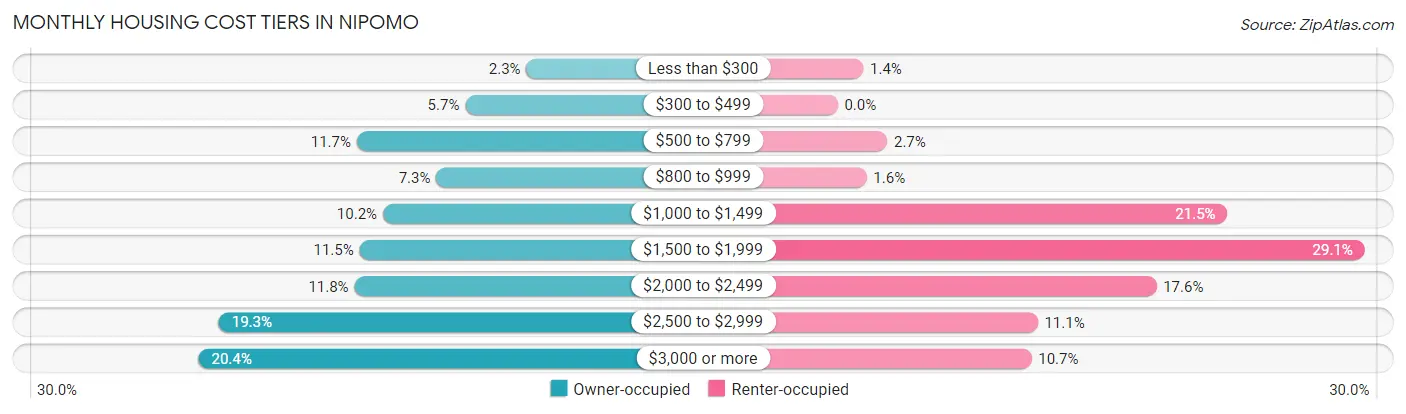
| Monthly Cost | Owner-occupied | Renter-occupied |
| Less than $300 | 90 (2.3%) | 25 (1.4%) |
| $300 to $499 | 223 (5.7%) | 0 (0.0%) |
| $500 to $799 | 459 (11.7%) | 48 (2.7%) |
| $800 to $999 | 286 (7.3%) | 28 (1.6%) |
| $1,000 to $1,499 | 402 (10.2%) | 378 (21.5%) |
| $1,500 to $1,999 | 453 (11.5%) | 511 (29.1%) |
| $2,000 to $2,499 | 464 (11.8%) | 309 (17.6%) |
| $2,500 to $2,999 | 759 (19.3%) | 194 (11.1%) |
| $3,000 or more | 803 (20.4%) | 188 (10.7%) |
| Total | 3,939 (100.0%) | 1,755 (100.0%) |
Physical Housing Characteristics in Nipomo
Housing Structures in Nipomo
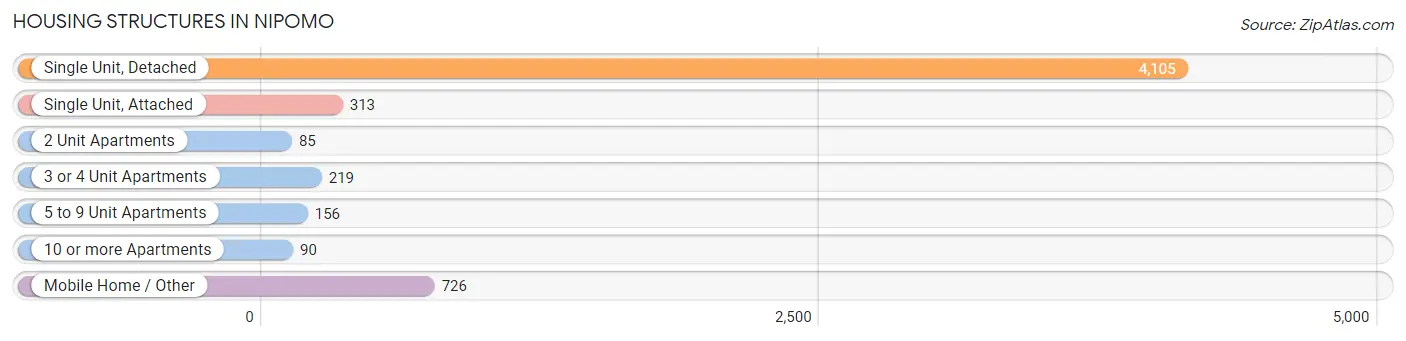
| Structure Type | # Housing Units | % Housing Units |
| Single Unit, Detached | 4,105 | 72.1% |
| Single Unit, Attached | 313 | 5.5% |
| 2 Unit Apartments | 85 | 1.5% |
| 3 or 4 Unit Apartments | 219 | 3.8% |
| 5 to 9 Unit Apartments | 156 | 2.7% |
| 10 or more Apartments | 90 | 1.6% |
| Mobile Home / Other | 726 | 12.8% |
| Total | 5,694 | 100.0% |
Housing Structures by Occupancy in Nipomo
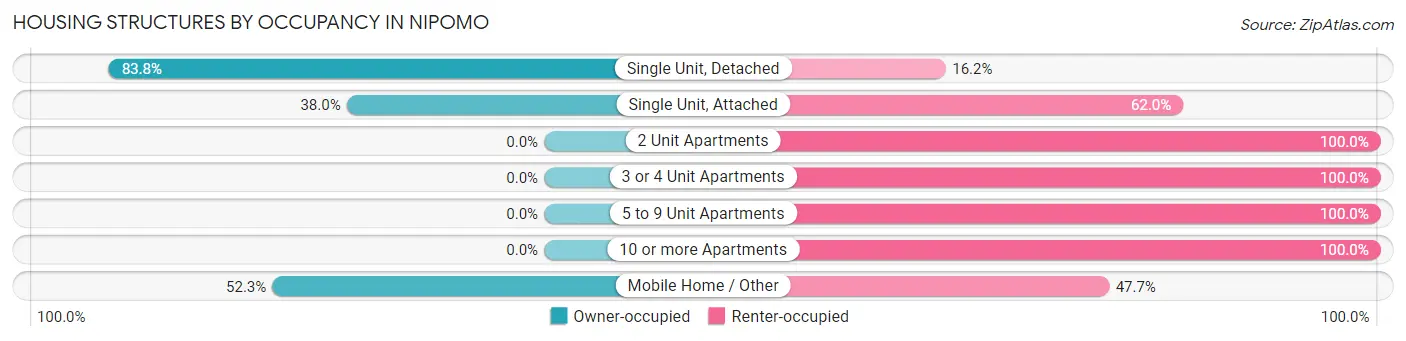
| Structure Type | Owner-occupied | Renter-occupied |
| Single Unit, Detached | 3,440 (83.8%) | 665 (16.2%) |
| Single Unit, Attached | 119 (38.0%) | 194 (62.0%) |
| 2 Unit Apartments | 0 (0.0%) | 85 (100.0%) |
| 3 or 4 Unit Apartments | 0 (0.0%) | 219 (100.0%) |
| 5 to 9 Unit Apartments | 0 (0.0%) | 156 (100.0%) |
| 10 or more Apartments | 0 (0.0%) | 90 (100.0%) |
| Mobile Home / Other | 380 (52.3%) | 346 (47.7%) |
| Total | 3,939 (69.2%) | 1,755 (30.8%) |
Housing Structures by Number of Rooms in Nipomo
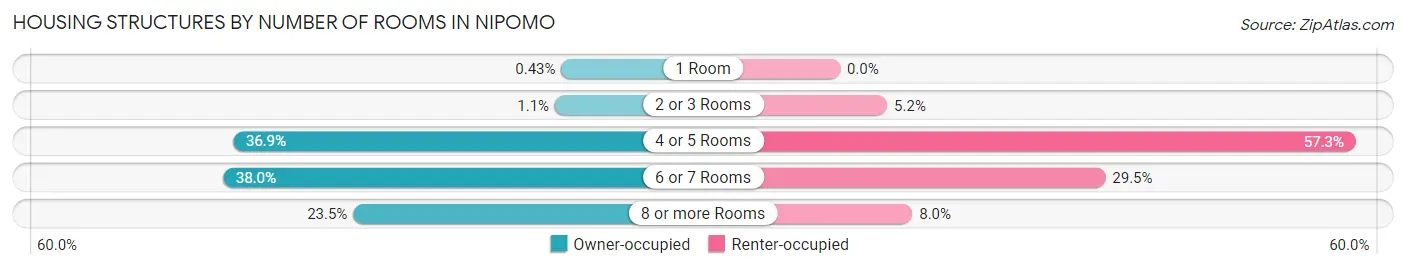
| Number of Rooms | Owner-occupied | Renter-occupied |
| 1 Room | 17 (0.4%) | 0 (0.0%) |
| 2 or 3 Rooms | 45 (1.1%) | 92 (5.2%) |
| 4 or 5 Rooms | 1,453 (36.9%) | 1,005 (57.3%) |
| 6 or 7 Rooms | 1,497 (38.0%) | 517 (29.5%) |
| 8 or more Rooms | 927 (23.5%) | 141 (8.0%) |
| Total | 3,939 (100.0%) | 1,755 (100.0%) |
Housing Structure by Heating Type in Nipomo
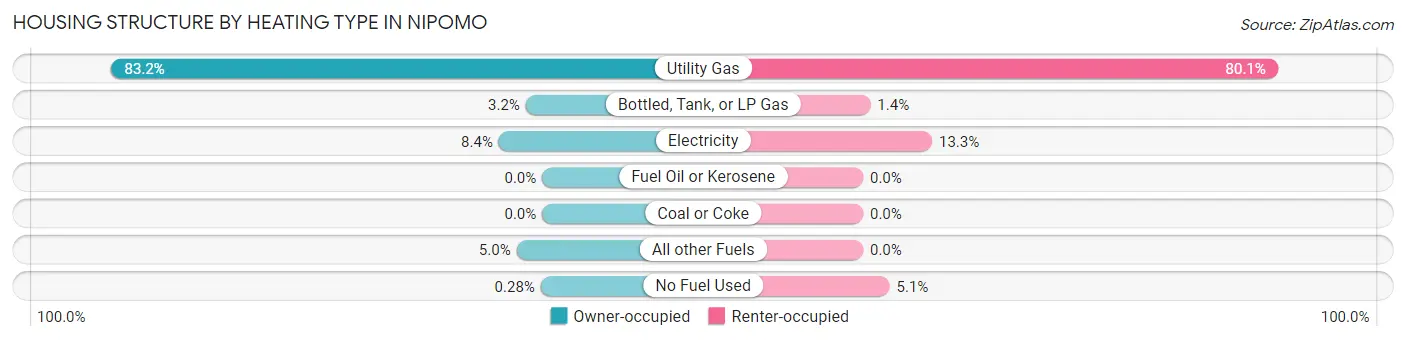
| Heating Type | Owner-occupied | Renter-occupied |
| Utility Gas | 3,278 (83.2%) | 1,406 (80.1%) |
| Bottled, Tank, or LP Gas | 125 (3.2%) | 25 (1.4%) |
| Electricity | 330 (8.4%) | 234 (13.3%) |
| Fuel Oil or Kerosene | 0 (0.0%) | 0 (0.0%) |
| Coal or Coke | 0 (0.0%) | 0 (0.0%) |
| All other Fuels | 195 (5.0%) | 0 (0.0%) |
| No Fuel Used | 11 (0.3%) | 90 (5.1%) |
| Total | 3,939 (100.0%) | 1,755 (100.0%) |
Household Vehicle Usage in Nipomo
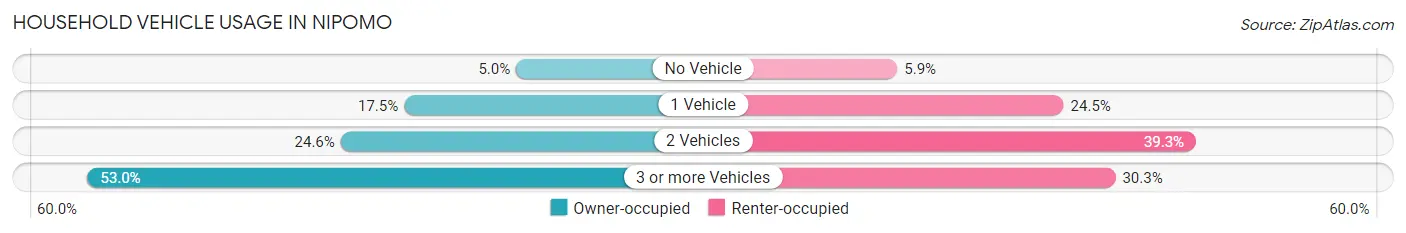
| Vehicles per Household | Owner-occupied | Renter-occupied |
| No Vehicle | 195 (5.0%) | 103 (5.9%) |
| 1 Vehicle | 689 (17.5%) | 430 (24.5%) |
| 2 Vehicles | 969 (24.6%) | 690 (39.3%) |
| 3 or more Vehicles | 2,086 (53.0%) | 532 (30.3%) |
| Total | 3,939 (100.0%) | 1,755 (100.0%) |
Real Estate & Mortgages in Nipomo
Real Estate and Mortgage Overview in Nipomo
| Characteristic | Without Mortgage | With Mortgage |
| Housing Units | 1,334 | 2,605 |
| Median Property Value | $665,300 | $662,300 |
| Median Household Income | $88,763 | $1,097 |
| Monthly Housing Costs | $691 | $803 |
| Real Estate Taxes | $4,821 | $53 |
Property Value by Mortgage Status in Nipomo
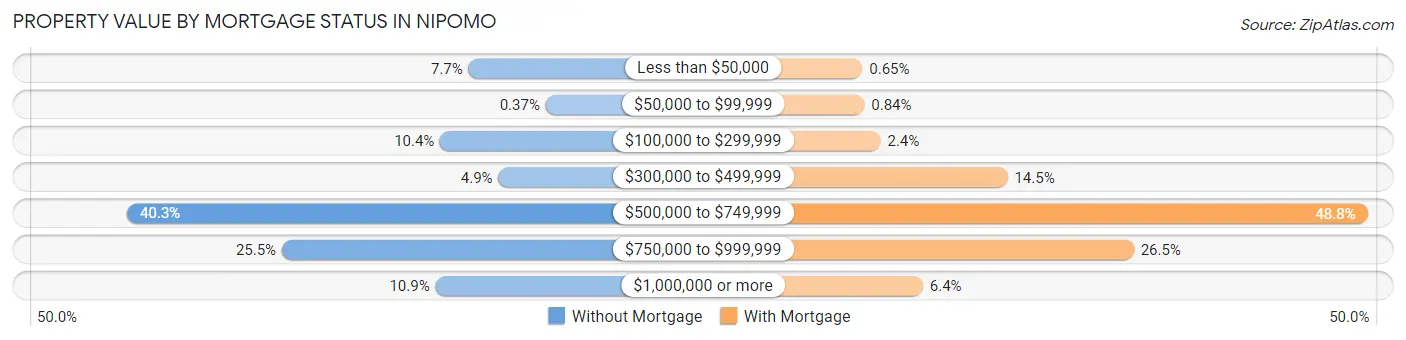
| Property Value | Without Mortgage | With Mortgage |
| Less than $50,000 | 103 (7.7%) | 17 (0.6%) |
| $50,000 to $99,999 | 5 (0.4%) | 22 (0.8%) |
| $100,000 to $299,999 | 139 (10.4%) | 62 (2.4%) |
| $300,000 to $499,999 | 65 (4.9%) | 377 (14.5%) |
| $500,000 to $749,999 | 537 (40.3%) | 1,270 (48.7%) |
| $750,000 to $999,999 | 340 (25.5%) | 690 (26.5%) |
| $1,000,000 or more | 145 (10.9%) | 167 (6.4%) |
| Total | 1,334 (100.0%) | 2,605 (100.0%) |
Household Income by Mortgage Status in Nipomo
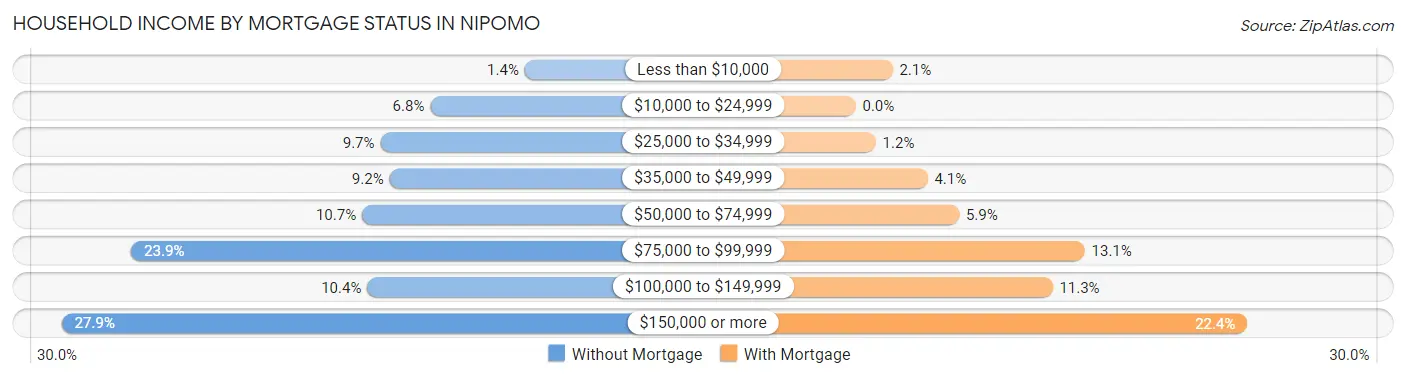
| Household Income | Without Mortgage | With Mortgage |
| Less than $10,000 | 19 (1.4%) | 55 (2.1%) |
| $10,000 to $24,999 | 91 (6.8%) | 0 (0.0%) |
| $25,000 to $34,999 | 129 (9.7%) | 30 (1.1%) |
| $35,000 to $49,999 | 122 (9.1%) | 107 (4.1%) |
| $50,000 to $74,999 | 143 (10.7%) | 154 (5.9%) |
| $75,000 to $99,999 | 319 (23.9%) | 341 (13.1%) |
| $100,000 to $149,999 | 139 (10.4%) | 293 (11.3%) |
| $150,000 or more | 372 (27.9%) | 583 (22.4%) |
| Total | 1,334 (100.0%) | 2,605 (100.0%) |
Property Value to Household Income Ratio in Nipomo
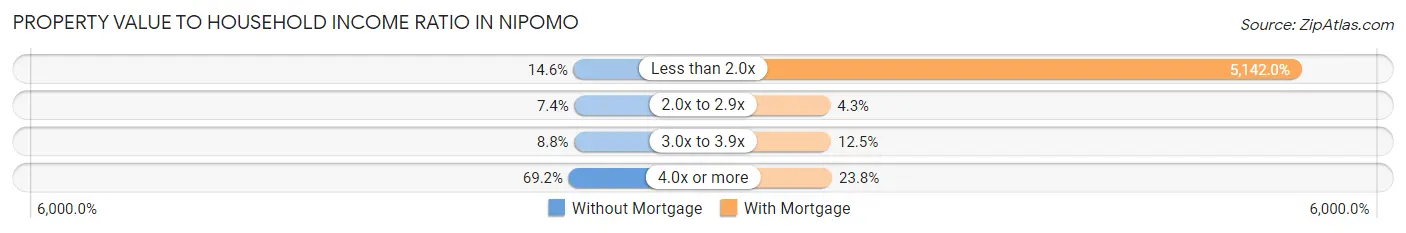
| Value-to-Income Ratio | Without Mortgage | With Mortgage |
| Less than 2.0x | 195 (14.6%) | 133,950 (5,142.0%) |
| 2.0x to 2.9x | 99 (7.4%) | 111 (4.3%) |
| 3.0x to 3.9x | 117 (8.8%) | 325 (12.5%) |
| 4.0x or more | 923 (69.2%) | 621 (23.8%) |
| Total | 1,334 (100.0%) | 2,605 (100.0%) |
Real Estate Taxes by Mortgage Status in Nipomo
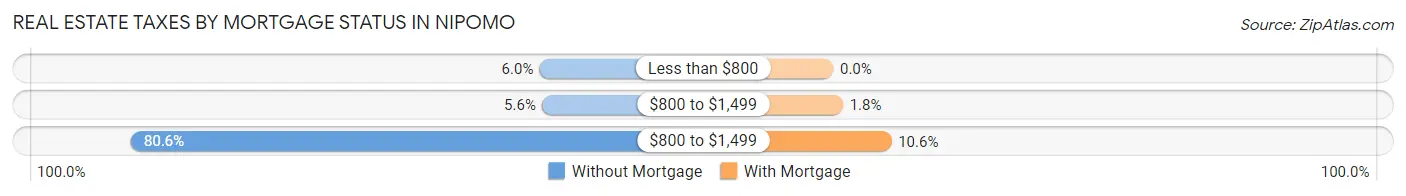
| Property Taxes | Without Mortgage | With Mortgage |
| Less than $800 | 80 (6.0%) | 0 (0.0%) |
| $800 to $1,499 | 74 (5.6%) | 46 (1.8%) |
| $800 to $1,499 | 1,075 (80.6%) | 277 (10.6%) |
| Total | 1,334 (100.0%) | 2,605 (100.0%) |
Health & Disability in Nipomo
Health Insurance Coverage by Age in Nipomo
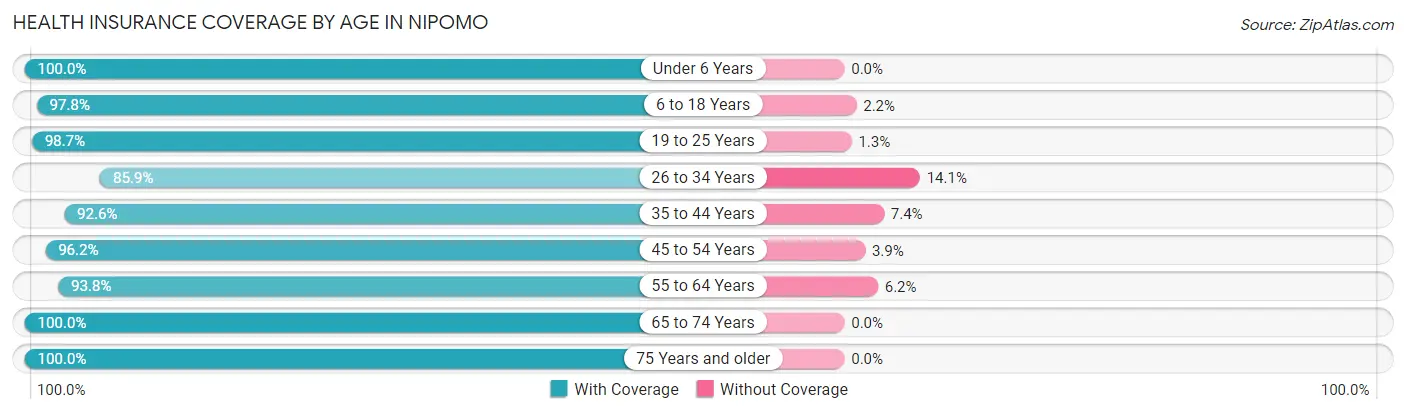
| Age Bracket | With Coverage | Without Coverage |
| Under 6 Years | 1,125 (100.0%) | 0 (0.0%) |
| 6 to 18 Years | 3,287 (97.8%) | 75 (2.2%) |
| 19 to 25 Years | 1,771 (98.7%) | 24 (1.3%) |
| 26 to 34 Years | 1,527 (85.9%) | 250 (14.1%) |
| 35 to 44 Years | 2,209 (92.6%) | 176 (7.4%) |
| 45 to 54 Years | 2,375 (96.2%) | 95 (3.8%) |
| 55 to 64 Years | 1,789 (93.8%) | 119 (6.2%) |
| 65 to 74 Years | 2,039 (100.0%) | 0 (0.0%) |
| 75 Years and older | 1,147 (100.0%) | 0 (0.0%) |
| Total | 17,269 (95.9%) | 739 (4.1%) |
Health Insurance Coverage by Citizenship Status in Nipomo
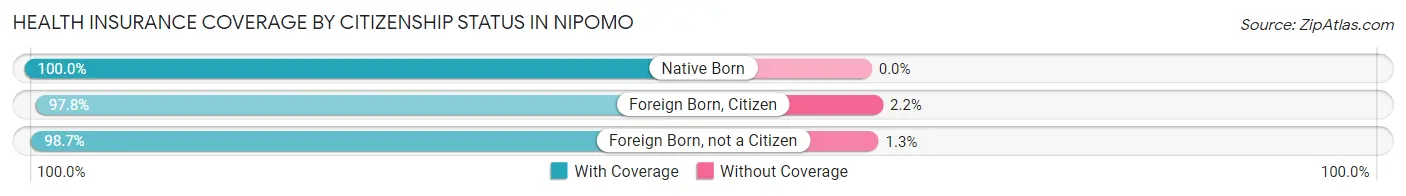
| Citizenship Status | With Coverage | Without Coverage |
| Native Born | 1,125 (100.0%) | 0 (0.0%) |
| Foreign Born, Citizen | 3,287 (97.8%) | 75 (2.2%) |
| Foreign Born, not a Citizen | 1,771 (98.7%) | 24 (1.3%) |
Health Insurance Coverage by Household Income in Nipomo
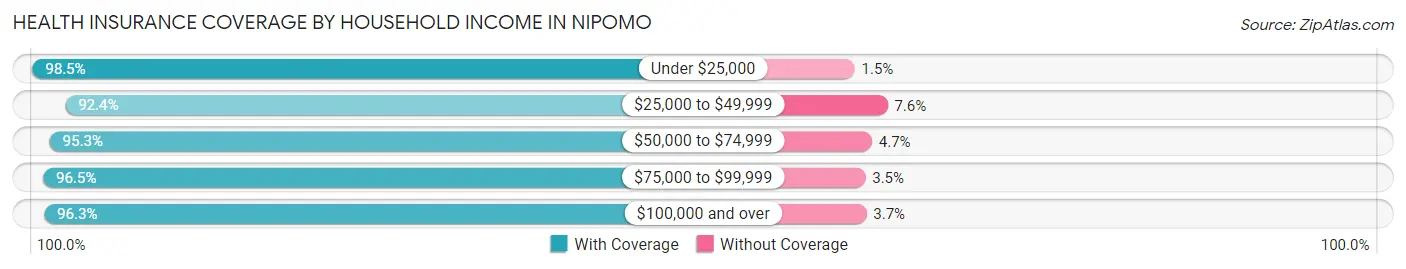
| Household Income | With Coverage | Without Coverage |
| Under $25,000 | 674 (98.5%) | 10 (1.5%) |
| $25,000 to $49,999 | 1,394 (92.4%) | 115 (7.6%) |
| $50,000 to $74,999 | 3,227 (95.3%) | 159 (4.7%) |
| $75,000 to $99,999 | 1,843 (96.5%) | 66 (3.5%) |
| $100,000 and over | 10,105 (96.3%) | 385 (3.7%) |
Public vs Private Health Insurance Coverage by Age in Nipomo
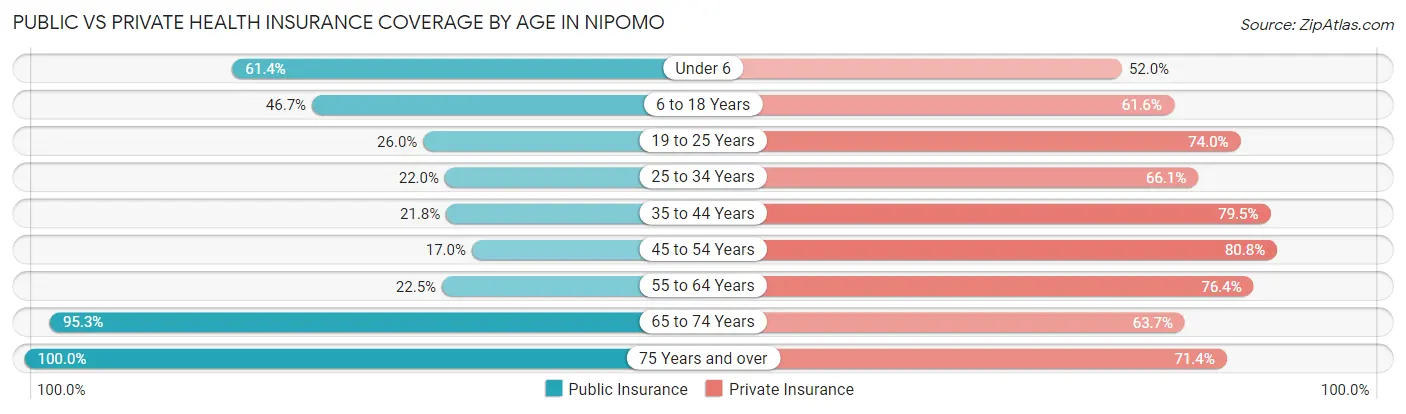
| Age Bracket | Public Insurance | Private Insurance |
| Under 6 | 691 (61.4%) | 585 (52.0%) |
| 6 to 18 Years | 1,569 (46.7%) | 2,072 (61.6%) |
| 19 to 25 Years | 467 (26.0%) | 1,328 (74.0%) |
| 25 to 34 Years | 391 (22.0%) | 1,175 (66.1%) |
| 35 to 44 Years | 519 (21.8%) | 1,897 (79.5%) |
| 45 to 54 Years | 420 (17.0%) | 1,995 (80.8%) |
| 55 to 64 Years | 430 (22.5%) | 1,458 (76.4%) |
| 65 to 74 Years | 1,943 (95.3%) | 1,298 (63.7%) |
| 75 Years and over | 1,147 (100.0%) | 819 (71.4%) |
| Total | 7,577 (42.1%) | 12,627 (70.1%) |
Disability Status by Sex by Age in Nipomo
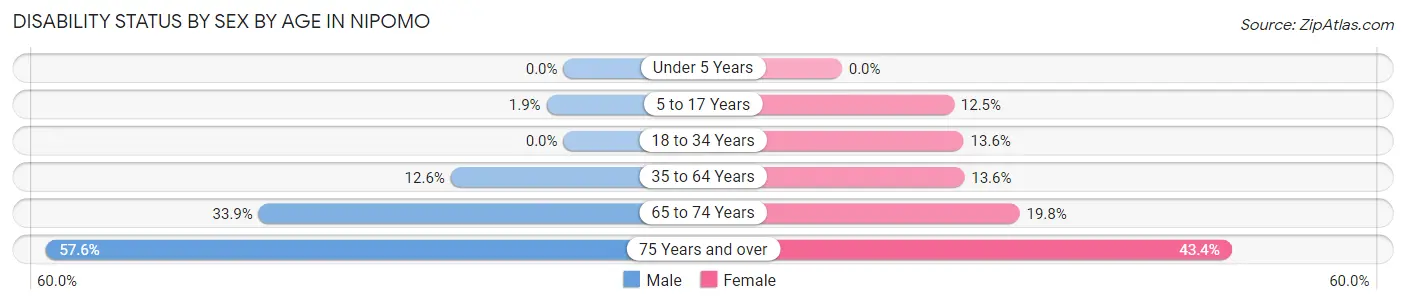
| Age Bracket | Male | Female |
| Under 5 Years | 0 (0.0%) | 0 (0.0%) |
| 5 to 17 Years | 33 (1.9%) | 196 (12.5%) |
| 18 to 34 Years | 0 (0.0%) | 270 (13.6%) |
| 35 to 64 Years | 433 (12.6%) | 452 (13.6%) |
| 65 to 74 Years | 315 (33.9%) | 220 (19.8%) |
| 75 Years and over | 346 (57.6%) | 237 (43.4%) |
Disability Class by Sex by Age in Nipomo
Disability Class: Hearing Difficulty
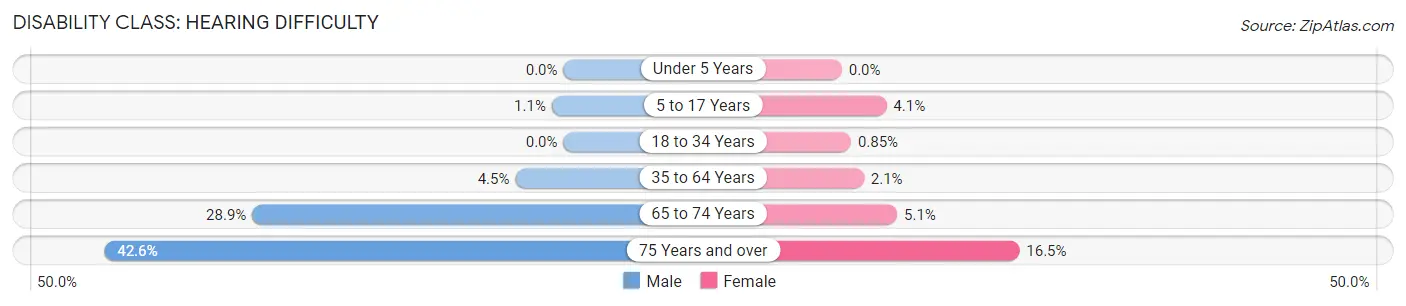
| Age Bracket | Male | Female |
| Under 5 Years | 0 (0.0%) | 0 (0.0%) |
| 5 to 17 Years | 19 (1.1%) | 65 (4.1%) |
| 18 to 34 Years | 0 (0.0%) | 17 (0.9%) |
| 35 to 64 Years | 154 (4.5%) | 68 (2.1%) |
| 65 to 74 Years | 268 (28.9%) | 57 (5.1%) |
| 75 Years and over | 256 (42.6%) | 90 (16.5%) |
Disability Class: Vision Difficulty
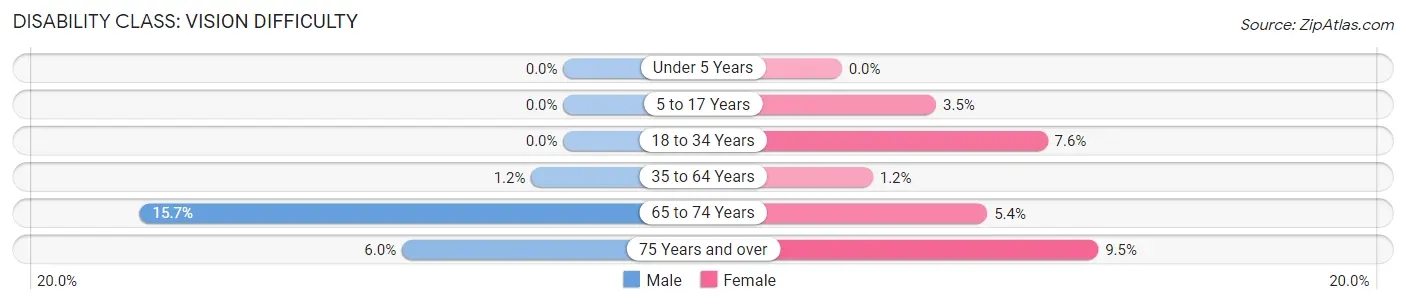
| Age Bracket | Male | Female |
| Under 5 Years | 0 (0.0%) | 0 (0.0%) |
| 5 to 17 Years | 0 (0.0%) | 55 (3.5%) |
| 18 to 34 Years | 0 (0.0%) | 152 (7.6%) |
| 35 to 64 Years | 41 (1.2%) | 38 (1.1%) |
| 65 to 74 Years | 146 (15.7%) | 60 (5.4%) |
| 75 Years and over | 36 (6.0%) | 52 (9.5%) |
Disability Class: Cognitive Difficulty
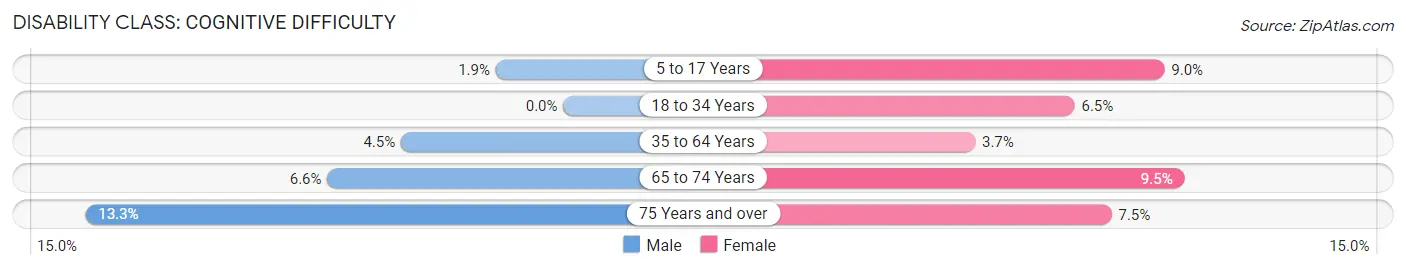
| Age Bracket | Male | Female |
| 5 to 17 Years | 33 (1.9%) | 141 (9.0%) |
| 18 to 34 Years | 0 (0.0%) | 129 (6.5%) |
| 35 to 64 Years | 156 (4.5%) | 123 (3.7%) |
| 65 to 74 Years | 61 (6.6%) | 106 (9.5%) |
| 75 Years and over | 80 (13.3%) | 41 (7.5%) |
Disability Class: Ambulatory Difficulty
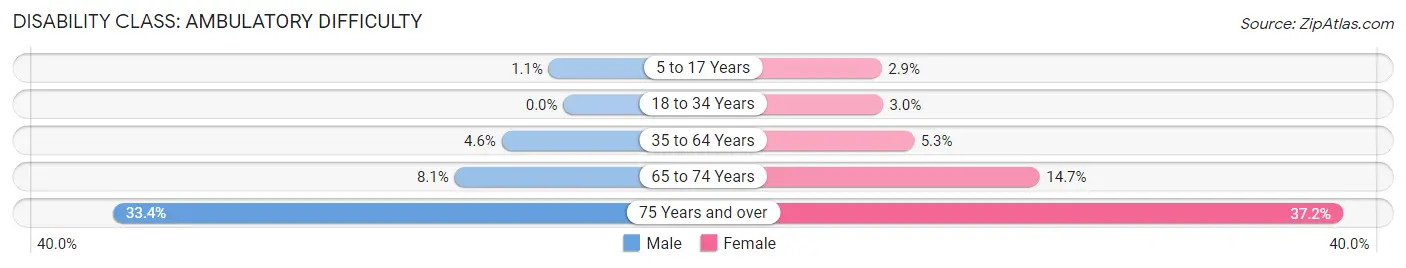
| Age Bracket | Male | Female |
| 5 to 17 Years | 19 (1.1%) | 46 (2.9%) |
| 18 to 34 Years | 0 (0.0%) | 60 (3.0%) |
| 35 to 64 Years | 158 (4.6%) | 177 (5.3%) |
| 65 to 74 Years | 75 (8.1%) | 163 (14.7%) |
| 75 Years and over | 201 (33.4%) | 203 (37.2%) |
Disability Class: Self-Care Difficulty
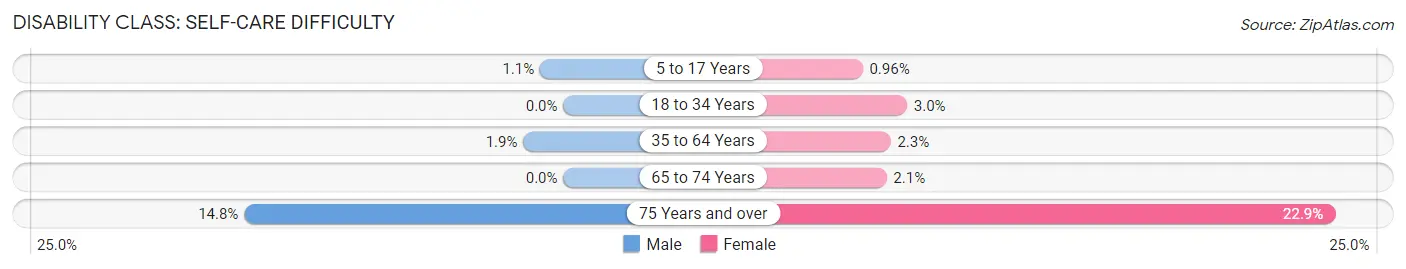
| Age Bracket | Male | Female |
| 5 to 17 Years | 19 (1.1%) | 15 (1.0%) |
| 18 to 34 Years | 0 (0.0%) | 60 (3.0%) |
| 35 to 64 Years | 64 (1.9%) | 75 (2.3%) |
| 65 to 74 Years | 0 (0.0%) | 23 (2.1%) |
| 75 Years and over | 89 (14.8%) | 125 (22.9%) |
Technology Access in Nipomo
Computing Device Access in Nipomo
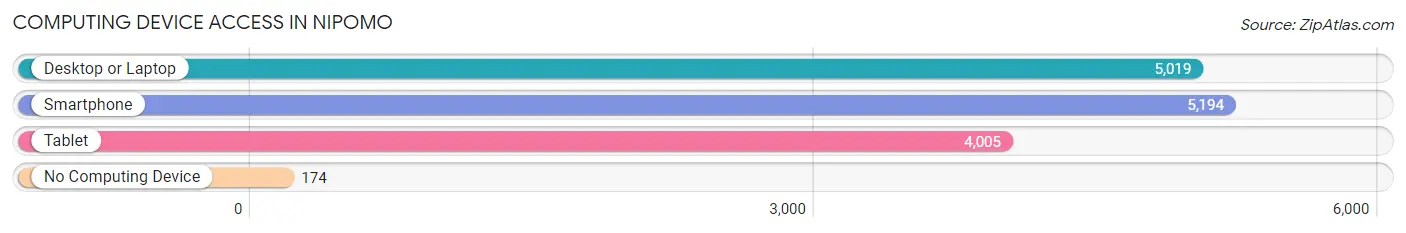
| Device Type | # Households | % Households |
| Desktop or Laptop | 5,019 | 88.1% |
| Smartphone | 5,194 | 91.2% |
| Tablet | 4,005 | 70.3% |
| No Computing Device | 174 | 3.1% |
| Total | 5,694 | 100.0% |
Internet Access in Nipomo
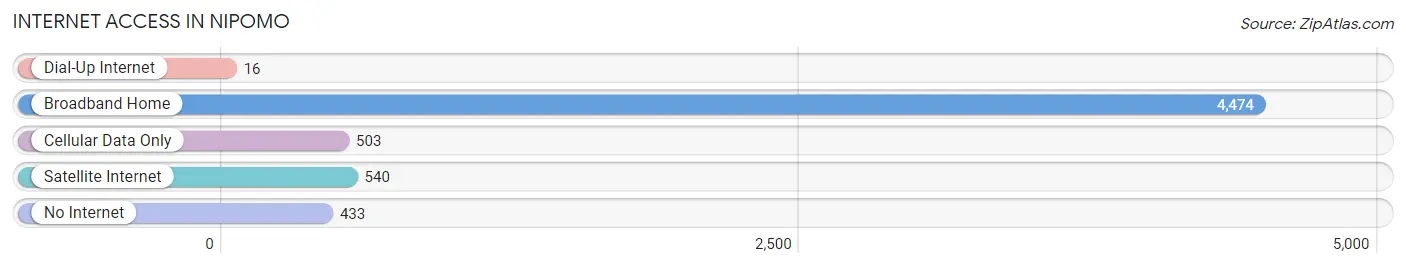
| Internet Type | # Households | % Households |
| Dial-Up Internet | 16 | 0.3% |
| Broadband Home | 4,474 | 78.6% |
| Cellular Data Only | 503 | 8.8% |
| Satellite Internet | 540 | 9.5% |
| No Internet | 433 | 7.6% |
| Total | 5,694 | 100.0% |
Nipomo Summary
Nipomo is a small unincorporated community located in San Luis Obispo County, California. It is situated in the foothills of the Santa Lucia Mountains, approximately 10 miles (16 km) south of San Luis Obispo and 8 miles (13 km) north of Santa Maria. The population of Nipomo was estimated to be 16,714 in 2019.
History
The area now known as Nipomo was originally inhabited by the Chumash people, who lived in the area for thousands of years before the arrival of Europeans. The first Europeans to settle in the area were Spanish missionaries, who established the Mission San Luis Obispo de Tolosa in 1772. The mission was the first of 21 missions established by the Spanish in California.
In 1837, the Mexican government granted the land that is now Nipomo to Jose Antonio Estrada. Estrada established a large rancho, which he named Rancho Nipomo. The rancho was eventually divided into smaller parcels and sold to settlers.
In 1874, the Southern Pacific Railroad built a line through the area, connecting San Luis Obispo to Santa Maria. This allowed for the development of the area, and the town of Nipomo was established in 1875.
Geography
Nipomo is located in the foothills of the Santa Lucia Mountains, approximately 10 miles (16 km) south of San Luis Obispo and 8 miles (13 km) north of Santa Maria. The town is situated at an elevation of approximately 500 feet (152 m).
The climate in Nipomo is Mediterranean, with mild winters and warm, dry summers. The average annual temperature is 64°F (18°C), and the average annual precipitation is 15 inches (381 mm).
Economy
The economy of Nipomo is largely based on agriculture. The area is known for its production of strawberries, broccoli, and other vegetables. Other industries in the area include manufacturing, retail, and tourism.
Demographics
As of 2019, the population of Nipomo was estimated to be 16,714. The racial makeup of the town was 73.3% White, 0.9% African American, 0.7% Native American, 1.2% Asian, 0.2% Pacific Islander, 19.7% from other races, and 4.2% from two or more races. Hispanic or Latino of any race were 37.2% of the population.
The median household income in Nipomo was $63,945 in 2019, and the median home value was $541,945. The median age of the population was 37.7 years.
Common Questions
What is Per Capita Income in Nipomo?
Per Capita income in Nipomo is $38,491.
What is the Median Family Income in Nipomo?
Median Family Income in Nipomo is $105,395.
What is the Median Household income in Nipomo?
Median Household Income in Nipomo is $95,982.
What is Income or Wage Gap in Nipomo?
Income or Wage Gap in Nipomo is 23.9%.
Women in Nipomo earn 76.1 cents for every dollar earned by a man.
What is Inequality or Gini Index in Nipomo?
Inequality or Gini Index in Nipomo is 0.40.
What is the Total Population of Nipomo?
Total Population of Nipomo is 18,009.
What is the Total Male Population of Nipomo?
Total Male Population of Nipomo is 8,992.
What is the Total Female Population of Nipomo?
Total Female Population of Nipomo is 9,017.
What is the Ratio of Males per 100 Females in Nipomo?
There are 99.72 Males per 100 Females in Nipomo.
What is the Ratio of Females per 100 Males in Nipomo?
There are 100.28 Females per 100 Males in Nipomo.
What is the Median Population Age in Nipomo?
Median Population Age in Nipomo is 37.9 Years.
What is the Average Family Size in Nipomo
Average Family Size in Nipomo is 3.5 People.
What is the Average Household Size in Nipomo
Average Household Size in Nipomo is 3.2 People.
How Large is the Labor Force in Nipomo?
There are 8,472 People in the Labor Forcein in Nipomo.
What is the Percentage of People in the Labor Force in Nipomo?
58.7% of People are in the Labor Force in Nipomo.
What is the Unemployment Rate in Nipomo?
Unemployment Rate in Nipomo is 4.0%.