Tipton, CA Map & Demographics
Tipton Map
Tipton Overview
$17,028
PER CAPITA INCOME
$47,539
AVG FAMILY INCOME
$47,695
AVG HOUSEHOLD INCOME
44.3%
WAGE / INCOME GAP [ % ]
55.7¢/ $1
WAGE / INCOME GAP [ $ ]
$7,918
FAMILY INCOME DEFICIT
0.48
INEQUALITY / GINI INDEX
3,170
TOTAL POPULATION
1,894
MALE POPULATION
1,276
FEMALE POPULATION
148.43
MALES / 100 FEMALES
67.37
FEMALES / 100 MALES
27.8
MEDIAN AGE
4.4
AVG FAMILY SIZE
4.2
AVG HOUSEHOLD SIZE
1,472
LABOR FORCE [ PEOPLE ]
62.9%
PERCENT IN LABOR FORCE
10.5%
UNEMPLOYMENT RATE
Tipton Zip Codes
Tipton Area Codes
Income in Tipton
Income Overview in Tipton
Per Capita Income in Tipton is $17,028, while median incomes of families and households are $47,539 and $47,695 respectively.
| Characteristic | Number | Measure |
| Per Capita Income | 3,170 | $17,028 |
| Median Family Income | 627 | $47,539 |
| Mean Family Income | 627 | $61,444 |
| Median Household Income | 761 | $47,695 |
| Mean Household Income | 761 | $67,620 |
| Income Deficit | 627 | $7,918 |
| Wage / Income Gap (%) | 3,170 | 44.34% |
| Wage / Income Gap ($) | 3,170 | 55.66¢ per $1 |
| Gini / Inequality Index | 3,170 | 0.48 |
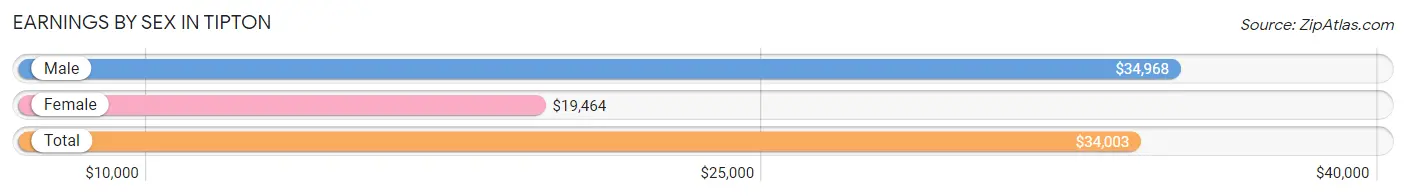
Earnings by Sex in Tipton
Average Earnings in Tipton are $34,003, $34,968 for men and $19,464 for women, a difference of 44.3%.
| Sex | Number | Average Earnings |
| Male | 966 (68.6%) | $34,968 |
| Female | 442 (31.4%) | $19,464 |
| Total | 1,408 (100.0%) | $34,003 |
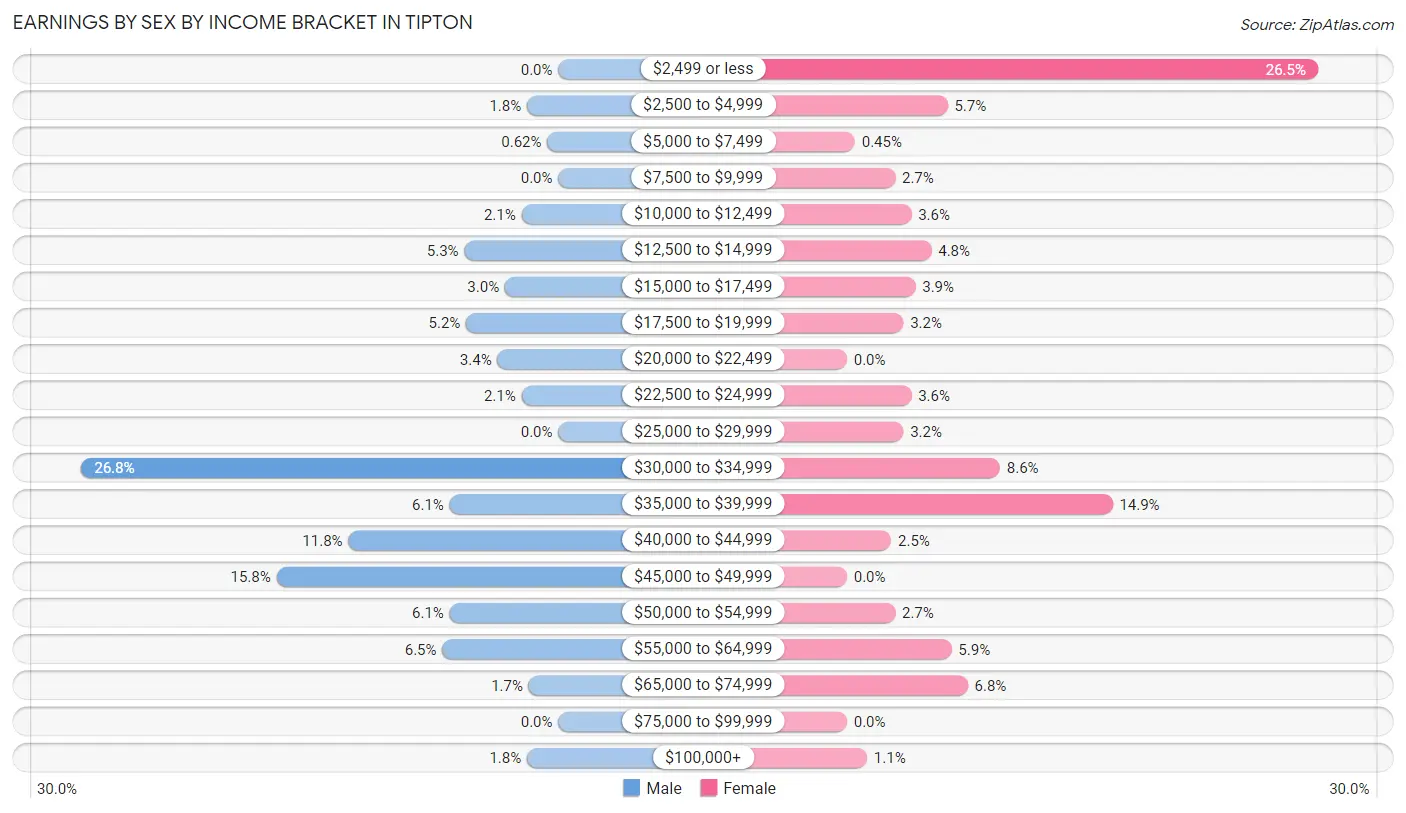
Earnings by Sex by Income Bracket in Tipton
The most common earnings brackets in Tipton are $30,000 to $34,999 for men (259 | 26.8%) and $2,499 or less for women (117 | 26.5%).
| Income | Male | Female |
| $2,499 or less | 0 (0.0%) | 117 (26.5%) |
| $2,500 to $4,999 | 17 (1.8%) | 25 (5.7%) |
| $5,000 to $7,499 | 6 (0.6%) | 2 (0.4%) |
| $7,500 to $9,999 | 0 (0.0%) | 12 (2.7%) |
| $10,000 to $12,499 | 20 (2.1%) | 16 (3.6%) |
| $12,500 to $14,999 | 51 (5.3%) | 21 (4.8%) |
| $15,000 to $17,499 | 29 (3.0%) | 17 (3.8%) |
| $17,500 to $19,999 | 50 (5.2%) | 14 (3.2%) |
| $20,000 to $22,499 | 33 (3.4%) | 0 (0.0%) |
| $22,500 to $24,999 | 20 (2.1%) | 16 (3.6%) |
| $25,000 to $29,999 | 0 (0.0%) | 14 (3.2%) |
| $30,000 to $34,999 | 259 (26.8%) | 38 (8.6%) |
| $35,000 to $39,999 | 59 (6.1%) | 66 (14.9%) |
| $40,000 to $44,999 | 114 (11.8%) | 11 (2.5%) |
| $45,000 to $49,999 | 153 (15.8%) | 0 (0.0%) |
| $50,000 to $54,999 | 59 (6.1%) | 12 (2.7%) |
| $55,000 to $64,999 | 63 (6.5%) | 26 (5.9%) |
| $65,000 to $74,999 | 16 (1.7%) | 30 (6.8%) |
| $75,000 to $99,999 | 0 (0.0%) | 0 (0.0%) |
| $100,000+ | 17 (1.8%) | 5 (1.1%) |
| Total | 966 (100.0%) | 442 (100.0%) |
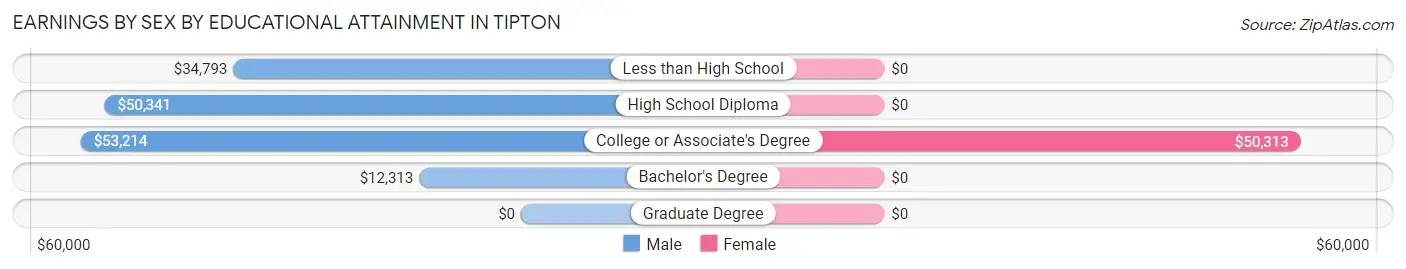
Earnings by Sex by Educational Attainment in Tipton
| Educational Attainment | Male Income | Female Income |
| Less than High School | $34,793 | $0 |
| High School Diploma | $50,341 | $0 |
| College or Associate's Degree | $53,214 | $50,313 |
| Bachelor's Degree | $12,313 | $0 |
| Graduate Degree | - | - |
| Total | $35,833 | $0 |
Family Income in Tipton
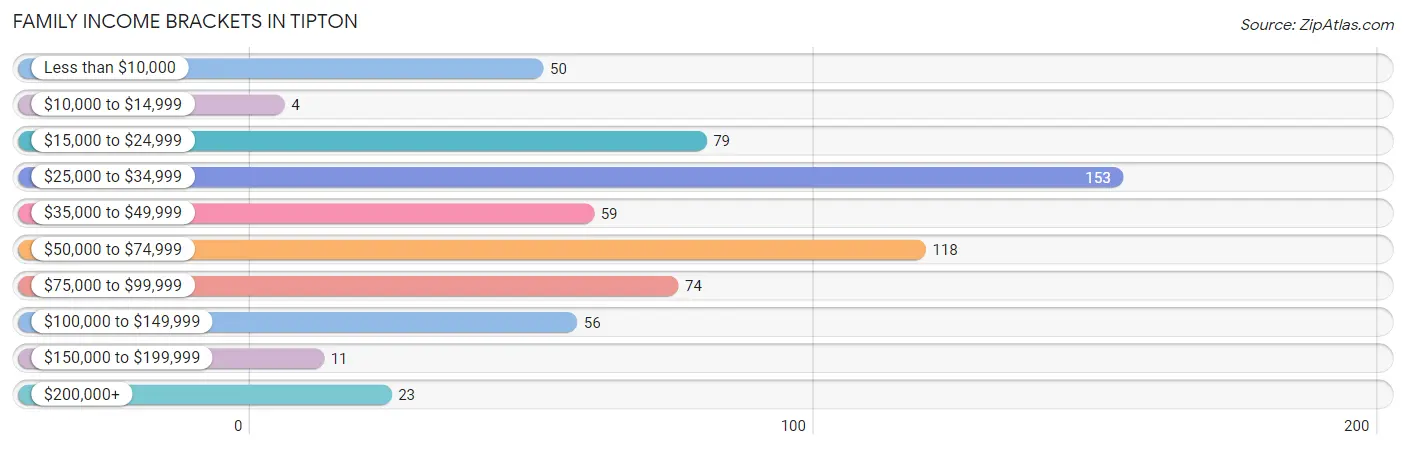
Family Income Brackets in Tipton
According to the Tipton family income data, there are 153 families falling into the $25,000 to $34,999 income range, which is the most common income bracket and makes up 24.4% of all families. Conversely, the $10,000 to $14,999 income bracket is the least frequent group with only 4 families (0.6%) belonging to this category.
| Income Bracket | # Families | % Families |
| Less than $10,000 | 50 | 8.0% |
| $10,000 to $14,999 | 4 | 0.6% |
| $15,000 to $24,999 | 79 | 12.6% |
| $25,000 to $34,999 | 153 | 24.4% |
| $35,000 to $49,999 | 59 | 9.4% |
| $50,000 to $74,999 | 118 | 18.8% |
| $75,000 to $99,999 | 74 | 11.8% |
| $100,000 to $149,999 | 56 | 8.9% |
| $150,000 to $199,999 | 11 | 1.8% |
| $200,000+ | 23 | 3.7% |
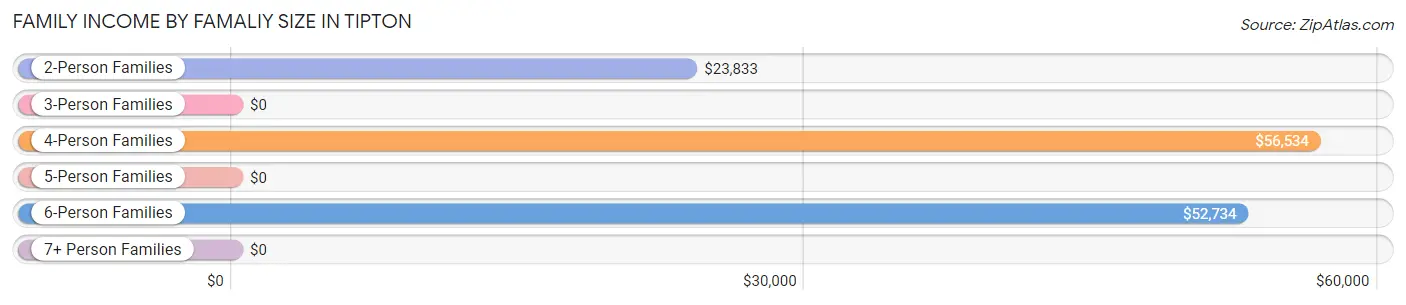
Family Income by Famaliy Size in Tipton
4-person families (121 | 19.3%) account for the highest median family income in Tipton with $56,534 per family, while 4-person families (121 | 19.3%) have the highest median income of $14,134 per family member.
| Income Bracket | # Families | Median Income |
| 2-Person Families | 132 (21.0%) | $23,833 |
| 3-Person Families | 62 (9.9%) | $0 |
| 4-Person Families | 121 (19.3%) | $56,534 |
| 5-Person Families | 222 (35.4%) | $0 |
| 6-Person Families | 51 (8.1%) | $52,734 |
| 7+ Person Families | 39 (6.2%) | $0 |
| Total | 627 (100.0%) | $47,539 |
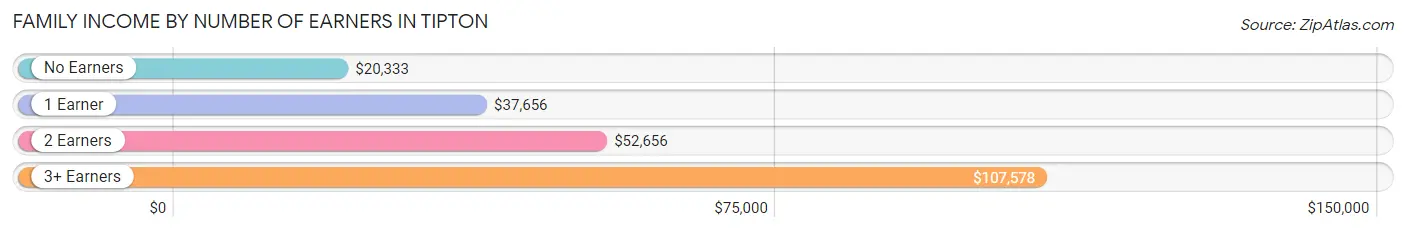
Family Income by Number of Earners in Tipton
The median family income in Tipton is $47,539, with families comprising 3+ earners (85) having the highest median family income of $107,578, while families with no earners (78) have the lowest median family income of $20,333, accounting for 13.6% and 12.4% of families, respectively.
| Number of Earners | # Families | Median Income |
| No Earners | 78 (12.4%) | $20,333 |
| 1 Earner | 220 (35.1%) | $37,656 |
| 2 Earners | 244 (38.9%) | $52,656 |
| 3+ Earners | 85 (13.6%) | $107,578 |
| Total | 627 (100.0%) | $47,539 |
Household Income in Tipton
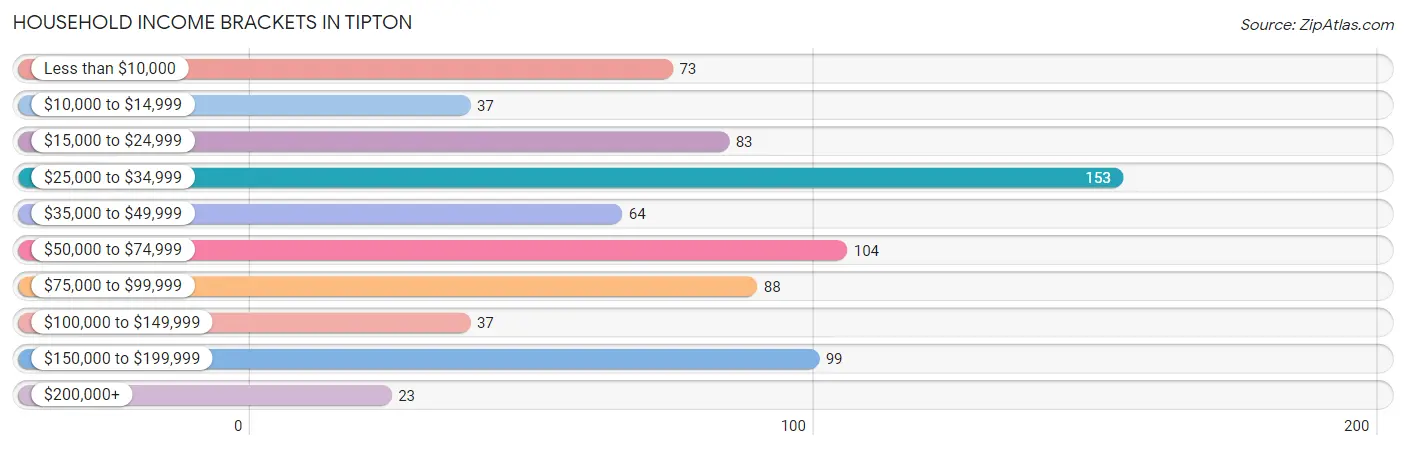
Household Income Brackets in Tipton
With 153 households falling in the category, the $25,000 to $34,999 income range is the most frequent in Tipton, accounting for 20.1% of all households. In contrast, only 23 households (3.0%) fall into the $200,000+ income bracket, making it the least populous group.
| Income Bracket | # Households | % Households |
| Less than $10,000 | 73 | 9.6% |
| $10,000 to $14,999 | 37 | 4.9% |
| $15,000 to $24,999 | 83 | 10.9% |
| $25,000 to $34,999 | 153 | 20.1% |
| $35,000 to $49,999 | 64 | 8.4% |
| $50,000 to $74,999 | 104 | 13.7% |
| $75,000 to $99,999 | 88 | 11.6% |
| $100,000 to $149,999 | 37 | 4.9% |
| $150,000 to $199,999 | 99 | 13.0% |
| $200,000+ | 23 | 3.0% |
Household Income by Householder Age in Tipton
The median household income in Tipton is $47,695, with the highest median household income of $53,672 found in the 25 to 44 years age bracket for the primary householder. A total of 331 households (43.5%) fall into this category. Meanwhile, the 15 to 24 years age bracket for the primary householder has the lowest median household income of $0, with 15 households (2.0%) in this group.
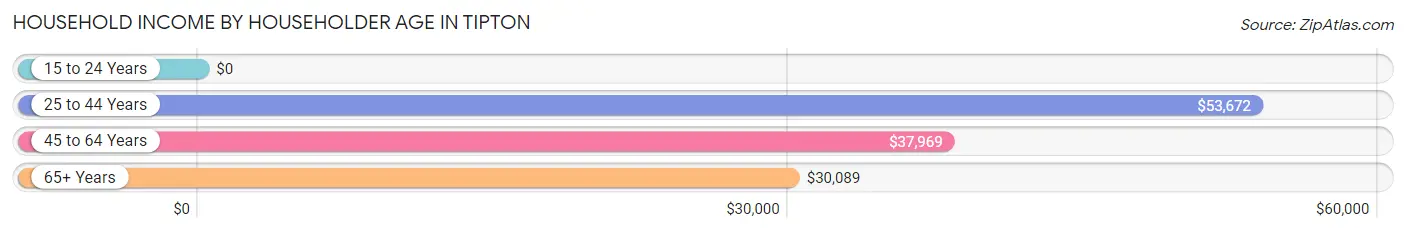
| Income Bracket | # Households | Median Income |
| 15 to 24 Years | 15 (2.0%) | $0 |
| 25 to 44 Years | 331 (43.5%) | $53,672 |
| 45 to 64 Years | 312 (41.0%) | $37,969 |
| 65+ Years | 103 (13.5%) | $30,089 |
| Total | 761 (100.0%) | $47,695 |
Poverty in Tipton
Income Below Poverty by Sex and Age in Tipton
With 31.3% poverty level for males and 31.7% for females among the residents of Tipton, 15 year old males and 5 year old females are the most vulnerable to poverty, with 35 males (100.0%) and 18 females (100.0%) in their respective age groups living below the poverty level.
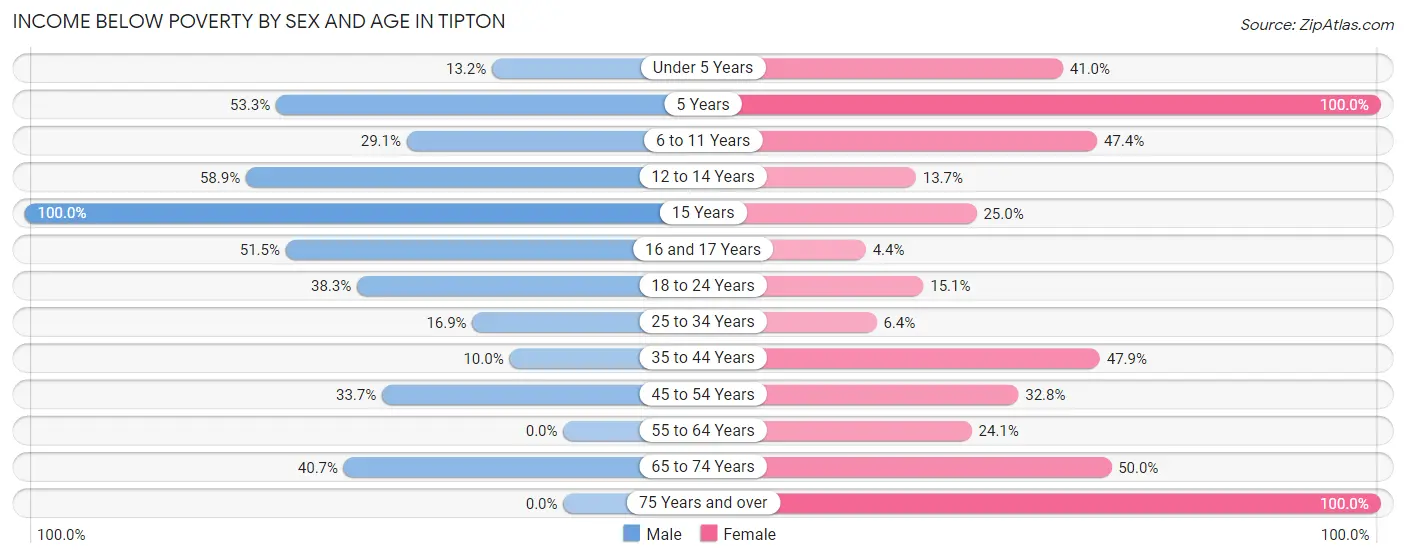
| Age Bracket | Male | Female |
| Under 5 Years | 9 (13.2%) | 32 (41.0%) |
| 5 Years | 16 (53.3%) | 18 (100.0%) |
| 6 to 11 Years | 59 (29.1%) | 72 (47.4%) |
| 12 to 14 Years | 76 (58.9%) | 14 (13.7%) |
| 15 Years | 35 (100.0%) | 2 (25.0%) |
| 16 and 17 Years | 102 (51.5%) | 2 (4.4%) |
| 18 to 24 Years | 103 (38.3%) | 23 (15.1%) |
| 25 to 34 Years | 28 (16.9%) | 9 (6.4%) |
| 35 to 44 Years | 35 (10.0%) | 91 (47.9%) |
| 45 to 54 Years | 106 (33.7%) | 76 (32.8%) |
| 55 to 64 Years | 0 (0.0%) | 20 (24.1%) |
| 65 to 74 Years | 22 (40.7%) | 31 (50.0%) |
| 75 Years and over | 0 (0.0%) | 14 (100.0%) |
| Total | 591 (31.3%) | 404 (31.7%) |
Income Above Poverty by Sex and Age in Tipton
According to the poverty statistics in Tipton, males aged 55 to 64 years and females aged 16 and 17 years are the age groups that are most secure financially, with 100.0% of males and 95.6% of females in these age groups living above the poverty line.
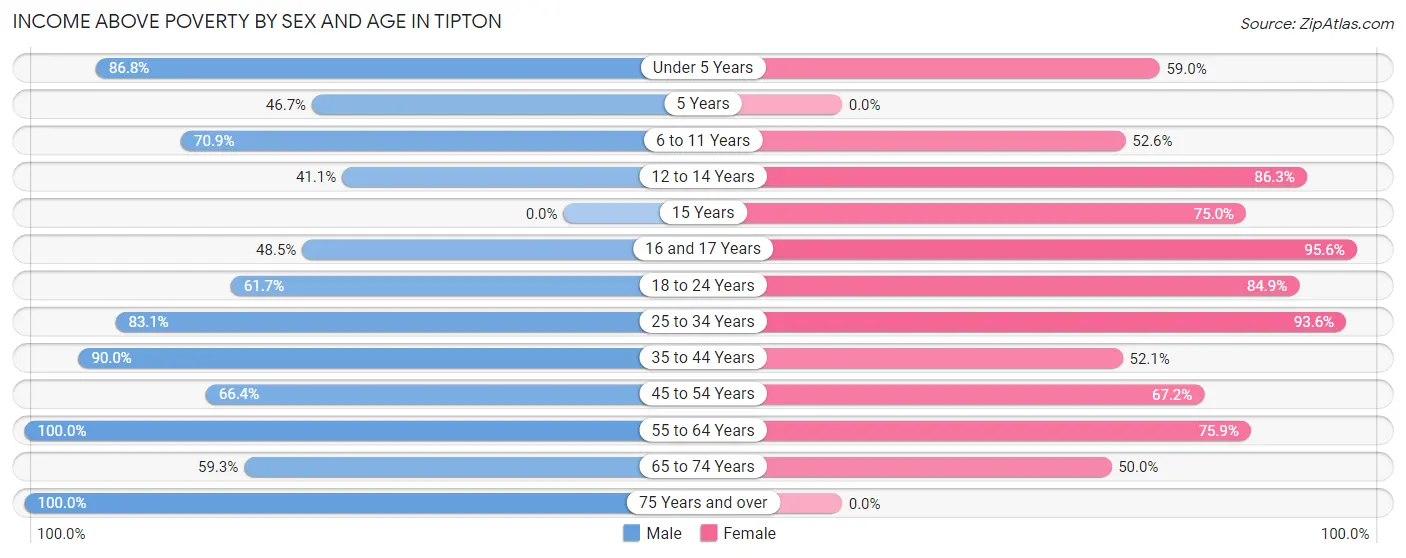
| Age Bracket | Male | Female |
| Under 5 Years | 59 (86.8%) | 46 (59.0%) |
| 5 Years | 14 (46.7%) | 0 (0.0%) |
| 6 to 11 Years | 144 (70.9%) | 80 (52.6%) |
| 12 to 14 Years | 53 (41.1%) | 88 (86.3%) |
| 15 Years | 0 (0.0%) | 6 (75.0%) |
| 16 and 17 Years | 96 (48.5%) | 43 (95.6%) |
| 18 to 24 Years | 166 (61.7%) | 129 (84.9%) |
| 25 to 34 Years | 138 (83.1%) | 131 (93.6%) |
| 35 to 44 Years | 315 (90.0%) | 99 (52.1%) |
| 45 to 54 Years | 209 (66.3%) | 156 (67.2%) |
| 55 to 64 Years | 56 (100.0%) | 63 (75.9%) |
| 65 to 74 Years | 32 (59.3%) | 31 (50.0%) |
| 75 Years and over | 14 (100.0%) | 0 (0.0%) |
| Total | 1,296 (68.7%) | 872 (68.3%) |
Income Below Poverty Among Married-Couple Families in Tipton
The poverty statistics for married-couple families in Tipton show that 32.4% or 147 of the total 454 families live below the poverty line. Families with 1 or 2 children have the highest poverty rate of 50.8%, comprising of 92 families. On the other hand, families with no children have the lowest poverty rate of 9.0%, which includes 12 families.
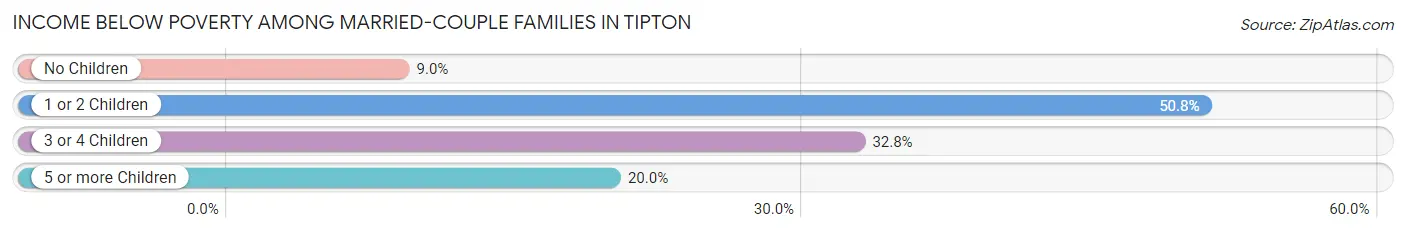
| Children | Above Poverty | Below Poverty |
| No Children | 122 (91.0%) | 12 (9.0%) |
| 1 or 2 Children | 89 (49.2%) | 92 (50.8%) |
| 3 or 4 Children | 80 (67.2%) | 39 (32.8%) |
| 5 or more Children | 16 (80.0%) | 4 (20.0%) |
| Total | 307 (67.6%) | 147 (32.4%) |
Income Below Poverty Among Single-Parent Households in Tipton
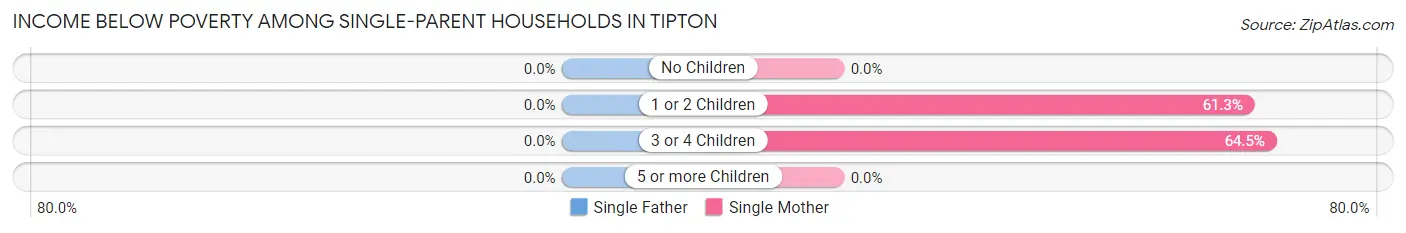
| Children | Single Father | Single Mother |
| No Children | 0 (0.0%) | 0 (0.0%) |
| 1 or 2 Children | 0 (0.0%) | 49 (61.3%) |
| 3 or 4 Children | 0 (0.0%) | 20 (64.5%) |
| 5 or more Children | 0 (0.0%) | 0 (0.0%) |
| Total | 0 (0.0%) | 69 (47.3%) |
Income Below Poverty Among Married-Couple vs Single-Parent Households in Tipton
The poverty data for Tipton shows that 147 of the married-couple family households (32.4%) and 69 of the single-parent households (39.9%) are living below the poverty level. Within the married-couple family households, those with 1 or 2 children have the highest poverty rate, with 92 households (50.8%) falling below the poverty line. Among the single-parent households, those with 3 or 4 children have the highest poverty rate, with 20 household (64.5%) living below poverty.
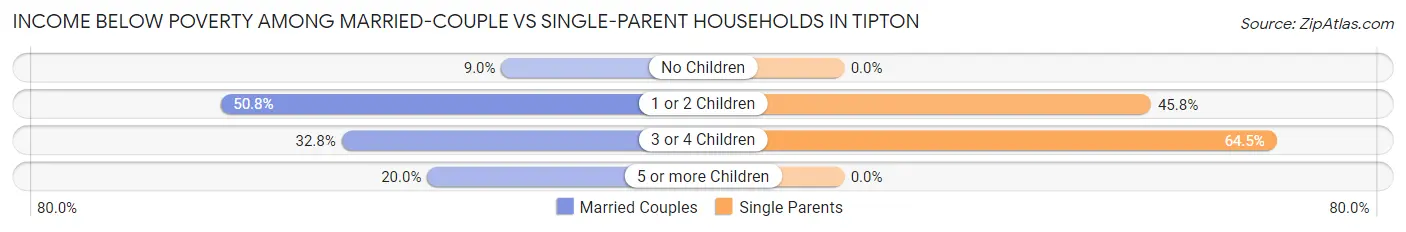
| Children | Married-Couple Families | Single-Parent Households |
| No Children | 12 (9.0%) | 0 (0.0%) |
| 1 or 2 Children | 92 (50.8%) | 49 (45.8%) |
| 3 or 4 Children | 39 (32.8%) | 20 (64.5%) |
| 5 or more Children | 4 (20.0%) | 0 (0.0%) |
| Total | 147 (32.4%) | 69 (39.9%) |
Race in Tipton
The most populous races in Tipton are Hispanic or Latino (2,954 | 93.2%), White / Caucasian (1,672 | 52.7%), and Two or more Races (935 | 29.5%).
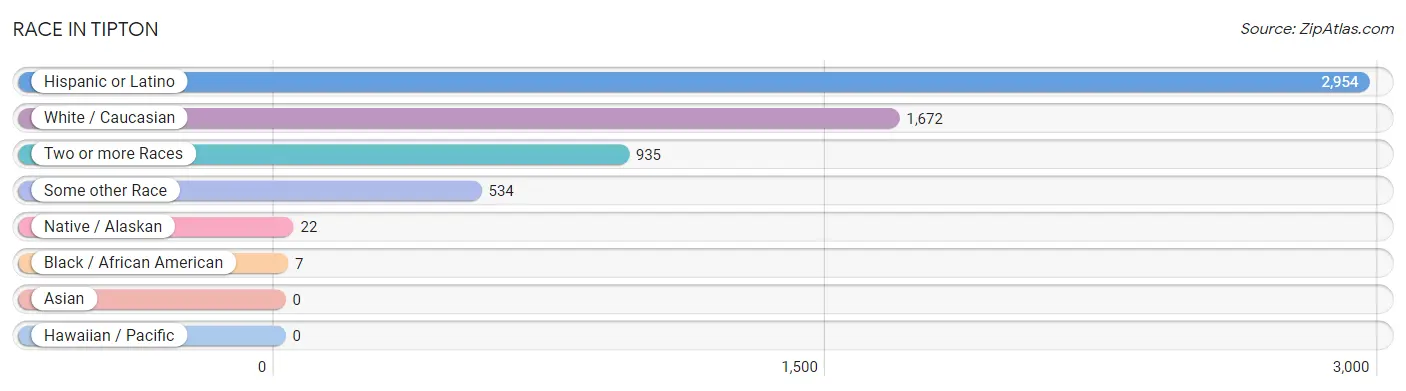
| Race | # Population | % Population |
| Asian | 0 | 0.0% |
| Black / African American | 7 | 0.2% |
| Hawaiian / Pacific | 0 | 0.0% |
| Hispanic or Latino | 2,954 | 93.2% |
| Native / Alaskan | 22 | 0.7% |
| White / Caucasian | 1,672 | 52.7% |
| Two or more Races | 935 | 29.5% |
| Some other Race | 534 | 16.9% |
| Total | 3,170 | 100.0% |
Ancestry in Tipton
The most populous ancestries reported in Tipton are Mexican (2,930 | 92.4%), Portuguese (75 | 2.4%), German (61 | 1.9%), American (29 | 0.9%), and Central American (24 | 0.8%), together accounting for 98.4% of all Tipton residents.
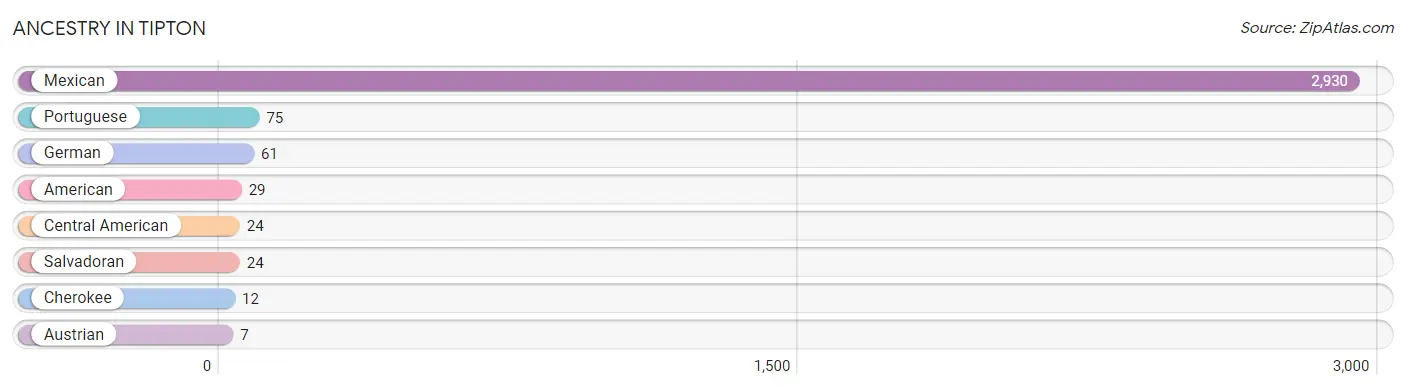
| Ancestry | # Population | % Population |
| American | 29 | 0.9% |
| Austrian | 7 | 0.2% |
| Central American | 24 | 0.8% |
| Cherokee | 12 | 0.4% |
| German | 61 | 1.9% |
| Mexican | 2,930 | 92.4% |
| Portuguese | 75 | 2.4% |
| Salvadoran | 24 | 0.8% | View All 8 Rows |
Immigrants in Tipton
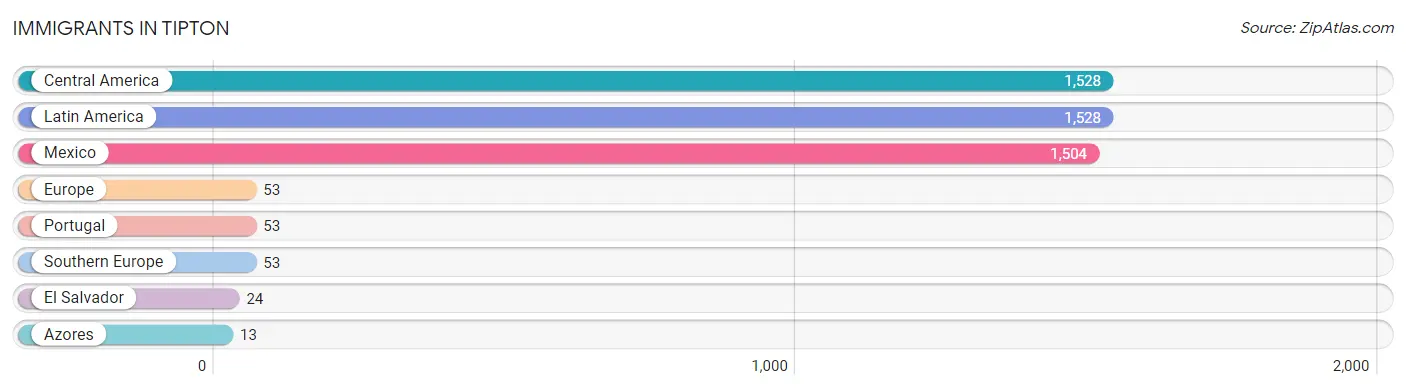
The most numerous immigrant groups reported in Tipton came from Central America (1,528 | 48.2%), Latin America (1,528 | 48.2%), Mexico (1,504 | 47.4%), Europe (53 | 1.7%), and Portugal (53 | 1.7%), together accounting for 147.2% of all Tipton residents.
| Immigration Origin | # Population | % Population |
| Azores | 13 | 0.4% |
| Central America | 1,528 | 48.2% |
| El Salvador | 24 | 0.8% |
| Europe | 53 | 1.7% |
| Latin America | 1,528 | 48.2% |
| Mexico | 1,504 | 47.4% |
| Portugal | 53 | 1.7% |
| Southern Europe | 53 | 1.7% | View All 8 Rows |
Sex and Age in Tipton
Sex and Age in Tipton
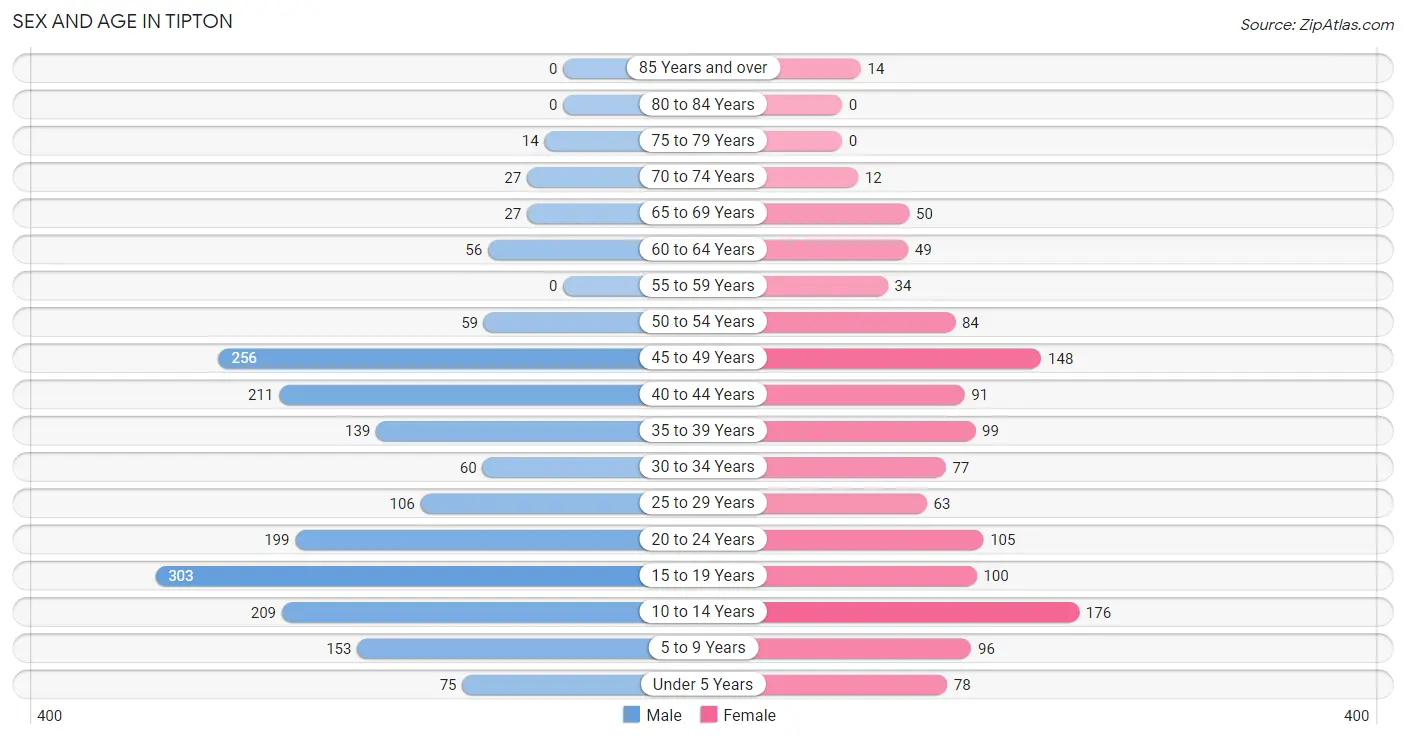
The most populous age groups in Tipton are 15 to 19 Years (303 | 16.0%) for men and 10 to 14 Years (176 | 13.8%) for women.
| Age Bracket | Male | Female |
| Under 5 Years | 75 (4.0%) | 78 (6.1%) |
| 5 to 9 Years | 153 (8.1%) | 96 (7.5%) |
| 10 to 14 Years | 209 (11.0%) | 176 (13.8%) |
| 15 to 19 Years | 303 (16.0%) | 100 (7.8%) |
| 20 to 24 Years | 199 (10.5%) | 105 (8.2%) |
| 25 to 29 Years | 106 (5.6%) | 63 (4.9%) |
| 30 to 34 Years | 60 (3.2%) | 77 (6.0%) |
| 35 to 39 Years | 139 (7.3%) | 99 (7.8%) |
| 40 to 44 Years | 211 (11.1%) | 91 (7.1%) |
| 45 to 49 Years | 256 (13.5%) | 148 (11.6%) |
| 50 to 54 Years | 59 (3.1%) | 84 (6.6%) |
| 55 to 59 Years | 0 (0.0%) | 34 (2.7%) |
| 60 to 64 Years | 56 (3.0%) | 49 (3.8%) |
| 65 to 69 Years | 27 (1.4%) | 50 (3.9%) |
| 70 to 74 Years | 27 (1.4%) | 12 (0.9%) |
| 75 to 79 Years | 14 (0.7%) | 0 (0.0%) |
| 80 to 84 Years | 0 (0.0%) | 0 (0.0%) |
| 85 Years and over | 0 (0.0%) | 14 (1.1%) |
| Total | 1,894 (100.0%) | 1,276 (100.0%) |
Families and Households in Tipton
Median Family Size in Tipton
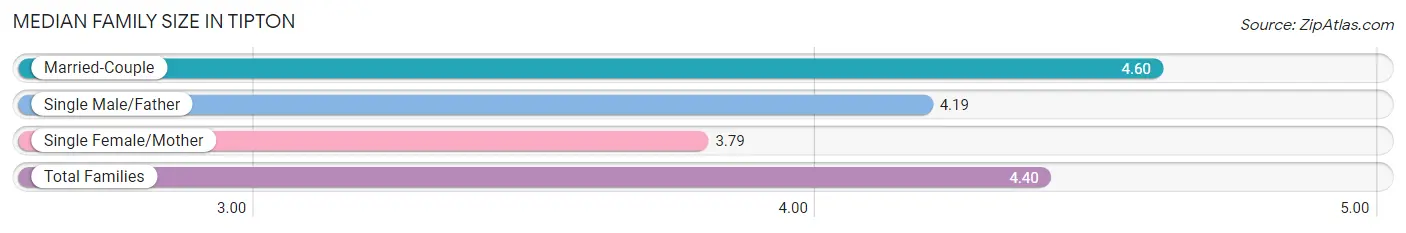
The median family size in Tipton is 4.40 persons per family, with married-couple families (454 | 72.4%) accounting for the largest median family size of 4.6 persons per family. On the other hand, single female/mother families (146 | 23.3%) represent the smallest median family size with 3.79 persons per family.
| Family Type | # Families | Family Size |
| Married-Couple | 454 (72.4%) | 4.60 |
| Single Male/Father | 27 (4.3%) | 4.19 |
| Single Female/Mother | 146 (23.3%) | 3.79 |
| Total Families | 627 (100.0%) | 4.40 |
Median Household Size in Tipton
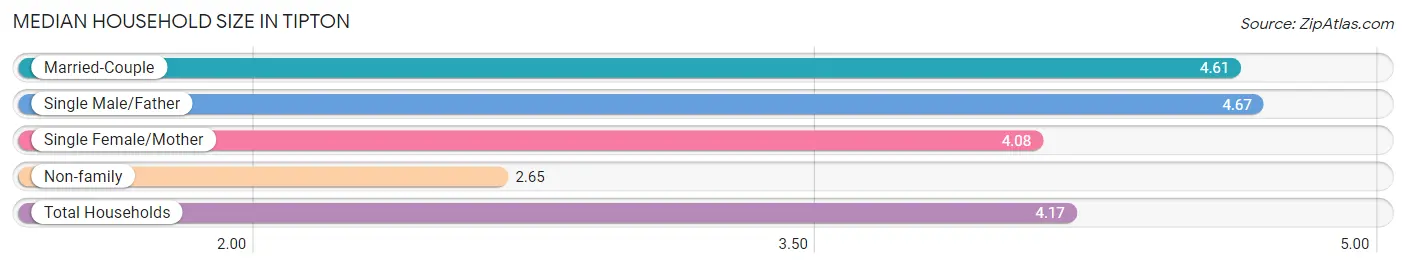
The median household size in Tipton is 4.17 persons per household, with single male/father households (27 | 3.5%) accounting for the largest median household size of 4.67 persons per household. non-family households (134 | 17.6%) represent the smallest median household size with 2.65 persons per household.
| Household Type | # Households | Household Size |
| Married-Couple | 454 (59.7%) | 4.61 |
| Single Male/Father | 27 (3.5%) | 4.67 |
| Single Female/Mother | 146 (19.2%) | 4.08 |
| Non-family | 134 (17.6%) | 2.65 |
| Total Households | 761 (100.0%) | 4.17 |
Household Size by Marriage Status in Tipton
Out of a total of 761 households in Tipton, 627 (82.4%) are family households, while 134 (17.6%) are nonfamily households. The most numerous type of family households are 5-person households, comprising 253, and the most common type of nonfamily households are 4-person households, comprising 69.
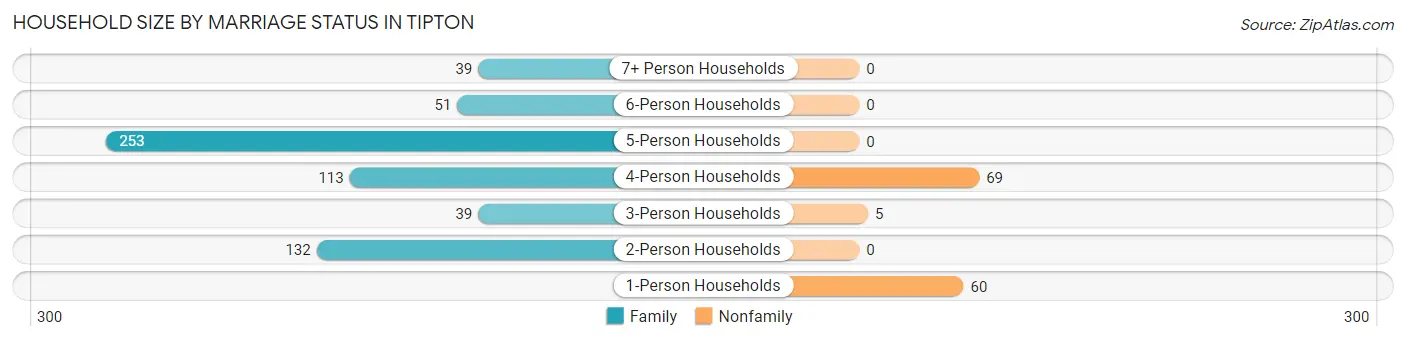
| Household Size | Family Households | Nonfamily Households |
| 1-Person Households | - | 60 (7.9%) |
| 2-Person Households | 132 (17.3%) | 0 (0.0%) |
| 3-Person Households | 39 (5.1%) | 5 (0.7%) |
| 4-Person Households | 113 (14.8%) | 69 (9.1%) |
| 5-Person Households | 253 (33.3%) | 0 (0.0%) |
| 6-Person Households | 51 (6.7%) | 0 (0.0%) |
| 7+ Person Households | 39 (5.1%) | 0 (0.0%) |
| Total | 627 (82.4%) | 134 (17.6%) |
Female Fertility in Tipton
Fertility by Age in Tipton
Average fertility rate in Tipton is 15.0 births per 1,000 women. Women in the age bracket of 35 to 50 years have the highest fertility rate with 29.0 births per 1,000 women. Women in the age bracket of 35 to 50 years acount for 100.0% of all women with births.
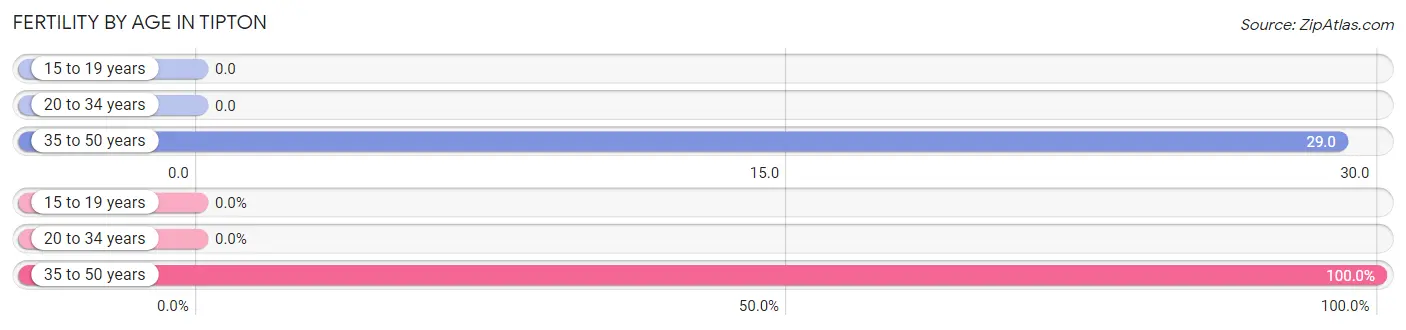
| Age Bracket | Women with Births | Births / 1,000 Women |
| 15 to 19 years | 0 (0.0%) | 0.0 |
| 20 to 34 years | 0 (0.0%) | 0.0 |
| 35 to 50 years | 11 (100.0%) | 29.0 |
| Total | 11 (100.0%) | 15.0 |
Fertility by Age by Marriage Status in Tipton
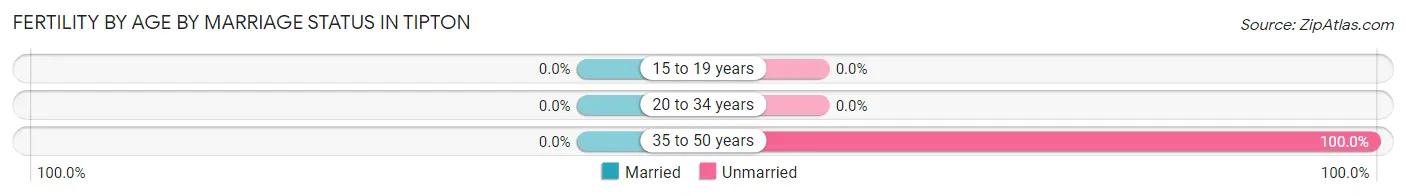
| Age Bracket | Married | Unmarried |
| 15 to 19 years | 0 (0.0%) | 0 (0.0%) |
| 20 to 34 years | 0 (0.0%) | 0 (0.0%) |
| 35 to 50 years | 0 (0.0%) | 11 (100.0%) |
| Total | 0 (0.0%) | 11 (100.0%) |
Fertility by Education in Tipton
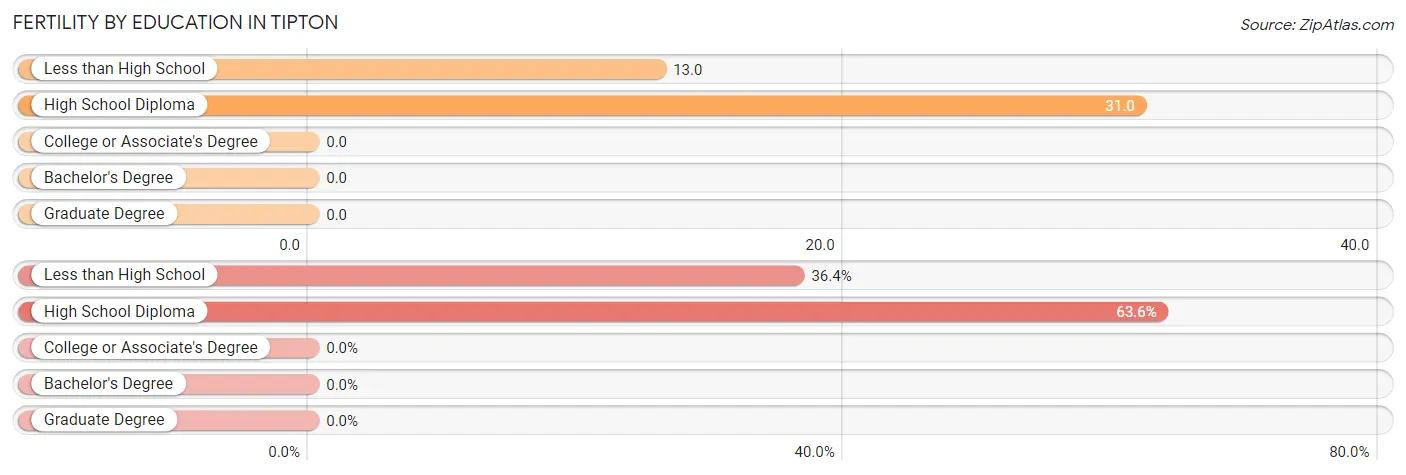
| Educational Attainment | Women with Births | Births / 1,000 Women |
| Less than High School | 4 (36.4%) | 13.0 |
| High School Diploma | 7 (63.6%) | 31.0 |
| College or Associate's Degree | 0 (0.0%) | 0.0 |
| Bachelor's Degree | 0 (0.0%) | 0.0 |
| Graduate Degree | 0 (0.0%) | 0.0 |
| Total | 11 (100.0%) | 15.0 |
Fertility by Education by Marriage Status in Tipton
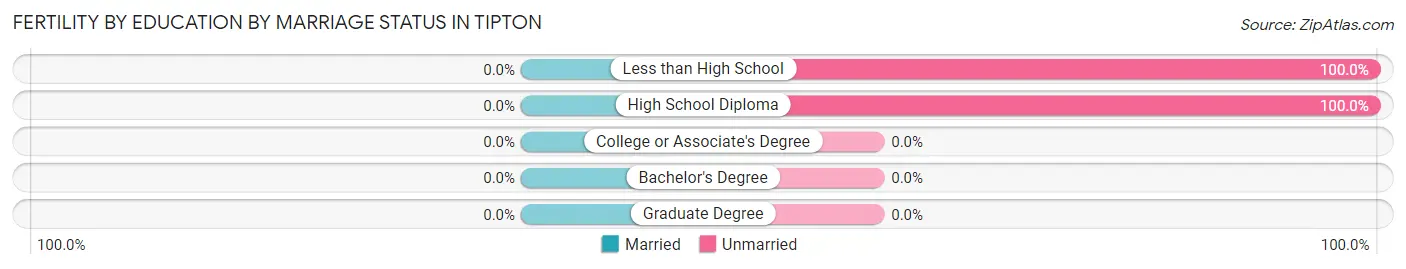
| Educational Attainment | Married | Unmarried |
| Less than High School | 0 (0.0%) | 4 (100.0%) |
| High School Diploma | 0 (0.0%) | 7 (100.0%) |
| College or Associate's Degree | 0 (0.0%) | 0 (0.0%) |
| Bachelor's Degree | 0 (0.0%) | 0 (0.0%) |
| Graduate Degree | 0 (0.0%) | 0 (0.0%) |
| Total | 0 (0.0%) | 11 (100.0%) |
Employment Characteristics in Tipton
Employment by Class of Employer in Tipton
Among the 1,282 employed individuals in Tipton, private company employees (1,078 | 84.1%), local government employees (63 | 4.9%), and self-employed (not incorporated) (58 | 4.5%) make up the most common classes of employment.
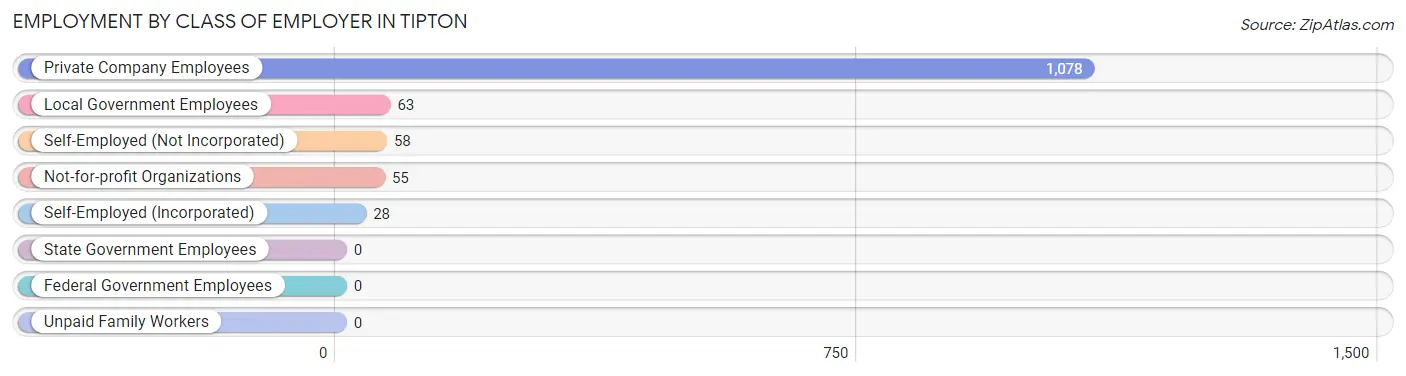
| Employer Class | # Employees | % Employees |
| Private Company Employees | 1,078 | 84.1% |
| Self-Employed (Incorporated) | 28 | 2.2% |
| Self-Employed (Not Incorporated) | 58 | 4.5% |
| Not-for-profit Organizations | 55 | 4.3% |
| Local Government Employees | 63 | 4.9% |
| State Government Employees | 0 | 0.0% |
| Federal Government Employees | 0 | 0.0% |
| Unpaid Family Workers | 0 | 0.0% |
| Total | 1,282 | 100.0% |
Employment Status by Age in Tipton
According to the labor force statistics for Tipton, out of the total population over 16 years of age (2,340), 62.9% or 1,472 individuals are in the labor force, with 10.5% or 155 of them unemployed. The age group with the highest labor force participation rate is 25 to 29 years, with 89.9% or 152 individuals in the labor force. Within the labor force, the 20 to 24 years age range has the highest percentage of unemployed individuals, with 53.4% or 103 of them being unemployed.
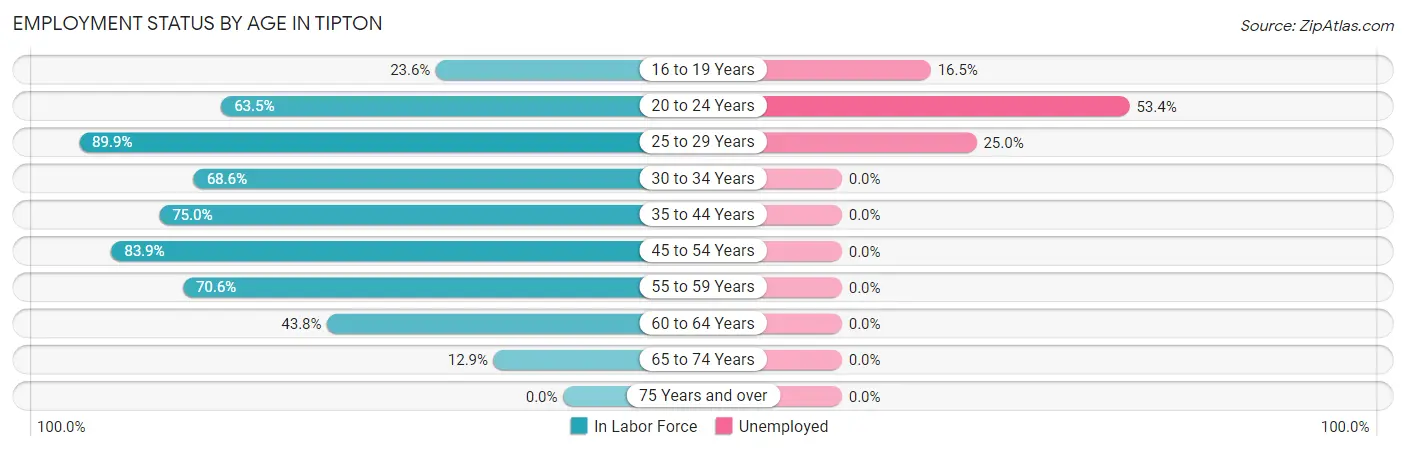
| Age Bracket | In Labor Force | Unemployed |
| 16 to 19 Years | 85 (23.6%) | 14 (16.5%) |
| 20 to 24 Years | 193 (63.5%) | 103 (53.4%) |
| 25 to 29 Years | 152 (89.9%) | 38 (25.0%) |
| 30 to 34 Years | 94 (68.6%) | 0 (0.0%) |
| 35 to 44 Years | 405 (75.0%) | 0 (0.0%) |
| 45 to 54 Years | 459 (83.9%) | 0 (0.0%) |
| 55 to 59 Years | 24 (70.6%) | 0 (0.0%) |
| 60 to 64 Years | 46 (43.8%) | 0 (0.0%) |
| 65 to 74 Years | 15 (12.9%) | 0 (0.0%) |
| 75 Years and over | 0 (0.0%) | 0 (0.0%) |
| Total | 1,472 (62.9%) | 155 (10.5%) |
Employment Status by Educational Attainment in Tipton
According to labor force statistics for Tipton, 77.0% of individuals (1,180) out of the total population between 25 and 64 years of age (1,532) are in the labor force, with 3.2% or 38 of them being unemployed. The group with the highest labor force participation rate are those with the educational attainment of bachelor's degree or higher, with 90.0% or 54 individuals in the labor force. Within the labor force, individuals with bachelor's degree or higher education have the highest percentage of unemployment, with 37.0% or 20 of them being unemployed.
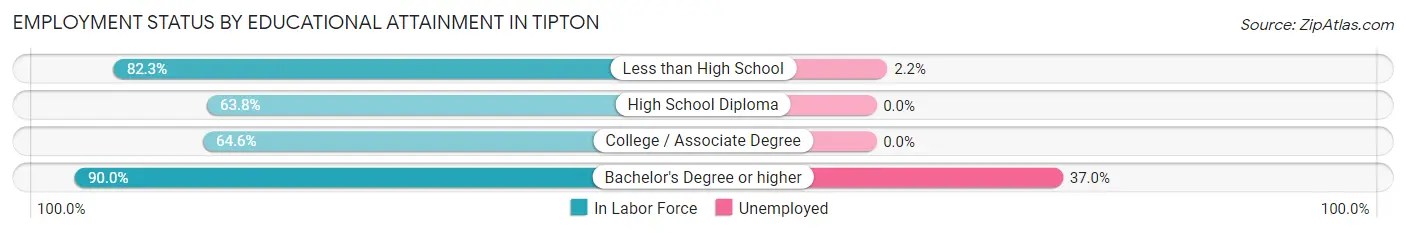
| Educational Attainment | In Labor Force | Unemployed |
| Less than High School | 824 (82.3%) | 22 (2.2%) |
| High School Diploma | 176 (63.8%) | 0 (0.0%) |
| College / Associate Degree | 126 (64.6%) | 0 (0.0%) |
| Bachelor's Degree or higher | 54 (90.0%) | 22 (37.0%) |
| Total | 1,180 (77.0%) | 49 (3.2%) |
Employment Occupations by Sex in Tipton
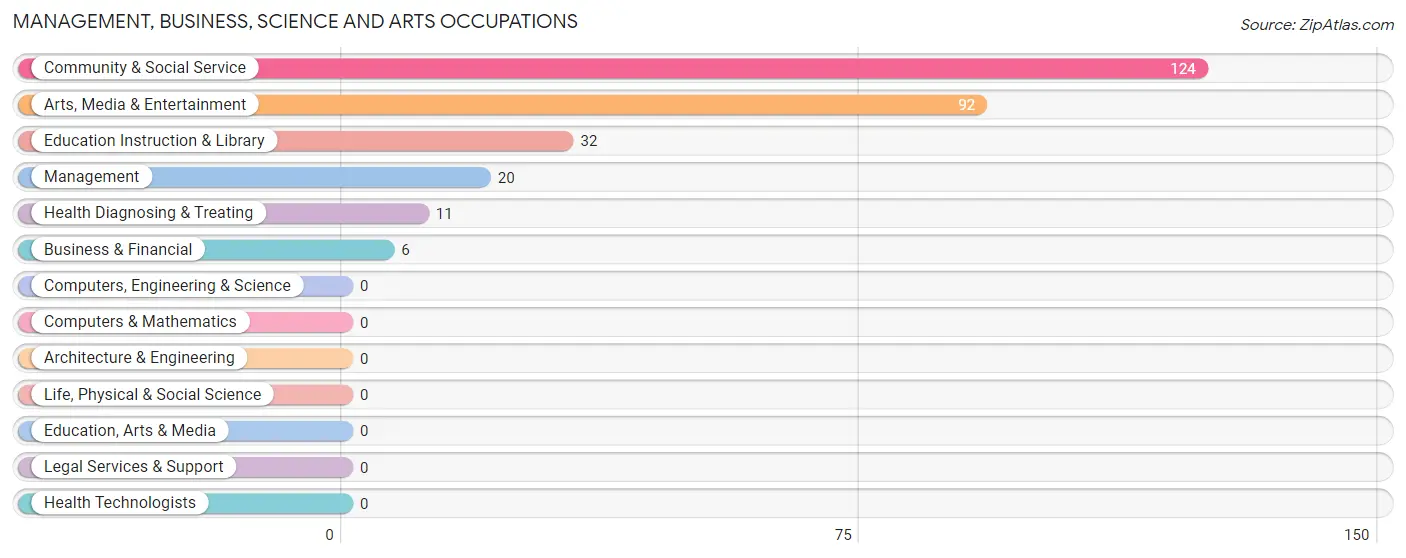
Management, Business, Science and Arts Occupations
The most common Management, Business, Science and Arts occupations in Tipton are Community & Social Service (124 | 9.4%), Arts, Media & Entertainment (92 | 7.0%), Education Instruction & Library (32 | 2.4%), Management (20 | 1.5%), and Health Diagnosing & Treating (11 | 0.8%).
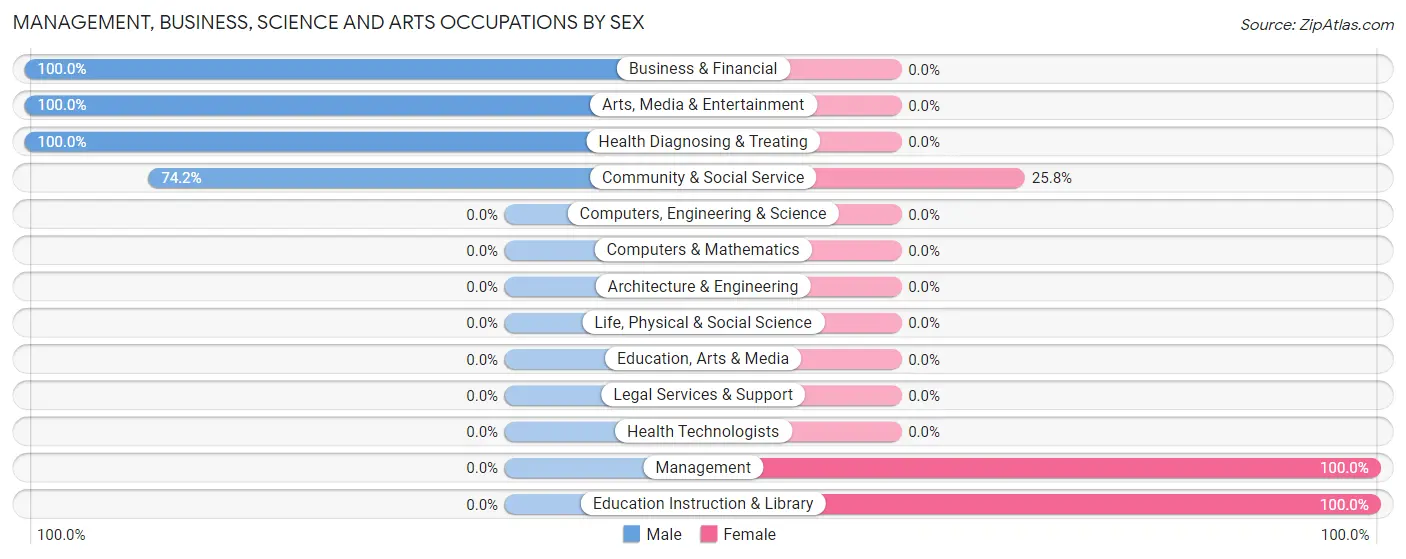
Management, Business, Science and Arts Occupations by Sex
Within the Management, Business, Science and Arts occupations in Tipton, the most male-oriented occupations are Business & Financial (100.0%), Arts, Media & Entertainment (100.0%), and Health Diagnosing & Treating (100.0%), while the most female-oriented occupations are Management (100.0%), Education Instruction & Library (100.0%), and Community & Social Service (25.8%).
| Occupation | Male | Female |
| Management | 0 (0.0%) | 20 (100.0%) |
| Business & Financial | 6 (100.0%) | 0 (0.0%) |
| Computers, Engineering & Science | 0 (0.0%) | 0 (0.0%) |
| Computers & Mathematics | 0 (0.0%) | 0 (0.0%) |
| Architecture & Engineering | 0 (0.0%) | 0 (0.0%) |
| Life, Physical & Social Science | 0 (0.0%) | 0 (0.0%) |
| Community & Social Service | 92 (74.2%) | 32 (25.8%) |
| Education, Arts & Media | 0 (0.0%) | 0 (0.0%) |
| Legal Services & Support | 0 (0.0%) | 0 (0.0%) |
| Education Instruction & Library | 0 (0.0%) | 32 (100.0%) |
| Arts, Media & Entertainment | 92 (100.0%) | 0 (0.0%) |
| Health Diagnosing & Treating | 11 (100.0%) | 0 (0.0%) |
| Health Technologists | 0 (0.0%) | 0 (0.0%) |
| Total (Category) | 109 (67.7%) | 52 (32.3%) |
| Total (Overall) | 912 (69.2%) | 406 (30.8%) |
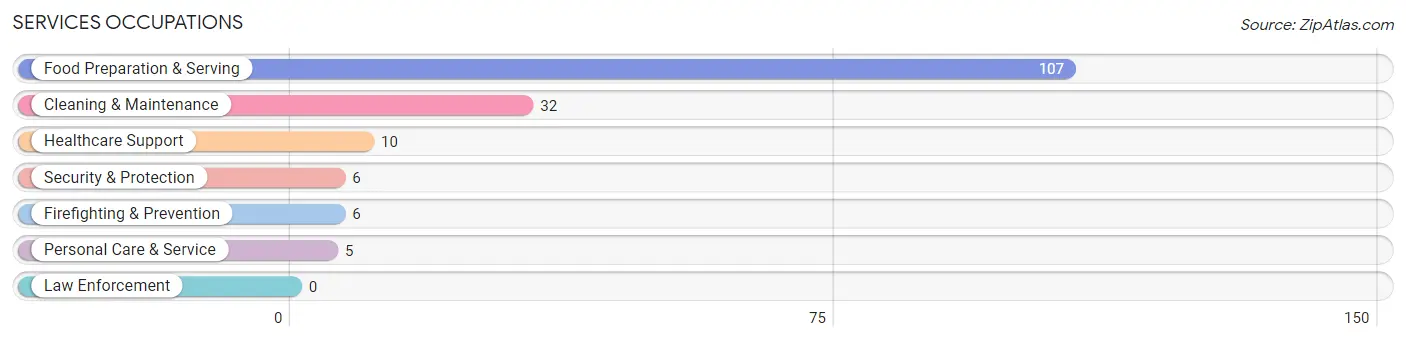
Services Occupations
The most common Services occupations in Tipton are Food Preparation & Serving (107 | 8.1%), Cleaning & Maintenance (32 | 2.4%), Healthcare Support (10 | 0.8%), Security & Protection (6 | 0.5%), and Firefighting & Prevention (6 | 0.5%).
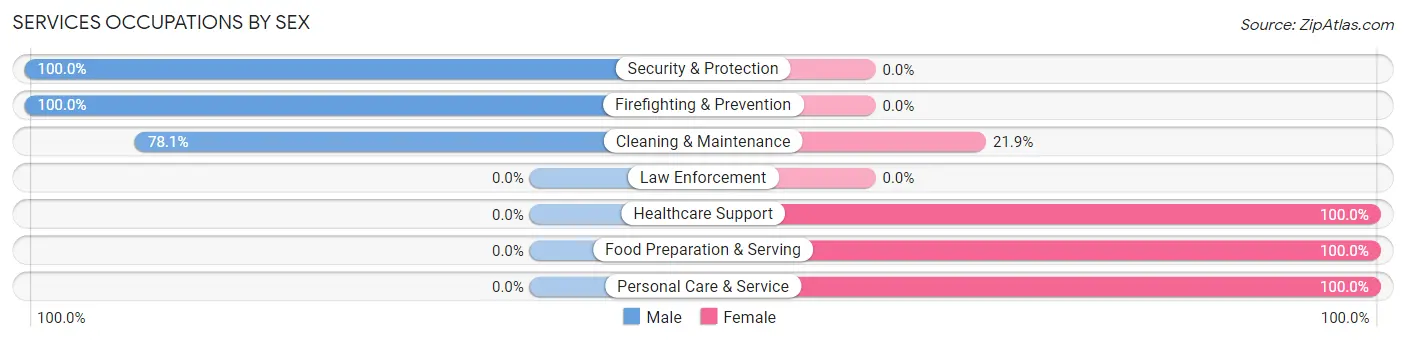
Services Occupations by Sex
Within the Services occupations in Tipton, the most male-oriented occupations are Security & Protection (100.0%), Firefighting & Prevention (100.0%), and Cleaning & Maintenance (78.1%), while the most female-oriented occupations are Healthcare Support (100.0%), Food Preparation & Serving (100.0%), and Personal Care & Service (100.0%).
| Occupation | Male | Female |
| Healthcare Support | 0 (0.0%) | 10 (100.0%) |
| Security & Protection | 6 (100.0%) | 0 (0.0%) |
| Firefighting & Prevention | 6 (100.0%) | 0 (0.0%) |
| Law Enforcement | 0 (0.0%) | 0 (0.0%) |
| Food Preparation & Serving | 0 (0.0%) | 107 (100.0%) |
| Cleaning & Maintenance | 25 (78.1%) | 7 (21.9%) |
| Personal Care & Service | 0 (0.0%) | 5 (100.0%) |
| Total (Category) | 31 (19.4%) | 129 (80.6%) |
| Total (Overall) | 912 (69.2%) | 406 (30.8%) |
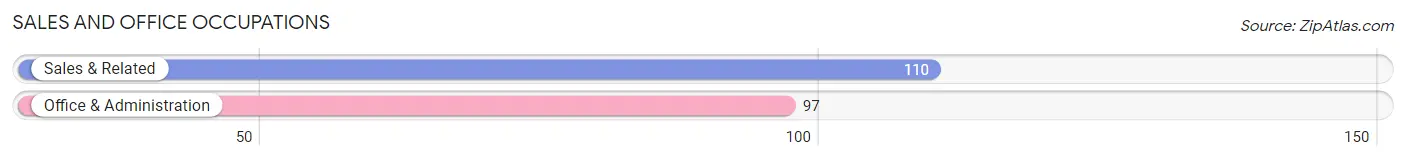
Sales and Office Occupations
The most common Sales and Office occupations in Tipton are Sales & Related (110 | 8.4%), and Office & Administration (97 | 7.4%).
Sales and Office Occupations by Sex
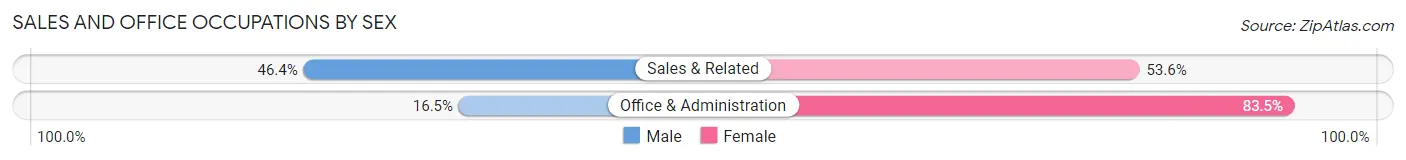
| Occupation | Male | Female |
| Sales & Related | 51 (46.4%) | 59 (53.6%) |
| Office & Administration | 16 (16.5%) | 81 (83.5%) |
| Total (Category) | 67 (32.4%) | 140 (67.6%) |
| Total (Overall) | 912 (69.2%) | 406 (30.8%) |
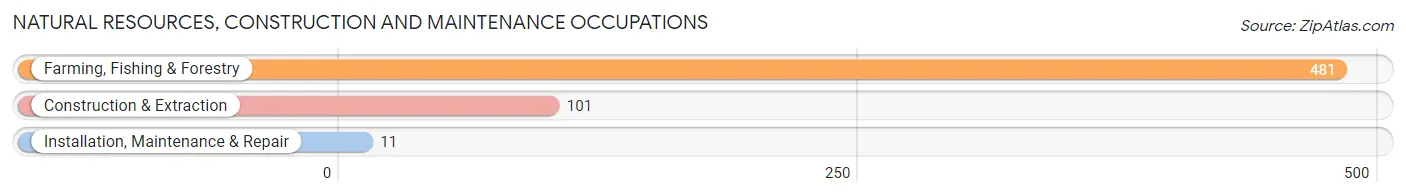
Natural Resources, Construction and Maintenance Occupations
The most common Natural Resources, Construction and Maintenance occupations in Tipton are Farming, Fishing & Forestry (481 | 36.5%), Construction & Extraction (101 | 7.7%), and Installation, Maintenance & Repair (11 | 0.8%).
Natural Resources, Construction and Maintenance Occupations by Sex
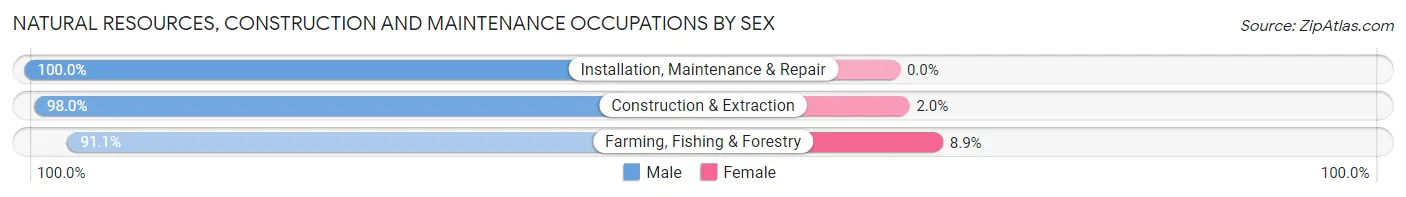
| Occupation | Male | Female |
| Farming, Fishing & Forestry | 438 (91.1%) | 43 (8.9%) |
| Construction & Extraction | 99 (98.0%) | 2 (2.0%) |
| Installation, Maintenance & Repair | 11 (100.0%) | 0 (0.0%) |
| Total (Category) | 548 (92.4%) | 45 (7.6%) |
| Total (Overall) | 912 (69.2%) | 406 (30.8%) |
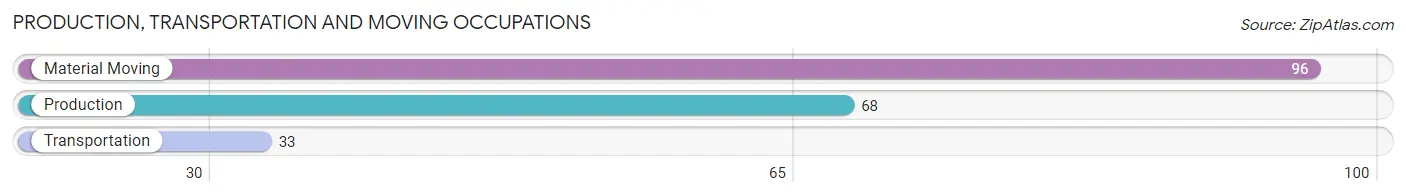
Production, Transportation and Moving Occupations
The most common Production, Transportation and Moving occupations in Tipton are Material Moving (96 | 7.3%), Production (68 | 5.2%), and Transportation (33 | 2.5%).
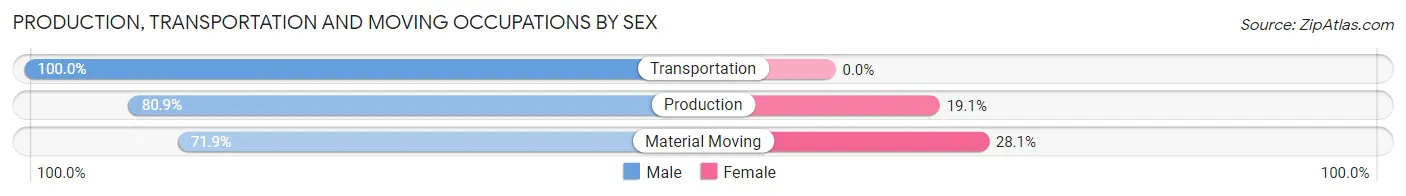
Production, Transportation and Moving Occupations by Sex
| Occupation | Male | Female |
| Production | 55 (80.9%) | 13 (19.1%) |
| Transportation | 33 (100.0%) | 0 (0.0%) |
| Material Moving | 69 (71.9%) | 27 (28.1%) |
| Total (Category) | 157 (79.7%) | 40 (20.3%) |
| Total (Overall) | 912 (69.2%) | 406 (30.8%) |
Employment Industries by Sex in Tipton
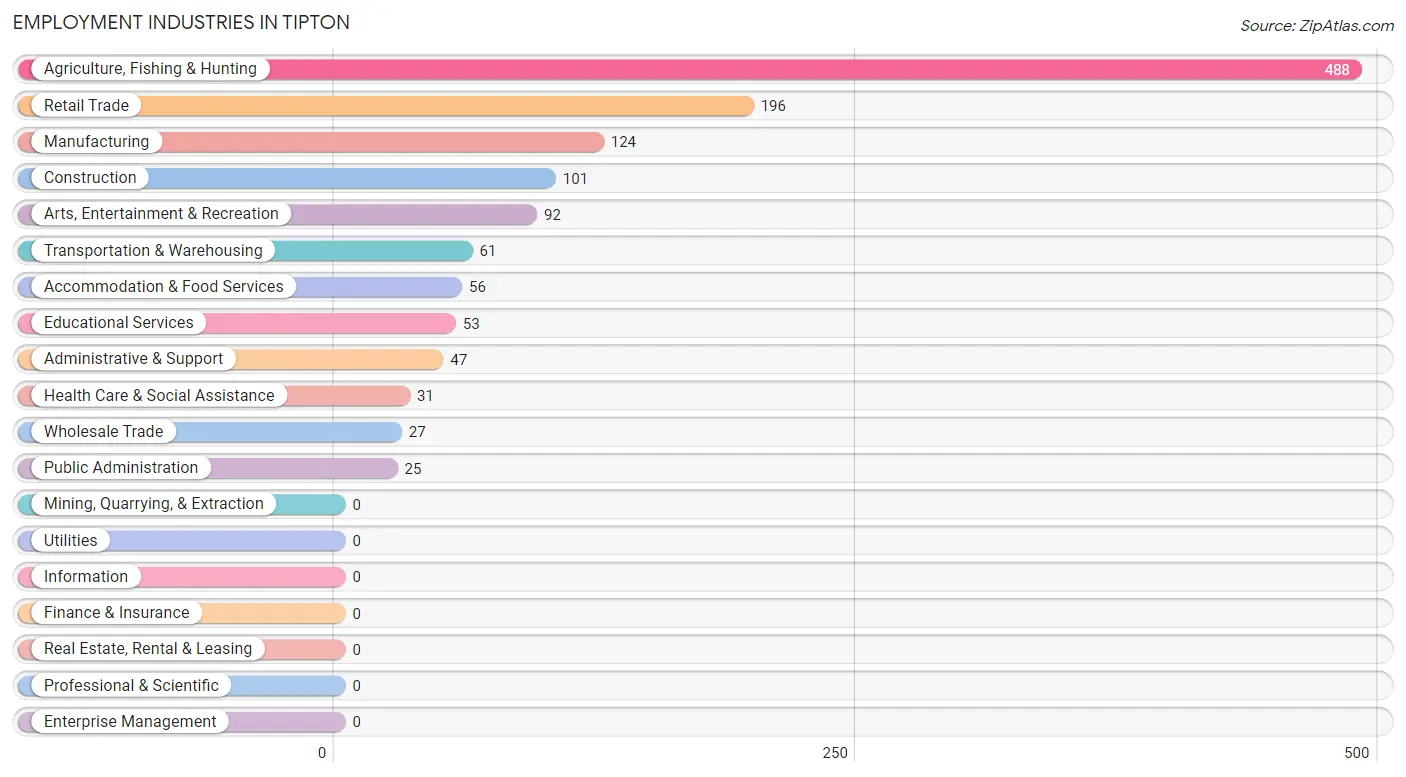
Employment Industries in Tipton
The major employment industries in Tipton include Agriculture, Fishing & Hunting (488 | 37.0%), Retail Trade (196 | 14.9%), Manufacturing (124 | 9.4%), Construction (101 | 7.7%), and Arts, Entertainment & Recreation (92 | 7.0%).
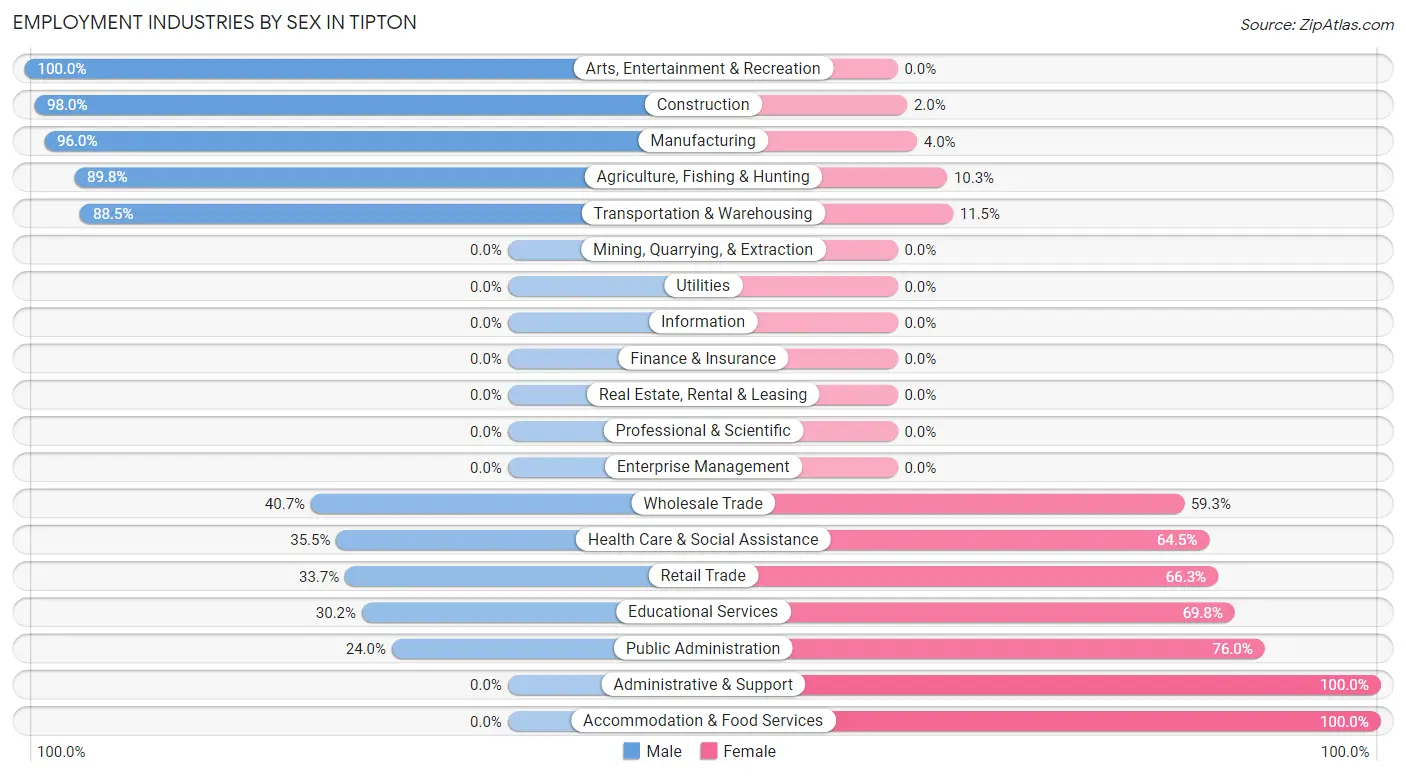
Employment Industries by Sex in Tipton
The Tipton industries that see more men than women are Arts, Entertainment & Recreation (100.0%), Construction (98.0%), and Manufacturing (96.0%), whereas the industries that tend to have a higher number of women are Administrative & Support (100.0%), Accommodation & Food Services (100.0%), and Public Administration (76.0%).
| Industry | Male | Female |
| Agriculture, Fishing & Hunting | 438 (89.7%) | 50 (10.2%) |
| Mining, Quarrying, & Extraction | 0 (0.0%) | 0 (0.0%) |
| Construction | 99 (98.0%) | 2 (2.0%) |
| Manufacturing | 119 (96.0%) | 5 (4.0%) |
| Wholesale Trade | 11 (40.7%) | 16 (59.3%) |
| Retail Trade | 66 (33.7%) | 130 (66.3%) |
| Transportation & Warehousing | 54 (88.5%) | 7 (11.5%) |
| Utilities | 0 (0.0%) | 0 (0.0%) |
| Information | 0 (0.0%) | 0 (0.0%) |
| Finance & Insurance | 0 (0.0%) | 0 (0.0%) |
| Real Estate, Rental & Leasing | 0 (0.0%) | 0 (0.0%) |
| Professional & Scientific | 0 (0.0%) | 0 (0.0%) |
| Enterprise Management | 0 (0.0%) | 0 (0.0%) |
| Administrative & Support | 0 (0.0%) | 47 (100.0%) |
| Educational Services | 16 (30.2%) | 37 (69.8%) |
| Health Care & Social Assistance | 11 (35.5%) | 20 (64.5%) |
| Arts, Entertainment & Recreation | 92 (100.0%) | 0 (0.0%) |
| Accommodation & Food Services | 0 (0.0%) | 56 (100.0%) |
| Public Administration | 6 (24.0%) | 19 (76.0%) |
| Total | 912 (69.2%) | 406 (30.8%) |
Education in Tipton
School Enrollment in Tipton
The most common levels of schooling among the 1,185 students in Tipton are high school (327 | 27.6%), middle school (300 | 25.3%), and college / undergraduate (254 | 21.4%).
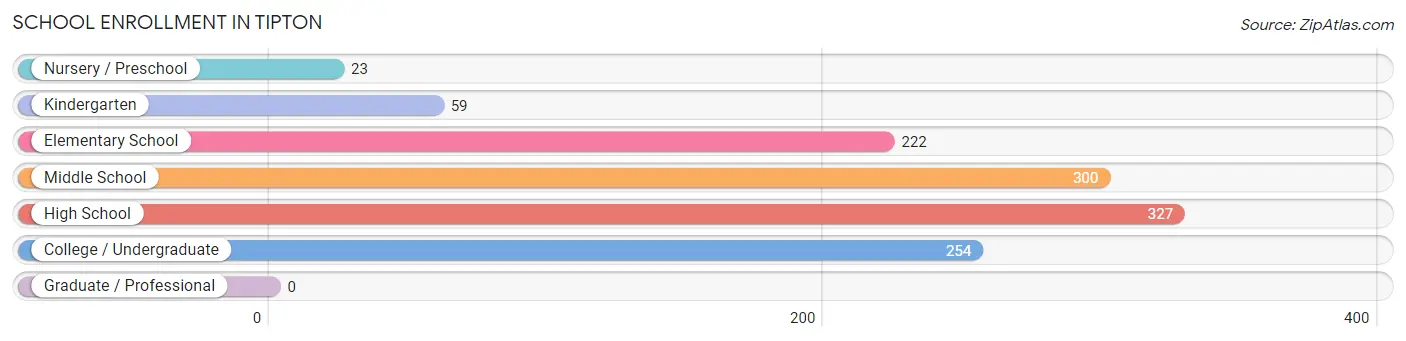
| School Level | # Students | % Students |
| Nursery / Preschool | 23 | 1.9% |
| Kindergarten | 59 | 5.0% |
| Elementary School | 222 | 18.7% |
| Middle School | 300 | 25.3% |
| High School | 327 | 27.6% |
| College / Undergraduate | 254 | 21.4% |
| Graduate / Professional | 0 | 0.0% |
| Total | 1,185 | 100.0% |
School Enrollment by Age by Funding Source in Tipton
Out of a total of 1,185 students who are enrolled in schools in Tipton, 38 (3.2%) attend a private institution, while the remaining 1,147 (96.8%) are enrolled in public schools. The age group of 5 to 9 year old has the highest likelihood of being enrolled in private schools, with 22 (9.1% in the age bracket) enrolled. Conversely, the age group of 3 to 4 year olds has the lowest likelihood of being enrolled in a private school, with 9 (100.0% in the age bracket) attending a public institution.
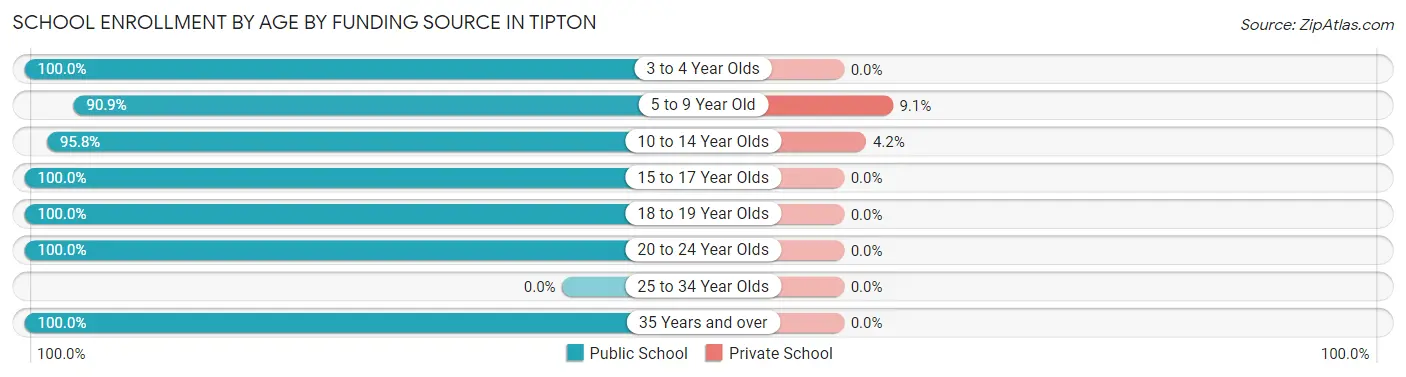
| Age Bracket | Public School | Private School |
| 3 to 4 Year Olds | 9 (100.0%) | 0 (0.0%) |
| 5 to 9 Year Old | 220 (90.9%) | 22 (9.1%) |
| 10 to 14 Year Olds | 369 (95.8%) | 16 (4.2%) |
| 15 to 17 Year Olds | 286 (100.0%) | 0 (0.0%) |
| 18 to 19 Year Olds | 76 (100.0%) | 0 (0.0%) |
| 20 to 24 Year Olds | 171 (100.0%) | 0 (0.0%) |
| 25 to 34 Year Olds | 0 (0.0%) | 0 (0.0%) |
| 35 Years and over | 16 (100.0%) | 0 (0.0%) |
| Total | 1,147 (96.8%) | 38 (3.2%) |
Educational Attainment by Field of Study in Tipton
Visual & performing arts (20 | 33.3%), psychology (17 | 28.3%), literature & languages (12 | 20.0%), and arts & humanities (11 | 18.3%) are the most common fields of study among 60 individuals in Tipton who have obtained a bachelor's degree or higher.
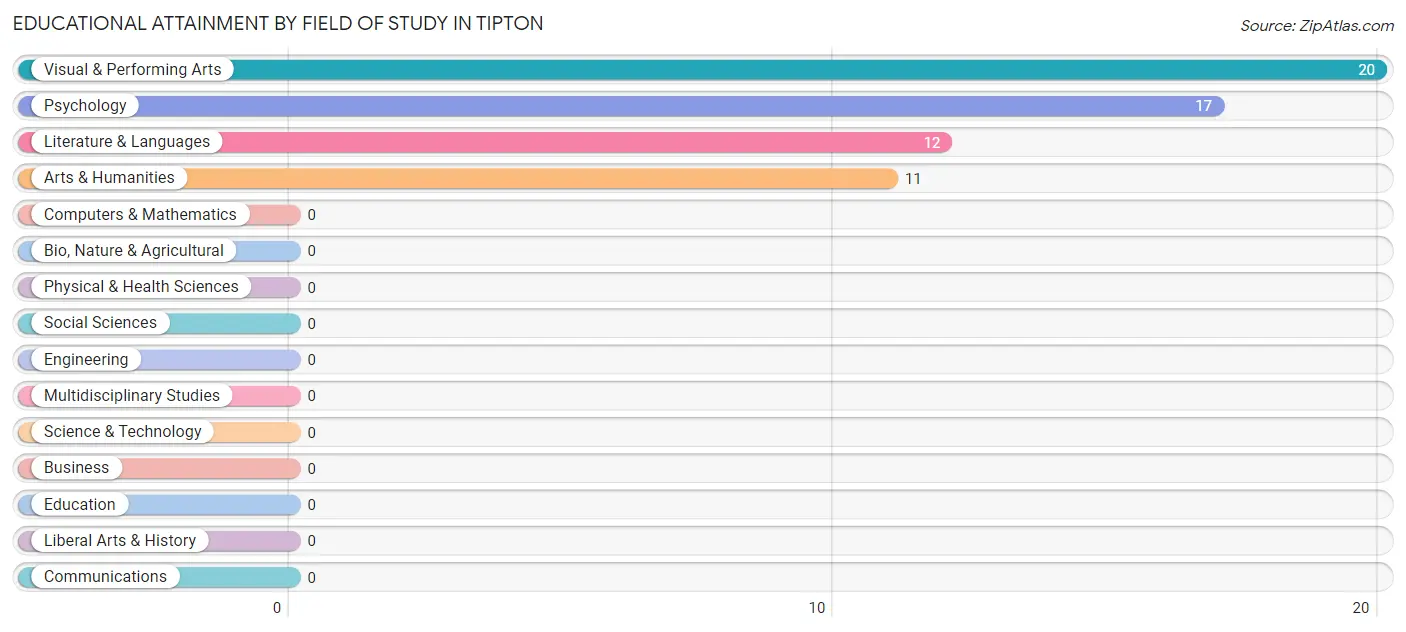
| Field of Study | # Graduates | % Graduates |
| Computers & Mathematics | 0 | 0.0% |
| Bio, Nature & Agricultural | 0 | 0.0% |
| Physical & Health Sciences | 0 | 0.0% |
| Psychology | 17 | 28.3% |
| Social Sciences | 0 | 0.0% |
| Engineering | 0 | 0.0% |
| Multidisciplinary Studies | 0 | 0.0% |
| Science & Technology | 0 | 0.0% |
| Business | 0 | 0.0% |
| Education | 0 | 0.0% |
| Literature & Languages | 12 | 20.0% |
| Liberal Arts & History | 0 | 0.0% |
| Visual & Performing Arts | 20 | 33.3% |
| Communications | 0 | 0.0% |
| Arts & Humanities | 11 | 18.3% |
| Total | 60 | 100.0% |
Transportation & Commute in Tipton
Vehicle Availability by Sex in Tipton
The most prevalent vehicle ownership categories in Tipton are males with 5 or more vehicles (280, accounting for 32.0%) and females with 5 or more vehicles (7, making up 69.0%).
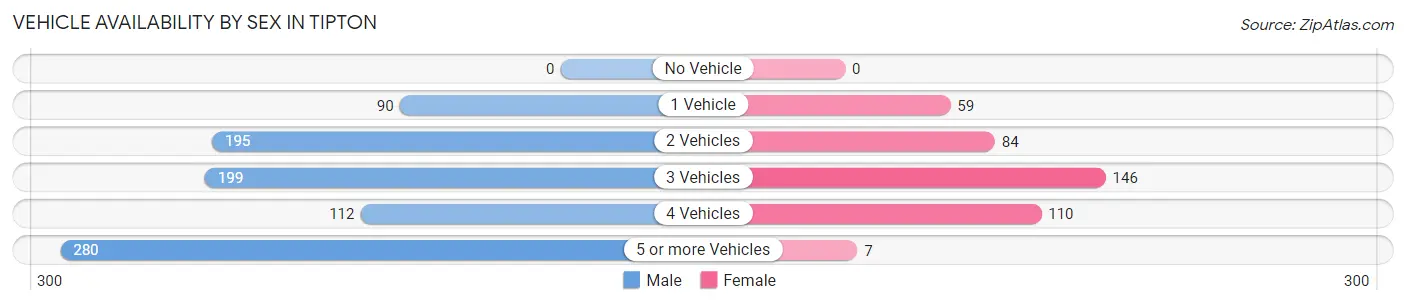
| Vehicles Available | Male | Female |
| No Vehicle | 0 (0.0%) | 0 (0.0%) |
| 1 Vehicle | 90 (10.3%) | 59 (14.5%) |
| 2 Vehicles | 195 (22.3%) | 84 (20.7%) |
| 3 Vehicles | 199 (22.7%) | 146 (36.0%) |
| 4 Vehicles | 112 (12.8%) | 110 (27.1%) |
| 5 or more Vehicles | 280 (32.0%) | 7 (1.7%) |
| Total | 876 (100.0%) | 406 (100.0%) |
Commute Time in Tipton
The most frequently occuring commute durations in Tipton are 20 to 24 minutes (249 commuters, 19.4%), 10 to 14 minutes (247 commuters, 19.3%), and 5 to 9 minutes (216 commuters, 16.9%).
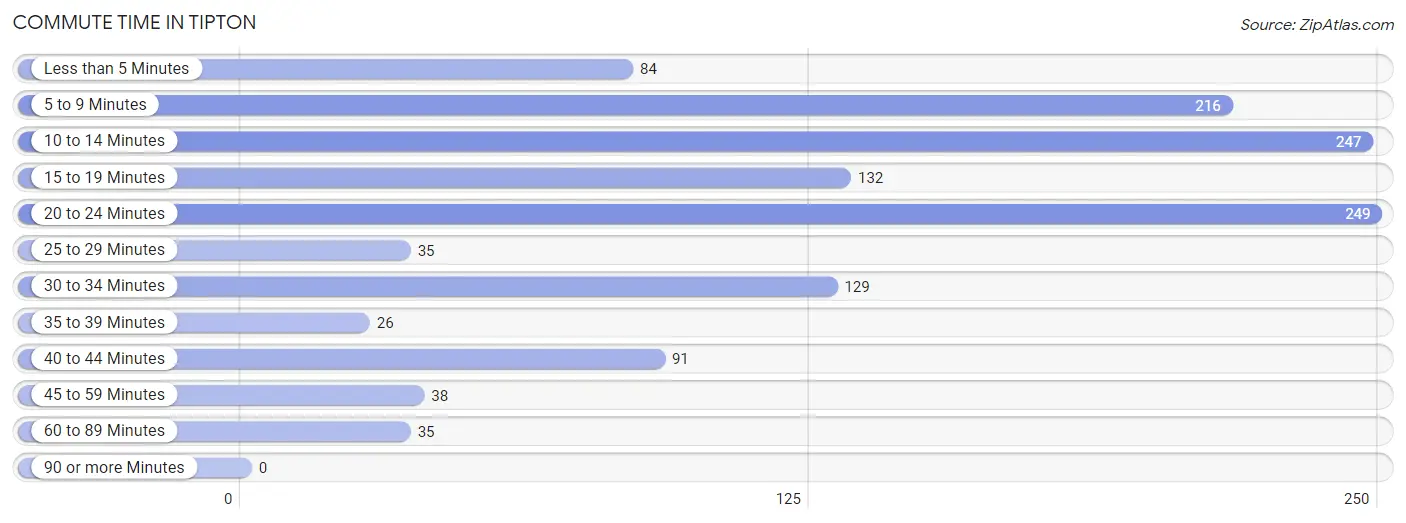
| Commute Time | # Commuters | % Commuters |
| Less than 5 Minutes | 84 | 6.6% |
| 5 to 9 Minutes | 216 | 16.9% |
| 10 to 14 Minutes | 247 | 19.3% |
| 15 to 19 Minutes | 132 | 10.3% |
| 20 to 24 Minutes | 249 | 19.4% |
| 25 to 29 Minutes | 35 | 2.7% |
| 30 to 34 Minutes | 129 | 10.1% |
| 35 to 39 Minutes | 26 | 2.0% |
| 40 to 44 Minutes | 91 | 7.1% |
| 45 to 59 Minutes | 38 | 3.0% |
| 60 to 89 Minutes | 35 | 2.7% |
| 90 or more Minutes | 0 | 0.0% |
Commute Time by Sex in Tipton
The most common commute times in Tipton are 10 to 14 minutes (241 commuters, 27.5%) for males and 20 to 24 minutes (118 commuters, 29.1%) for females.
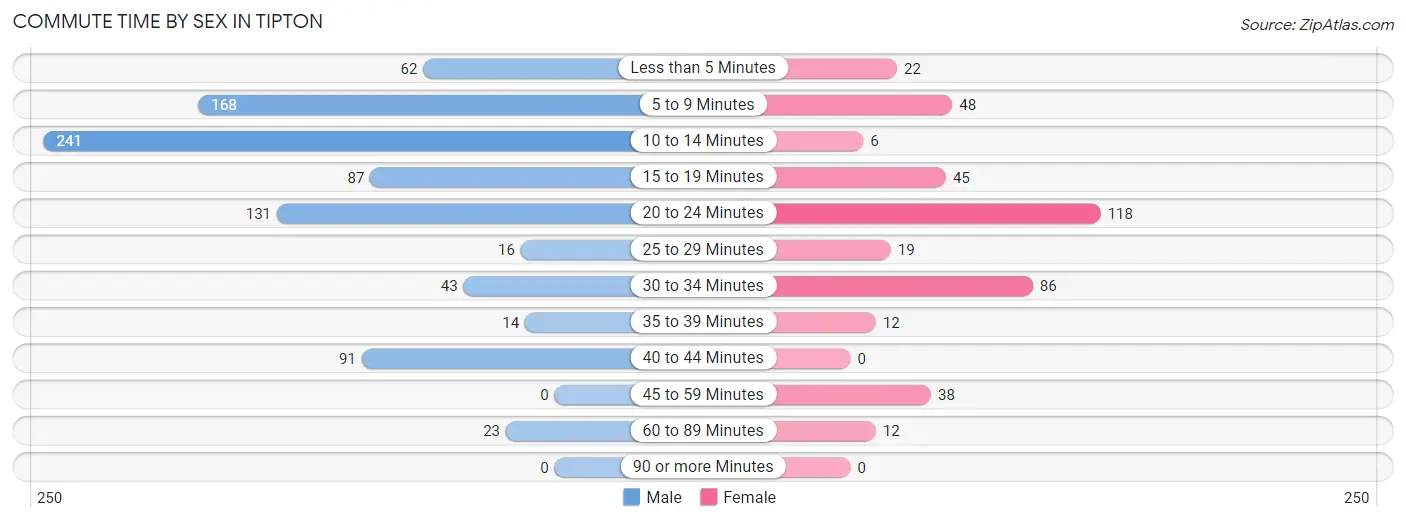
| Commute Time | Male | Female |
| Less than 5 Minutes | 62 (7.1%) | 22 (5.4%) |
| 5 to 9 Minutes | 168 (19.2%) | 48 (11.8%) |
| 10 to 14 Minutes | 241 (27.5%) | 6 (1.5%) |
| 15 to 19 Minutes | 87 (9.9%) | 45 (11.1%) |
| 20 to 24 Minutes | 131 (14.9%) | 118 (29.1%) |
| 25 to 29 Minutes | 16 (1.8%) | 19 (4.7%) |
| 30 to 34 Minutes | 43 (4.9%) | 86 (21.2%) |
| 35 to 39 Minutes | 14 (1.6%) | 12 (3.0%) |
| 40 to 44 Minutes | 91 (10.4%) | 0 (0.0%) |
| 45 to 59 Minutes | 0 (0.0%) | 38 (9.4%) |
| 60 to 89 Minutes | 23 (2.6%) | 12 (3.0%) |
| 90 or more Minutes | 0 (0.0%) | 0 (0.0%) |
Time of Departure to Work by Sex in Tipton
The most frequent times of departure to work in Tipton are 5:30 AM to 5:59 AM (263, 30.0%) for males and 7:00 AM to 7:29 AM (86, 21.2%) for females.
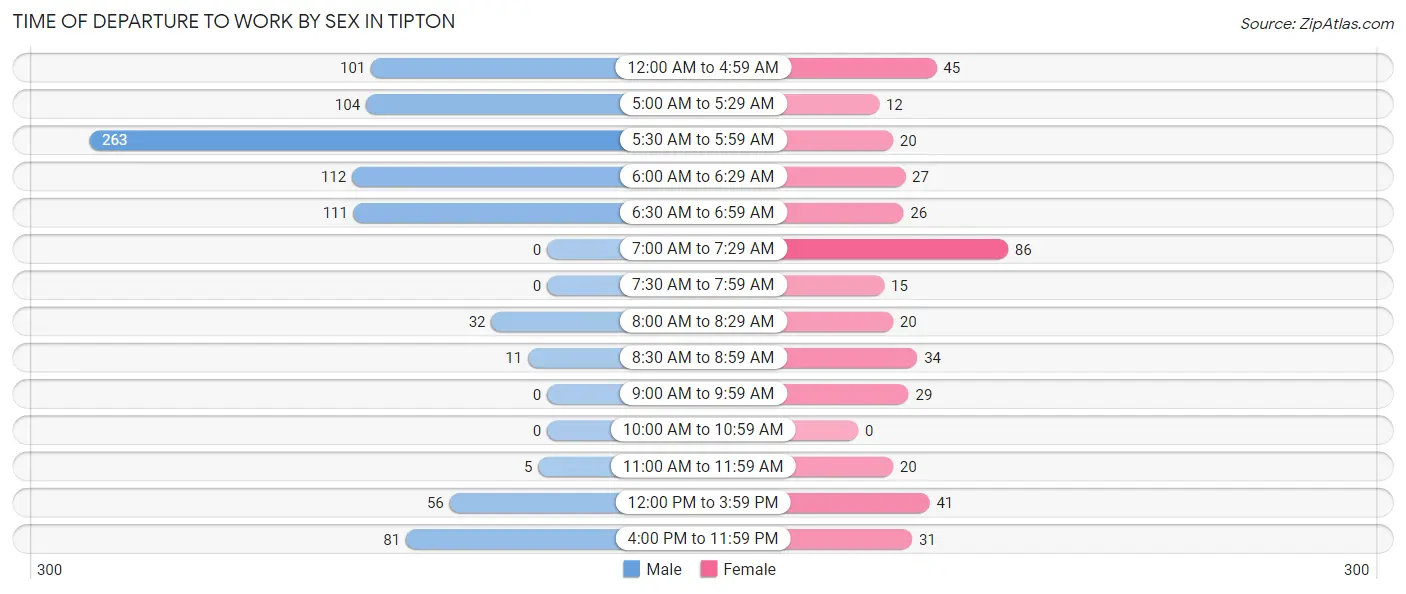
| Time of Departure | Male | Female |
| 12:00 AM to 4:59 AM | 101 (11.5%) | 45 (11.1%) |
| 5:00 AM to 5:29 AM | 104 (11.9%) | 12 (3.0%) |
| 5:30 AM to 5:59 AM | 263 (30.0%) | 20 (4.9%) |
| 6:00 AM to 6:29 AM | 112 (12.8%) | 27 (6.7%) |
| 6:30 AM to 6:59 AM | 111 (12.7%) | 26 (6.4%) |
| 7:00 AM to 7:29 AM | 0 (0.0%) | 86 (21.2%) |
| 7:30 AM to 7:59 AM | 0 (0.0%) | 15 (3.7%) |
| 8:00 AM to 8:29 AM | 32 (3.6%) | 20 (4.9%) |
| 8:30 AM to 8:59 AM | 11 (1.3%) | 34 (8.4%) |
| 9:00 AM to 9:59 AM | 0 (0.0%) | 29 (7.1%) |
| 10:00 AM to 10:59 AM | 0 (0.0%) | 0 (0.0%) |
| 11:00 AM to 11:59 AM | 5 (0.6%) | 20 (4.9%) |
| 12:00 PM to 3:59 PM | 56 (6.4%) | 41 (10.1%) |
| 4:00 PM to 11:59 PM | 81 (9.2%) | 31 (7.6%) |
| Total | 876 (100.0%) | 406 (100.0%) |
Housing Occupancy in Tipton
Occupancy by Ownership in Tipton
Of the total 761 dwellings in Tipton, owner-occupied units account for 280 (36.8%), while renter-occupied units make up 481 (63.2%).
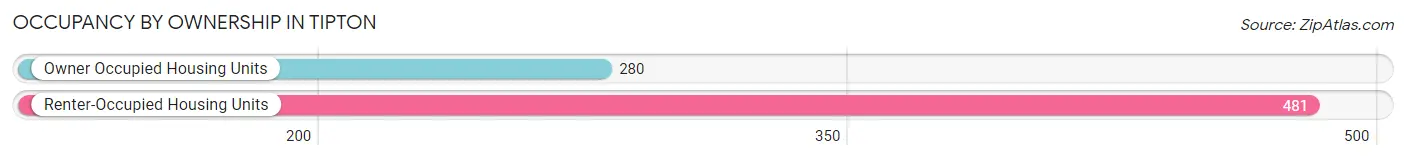
| Occupancy | # Housing Units | % Housing Units |
| Owner Occupied Housing Units | 280 | 36.8% |
| Renter-Occupied Housing Units | 481 | 63.2% |
| Total Occupied Housing Units | 761 | 100.0% |
Occupancy by Household Size in Tipton
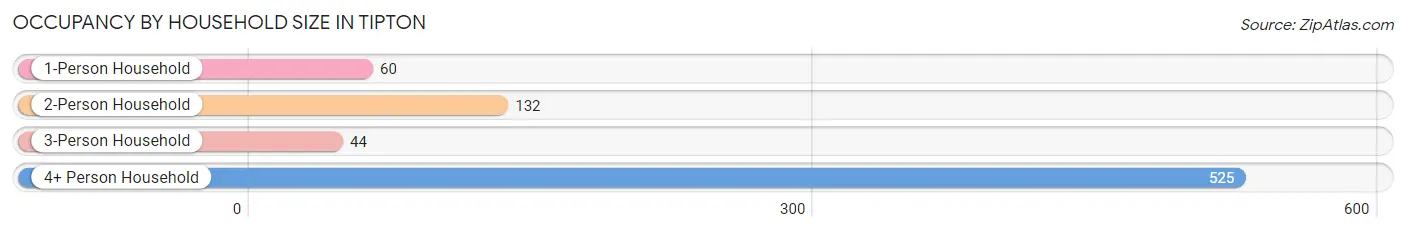
| Household Size | # Housing Units | % Housing Units |
| 1-Person Household | 60 | 7.9% |
| 2-Person Household | 132 | 17.3% |
| 3-Person Household | 44 | 5.8% |
| 4+ Person Household | 525 | 69.0% |
| Total Housing Units | 761 | 100.0% |
Occupancy by Ownership by Household Size in Tipton
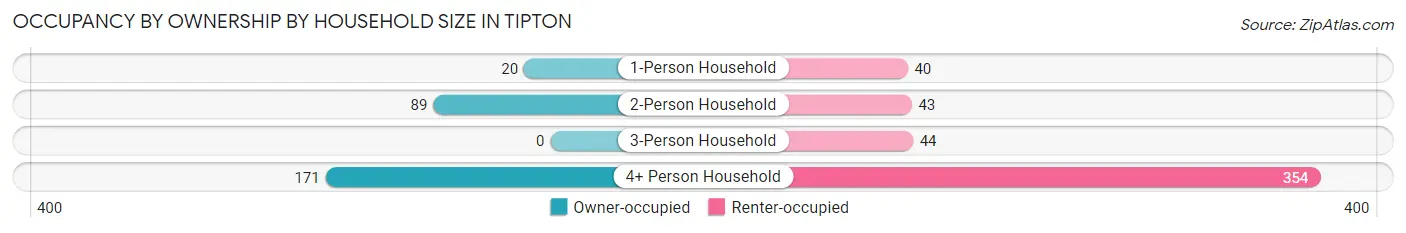
| Household Size | Owner-occupied | Renter-occupied |
| 1-Person Household | 20 (33.3%) | 40 (66.7%) |
| 2-Person Household | 89 (67.4%) | 43 (32.6%) |
| 3-Person Household | 0 (0.0%) | 44 (100.0%) |
| 4+ Person Household | 171 (32.6%) | 354 (67.4%) |
| Total Housing Units | 280 (36.8%) | 481 (63.2%) |
Occupancy by Educational Attainment in Tipton
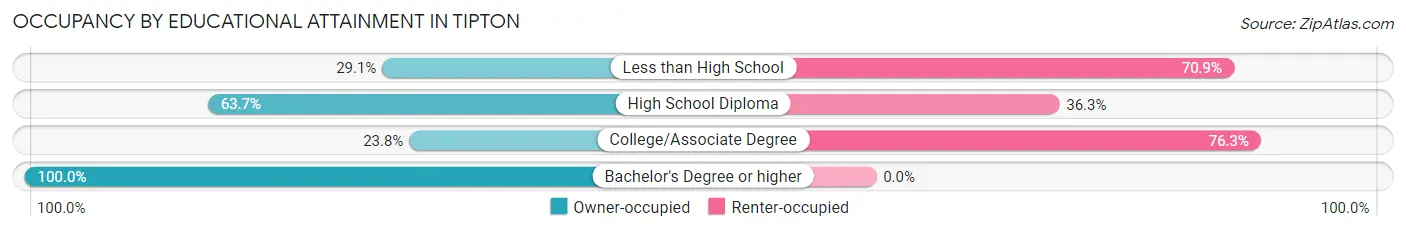
| Household Size | Owner-occupied | Renter-occupied |
| Less than High School | 149 (29.1%) | 363 (70.9%) |
| High School Diploma | 100 (63.7%) | 57 (36.3%) |
| College/Associate Degree | 19 (23.7%) | 61 (76.2%) |
| Bachelor's Degree or higher | 12 (100.0%) | 0 (0.0%) |
Occupancy by Age of Householder in Tipton
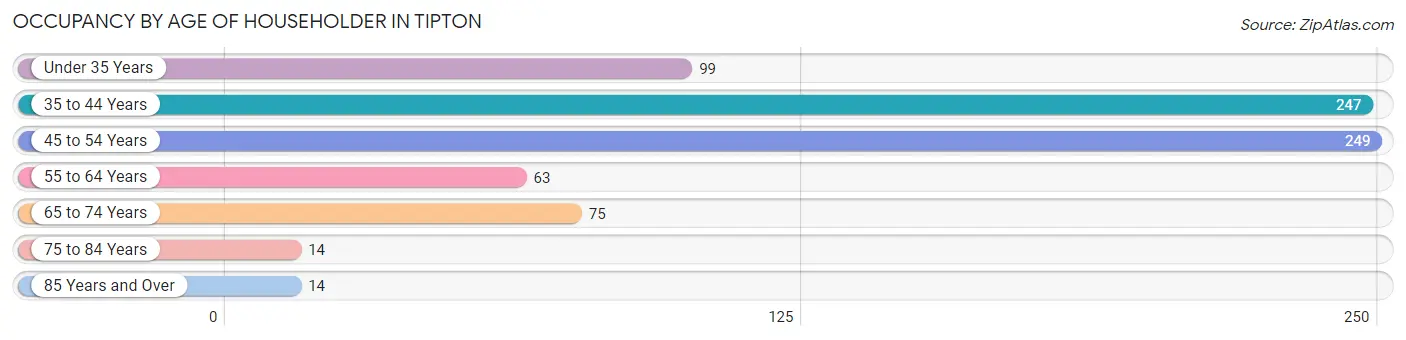
| Age Bracket | # Households | % Households |
| Under 35 Years | 99 | 13.0% |
| 35 to 44 Years | 247 | 32.5% |
| 45 to 54 Years | 249 | 32.7% |
| 55 to 64 Years | 63 | 8.3% |
| 65 to 74 Years | 75 | 9.9% |
| 75 to 84 Years | 14 | 1.8% |
| 85 Years and Over | 14 | 1.8% |
| Total | 761 | 100.0% |
Housing Finances in Tipton
Median Income by Occupancy in Tipton
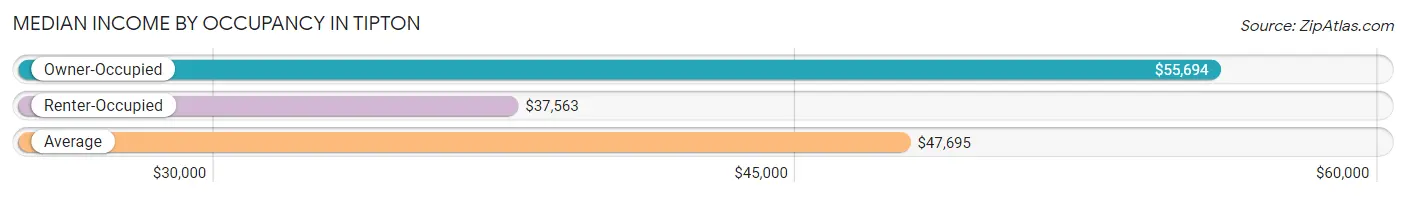
| Occupancy Type | # Households | Median Income |
| Owner-Occupied | 280 (36.8%) | $55,694 |
| Renter-Occupied | 481 (63.2%) | $37,563 |
| Average | 761 (100.0%) | $47,695 |
Occupancy by Householder Income Bracket in Tipton
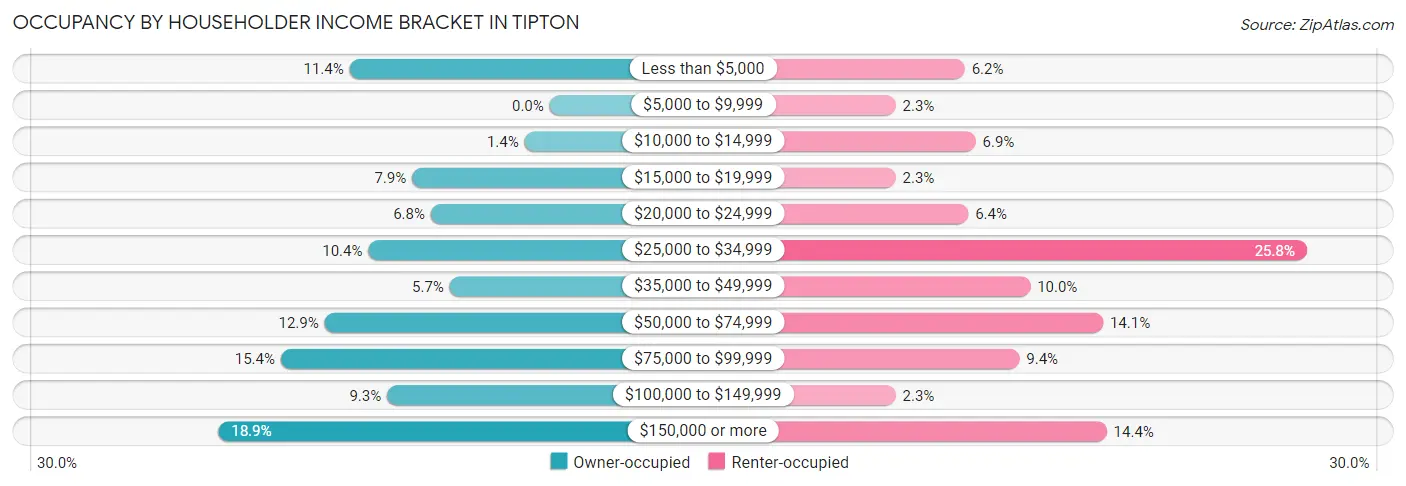
| Income Bracket | Owner-occupied | Renter-occupied |
| Less than $5,000 | 32 (11.4%) | 30 (6.2%) |
| $5,000 to $9,999 | 0 (0.0%) | 11 (2.3%) |
| $10,000 to $14,999 | 4 (1.4%) | 33 (6.9%) |
| $15,000 to $19,999 | 22 (7.9%) | 11 (2.3%) |
| $20,000 to $24,999 | 19 (6.8%) | 31 (6.4%) |
| $25,000 to $34,999 | 29 (10.4%) | 124 (25.8%) |
| $35,000 to $49,999 | 16 (5.7%) | 48 (10.0%) |
| $50,000 to $74,999 | 36 (12.9%) | 68 (14.1%) |
| $75,000 to $99,999 | 43 (15.4%) | 45 (9.4%) |
| $100,000 to $149,999 | 26 (9.3%) | 11 (2.3%) |
| $150,000 or more | 53 (18.9%) | 69 (14.3%) |
| Total | 280 (100.0%) | 481 (100.0%) |
Monthly Housing Cost Tiers in Tipton
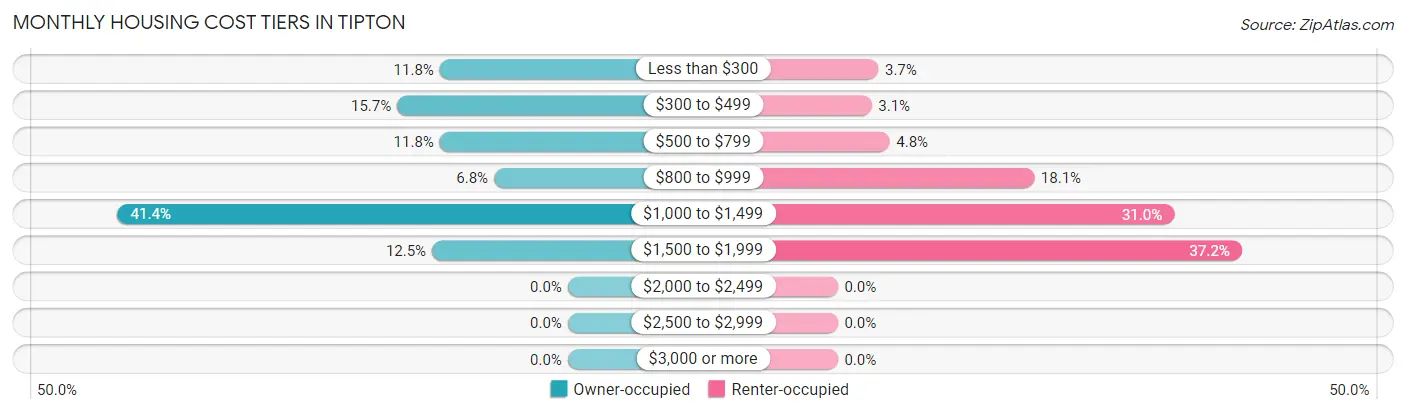
| Monthly Cost | Owner-occupied | Renter-occupied |
| Less than $300 | 33 (11.8%) | 18 (3.7%) |
| $300 to $499 | 44 (15.7%) | 15 (3.1%) |
| $500 to $799 | 33 (11.8%) | 23 (4.8%) |
| $800 to $999 | 19 (6.8%) | 87 (18.1%) |
| $1,000 to $1,499 | 116 (41.4%) | 149 (31.0%) |
| $1,500 to $1,999 | 35 (12.5%) | 179 (37.2%) |
| $2,000 to $2,499 | 0 (0.0%) | 0 (0.0%) |
| $2,500 to $2,999 | 0 (0.0%) | 0 (0.0%) |
| $3,000 or more | 0 (0.0%) | 0 (0.0%) |
| Total | 280 (100.0%) | 481 (100.0%) |
Physical Housing Characteristics in Tipton
Housing Structures in Tipton
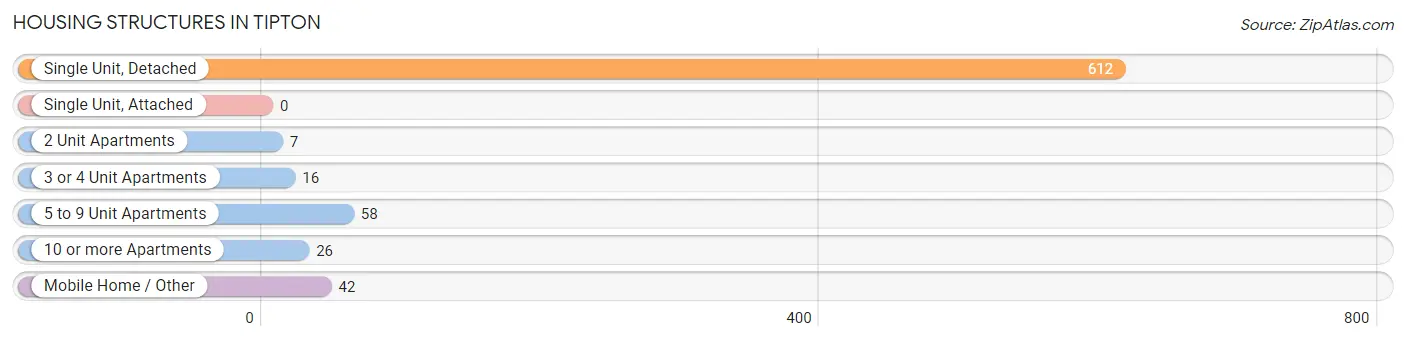
| Structure Type | # Housing Units | % Housing Units |
| Single Unit, Detached | 612 | 80.4% |
| Single Unit, Attached | 0 | 0.0% |
| 2 Unit Apartments | 7 | 0.9% |
| 3 or 4 Unit Apartments | 16 | 2.1% |
| 5 to 9 Unit Apartments | 58 | 7.6% |
| 10 or more Apartments | 26 | 3.4% |
| Mobile Home / Other | 42 | 5.5% |
| Total | 761 | 100.0% |
Housing Structures by Occupancy in Tipton
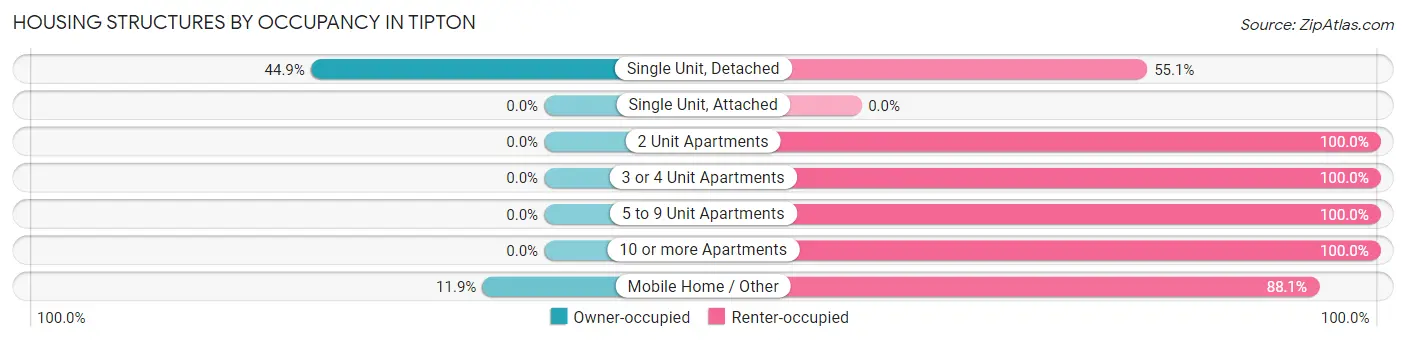
| Structure Type | Owner-occupied | Renter-occupied |
| Single Unit, Detached | 275 (44.9%) | 337 (55.1%) |
| Single Unit, Attached | 0 (0.0%) | 0 (0.0%) |
| 2 Unit Apartments | 0 (0.0%) | 7 (100.0%) |
| 3 or 4 Unit Apartments | 0 (0.0%) | 16 (100.0%) |
| 5 to 9 Unit Apartments | 0 (0.0%) | 58 (100.0%) |
| 10 or more Apartments | 0 (0.0%) | 26 (100.0%) |
| Mobile Home / Other | 5 (11.9%) | 37 (88.1%) |
| Total | 280 (36.8%) | 481 (63.2%) |
Housing Structures by Number of Rooms in Tipton
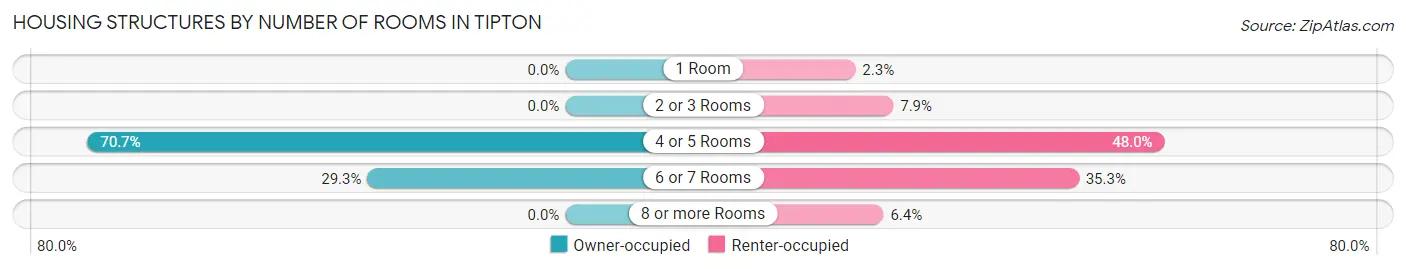
| Number of Rooms | Owner-occupied | Renter-occupied |
| 1 Room | 0 (0.0%) | 11 (2.3%) |
| 2 or 3 Rooms | 0 (0.0%) | 38 (7.9%) |
| 4 or 5 Rooms | 198 (70.7%) | 231 (48.0%) |
| 6 or 7 Rooms | 82 (29.3%) | 170 (35.3%) |
| 8 or more Rooms | 0 (0.0%) | 31 (6.4%) |
| Total | 280 (100.0%) | 481 (100.0%) |
Housing Structure by Heating Type in Tipton
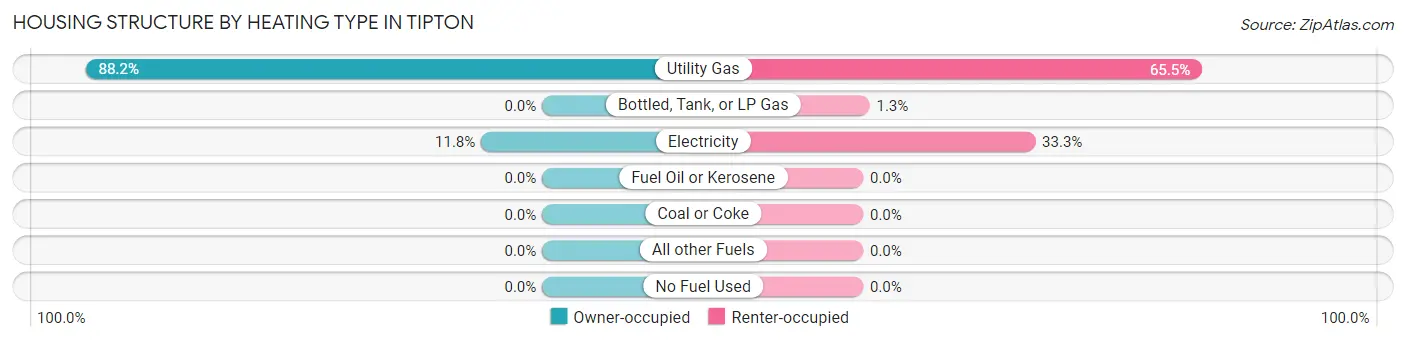
| Heating Type | Owner-occupied | Renter-occupied |
| Utility Gas | 247 (88.2%) | 315 (65.5%) |
| Bottled, Tank, or LP Gas | 0 (0.0%) | 6 (1.3%) |
| Electricity | 33 (11.8%) | 160 (33.3%) |
| Fuel Oil or Kerosene | 0 (0.0%) | 0 (0.0%) |
| Coal or Coke | 0 (0.0%) | 0 (0.0%) |
| All other Fuels | 0 (0.0%) | 0 (0.0%) |
| No Fuel Used | 0 (0.0%) | 0 (0.0%) |
| Total | 280 (100.0%) | 481 (100.0%) |
Household Vehicle Usage in Tipton
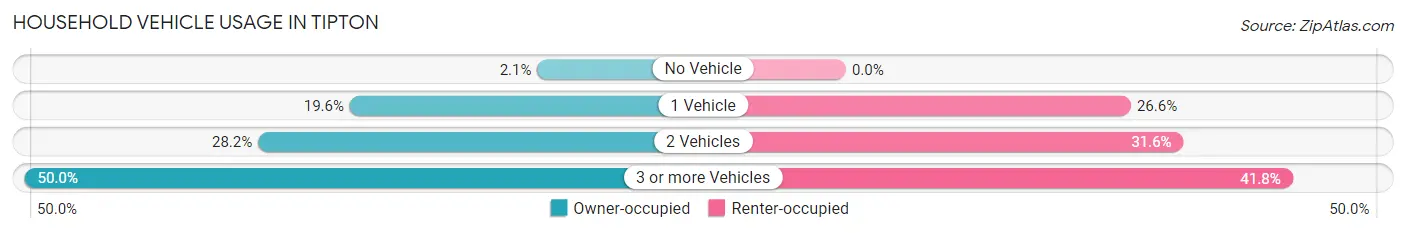
| Vehicles per Household | Owner-occupied | Renter-occupied |
| No Vehicle | 6 (2.1%) | 0 (0.0%) |
| 1 Vehicle | 55 (19.6%) | 128 (26.6%) |
| 2 Vehicles | 79 (28.2%) | 152 (31.6%) |
| 3 or more Vehicles | 140 (50.0%) | 201 (41.8%) |
| Total | 280 (100.0%) | 481 (100.0%) |
Real Estate & Mortgages in Tipton
Real Estate and Mortgage Overview in Tipton
| Characteristic | Without Mortgage | With Mortgage |
| Housing Units | 98 | 182 |
| Median Property Value | $209,300 | $219,600 |
| Median Household Income | $33,000 | $53 |
| Monthly Housing Costs | $400 | $0 |
| Real Estate Taxes | $1,137 | $0 |
Property Value by Mortgage Status in Tipton
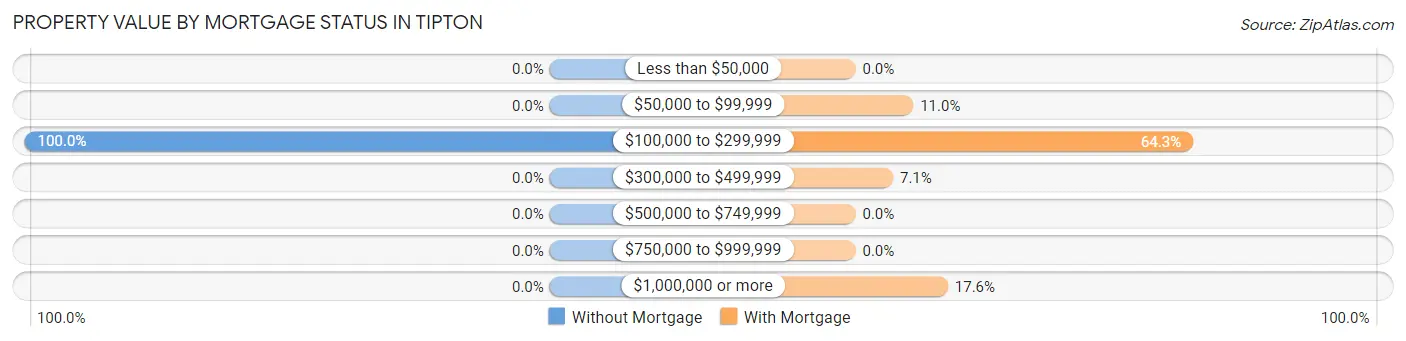
| Property Value | Without Mortgage | With Mortgage |
| Less than $50,000 | 0 (0.0%) | 0 (0.0%) |
| $50,000 to $99,999 | 0 (0.0%) | 20 (11.0%) |
| $100,000 to $299,999 | 98 (100.0%) | 117 (64.3%) |
| $300,000 to $499,999 | 0 (0.0%) | 13 (7.1%) |
| $500,000 to $749,999 | 0 (0.0%) | 0 (0.0%) |
| $750,000 to $999,999 | 0 (0.0%) | 0 (0.0%) |
| $1,000,000 or more | 0 (0.0%) | 32 (17.6%) |
| Total | 98 (100.0%) | 182 (100.0%) |
Household Income by Mortgage Status in Tipton
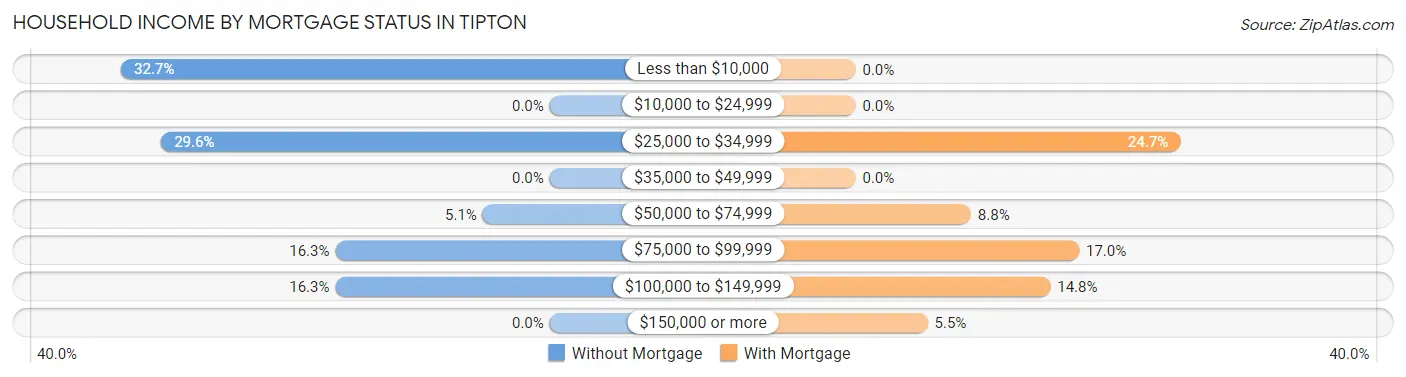
| Household Income | Without Mortgage | With Mortgage |
| Less than $10,000 | 32 (32.7%) | 0 (0.0%) |
| $10,000 to $24,999 | 0 (0.0%) | 0 (0.0%) |
| $25,000 to $34,999 | 29 (29.6%) | 45 (24.7%) |
| $35,000 to $49,999 | 0 (0.0%) | 0 (0.0%) |
| $50,000 to $74,999 | 5 (5.1%) | 16 (8.8%) |
| $75,000 to $99,999 | 16 (16.3%) | 31 (17.0%) |
| $100,000 to $149,999 | 16 (16.3%) | 27 (14.8%) |
| $150,000 or more | 0 (0.0%) | 10 (5.5%) |
| Total | 98 (100.0%) | 182 (100.0%) |
Property Value to Household Income Ratio in Tipton
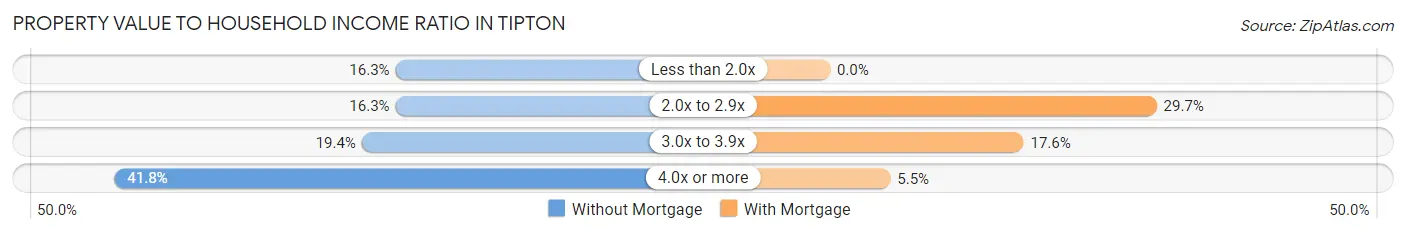
| Value-to-Income Ratio | Without Mortgage | With Mortgage |
| Less than 2.0x | 16 (16.3%) | 0 (0.0%) |
| 2.0x to 2.9x | 16 (16.3%) | 54 (29.7%) |
| 3.0x to 3.9x | 19 (19.4%) | 32 (17.6%) |
| 4.0x or more | 41 (41.8%) | 10 (5.5%) |
| Total | 98 (100.0%) | 182 (100.0%) |
Real Estate Taxes by Mortgage Status in Tipton
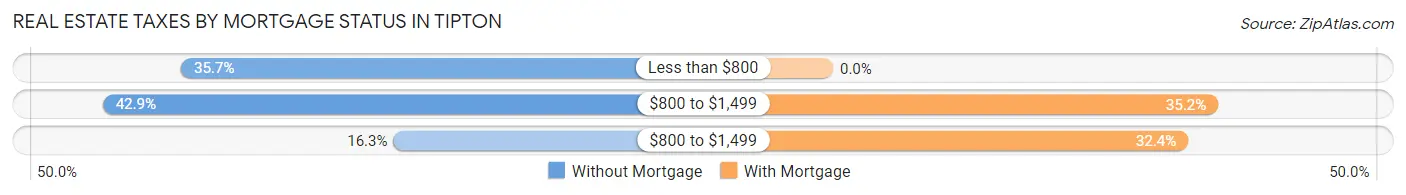
| Property Taxes | Without Mortgage | With Mortgage |
| Less than $800 | 35 (35.7%) | 0 (0.0%) |
| $800 to $1,499 | 42 (42.9%) | 64 (35.2%) |
| $800 to $1,499 | 16 (16.3%) | 59 (32.4%) |
| Total | 98 (100.0%) | 182 (100.0%) |
Health & Disability in Tipton
Health Insurance Coverage by Age in Tipton
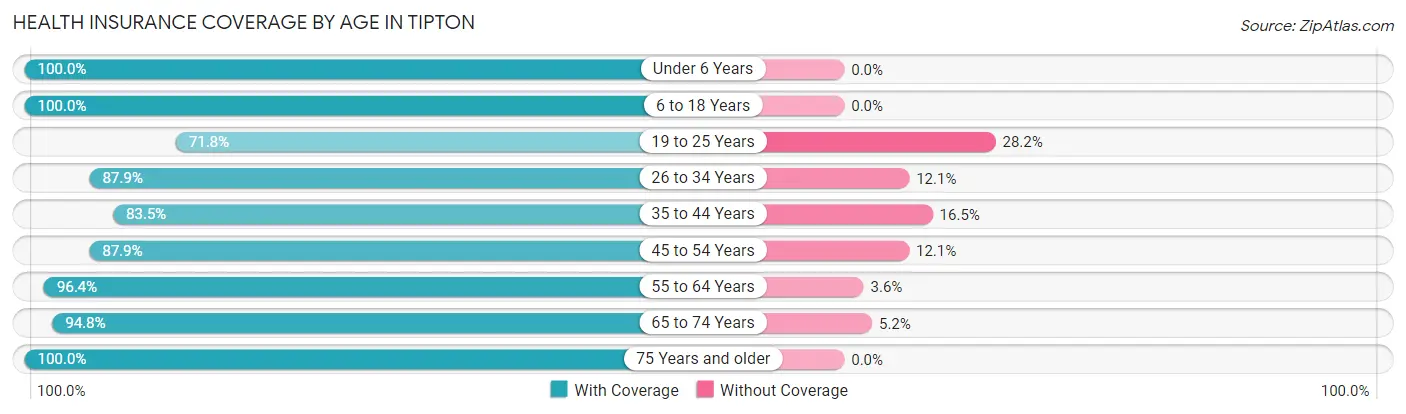
| Age Bracket | With Coverage | Without Coverage |
| Under 6 Years | 201 (100.0%) | 0 (0.0%) |
| 6 to 18 Years | 920 (100.0%) | 0 (0.0%) |
| 19 to 25 Years | 280 (71.8%) | 110 (28.2%) |
| 26 to 34 Years | 254 (87.9%) | 35 (12.1%) |
| 35 to 44 Years | 451 (83.5%) | 89 (16.5%) |
| 45 to 54 Years | 481 (87.9%) | 66 (12.1%) |
| 55 to 64 Years | 134 (96.4%) | 5 (3.6%) |
| 65 to 74 Years | 110 (94.8%) | 6 (5.2%) |
| 75 Years and older | 28 (100.0%) | 0 (0.0%) |
| Total | 2,859 (90.2%) | 311 (9.8%) |
Health Insurance Coverage by Citizenship Status in Tipton
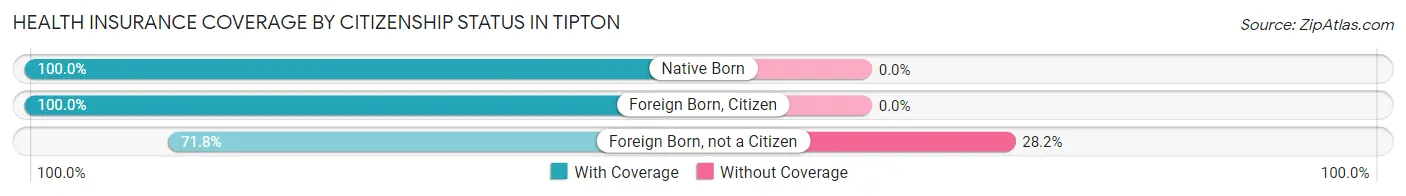
| Citizenship Status | With Coverage | Without Coverage |
| Native Born | 201 (100.0%) | 0 (0.0%) |
| Foreign Born, Citizen | 920 (100.0%) | 0 (0.0%) |
| Foreign Born, not a Citizen | 280 (71.8%) | 110 (28.2%) |
Health Insurance Coverage by Household Income in Tipton
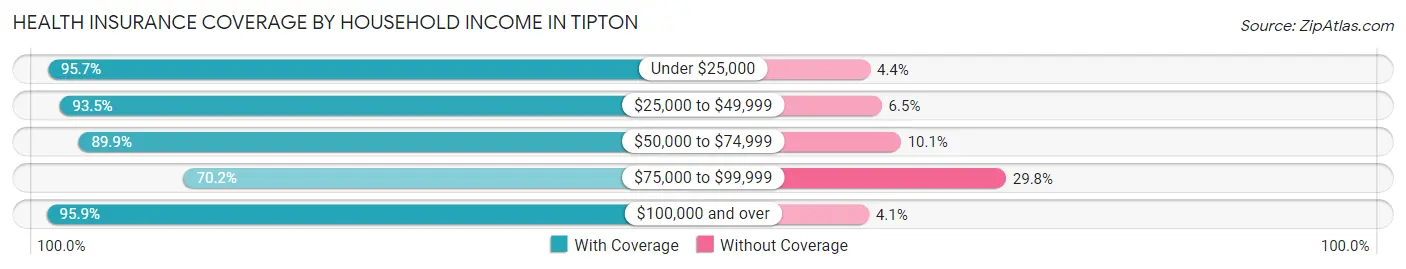
| Household Income | With Coverage | Without Coverage |
| Under $25,000 | 484 (95.7%) | 22 (4.3%) |
| $25,000 to $49,999 | 873 (93.5%) | 61 (6.5%) |
| $50,000 to $74,999 | 463 (89.9%) | 52 (10.1%) |
| $75,000 to $99,999 | 344 (70.2%) | 146 (29.8%) |
| $100,000 and over | 695 (95.9%) | 30 (4.1%) |
Public vs Private Health Insurance Coverage by Age in Tipton
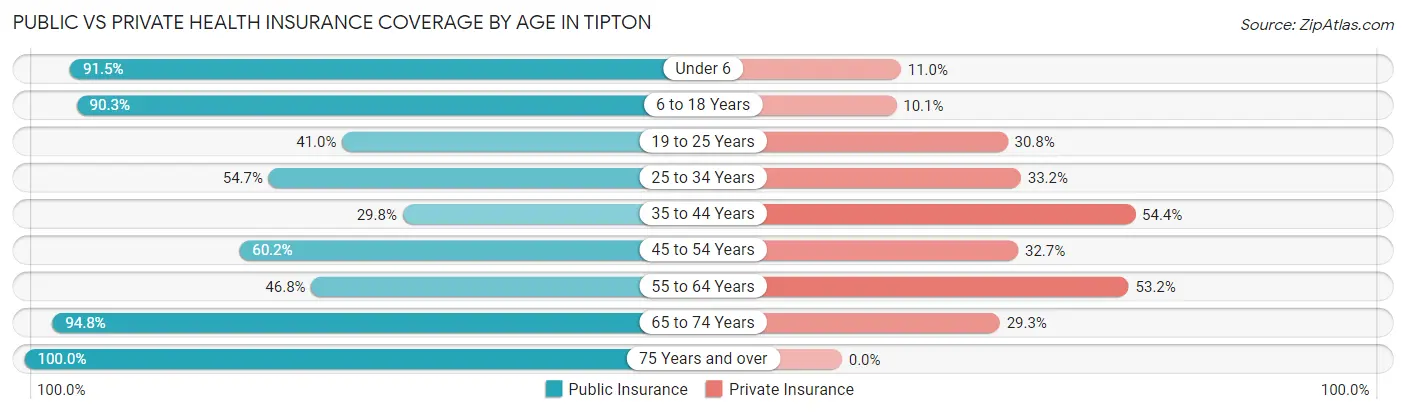
| Age Bracket | Public Insurance | Private Insurance |
| Under 6 | 184 (91.5%) | 22 (11.0%) |
| 6 to 18 Years | 831 (90.3%) | 93 (10.1%) |
| 19 to 25 Years | 160 (41.0%) | 120 (30.8%) |
| 25 to 34 Years | 158 (54.7%) | 96 (33.2%) |
| 35 to 44 Years | 161 (29.8%) | 294 (54.4%) |
| 45 to 54 Years | 329 (60.2%) | 179 (32.7%) |
| 55 to 64 Years | 65 (46.8%) | 74 (53.2%) |
| 65 to 74 Years | 110 (94.8%) | 34 (29.3%) |
| 75 Years and over | 28 (100.0%) | 0 (0.0%) |
| Total | 2,026 (63.9%) | 912 (28.8%) |
Disability Status by Sex by Age in Tipton
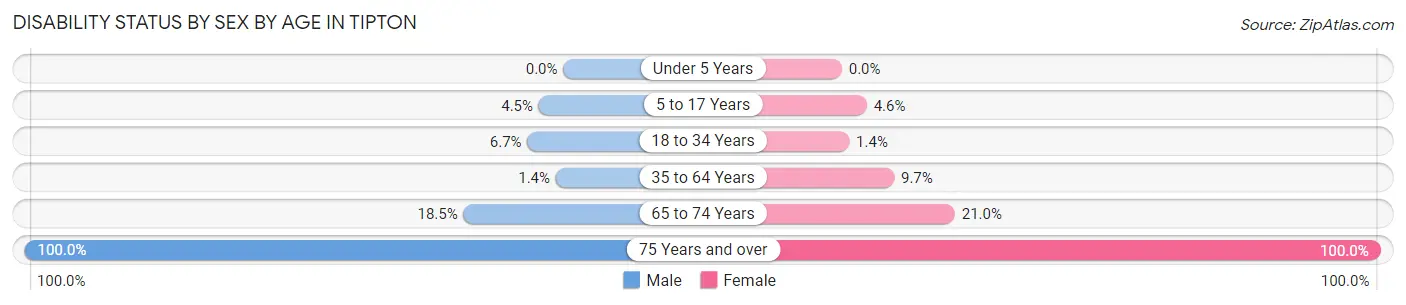
| Age Bracket | Male | Female |
| Under 5 Years | 0 (0.0%) | 0 (0.0%) |
| 5 to 17 Years | 27 (4.5%) | 15 (4.6%) |
| 18 to 34 Years | 29 (6.7%) | 4 (1.4%) |
| 35 to 64 Years | 10 (1.4%) | 49 (9.7%) |
| 65 to 74 Years | 10 (18.5%) | 13 (21.0%) |
| 75 Years and over | 14 (100.0%) | 14 (100.0%) |
Disability Class by Sex by Age in Tipton
Disability Class: Hearing Difficulty
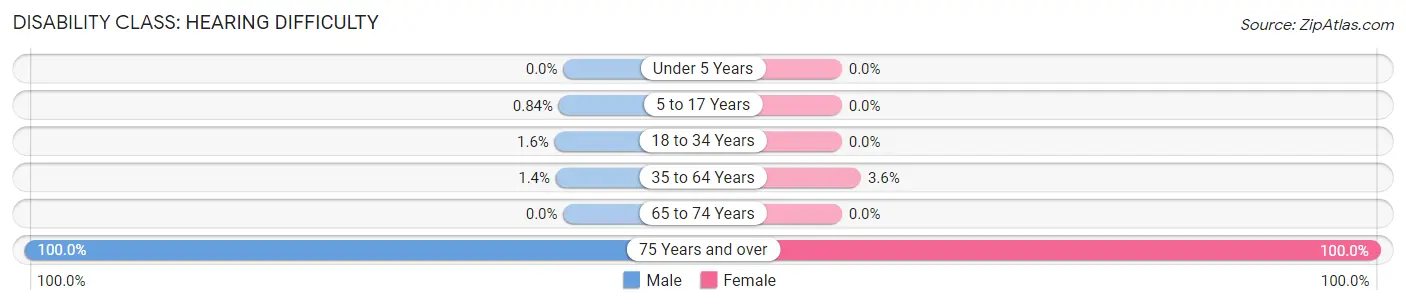
| Age Bracket | Male | Female |
| Under 5 Years | 0 (0.0%) | 0 (0.0%) |
| 5 to 17 Years | 5 (0.8%) | 0 (0.0%) |
| 18 to 34 Years | 7 (1.6%) | 0 (0.0%) |
| 35 to 64 Years | 10 (1.4%) | 18 (3.6%) |
| 65 to 74 Years | 0 (0.0%) | 0 (0.0%) |
| 75 Years and over | 14 (100.0%) | 14 (100.0%) |
Disability Class: Vision Difficulty
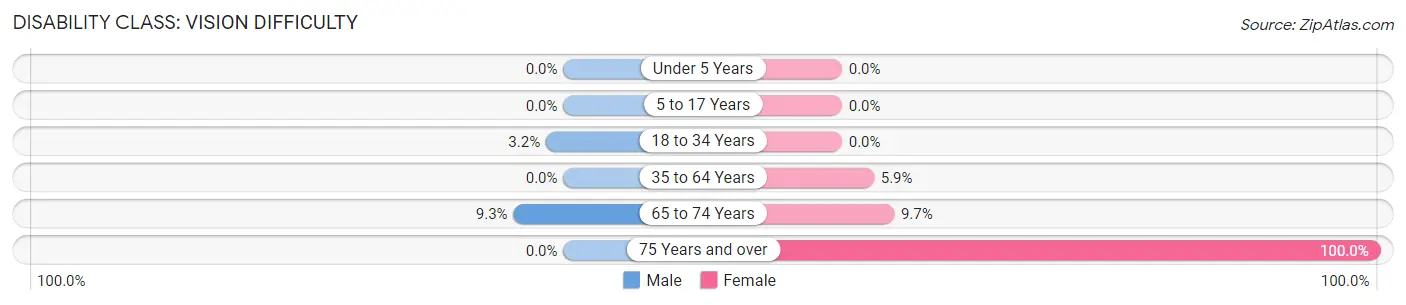
| Age Bracket | Male | Female |
| Under 5 Years | 0 (0.0%) | 0 (0.0%) |
| 5 to 17 Years | 0 (0.0%) | 0 (0.0%) |
| 18 to 34 Years | 14 (3.2%) | 0 (0.0%) |
| 35 to 64 Years | 0 (0.0%) | 30 (5.9%) |
| 65 to 74 Years | 5 (9.3%) | 6 (9.7%) |
| 75 Years and over | 0 (0.0%) | 14 (100.0%) |
Disability Class: Cognitive Difficulty
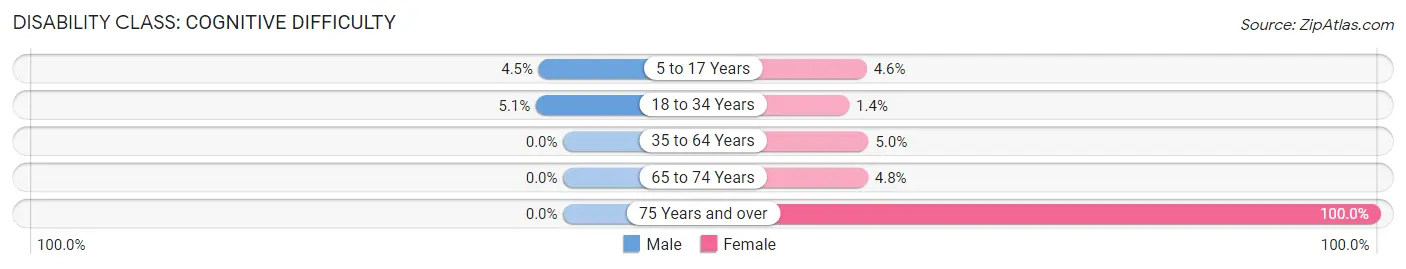
| Age Bracket | Male | Female |
| 5 to 17 Years | 27 (4.5%) | 15 (4.6%) |
| 18 to 34 Years | 22 (5.1%) | 4 (1.4%) |
| 35 to 64 Years | 0 (0.0%) | 25 (5.0%) |
| 65 to 74 Years | 0 (0.0%) | 3 (4.8%) |
| 75 Years and over | 0 (0.0%) | 14 (100.0%) |
Disability Class: Ambulatory Difficulty
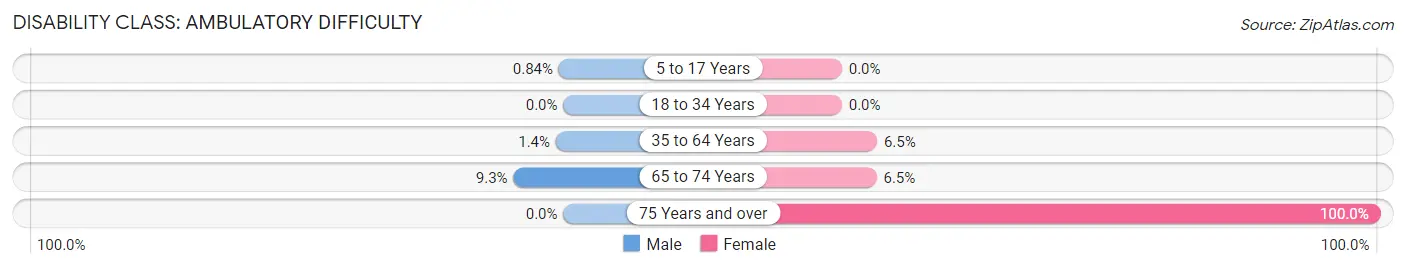
| Age Bracket | Male | Female |
| 5 to 17 Years | 5 (0.8%) | 0 (0.0%) |
| 18 to 34 Years | 0 (0.0%) | 0 (0.0%) |
| 35 to 64 Years | 10 (1.4%) | 33 (6.5%) |
| 65 to 74 Years | 5 (9.3%) | 4 (6.5%) |
| 75 Years and over | 0 (0.0%) | 14 (100.0%) |
Disability Class: Self-Care Difficulty
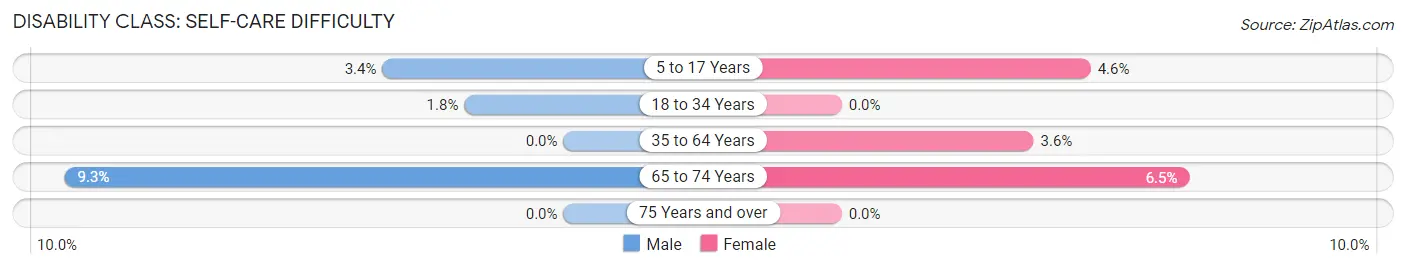
| Age Bracket | Male | Female |
| 5 to 17 Years | 20 (3.4%) | 15 (4.6%) |
| 18 to 34 Years | 8 (1.8%) | 0 (0.0%) |
| 35 to 64 Years | 0 (0.0%) | 18 (3.6%) |
| 65 to 74 Years | 5 (9.3%) | 4 (6.5%) |
| 75 Years and over | 0 (0.0%) | 0 (0.0%) |
Technology Access in Tipton
Computing Device Access in Tipton
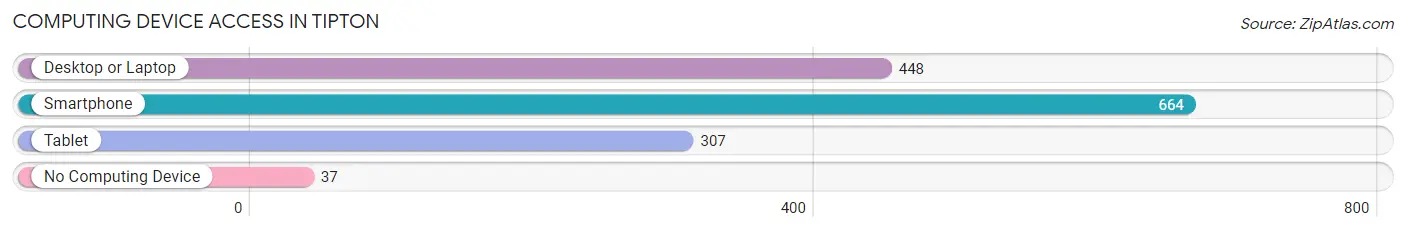
| Device Type | # Households | % Households |
| Desktop or Laptop | 448 | 58.9% |
| Smartphone | 664 | 87.3% |
| Tablet | 307 | 40.3% |
| No Computing Device | 37 | 4.9% |
| Total | 761 | 100.0% |
Internet Access in Tipton
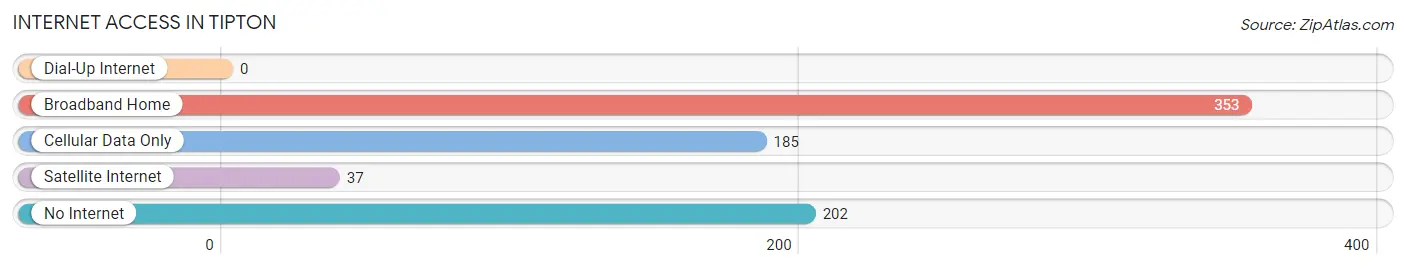
| Internet Type | # Households | % Households |
| Dial-Up Internet | 0 | 0.0% |
| Broadband Home | 353 | 46.4% |
| Cellular Data Only | 185 | 24.3% |
| Satellite Internet | 37 | 4.9% |
| No Internet | 202 | 26.5% |
| Total | 761 | 100.0% |
Tipton Summary
Tipton is a small town located in Tulare County, California, United States. It is situated in the San Joaquin Valley, approximately 8 miles east of Porterville and about 30 miles south of Fresno. The population of Tipton was 1,817 at the 2010 census, up from 1,717 at the 2000 census.
History
Tipton was founded in 1872 by William Tipton, a rancher from Missouri. He purchased a large tract of land in the area and began to develop it for agricultural purposes. The town was originally called Tiptonville, but the name was changed to Tipton in 1876.
The town grew slowly over the years, and by the early 1900s it had become a thriving agricultural center. The town was incorporated in 1921, and the population had grown to 1,000 by the 1930s.
Geography
Tipton is located at an elevation of approximately 300 feet above sea level. It is situated in the San Joaquin Valley, approximately 8 miles east of Porterville and about 30 miles south of Fresno. The town is surrounded by agricultural land, and the nearby Sierra Nevada Mountains provide a scenic backdrop.
The climate in Tipton is semi-arid, with hot summers and mild winters. The average annual precipitation is approximately 8 inches.
Economy
Tipton’s economy is largely based on agriculture. The town is home to several large farms, and the surrounding area is known for its production of cotton, alfalfa, and other crops.
The town also has a small manufacturing sector, with several small businesses producing a variety of products.
Demographics
As of the 2010 census, the population of Tipton was 1,817. The racial makeup of the town was 73.3% White, 0.7% African American, 0.7% Native American, 0.3% Asian, 0.1% Pacific Islander, 22.2% from other races, and 2.7% from two or more races. Hispanic or Latino of any race were 44.2% of the population.
The median household income in Tipton was $31,250, and the median family income was $35,000. The per capita income was $14,845. About 20.2% of families and 24.2% of the population were below the poverty line, including 33.3% of those under age 18 and 10.2% of those age 65 or over.
Tipton is served by the Tipton-Porterville Unified School District. The town is home to one elementary school, one middle school, and one high school. The town also has a public library and a community center.
Common Questions
What is Per Capita Income in Tipton?
Per Capita income in Tipton is $17,028.
What is the Median Family Income in Tipton?
Median Family Income in Tipton is $47,539.
What is the Median Household income in Tipton?
Median Household Income in Tipton is $47,695.
What is Income or Wage Gap in Tipton?
Income or Wage Gap in Tipton is 44.3%.
Women in Tipton earn 55.7 cents for every dollar earned by a man.
What is Family Income Deficit in Tipton?
Family Income Deficit in Tipton is $7,918.
Families that are below poverty line in Tipton earn $7,918 less on average than the poverty threshold level.
What is Inequality or Gini Index in Tipton?
Inequality or Gini Index in Tipton is 0.48.
What is the Total Population of Tipton?
Total Population of Tipton is 3,170.
What is the Total Male Population of Tipton?
Total Male Population of Tipton is 1,894.
What is the Total Female Population of Tipton?
Total Female Population of Tipton is 1,276.
What is the Ratio of Males per 100 Females in Tipton?
There are 148.43 Males per 100 Females in Tipton.
What is the Ratio of Females per 100 Males in Tipton?
There are 67.37 Females per 100 Males in Tipton.
What is the Median Population Age in Tipton?
Median Population Age in Tipton is 27.8 Years.
What is the Average Family Size in Tipton
Average Family Size in Tipton is 4.4 People.
What is the Average Household Size in Tipton
Average Household Size in Tipton is 4.2 People.
How Large is the Labor Force in Tipton?
There are 1,472 People in the Labor Forcein in Tipton.
What is the Percentage of People in the Labor Force in Tipton?
62.9% of People are in the Labor Force in Tipton.
What is the Unemployment Rate in Tipton?
Unemployment Rate in Tipton is 10.5%.