New Bedford, MA Map & Demographics
New Bedford Map
New Bedford Overview
$29,591
PER CAPITA INCOME
$68,281
AVG FAMILY INCOME
$54,604
AVG HOUSEHOLD INCOME
25.8%
WAGE / INCOME GAP [ % ]
74.2¢/ $1
WAGE / INCOME GAP [ $ ]
$10,808
FAMILY INCOME DEFICIT
0.45
INEQUALITY / GINI INDEX
100,620
TOTAL POPULATION
50,584
MALE POPULATION
50,036
FEMALE POPULATION
101.10
MALES / 100 FEMALES
98.92
FEMALES / 100 MALES
36.8
MEDIAN AGE
3.1
AVG FAMILY SIZE
2.4
AVG HOUSEHOLD SIZE
49,942
LABOR FORCE [ PEOPLE ]
62.6%
PERCENT IN LABOR FORCE
7.2%
UNEMPLOYMENT RATE
Income in New Bedford
Income Overview in New Bedford
Per Capita Income in New Bedford is $29,591, while median incomes of families and households are $68,281 and $54,604 respectively.
| Characteristic | Number | Measure |
| Per Capita Income | 100,620 | $29,591 |
| Median Family Income | 23,791 | $68,281 |
| Mean Family Income | 23,791 | $83,870 |
| Median Household Income | 41,722 | $54,604 |
| Mean Household Income | 41,722 | $71,173 |
| Income Deficit | 23,791 | $10,808 |
| Wage / Income Gap (%) | 100,620 | 25.79% |
| Wage / Income Gap ($) | 100,620 | 74.21¢ per $1 |
| Gini / Inequality Index | 100,620 | 0.45 |
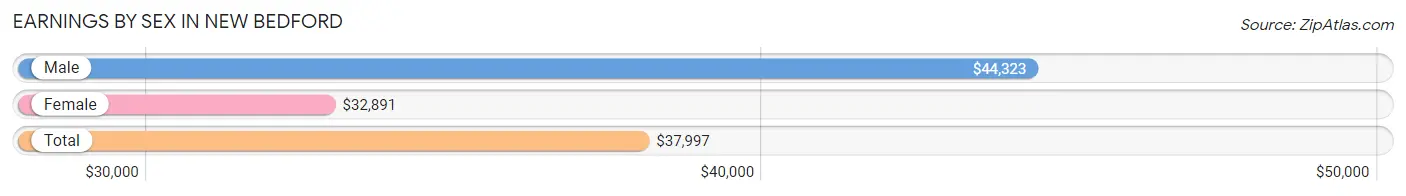
Earnings by Sex in New Bedford
Average Earnings in New Bedford are $37,997, $44,323 for men and $32,891 for women, a difference of 25.8%.
| Sex | Number | Average Earnings |
| Male | 27,433 (52.7%) | $44,323 |
| Female | 24,571 (47.2%) | $32,891 |
| Total | 52,004 (100.0%) | $37,997 |
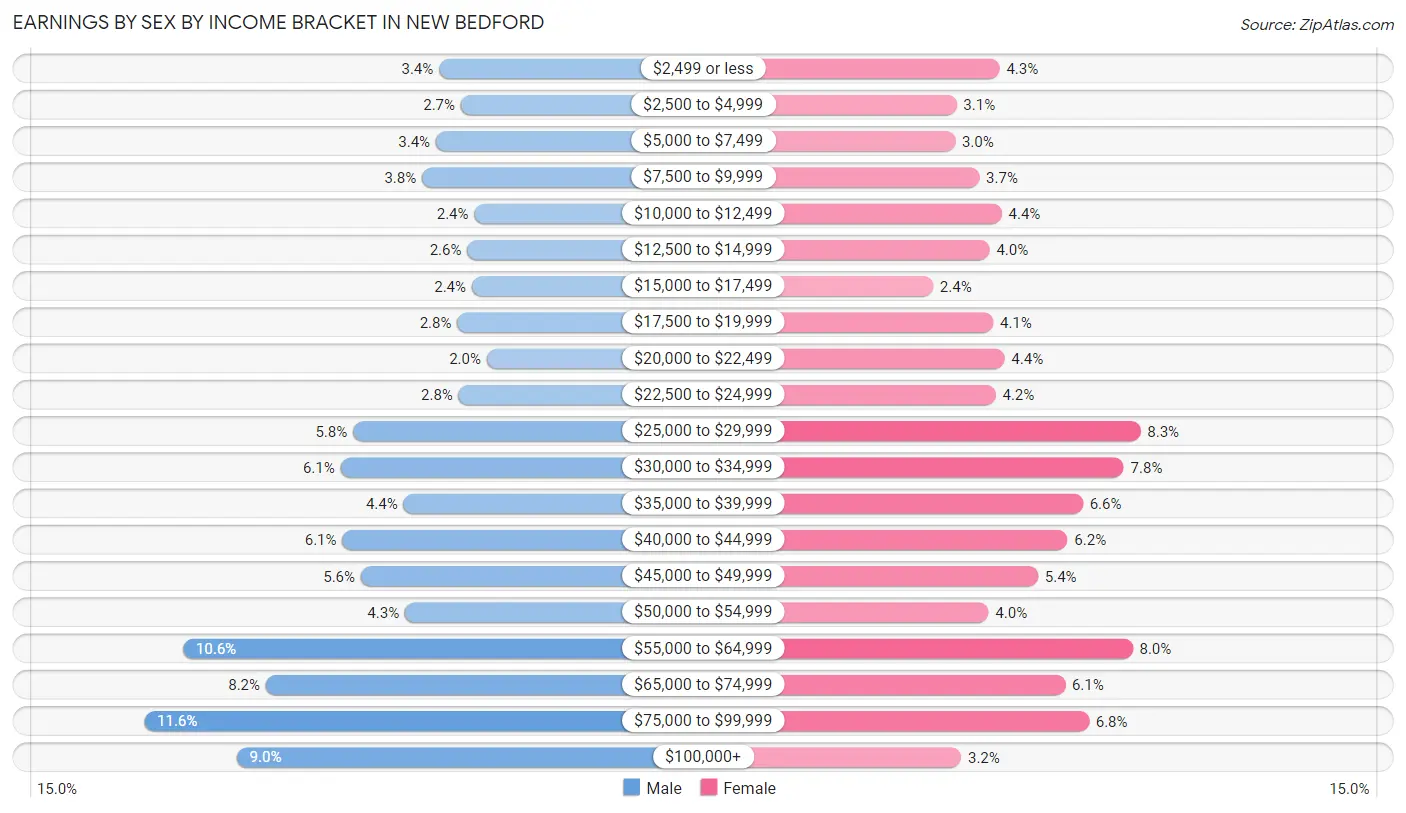
Earnings by Sex by Income Bracket in New Bedford
The most common earnings brackets in New Bedford are $75,000 to $99,999 for men (3,194 | 11.6%) and $25,000 to $29,999 for women (2,027 | 8.3%).
| Income | Male | Female |
| $2,499 or less | 920 (3.4%) | 1,053 (4.3%) |
| $2,500 to $4,999 | 753 (2.7%) | 758 (3.1%) |
| $5,000 to $7,499 | 943 (3.4%) | 746 (3.0%) |
| $7,500 to $9,999 | 1,052 (3.8%) | 913 (3.7%) |
| $10,000 to $12,499 | 648 (2.4%) | 1,068 (4.3%) |
| $12,500 to $14,999 | 703 (2.6%) | 985 (4.0%) |
| $15,000 to $17,499 | 667 (2.4%) | 594 (2.4%) |
| $17,500 to $19,999 | 779 (2.8%) | 1,011 (4.1%) |
| $20,000 to $22,499 | 551 (2.0%) | 1,089 (4.4%) |
| $22,500 to $24,999 | 769 (2.8%) | 1,028 (4.2%) |
| $25,000 to $29,999 | 1,582 (5.8%) | 2,027 (8.3%) |
| $30,000 to $34,999 | 1,679 (6.1%) | 1,912 (7.8%) |
| $35,000 to $39,999 | 1,194 (4.3%) | 1,629 (6.6%) |
| $40,000 to $44,999 | 1,665 (6.1%) | 1,523 (6.2%) |
| $45,000 to $49,999 | 1,522 (5.6%) | 1,319 (5.4%) |
| $50,000 to $54,999 | 1,182 (4.3%) | 977 (4.0%) |
| $55,000 to $64,999 | 2,895 (10.5%) | 1,973 (8.0%) |
| $65,000 to $74,999 | 2,254 (8.2%) | 1,507 (6.1%) |
| $75,000 to $99,999 | 3,194 (11.6%) | 1,670 (6.8%) |
| $100,000+ | 2,481 (9.0%) | 789 (3.2%) |
| Total | 27,433 (100.0%) | 24,571 (100.0%) |
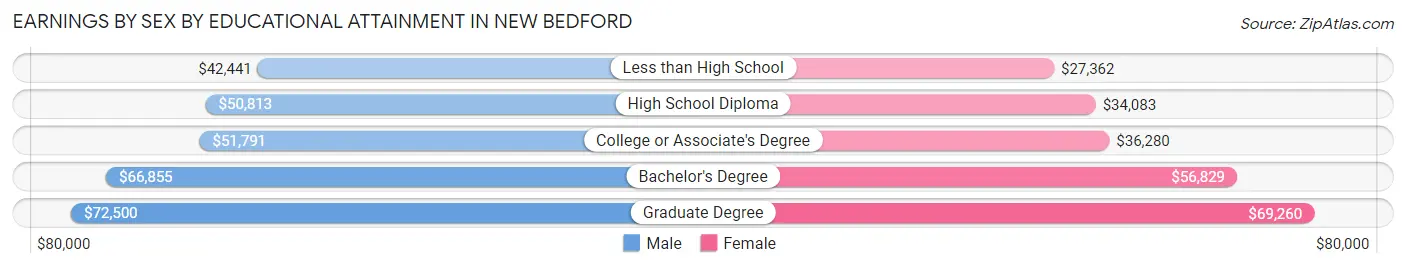
Earnings by Sex by Educational Attainment in New Bedford
Average earnings in New Bedford are $51,347 for men and $36,717 for women, a difference of 28.5%. Men with an educational attainment of graduate degree enjoy the highest average annual earnings of $72,500, while those with less than high school education earn the least with $42,441. Women with an educational attainment of graduate degree earn the most with the average annual earnings of $69,260, while those with less than high school education have the smallest earnings of $27,362.
| Educational Attainment | Male Income | Female Income |
| Less than High School | $42,441 | $27,362 |
| High School Diploma | $50,813 | $34,083 |
| College or Associate's Degree | $51,791 | $36,280 |
| Bachelor's Degree | $66,855 | $56,829 |
| Graduate Degree | $72,500 | $69,260 |
| Total | $51,347 | $36,717 |
Family Income in New Bedford
Family Income Brackets in New Bedford
According to the New Bedford family income data, there are 4,259 families falling into the $100,000 to $149,999 income range, which is the most common income bracket and makes up 17.9% of all families. Conversely, the $10,000 to $14,999 income bracket is the least frequent group with only 500 families (2.1%) belonging to this category.
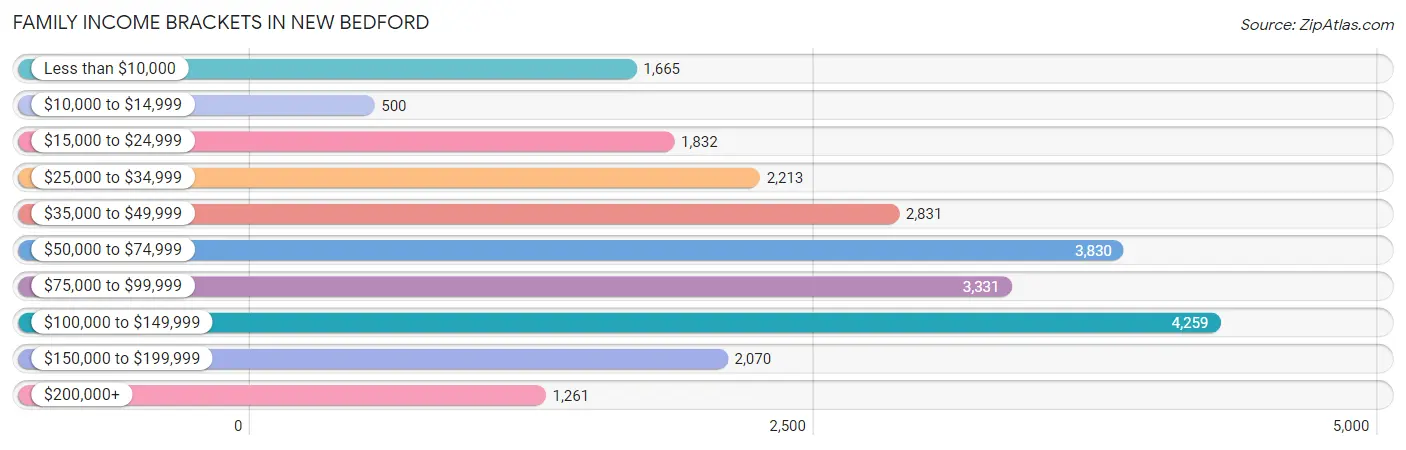
| Income Bracket | # Families | % Families |
| Less than $10,000 | 1,665 | 7.0% |
| $10,000 to $14,999 | 500 | 2.1% |
| $15,000 to $24,999 | 1,832 | 7.7% |
| $25,000 to $34,999 | 2,213 | 9.3% |
| $35,000 to $49,999 | 2,831 | 11.9% |
| $50,000 to $74,999 | 3,830 | 16.1% |
| $75,000 to $99,999 | 3,331 | 14.0% |
| $100,000 to $149,999 | 4,259 | 17.9% |
| $150,000 to $199,999 | 2,070 | 8.7% |
| $200,000+ | 1,261 | 5.3% |
Family Income by Famaliy Size in New Bedford
7+ person families (315 | 1.3%) account for the highest median family income in New Bedford with $138,301 per family, while 2-person families (9,802 | 41.2%) have the highest median income of $30,223 per family member.
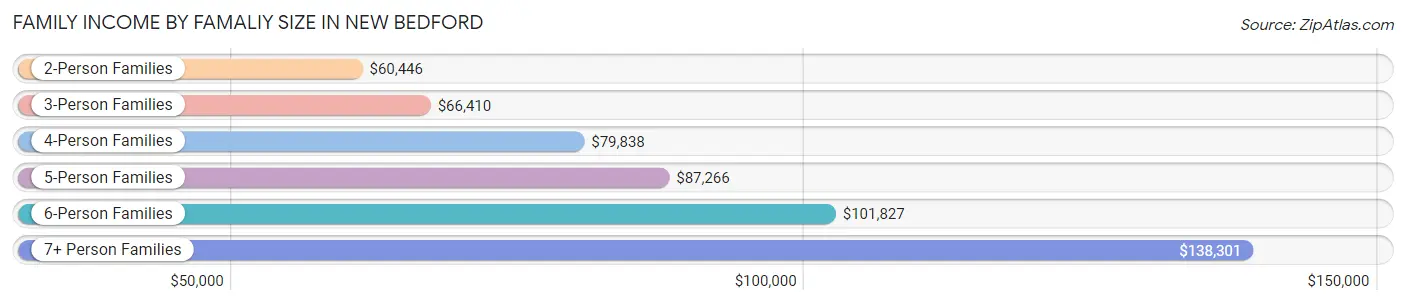
| Income Bracket | # Families | Median Income |
| 2-Person Families | 9,802 (41.2%) | $60,446 |
| 3-Person Families | 6,319 (26.6%) | $66,410 |
| 4-Person Families | 4,336 (18.2%) | $79,838 |
| 5-Person Families | 2,017 (8.5%) | $87,266 |
| 6-Person Families | 1,002 (4.2%) | $101,827 |
| 7+ Person Families | 315 (1.3%) | $138,301 |
| Total | 23,791 (100.0%) | $68,281 |
Family Income by Number of Earners in New Bedford
The median family income in New Bedford is $68,281, with families comprising 3+ earners (3,572) having the highest median family income of $150,605, while families with no earners (3,284) have the lowest median family income of $24,286, accounting for 15.0% and 13.8% of families, respectively.
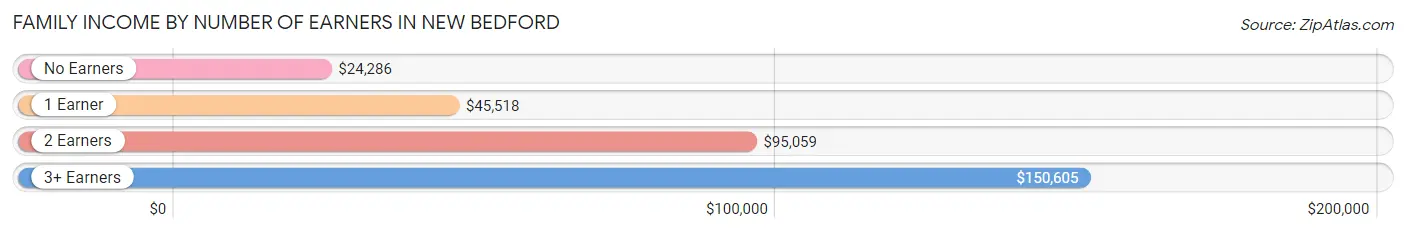
| Number of Earners | # Families | Median Income |
| No Earners | 3,284 (13.8%) | $24,286 |
| 1 Earner | 8,925 (37.5%) | $45,518 |
| 2 Earners | 8,010 (33.7%) | $95,059 |
| 3+ Earners | 3,572 (15.0%) | $150,605 |
| Total | 23,791 (100.0%) | $68,281 |
Household Income in New Bedford
Household Income Brackets in New Bedford
With 7,134 households falling in the category, the $50,000 to $74,999 income range is the most frequent in New Bedford, accounting for 17.1% of all households. In contrast, only 1,627 households (3.9%) fall into the $200,000+ income bracket, making it the least populous group.
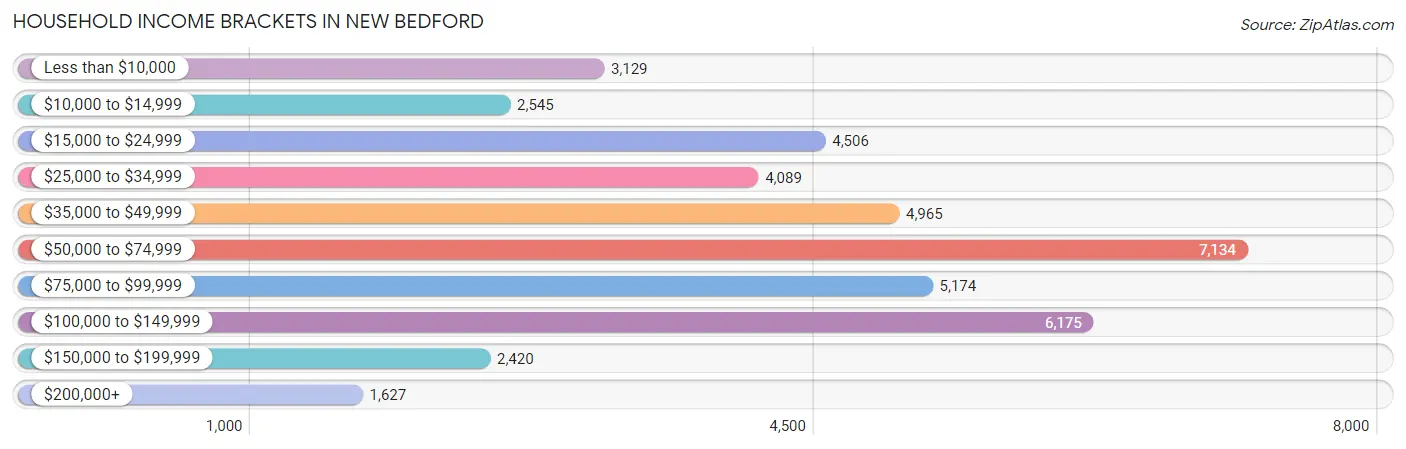
| Income Bracket | # Households | % Households |
| Less than $10,000 | 3,129 | 7.5% |
| $10,000 to $14,999 | 2,545 | 6.1% |
| $15,000 to $24,999 | 4,506 | 10.8% |
| $25,000 to $34,999 | 4,089 | 9.8% |
| $35,000 to $49,999 | 4,965 | 11.9% |
| $50,000 to $74,999 | 7,134 | 17.1% |
| $75,000 to $99,999 | 5,174 | 12.4% |
| $100,000 to $149,999 | 6,175 | 14.8% |
| $150,000 to $199,999 | 2,420 | 5.8% |
| $200,000+ | 1,627 | 3.9% |
Household Income by Householder Age in New Bedford
The median household income in New Bedford is $54,604, with the highest median household income of $64,821 found in the 45 to 64 years age bracket for the primary householder. A total of 14,238 households (34.1%) fall into this category. Meanwhile, the 65+ years age bracket for the primary householder has the lowest median household income of $36,357, with 10,735 households (25.7%) in this group.
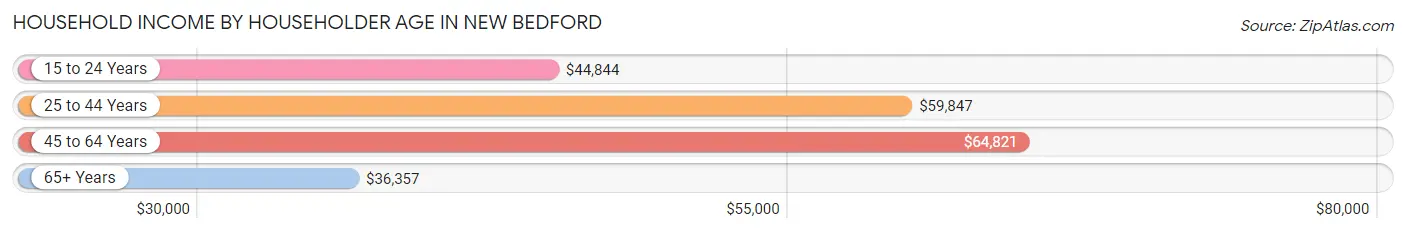
| Income Bracket | # Households | Median Income |
| 15 to 24 Years | 1,992 (4.8%) | $44,844 |
| 25 to 44 Years | 14,757 (35.4%) | $59,847 |
| 45 to 64 Years | 14,238 (34.1%) | $64,821 |
| 65+ Years | 10,735 (25.7%) | $36,357 |
| Total | 41,722 (100.0%) | $54,604 |
Poverty in New Bedford
Income Below Poverty by Sex and Age in New Bedford
With 16.8% poverty level for males and 20.7% for females among the residents of New Bedford, 15 year old males and 12 to 14 year old females are the most vulnerable to poverty, with 278 males (31.3%) and 664 females (37.6%) in their respective age groups living below the poverty level.
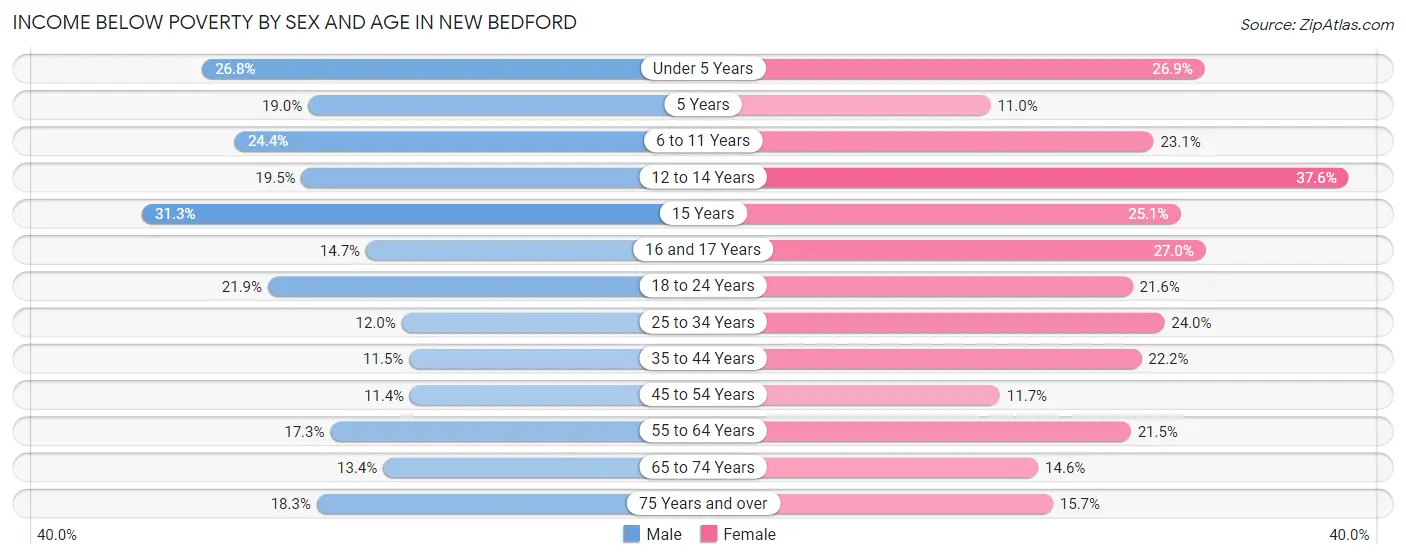
| Age Bracket | Male | Female |
| Under 5 Years | 1,000 (26.8%) | 729 (26.9%) |
| 5 Years | 124 (19.0%) | 66 (11.0%) |
| 6 to 11 Years | 964 (24.4%) | 781 (23.1%) |
| 12 to 14 Years | 412 (19.5%) | 664 (37.6%) |
| 15 Years | 278 (31.3%) | 200 (25.1%) |
| 16 and 17 Years | 222 (14.7%) | 348 (27.0%) |
| 18 to 24 Years | 1,172 (21.9%) | 979 (21.6%) |
| 25 to 34 Years | 834 (12.0%) | 1,667 (23.9%) |
| 35 to 44 Years | 714 (11.5%) | 1,612 (22.2%) |
| 45 to 54 Years | 757 (11.4%) | 697 (11.7%) |
| 55 to 64 Years | 953 (17.3%) | 1,179 (21.4%) |
| 65 to 74 Years | 550 (13.4%) | 733 (14.6%) |
| 75 Years and over | 420 (18.3%) | 560 (15.7%) |
| Total | 8,400 (16.8%) | 10,215 (20.7%) |
Income Above Poverty by Sex and Age in New Bedford
According to the poverty statistics in New Bedford, males aged 45 to 54 years and females aged 5 years are the age groups that are most secure financially, with 88.6% of males and 89.0% of females in these age groups living above the poverty line.
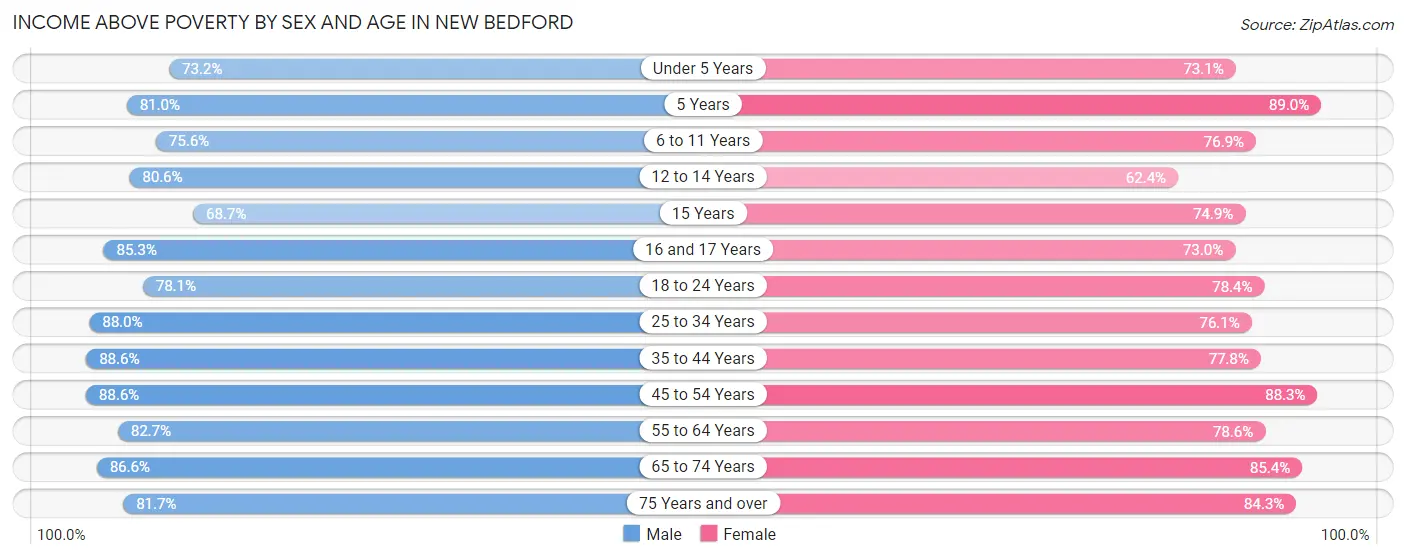
| Age Bracket | Male | Female |
| Under 5 Years | 2,730 (73.2%) | 1,978 (73.1%) |
| 5 Years | 530 (81.0%) | 532 (89.0%) |
| 6 to 11 Years | 2,990 (75.6%) | 2,594 (76.9%) |
| 12 to 14 Years | 1,706 (80.5%) | 1,101 (62.4%) |
| 15 Years | 611 (68.7%) | 596 (74.9%) |
| 16 and 17 Years | 1,292 (85.3%) | 940 (73.0%) |
| 18 to 24 Years | 4,171 (78.1%) | 3,555 (78.4%) |
| 25 to 34 Years | 6,112 (88.0%) | 5,293 (76.0%) |
| 35 to 44 Years | 5,522 (88.5%) | 5,635 (77.8%) |
| 45 to 54 Years | 5,889 (88.6%) | 5,239 (88.3%) |
| 55 to 64 Years | 4,557 (82.7%) | 4,317 (78.5%) |
| 65 to 74 Years | 3,558 (86.6%) | 4,293 (85.4%) |
| 75 Years and over | 1,874 (81.7%) | 3,013 (84.3%) |
| Total | 41,542 (83.2%) | 39,086 (79.3%) |
Income Below Poverty Among Married-Couple Families in New Bedford
The poverty statistics for married-couple families in New Bedford show that 6.8% or 898 of the total 13,151 families live below the poverty line. Families with 3 or 4 children have the highest poverty rate of 16.3%, comprising of 166 families. On the other hand, families with 5 or more children have the lowest poverty rate of 0.0%, which includes 0 families.
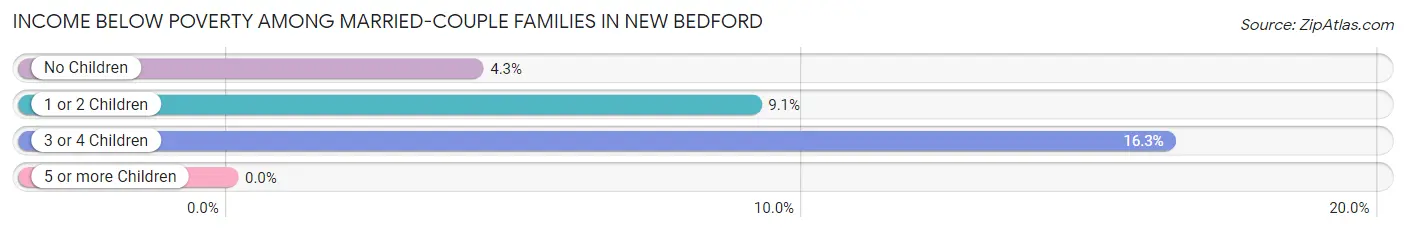
| Children | Above Poverty | Below Poverty |
| No Children | 7,295 (95.7%) | 325 (4.3%) |
| 1 or 2 Children | 4,061 (90.9%) | 407 (9.1%) |
| 3 or 4 Children | 851 (83.7%) | 166 (16.3%) |
| 5 or more Children | 46 (100.0%) | 0 (0.0%) |
| Total | 12,253 (93.2%) | 898 (6.8%) |
Income Below Poverty Among Single-Parent Households in New Bedford
According to the poverty data in New Bedford, 16.5% or 523 single-father households and 30.9% or 2,309 single-mother households are living below the poverty line. Among single-father households, those with no children have the highest poverty rate, with 284 households (21.0%) experiencing poverty. Likewise, among single-mother households, those with 3 or 4 children have the highest poverty rate, with 620 households (61.3%) falling below the poverty line.
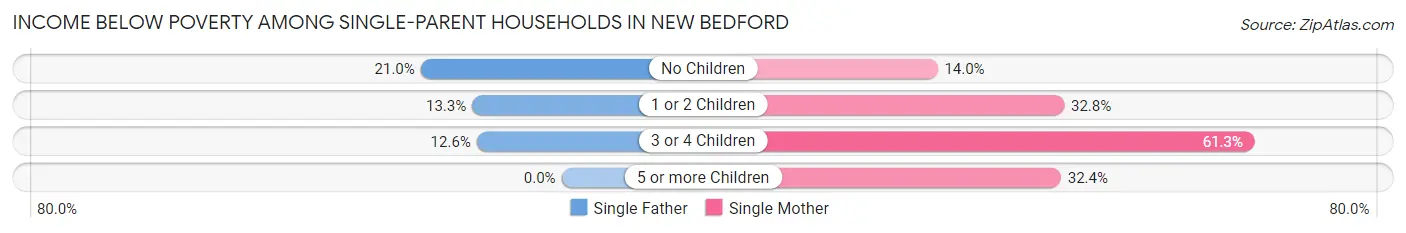
| Children | Single Father | Single Mother |
| No Children | 284 (21.0%) | 321 (14.0%) |
| 1 or 2 Children | 193 (13.3%) | 1,357 (32.8%) |
| 3 or 4 Children | 46 (12.6%) | 620 (61.3%) |
| 5 or more Children | 0 (0.0%) | 11 (32.4%) |
| Total | 523 (16.5%) | 2,309 (30.9%) |
Income Below Poverty Among Married-Couple vs Single-Parent Households in New Bedford
The poverty data for New Bedford shows that 898 of the married-couple family households (6.8%) and 2,832 of the single-parent households (26.6%) are living below the poverty level. Within the married-couple family households, those with 3 or 4 children have the highest poverty rate, with 166 households (16.3%) falling below the poverty line. Among the single-parent households, those with 3 or 4 children have the highest poverty rate, with 666 household (48.4%) living below poverty.
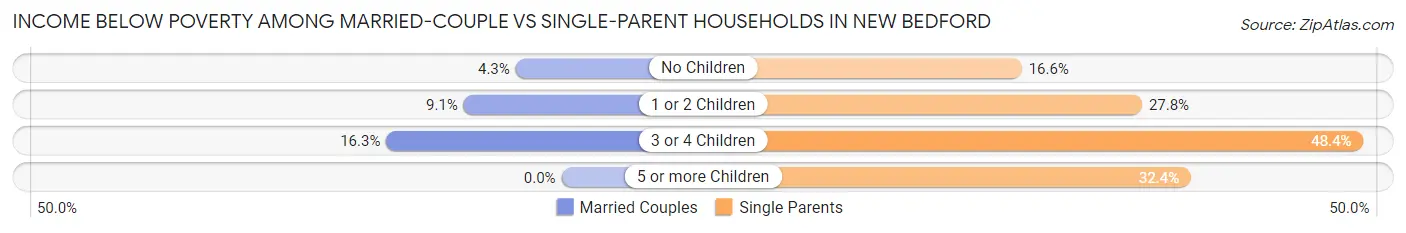
| Children | Married-Couple Families | Single-Parent Households |
| No Children | 325 (4.3%) | 605 (16.6%) |
| 1 or 2 Children | 407 (9.1%) | 1,550 (27.8%) |
| 3 or 4 Children | 166 (16.3%) | 666 (48.4%) |
| 5 or more Children | 0 (0.0%) | 11 (32.4%) |
| Total | 898 (6.8%) | 2,832 (26.6%) |
Race in New Bedford
The most populous races in New Bedford are White / Caucasian (60,797 | 60.4%), Hispanic or Latino (23,591 | 23.4%), and Some other Race (18,158 | 18.0%).
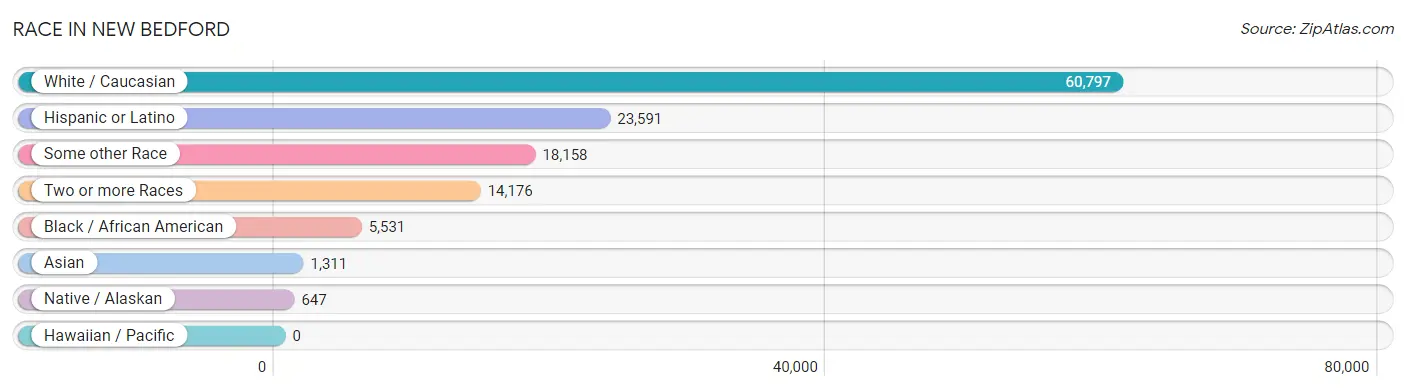
| Race | # Population | % Population |
| Asian | 1,311 | 1.3% |
| Black / African American | 5,531 | 5.5% |
| Hawaiian / Pacific | 0 | 0.0% |
| Hispanic or Latino | 23,591 | 23.4% |
| Native / Alaskan | 647 | 0.6% |
| White / Caucasian | 60,797 | 60.4% |
| Two or more Races | 14,176 | 14.1% |
| Some other Race | 18,158 | 18.0% |
| Total | 100,620 | 100.0% |
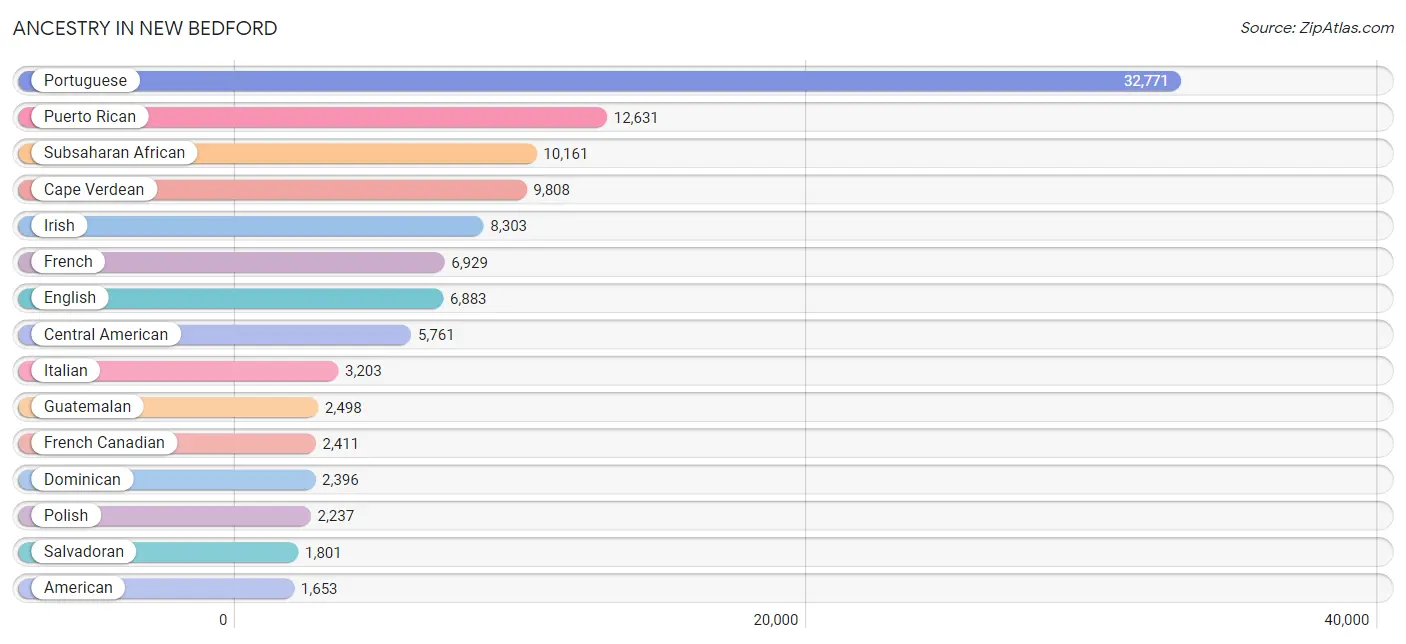
Ancestry in New Bedford
The most populous ancestries reported in New Bedford are Portuguese (32,771 | 32.6%), Puerto Rican (12,631 | 12.6%), Subsaharan African (10,161 | 10.1%), Cape Verdean (9,808 | 9.8%), and Irish (8,303 | 8.3%), together accounting for 73.2% of all New Bedford residents.
| Ancestry | # Population | % Population |
| African | 231 | 0.2% |
| American | 1,653 | 1.6% |
| Apache | 17 | 0.0% |
| Arab | 347 | 0.3% |
| Argentinean | 29 | 0.0% |
| Armenian | 104 | 0.1% |
| Australian | 9 | 0.0% |
| Austrian | 95 | 0.1% |
| Bahamian | 20 | 0.0% |
| Barbadian | 130 | 0.1% |
| Belgian | 21 | 0.0% |
| Bhutanese | 412 | 0.4% |
| Blackfeet | 191 | 0.2% |
| Brazilian | 673 | 0.7% |
| British | 61 | 0.1% |
| British West Indian | 55 | 0.1% |
| Burmese | 72 | 0.1% |
| Canadian | 166 | 0.2% |
| Cape Verdean | 9,808 | 9.8% |
| Celtic | 5 | 0.0% |
| Central American | 5,761 | 5.7% |
| Central American Indian | 648 | 0.6% |
| Cherokee | 62 | 0.1% |
| Choctaw | 5 | 0.0% |
| Colombian | 414 | 0.4% |
| Comanche | 7 | 0.0% |
| Costa Rican | 14 | 0.0% |
| Cuban | 88 | 0.1% |
| Czech | 21 | 0.0% |
| Danish | 16 | 0.0% |
| Dominican | 2,396 | 2.4% |
| Dutch | 98 | 0.1% |
| Eastern European | 24 | 0.0% |
| Ecuadorian | 119 | 0.1% |
| Egyptian | 51 | 0.1% |
| English | 6,883 | 6.8% |
| Ethiopian | 11 | 0.0% |
| European | 315 | 0.3% |
| Finnish | 37 | 0.0% |
| French | 6,929 | 6.9% |
| French American Indian | 33 | 0.0% |
| French Canadian | 2,411 | 2.4% |
| German | 1,547 | 1.5% |
| Greek | 211 | 0.2% |
| Guatemalan | 2,498 | 2.5% |
| Haitian | 600 | 0.6% |
| Honduran | 1,448 | 1.4% |
| Hungarian | 11 | 0.0% |
| Indian (Asian) | 540 | 0.5% |
| Irish | 8,303 | 8.3% |
| Iroquois | 7 | 0.0% |
| Italian | 3,203 | 3.2% |
| Jamaican | 206 | 0.2% |
| Japanese | 71 | 0.1% |
| Jordanian | 34 | 0.0% |
| Kenyan | 6 | 0.0% |
| Korean | 526 | 0.5% |
| Lebanese | 169 | 0.2% |
| Lithuanian | 54 | 0.1% |
| Mexican | 1,218 | 1.2% |
| Navajo | 20 | 0.0% |
| Nigerian | 34 | 0.0% |
| Northern European | 59 | 0.1% |
| Norwegian | 228 | 0.2% |
| Okinawan | 2 | 0.0% |
| Pakistani | 16 | 0.0% |
| Peruvian | 8 | 0.0% |
| Polish | 2,237 | 2.2% |
| Portuguese | 32,771 | 32.6% |
| Puerto Rican | 12,631 | 12.6% |
| Russian | 138 | 0.1% |
| Salvadoran | 1,801 | 1.8% |
| Scandinavian | 49 | 0.1% |
| Scotch-Irish | 177 | 0.2% |
| Scottish | 385 | 0.4% |
| Senegalese | 22 | 0.0% |
| Serbian | 8 | 0.0% |
| Sioux | 31 | 0.0% |
| South African | 29 | 0.0% |
| South American | 675 | 0.7% |
| Spaniard | 285 | 0.3% |
| Spanish | 76 | 0.1% |
| Sri Lankan | 181 | 0.2% |
| Subsaharan African | 10,161 | 10.1% |
| Swedish | 287 | 0.3% |
| Swiss | 42 | 0.0% |
| Syrian | 22 | 0.0% |
| Thai | 351 | 0.4% |
| Trinidadian and Tobagonian | 26 | 0.0% |
| Ukrainian | 13 | 0.0% |
| Uruguayan | 12 | 0.0% |
| Ute | 11 | 0.0% |
| Venezuelan | 93 | 0.1% |
| Welsh | 138 | 0.1% |
| West Indian | 96 | 0.1% |
| Yugoslavian | 77 | 0.1% | View All 96 Rows |
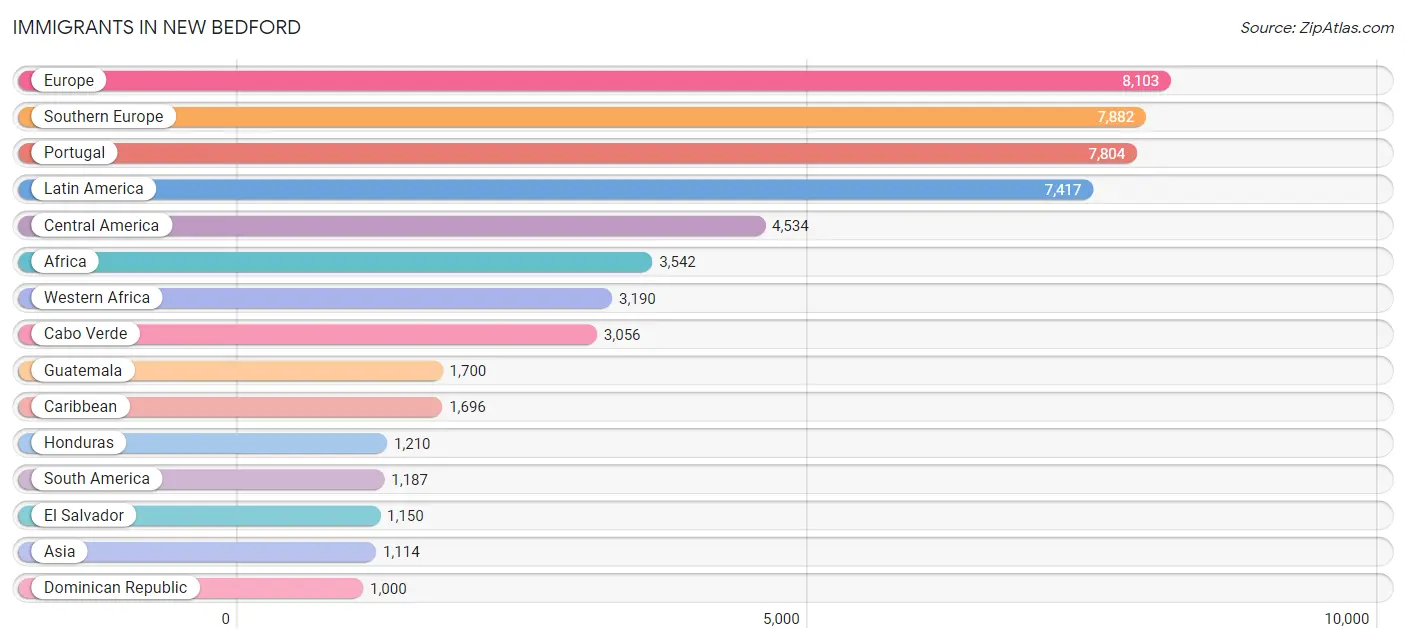
Immigrants in New Bedford
The most numerous immigrant groups reported in New Bedford came from Europe (8,103 | 8.1%), Southern Europe (7,882 | 7.8%), Portugal (7,804 | 7.8%), Latin America (7,417 | 7.4%), and Central America (4,534 | 4.5%), together accounting for 35.5% of all New Bedford residents.
| Immigration Origin | # Population | % Population |
| Africa | 3,542 | 3.5% |
| Armenia | 46 | 0.1% |
| Asia | 1,114 | 1.1% |
| Australia | 9 | 0.0% |
| Azores | 949 | 0.9% |
| Bangladesh | 21 | 0.0% |
| Barbados | 42 | 0.0% |
| Brazil | 764 | 0.8% |
| Cabo Verde | 3,056 | 3.0% |
| Cambodia | 51 | 0.1% |
| Cameroon | 61 | 0.1% |
| Canada | 76 | 0.1% |
| Caribbean | 1,696 | 1.7% |
| Central America | 4,534 | 4.5% |
| China | 241 | 0.2% |
| Colombia | 217 | 0.2% |
| Costa Rica | 24 | 0.0% |
| Cuba | 16 | 0.0% |
| Czechoslovakia | 13 | 0.0% |
| Denmark | 7 | 0.0% |
| Dominica | 128 | 0.1% |
| Dominican Republic | 1,000 | 1.0% |
| Eastern Africa | 31 | 0.0% |
| Eastern Asia | 304 | 0.3% |
| Eastern Europe | 32 | 0.0% |
| Ecuador | 119 | 0.1% |
| Egypt | 26 | 0.0% |
| El Salvador | 1,150 | 1.1% |
| England | 15 | 0.0% |
| Europe | 8,103 | 8.1% |
| France | 84 | 0.1% |
| Germany | 25 | 0.0% |
| Greece | 8 | 0.0% |
| Grenada | 20 | 0.0% |
| Guatemala | 1,700 | 1.7% |
| Haiti | 387 | 0.4% |
| Honduras | 1,210 | 1.2% |
| Hong Kong | 19 | 0.0% |
| India | 285 | 0.3% |
| Iran | 17 | 0.0% |
| Ireland | 10 | 0.0% |
| Italy | 45 | 0.0% |
| Jamaica | 67 | 0.1% |
| Japan | 33 | 0.0% |
| Jordan | 6 | 0.0% |
| Kenya | 6 | 0.0% |
| Korea | 30 | 0.0% |
| Latin America | 7,417 | 7.4% |
| Lebanon | 34 | 0.0% |
| Mexico | 450 | 0.4% |
| Middle Africa | 125 | 0.1% |
| Morocco | 7 | 0.0% |
| Nigeria | 6 | 0.0% |
| Northern Africa | 58 | 0.1% |
| Northern Europe | 68 | 0.1% |
| Oceania | 9 | 0.0% |
| Pakistan | 140 | 0.1% |
| Peru | 1 | 0.0% |
| Philippines | 96 | 0.1% |
| Poland | 17 | 0.0% |
| Portugal | 7,804 | 7.8% |
| Russia | 2 | 0.0% |
| Saudi Arabia | 29 | 0.0% |
| Senegal | 89 | 0.1% |
| South Africa | 29 | 0.0% |
| South America | 1,187 | 1.2% |
| South Central Asia | 463 | 0.5% |
| South Eastern Asia | 226 | 0.2% |
| Southern Europe | 7,882 | 7.8% |
| Spain | 25 | 0.0% |
| Sweden | 14 | 0.0% |
| Switzerland | 12 | 0.0% |
| Thailand | 6 | 0.0% |
| Trinidad and Tobago | 36 | 0.0% |
| Uruguay | 23 | 0.0% |
| Venezuela | 63 | 0.1% |
| Vietnam | 73 | 0.1% |
| Western Africa | 3,190 | 3.2% |
| Western Asia | 121 | 0.1% |
| Western Europe | 121 | 0.1% |
| Zaire | 2 | 0.0% |
| Zimbabwe | 11 | 0.0% | View All 82 Rows |
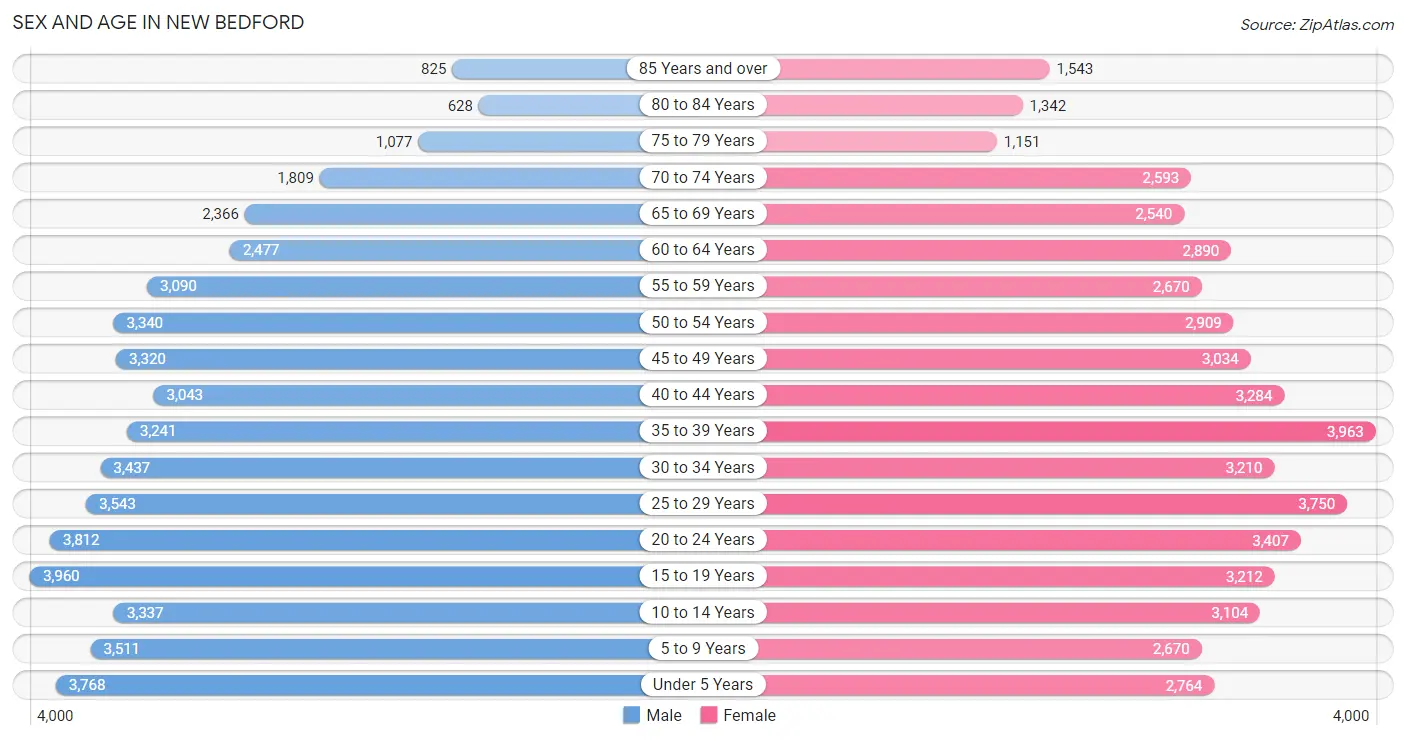
Sex and Age in New Bedford
Sex and Age in New Bedford
The most populous age groups in New Bedford are 15 to 19 Years (3,960 | 7.8%) for men and 35 to 39 Years (3,963 | 7.9%) for women.
| Age Bracket | Male | Female |
| Under 5 Years | 3,768 (7.4%) | 2,764 (5.5%) |
| 5 to 9 Years | 3,511 (6.9%) | 2,670 (5.3%) |
| 10 to 14 Years | 3,337 (6.6%) | 3,104 (6.2%) |
| 15 to 19 Years | 3,960 (7.8%) | 3,212 (6.4%) |
| 20 to 24 Years | 3,812 (7.5%) | 3,407 (6.8%) |
| 25 to 29 Years | 3,543 (7.0%) | 3,750 (7.5%) |
| 30 to 34 Years | 3,437 (6.8%) | 3,210 (6.4%) |
| 35 to 39 Years | 3,241 (6.4%) | 3,963 (7.9%) |
| 40 to 44 Years | 3,043 (6.0%) | 3,284 (6.6%) |
| 45 to 49 Years | 3,320 (6.6%) | 3,034 (6.1%) |
| 50 to 54 Years | 3,340 (6.6%) | 2,909 (5.8%) |
| 55 to 59 Years | 3,090 (6.1%) | 2,670 (5.3%) |
| 60 to 64 Years | 2,477 (4.9%) | 2,890 (5.8%) |
| 65 to 69 Years | 2,366 (4.7%) | 2,540 (5.1%) |
| 70 to 74 Years | 1,809 (3.6%) | 2,593 (5.2%) |
| 75 to 79 Years | 1,077 (2.1%) | 1,151 (2.3%) |
| 80 to 84 Years | 628 (1.2%) | 1,342 (2.7%) |
| 85 Years and over | 825 (1.6%) | 1,543 (3.1%) |
| Total | 50,584 (100.0%) | 50,036 (100.0%) |
Families and Households in New Bedford
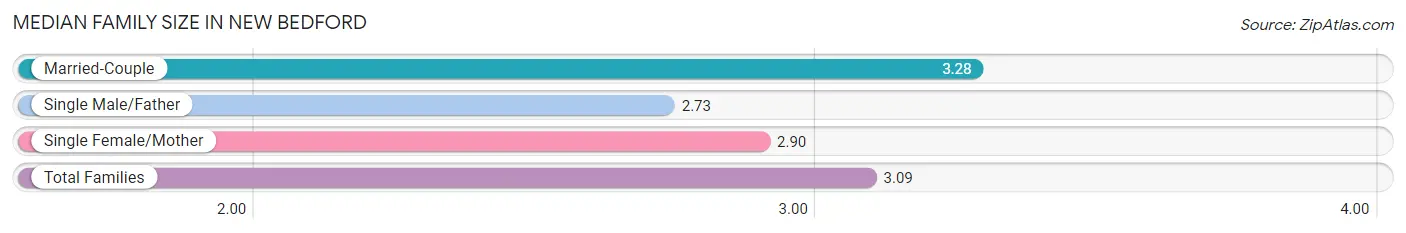
Median Family Size in New Bedford
The median family size in New Bedford is 3.09 persons per family, with married-couple families (13,151 | 55.3%) accounting for the largest median family size of 3.28 persons per family. On the other hand, single male/father families (3,165 | 13.3%) represent the smallest median family size with 2.73 persons per family.
| Family Type | # Families | Family Size |
| Married-Couple | 13,151 (55.3%) | 3.28 |
| Single Male/Father | 3,165 (13.3%) | 2.73 |
| Single Female/Mother | 7,475 (31.4%) | 2.90 |
| Total Families | 23,791 (100.0%) | 3.09 |
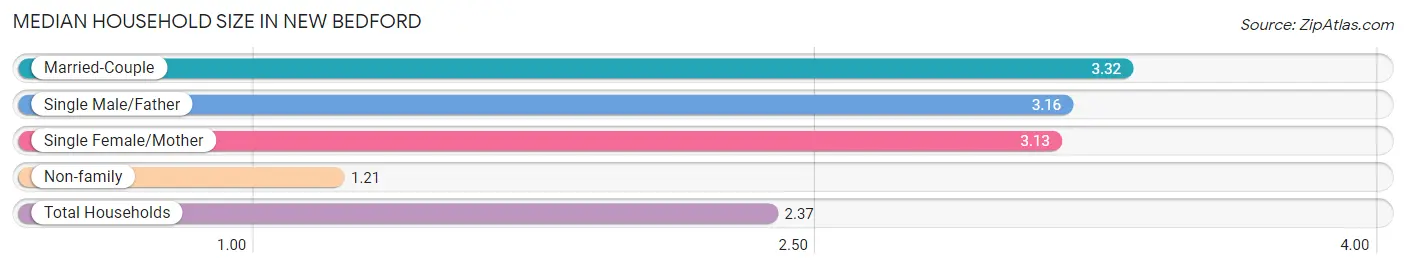
Median Household Size in New Bedford
The median household size in New Bedford is 2.37 persons per household, with married-couple households (13,151 | 31.5%) accounting for the largest median household size of 3.32 persons per household. non-family households (17,931 | 43.0%) represent the smallest median household size with 1.21 persons per household.
| Household Type | # Households | Household Size |
| Married-Couple | 13,151 (31.5%) | 3.32 |
| Single Male/Father | 3,165 (7.6%) | 3.16 |
| Single Female/Mother | 7,475 (17.9%) | 3.13 |
| Non-family | 17,931 (43.0%) | 1.21 |
| Total Households | 41,722 (100.0%) | 2.37 |
Household Size by Marriage Status in New Bedford
Out of a total of 41,722 households in New Bedford, 23,791 (57.0%) are family households, while 17,931 (43.0%) are nonfamily households. The most numerous type of family households are 2-person households, comprising 8,749, and the most common type of nonfamily households are 1-person households, comprising 14,828.
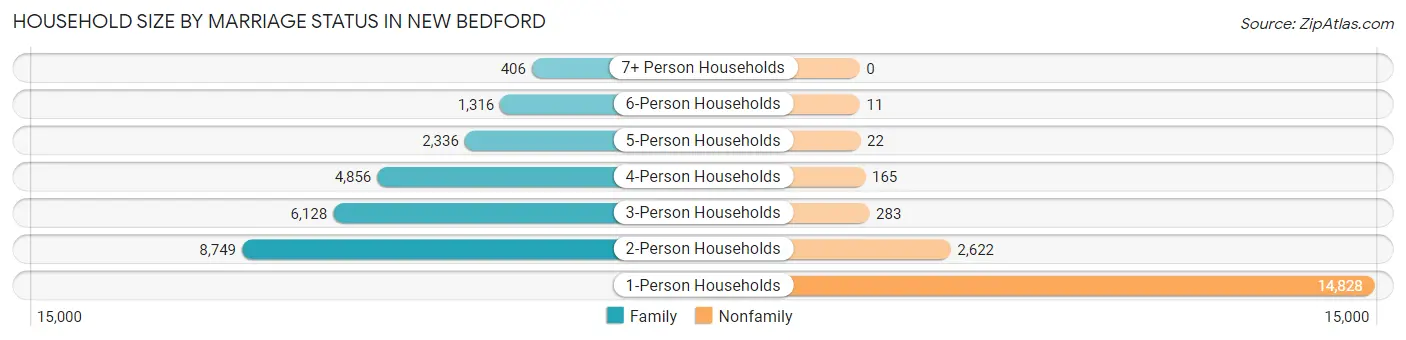
| Household Size | Family Households | Nonfamily Households |
| 1-Person Households | - | 14,828 (35.5%) |
| 2-Person Households | 8,749 (21.0%) | 2,622 (6.3%) |
| 3-Person Households | 6,128 (14.7%) | 283 (0.7%) |
| 4-Person Households | 4,856 (11.6%) | 165 (0.4%) |
| 5-Person Households | 2,336 (5.6%) | 22 (0.1%) |
| 6-Person Households | 1,316 (3.2%) | 11 (0.0%) |
| 7+ Person Households | 406 (1.0%) | 0 (0.0%) |
| Total | 23,791 (57.0%) | 17,931 (43.0%) |
Female Fertility in New Bedford
Fertility by Age in New Bedford
Average fertility rate in New Bedford is 66.0 births per 1,000 women. Women in the age bracket of 20 to 34 years have the highest fertility rate with 112.0 births per 1,000 women. Women in the age bracket of 20 to 34 years acount for 71.5% of all women with births.
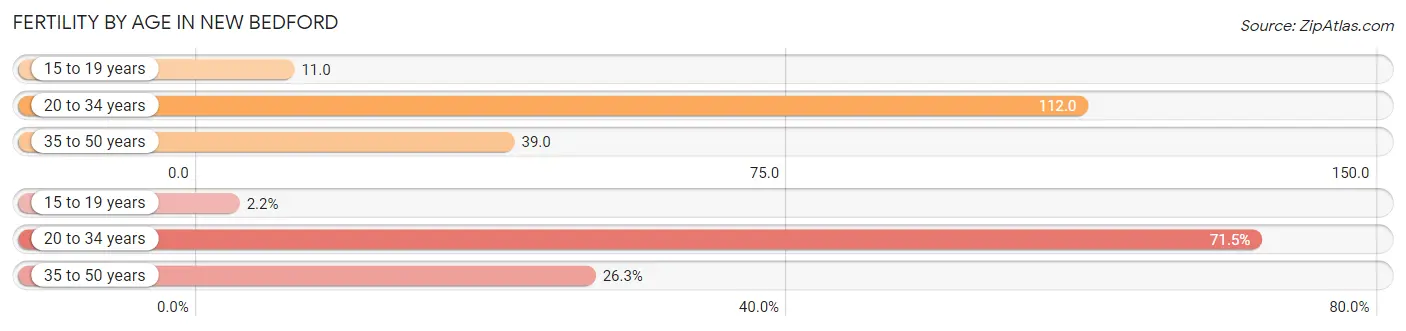
| Age Bracket | Women with Births | Births / 1,000 Women |
| 15 to 19 years | 35 (2.1%) | 11.0 |
| 20 to 34 years | 1,164 (71.5%) | 112.0 |
| 35 to 50 years | 428 (26.3%) | 39.0 |
| Total | 1,627 (100.0%) | 66.0 |
Fertility by Age by Marriage Status in New Bedford
42.8% of women with births (1,627) in New Bedford are married. The highest percentage of unmarried women with births falls into 15 to 19 years age bracket with 100.0% of them unmarried at the time of birth, while the lowest percentage of unmarried women with births belong to 35 to 50 years age bracket with 13.5% of them unmarried.
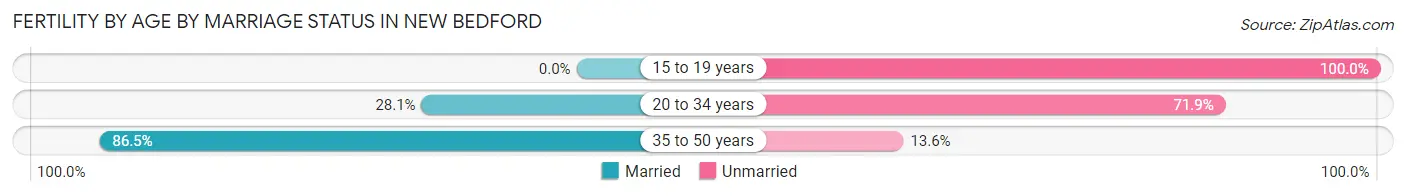
| Age Bracket | Married | Unmarried |
| 15 to 19 years | 0 (0.0%) | 35 (100.0%) |
| 20 to 34 years | 327 (28.1%) | 837 (71.9%) |
| 35 to 50 years | 370 (86.5%) | 58 (13.6%) |
| Total | 696 (42.8%) | 931 (57.2%) |
Fertility by Education in New Bedford
Average fertility rate in New Bedford is 66.0 births per 1,000 women. Women with the education attainment of less than high school have the highest fertility rate of 81.0 births per 1,000 women, while women with the education attainment of graduate degree have the lowest fertility at 39.0 births per 1,000 women. Women with the education attainment of high school diploma represent 30.8% of all women with births.
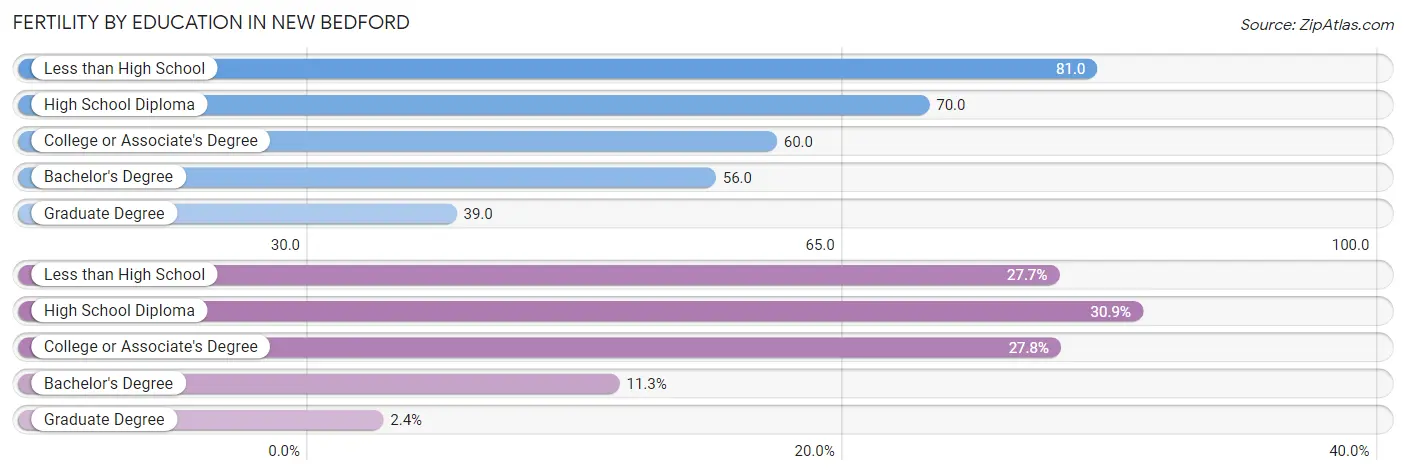
| Educational Attainment | Women with Births | Births / 1,000 Women |
| Less than High School | 451 (27.7%) | 81.0 |
| High School Diploma | 502 (30.8%) | 70.0 |
| College or Associate's Degree | 452 (27.8%) | 60.0 |
| Bachelor's Degree | 183 (11.3%) | 56.0 |
| Graduate Degree | 39 (2.4%) | 39.0 |
| Total | 1,627 (100.0%) | 66.0 |
Fertility by Education by Marriage Status in New Bedford
57.2% of women with births in New Bedford are unmarried. Women with the educational attainment of graduate degree are most likely to be married with 100.0% of them married at childbirth, while women with the educational attainment of high school diploma are least likely to be married with 70.7% of them unmarried at childbirth.
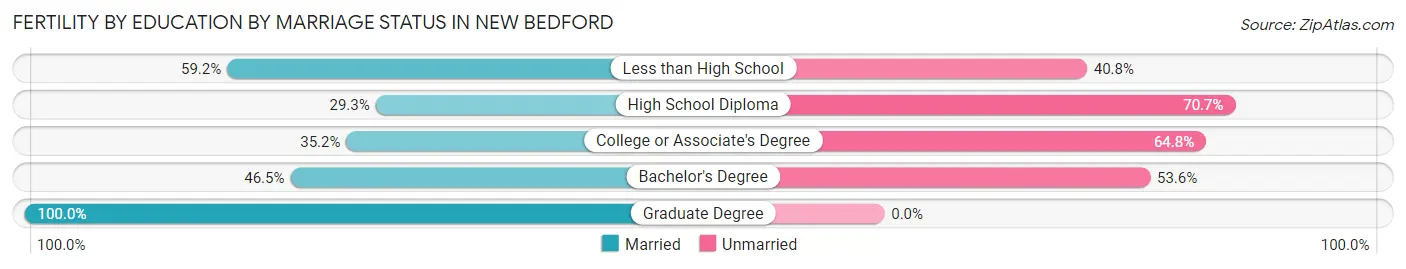
| Educational Attainment | Married | Unmarried |
| Less than High School | 267 (59.2%) | 184 (40.8%) |
| High School Diploma | 147 (29.3%) | 355 (70.7%) |
| College or Associate's Degree | 159 (35.2%) | 293 (64.8%) |
| Bachelor's Degree | 85 (46.5%) | 98 (53.5%) |
| Graduate Degree | 39 (100.0%) | 0 (0.0%) |
| Total | 696 (42.8%) | 931 (57.2%) |
Employment Characteristics in New Bedford
Employment by Class of Employer in New Bedford
Among the 45,505 employed individuals in New Bedford, private company employees (34,098 | 74.9%), not-for-profit organizations (4,084 | 9.0%), and local government employees (2,628 | 5.8%) make up the most common classes of employment.
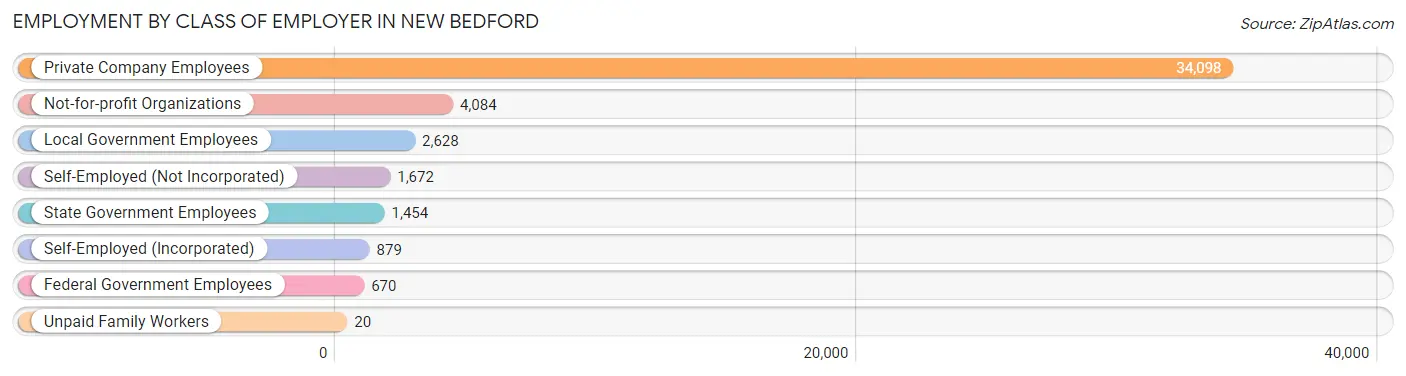
| Employer Class | # Employees | % Employees |
| Private Company Employees | 34,098 | 74.9% |
| Self-Employed (Incorporated) | 879 | 1.9% |
| Self-Employed (Not Incorporated) | 1,672 | 3.7% |
| Not-for-profit Organizations | 4,084 | 9.0% |
| Local Government Employees | 2,628 | 5.8% |
| State Government Employees | 1,454 | 3.2% |
| Federal Government Employees | 670 | 1.5% |
| Unpaid Family Workers | 20 | 0.0% |
| Total | 45,505 | 100.0% |
Employment Status by Age in New Bedford
According to the labor force statistics for New Bedford, out of the total population over 16 years of age (79,780), 62.6% or 49,942 individuals are in the labor force, with 7.2% or 3,596 of them unemployed. The age group with the highest labor force participation rate is 25 to 29 years, with 84.1% or 6,133 individuals in the labor force. Within the labor force, the 75 years and over age range has the highest percentage of unemployed individuals, with 13.4% or 45 of them being unemployed.
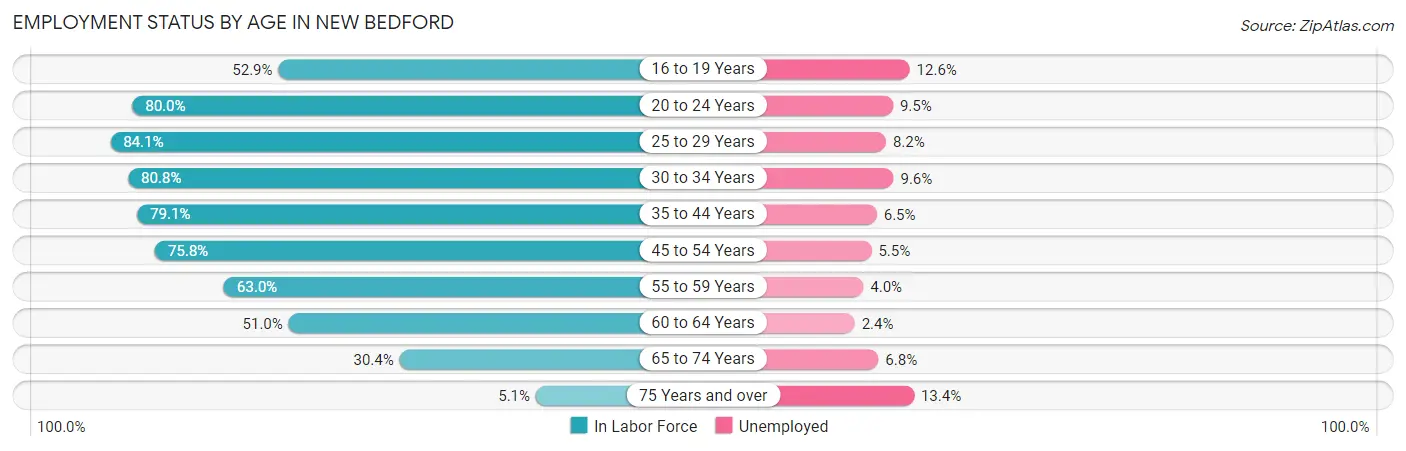
| Age Bracket | In Labor Force | Unemployed |
| 16 to 19 Years | 2,902 (52.9%) | 366 (12.6%) |
| 20 to 24 Years | 5,775 (80.0%) | 549 (9.5%) |
| 25 to 29 Years | 6,133 (84.1%) | 503 (8.2%) |
| 30 to 34 Years | 5,371 (80.8%) | 516 (9.6%) |
| 35 to 44 Years | 10,703 (79.1%) | 696 (6.5%) |
| 45 to 54 Years | 9,553 (75.8%) | 525 (5.5%) |
| 55 to 59 Years | 3,629 (63.0%) | 145 (4.0%) |
| 60 to 64 Years | 2,737 (51.0%) | 66 (2.4%) |
| 65 to 74 Years | 2,830 (30.4%) | 192 (6.8%) |
| 75 Years and over | 335 (5.1%) | 45 (13.4%) |
| Total | 49,942 (62.6%) | 3,596 (7.2%) |
Employment Status by Educational Attainment in New Bedford
According to labor force statistics for New Bedford, 74.5% of individuals (38,145) out of the total population between 25 and 64 years of age (51,201) are in the labor force, with 6.4% or 2,441 of them being unemployed. The group with the highest labor force participation rate are those with the educational attainment of bachelor's degree or higher, with 89.2% or 7,495 individuals in the labor force. Within the labor force, individuals with college / associate degree education have the highest percentage of unemployment, with 9.3% or 1,054 of them being unemployed.
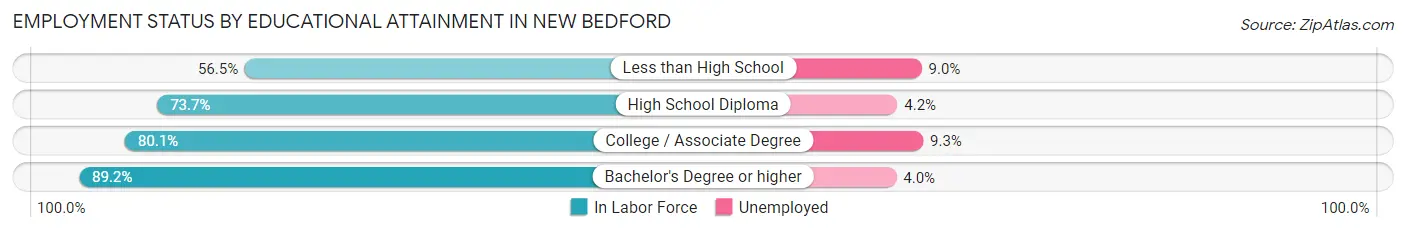
| Educational Attainment | In Labor Force | Unemployed |
| Less than High School | 6,006 (56.5%) | 957 (9.0%) |
| High School Diploma | 13,276 (73.7%) | 757 (4.2%) |
| College / Associate Degree | 11,337 (80.1%) | 1,316 (9.3%) |
| Bachelor's Degree or higher | 7,495 (89.2%) | 336 (4.0%) |
| Total | 38,145 (74.5%) | 3,277 (6.4%) |
Employment Occupations by Sex in New Bedford
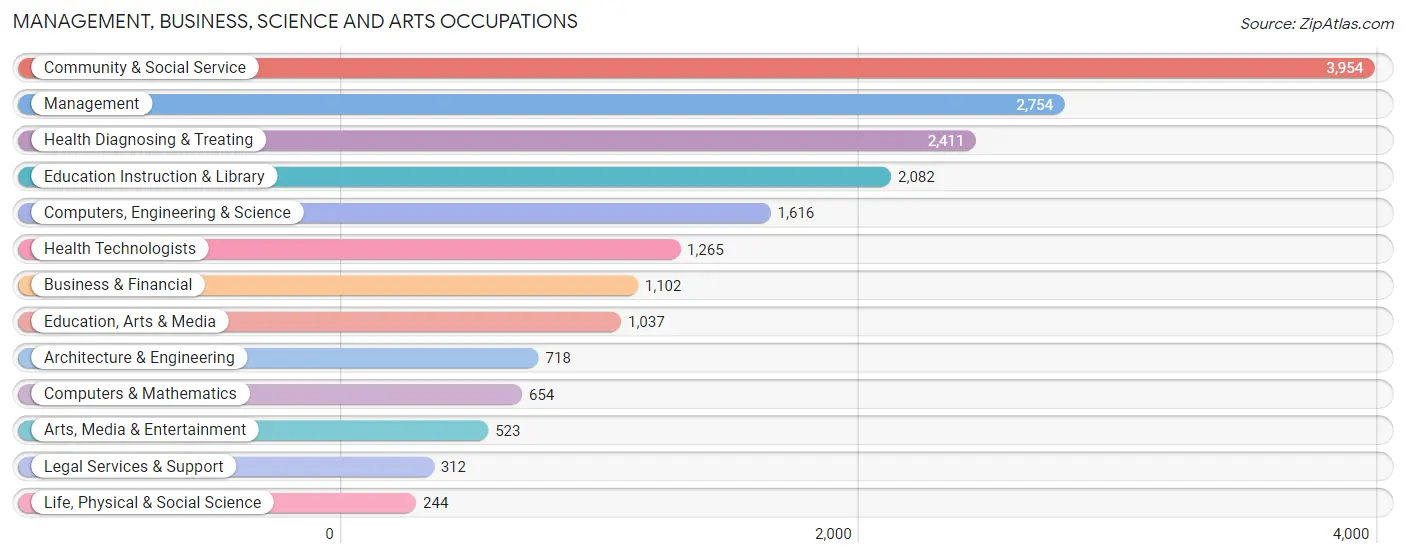
Management, Business, Science and Arts Occupations
The most common Management, Business, Science and Arts occupations in New Bedford are Community & Social Service (3,954 | 8.5%), Management (2,754 | 5.9%), Health Diagnosing & Treating (2,411 | 5.2%), Education Instruction & Library (2,082 | 4.5%), and Computers, Engineering & Science (1,616 | 3.5%).
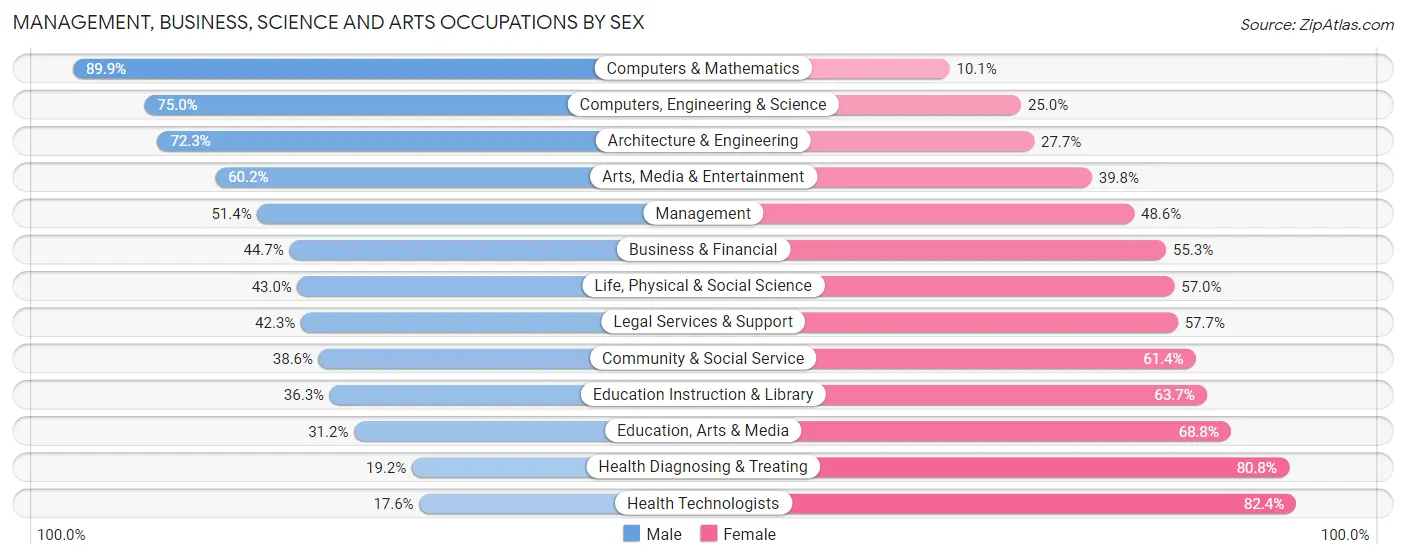
Management, Business, Science and Arts Occupations by Sex
Within the Management, Business, Science and Arts occupations in New Bedford, the most male-oriented occupations are Computers & Mathematics (89.9%), Computers, Engineering & Science (75.0%), and Architecture & Engineering (72.3%), while the most female-oriented occupations are Health Technologists (82.4%), Health Diagnosing & Treating (80.8%), and Education, Arts & Media (68.8%).
| Occupation | Male | Female |
| Management | 1,416 (51.4%) | 1,338 (48.6%) |
| Business & Financial | 493 (44.7%) | 609 (55.3%) |
| Computers, Engineering & Science | 1,212 (75.0%) | 404 (25.0%) |
| Computers & Mathematics | 588 (89.9%) | 66 (10.1%) |
| Architecture & Engineering | 519 (72.3%) | 199 (27.7%) |
| Life, Physical & Social Science | 105 (43.0%) | 139 (57.0%) |
| Community & Social Service | 1,527 (38.6%) | 2,427 (61.4%) |
| Education, Arts & Media | 324 (31.2%) | 713 (68.8%) |
| Legal Services & Support | 132 (42.3%) | 180 (57.7%) |
| Education Instruction & Library | 756 (36.3%) | 1,326 (63.7%) |
| Arts, Media & Entertainment | 315 (60.2%) | 208 (39.8%) |
| Health Diagnosing & Treating | 462 (19.2%) | 1,949 (80.8%) |
| Health Technologists | 223 (17.6%) | 1,042 (82.4%) |
| Total (Category) | 5,110 (43.2%) | 6,727 (56.8%) |
| Total (Overall) | 24,289 (52.4%) | 22,050 (47.6%) |
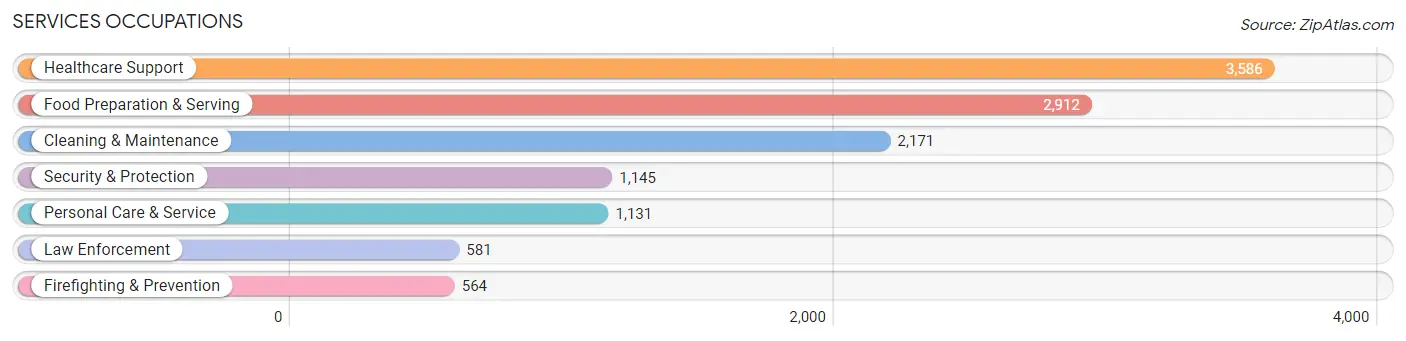
Services Occupations
The most common Services occupations in New Bedford are Healthcare Support (3,586 | 7.7%), Food Preparation & Serving (2,912 | 6.3%), Cleaning & Maintenance (2,171 | 4.7%), Security & Protection (1,145 | 2.5%), and Personal Care & Service (1,131 | 2.4%).
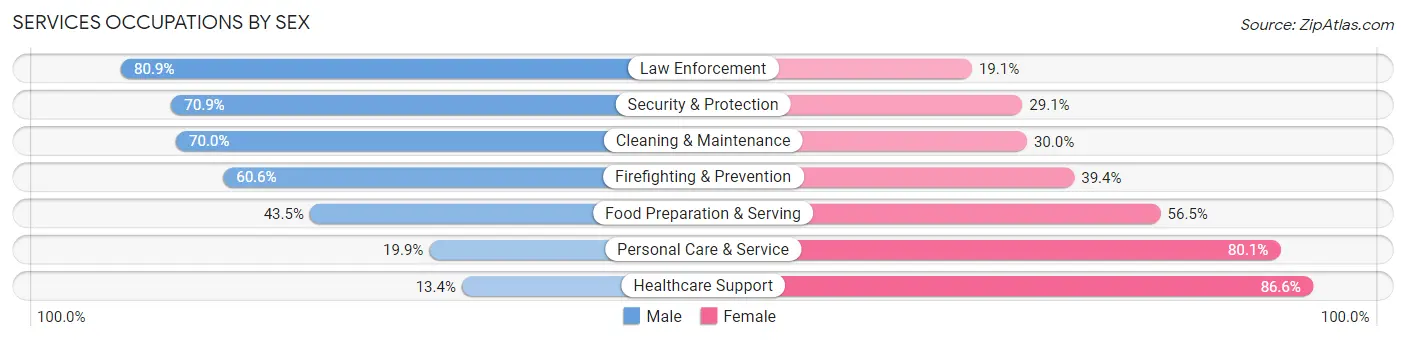
Services Occupations by Sex
Within the Services occupations in New Bedford, the most male-oriented occupations are Law Enforcement (80.9%), Security & Protection (70.9%), and Cleaning & Maintenance (70.0%), while the most female-oriented occupations are Healthcare Support (86.6%), Personal Care & Service (80.1%), and Food Preparation & Serving (56.5%).
| Occupation | Male | Female |
| Healthcare Support | 482 (13.4%) | 3,104 (86.6%) |
| Security & Protection | 812 (70.9%) | 333 (29.1%) |
| Firefighting & Prevention | 342 (60.6%) | 222 (39.4%) |
| Law Enforcement | 470 (80.9%) | 111 (19.1%) |
| Food Preparation & Serving | 1,268 (43.5%) | 1,644 (56.5%) |
| Cleaning & Maintenance | 1,520 (70.0%) | 651 (30.0%) |
| Personal Care & Service | 225 (19.9%) | 906 (80.1%) |
| Total (Category) | 4,307 (39.4%) | 6,638 (60.7%) |
| Total (Overall) | 24,289 (52.4%) | 22,050 (47.6%) |
Sales and Office Occupations
The most common Sales and Office occupations in New Bedford are Office & Administration (4,749 | 10.2%), and Sales & Related (4,562 | 9.8%).

Sales and Office Occupations by Sex
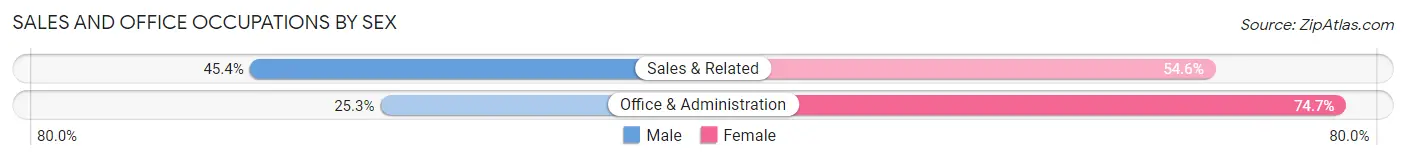
| Occupation | Male | Female |
| Sales & Related | 2,071 (45.4%) | 2,491 (54.6%) |
| Office & Administration | 1,201 (25.3%) | 3,548 (74.7%) |
| Total (Category) | 3,272 (35.1%) | 6,039 (64.9%) |
| Total (Overall) | 24,289 (52.4%) | 22,050 (47.6%) |
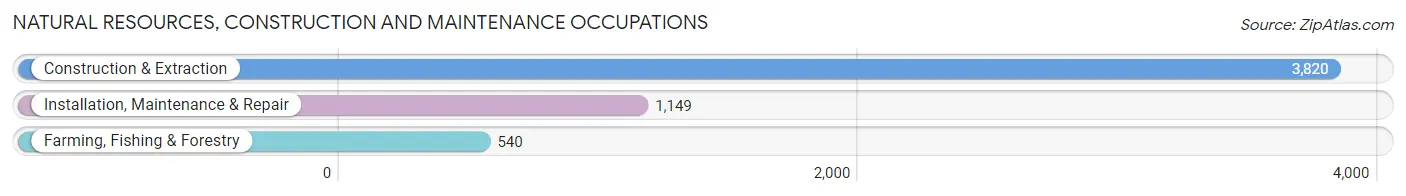
Natural Resources, Construction and Maintenance Occupations
The most common Natural Resources, Construction and Maintenance occupations in New Bedford are Construction & Extraction (3,820 | 8.2%), Installation, Maintenance & Repair (1,149 | 2.5%), and Farming, Fishing & Forestry (540 | 1.2%).
Natural Resources, Construction and Maintenance Occupations by Sex
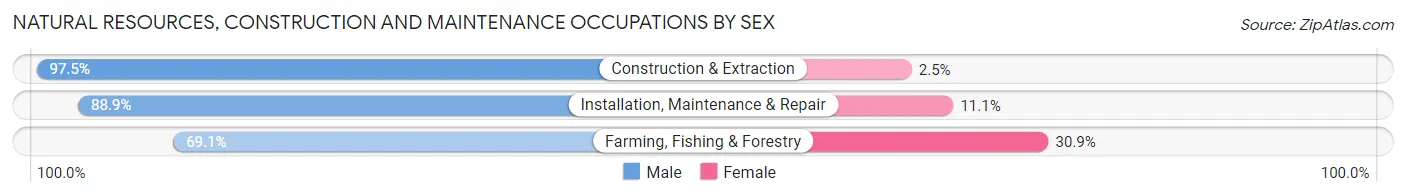
| Occupation | Male | Female |
| Farming, Fishing & Forestry | 373 (69.1%) | 167 (30.9%) |
| Construction & Extraction | 3,725 (97.5%) | 95 (2.5%) |
| Installation, Maintenance & Repair | 1,021 (88.9%) | 128 (11.1%) |
| Total (Category) | 5,119 (92.9%) | 390 (7.1%) |
| Total (Overall) | 24,289 (52.4%) | 22,050 (47.6%) |
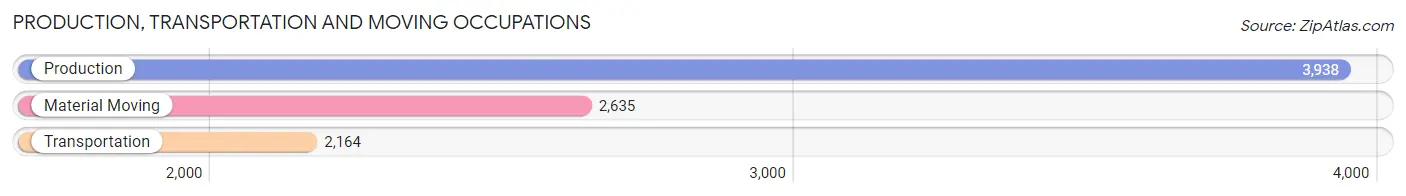
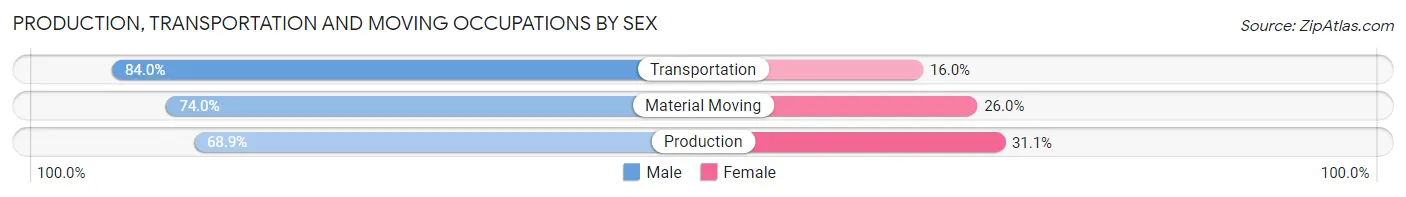
Production, Transportation and Moving Occupations
The most common Production, Transportation and Moving occupations in New Bedford are Production (3,938 | 8.5%), Material Moving (2,635 | 5.7%), and Transportation (2,164 | 4.7%).
Production, Transportation and Moving Occupations by Sex
| Occupation | Male | Female |
| Production | 2,714 (68.9%) | 1,224 (31.1%) |
| Transportation | 1,817 (84.0%) | 347 (16.0%) |
| Material Moving | 1,950 (74.0%) | 685 (26.0%) |
| Total (Category) | 6,481 (74.2%) | 2,256 (25.8%) |
| Total (Overall) | 24,289 (52.4%) | 22,050 (47.6%) |
Employment Industries by Sex in New Bedford
Employment Industries in New Bedford
The major employment industries in New Bedford include Health Care & Social Assistance (8,948 | 19.3%), Retail Trade (6,283 | 13.6%), Manufacturing (5,069 | 10.9%), Construction (4,205 | 9.1%), and Accommodation & Food Services (3,650 | 7.9%).

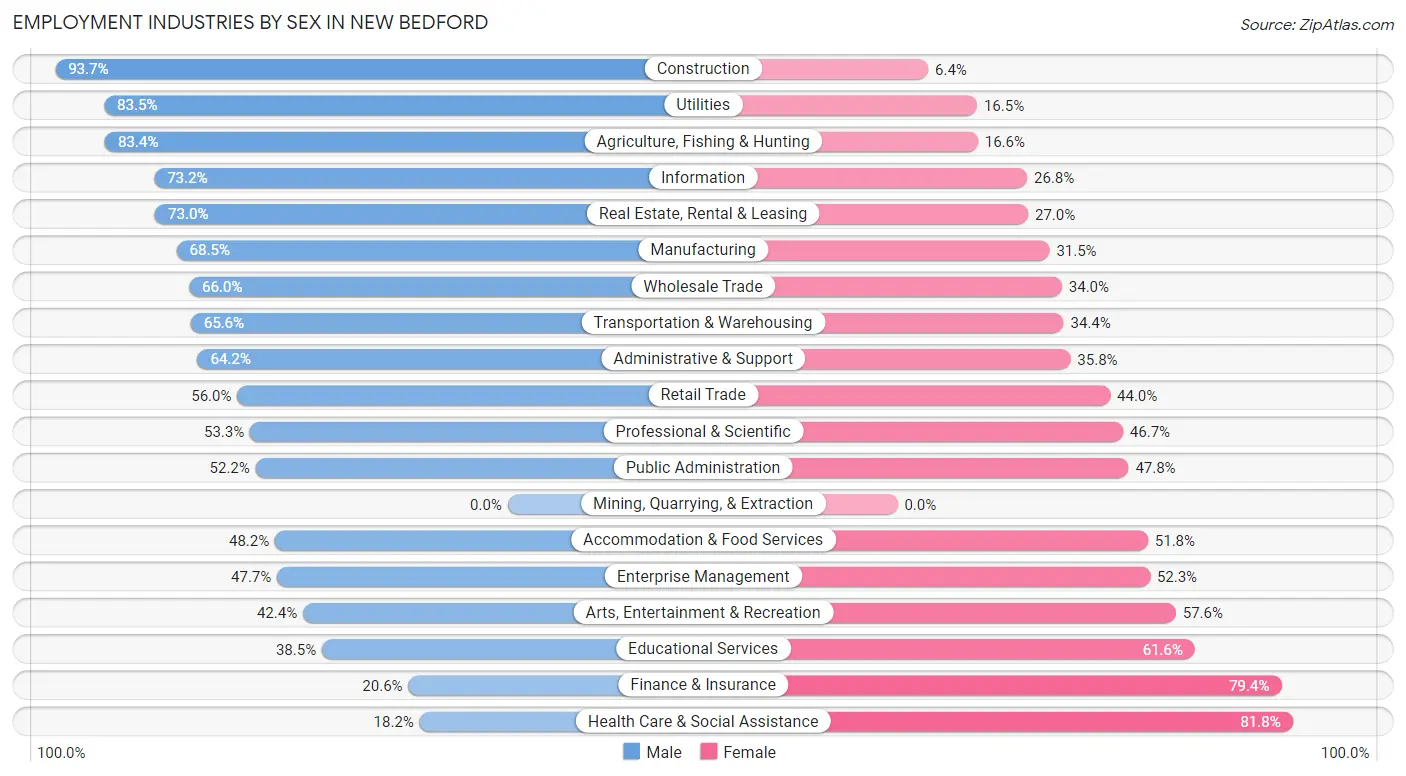
Employment Industries by Sex in New Bedford
The New Bedford industries that see more men than women are Construction (93.6%), Utilities (83.5%), and Agriculture, Fishing & Hunting (83.4%), whereas the industries that tend to have a higher number of women are Health Care & Social Assistance (81.8%), Finance & Insurance (79.4%), and Educational Services (61.6%).
| Industry | Male | Female |
| Agriculture, Fishing & Hunting | 521 (83.4%) | 104 (16.6%) |
| Mining, Quarrying, & Extraction | 0 (0.0%) | 0 (0.0%) |
| Construction | 3,938 (93.6%) | 267 (6.4%) |
| Manufacturing | 3,474 (68.5%) | 1,595 (31.5%) |
| Wholesale Trade | 1,083 (66.0%) | 559 (34.0%) |
| Retail Trade | 3,517 (56.0%) | 2,766 (44.0%) |
| Transportation & Warehousing | 1,598 (65.6%) | 838 (34.4%) |
| Utilities | 208 (83.5%) | 41 (16.5%) |
| Information | 477 (73.2%) | 175 (26.8%) |
| Finance & Insurance | 226 (20.6%) | 873 (79.4%) |
| Real Estate, Rental & Leasing | 332 (73.0%) | 123 (27.0%) |
| Professional & Scientific | 760 (53.3%) | 665 (46.7%) |
| Enterprise Management | 42 (47.7%) | 46 (52.3%) |
| Administrative & Support | 1,289 (64.2%) | 719 (35.8%) |
| Educational Services | 1,217 (38.5%) | 1,948 (61.6%) |
| Health Care & Social Assistance | 1,631 (18.2%) | 7,317 (81.8%) |
| Arts, Entertainment & Recreation | 339 (42.4%) | 461 (57.6%) |
| Accommodation & Food Services | 1,758 (48.2%) | 1,892 (51.8%) |
| Public Administration | 743 (52.2%) | 681 (47.8%) |
| Total | 24,289 (52.4%) | 22,050 (47.6%) |
Education in New Bedford
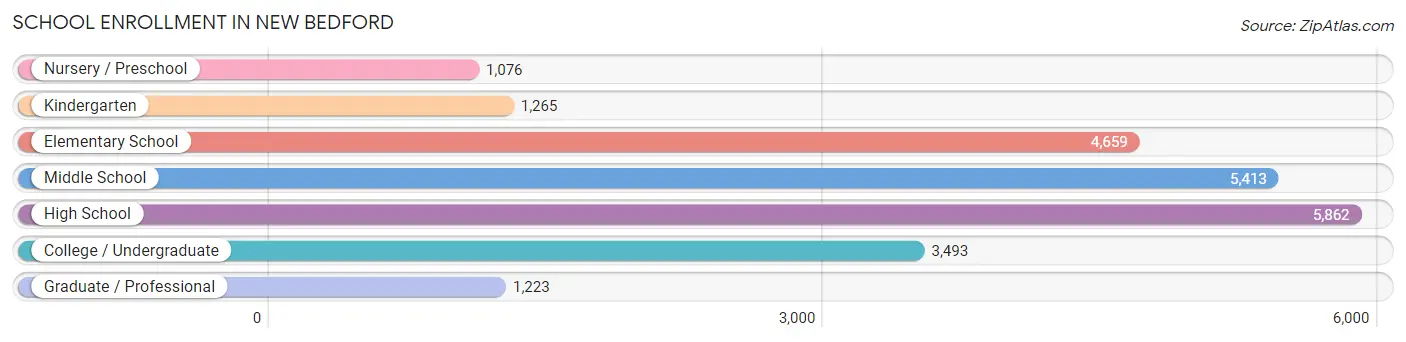
School Enrollment in New Bedford
The most common levels of schooling among the 22,991 students in New Bedford are high school (5,862 | 25.5%), middle school (5,413 | 23.5%), and elementary school (4,659 | 20.3%).
| School Level | # Students | % Students |
| Nursery / Preschool | 1,076 | 4.7% |
| Kindergarten | 1,265 | 5.5% |
| Elementary School | 4,659 | 20.3% |
| Middle School | 5,413 | 23.5% |
| High School | 5,862 | 25.5% |
| College / Undergraduate | 3,493 | 15.2% |
| Graduate / Professional | 1,223 | 5.3% |
| Total | 22,991 | 100.0% |
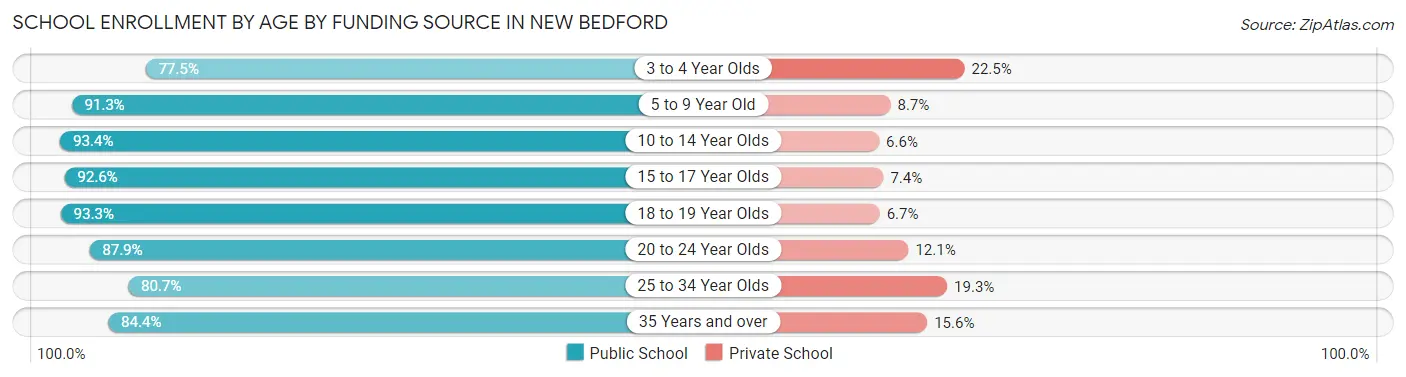
School Enrollment by Age by Funding Source in New Bedford
Out of a total of 22,991 students who are enrolled in schools in New Bedford, 2,184 (9.5%) attend a private institution, while the remaining 20,807 (90.5%) are enrolled in public schools. The age group of 3 to 4 year olds has the highest likelihood of being enrolled in private schools, with 182 (22.5% in the age bracket) enrolled. Conversely, the age group of 10 to 14 year olds has the lowest likelihood of being enrolled in a private school, with 5,859 (93.4% in the age bracket) attending a public institution.
| Age Bracket | Public School | Private School |
| 3 to 4 Year Olds | 626 (77.5%) | 182 (22.5%) |
| 5 to 9 Year Old | 5,167 (91.3%) | 494 (8.7%) |
| 10 to 14 Year Olds | 5,859 (93.4%) | 415 (6.6%) |
| 15 to 17 Year Olds | 3,953 (92.6%) | 317 (7.4%) |
| 18 to 19 Year Olds | 1,432 (93.3%) | 103 (6.7%) |
| 20 to 24 Year Olds | 1,595 (87.9%) | 219 (12.1%) |
| 25 to 34 Year Olds | 1,038 (80.7%) | 248 (19.3%) |
| 35 Years and over | 1,134 (84.4%) | 209 (15.6%) |
| Total | 20,807 (90.5%) | 2,184 (9.5%) |
Educational Attainment by Field of Study in New Bedford
Business (1,909 | 16.0%), science & technology (1,538 | 12.9%), social sciences (1,373 | 11.5%), education (1,200 | 10.0%), and psychology (929 | 7.8%) are the most common fields of study among 11,969 individuals in New Bedford who have obtained a bachelor's degree or higher.
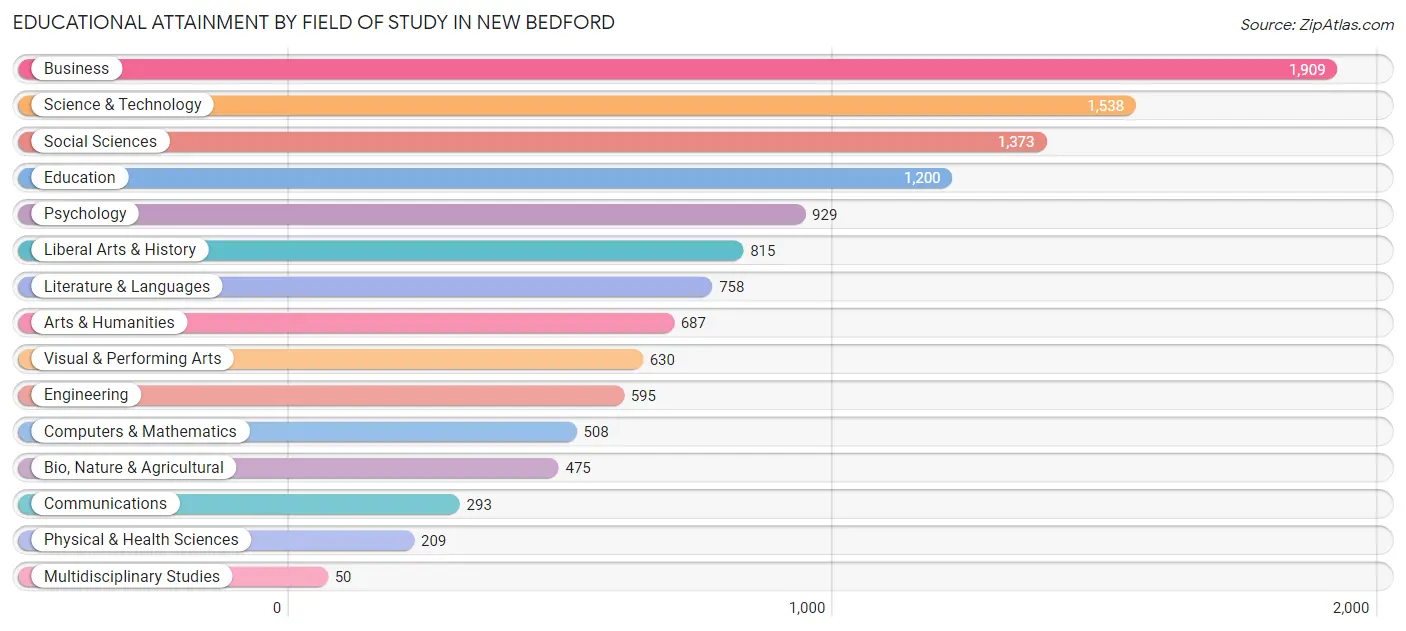
| Field of Study | # Graduates | % Graduates |
| Computers & Mathematics | 508 | 4.2% |
| Bio, Nature & Agricultural | 475 | 4.0% |
| Physical & Health Sciences | 209 | 1.8% |
| Psychology | 929 | 7.8% |
| Social Sciences | 1,373 | 11.5% |
| Engineering | 595 | 5.0% |
| Multidisciplinary Studies | 50 | 0.4% |
| Science & Technology | 1,538 | 12.9% |
| Business | 1,909 | 16.0% |
| Education | 1,200 | 10.0% |
| Literature & Languages | 758 | 6.3% |
| Liberal Arts & History | 815 | 6.8% |
| Visual & Performing Arts | 630 | 5.3% |
| Communications | 293 | 2.5% |
| Arts & Humanities | 687 | 5.7% |
| Total | 11,969 | 100.0% |
Transportation & Commute in New Bedford
Vehicle Availability by Sex in New Bedford
The most prevalent vehicle ownership categories in New Bedford are males with 2 vehicles (8,846, accounting for 37.2%) and females with 2 vehicles (8,110, making up 40.9%).
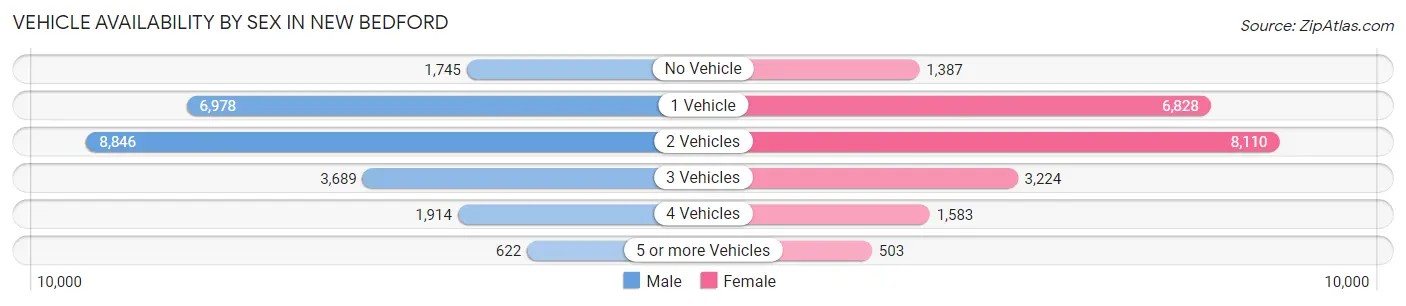
| Vehicles Available | Male | Female |
| No Vehicle | 1,745 (7.3%) | 1,387 (6.4%) |
| 1 Vehicle | 6,978 (29.3%) | 6,828 (31.6%) |
| 2 Vehicles | 8,846 (37.2%) | 8,110 (37.5%) |
| 3 Vehicles | 3,689 (15.5%) | 3,224 (14.9%) |
| 4 Vehicles | 1,914 (8.0%) | 1,583 (7.3%) |
| 5 or more Vehicles | 622 (2.6%) | 503 (2.3%) |
| Total | 23,794 (100.0%) | 21,635 (100.0%) |
Commute Time in New Bedford
The most frequently occuring commute durations in New Bedford are 15 to 19 minutes (8,199 commuters, 18.8%), 10 to 14 minutes (7,697 commuters, 17.7%), and 20 to 24 minutes (5,280 commuters, 12.1%).
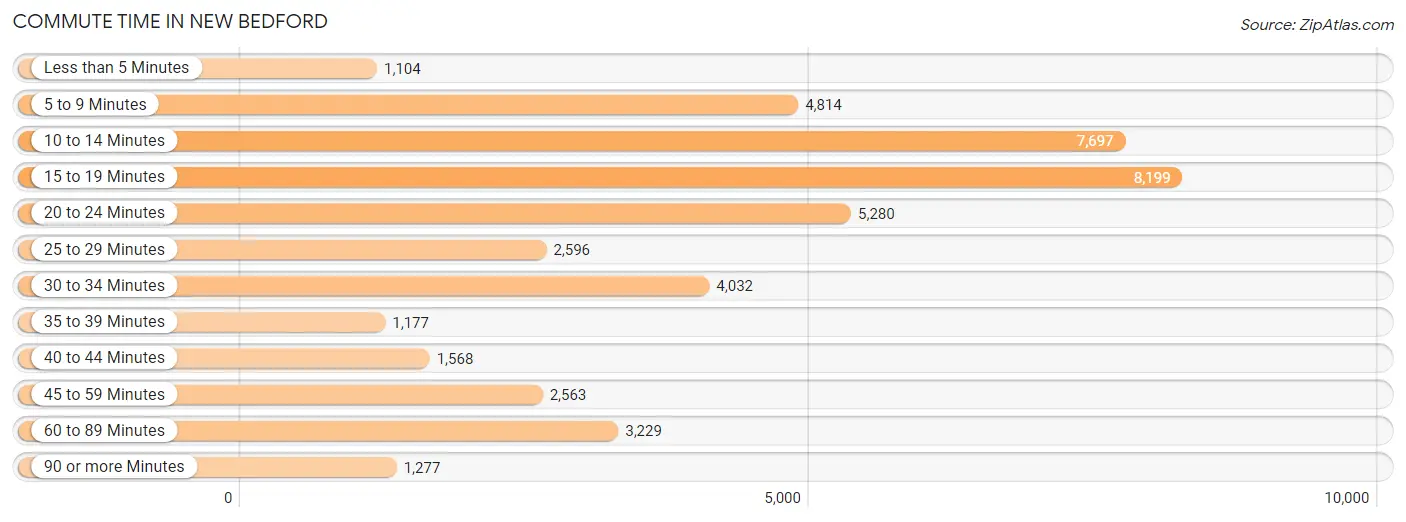
| Commute Time | # Commuters | % Commuters |
| Less than 5 Minutes | 1,104 | 2.5% |
| 5 to 9 Minutes | 4,814 | 11.1% |
| 10 to 14 Minutes | 7,697 | 17.7% |
| 15 to 19 Minutes | 8,199 | 18.8% |
| 20 to 24 Minutes | 5,280 | 12.1% |
| 25 to 29 Minutes | 2,596 | 6.0% |
| 30 to 34 Minutes | 4,032 | 9.3% |
| 35 to 39 Minutes | 1,177 | 2.7% |
| 40 to 44 Minutes | 1,568 | 3.6% |
| 45 to 59 Minutes | 2,563 | 5.9% |
| 60 to 89 Minutes | 3,229 | 7.4% |
| 90 or more Minutes | 1,277 | 2.9% |
Commute Time by Sex in New Bedford
The most common commute times in New Bedford are 10 to 14 minutes (3,698 commuters, 16.2%) for males and 15 to 19 minutes (4,589 commuters, 22.2%) for females.
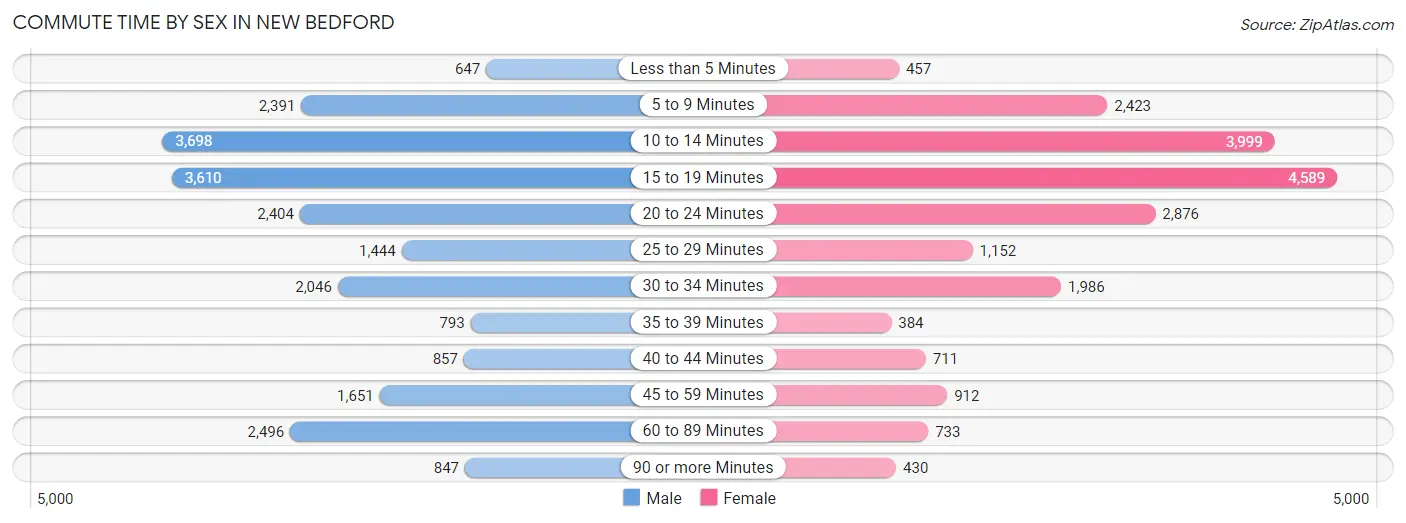
| Commute Time | Male | Female |
| Less than 5 Minutes | 647 (2.8%) | 457 (2.2%) |
| 5 to 9 Minutes | 2,391 (10.4%) | 2,423 (11.7%) |
| 10 to 14 Minutes | 3,698 (16.2%) | 3,999 (19.4%) |
| 15 to 19 Minutes | 3,610 (15.8%) | 4,589 (22.2%) |
| 20 to 24 Minutes | 2,404 (10.5%) | 2,876 (13.9%) |
| 25 to 29 Minutes | 1,444 (6.3%) | 1,152 (5.6%) |
| 30 to 34 Minutes | 2,046 (8.9%) | 1,986 (9.6%) |
| 35 to 39 Minutes | 793 (3.5%) | 384 (1.9%) |
| 40 to 44 Minutes | 857 (3.7%) | 711 (3.4%) |
| 45 to 59 Minutes | 1,651 (7.2%) | 912 (4.4%) |
| 60 to 89 Minutes | 2,496 (10.9%) | 733 (3.5%) |
| 90 or more Minutes | 847 (3.7%) | 430 (2.1%) |
Time of Departure to Work by Sex in New Bedford
The most frequent times of departure to work in New Bedford are 7:00 AM to 7:29 AM (3,195, 14.0%) for males and 7:00 AM to 7:29 AM (2,996, 14.5%) for females.
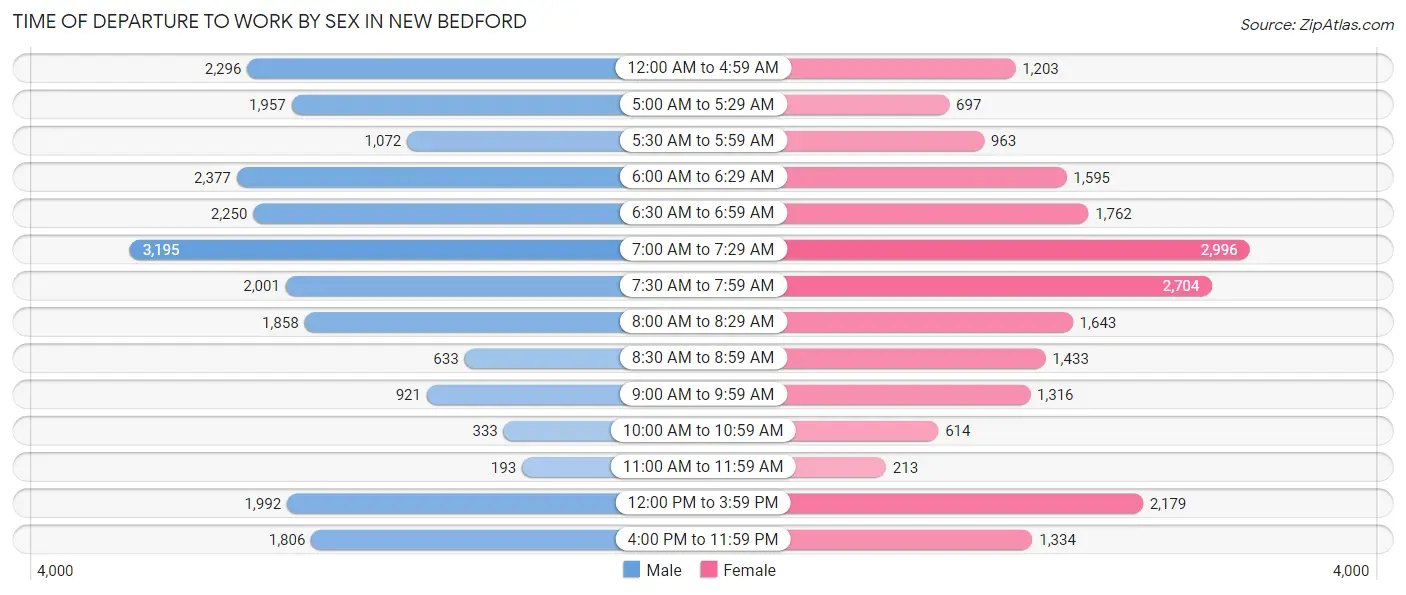
| Time of Departure | Male | Female |
| 12:00 AM to 4:59 AM | 2,296 (10.0%) | 1,203 (5.8%) |
| 5:00 AM to 5:29 AM | 1,957 (8.6%) | 697 (3.4%) |
| 5:30 AM to 5:59 AM | 1,072 (4.7%) | 963 (4.7%) |
| 6:00 AM to 6:29 AM | 2,377 (10.4%) | 1,595 (7.7%) |
| 6:30 AM to 6:59 AM | 2,250 (9.8%) | 1,762 (8.5%) |
| 7:00 AM to 7:29 AM | 3,195 (14.0%) | 2,996 (14.5%) |
| 7:30 AM to 7:59 AM | 2,001 (8.7%) | 2,704 (13.1%) |
| 8:00 AM to 8:29 AM | 1,858 (8.1%) | 1,643 (8.0%) |
| 8:30 AM to 8:59 AM | 633 (2.8%) | 1,433 (6.9%) |
| 9:00 AM to 9:59 AM | 921 (4.0%) | 1,316 (6.4%) |
| 10:00 AM to 10:59 AM | 333 (1.5%) | 614 (3.0%) |
| 11:00 AM to 11:59 AM | 193 (0.8%) | 213 (1.0%) |
| 12:00 PM to 3:59 PM | 1,992 (8.7%) | 2,179 (10.5%) |
| 4:00 PM to 11:59 PM | 1,806 (7.9%) | 1,334 (6.5%) |
| Total | 22,884 (100.0%) | 20,652 (100.0%) |
Housing Occupancy in New Bedford
Occupancy by Ownership in New Bedford
Of the total 41,722 dwellings in New Bedford, owner-occupied units account for 16,644 (39.9%), while renter-occupied units make up 25,078 (60.1%).
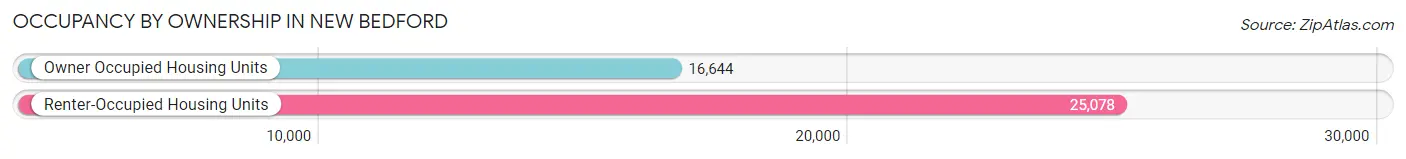
| Occupancy | # Housing Units | % Housing Units |
| Owner Occupied Housing Units | 16,644 | 39.9% |
| Renter-Occupied Housing Units | 25,078 | 60.1% |
| Total Occupied Housing Units | 41,722 | 100.0% |
Occupancy by Household Size in New Bedford
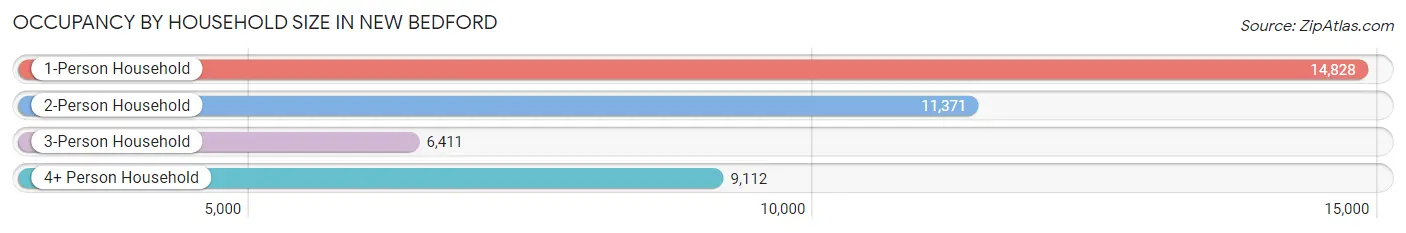
| Household Size | # Housing Units | % Housing Units |
| 1-Person Household | 14,828 | 35.5% |
| 2-Person Household | 11,371 | 27.3% |
| 3-Person Household | 6,411 | 15.4% |
| 4+ Person Household | 9,112 | 21.8% |
| Total Housing Units | 41,722 | 100.0% |
Occupancy by Ownership by Household Size in New Bedford
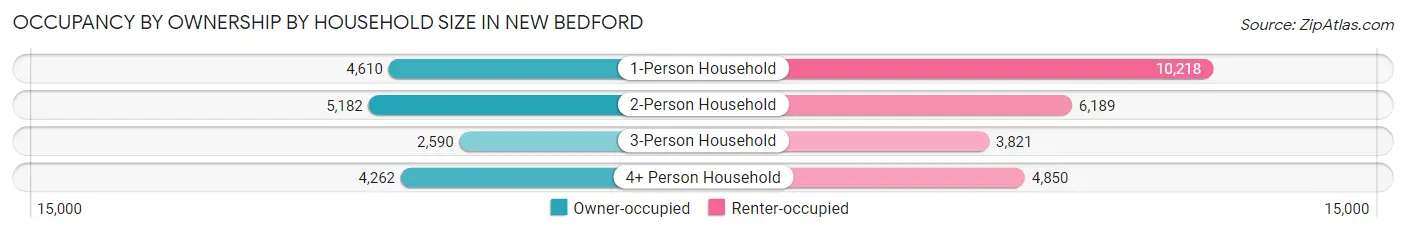
| Household Size | Owner-occupied | Renter-occupied |
| 1-Person Household | 4,610 (31.1%) | 10,218 (68.9%) |
| 2-Person Household | 5,182 (45.6%) | 6,189 (54.4%) |
| 3-Person Household | 2,590 (40.4%) | 3,821 (59.6%) |
| 4+ Person Household | 4,262 (46.8%) | 4,850 (53.2%) |
| Total Housing Units | 16,644 (39.9%) | 25,078 (60.1%) |
Occupancy by Educational Attainment in New Bedford
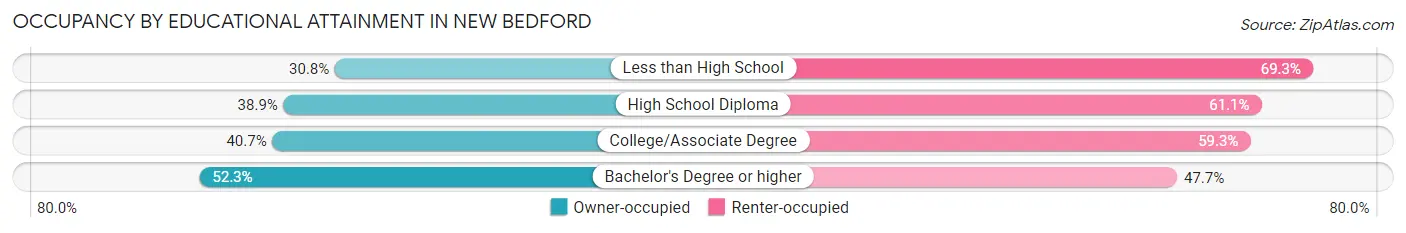
| Household Size | Owner-occupied | Renter-occupied |
| Less than High School | 2,849 (30.7%) | 6,416 (69.3%) |
| High School Diploma | 5,415 (38.9%) | 8,502 (61.1%) |
| College/Associate Degree | 4,603 (40.7%) | 6,712 (59.3%) |
| Bachelor's Degree or higher | 3,777 (52.3%) | 3,448 (47.7%) |
Occupancy by Age of Householder in New Bedford
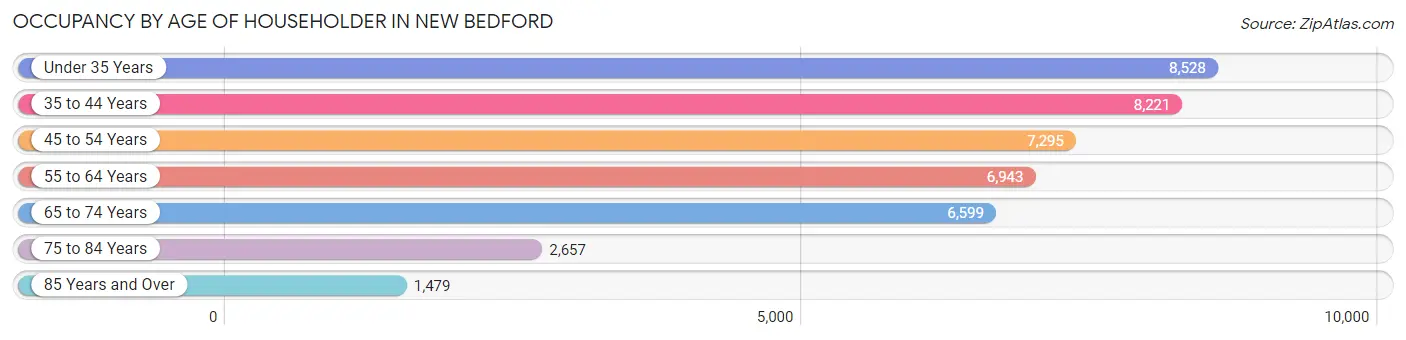
| Age Bracket | # Households | % Households |
| Under 35 Years | 8,528 | 20.4% |
| 35 to 44 Years | 8,221 | 19.7% |
| 45 to 54 Years | 7,295 | 17.5% |
| 55 to 64 Years | 6,943 | 16.6% |
| 65 to 74 Years | 6,599 | 15.8% |
| 75 to 84 Years | 2,657 | 6.4% |
| 85 Years and Over | 1,479 | 3.5% |
| Total | 41,722 | 100.0% |
Housing Finances in New Bedford
Median Income by Occupancy in New Bedford
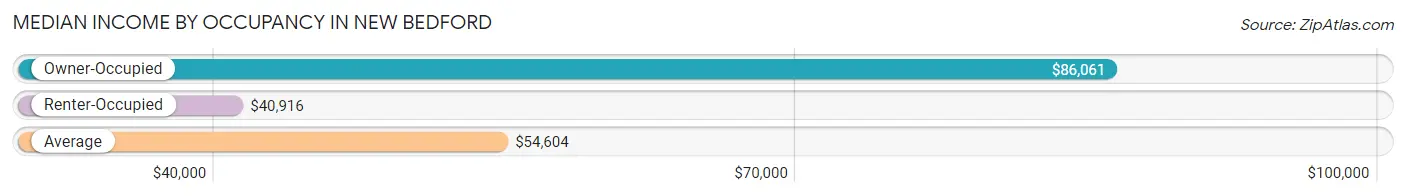
| Occupancy Type | # Households | Median Income |
| Owner-Occupied | 16,644 (39.9%) | $86,061 |
| Renter-Occupied | 25,078 (60.1%) | $40,916 |
| Average | 41,722 (100.0%) | $54,604 |
Occupancy by Householder Income Bracket in New Bedford
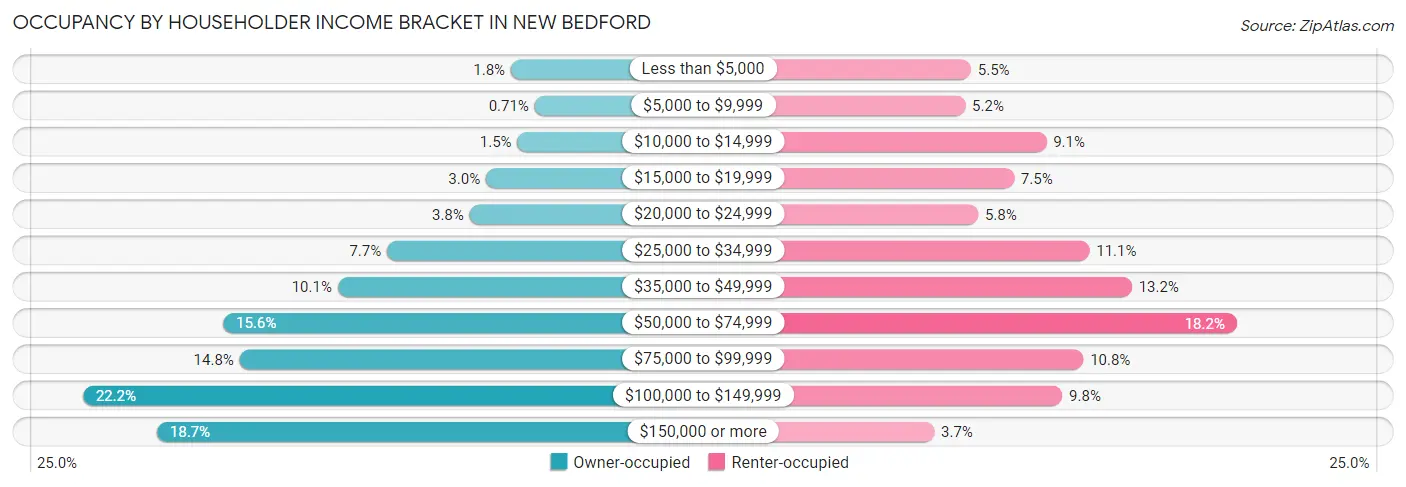
| Income Bracket | Owner-occupied | Renter-occupied |
| Less than $5,000 | 306 (1.8%) | 1,376 (5.5%) |
| $5,000 to $9,999 | 119 (0.7%) | 1,309 (5.2%) |
| $10,000 to $14,999 | 255 (1.5%) | 2,277 (9.1%) |
| $15,000 to $19,999 | 505 (3.0%) | 1,890 (7.5%) |
| $20,000 to $24,999 | 634 (3.8%) | 1,463 (5.8%) |
| $25,000 to $34,999 | 1,288 (7.7%) | 2,790 (11.1%) |
| $35,000 to $49,999 | 1,680 (10.1%) | 3,297 (13.2%) |
| $50,000 to $74,999 | 2,588 (15.5%) | 4,551 (18.1%) |
| $75,000 to $99,999 | 2,457 (14.8%) | 2,719 (10.8%) |
| $100,000 to $149,999 | 3,700 (22.2%) | 2,468 (9.8%) |
| $150,000 or more | 3,112 (18.7%) | 938 (3.7%) |
| Total | 16,644 (100.0%) | 25,078 (100.0%) |
Monthly Housing Cost Tiers in New Bedford
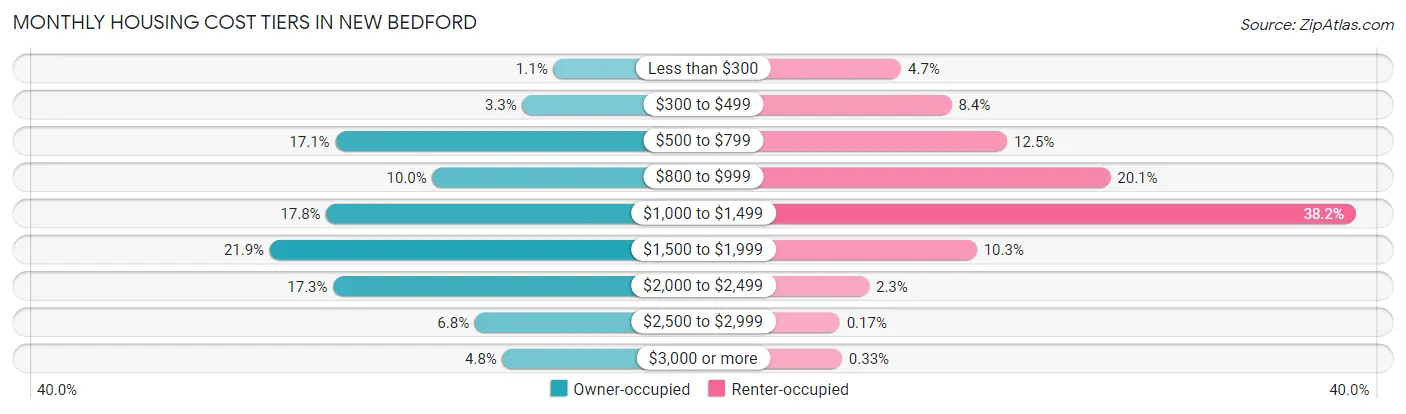
| Monthly Cost | Owner-occupied | Renter-occupied |
| Less than $300 | 174 (1.1%) | 1,176 (4.7%) |
| $300 to $499 | 553 (3.3%) | 2,107 (8.4%) |
| $500 to $799 | 2,847 (17.1%) | 3,134 (12.5%) |
| $800 to $999 | 1,656 (10.0%) | 5,041 (20.1%) |
| $1,000 to $1,499 | 2,958 (17.8%) | 9,573 (38.2%) |
| $1,500 to $1,999 | 3,650 (21.9%) | 2,573 (10.3%) |
| $2,000 to $2,499 | 2,873 (17.3%) | 584 (2.3%) |
| $2,500 to $2,999 | 1,136 (6.8%) | 42 (0.2%) |
| $3,000 or more | 797 (4.8%) | 84 (0.3%) |
| Total | 16,644 (100.0%) | 25,078 (100.0%) |
Physical Housing Characteristics in New Bedford
Housing Structures in New Bedford
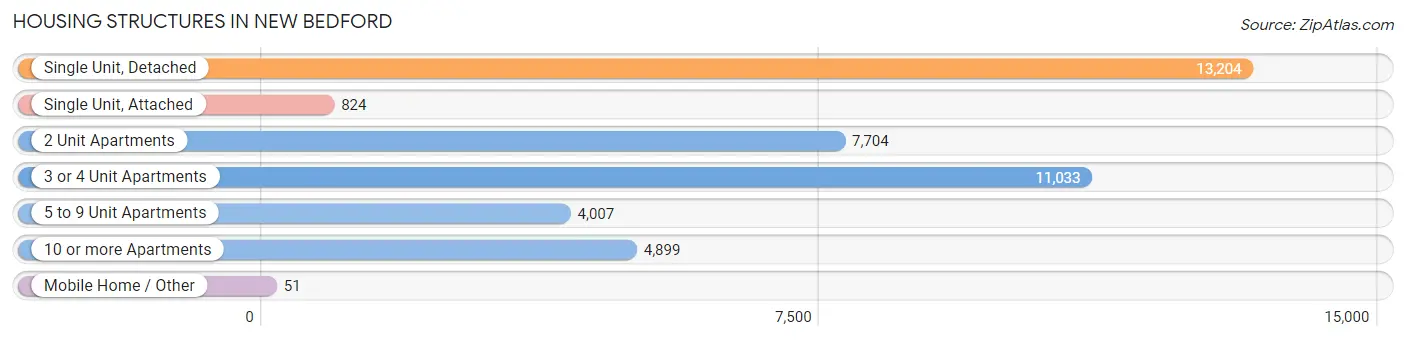
| Structure Type | # Housing Units | % Housing Units |
| Single Unit, Detached | 13,204 | 31.7% |
| Single Unit, Attached | 824 | 2.0% |
| 2 Unit Apartments | 7,704 | 18.5% |
| 3 or 4 Unit Apartments | 11,033 | 26.4% |
| 5 to 9 Unit Apartments | 4,007 | 9.6% |
| 10 or more Apartments | 4,899 | 11.7% |
| Mobile Home / Other | 51 | 0.1% |
| Total | 41,722 | 100.0% |
Housing Structures by Occupancy in New Bedford
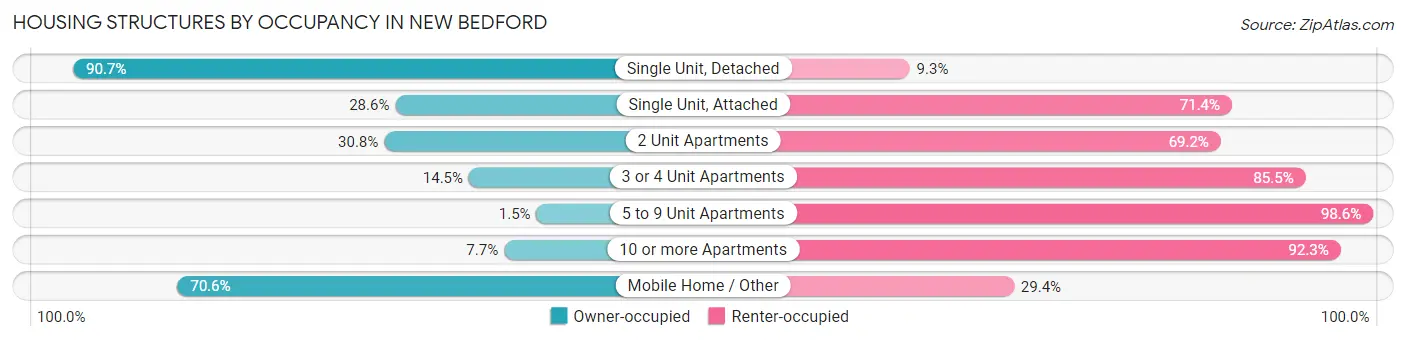
| Structure Type | Owner-occupied | Renter-occupied |
| Single Unit, Detached | 11,971 (90.7%) | 1,233 (9.3%) |
| Single Unit, Attached | 236 (28.6%) | 588 (71.4%) |
| 2 Unit Apartments | 2,371 (30.8%) | 5,333 (69.2%) |
| 3 or 4 Unit Apartments | 1,595 (14.5%) | 9,438 (85.5%) |
| 5 to 9 Unit Apartments | 58 (1.5%) | 3,949 (98.6%) |
| 10 or more Apartments | 377 (7.7%) | 4,522 (92.3%) |
| Mobile Home / Other | 36 (70.6%) | 15 (29.4%) |
| Total | 16,644 (39.9%) | 25,078 (60.1%) |
Housing Structures by Number of Rooms in New Bedford
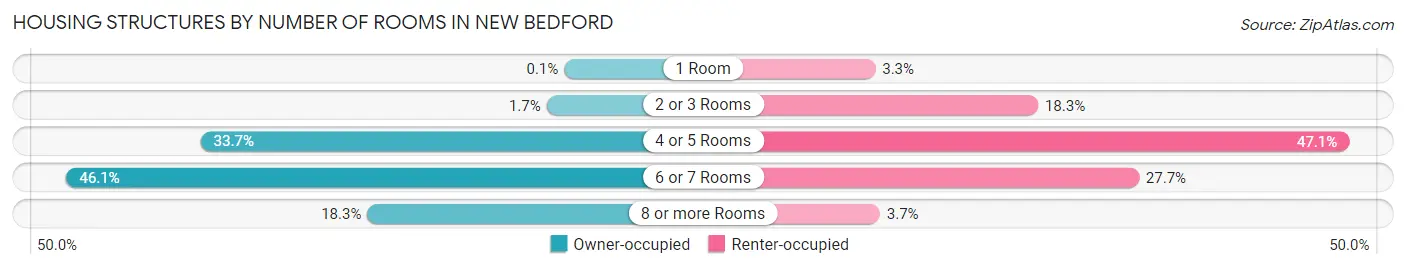
| Number of Rooms | Owner-occupied | Renter-occupied |
| 1 Room | 17 (0.1%) | 819 (3.3%) |
| 2 or 3 Rooms | 288 (1.7%) | 4,594 (18.3%) |
| 4 or 5 Rooms | 5,613 (33.7%) | 11,806 (47.1%) |
| 6 or 7 Rooms | 7,678 (46.1%) | 6,933 (27.7%) |
| 8 or more Rooms | 3,048 (18.3%) | 926 (3.7%) |
| Total | 16,644 (100.0%) | 25,078 (100.0%) |
Housing Structure by Heating Type in New Bedford
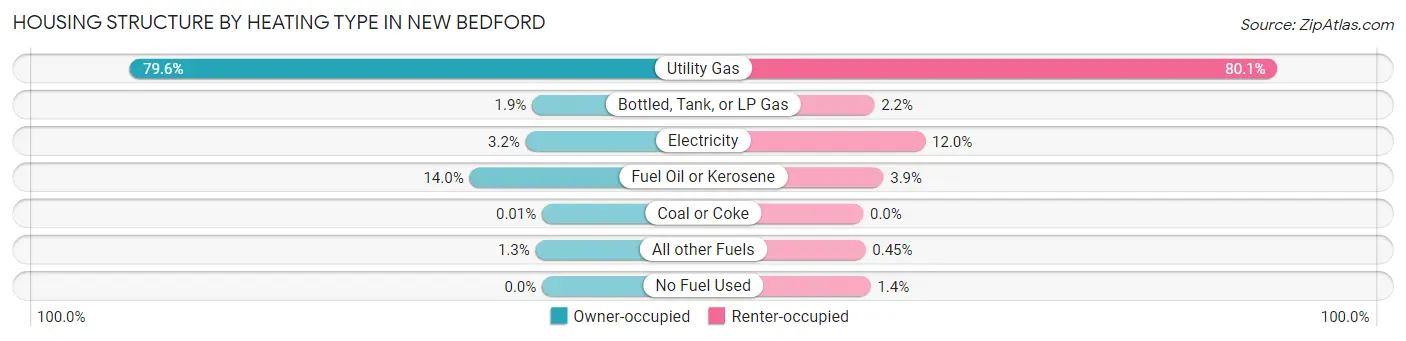
| Heating Type | Owner-occupied | Renter-occupied |
| Utility Gas | 13,252 (79.6%) | 20,075 (80.0%) |
| Bottled, Tank, or LP Gas | 319 (1.9%) | 545 (2.2%) |
| Electricity | 528 (3.2%) | 3,006 (12.0%) |
| Fuel Oil or Kerosene | 2,335 (14.0%) | 980 (3.9%) |
| Coal or Coke | 1 (0.0%) | 0 (0.0%) |
| All other Fuels | 209 (1.3%) | 114 (0.4%) |
| No Fuel Used | 0 (0.0%) | 358 (1.4%) |
| Total | 16,644 (100.0%) | 25,078 (100.0%) |
Household Vehicle Usage in New Bedford
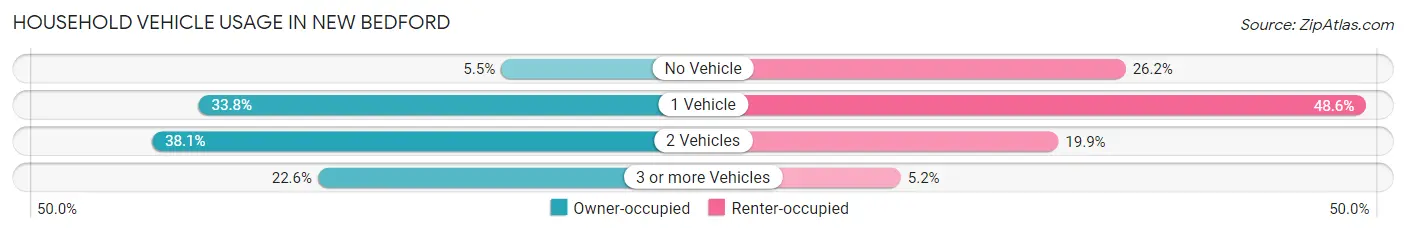
| Vehicles per Household | Owner-occupied | Renter-occupied |
| No Vehicle | 920 (5.5%) | 6,572 (26.2%) |
| 1 Vehicle | 5,617 (33.8%) | 12,198 (48.6%) |
| 2 Vehicles | 6,340 (38.1%) | 4,998 (19.9%) |
| 3 or more Vehicles | 3,767 (22.6%) | 1,310 (5.2%) |
| Total | 16,644 (100.0%) | 25,078 (100.0%) |
Real Estate & Mortgages in New Bedford
Real Estate and Mortgage Overview in New Bedford
| Characteristic | Without Mortgage | With Mortgage |
| Housing Units | 5,756 | 10,888 |
| Median Property Value | $279,800 | $296,600 |
| Median Household Income | $55,391 | $2,586 |
| Monthly Housing Costs | $758 | $781 |
| Real Estate Taxes | $4,103 | $277 |
Property Value by Mortgage Status in New Bedford
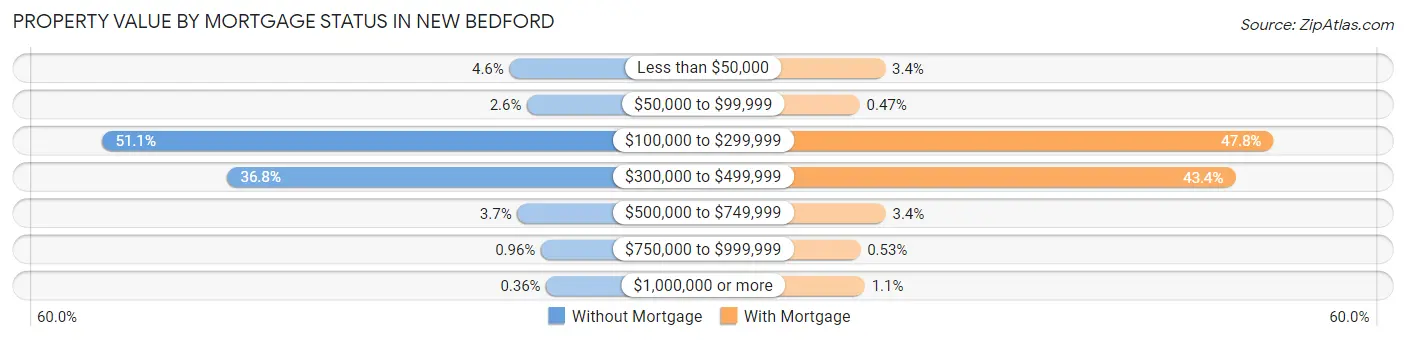
| Property Value | Without Mortgage | With Mortgage |
| Less than $50,000 | 263 (4.6%) | 368 (3.4%) |
| $50,000 to $99,999 | 147 (2.5%) | 51 (0.5%) |
| $100,000 to $299,999 | 2,941 (51.1%) | 5,199 (47.7%) |
| $300,000 to $499,999 | 2,118 (36.8%) | 4,725 (43.4%) |
| $500,000 to $749,999 | 211 (3.7%) | 373 (3.4%) |
| $750,000 to $999,999 | 55 (1.0%) | 58 (0.5%) |
| $1,000,000 or more | 21 (0.4%) | 114 (1.1%) |
| Total | 5,756 (100.0%) | 10,888 (100.0%) |
Household Income by Mortgage Status in New Bedford
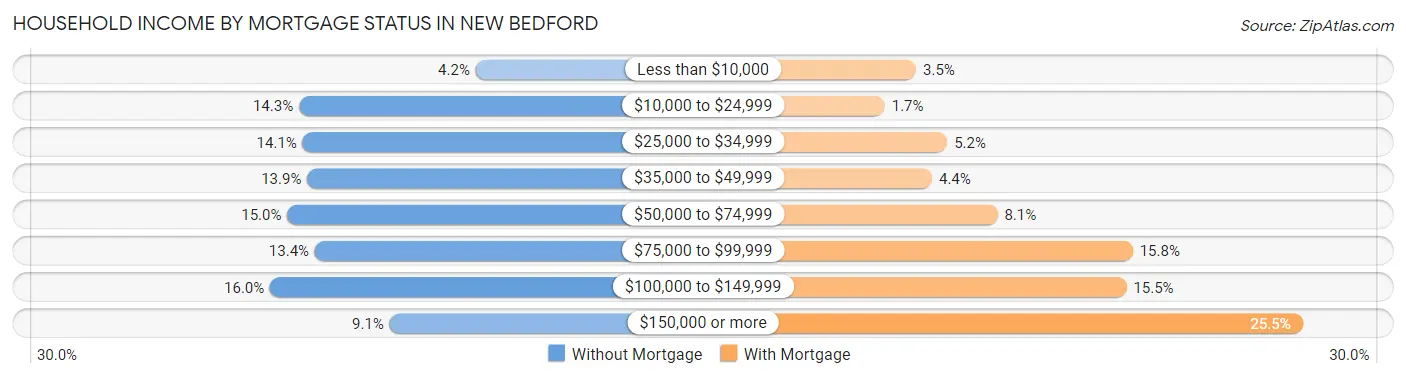
| Household Income | Without Mortgage | With Mortgage |
| Less than $10,000 | 243 (4.2%) | 377 (3.5%) |
| $10,000 to $24,999 | 824 (14.3%) | 182 (1.7%) |
| $25,000 to $34,999 | 812 (14.1%) | 570 (5.2%) |
| $35,000 to $49,999 | 797 (13.9%) | 476 (4.4%) |
| $50,000 to $74,999 | 863 (15.0%) | 883 (8.1%) |
| $75,000 to $99,999 | 772 (13.4%) | 1,725 (15.8%) |
| $100,000 to $149,999 | 919 (16.0%) | 1,685 (15.5%) |
| $150,000 or more | 526 (9.1%) | 2,781 (25.5%) |
| Total | 5,756 (100.0%) | 10,888 (100.0%) |
Property Value to Household Income Ratio in New Bedford
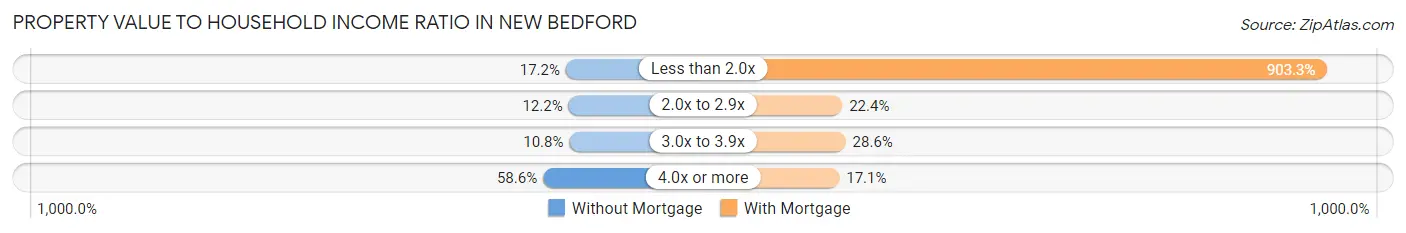
| Value-to-Income Ratio | Without Mortgage | With Mortgage |
| Less than 2.0x | 987 (17.2%) | 98,355 (903.3%) |
| 2.0x to 2.9x | 703 (12.2%) | 2,437 (22.4%) |
| 3.0x to 3.9x | 624 (10.8%) | 3,116 (28.6%) |
| 4.0x or more | 3,370 (58.6%) | 1,858 (17.1%) |
| Total | 5,756 (100.0%) | 10,888 (100.0%) |
Real Estate Taxes by Mortgage Status in New Bedford
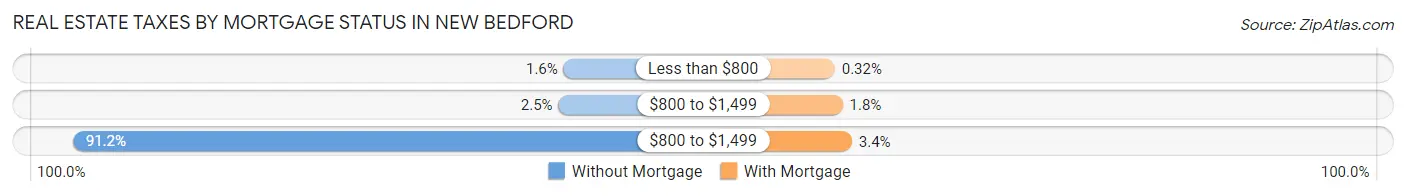
| Property Taxes | Without Mortgage | With Mortgage |
| Less than $800 | 89 (1.5%) | 35 (0.3%) |
| $800 to $1,499 | 144 (2.5%) | 191 (1.8%) |
| $800 to $1,499 | 5,249 (91.2%) | 375 (3.4%) |
| Total | 5,756 (100.0%) | 10,888 (100.0%) |
Health & Disability in New Bedford
Health Insurance Coverage by Age in New Bedford
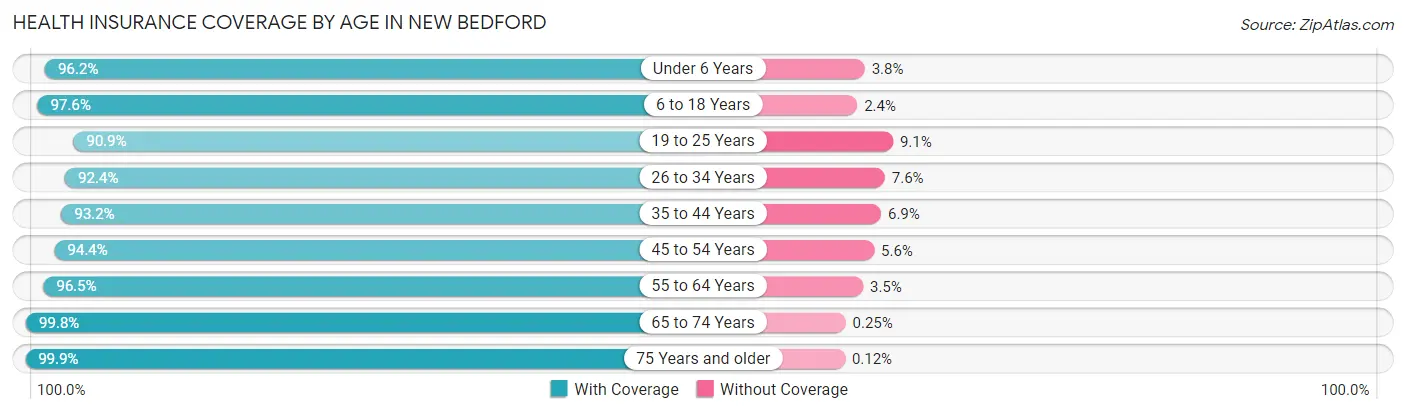
| Age Bracket | With Coverage | Without Coverage |
| Under 6 Years | 7,502 (96.2%) | 297 (3.8%) |
| 6 to 18 Years | 16,743 (97.6%) | 413 (2.4%) |
| 19 to 25 Years | 9,391 (90.9%) | 938 (9.1%) |
| 26 to 34 Years | 11,207 (92.4%) | 917 (7.6%) |
| 35 to 44 Years | 12,560 (93.1%) | 923 (6.9%) |
| 45 to 54 Years | 11,861 (94.4%) | 698 (5.6%) |
| 55 to 64 Years | 10,622 (96.5%) | 384 (3.5%) |
| 65 to 74 Years | 9,111 (99.8%) | 23 (0.3%) |
| 75 Years and older | 5,860 (99.9%) | 7 (0.1%) |
| Total | 94,857 (95.4%) | 4,600 (4.6%) |
Health Insurance Coverage by Citizenship Status in New Bedford
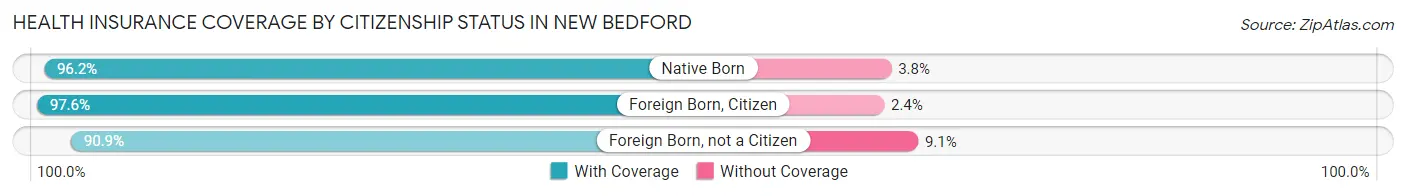
| Citizenship Status | With Coverage | Without Coverage |
| Native Born | 7,502 (96.2%) | 297 (3.8%) |
| Foreign Born, Citizen | 16,743 (97.6%) | 413 (2.4%) |
| Foreign Born, not a Citizen | 9,391 (90.9%) | 938 (9.1%) |
Health Insurance Coverage by Household Income in New Bedford
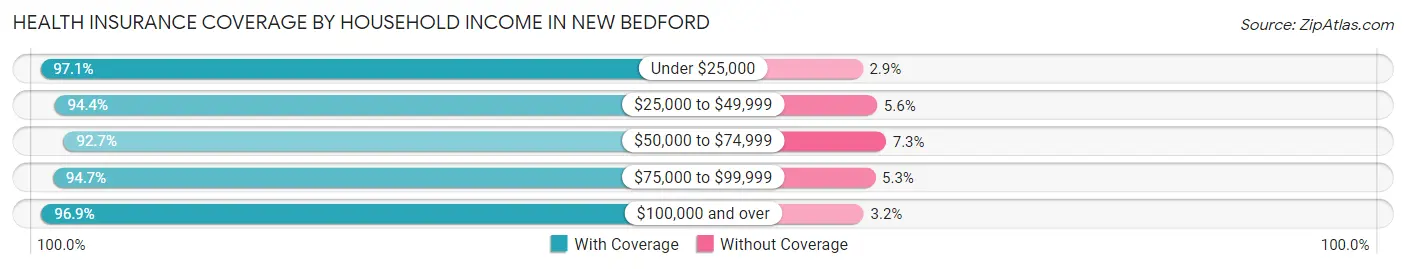
| Household Income | With Coverage | Without Coverage |
| Under $25,000 | 15,867 (97.1%) | 479 (2.9%) |
| $25,000 to $49,999 | 18,609 (94.4%) | 1,113 (5.6%) |
| $50,000 to $74,999 | 15,855 (92.7%) | 1,250 (7.3%) |
| $75,000 to $99,999 | 12,402 (94.7%) | 694 (5.3%) |
| $100,000 and over | 31,414 (96.9%) | 1,023 (3.2%) |
Public vs Private Health Insurance Coverage by Age in New Bedford
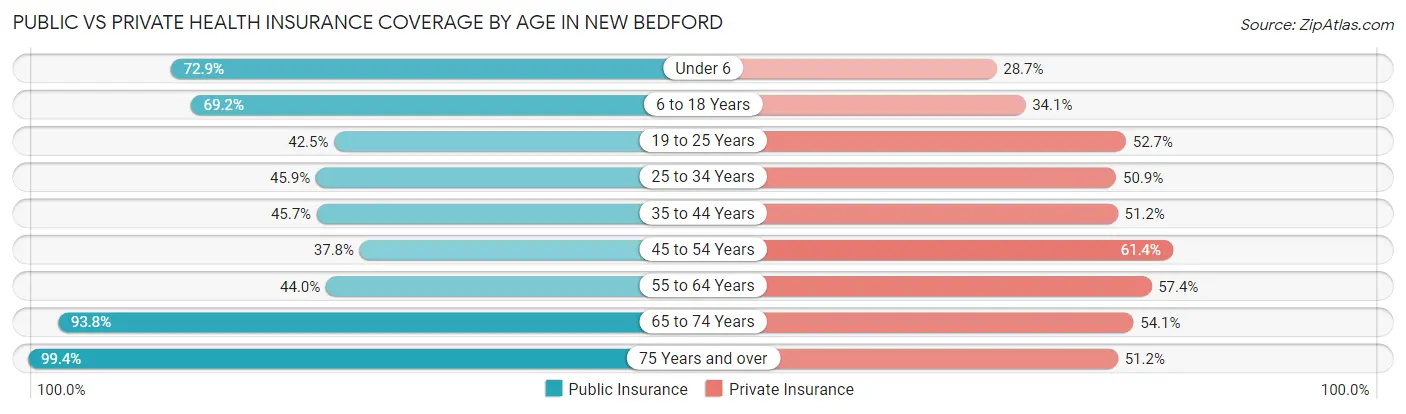
| Age Bracket | Public Insurance | Private Insurance |
| Under 6 | 5,684 (72.9%) | 2,237 (28.7%) |
| 6 to 18 Years | 11,868 (69.2%) | 5,841 (34.1%) |
| 19 to 25 Years | 4,392 (42.5%) | 5,445 (52.7%) |
| 25 to 34 Years | 5,566 (45.9%) | 6,171 (50.9%) |
| 35 to 44 Years | 6,167 (45.7%) | 6,903 (51.2%) |
| 45 to 54 Years | 4,744 (37.8%) | 7,716 (61.4%) |
| 55 to 64 Years | 4,847 (44.0%) | 6,321 (57.4%) |
| 65 to 74 Years | 8,571 (93.8%) | 4,942 (54.1%) |
| 75 Years and over | 5,830 (99.4%) | 3,005 (51.2%) |
| Total | 57,669 (58.0%) | 48,581 (48.8%) |
Disability Status by Sex by Age in New Bedford
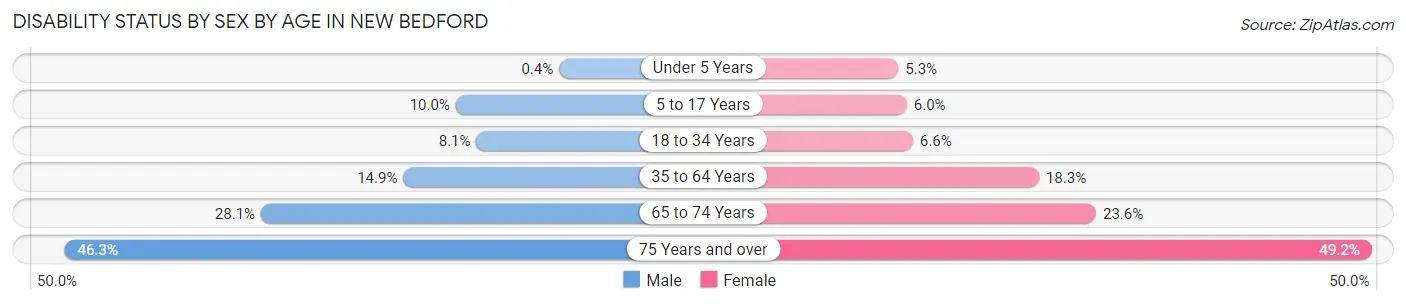
| Age Bracket | Male | Female |
| Under 5 Years | 15 (0.4%) | 145 (5.2%) |
| 5 to 17 Years | 924 (10.0%) | 475 (6.0%) |
| 18 to 34 Years | 991 (8.1%) | 758 (6.6%) |
| 35 to 64 Years | 2,729 (14.9%) | 3,419 (18.3%) |
| 65 to 74 Years | 1,153 (28.1%) | 1,186 (23.6%) |
| 75 Years and over | 1,062 (46.3%) | 1,757 (49.2%) |
Disability Class by Sex by Age in New Bedford
Disability Class: Hearing Difficulty
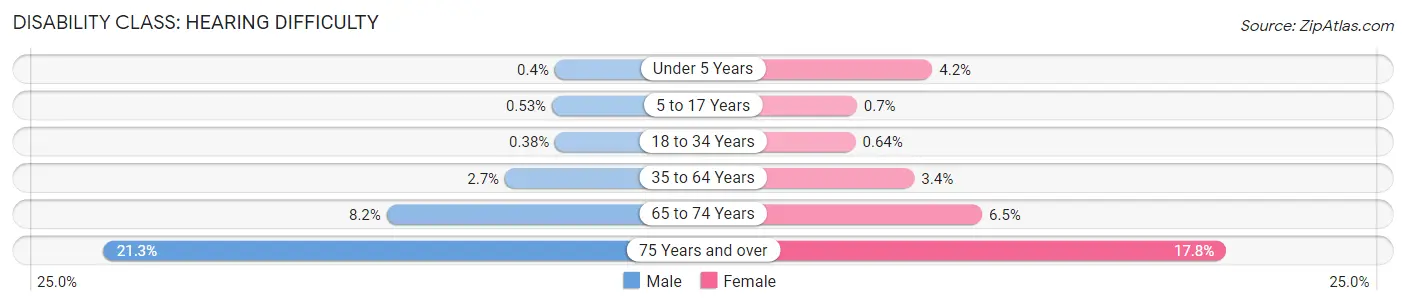
| Age Bracket | Male | Female |
| Under 5 Years | 15 (0.4%) | 116 (4.2%) |
| 5 to 17 Years | 49 (0.5%) | 55 (0.7%) |
| 18 to 34 Years | 47 (0.4%) | 74 (0.6%) |
| 35 to 64 Years | 498 (2.7%) | 630 (3.4%) |
| 65 to 74 Years | 337 (8.2%) | 327 (6.5%) |
| 75 Years and over | 489 (21.3%) | 637 (17.8%) |
Disability Class: Vision Difficulty
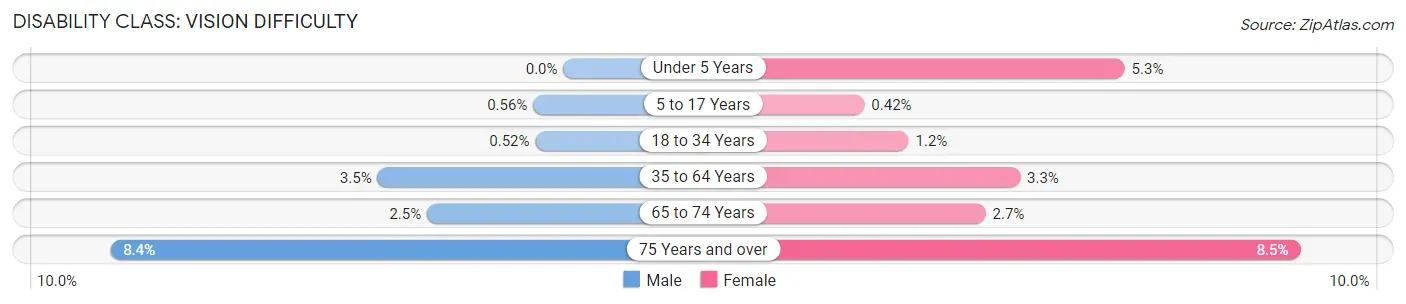
| Age Bracket | Male | Female |
| Under 5 Years | 0 (0.0%) | 145 (5.2%) |
| 5 to 17 Years | 52 (0.6%) | 33 (0.4%) |
| 18 to 34 Years | 64 (0.5%) | 143 (1.2%) |
| 35 to 64 Years | 634 (3.5%) | 618 (3.3%) |
| 65 to 74 Years | 104 (2.5%) | 134 (2.7%) |
| 75 Years and over | 193 (8.4%) | 304 (8.5%) |
Disability Class: Cognitive Difficulty
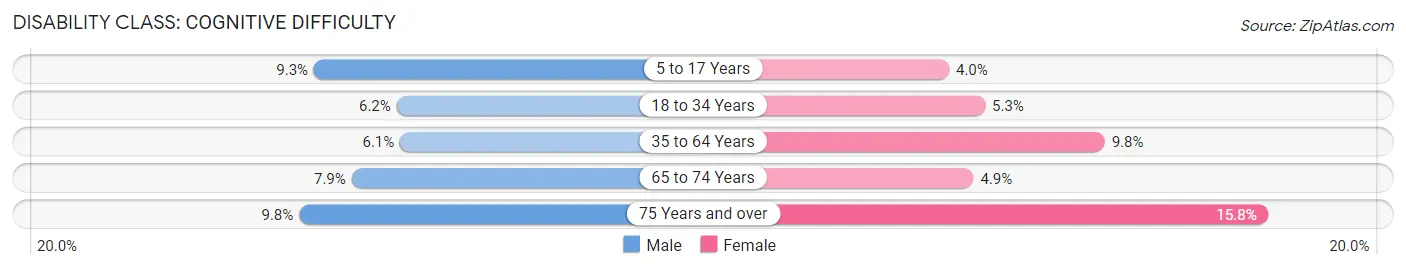
| Age Bracket | Male | Female |
| 5 to 17 Years | 856 (9.3%) | 313 (4.0%) |
| 18 to 34 Years | 760 (6.2%) | 611 (5.3%) |
| 35 to 64 Years | 1,114 (6.1%) | 1,823 (9.8%) |
| 65 to 74 Years | 323 (7.9%) | 246 (4.9%) |
| 75 Years and over | 225 (9.8%) | 566 (15.8%) |
Disability Class: Ambulatory Difficulty
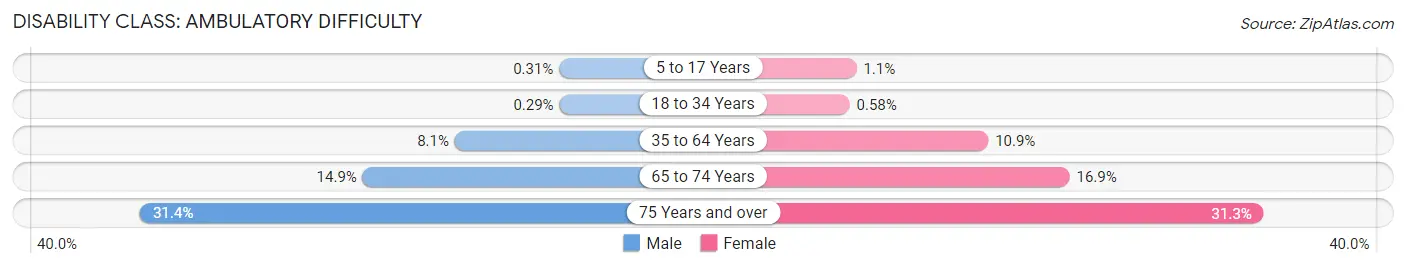
| Age Bracket | Male | Female |
| 5 to 17 Years | 29 (0.3%) | 86 (1.1%) |
| 18 to 34 Years | 36 (0.3%) | 67 (0.6%) |
| 35 to 64 Years | 1,481 (8.1%) | 2,030 (10.9%) |
| 65 to 74 Years | 612 (14.9%) | 850 (16.9%) |
| 75 Years and over | 721 (31.4%) | 1,119 (31.3%) |
Disability Class: Self-Care Difficulty
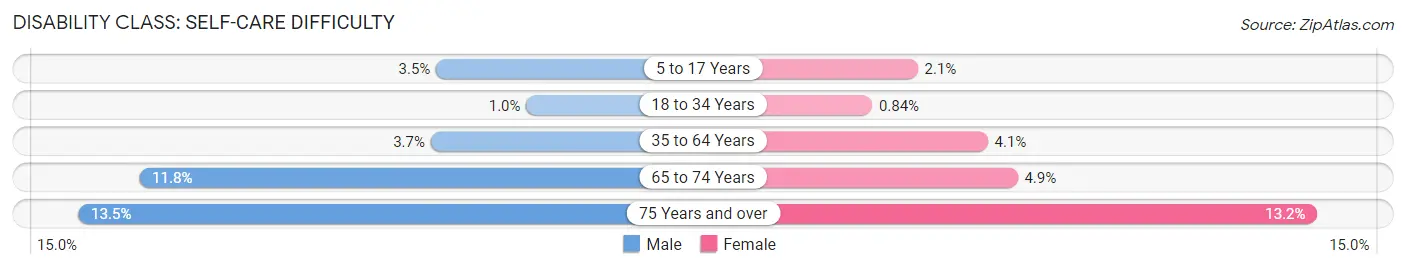
| Age Bracket | Male | Female |
| 5 to 17 Years | 327 (3.5%) | 166 (2.1%) |
| 18 to 34 Years | 126 (1.0%) | 97 (0.8%) |
| 35 to 64 Years | 678 (3.7%) | 758 (4.1%) |
| 65 to 74 Years | 485 (11.8%) | 246 (4.9%) |
| 75 Years and over | 310 (13.5%) | 473 (13.2%) |
Technology Access in New Bedford
Computing Device Access in New Bedford
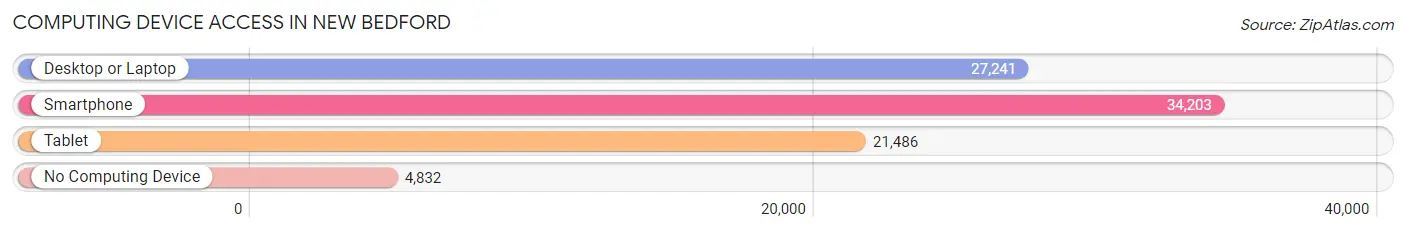
| Device Type | # Households | % Households |
| Desktop or Laptop | 27,241 | 65.3% |
| Smartphone | 34,203 | 82.0% |
| Tablet | 21,486 | 51.5% |
| No Computing Device | 4,832 | 11.6% |
| Total | 41,722 | 100.0% |
Internet Access in New Bedford
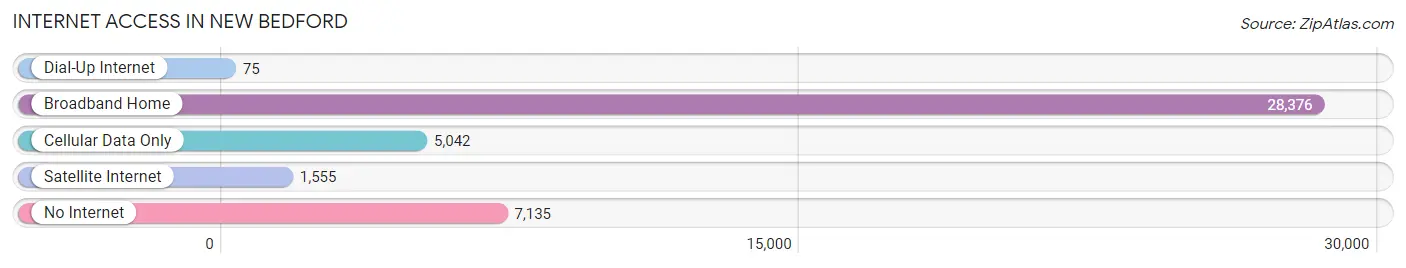
| Internet Type | # Households | % Households |
| Dial-Up Internet | 75 | 0.2% |
| Broadband Home | 28,376 | 68.0% |
| Cellular Data Only | 5,042 | 12.1% |
| Satellite Internet | 1,555 | 3.7% |
| No Internet | 7,135 | 17.1% |
| Total | 41,722 | 100.0% |
New Bedford Summary
New Bedford, Massachusetts is a city located in Bristol County, Massachusetts, United States. It is the sixth-largest city in Massachusetts and the largest city in the South Coast region. The city has a population of 95,072 as of the 2010 census, making it the fourth-largest city in Massachusetts.
History
New Bedford was first settled in 1652 by English settlers from the Plymouth Colony. The town was named after Bedford, England, which was the hometown of the first settlers. The town was incorporated in 1787 and became a city in 1847.
New Bedford was an important whaling port in the 19th century, and was the largest whaling port in the world at the time. The city was also a major center of the textile industry, and was home to several large mills.
Geography
New Bedford is located at 41°38'N 70°55'W. It is situated on the south coast of Massachusetts, approximately 50 miles south of Boston. The city is bordered by Dartmouth to the west, Fairhaven to the south, and Acushnet to the east.
The city is located on the Acushnet River, which flows into Buzzards Bay. The city is also home to several small islands, including Cuttyhunk Island, which is located just off the coast of New Bedford.
Climate
New Bedford has a humid continental climate, with warm summers and cold winters. The average annual temperature is around 50°F, with an average high of around 70°F in the summer and an average low of around 30°F in the winter.
Demographics
As of the 2010 census, New Bedford had a population of 95,072. The racial makeup of the city was 73.2% White, 11.3% African American, 0.5% Native American, 1.3% Asian, 0.1% Pacific Islander, 10.2% from other races, and 3.5% from two or more races. Hispanic or Latino of any race were 20.3% of the population.
Economy
New Bedford is a major center of the fishing industry, and is home to the largest commercial fishing port in the United States. The city is also home to several large manufacturing companies, including Acushnet Company, which produces Titleist golf balls, and NStar, which produces electrical components.
The city is also home to several educational institutions, including the University of Massachusetts Dartmouth, Bristol Community College, and the New Bedford Institute of Technology.
Conclusion
New Bedford, Massachusetts is a city located in Bristol County, Massachusetts, United States. It is the sixth-largest city in Massachusetts and the largest city in the South Coast region. The city has a population of 95,072 as of the 2010 census, making it the fourth-largest city in Massachusetts. New Bedford was first settled in 1652 by English settlers from the Plymouth Colony and was an important whaling port in the 19th century. The city is located on the Acushnet River, which flows into Buzzards Bay, and has a humid continental climate. The city is a major center of the fishing industry, and is home to several large manufacturing companies and educational institutions.
Common Questions
What is Per Capita Income in New Bedford?
Per Capita income in New Bedford is $29,591.
What is the Median Family Income in New Bedford?
Median Family Income in New Bedford is $68,281.
What is the Median Household income in New Bedford?
Median Household Income in New Bedford is $54,604.
What is Income or Wage Gap in New Bedford?
Income or Wage Gap in New Bedford is 25.8%.
Women in New Bedford earn 74.2 cents for every dollar earned by a man.
What is Family Income Deficit in New Bedford?
Family Income Deficit in New Bedford is $10,808.
Families that are below poverty line in New Bedford earn $10,808 less on average than the poverty threshold level.
What is Inequality or Gini Index in New Bedford?
Inequality or Gini Index in New Bedford is 0.45.
What is the Total Population of New Bedford?
Total Population of New Bedford is 100,620.
What is the Total Male Population of New Bedford?
Total Male Population of New Bedford is 50,584.
What is the Total Female Population of New Bedford?
Total Female Population of New Bedford is 50,036.
What is the Ratio of Males per 100 Females in New Bedford?
There are 101.10 Males per 100 Females in New Bedford.
What is the Ratio of Females per 100 Males in New Bedford?
There are 98.92 Females per 100 Males in New Bedford.
What is the Median Population Age in New Bedford?
Median Population Age in New Bedford is 36.8 Years.
What is the Average Family Size in New Bedford
Average Family Size in New Bedford is 3.1 People.
What is the Average Household Size in New Bedford
Average Household Size in New Bedford is 2.4 People.
How Large is the Labor Force in New Bedford?
There are 49,942 People in the Labor Forcein in New Bedford.
What is the Percentage of People in the Labor Force in New Bedford?
62.6% of People are in the Labor Force in New Bedford.
What is the Unemployment Rate in New Bedford?
Unemployment Rate in New Bedford is 7.2%.