Penryn, CA Map & Demographics
Penryn Map
Penryn Overview
$51,485
PER CAPITA INCOME
$100,673
AVG FAMILY INCOME
$89,205
AVG HOUSEHOLD INCOME
12.3%
WAGE / INCOME GAP [ % ]
87.7¢/ $1
WAGE / INCOME GAP [ $ ]
0.38
INEQUALITY / GINI INDEX
1,112
TOTAL POPULATION
588
MALE POPULATION
524
FEMALE POPULATION
112.21
MALES / 100 FEMALES
89.12
FEMALES / 100 MALES
50.7
MEDIAN AGE
2.9
AVG FAMILY SIZE
2.3
AVG HOUSEHOLD SIZE
525
LABOR FORCE [ PEOPLE ]
56.8%
PERCENT IN LABOR FORCE
5.9%
UNEMPLOYMENT RATE
Penryn Zip Codes
Penryn Area Codes
Income in Penryn
Income Overview in Penryn
Per Capita Income in Penryn is $51,485, while median incomes of families and households are $100,673 and $89,205 respectively.
| Characteristic | Number | Measure |
| Per Capita Income | 1,112 | $51,485 |
| Median Family Income | 311 | $100,673 |
| Mean Family Income | 311 | $112,170 |
| Median Household Income | 489 | $89,205 |
| Mean Household Income | 489 | $111,981 |
| Income Deficit | 311 | $0 |
| Wage / Income Gap (%) | 1,112 | 12.29% |
| Wage / Income Gap ($) | 1,112 | 87.71¢ per $1 |
| Gini / Inequality Index | 1,112 | 0.38 |
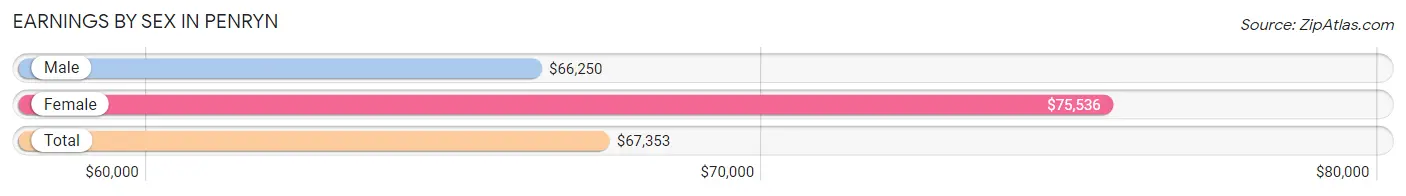
Earnings by Sex in Penryn
Average Earnings in Penryn are $67,353, $66,250 for men and $75,536 for women, a difference of 12.3%.
| Sex | Number | Average Earnings |
| Male | 341 (62.5%) | $66,250 |
| Female | 205 (37.6%) | $75,536 |
| Total | 546 (100.0%) | $67,353 |
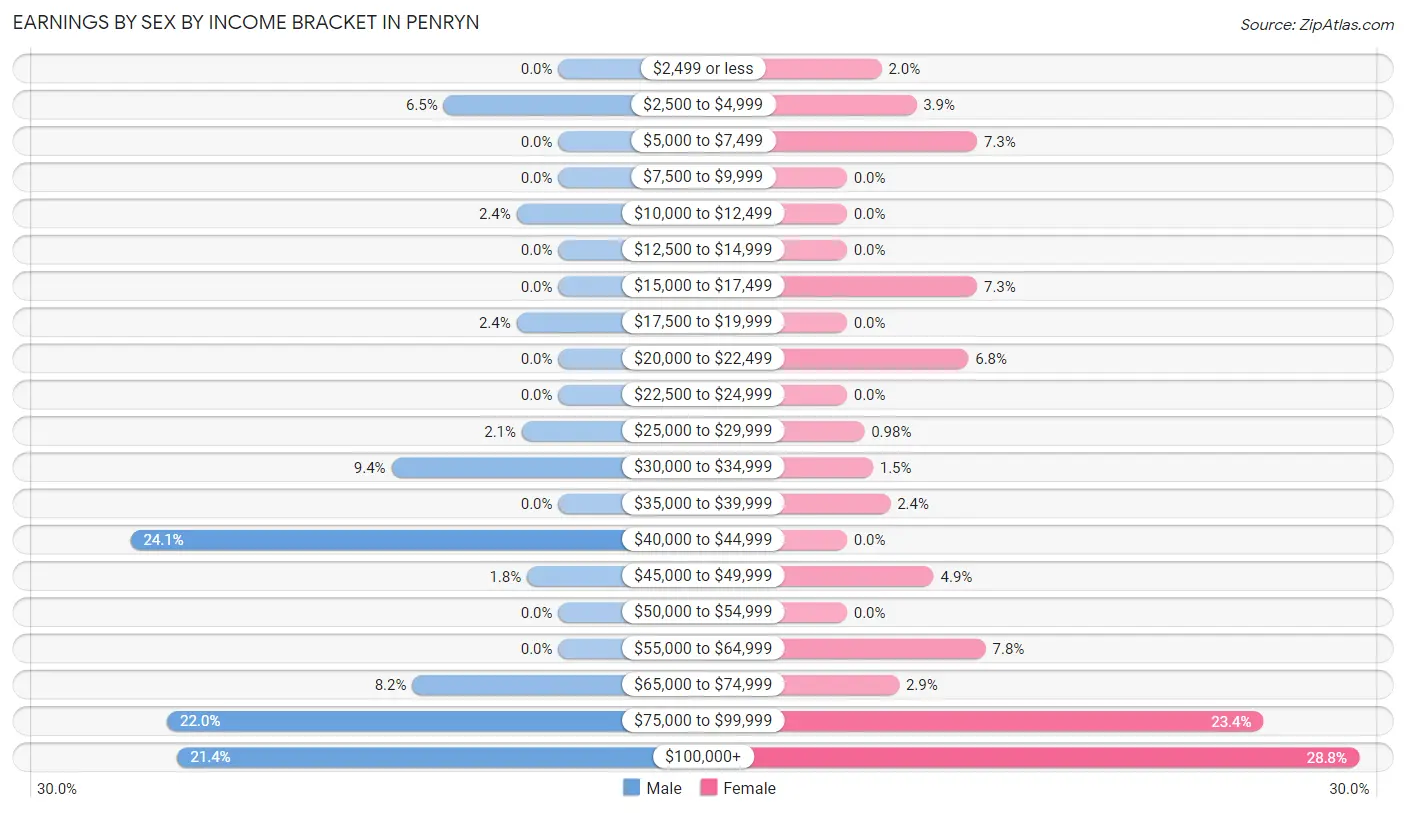
Earnings by Sex by Income Bracket in Penryn
The most common earnings brackets in Penryn are $40,000 to $44,999 for men (82 | 24.0%) and $100,000+ for women (59 | 28.8%).
| Income | Male | Female |
| $2,499 or less | 0 (0.0%) | 4 (1.9%) |
| $2,500 to $4,999 | 22 (6.5%) | 8 (3.9%) |
| $5,000 to $7,499 | 0 (0.0%) | 15 (7.3%) |
| $7,500 to $9,999 | 0 (0.0%) | 0 (0.0%) |
| $10,000 to $12,499 | 8 (2.4%) | 0 (0.0%) |
| $12,500 to $14,999 | 0 (0.0%) | 0 (0.0%) |
| $15,000 to $17,499 | 0 (0.0%) | 15 (7.3%) |
| $17,500 to $19,999 | 8 (2.4%) | 0 (0.0%) |
| $20,000 to $22,499 | 0 (0.0%) | 14 (6.8%) |
| $22,500 to $24,999 | 0 (0.0%) | 0 (0.0%) |
| $25,000 to $29,999 | 7 (2.1%) | 2 (1.0%) |
| $30,000 to $34,999 | 32 (9.4%) | 3 (1.5%) |
| $35,000 to $39,999 | 0 (0.0%) | 5 (2.4%) |
| $40,000 to $44,999 | 82 (24.0%) | 0 (0.0%) |
| $45,000 to $49,999 | 6 (1.8%) | 10 (4.9%) |
| $50,000 to $54,999 | 0 (0.0%) | 0 (0.0%) |
| $55,000 to $64,999 | 0 (0.0%) | 16 (7.8%) |
| $65,000 to $74,999 | 28 (8.2%) | 6 (2.9%) |
| $75,000 to $99,999 | 75 (22.0%) | 48 (23.4%) |
| $100,000+ | 73 (21.4%) | 59 (28.8%) |
| Total | 341 (100.0%) | 205 (100.0%) |
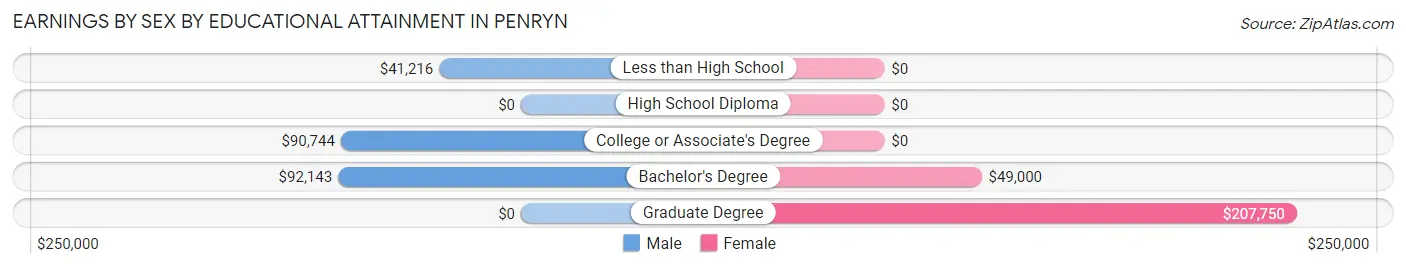
Earnings by Sex by Educational Attainment in Penryn
Average earnings in Penryn are $70,556 for men and $76,250 for women, a difference of 7.5%. Men with an educational attainment of bachelor's degree enjoy the highest average annual earnings of $92,143, while those with less than high school education earn the least with $41,216. Women with an educational attainment of graduate degree earn the most with the average annual earnings of $207,750, while those with bachelor's degree education have the smallest earnings of $49,000.
| Educational Attainment | Male Income | Female Income |
| Less than High School | $41,216 | $0 |
| High School Diploma | - | - |
| College or Associate's Degree | $90,744 | $0 |
| Bachelor's Degree | $92,143 | $49,000 |
| Graduate Degree | - | - |
| Total | $70,556 | $76,250 |
Family Income in Penryn
Family Income Brackets in Penryn
According to the Penryn family income data, there are 82 families falling into the $100,000 to $149,999 income range, which is the most common income bracket and makes up 26.4% of all families.
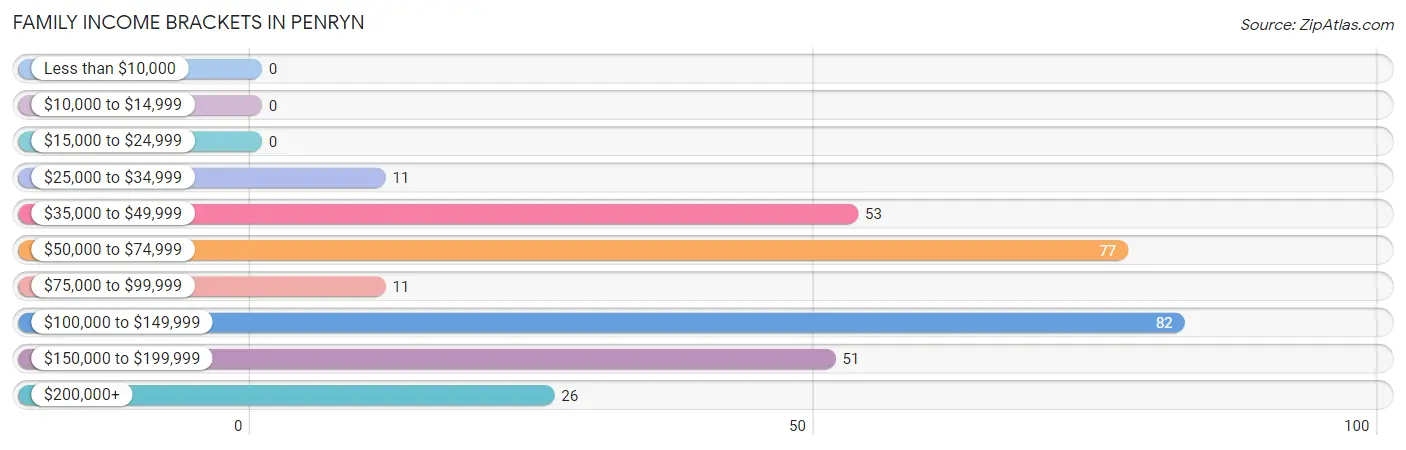
| Income Bracket | # Families | % Families |
| Less than $10,000 | 0 | 0.0% |
| $10,000 to $14,999 | 0 | 0.0% |
| $15,000 to $24,999 | 0 | 0.0% |
| $25,000 to $34,999 | 11 | 3.5% |
| $35,000 to $49,999 | 53 | 17.0% |
| $50,000 to $74,999 | 77 | 24.8% |
| $75,000 to $99,999 | 11 | 3.5% |
| $100,000 to $149,999 | 82 | 26.4% |
| $150,000 to $199,999 | 51 | 16.4% |
| $200,000+ | 26 | 8.4% |
Family Income by Famaliy Size in Penryn
4-person families (45 | 14.5%) account for the highest median family income in Penryn with $151,917 per family, while 3-person families (26 | 8.4%) have the highest median income of $47,348 per family member.
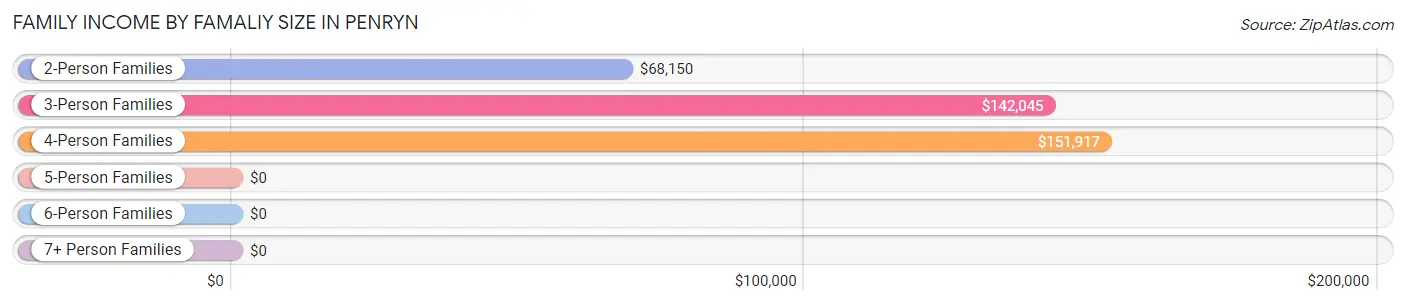
| Income Bracket | # Families | Median Income |
| 2-Person Families | 207 (66.6%) | $68,150 |
| 3-Person Families | 26 (8.4%) | $142,045 |
| 4-Person Families | 45 (14.5%) | $151,917 |
| 5-Person Families | 25 (8.0%) | $0 |
| 6-Person Families | 8 (2.6%) | $0 |
| 7+ Person Families | 0 (0.0%) | $0 |
| Total | 311 (100.0%) | $100,673 |
Family Income by Number of Earners in Penryn
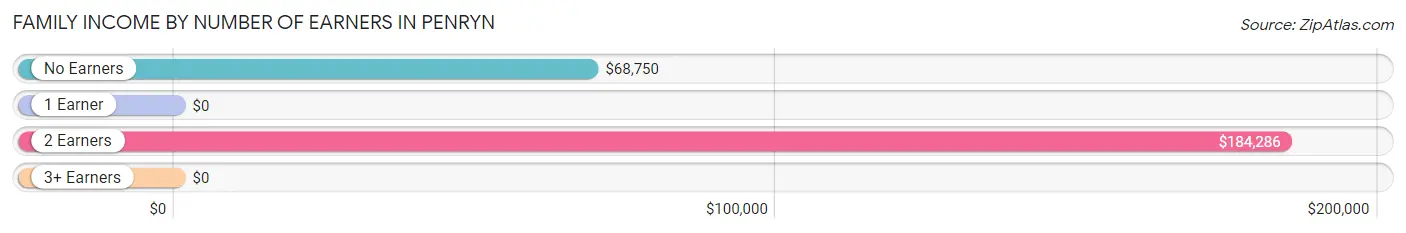
| Number of Earners | # Families | Median Income |
| No Earners | 85 (27.3%) | $68,750 |
| 1 Earner | 120 (38.6%) | $0 |
| 2 Earners | 80 (25.7%) | $184,286 |
| 3+ Earners | 26 (8.4%) | $0 |
| Total | 311 (100.0%) | $100,673 |
Household Income in Penryn
Household Income Brackets in Penryn
With 118 households falling in the category, the $50,000 to $74,999 income range is the most frequent in Penryn, accounting for 24.1% of all households.
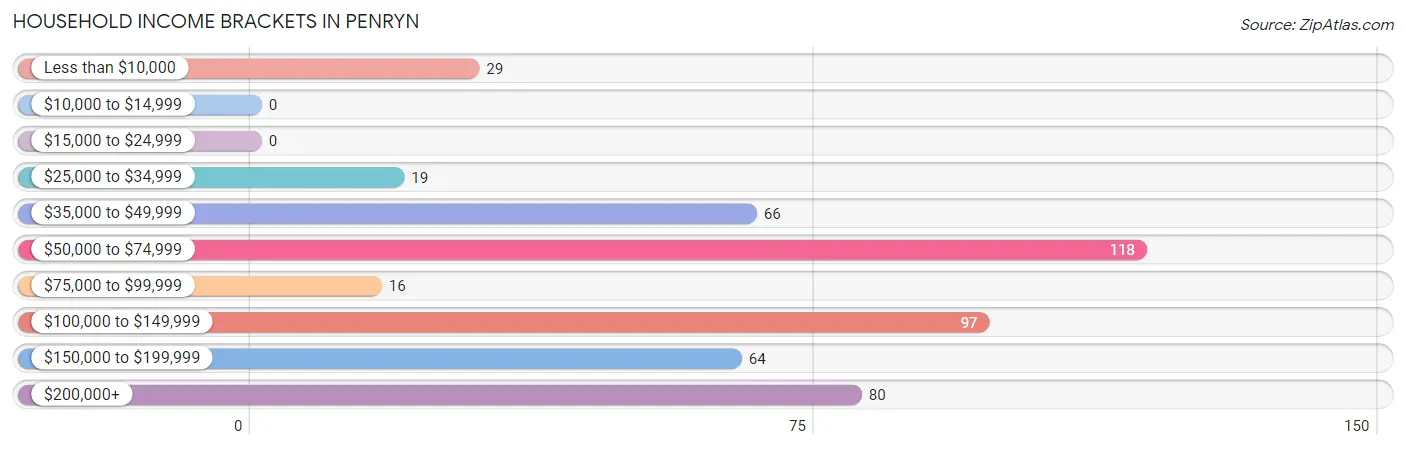
| Income Bracket | # Households | % Households |
| Less than $10,000 | 29 | 5.9% |
| $10,000 to $14,999 | 0 | 0.0% |
| $15,000 to $24,999 | 0 | 0.0% |
| $25,000 to $34,999 | 19 | 3.9% |
| $35,000 to $49,999 | 66 | 13.5% |
| $50,000 to $74,999 | 118 | 24.1% |
| $75,000 to $99,999 | 16 | 3.3% |
| $100,000 to $149,999 | 97 | 19.8% |
| $150,000 to $199,999 | 64 | 13.1% |
| $200,000+ | 80 | 16.4% |
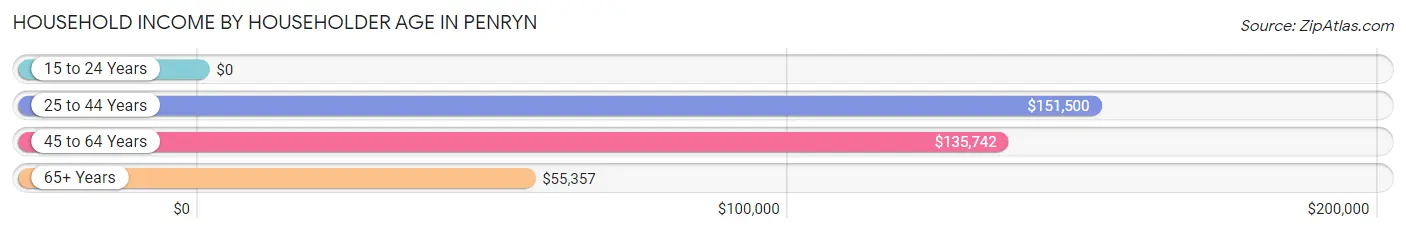
Household Income by Householder Age in Penryn
The median household income in Penryn is $89,205, with the highest median household income of $151,500 found in the 25 to 44 years age bracket for the primary householder. A total of 106 households (21.7%) fall into this category.
| Income Bracket | # Households | Median Income |
| 15 to 24 Years | 0 (0.0%) | $0 |
| 25 to 44 Years | 106 (21.7%) | $151,500 |
| 45 to 64 Years | 195 (39.9%) | $135,742 |
| 65+ Years | 188 (38.5%) | $55,357 |
| Total | 489 (100.0%) | $89,205 |
Poverty in Penryn
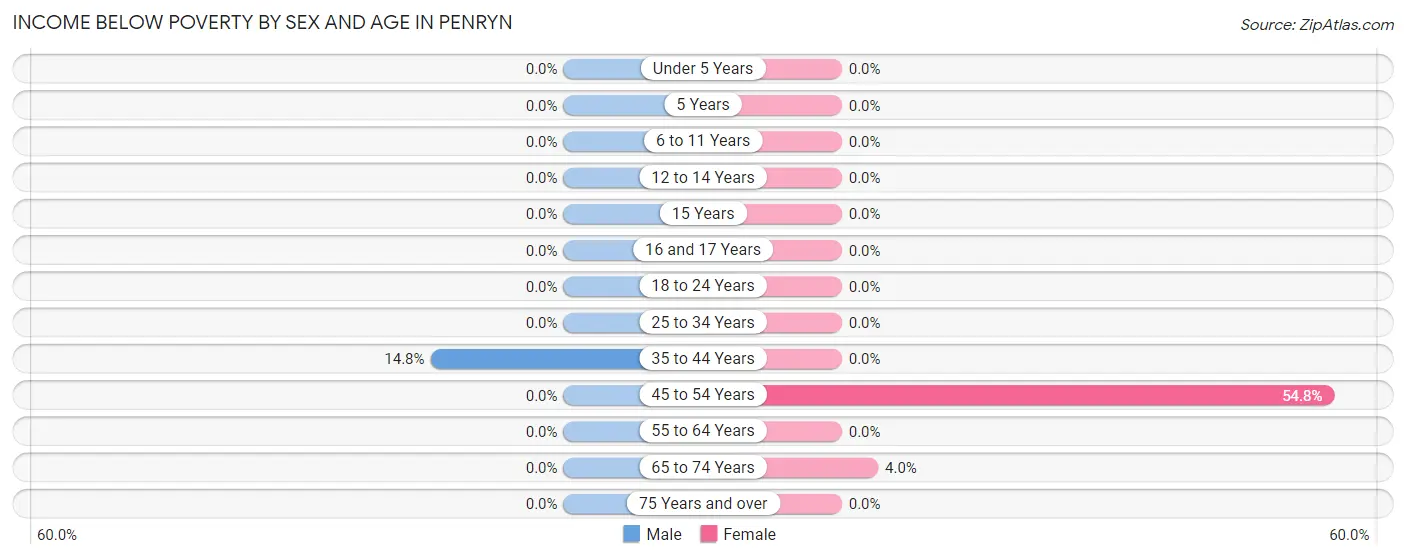
Income Below Poverty by Sex and Age in Penryn
With 2.0% poverty level for males and 4.0% for females among the residents of Penryn, 35 to 44 year old males and 45 to 54 year old females are the most vulnerable to poverty, with 12 males (14.8%) and 17 females (54.8%) in their respective age groups living below the poverty level.
| Age Bracket | Male | Female |
| Under 5 Years | 0 (0.0%) | 0 (0.0%) |
| 5 Years | 0 (0.0%) | 0 (0.0%) |
| 6 to 11 Years | 0 (0.0%) | 0 (0.0%) |
| 12 to 14 Years | 0 (0.0%) | 0 (0.0%) |
| 15 Years | 0 (0.0%) | 0 (0.0%) |
| 16 and 17 Years | 0 (0.0%) | 0 (0.0%) |
| 18 to 24 Years | 0 (0.0%) | 0 (0.0%) |
| 25 to 34 Years | 0 (0.0%) | 0 (0.0%) |
| 35 to 44 Years | 12 (14.8%) | 0 (0.0%) |
| 45 to 54 Years | 0 (0.0%) | 17 (54.8%) |
| 55 to 64 Years | 0 (0.0%) | 0 (0.0%) |
| 65 to 74 Years | 0 (0.0%) | 4 (4.0%) |
| 75 Years and over | 0 (0.0%) | 0 (0.0%) |
| Total | 12 (2.0%) | 21 (4.0%) |
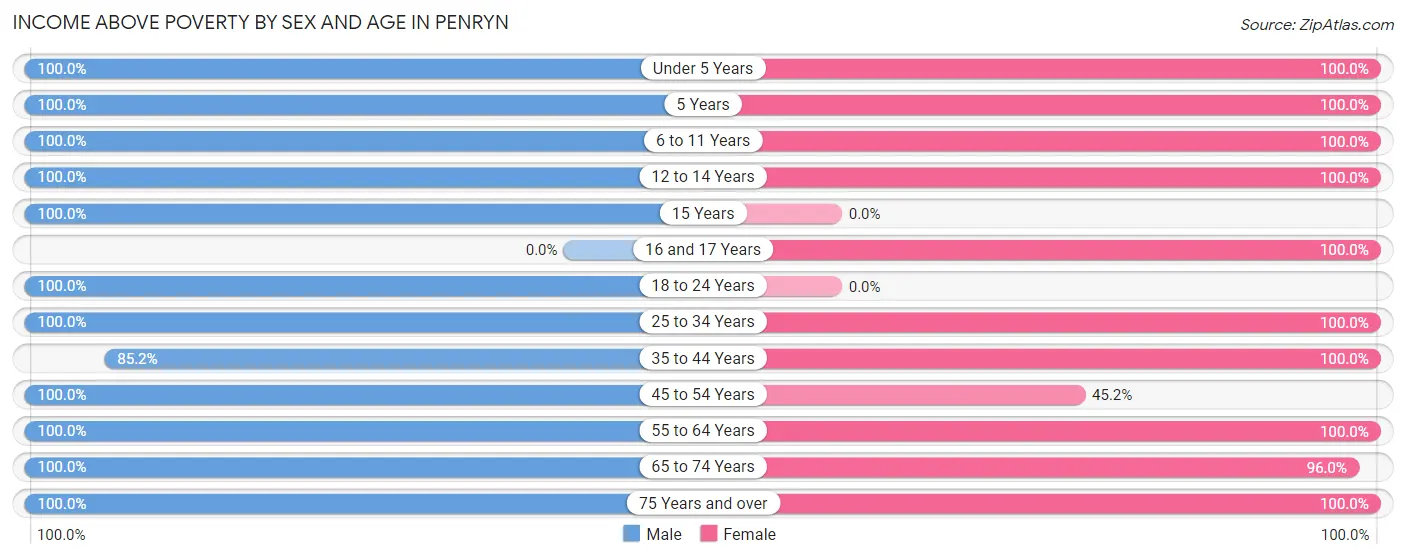
Income Above Poverty by Sex and Age in Penryn
According to the poverty statistics in Penryn, males aged under 5 years and females aged under 5 years are the age groups that are most secure financially, with 100.0% of males and 100.0% of females in these age groups living above the poverty line.
| Age Bracket | Male | Female |
| Under 5 Years | 21 (100.0%) | 37 (100.0%) |
| 5 Years | 6 (100.0%) | 5 (100.0%) |
| 6 to 11 Years | 25 (100.0%) | 24 (100.0%) |
| 12 to 14 Years | 28 (100.0%) | 33 (100.0%) |
| 15 Years | 8 (100.0%) | 0 (0.0%) |
| 16 and 17 Years | 0 (0.0%) | 12 (100.0%) |
| 18 to 24 Years | 30 (100.0%) | 0 (0.0%) |
| 25 to 34 Years | 114 (100.0%) | 21 (100.0%) |
| 35 to 44 Years | 69 (85.2%) | 82 (100.0%) |
| 45 to 54 Years | 31 (100.0%) | 14 (45.2%) |
| 55 to 64 Years | 96 (100.0%) | 95 (100.0%) |
| 65 to 74 Years | 41 (100.0%) | 95 (96.0%) |
| 75 Years and over | 107 (100.0%) | 85 (100.0%) |
| Total | 576 (98.0%) | 503 (96.0%) |
Income Below Poverty Among Married-Couple Families in Penryn
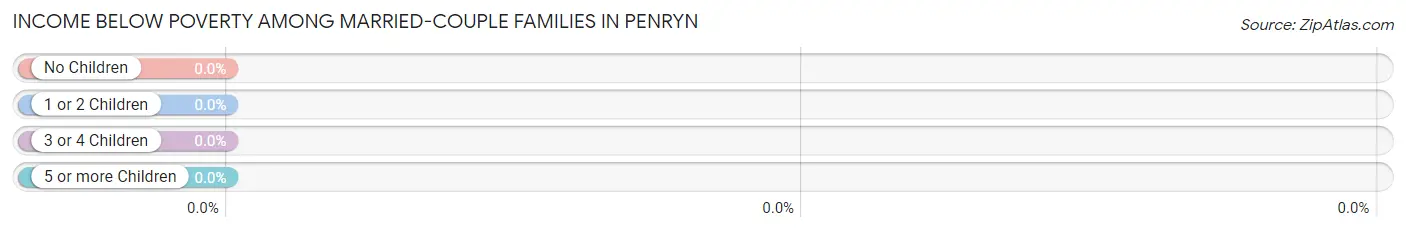
| Children | Above Poverty | Below Poverty |
| No Children | 122 (100.0%) | 0 (0.0%) |
| 1 or 2 Children | 77 (100.0%) | 0 (0.0%) |
| 3 or 4 Children | 16 (100.0%) | 0 (0.0%) |
| 5 or more Children | 0 (0.0%) | 0 (0.0%) |
| Total | 215 (100.0%) | 0 (0.0%) |
Income Below Poverty Among Single-Parent Households in Penryn
| Children | Single Father | Single Mother |
| No Children | 0 (0.0%) | 0 (0.0%) |
| 1 or 2 Children | 0 (0.0%) | 0 (0.0%) |
| 3 or 4 Children | 0 (0.0%) | 0 (0.0%) |
| 5 or more Children | 0 (0.0%) | 0 (0.0%) |
| Total | 0 (0.0%) | 0 (0.0%) |
Income Below Poverty Among Married-Couple vs Single-Parent Households in Penryn
| Children | Married-Couple Families | Single-Parent Households |
| No Children | 0 (0.0%) | 0 (0.0%) |
| 1 or 2 Children | 0 (0.0%) | 0 (0.0%) |
| 3 or 4 Children | 0 (0.0%) | 0 (0.0%) |
| 5 or more Children | 0 (0.0%) | 0 (0.0%) |
| Total | 0 (0.0%) | 0 (0.0%) |
Race in Penryn
The most populous races in Penryn are White / Caucasian (901 | 81.0%), Two or more Races (130 | 11.7%), and Hispanic or Latino (97 | 8.7%).
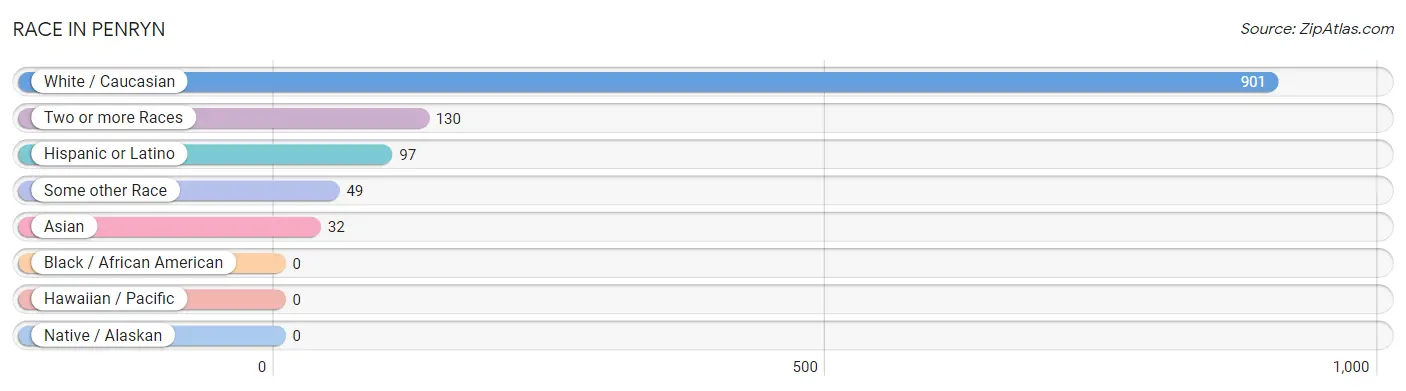
| Race | # Population | % Population |
| Asian | 32 | 2.9% |
| Black / African American | 0 | 0.0% |
| Hawaiian / Pacific | 0 | 0.0% |
| Hispanic or Latino | 97 | 8.7% |
| Native / Alaskan | 0 | 0.0% |
| White / Caucasian | 901 | 81.0% |
| Two or more Races | 130 | 11.7% |
| Some other Race | 49 | 4.4% |
| Total | 1,112 | 100.0% |
Ancestry in Penryn
The most populous ancestries reported in Penryn are English (203 | 18.3%), German (154 | 13.9%), Mexican (97 | 8.7%), Scottish (86 | 7.7%), and American (78 | 7.0%), together accounting for 55.6% of all Penryn residents.
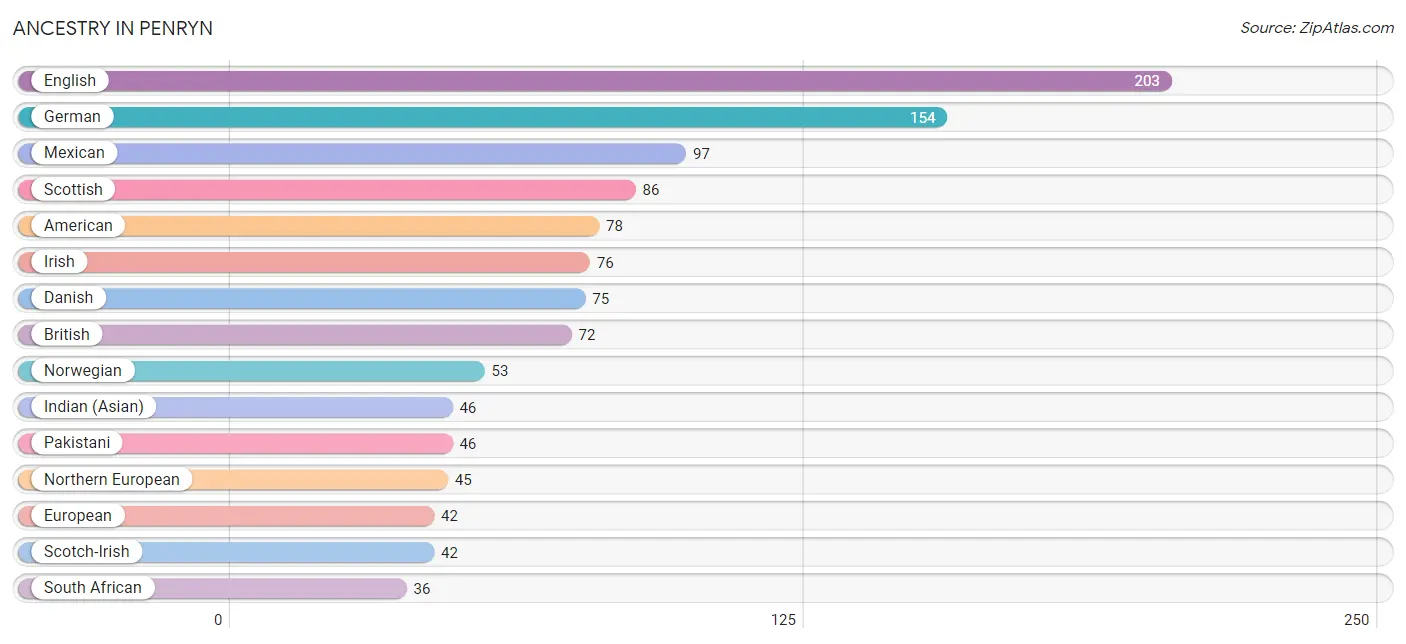
| Ancestry | # Population | % Population |
| American | 78 | 7.0% |
| Apache | 12 | 1.1% |
| Arab | 15 | 1.3% |
| Bhutanese | 28 | 2.5% |
| British | 72 | 6.5% |
| Danish | 75 | 6.7% |
| English | 203 | 18.3% |
| European | 42 | 3.8% |
| German | 154 | 13.9% |
| Indian (Asian) | 46 | 4.1% |
| Irish | 76 | 6.8% |
| Italian | 27 | 2.4% |
| Lebanese | 15 | 1.3% |
| Mexican | 97 | 8.7% |
| Northern European | 45 | 4.1% |
| Norwegian | 53 | 4.8% |
| Pakistani | 46 | 4.1% |
| Portuguese | 5 | 0.4% |
| Scotch-Irish | 42 | 3.8% |
| Scottish | 86 | 7.7% |
| Slavic | 14 | 1.3% |
| South African | 36 | 3.2% |
| Subsaharan African | 36 | 3.2% |
| Swedish | 8 | 0.7% |
| Welsh | 5 | 0.4% | View All 25 Rows |
Immigrants in Penryn
The most numerous immigrant groups reported in Penryn came from Central America (22 | 2.0%), Latin America (22 | 2.0%), Mexico (22 | 2.0%), Asia (21 | 1.9%), and South Eastern Asia (14 | 1.3%), together accounting for 9.1% of all Penryn residents.
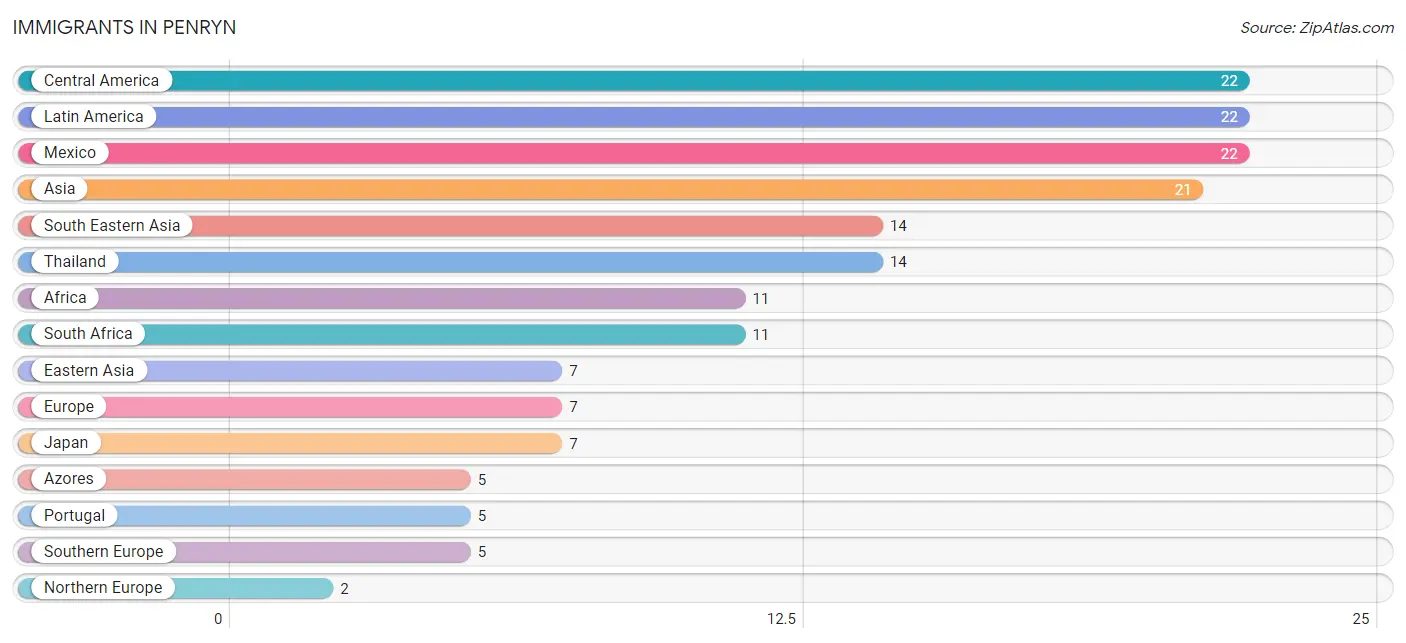
| Immigration Origin | # Population | % Population |
| Africa | 11 | 1.0% |
| Asia | 21 | 1.9% |
| Azores | 5 | 0.4% |
| Central America | 22 | 2.0% |
| Eastern Asia | 7 | 0.6% |
| Europe | 7 | 0.6% |
| Japan | 7 | 0.6% |
| Latin America | 22 | 2.0% |
| Mexico | 22 | 2.0% |
| Northern Europe | 2 | 0.2% |
| Portugal | 5 | 0.4% |
| South Africa | 11 | 1.0% |
| South Eastern Asia | 14 | 1.3% |
| Southern Europe | 5 | 0.4% |
| Thailand | 14 | 1.3% | View All 15 Rows |
Sex and Age in Penryn
Sex and Age in Penryn
The most populous age groups in Penryn are 25 to 29 Years (84 | 14.3%) for men and 55 to 59 Years (74 | 14.1%) for women.
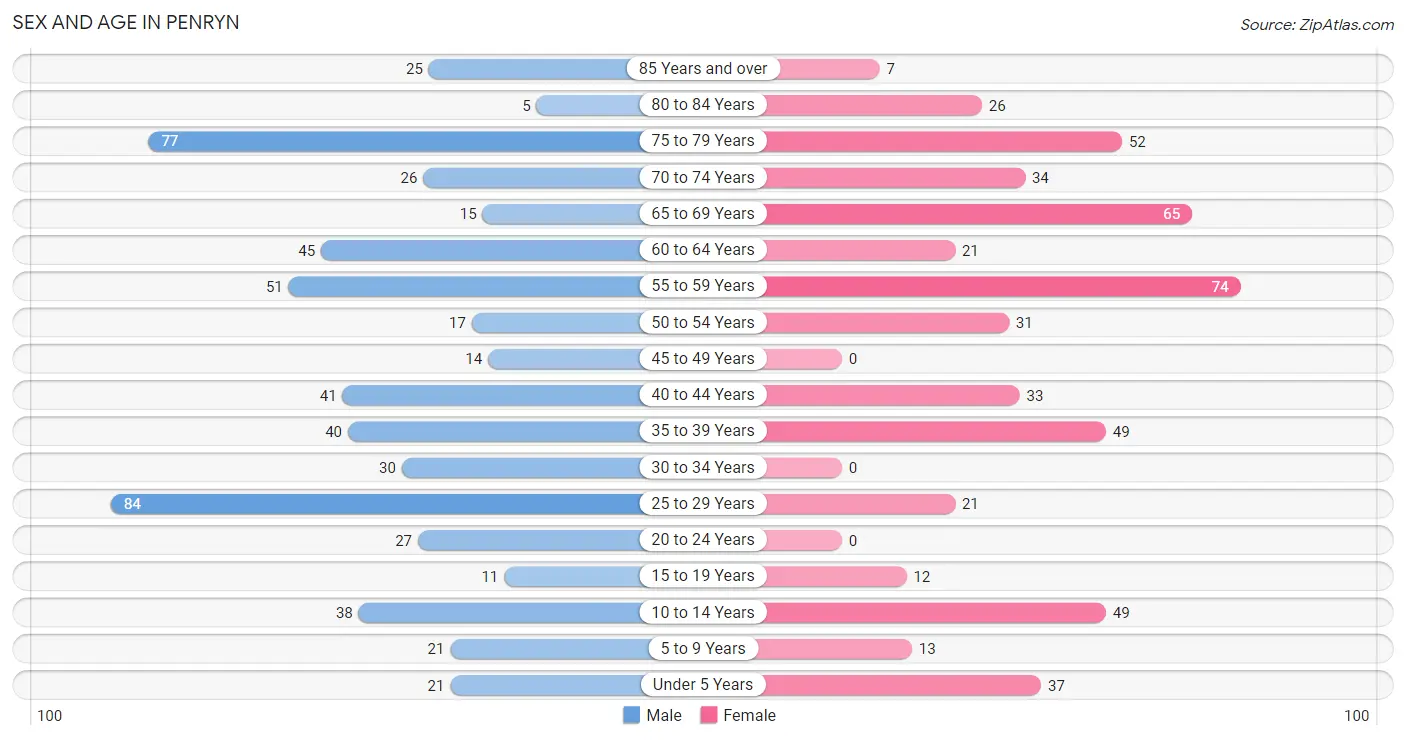
| Age Bracket | Male | Female |
| Under 5 Years | 21 (3.6%) | 37 (7.1%) |
| 5 to 9 Years | 21 (3.6%) | 13 (2.5%) |
| 10 to 14 Years | 38 (6.5%) | 49 (9.3%) |
| 15 to 19 Years | 11 (1.9%) | 12 (2.3%) |
| 20 to 24 Years | 27 (4.6%) | 0 (0.0%) |
| 25 to 29 Years | 84 (14.3%) | 21 (4.0%) |
| 30 to 34 Years | 30 (5.1%) | 0 (0.0%) |
| 35 to 39 Years | 40 (6.8%) | 49 (9.3%) |
| 40 to 44 Years | 41 (7.0%) | 33 (6.3%) |
| 45 to 49 Years | 14 (2.4%) | 0 (0.0%) |
| 50 to 54 Years | 17 (2.9%) | 31 (5.9%) |
| 55 to 59 Years | 51 (8.7%) | 74 (14.1%) |
| 60 to 64 Years | 45 (7.6%) | 21 (4.0%) |
| 65 to 69 Years | 15 (2.5%) | 65 (12.4%) |
| 70 to 74 Years | 26 (4.4%) | 34 (6.5%) |
| 75 to 79 Years | 77 (13.1%) | 52 (9.9%) |
| 80 to 84 Years | 5 (0.9%) | 26 (5.0%) |
| 85 Years and over | 25 (4.3%) | 7 (1.3%) |
| Total | 588 (100.0%) | 524 (100.0%) |
Families and Households in Penryn
Median Family Size in Penryn
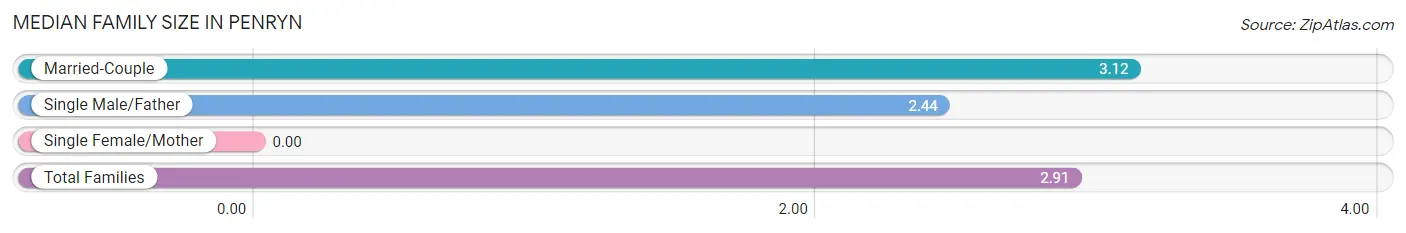
| Family Type | # Families | Family Size |
| Married-Couple | 215 (69.1%) | 3.12 |
| Single Male/Father | 96 (30.9%) | 2.44 |
| Single Female/Mother | 0 (0.0%) | - |
| Total Families | 311 (100.0%) | 2.91 |
Median Household Size in Penryn
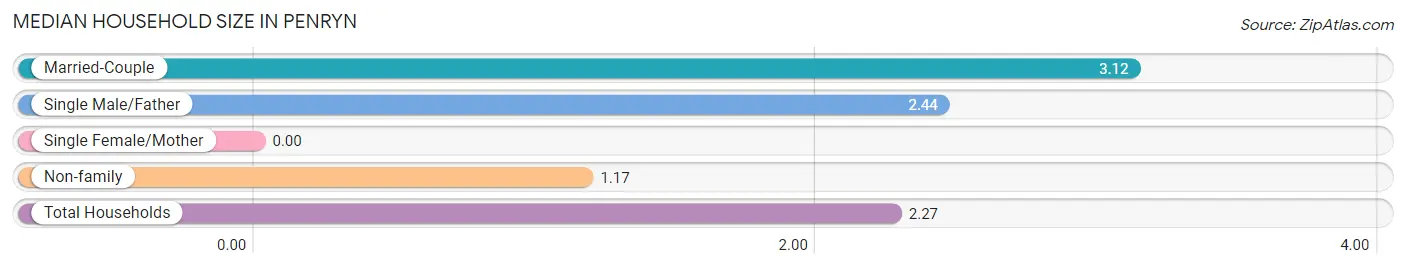
| Household Type | # Households | Household Size |
| Married-Couple | 215 (44.0%) | 3.12 |
| Single Male/Father | 96 (19.6%) | 2.44 |
| Single Female/Mother | 0 (0.0%) | - |
| Non-family | 178 (36.4%) | 1.17 |
| Total Households | 489 (100.0%) | 2.27 |
Household Size by Marriage Status in Penryn
Out of a total of 489 households in Penryn, 311 (63.6%) are family households, while 178 (36.4%) are nonfamily households. The most numerous type of family households are 2-person households, comprising 207, and the most common type of nonfamily households are 1-person households, comprising 158.
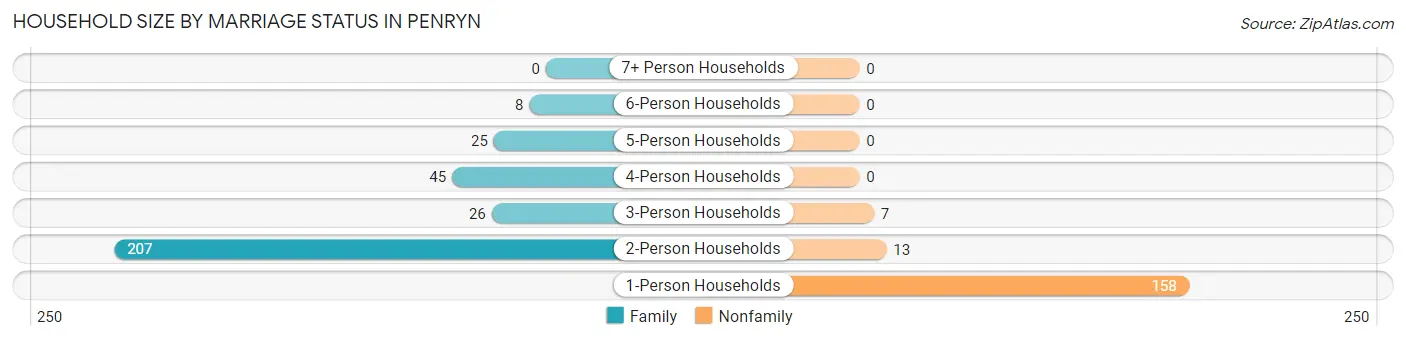
| Household Size | Family Households | Nonfamily Households |
| 1-Person Households | - | 158 (32.3%) |
| 2-Person Households | 207 (42.3%) | 13 (2.7%) |
| 3-Person Households | 26 (5.3%) | 7 (1.4%) |
| 4-Person Households | 45 (9.2%) | 0 (0.0%) |
| 5-Person Households | 25 (5.1%) | 0 (0.0%) |
| 6-Person Households | 8 (1.6%) | 0 (0.0%) |
| 7+ Person Households | 0 (0.0%) | 0 (0.0%) |
| Total | 311 (63.6%) | 178 (36.4%) |
Female Fertility in Penryn
Fertility by Age in Penryn
| Age Bracket | Women with Births | Births / 1,000 Women |
| 15 to 19 years | 0 (0.0%) | 0.0 |
| 20 to 34 years | 0 (0.0%) | 0.0 |
| 35 to 50 years | 0 (0.0%) | 0.0 |
| Total | 0 (0.0%) | 0.0 |
Fertility by Age by Marriage Status in Penryn
| Age Bracket | Married | Unmarried |
| 15 to 19 years | 0 (0.0%) | 0 (0.0%) |
| 20 to 34 years | 0 (0.0%) | 0 (0.0%) |
| 35 to 50 years | 0 (0.0%) | 0 (0.0%) |
| Total | 0 (0.0%) | 0 (0.0%) |
Fertility by Education in Penryn
| Educational Attainment | Women with Births | Births / 1,000 Women |
| Less than High School | 0 (0.0%) | 0.0 |
| High School Diploma | 0 (0.0%) | 0.0 |
| College or Associate's Degree | 0 (0.0%) | 0.0 |
| Bachelor's Degree | 0 (0.0%) | 0.0 |
| Graduate Degree | 0 (0.0%) | 0.0 |
| Total | 0 (0.0%) | 0.0 |
Fertility by Education by Marriage Status in Penryn
| Educational Attainment | Married | Unmarried |
| Less than High School | 0 (0.0%) | 0 (0.0%) |
| High School Diploma | 0 (0.0%) | 0 (0.0%) |
| College or Associate's Degree | 0 (0.0%) | 0 (0.0%) |
| Bachelor's Degree | 0 (0.0%) | 0 (0.0%) |
| Graduate Degree | 0 (0.0%) | 0 (0.0%) |
| Total | 0 (0.0%) | 0 (0.0%) |
Employment Characteristics in Penryn
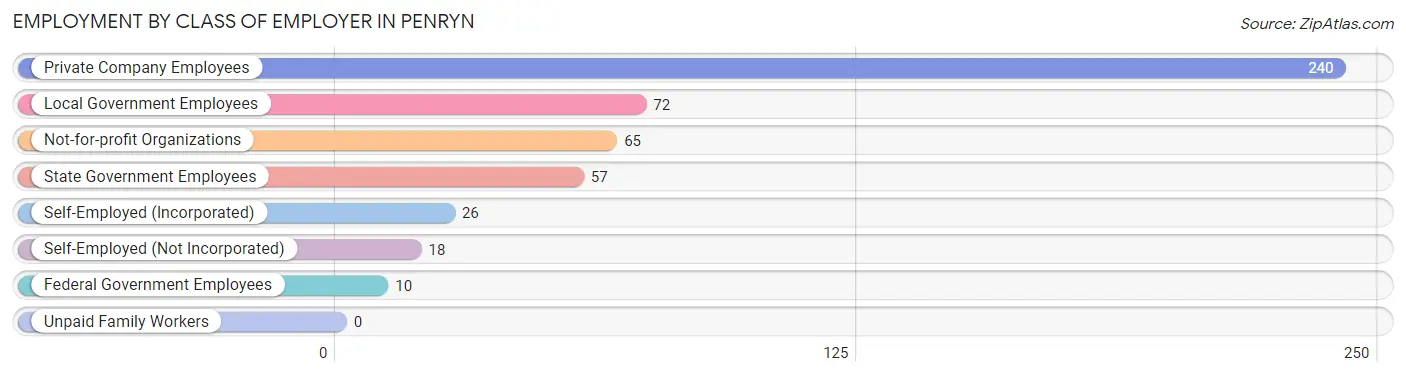
Employment by Class of Employer in Penryn
Among the 488 employed individuals in Penryn, private company employees (240 | 49.2%), local government employees (72 | 14.7%), and not-for-profit organizations (65 | 13.3%) make up the most common classes of employment.
| Employer Class | # Employees | % Employees |
| Private Company Employees | 240 | 49.2% |
| Self-Employed (Incorporated) | 26 | 5.3% |
| Self-Employed (Not Incorporated) | 18 | 3.7% |
| Not-for-profit Organizations | 65 | 13.3% |
| Local Government Employees | 72 | 14.7% |
| State Government Employees | 57 | 11.7% |
| Federal Government Employees | 10 | 2.1% |
| Unpaid Family Workers | 0 | 0.0% |
| Total | 488 | 100.0% |
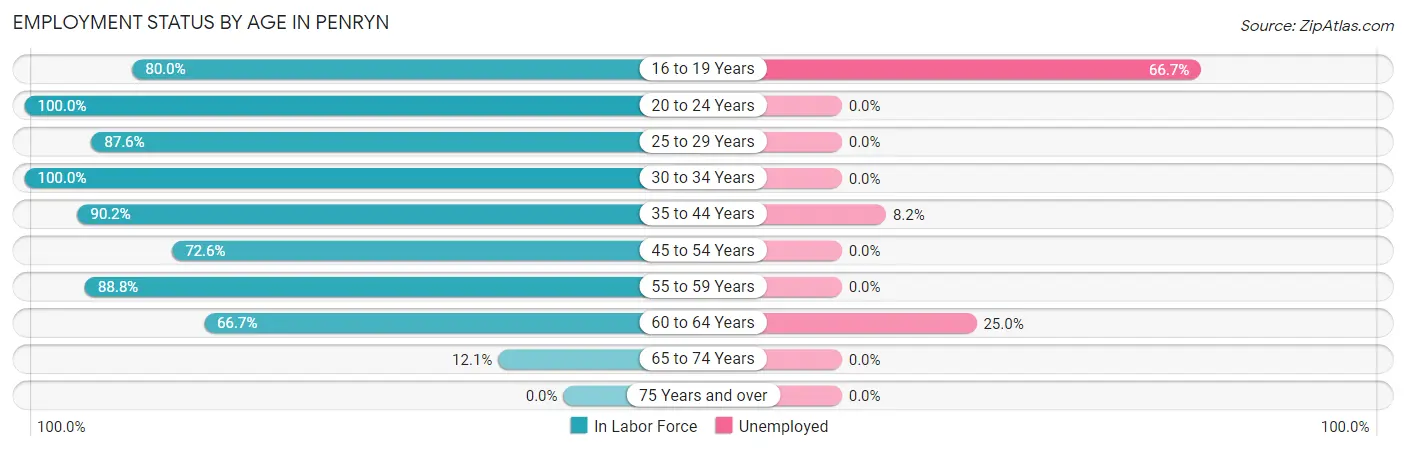
Employment Status by Age in Penryn
According to the labor force statistics for Penryn, out of the total population over 16 years of age (925), 56.8% or 525 individuals are in the labor force, with 5.9% or 31 of them unemployed. The age group with the highest labor force participation rate is 20 to 24 years, with 100.0% or 27 individuals in the labor force. Within the labor force, the 16 to 19 years age range has the highest percentage of unemployed individuals, with 66.7% or 8 of them being unemployed.
| Age Bracket | In Labor Force | Unemployed |
| 16 to 19 Years | 12 (80.0%) | 8 (66.7%) |
| 20 to 24 Years | 27 (100.0%) | 0 (0.0%) |
| 25 to 29 Years | 92 (87.6%) | 0 (0.0%) |
| 30 to 34 Years | 30 (100.0%) | 0 (0.0%) |
| 35 to 44 Years | 147 (90.2%) | 12 (8.2%) |
| 45 to 54 Years | 45 (72.6%) | 0 (0.0%) |
| 55 to 59 Years | 111 (88.8%) | 0 (0.0%) |
| 60 to 64 Years | 44 (66.7%) | 11 (25.0%) |
| 65 to 74 Years | 17 (12.1%) | 0 (0.0%) |
| 75 Years and over | 0 (0.0%) | 0 (0.0%) |
| Total | 525 (56.8%) | 31 (5.9%) |
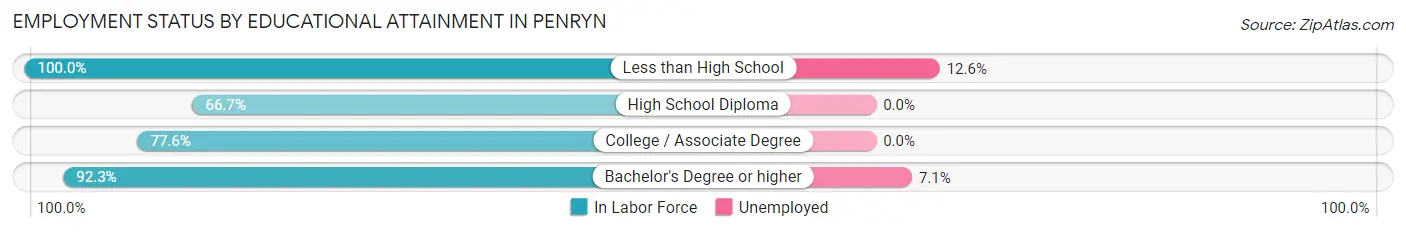
Employment Status by Educational Attainment in Penryn
According to labor force statistics for Penryn, 85.1% of individuals (469) out of the total population between 25 and 64 years of age (551) are in the labor force, with 4.9% or 23 of them being unemployed. The group with the highest labor force participation rate are those with the educational attainment of less than high school, with 100.0% or 95 individuals in the labor force. Within the labor force, individuals with less than high school education have the highest percentage of unemployment, with 12.6% or 12 of them being unemployed.
| Educational Attainment | In Labor Force | Unemployed |
| Less than High School | 95 (100.0%) | 12 (12.6%) |
| High School Diploma | 28 (66.7%) | 0 (0.0%) |
| College / Associate Degree | 190 (77.6%) | 0 (0.0%) |
| Bachelor's Degree or higher | 156 (92.3%) | 12 (7.1%) |
| Total | 469 (85.1%) | 27 (4.9%) |
Employment Occupations by Sex in Penryn
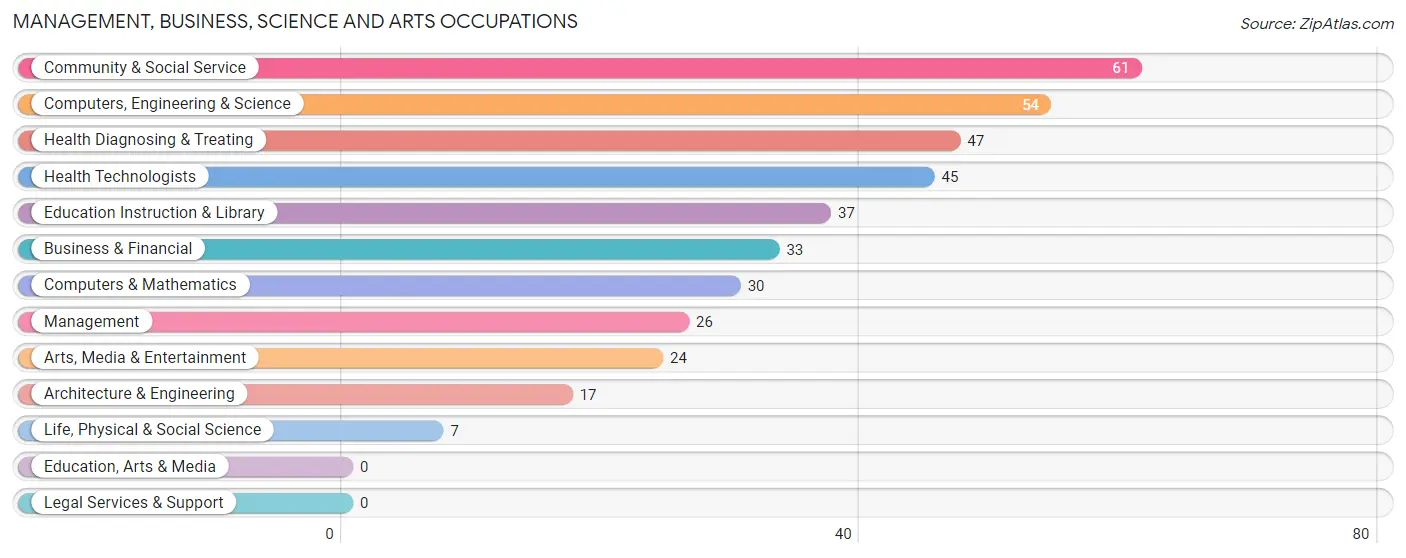
Management, Business, Science and Arts Occupations
The most common Management, Business, Science and Arts occupations in Penryn are Community & Social Service (61 | 12.3%), Computers, Engineering & Science (54 | 10.9%), Health Diagnosing & Treating (47 | 9.5%), Health Technologists (45 | 9.1%), and Education Instruction & Library (37 | 7.5%).
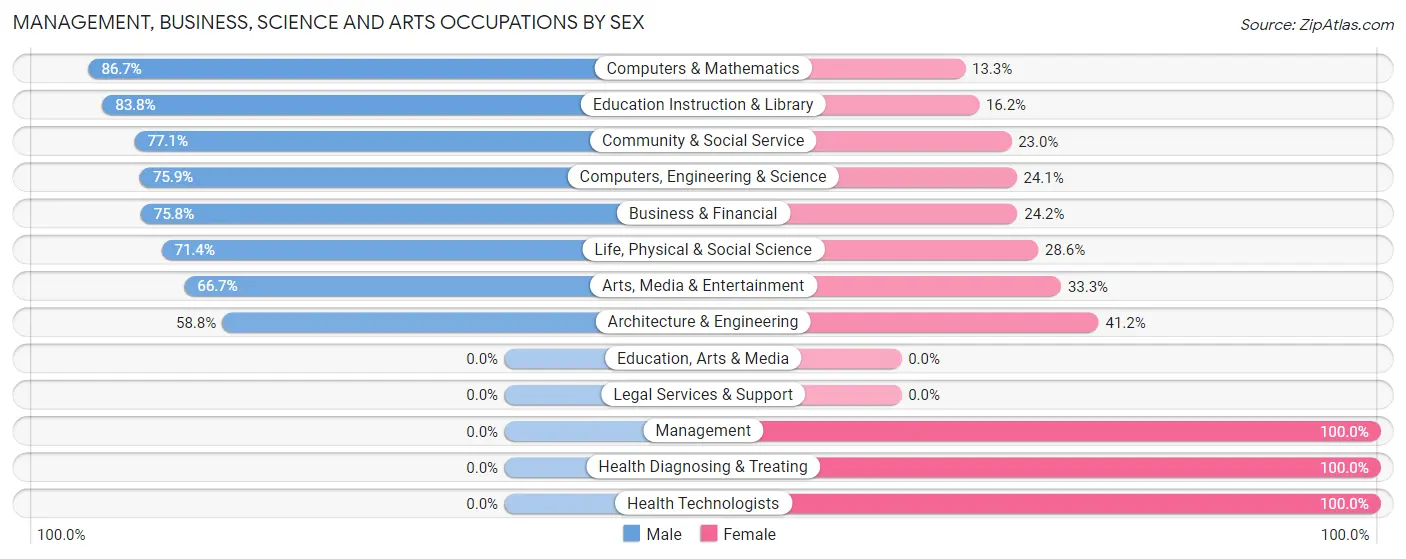
Management, Business, Science and Arts Occupations by Sex
Within the Management, Business, Science and Arts occupations in Penryn, the most male-oriented occupations are Computers & Mathematics (86.7%), Education Instruction & Library (83.8%), and Community & Social Service (77.0%), while the most female-oriented occupations are Management (100.0%), Health Diagnosing & Treating (100.0%), and Health Technologists (100.0%).
| Occupation | Male | Female |
| Management | 0 (0.0%) | 26 (100.0%) |
| Business & Financial | 25 (75.8%) | 8 (24.2%) |
| Computers, Engineering & Science | 41 (75.9%) | 13 (24.1%) |
| Computers & Mathematics | 26 (86.7%) | 4 (13.3%) |
| Architecture & Engineering | 10 (58.8%) | 7 (41.2%) |
| Life, Physical & Social Science | 5 (71.4%) | 2 (28.6%) |
| Community & Social Service | 47 (77.0%) | 14 (23.0%) |
| Education, Arts & Media | 0 (0.0%) | 0 (0.0%) |
| Legal Services & Support | 0 (0.0%) | 0 (0.0%) |
| Education Instruction & Library | 31 (83.8%) | 6 (16.2%) |
| Arts, Media & Entertainment | 16 (66.7%) | 8 (33.3%) |
| Health Diagnosing & Treating | 0 (0.0%) | 47 (100.0%) |
| Health Technologists | 0 (0.0%) | 45 (100.0%) |
| Total (Category) | 113 (51.1%) | 108 (48.9%) |
| Total (Overall) | 321 (65.0%) | 173 (35.0%) |
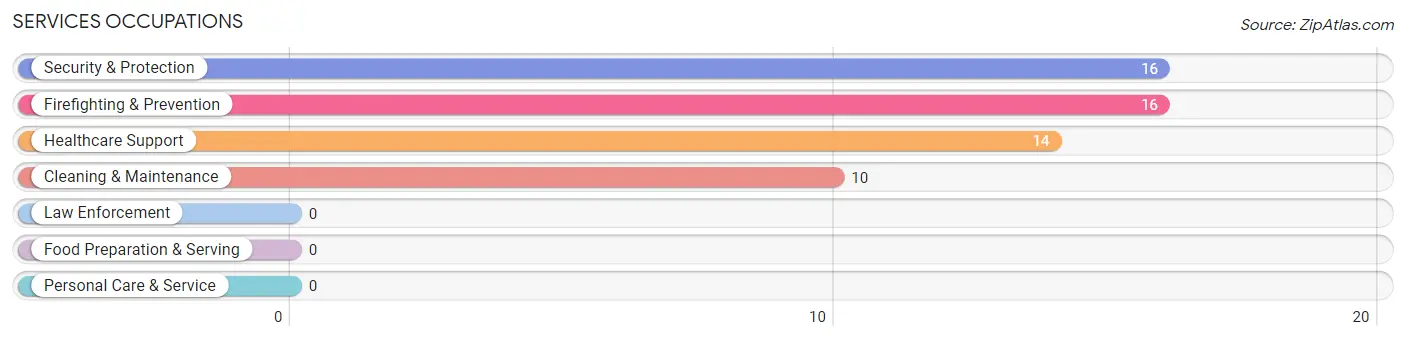
Services Occupations
The most common Services occupations in Penryn are Security & Protection (16 | 3.2%), Firefighting & Prevention (16 | 3.2%), Healthcare Support (14 | 2.8%), and Cleaning & Maintenance (10 | 2.0%).
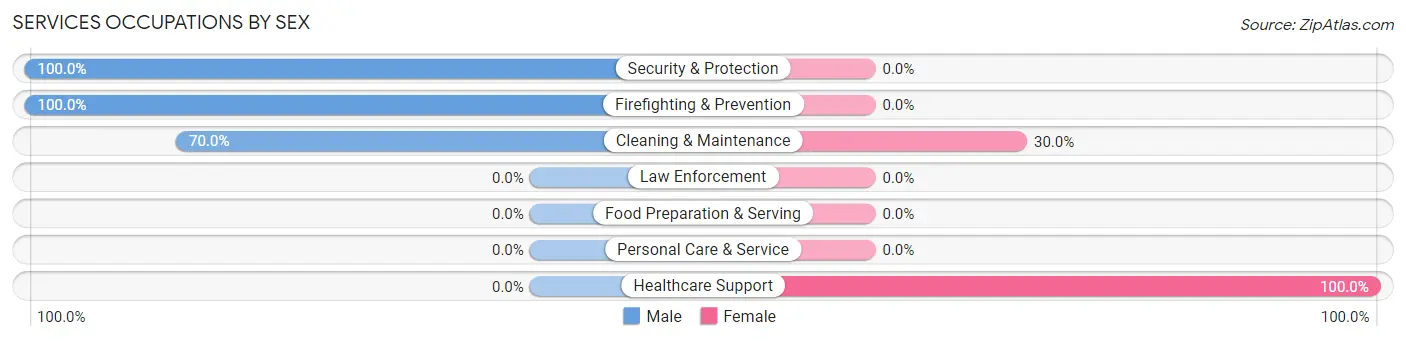
Services Occupations by Sex
Within the Services occupations in Penryn, the most male-oriented occupations are Security & Protection (100.0%), Firefighting & Prevention (100.0%), and Cleaning & Maintenance (70.0%), while the most female-oriented occupations are Healthcare Support (100.0%), and Cleaning & Maintenance (30.0%).
| Occupation | Male | Female |
| Healthcare Support | 0 (0.0%) | 14 (100.0%) |
| Security & Protection | 16 (100.0%) | 0 (0.0%) |
| Firefighting & Prevention | 16 (100.0%) | 0 (0.0%) |
| Law Enforcement | 0 (0.0%) | 0 (0.0%) |
| Food Preparation & Serving | 0 (0.0%) | 0 (0.0%) |
| Cleaning & Maintenance | 7 (70.0%) | 3 (30.0%) |
| Personal Care & Service | 0 (0.0%) | 0 (0.0%) |
| Total (Category) | 23 (57.5%) | 17 (42.5%) |
| Total (Overall) | 321 (65.0%) | 173 (35.0%) |
Sales and Office Occupations
The most common Sales and Office occupations in Penryn are Sales & Related (71 | 14.4%), and Office & Administration (45 | 9.1%).
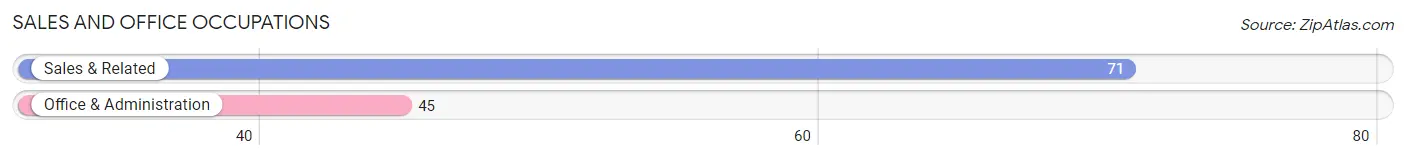
Sales and Office Occupations by Sex

| Occupation | Male | Female |
| Sales & Related | 59 (83.1%) | 12 (16.9%) |
| Office & Administration | 14 (31.1%) | 31 (68.9%) |
| Total (Category) | 73 (62.9%) | 43 (37.1%) |
| Total (Overall) | 321 (65.0%) | 173 (35.0%) |
Natural Resources, Construction and Maintenance Occupations
The most common Natural Resources, Construction and Maintenance occupations in Penryn are Construction & Extraction (89 | 18.0%), Installation, Maintenance & Repair (11 | 2.2%), and Farming, Fishing & Forestry (6 | 1.2%).
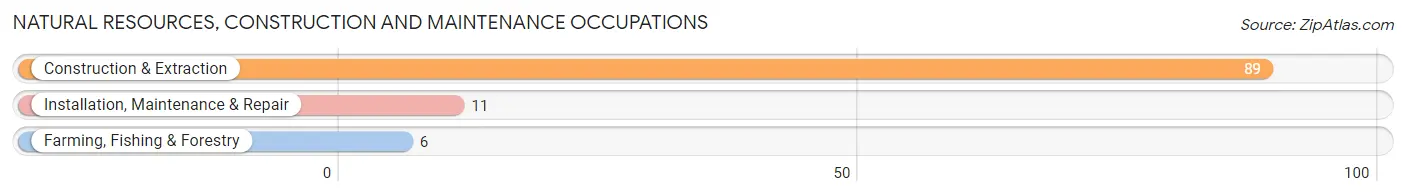
Natural Resources, Construction and Maintenance Occupations by Sex
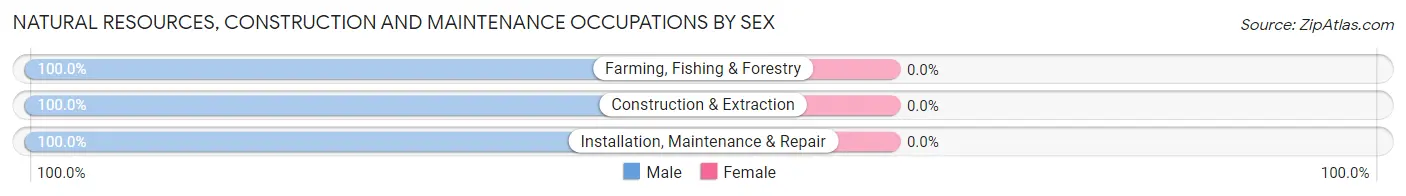
| Occupation | Male | Female |
| Farming, Fishing & Forestry | 6 (100.0%) | 0 (0.0%) |
| Construction & Extraction | 89 (100.0%) | 0 (0.0%) |
| Installation, Maintenance & Repair | 11 (100.0%) | 0 (0.0%) |
| Total (Category) | 106 (100.0%) | 0 (0.0%) |
| Total (Overall) | 321 (65.0%) | 173 (35.0%) |
Production, Transportation and Moving Occupations
The most common Production, Transportation and Moving occupations in Penryn are Material Moving (6 | 1.2%), and Production (5 | 1.0%).
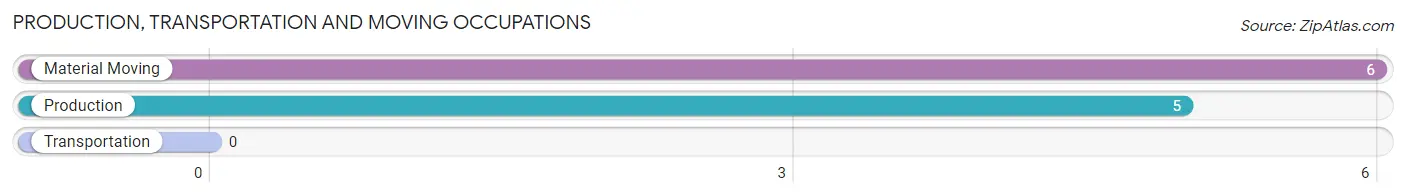
Production, Transportation and Moving Occupations by Sex
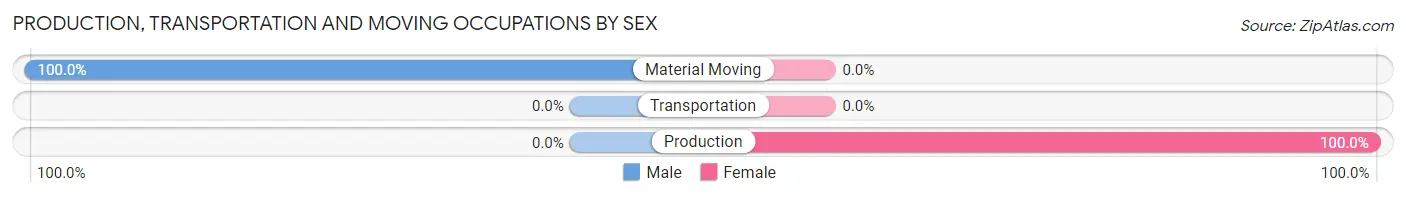
| Occupation | Male | Female |
| Production | 0 (0.0%) | 5 (100.0%) |
| Transportation | 0 (0.0%) | 0 (0.0%) |
| Material Moving | 6 (100.0%) | 0 (0.0%) |
| Total (Category) | 6 (54.5%) | 5 (45.5%) |
| Total (Overall) | 321 (65.0%) | 173 (35.0%) |
Employment Industries by Sex in Penryn
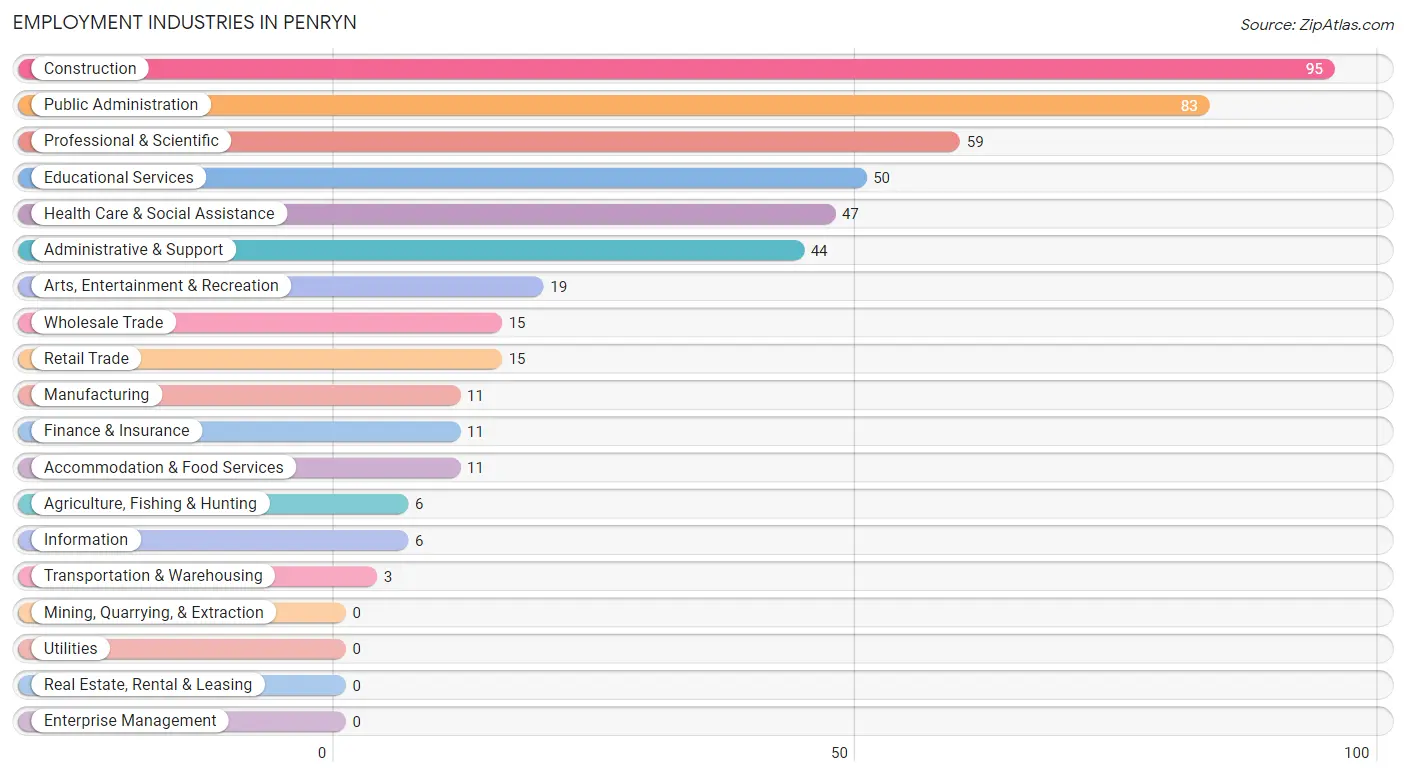
Employment Industries in Penryn
The major employment industries in Penryn include Construction (95 | 19.2%), Public Administration (83 | 16.8%), Professional & Scientific (59 | 11.9%), Educational Services (50 | 10.1%), and Health Care & Social Assistance (47 | 9.5%).
Employment Industries by Sex in Penryn
The Penryn industries that see more men than women are Agriculture, Fishing & Hunting (100.0%), Wholesale Trade (100.0%), and Finance & Insurance (100.0%), whereas the industries that tend to have a higher number of women are Transportation & Warehousing (100.0%), Information (100.0%), and Health Care & Social Assistance (100.0%).
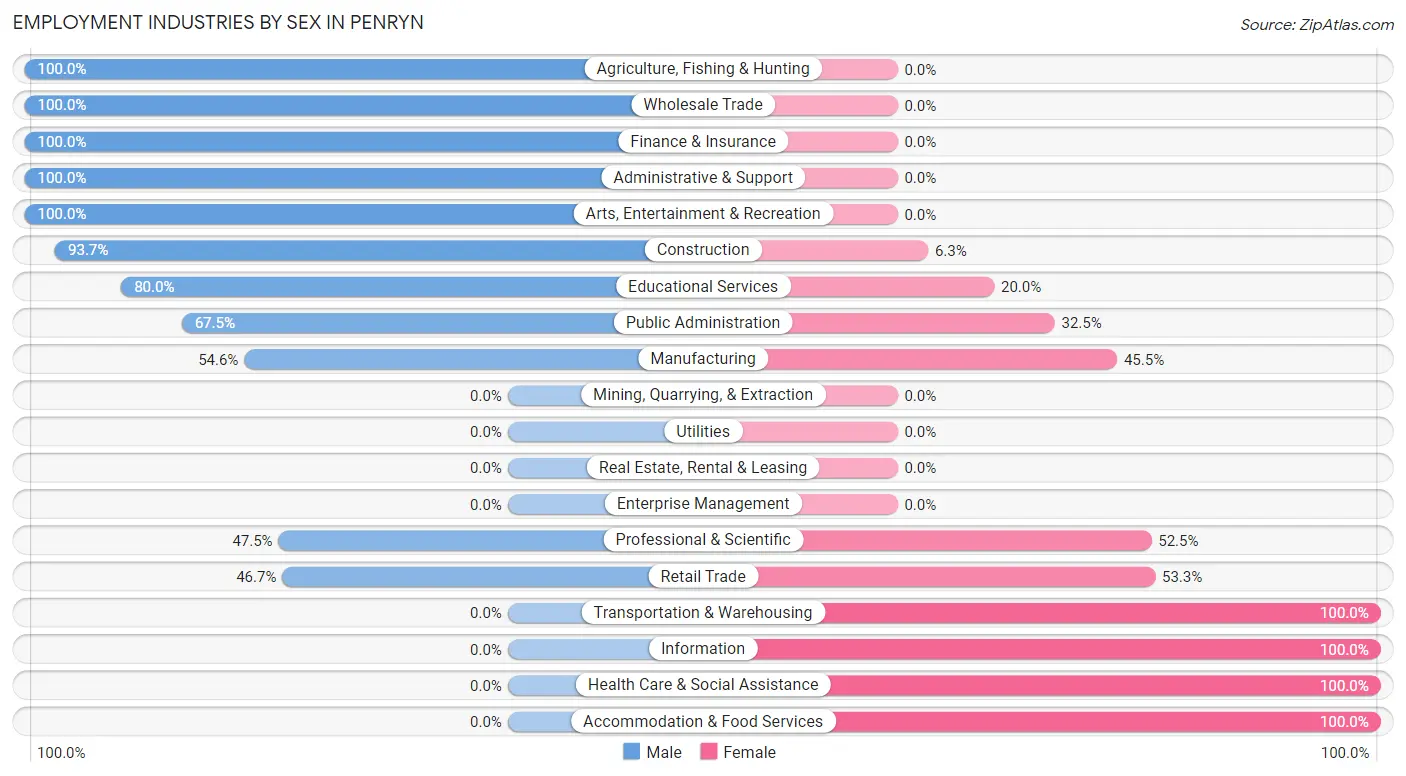
| Industry | Male | Female |
| Agriculture, Fishing & Hunting | 6 (100.0%) | 0 (0.0%) |
| Mining, Quarrying, & Extraction | 0 (0.0%) | 0 (0.0%) |
| Construction | 89 (93.7%) | 6 (6.3%) |
| Manufacturing | 6 (54.5%) | 5 (45.5%) |
| Wholesale Trade | 15 (100.0%) | 0 (0.0%) |
| Retail Trade | 7 (46.7%) | 8 (53.3%) |
| Transportation & Warehousing | 0 (0.0%) | 3 (100.0%) |
| Utilities | 0 (0.0%) | 0 (0.0%) |
| Information | 0 (0.0%) | 6 (100.0%) |
| Finance & Insurance | 11 (100.0%) | 0 (0.0%) |
| Real Estate, Rental & Leasing | 0 (0.0%) | 0 (0.0%) |
| Professional & Scientific | 28 (47.5%) | 31 (52.5%) |
| Enterprise Management | 0 (0.0%) | 0 (0.0%) |
| Administrative & Support | 44 (100.0%) | 0 (0.0%) |
| Educational Services | 40 (80.0%) | 10 (20.0%) |
| Health Care & Social Assistance | 0 (0.0%) | 47 (100.0%) |
| Arts, Entertainment & Recreation | 19 (100.0%) | 0 (0.0%) |
| Accommodation & Food Services | 0 (0.0%) | 11 (100.0%) |
| Public Administration | 56 (67.5%) | 27 (32.5%) |
| Total | 321 (65.0%) | 173 (35.0%) |
Education in Penryn
School Enrollment in Penryn
The most common levels of schooling among the 189 students in Penryn are middle school (83 | 43.9%), college / undergraduate (30 | 15.9%), and elementary school (27 | 14.3%).
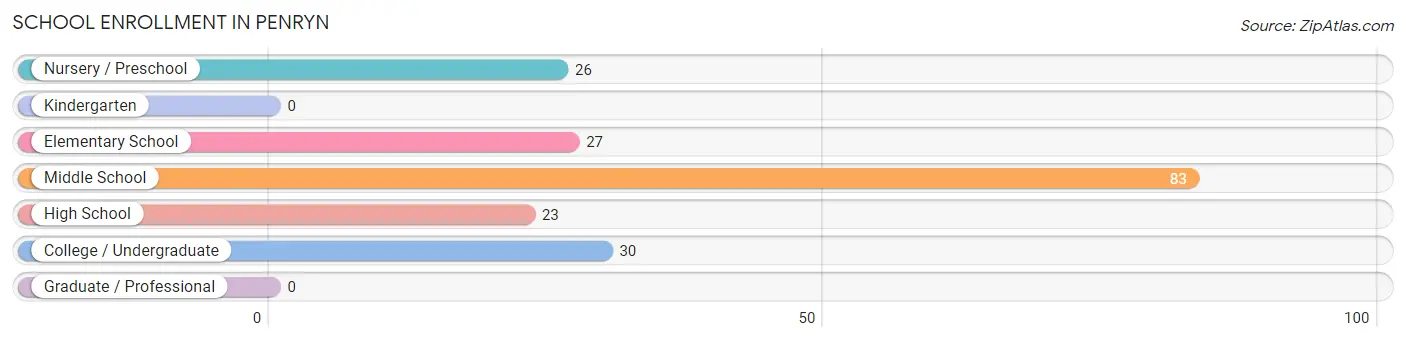
| School Level | # Students | % Students |
| Nursery / Preschool | 26 | 13.8% |
| Kindergarten | 0 | 0.0% |
| Elementary School | 27 | 14.3% |
| Middle School | 83 | 43.9% |
| High School | 23 | 12.2% |
| College / Undergraduate | 30 | 15.9% |
| Graduate / Professional | 0 | 0.0% |
| Total | 189 | 100.0% |
School Enrollment by Age by Funding Source in Penryn
Out of a total of 189 students who are enrolled in schools in Penryn, 42 (22.2%) attend a private institution, while the remaining 147 (77.8%) are enrolled in public schools. The age group of 3 to 4 year olds has the highest likelihood of being enrolled in private schools, with 15 (100.0% in the age bracket) enrolled. Conversely, the age group of 10 to 14 year olds has the lowest likelihood of being enrolled in a private school, with 87 (100.0% in the age bracket) attending a public institution.
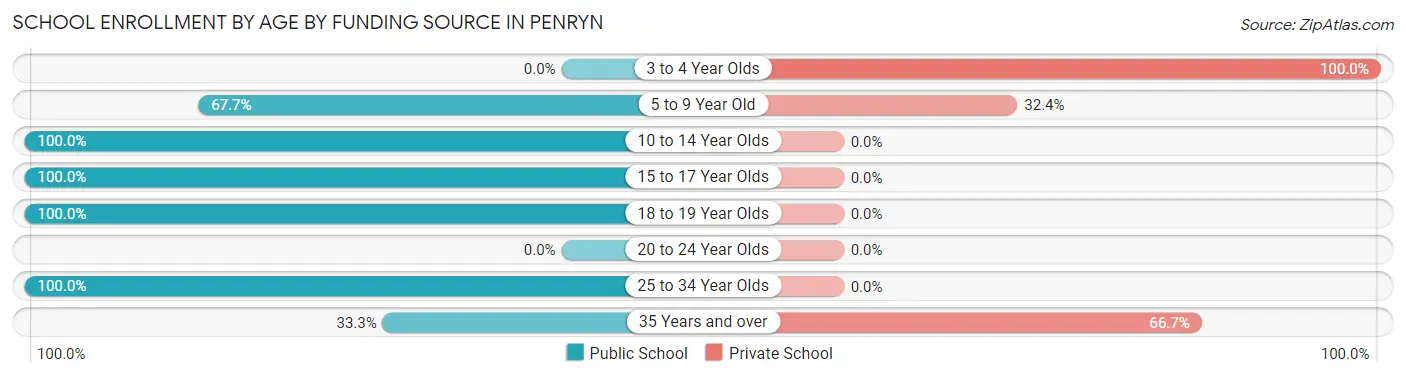
| Age Bracket | Public School | Private School |
| 3 to 4 Year Olds | 0 (0.0%) | 15 (100.0%) |
| 5 to 9 Year Old | 23 (67.6%) | 11 (32.4%) |
| 10 to 14 Year Olds | 87 (100.0%) | 0 (0.0%) |
| 15 to 17 Year Olds | 20 (100.0%) | 0 (0.0%) |
| 18 to 19 Year Olds | 3 (100.0%) | 0 (0.0%) |
| 20 to 24 Year Olds | 0 (0.0%) | 0 (0.0%) |
| 25 to 34 Year Olds | 6 (100.0%) | 0 (0.0%) |
| 35 Years and over | 8 (33.3%) | 16 (66.7%) |
| Total | 147 (77.8%) | 42 (22.2%) |
Educational Attainment by Field of Study in Penryn
Psychology (51 | 18.1%), computers & mathematics (50 | 17.8%), education (50 | 17.8%), engineering (28 | 10.0%), and social sciences (20 | 7.1%) are the most common fields of study among 281 individuals in Penryn who have obtained a bachelor's degree or higher.
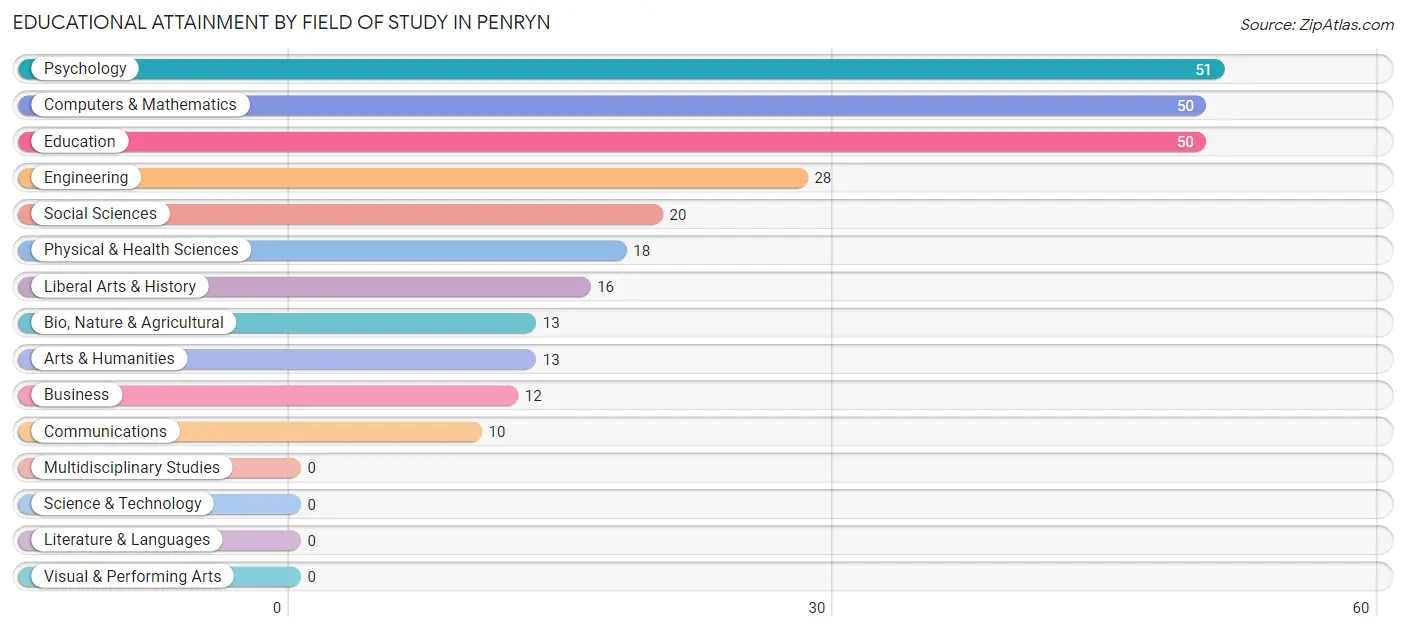
| Field of Study | # Graduates | % Graduates |
| Computers & Mathematics | 50 | 17.8% |
| Bio, Nature & Agricultural | 13 | 4.6% |
| Physical & Health Sciences | 18 | 6.4% |
| Psychology | 51 | 18.1% |
| Social Sciences | 20 | 7.1% |
| Engineering | 28 | 10.0% |
| Multidisciplinary Studies | 0 | 0.0% |
| Science & Technology | 0 | 0.0% |
| Business | 12 | 4.3% |
| Education | 50 | 17.8% |
| Literature & Languages | 0 | 0.0% |
| Liberal Arts & History | 16 | 5.7% |
| Visual & Performing Arts | 0 | 0.0% |
| Communications | 10 | 3.6% |
| Arts & Humanities | 13 | 4.6% |
| Total | 281 | 100.0% |
Transportation & Commute in Penryn
Vehicle Availability by Sex in Penryn
The most prevalent vehicle ownership categories in Penryn are males with 2 vehicles (129, accounting for 40.9%) and females with 2 vehicles (60, making up 74.6%).
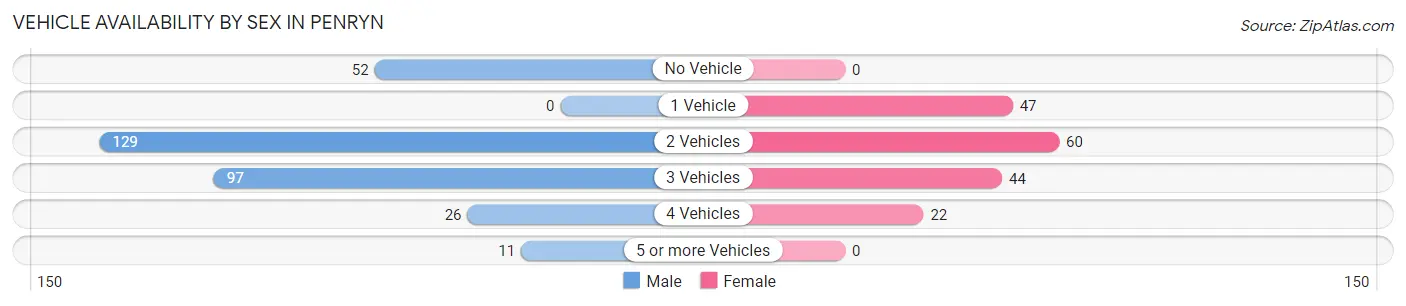
| Vehicles Available | Male | Female |
| No Vehicle | 52 (16.5%) | 0 (0.0%) |
| 1 Vehicle | 0 (0.0%) | 47 (27.2%) |
| 2 Vehicles | 129 (40.9%) | 60 (34.7%) |
| 3 Vehicles | 97 (30.8%) | 44 (25.4%) |
| 4 Vehicles | 26 (8.3%) | 22 (12.7%) |
| 5 or more Vehicles | 11 (3.5%) | 0 (0.0%) |
| Total | 315 (100.0%) | 173 (100.0%) |
Commute Time in Penryn
The most frequently occuring commute durations in Penryn are 15 to 19 minutes (131 commuters, 34.2%), 20 to 24 minutes (115 commuters, 30.0%), and 40 to 44 minutes (38 commuters, 9.9%).
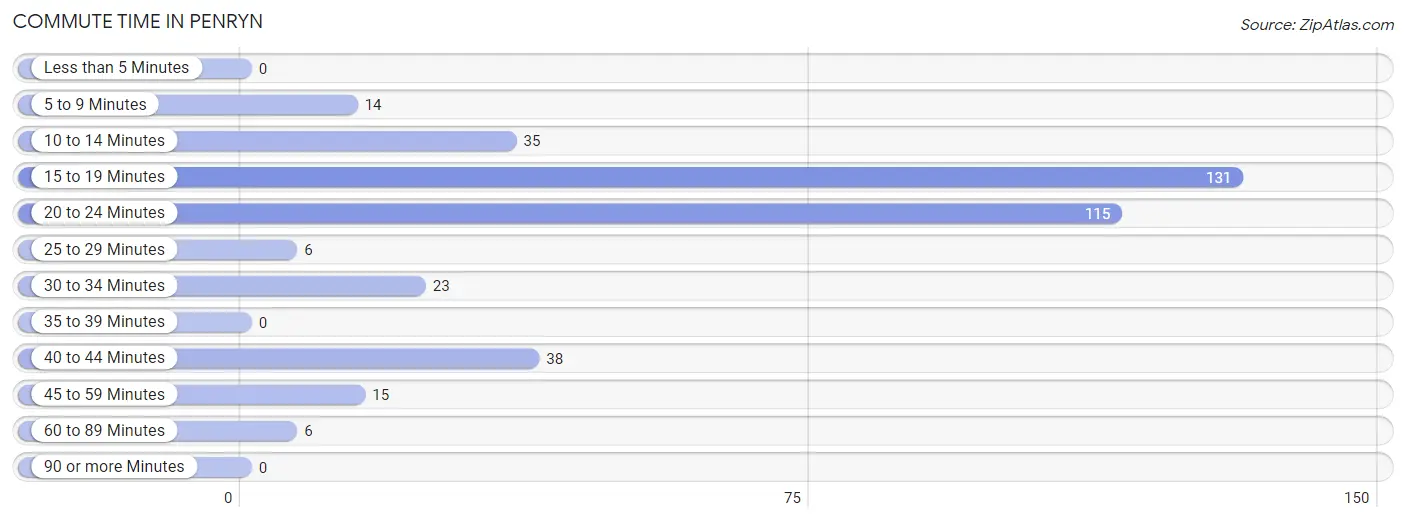
| Commute Time | # Commuters | % Commuters |
| Less than 5 Minutes | 0 | 0.0% |
| 5 to 9 Minutes | 14 | 3.7% |
| 10 to 14 Minutes | 35 | 9.1% |
| 15 to 19 Minutes | 131 | 34.2% |
| 20 to 24 Minutes | 115 | 30.0% |
| 25 to 29 Minutes | 6 | 1.6% |
| 30 to 34 Minutes | 23 | 6.0% |
| 35 to 39 Minutes | 0 | 0.0% |
| 40 to 44 Minutes | 38 | 9.9% |
| 45 to 59 Minutes | 15 | 3.9% |
| 60 to 89 Minutes | 6 | 1.6% |
| 90 or more Minutes | 0 | 0.0% |
Commute Time by Sex in Penryn
The most common commute times in Penryn are 15 to 19 minutes (109 commuters, 43.1%) for males and 20 to 24 minutes (77 commuters, 59.2%) for females.
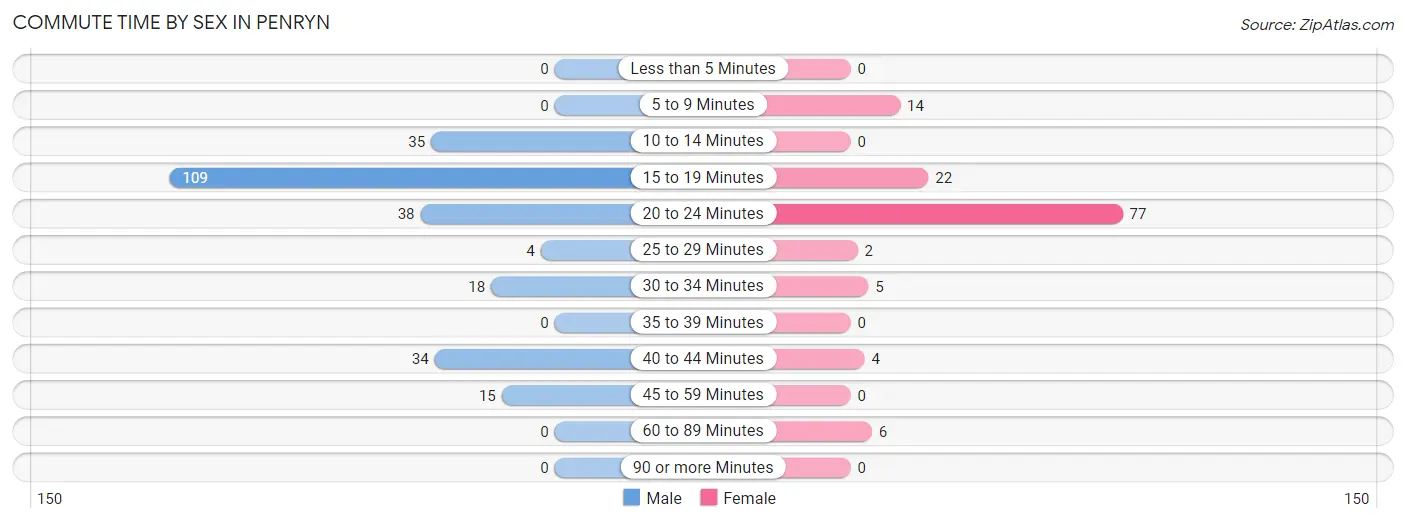
| Commute Time | Male | Female |
| Less than 5 Minutes | 0 (0.0%) | 0 (0.0%) |
| 5 to 9 Minutes | 0 (0.0%) | 14 (10.8%) |
| 10 to 14 Minutes | 35 (13.8%) | 0 (0.0%) |
| 15 to 19 Minutes | 109 (43.1%) | 22 (16.9%) |
| 20 to 24 Minutes | 38 (15.0%) | 77 (59.2%) |
| 25 to 29 Minutes | 4 (1.6%) | 2 (1.5%) |
| 30 to 34 Minutes | 18 (7.1%) | 5 (3.8%) |
| 35 to 39 Minutes | 0 (0.0%) | 0 (0.0%) |
| 40 to 44 Minutes | 34 (13.4%) | 4 (3.1%) |
| 45 to 59 Minutes | 15 (5.9%) | 0 (0.0%) |
| 60 to 89 Minutes | 0 (0.0%) | 6 (4.6%) |
| 90 or more Minutes | 0 (0.0%) | 0 (0.0%) |
Time of Departure to Work by Sex in Penryn
The most frequent times of departure to work in Penryn are 6:00 AM to 6:29 AM (103, 40.7%) for males and 5:00 AM to 5:29 AM (45, 34.6%) for females.
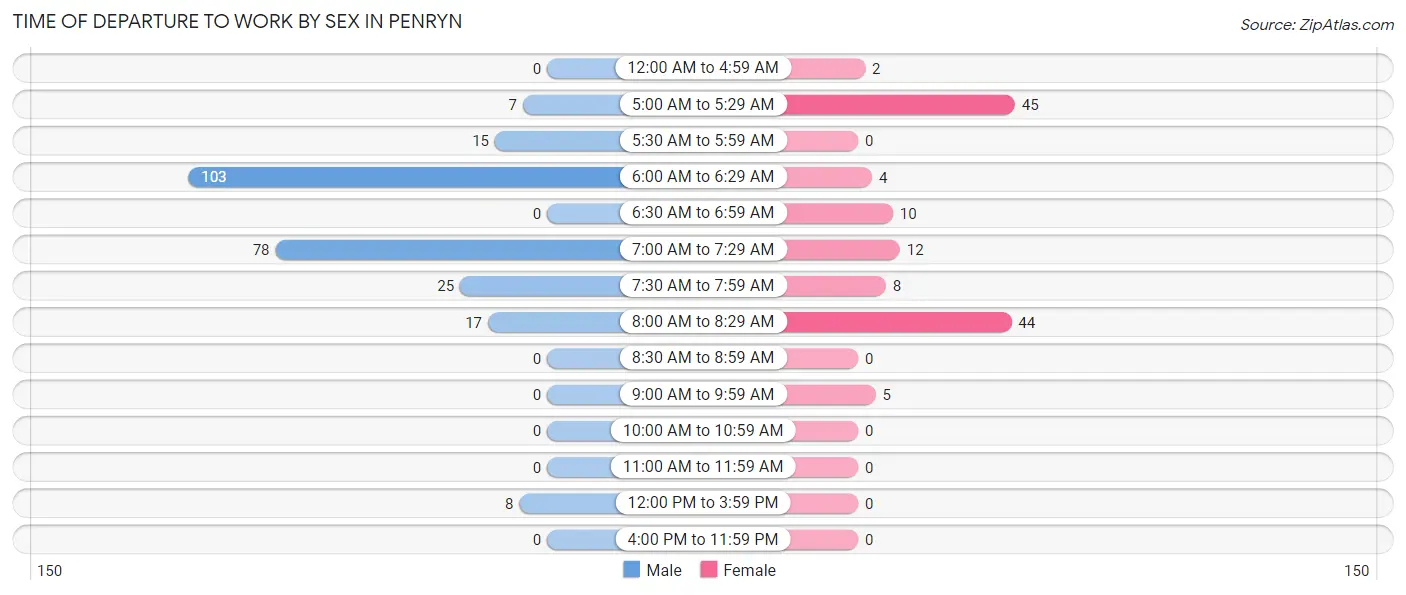
| Time of Departure | Male | Female |
| 12:00 AM to 4:59 AM | 0 (0.0%) | 2 (1.5%) |
| 5:00 AM to 5:29 AM | 7 (2.8%) | 45 (34.6%) |
| 5:30 AM to 5:59 AM | 15 (5.9%) | 0 (0.0%) |
| 6:00 AM to 6:29 AM | 103 (40.7%) | 4 (3.1%) |
| 6:30 AM to 6:59 AM | 0 (0.0%) | 10 (7.7%) |
| 7:00 AM to 7:29 AM | 78 (30.8%) | 12 (9.2%) |
| 7:30 AM to 7:59 AM | 25 (9.9%) | 8 (6.1%) |
| 8:00 AM to 8:29 AM | 17 (6.7%) | 44 (33.9%) |
| 8:30 AM to 8:59 AM | 0 (0.0%) | 0 (0.0%) |
| 9:00 AM to 9:59 AM | 0 (0.0%) | 5 (3.8%) |
| 10:00 AM to 10:59 AM | 0 (0.0%) | 0 (0.0%) |
| 11:00 AM to 11:59 AM | 0 (0.0%) | 0 (0.0%) |
| 12:00 PM to 3:59 PM | 8 (3.2%) | 0 (0.0%) |
| 4:00 PM to 11:59 PM | 0 (0.0%) | 0 (0.0%) |
| Total | 253 (100.0%) | 130 (100.0%) |
Housing Occupancy in Penryn
Occupancy by Ownership in Penryn
Of the total 489 dwellings in Penryn, owner-occupied units account for 415 (84.9%), while renter-occupied units make up 74 (15.1%).
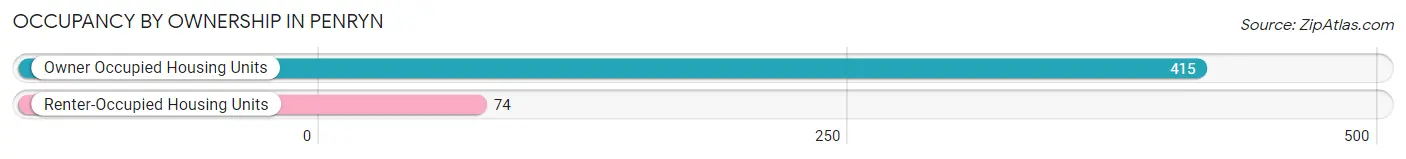
| Occupancy | # Housing Units | % Housing Units |
| Owner Occupied Housing Units | 415 | 84.9% |
| Renter-Occupied Housing Units | 74 | 15.1% |
| Total Occupied Housing Units | 489 | 100.0% |
Occupancy by Household Size in Penryn
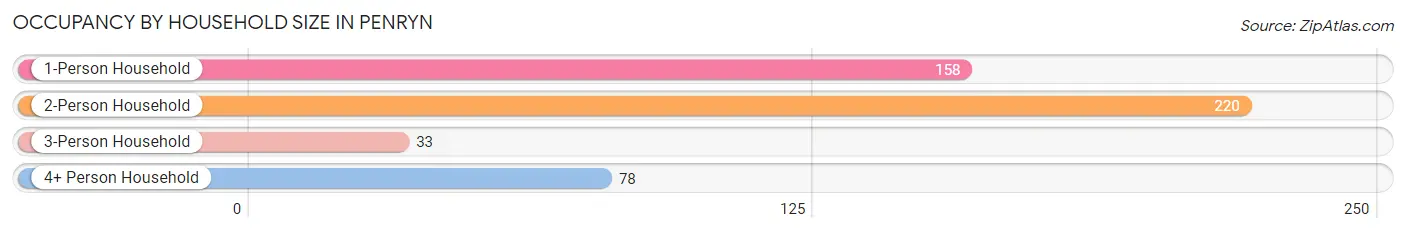
| Household Size | # Housing Units | % Housing Units |
| 1-Person Household | 158 | 32.3% |
| 2-Person Household | 220 | 45.0% |
| 3-Person Household | 33 | 6.8% |
| 4+ Person Household | 78 | 16.0% |
| Total Housing Units | 489 | 100.0% |
Occupancy by Ownership by Household Size in Penryn
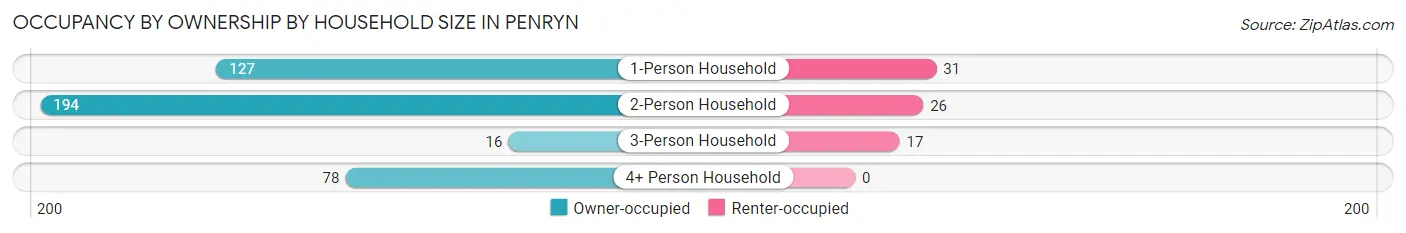
| Household Size | Owner-occupied | Renter-occupied |
| 1-Person Household | 127 (80.4%) | 31 (19.6%) |
| 2-Person Household | 194 (88.2%) | 26 (11.8%) |
| 3-Person Household | 16 (48.5%) | 17 (51.5%) |
| 4+ Person Household | 78 (100.0%) | 0 (0.0%) |
| Total Housing Units | 415 (84.9%) | 74 (15.1%) |
Occupancy by Educational Attainment in Penryn
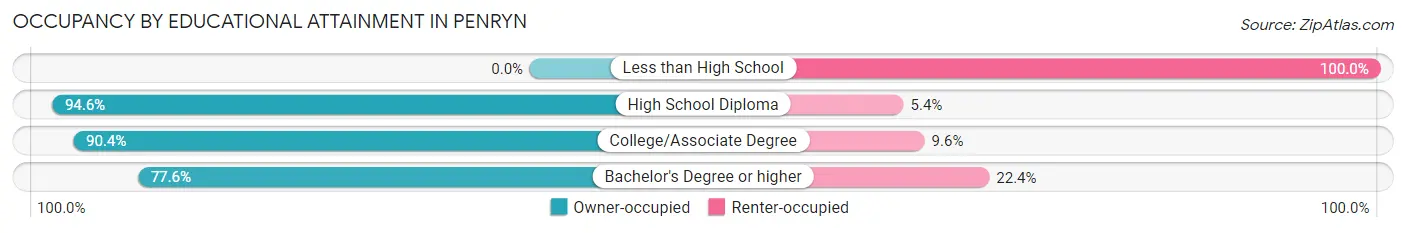
| Household Size | Owner-occupied | Renter-occupied |
| Less than High School | 0 (0.0%) | 12 (100.0%) |
| High School Diploma | 87 (94.6%) | 5 (5.4%) |
| College/Associate Degree | 207 (90.4%) | 22 (9.6%) |
| Bachelor's Degree or higher | 121 (77.6%) | 35 (22.4%) |
Occupancy by Age of Householder in Penryn
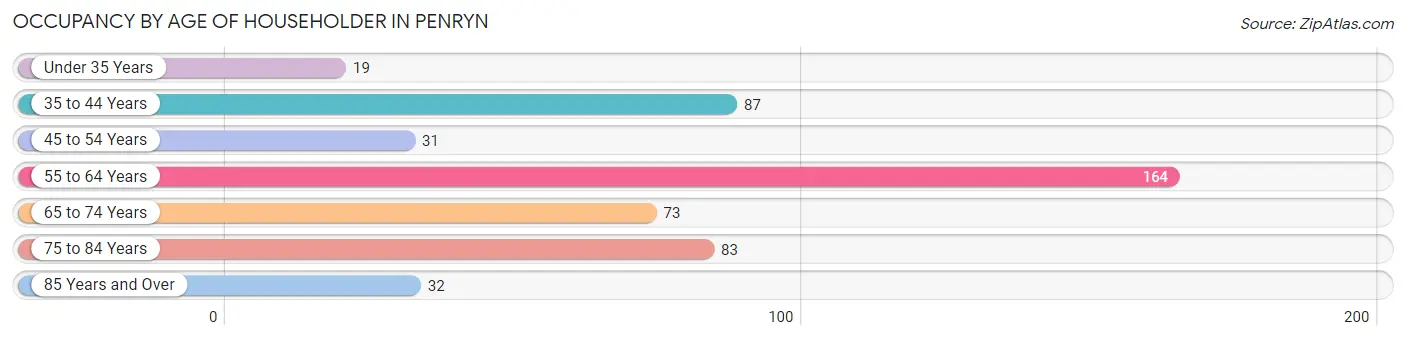
| Age Bracket | # Households | % Households |
| Under 35 Years | 19 | 3.9% |
| 35 to 44 Years | 87 | 17.8% |
| 45 to 54 Years | 31 | 6.3% |
| 55 to 64 Years | 164 | 33.5% |
| 65 to 74 Years | 73 | 14.9% |
| 75 to 84 Years | 83 | 17.0% |
| 85 Years and Over | 32 | 6.5% |
| Total | 489 | 100.0% |
Housing Finances in Penryn
Median Income by Occupancy in Penryn
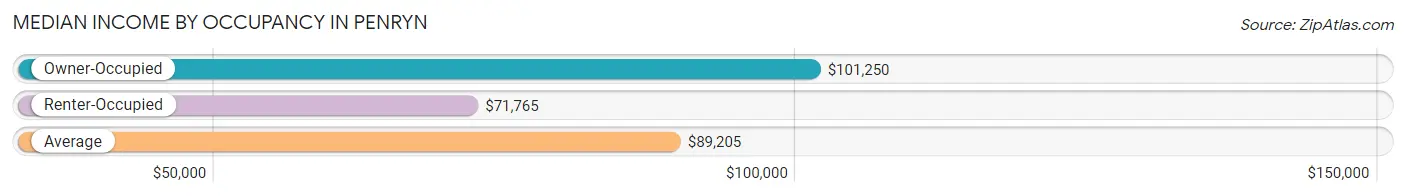
| Occupancy Type | # Households | Median Income |
| Owner-Occupied | 415 (84.9%) | $101,250 |
| Renter-Occupied | 74 (15.1%) | $71,765 |
| Average | 489 (100.0%) | $89,205 |
Occupancy by Householder Income Bracket in Penryn
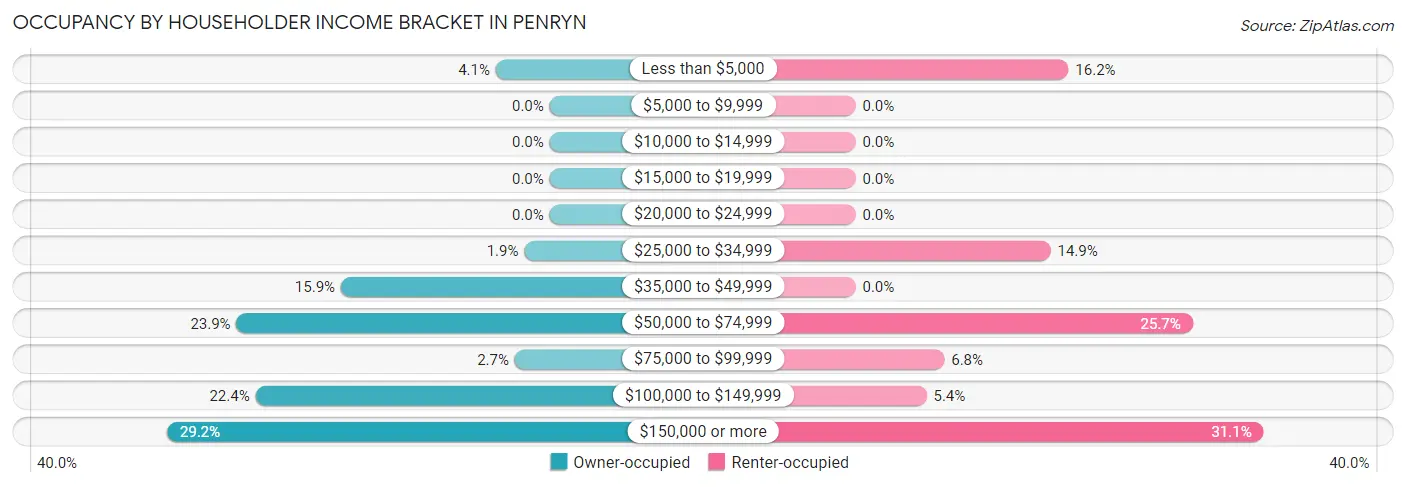
| Income Bracket | Owner-occupied | Renter-occupied |
| Less than $5,000 | 17 (4.1%) | 12 (16.2%) |
| $5,000 to $9,999 | 0 (0.0%) | 0 (0.0%) |
| $10,000 to $14,999 | 0 (0.0%) | 0 (0.0%) |
| $15,000 to $19,999 | 0 (0.0%) | 0 (0.0%) |
| $20,000 to $24,999 | 0 (0.0%) | 0 (0.0%) |
| $25,000 to $34,999 | 8 (1.9%) | 11 (14.9%) |
| $35,000 to $49,999 | 66 (15.9%) | 0 (0.0%) |
| $50,000 to $74,999 | 99 (23.9%) | 19 (25.7%) |
| $75,000 to $99,999 | 11 (2.6%) | 5 (6.8%) |
| $100,000 to $149,999 | 93 (22.4%) | 4 (5.4%) |
| $150,000 or more | 121 (29.2%) | 23 (31.1%) |
| Total | 415 (100.0%) | 74 (100.0%) |
Monthly Housing Cost Tiers in Penryn
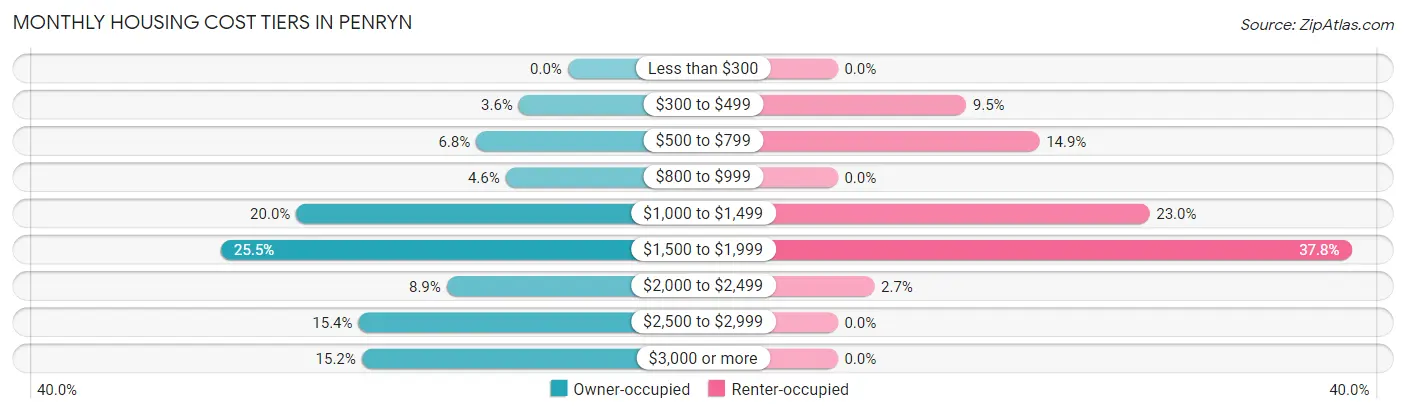
| Monthly Cost | Owner-occupied | Renter-occupied |
| Less than $300 | 0 (0.0%) | 0 (0.0%) |
| $300 to $499 | 15 (3.6%) | 7 (9.5%) |
| $500 to $799 | 28 (6.8%) | 11 (14.9%) |
| $800 to $999 | 19 (4.6%) | 0 (0.0%) |
| $1,000 to $1,499 | 83 (20.0%) | 17 (23.0%) |
| $1,500 to $1,999 | 106 (25.5%) | 28 (37.8%) |
| $2,000 to $2,499 | 37 (8.9%) | 2 (2.7%) |
| $2,500 to $2,999 | 64 (15.4%) | 0 (0.0%) |
| $3,000 or more | 63 (15.2%) | 0 (0.0%) |
| Total | 415 (100.0%) | 74 (100.0%) |
Physical Housing Characteristics in Penryn
Housing Structures in Penryn
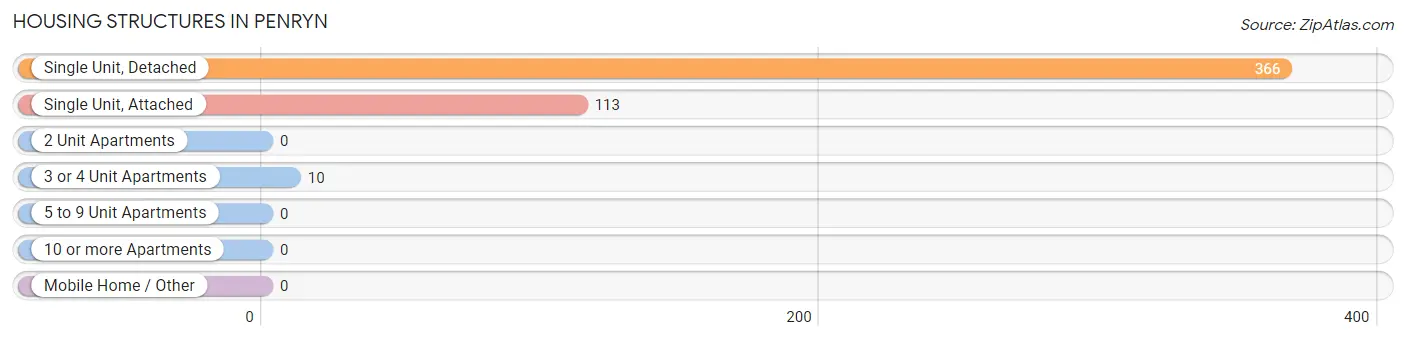
| Structure Type | # Housing Units | % Housing Units |
| Single Unit, Detached | 366 | 74.9% |
| Single Unit, Attached | 113 | 23.1% |
| 2 Unit Apartments | 0 | 0.0% |
| 3 or 4 Unit Apartments | 10 | 2.0% |
| 5 to 9 Unit Apartments | 0 | 0.0% |
| 10 or more Apartments | 0 | 0.0% |
| Mobile Home / Other | 0 | 0.0% |
| Total | 489 | 100.0% |
Housing Structures by Occupancy in Penryn
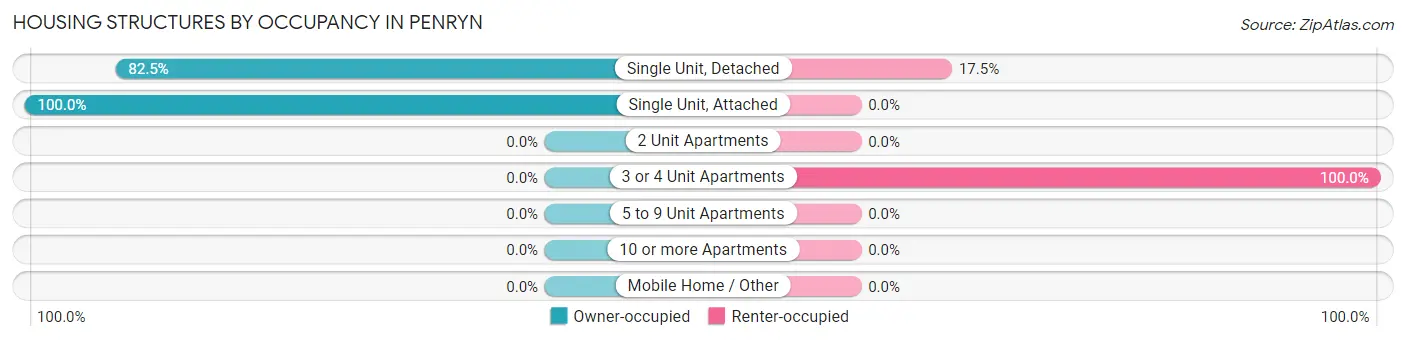
| Structure Type | Owner-occupied | Renter-occupied |
| Single Unit, Detached | 302 (82.5%) | 64 (17.5%) |
| Single Unit, Attached | 113 (100.0%) | 0 (0.0%) |
| 2 Unit Apartments | 0 (0.0%) | 0 (0.0%) |
| 3 or 4 Unit Apartments | 0 (0.0%) | 10 (100.0%) |
| 5 to 9 Unit Apartments | 0 (0.0%) | 0 (0.0%) |
| 10 or more Apartments | 0 (0.0%) | 0 (0.0%) |
| Mobile Home / Other | 0 (0.0%) | 0 (0.0%) |
| Total | 415 (84.9%) | 74 (15.1%) |
Housing Structures by Number of Rooms in Penryn
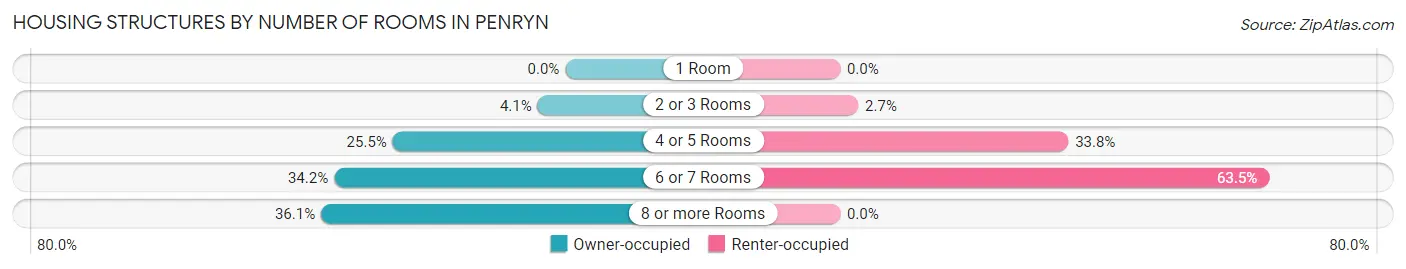
| Number of Rooms | Owner-occupied | Renter-occupied |
| 1 Room | 0 (0.0%) | 0 (0.0%) |
| 2 or 3 Rooms | 17 (4.1%) | 2 (2.7%) |
| 4 or 5 Rooms | 106 (25.5%) | 25 (33.8%) |
| 6 or 7 Rooms | 142 (34.2%) | 47 (63.5%) |
| 8 or more Rooms | 150 (36.1%) | 0 (0.0%) |
| Total | 415 (100.0%) | 74 (100.0%) |
Housing Structure by Heating Type in Penryn
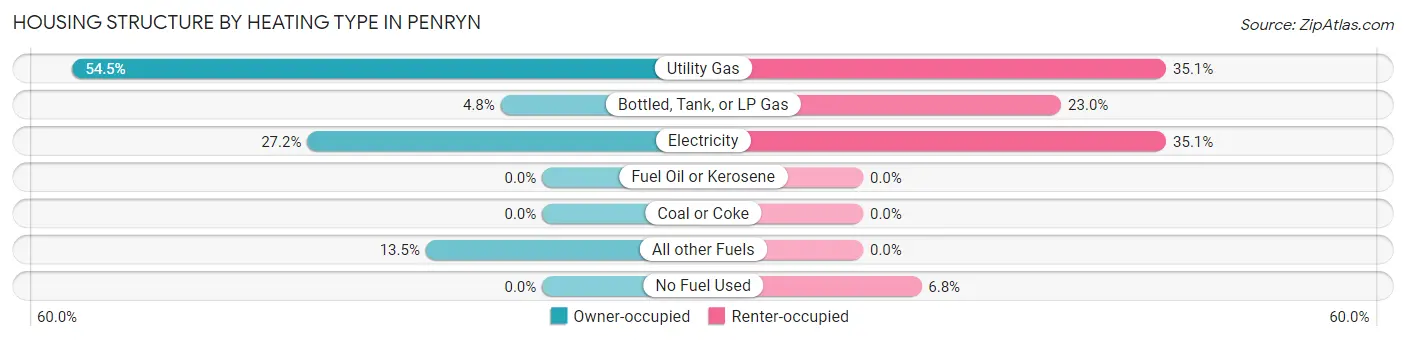
| Heating Type | Owner-occupied | Renter-occupied |
| Utility Gas | 226 (54.5%) | 26 (35.1%) |
| Bottled, Tank, or LP Gas | 20 (4.8%) | 17 (23.0%) |
| Electricity | 113 (27.2%) | 26 (35.1%) |
| Fuel Oil or Kerosene | 0 (0.0%) | 0 (0.0%) |
| Coal or Coke | 0 (0.0%) | 0 (0.0%) |
| All other Fuels | 56 (13.5%) | 0 (0.0%) |
| No Fuel Used | 0 (0.0%) | 5 (6.8%) |
| Total | 415 (100.0%) | 74 (100.0%) |
Household Vehicle Usage in Penryn
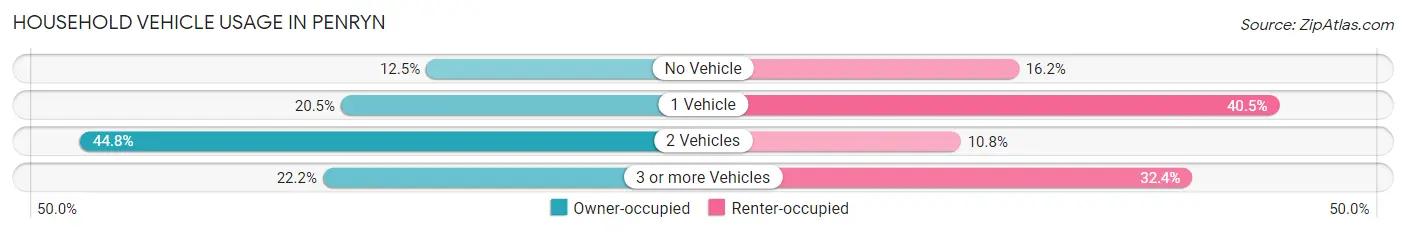
| Vehicles per Household | Owner-occupied | Renter-occupied |
| No Vehicle | 52 (12.5%) | 12 (16.2%) |
| 1 Vehicle | 85 (20.5%) | 30 (40.5%) |
| 2 Vehicles | 186 (44.8%) | 8 (10.8%) |
| 3 or more Vehicles | 92 (22.2%) | 24 (32.4%) |
| Total | 415 (100.0%) | 74 (100.0%) |
Real Estate & Mortgages in Penryn
Real Estate and Mortgage Overview in Penryn
| Characteristic | Without Mortgage | With Mortgage |
| Housing Units | 154 | 261 |
| Median Property Value | $1,031,600 | $654,300 |
| Median Household Income | $55,714 | $102 |
| Monthly Housing Costs | $1,179 | $63 |
| Real Estate Taxes | - | - |
Property Value by Mortgage Status in Penryn
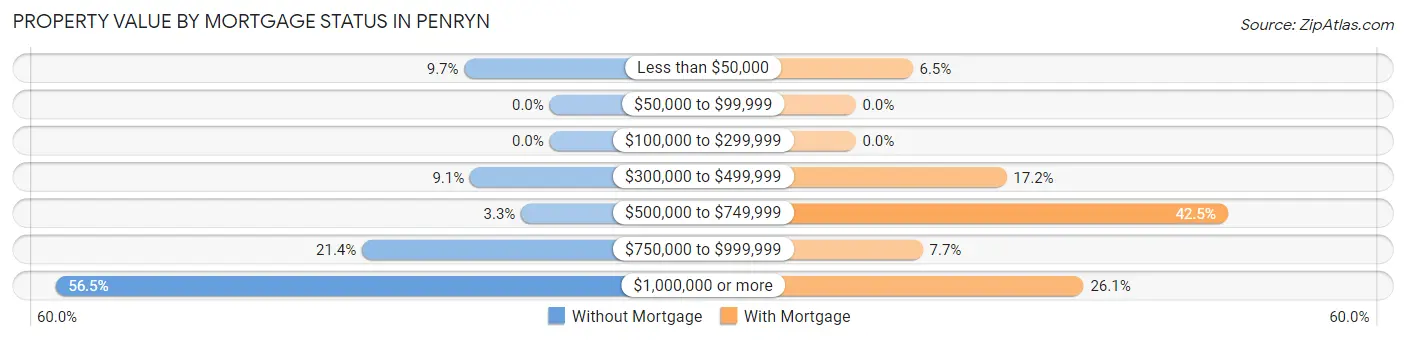
| Property Value | Without Mortgage | With Mortgage |
| Less than $50,000 | 15 (9.7%) | 17 (6.5%) |
| $50,000 to $99,999 | 0 (0.0%) | 0 (0.0%) |
| $100,000 to $299,999 | 0 (0.0%) | 0 (0.0%) |
| $300,000 to $499,999 | 14 (9.1%) | 45 (17.2%) |
| $500,000 to $749,999 | 5 (3.3%) | 111 (42.5%) |
| $750,000 to $999,999 | 33 (21.4%) | 20 (7.7%) |
| $1,000,000 or more | 87 (56.5%) | 68 (26.1%) |
| Total | 154 (100.0%) | 261 (100.0%) |
Household Income by Mortgage Status in Penryn
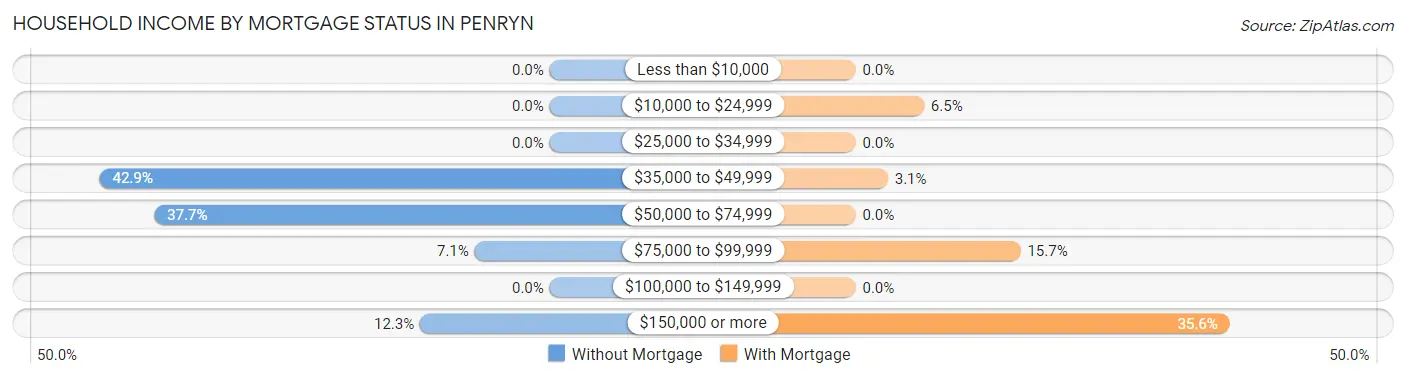
| Household Income | Without Mortgage | With Mortgage |
| Less than $10,000 | 0 (0.0%) | 0 (0.0%) |
| $10,000 to $24,999 | 0 (0.0%) | 17 (6.5%) |
| $25,000 to $34,999 | 0 (0.0%) | 0 (0.0%) |
| $35,000 to $49,999 | 66 (42.9%) | 8 (3.1%) |
| $50,000 to $74,999 | 58 (37.7%) | 0 (0.0%) |
| $75,000 to $99,999 | 11 (7.1%) | 41 (15.7%) |
| $100,000 to $149,999 | 0 (0.0%) | 0 (0.0%) |
| $150,000 or more | 19 (12.3%) | 93 (35.6%) |
| Total | 154 (100.0%) | 261 (100.0%) |
Property Value to Household Income Ratio in Penryn
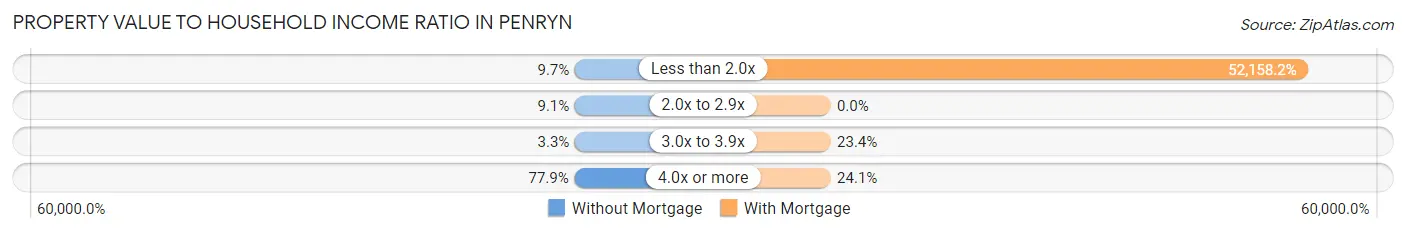
| Value-to-Income Ratio | Without Mortgage | With Mortgage |
| Less than 2.0x | 15 (9.7%) | 136,133 (52,158.2%) |
| 2.0x to 2.9x | 14 (9.1%) | 0 (0.0%) |
| 3.0x to 3.9x | 5 (3.3%) | 61 (23.4%) |
| 4.0x or more | 120 (77.9%) | 63 (24.1%) |
| Total | 154 (100.0%) | 261 (100.0%) |
Real Estate Taxes by Mortgage Status in Penryn
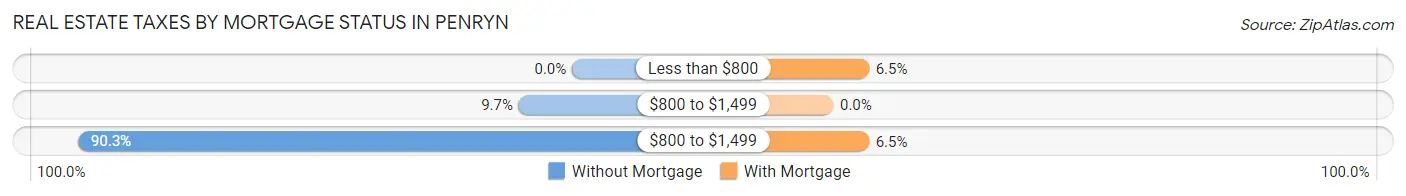
| Property Taxes | Without Mortgage | With Mortgage |
| Less than $800 | 0 (0.0%) | 17 (6.5%) |
| $800 to $1,499 | 15 (9.7%) | 0 (0.0%) |
| $800 to $1,499 | 139 (90.3%) | 17 (6.5%) |
| Total | 154 (100.0%) | 261 (100.0%) |
Health & Disability in Penryn
Health Insurance Coverage by Age in Penryn
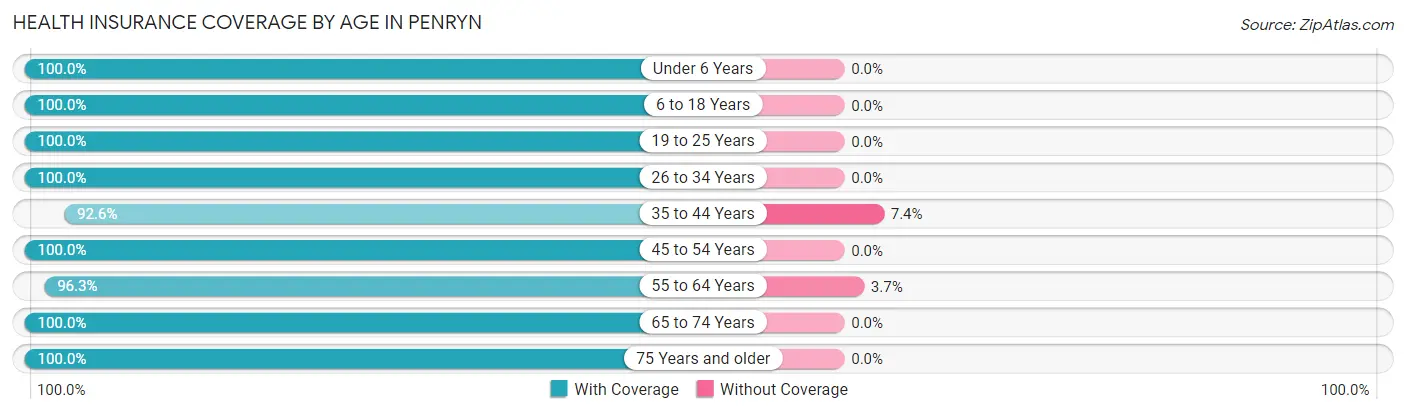
| Age Bracket | With Coverage | Without Coverage |
| Under 6 Years | 69 (100.0%) | 0 (0.0%) |
| 6 to 18 Years | 133 (100.0%) | 0 (0.0%) |
| 19 to 25 Years | 106 (100.0%) | 0 (0.0%) |
| 26 to 34 Years | 56 (100.0%) | 0 (0.0%) |
| 35 to 44 Years | 151 (92.6%) | 12 (7.4%) |
| 45 to 54 Years | 62 (100.0%) | 0 (0.0%) |
| 55 to 64 Years | 184 (96.3%) | 7 (3.7%) |
| 65 to 74 Years | 140 (100.0%) | 0 (0.0%) |
| 75 Years and older | 192 (100.0%) | 0 (0.0%) |
| Total | 1,093 (98.3%) | 19 (1.7%) |
Health Insurance Coverage by Citizenship Status in Penryn
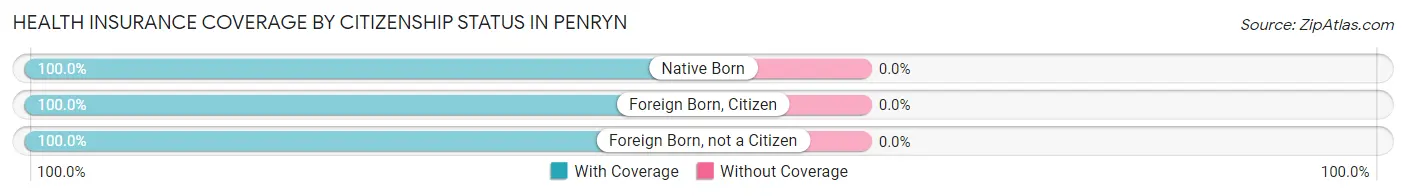
| Citizenship Status | With Coverage | Without Coverage |
| Native Born | 69 (100.0%) | 0 (0.0%) |
| Foreign Born, Citizen | 133 (100.0%) | 0 (0.0%) |
| Foreign Born, not a Citizen | 106 (100.0%) | 0 (0.0%) |
Health Insurance Coverage by Household Income in Penryn
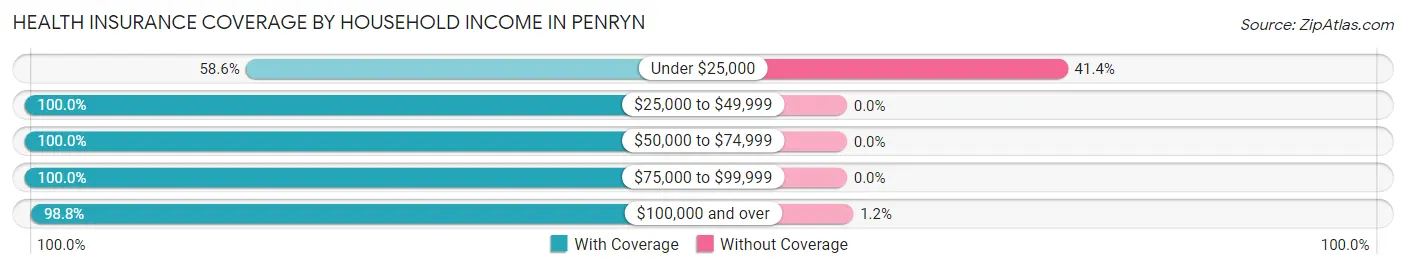
| Household Income | With Coverage | Without Coverage |
| Under $25,000 | 17 (58.6%) | 12 (41.4%) |
| $25,000 to $49,999 | 170 (100.0%) | 0 (0.0%) |
| $50,000 to $74,999 | 270 (100.0%) | 0 (0.0%) |
| $75,000 to $99,999 | 62 (100.0%) | 0 (0.0%) |
| $100,000 and over | 574 (98.8%) | 7 (1.2%) |
Public vs Private Health Insurance Coverage by Age in Penryn
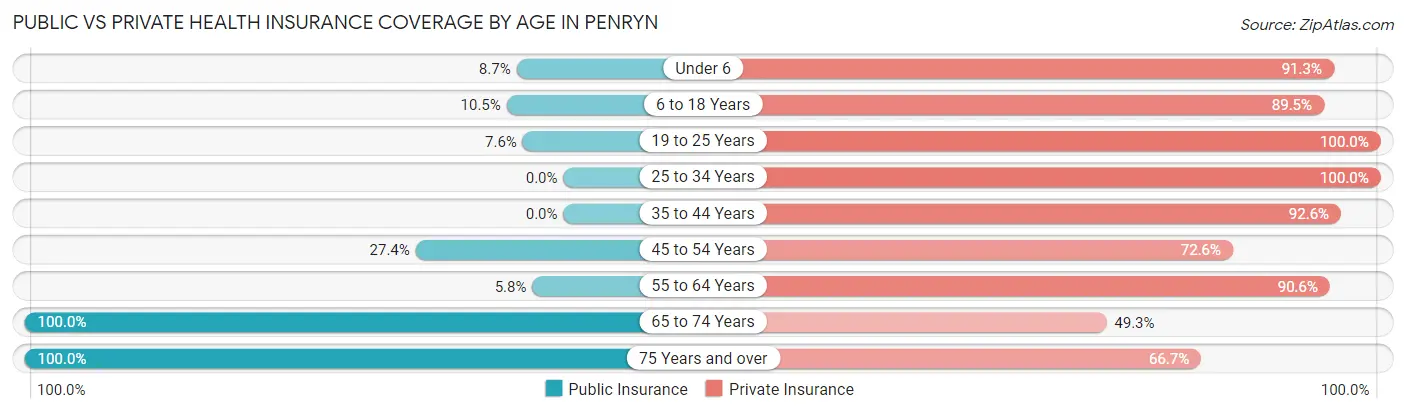
| Age Bracket | Public Insurance | Private Insurance |
| Under 6 | 6 (8.7%) | 63 (91.3%) |
| 6 to 18 Years | 14 (10.5%) | 119 (89.5%) |
| 19 to 25 Years | 8 (7.5%) | 106 (100.0%) |
| 25 to 34 Years | 0 (0.0%) | 56 (100.0%) |
| 35 to 44 Years | 0 (0.0%) | 151 (92.6%) |
| 45 to 54 Years | 17 (27.4%) | 45 (72.6%) |
| 55 to 64 Years | 11 (5.8%) | 173 (90.6%) |
| 65 to 74 Years | 140 (100.0%) | 69 (49.3%) |
| 75 Years and over | 192 (100.0%) | 128 (66.7%) |
| Total | 388 (34.9%) | 910 (81.8%) |
Disability Status by Sex by Age in Penryn
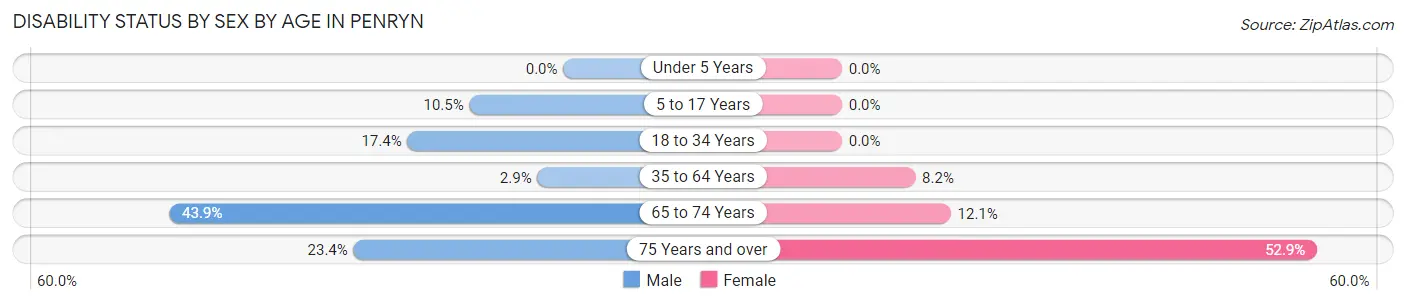
| Age Bracket | Male | Female |
| Under 5 Years | 0 (0.0%) | 0 (0.0%) |
| 5 to 17 Years | 7 (10.4%) | 0 (0.0%) |
| 18 to 34 Years | 25 (17.4%) | 0 (0.0%) |
| 35 to 64 Years | 6 (2.9%) | 17 (8.2%) |
| 65 to 74 Years | 18 (43.9%) | 12 (12.1%) |
| 75 Years and over | 25 (23.4%) | 45 (52.9%) |
Disability Class by Sex by Age in Penryn
Disability Class: Hearing Difficulty
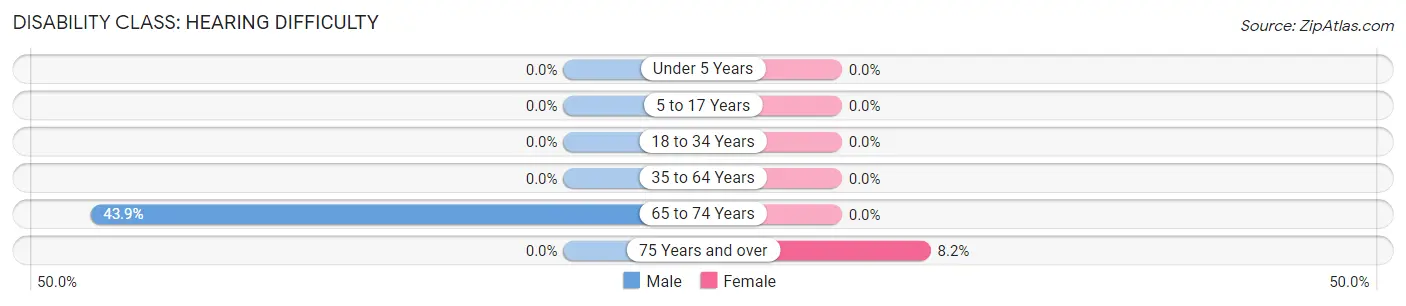
| Age Bracket | Male | Female |
| Under 5 Years | 0 (0.0%) | 0 (0.0%) |
| 5 to 17 Years | 0 (0.0%) | 0 (0.0%) |
| 18 to 34 Years | 0 (0.0%) | 0 (0.0%) |
| 35 to 64 Years | 0 (0.0%) | 0 (0.0%) |
| 65 to 74 Years | 18 (43.9%) | 0 (0.0%) |
| 75 Years and over | 0 (0.0%) | 7 (8.2%) |
Disability Class: Vision Difficulty
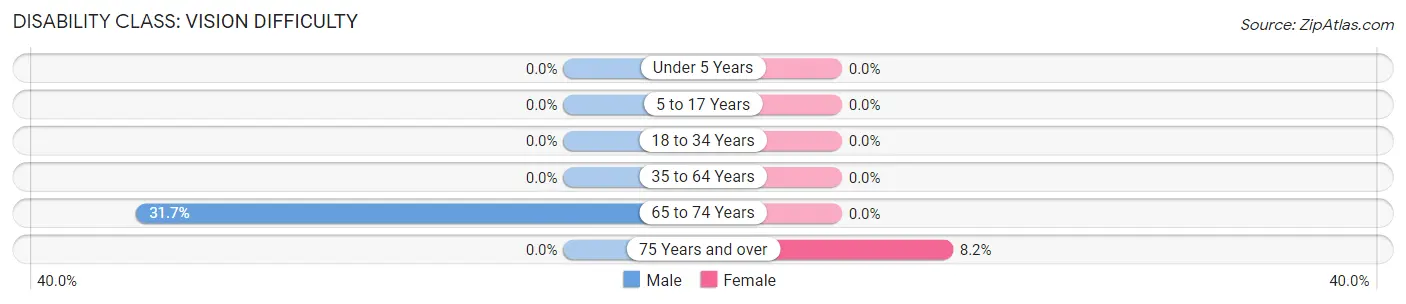
| Age Bracket | Male | Female |
| Under 5 Years | 0 (0.0%) | 0 (0.0%) |
| 5 to 17 Years | 0 (0.0%) | 0 (0.0%) |
| 18 to 34 Years | 0 (0.0%) | 0 (0.0%) |
| 35 to 64 Years | 0 (0.0%) | 0 (0.0%) |
| 65 to 74 Years | 13 (31.7%) | 0 (0.0%) |
| 75 Years and over | 0 (0.0%) | 7 (8.2%) |
Disability Class: Cognitive Difficulty
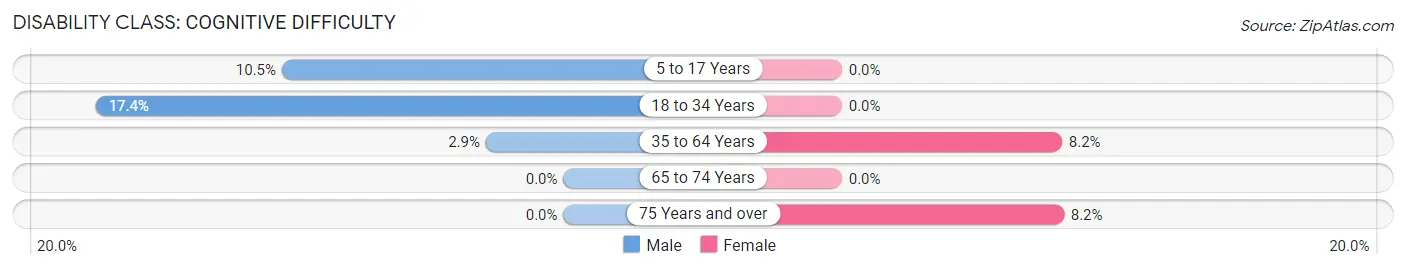
| Age Bracket | Male | Female |
| 5 to 17 Years | 7 (10.4%) | 0 (0.0%) |
| 18 to 34 Years | 25 (17.4%) | 0 (0.0%) |
| 35 to 64 Years | 6 (2.9%) | 17 (8.2%) |
| 65 to 74 Years | 0 (0.0%) | 0 (0.0%) |
| 75 Years and over | 0 (0.0%) | 7 (8.2%) |
Disability Class: Ambulatory Difficulty
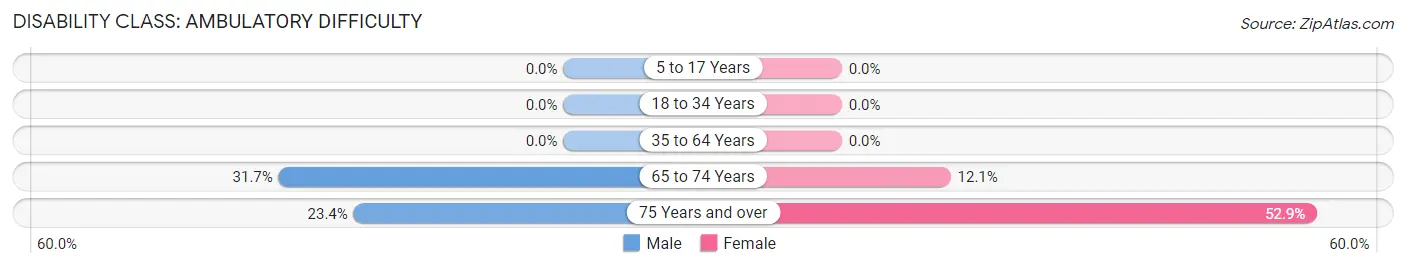
| Age Bracket | Male | Female |
| 5 to 17 Years | 0 (0.0%) | 0 (0.0%) |
| 18 to 34 Years | 0 (0.0%) | 0 (0.0%) |
| 35 to 64 Years | 0 (0.0%) | 0 (0.0%) |
| 65 to 74 Years | 13 (31.7%) | 12 (12.1%) |
| 75 Years and over | 25 (23.4%) | 45 (52.9%) |
Disability Class: Self-Care Difficulty
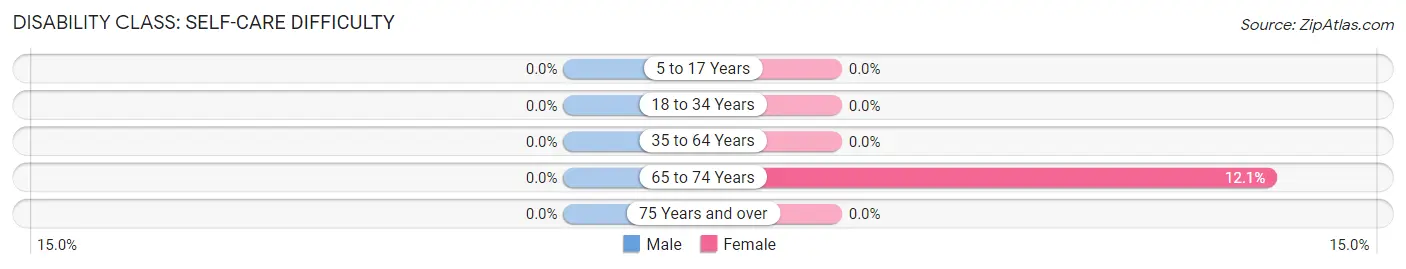
| Age Bracket | Male | Female |
| 5 to 17 Years | 0 (0.0%) | 0 (0.0%) |
| 18 to 34 Years | 0 (0.0%) | 0 (0.0%) |
| 35 to 64 Years | 0 (0.0%) | 0 (0.0%) |
| 65 to 74 Years | 0 (0.0%) | 12 (12.1%) |
| 75 Years and over | 0 (0.0%) | 0 (0.0%) |
Technology Access in Penryn
Computing Device Access in Penryn
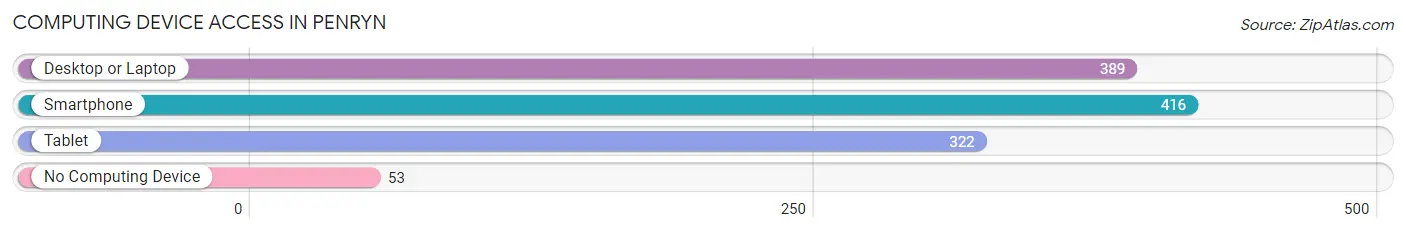
| Device Type | # Households | % Households |
| Desktop or Laptop | 389 | 79.5% |
| Smartphone | 416 | 85.1% |
| Tablet | 322 | 65.8% |
| No Computing Device | 53 | 10.8% |
| Total | 489 | 100.0% |
Internet Access in Penryn
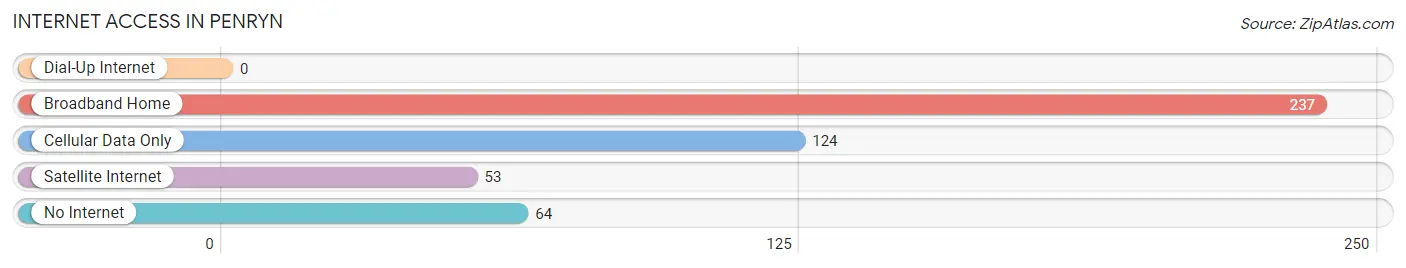
| Internet Type | # Households | % Households |
| Dial-Up Internet | 0 | 0.0% |
| Broadband Home | 237 | 48.5% |
| Cellular Data Only | 124 | 25.4% |
| Satellite Internet | 53 | 10.8% |
| No Internet | 64 | 13.1% |
| Total | 489 | 100.0% |
Penryn Summary
Introduction
Penryn is a small unincorporated community located in Placer County, California. It is situated in the Sierra Nevada foothills, approximately 25 miles northeast of Sacramento. The town is home to a population of approximately 2,000 people and is known for its rural charm and small-town atmosphere.
History
The area that is now Penryn was first settled in the mid-1800s by a group of miners who were searching for gold. The town was officially founded in 1864 and was named after a Welsh mining town. The town quickly grew and by the late 1800s, it had become a bustling center of commerce and industry.
The town was home to a number of businesses, including a blacksmith, a general store, a hotel, and a post office. The town also had a school, a church, and a cemetery.
In the early 1900s, the town began to decline as the gold rush ended and the population began to move away. By the 1950s, the town had become a virtual ghost town.
In the late 1970s, the town began to experience a resurgence as people began to move back to the area. The town was incorporated in 1982 and has since become a popular destination for those looking for a rural lifestyle.
Geography
Penryn is located in the Sierra Nevada foothills, approximately 25 miles northeast of Sacramento. The town is situated at an elevation of 1,000 feet and is surrounded by rolling hills and oak-studded valleys.
The town is located in the foothills of the Sierra Nevada mountain range and is close to several popular recreational areas, including the American River, Folsom Lake, and the Auburn State Recreation Area.
Economy
The economy of Penryn is largely based on agriculture and tourism. The town is home to a number of farms and ranches, which produce a variety of crops, including apples, pears, and walnuts.
The town is also home to a number of small businesses, including restaurants, shops, and galleries. The town is also home to a number of wineries, which produce a variety of wines.
The town is also a popular destination for tourists, who come to enjoy the rural atmosphere and the nearby recreational areas.
Demographics
As of the 2010 census, the population of Penryn was 2,000. The town is predominantly white (90.2%), with a small Hispanic population (4.2%) and a small African American population (2.2%).
The median household income in Penryn is $68,750, which is higher than the national average. The median age in Penryn is 44.7, which is slightly higher than the national average.
Conclusion
Penryn is a small unincorporated community located in Placer County, California. It is situated in the Sierra Nevada foothills, approximately 25 miles northeast of Sacramento. The town is home to a population of approximately 2,000 people and is known for its rural charm and small-town atmosphere. The economy of Penryn is largely based on agriculture and tourism, and the town is a popular destination for those looking for a rural lifestyle. The population of Penryn is predominantly white, with a small Hispanic and African American population. The median household income in Penryn is higher than the national average, and the median age is slightly higher than the national average.
Common Questions
What is Per Capita Income in Penryn?
Per Capita income in Penryn is $51,485.
What is the Median Family Income in Penryn?
Median Family Income in Penryn is $100,673.
What is the Median Household income in Penryn?
Median Household Income in Penryn is $89,205.
What is Income or Wage Gap in Penryn?
Income or Wage Gap in Penryn is 12.3%.
Women in Penryn earn 87.7 cents for every dollar earned by a man.
What is Inequality or Gini Index in Penryn?
Inequality or Gini Index in Penryn is 0.38.
What is the Total Population of Penryn?
Total Population of Penryn is 1,112.
What is the Total Male Population of Penryn?
Total Male Population of Penryn is 588.
What is the Total Female Population of Penryn?
Total Female Population of Penryn is 524.
What is the Ratio of Males per 100 Females in Penryn?
There are 112.21 Males per 100 Females in Penryn.
What is the Ratio of Females per 100 Males in Penryn?
There are 89.12 Females per 100 Males in Penryn.
What is the Median Population Age in Penryn?
Median Population Age in Penryn is 50.7 Years.
What is the Average Family Size in Penryn
Average Family Size in Penryn is 2.9 People.
What is the Average Household Size in Penryn
Average Household Size in Penryn is 2.3 People.
How Large is the Labor Force in Penryn?
There are 525 People in the Labor Forcein in Penryn.
What is the Percentage of People in the Labor Force in Penryn?
56.8% of People are in the Labor Force in Penryn.
What is the Unemployment Rate in Penryn?
Unemployment Rate in Penryn is 5.9%.