Buhl, ID Map & Demographics
Buhl Map
Buhl Overview
$24,073
PER CAPITA INCOME
$62,879
AVG FAMILY INCOME
$51,307
AVG HOUSEHOLD INCOME
43.2%
WAGE / INCOME GAP [ % ]
56.8¢/ $1
WAGE / INCOME GAP [ $ ]
0.39
INEQUALITY / GINI INDEX
4,577
TOTAL POPULATION
2,027
MALE POPULATION
2,550
FEMALE POPULATION
79.49
MALES / 100 FEMALES
125.80
FEMALES / 100 MALES
34.4
MEDIAN AGE
3.2
AVG FAMILY SIZE
2.5
AVG HOUSEHOLD SIZE
2,152
LABOR FORCE [ PEOPLE ]
62.8%
PERCENT IN LABOR FORCE
4.0%
UNEMPLOYMENT RATE
Buhl Zip Codes
Buhl Area Codes
Income in Buhl
Income Overview in Buhl
Per Capita Income in Buhl is $24,073, while median incomes of families and households are $62,879 and $51,307 respectively.
| Characteristic | Number | Measure |
| Per Capita Income | 4,577 | $24,073 |
| Median Family Income | 1,138 | $62,879 |
| Mean Family Income | 1,138 | $71,366 |
| Median Household Income | 1,791 | $51,307 |
| Mean Household Income | 1,791 | $60,942 |
| Income Deficit | 1,138 | $0 |
| Wage / Income Gap (%) | 4,577 | 43.24% |
| Wage / Income Gap ($) | 4,577 | 56.76¢ per $1 |
| Gini / Inequality Index | 4,577 | 0.39 |
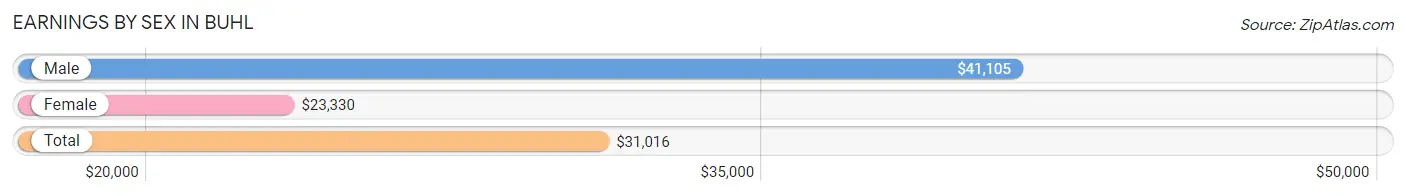
Earnings by Sex in Buhl
Average Earnings in Buhl are $31,016, $41,105 for men and $23,330 for women, a difference of 43.2%.
| Sex | Number | Average Earnings |
| Male | 1,122 (50.9%) | $41,105 |
| Female | 1,081 (49.1%) | $23,330 |
| Total | 2,203 (100.0%) | $31,016 |
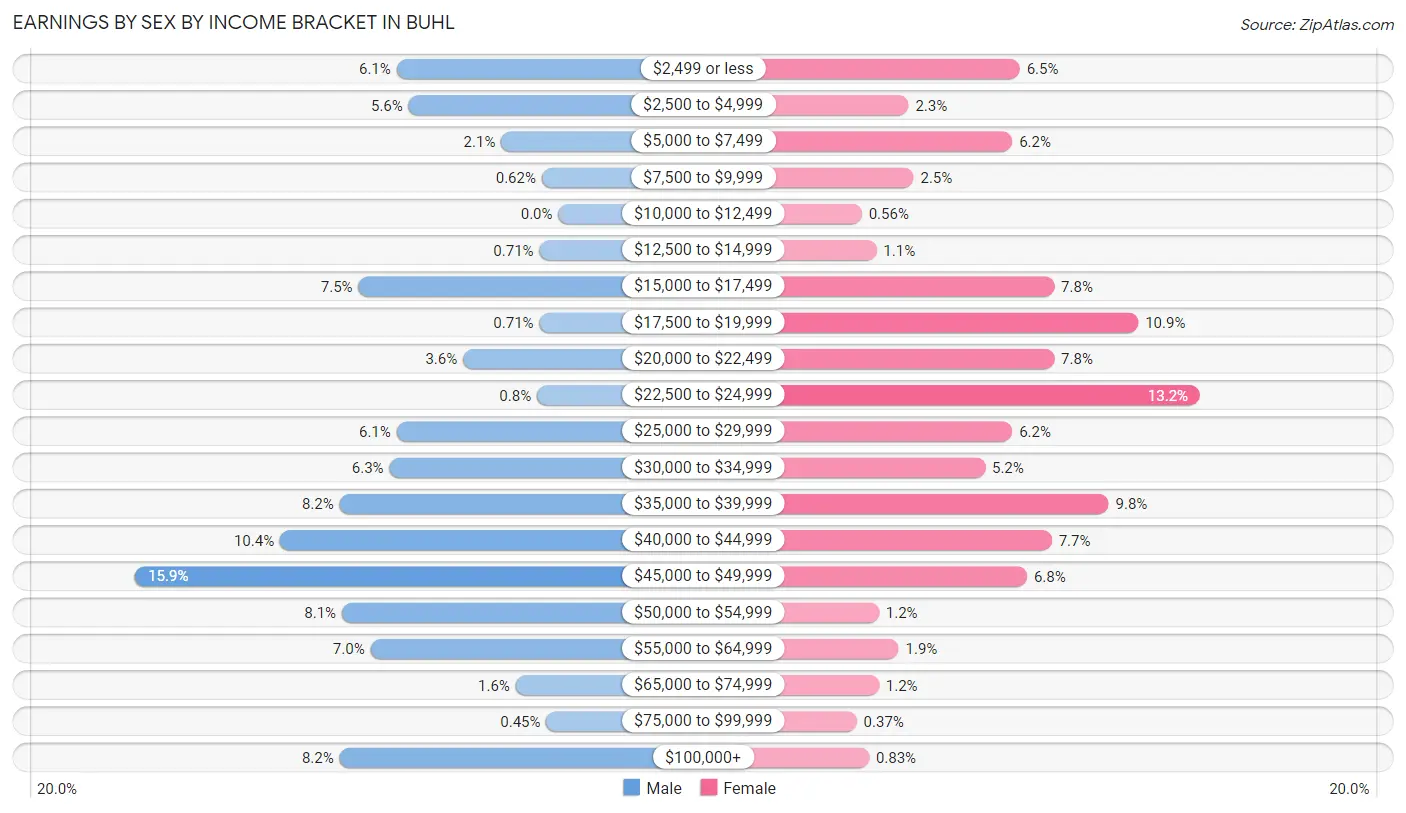
Earnings by Sex by Income Bracket in Buhl
The most common earnings brackets in Buhl are $45,000 to $49,999 for men (178 | 15.9%) and $22,500 to $24,999 for women (143 | 13.2%).
| Income | Male | Female |
| $2,499 or less | 68 (6.1%) | 70 (6.5%) |
| $2,500 to $4,999 | 63 (5.6%) | 25 (2.3%) |
| $5,000 to $7,499 | 24 (2.1%) | 67 (6.2%) |
| $7,500 to $9,999 | 7 (0.6%) | 27 (2.5%) |
| $10,000 to $12,499 | 0 (0.0%) | 6 (0.6%) |
| $12,500 to $14,999 | 8 (0.7%) | 12 (1.1%) |
| $15,000 to $17,499 | 84 (7.5%) | 84 (7.8%) |
| $17,500 to $19,999 | 8 (0.7%) | 118 (10.9%) |
| $20,000 to $22,499 | 40 (3.6%) | 84 (7.8%) |
| $22,500 to $24,999 | 9 (0.8%) | 143 (13.2%) |
| $25,000 to $29,999 | 68 (6.1%) | 67 (6.2%) |
| $30,000 to $34,999 | 71 (6.3%) | 56 (5.2%) |
| $35,000 to $39,999 | 92 (8.2%) | 106 (9.8%) |
| $40,000 to $44,999 | 117 (10.4%) | 83 (7.7%) |
| $45,000 to $49,999 | 178 (15.9%) | 73 (6.8%) |
| $50,000 to $54,999 | 91 (8.1%) | 13 (1.2%) |
| $55,000 to $64,999 | 79 (7.0%) | 21 (1.9%) |
| $65,000 to $74,999 | 18 (1.6%) | 13 (1.2%) |
| $75,000 to $99,999 | 5 (0.4%) | 4 (0.4%) |
| $100,000+ | 92 (8.2%) | 9 (0.8%) |
| Total | 1,122 (100.0%) | 1,081 (100.0%) |
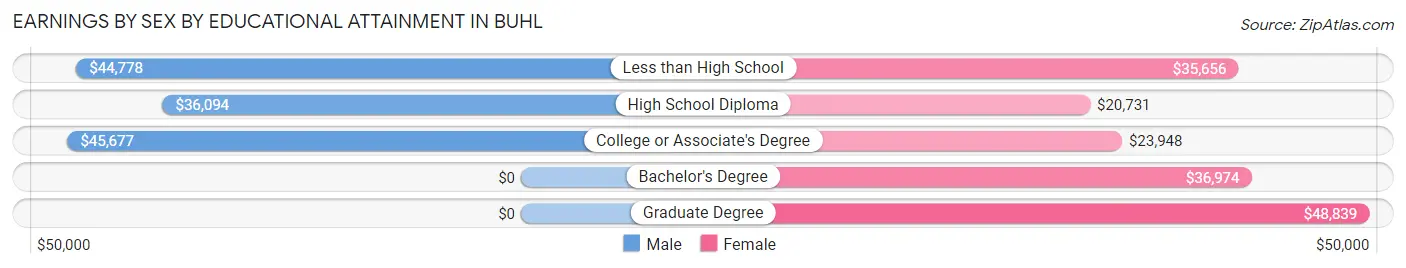
Earnings by Sex by Educational Attainment in Buhl
Average earnings in Buhl are $44,912 for men and $24,206 for women, a difference of 46.1%. Men with an educational attainment of college or associate's degree enjoy the highest average annual earnings of $45,677, while those with high school diploma education earn the least with $36,094. Women with an educational attainment of graduate degree earn the most with the average annual earnings of $48,839, while those with high school diploma education have the smallest earnings of $20,731.
| Educational Attainment | Male Income | Female Income |
| Less than High School | $44,778 | $35,656 |
| High School Diploma | $36,094 | $20,731 |
| College or Associate's Degree | $45,677 | $23,948 |
| Bachelor's Degree | - | - |
| Graduate Degree | - | - |
| Total | $44,912 | $24,206 |
Family Income in Buhl
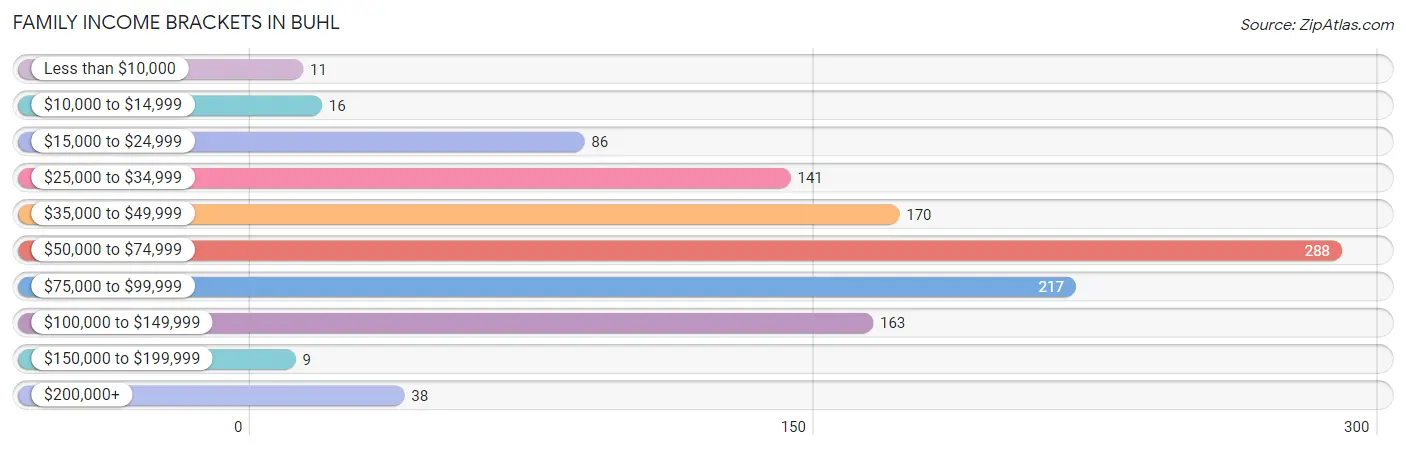
Family Income Brackets in Buhl
According to the Buhl family income data, there are 288 families falling into the $50,000 to $74,999 income range, which is the most common income bracket and makes up 25.3% of all families. Conversely, the $150,000 to $199,999 income bracket is the least frequent group with only 9 families (0.8%) belonging to this category.
| Income Bracket | # Families | % Families |
| Less than $10,000 | 11 | 1.0% |
| $10,000 to $14,999 | 16 | 1.4% |
| $15,000 to $24,999 | 86 | 7.6% |
| $25,000 to $34,999 | 141 | 12.4% |
| $35,000 to $49,999 | 170 | 14.9% |
| $50,000 to $74,999 | 288 | 25.3% |
| $75,000 to $99,999 | 217 | 19.1% |
| $100,000 to $149,999 | 163 | 14.3% |
| $150,000 to $199,999 | 9 | 0.8% |
| $200,000+ | 38 | 3.3% |
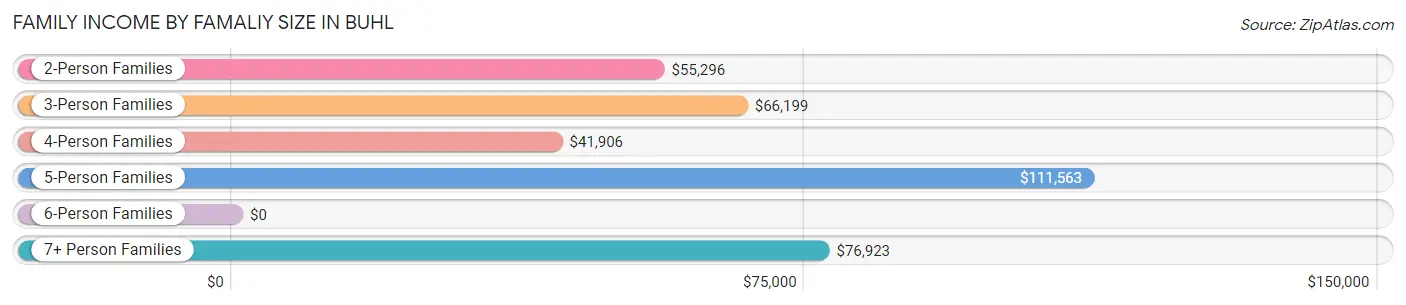
Family Income by Famaliy Size in Buhl
5-person families (69 | 6.1%) account for the highest median family income in Buhl with $111,563 per family, while 2-person families (545 | 47.9%) have the highest median income of $27,648 per family member.
| Income Bracket | # Families | Median Income |
| 2-Person Families | 545 (47.9%) | $55,296 |
| 3-Person Families | 277 (24.3%) | $66,199 |
| 4-Person Families | 143 (12.6%) | $41,906 |
| 5-Person Families | 69 (6.1%) | $111,563 |
| 6-Person Families | 0 (0.0%) | $0 |
| 7+ Person Families | 104 (9.1%) | $76,923 |
| Total | 1,138 (100.0%) | $62,879 |
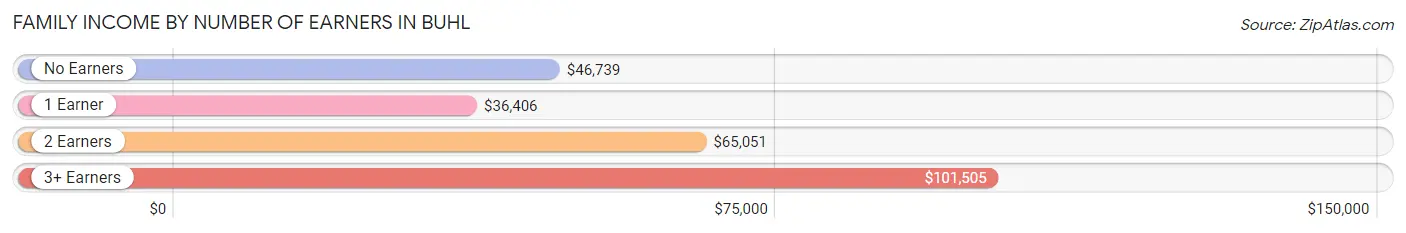
Family Income by Number of Earners in Buhl
The median family income in Buhl is $62,879, with families comprising 3+ earners (97) having the highest median family income of $101,505, while families with 1 earner (273) have the lowest median family income of $36,406, accounting for 8.5% and 24.0% of families, respectively.
| Number of Earners | # Families | Median Income |
| No Earners | 252 (22.1%) | $46,739 |
| 1 Earner | 273 (24.0%) | $36,406 |
| 2 Earners | 516 (45.3%) | $65,051 |
| 3+ Earners | 97 (8.5%) | $101,505 |
| Total | 1,138 (100.0%) | $62,879 |
Household Income in Buhl
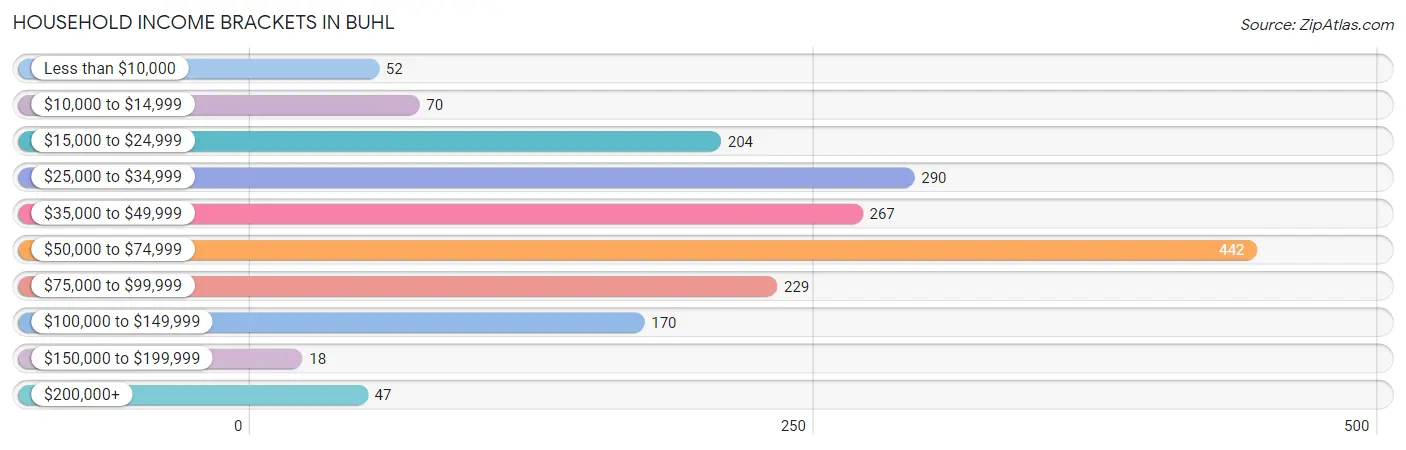
Household Income Brackets in Buhl
With 442 households falling in the category, the $50,000 to $74,999 income range is the most frequent in Buhl, accounting for 24.7% of all households. In contrast, only 18 households (1.0%) fall into the $150,000 to $199,999 income bracket, making it the least populous group.
| Income Bracket | # Households | % Households |
| Less than $10,000 | 52 | 2.9% |
| $10,000 to $14,999 | 70 | 3.9% |
| $15,000 to $24,999 | 204 | 11.4% |
| $25,000 to $34,999 | 290 | 16.2% |
| $35,000 to $49,999 | 267 | 14.9% |
| $50,000 to $74,999 | 442 | 24.7% |
| $75,000 to $99,999 | 229 | 12.8% |
| $100,000 to $149,999 | 170 | 9.5% |
| $150,000 to $199,999 | 18 | 1.0% |
| $200,000+ | 47 | 2.6% |
Household Income by Householder Age in Buhl
The median household income in Buhl is $51,307, with the highest median household income of $67,778 found in the 15 to 24 years age bracket for the primary householder. A total of 52 households (2.9%) fall into this category. Meanwhile, the 65+ years age bracket for the primary householder has the lowest median household income of $30,799, with 501 households (28.0%) in this group.
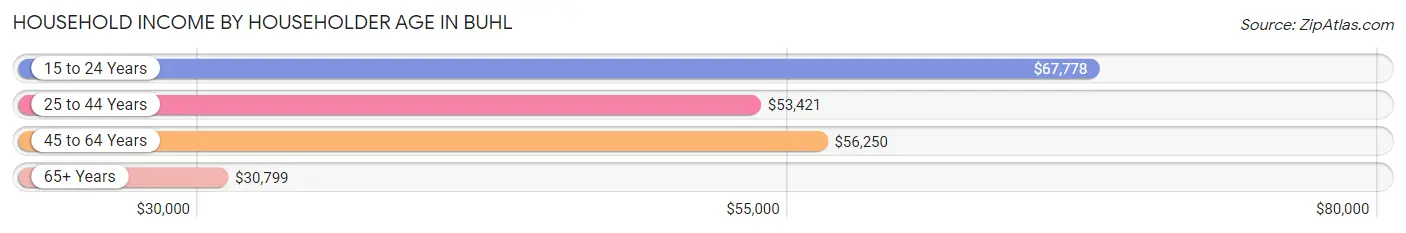
| Income Bracket | # Households | Median Income |
| 15 to 24 Years | 52 (2.9%) | $67,778 |
| 25 to 44 Years | 514 (28.7%) | $53,421 |
| 45 to 64 Years | 724 (40.4%) | $56,250 |
| 65+ Years | 501 (28.0%) | $30,799 |
| Total | 1,791 (100.0%) | $51,307 |
Poverty in Buhl
Income Below Poverty by Sex and Age in Buhl
With 1.9% poverty level for males and 12.3% for females among the residents of Buhl, 65 to 74 year old males and 15 year old females are the most vulnerable to poverty, with 21 males (10.7%) and 31 females (60.8%) in their respective age groups living below the poverty level.
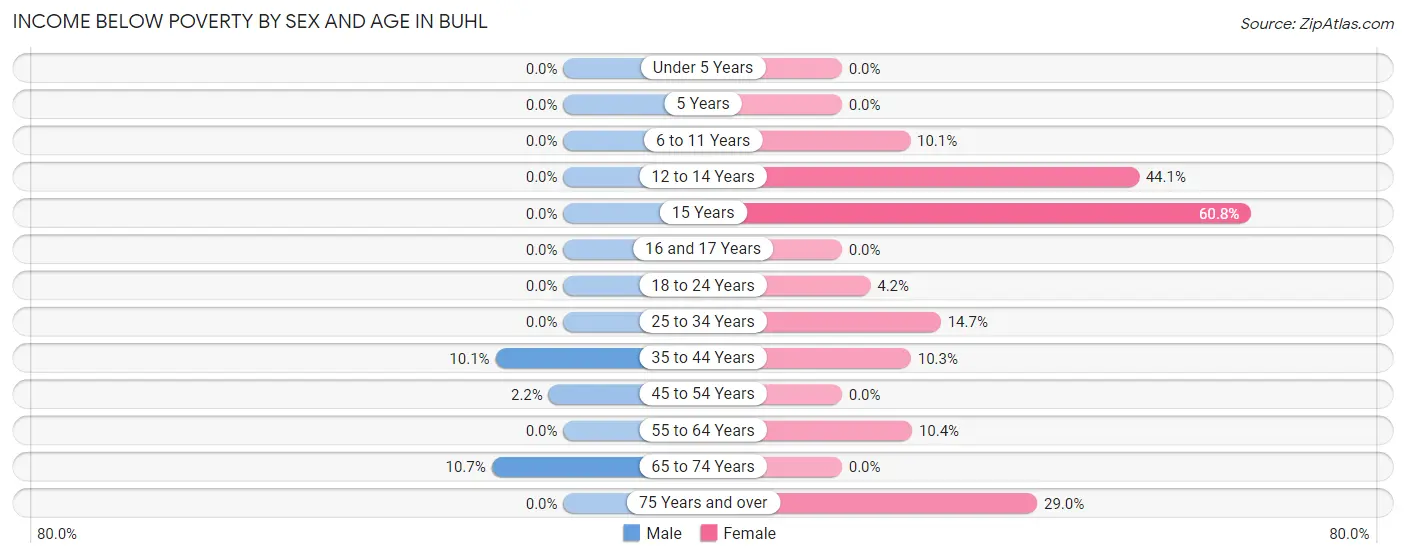
| Age Bracket | Male | Female |
| Under 5 Years | 0 (0.0%) | 0 (0.0%) |
| 5 Years | 0 (0.0%) | 0 (0.0%) |
| 6 to 11 Years | 0 (0.0%) | 32 (10.1%) |
| 12 to 14 Years | 0 (0.0%) | 56 (44.1%) |
| 15 Years | 0 (0.0%) | 31 (60.8%) |
| 16 and 17 Years | 0 (0.0%) | 0 (0.0%) |
| 18 to 24 Years | 0 (0.0%) | 9 (4.2%) |
| 25 to 34 Years | 0 (0.0%) | 47 (14.7%) |
| 35 to 44 Years | 11 (10.1%) | 29 (10.2%) |
| 45 to 54 Years | 6 (2.2%) | 0 (0.0%) |
| 55 to 64 Years | 0 (0.0%) | 35 (10.4%) |
| 65 to 74 Years | 21 (10.7%) | 0 (0.0%) |
| 75 Years and over | 0 (0.0%) | 69 (29.0%) |
| Total | 38 (1.9%) | 308 (12.3%) |
Income Above Poverty by Sex and Age in Buhl
According to the poverty statistics in Buhl, males aged under 5 years and females aged under 5 years are the age groups that are most secure financially, with 100.0% of males and 100.0% of females in these age groups living above the poverty line.
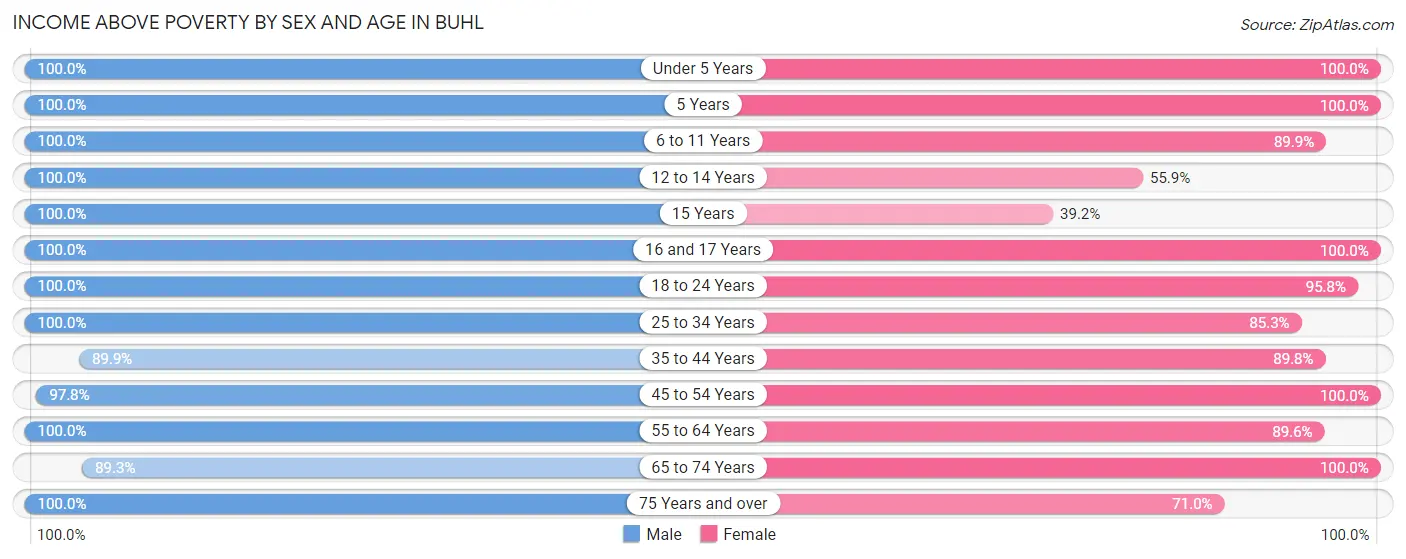
| Age Bracket | Male | Female |
| Under 5 Years | 70 (100.0%) | 136 (100.0%) |
| 5 Years | 55 (100.0%) | 33 (100.0%) |
| 6 to 11 Years | 200 (100.0%) | 284 (89.9%) |
| 12 to 14 Years | 99 (100.0%) | 71 (55.9%) |
| 15 Years | 55 (100.0%) | 20 (39.2%) |
| 16 and 17 Years | 96 (100.0%) | 38 (100.0%) |
| 18 to 24 Years | 160 (100.0%) | 204 (95.8%) |
| 25 to 34 Years | 373 (100.0%) | 273 (85.3%) |
| 35 to 44 Years | 98 (89.9%) | 254 (89.7%) |
| 45 to 54 Years | 268 (97.8%) | 214 (100.0%) |
| 55 to 64 Years | 222 (100.0%) | 301 (89.6%) |
| 65 to 74 Years | 176 (89.3%) | 202 (100.0%) |
| 75 Years and over | 80 (100.0%) | 169 (71.0%) |
| Total | 1,952 (98.1%) | 2,199 (87.7%) |
Income Below Poverty Among Married-Couple Families in Buhl
The poverty statistics for married-couple families in Buhl show that 1.9% or 16 of the total 844 families live below the poverty line. Families with no children have the highest poverty rate of 3.6%, comprising of 16 families. On the other hand, families with 1 or 2 children have the lowest poverty rate of 0.0%, which includes 0 families.
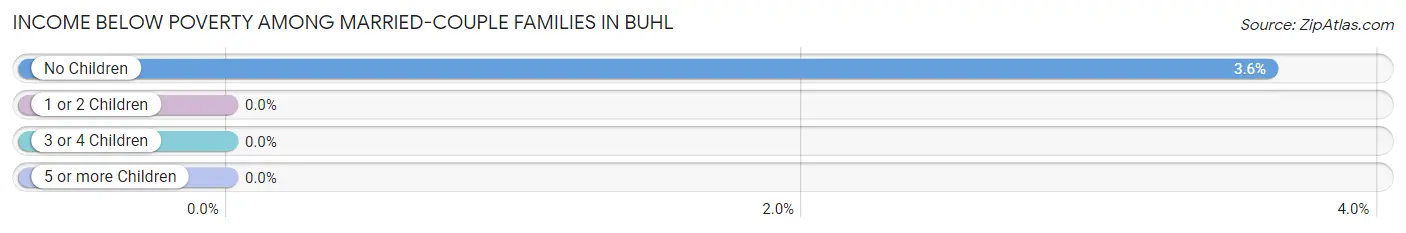
| Children | Above Poverty | Below Poverty |
| No Children | 426 (96.4%) | 16 (3.6%) |
| 1 or 2 Children | 317 (100.0%) | 0 (0.0%) |
| 3 or 4 Children | 85 (100.0%) | 0 (0.0%) |
| 5 or more Children | 0 (0.0%) | 0 (0.0%) |
| Total | 828 (98.1%) | 16 (1.9%) |
Income Below Poverty Among Single-Parent Households in Buhl
According to the poverty data in Buhl, 33.3% or 11 single-father households and 12.6% or 33 single-mother households are living below the poverty line. Among single-father households, those with 1 or 2 children have the highest poverty rate, with 11 households (100.0%) experiencing poverty. Likewise, among single-mother households, those with 1 or 2 children have the highest poverty rate, with 33 households (23.2%) falling below the poverty line.
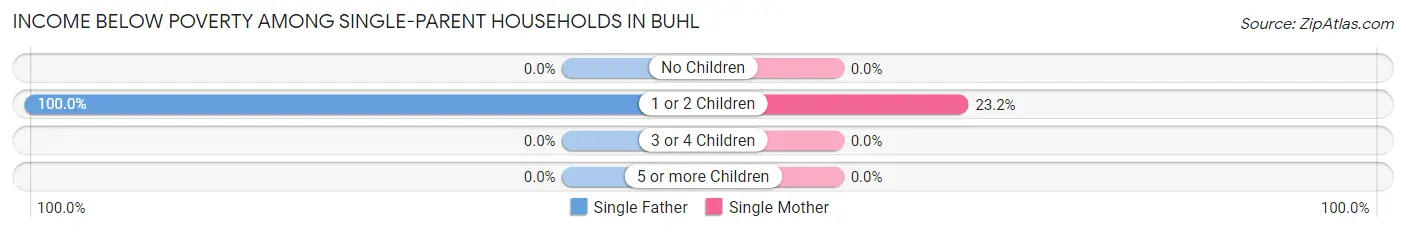
| Children | Single Father | Single Mother |
| No Children | 0 (0.0%) | 0 (0.0%) |
| 1 or 2 Children | 11 (100.0%) | 33 (23.2%) |
| 3 or 4 Children | 0 (0.0%) | 0 (0.0%) |
| 5 or more Children | 0 (0.0%) | 0 (0.0%) |
| Total | 11 (33.3%) | 33 (12.6%) |
Income Below Poverty Among Married-Couple vs Single-Parent Households in Buhl
The poverty data for Buhl shows that 16 of the married-couple family households (1.9%) and 44 of the single-parent households (15.0%) are living below the poverty level. Within the married-couple family households, those with no children have the highest poverty rate, with 16 households (3.6%) falling below the poverty line. Among the single-parent households, those with 1 or 2 children have the highest poverty rate, with 44 household (28.8%) living below poverty.
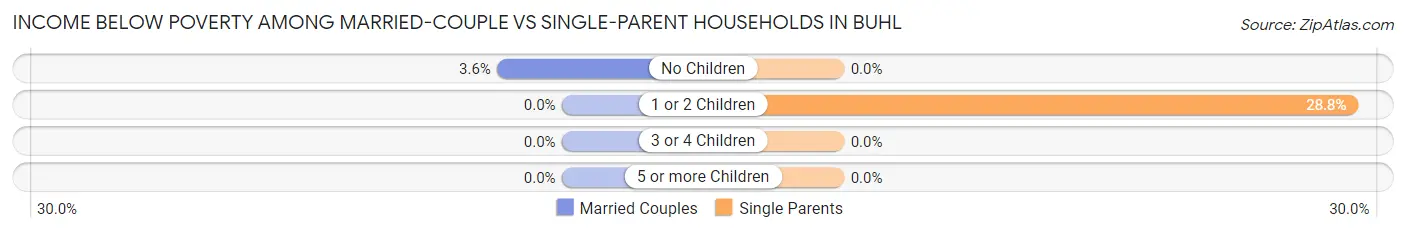
| Children | Married-Couple Families | Single-Parent Households |
| No Children | 16 (3.6%) | 0 (0.0%) |
| 1 or 2 Children | 0 (0.0%) | 44 (28.8%) |
| 3 or 4 Children | 0 (0.0%) | 0 (0.0%) |
| 5 or more Children | 0 (0.0%) | 0 (0.0%) |
| Total | 16 (1.9%) | 44 (15.0%) |
Race in Buhl
The most populous races in Buhl are White / Caucasian (3,308 | 72.3%), Hispanic or Latino (1,495 | 32.7%), and Some other Race (711 | 15.5%).
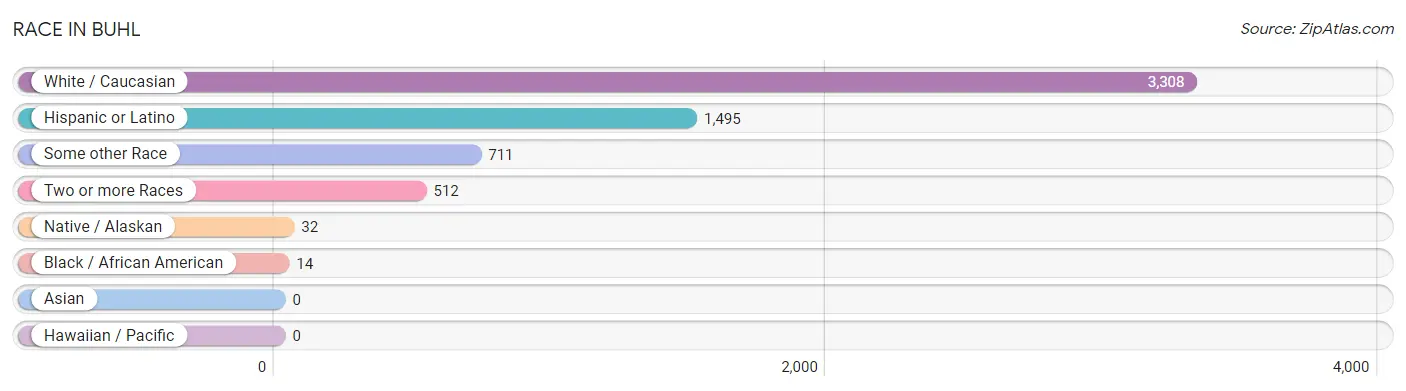
| Race | # Population | % Population |
| Asian | 0 | 0.0% |
| Black / African American | 14 | 0.3% |
| Hawaiian / Pacific | 0 | 0.0% |
| Hispanic or Latino | 1,495 | 32.7% |
| Native / Alaskan | 32 | 0.7% |
| White / Caucasian | 3,308 | 72.3% |
| Two or more Races | 512 | 11.2% |
| Some other Race | 711 | 15.5% |
| Total | 4,577 | 100.0% |
Ancestry in Buhl
The most populous ancestries reported in Buhl are Mexican (1,406 | 30.7%), English (783 | 17.1%), German (490 | 10.7%), Irish (472 | 10.3%), and American (222 | 4.9%), together accounting for 73.7% of all Buhl residents.
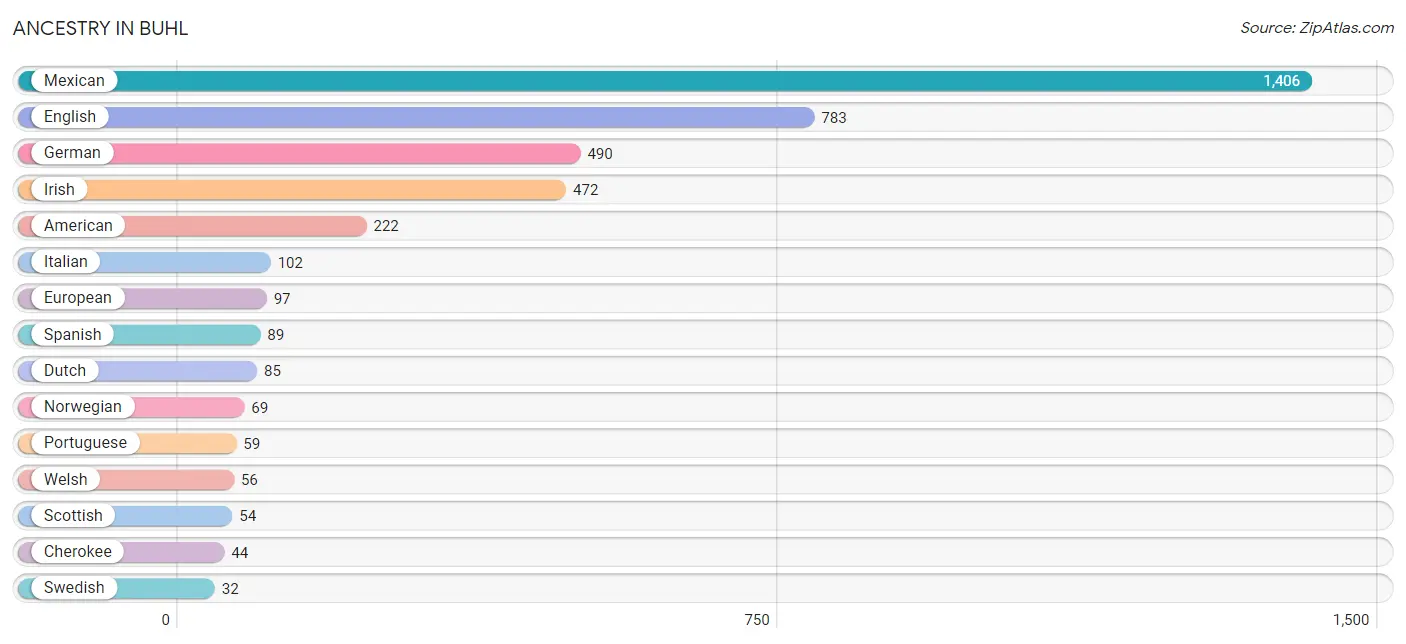
| Ancestry | # Population | % Population |
| American | 222 | 4.9% |
| Basque | 8 | 0.2% |
| Cherokee | 44 | 1.0% |
| Croatian | 20 | 0.4% |
| Czech | 15 | 0.3% |
| Danish | 13 | 0.3% |
| Dutch | 85 | 1.9% |
| Dutch West Indian | 12 | 0.3% |
| English | 783 | 17.1% |
| European | 97 | 2.1% |
| French | 19 | 0.4% |
| German | 490 | 10.7% |
| Hungarian | 23 | 0.5% |
| Irish | 472 | 10.3% |
| Iroquois | 29 | 0.6% |
| Italian | 102 | 2.2% |
| Mexican | 1,406 | 30.7% |
| Norwegian | 69 | 1.5% |
| Portuguese | 59 | 1.3% |
| Scotch-Irish | 9 | 0.2% |
| Scottish | 54 | 1.2% |
| Spanish | 89 | 1.9% |
| Swedish | 32 | 0.7% |
| Swiss | 10 | 0.2% |
| Welsh | 56 | 1.2% | View All 25 Rows |
Immigrants in Buhl
The most numerous immigrant groups reported in Buhl came from Central America (613 | 13.4%), Latin America (613 | 13.4%), Mexico (613 | 13.4%), Europe (59 | 1.3%), and Portugal (59 | 1.3%), together accounting for 42.7% of all Buhl residents.
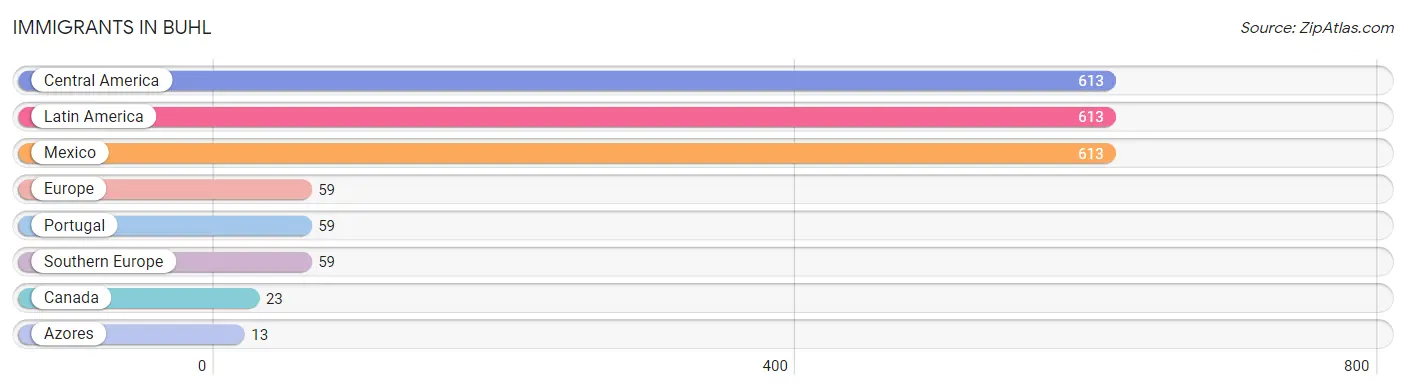
| Immigration Origin | # Population | % Population |
| Azores | 13 | 0.3% |
| Canada | 23 | 0.5% |
| Central America | 613 | 13.4% |
| Europe | 59 | 1.3% |
| Latin America | 613 | 13.4% |
| Mexico | 613 | 13.4% |
| Portugal | 59 | 1.3% |
| Southern Europe | 59 | 1.3% | View All 8 Rows |
Sex and Age in Buhl
Sex and Age in Buhl
The most populous age groups in Buhl are 30 to 34 Years (283 | 14.0%) for men and 5 to 9 Years (270 | 10.6%) for women.
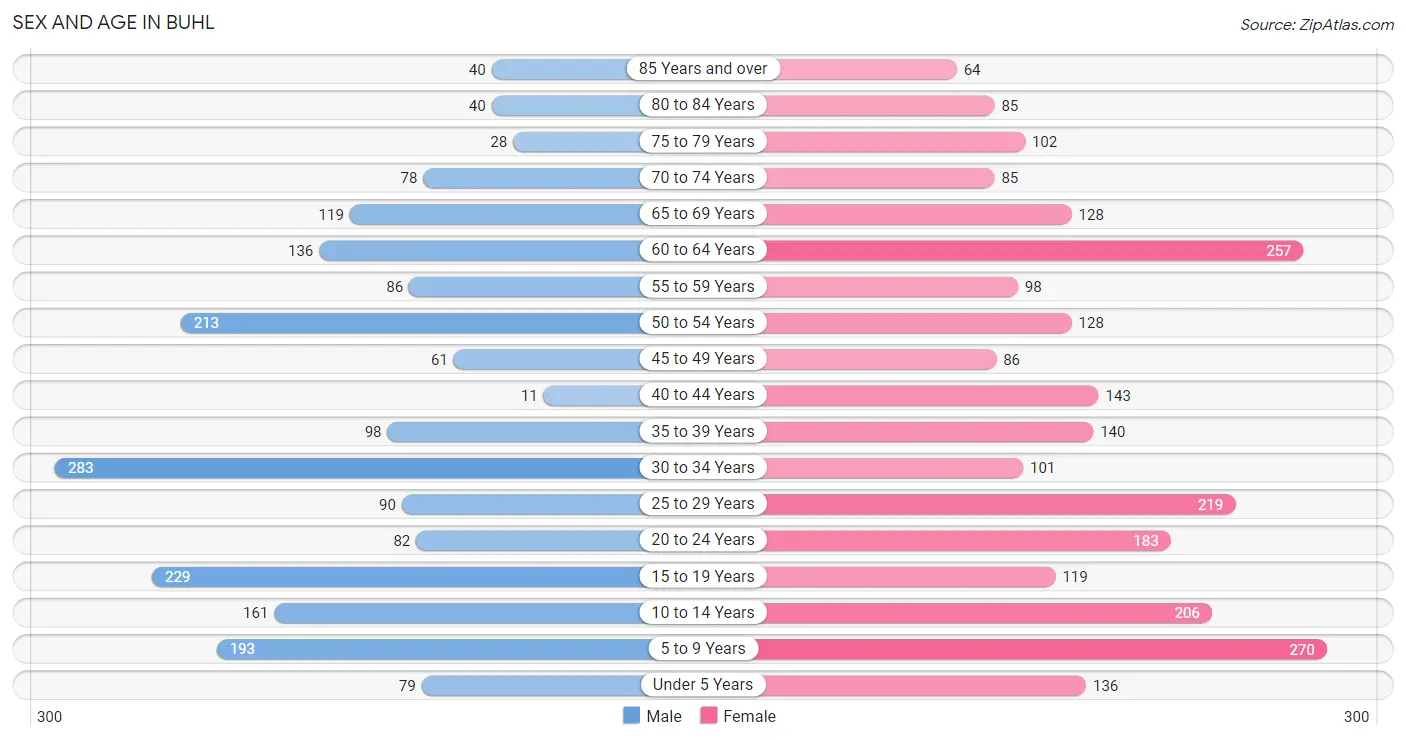
| Age Bracket | Male | Female |
| Under 5 Years | 79 (3.9%) | 136 (5.3%) |
| 5 to 9 Years | 193 (9.5%) | 270 (10.6%) |
| 10 to 14 Years | 161 (7.9%) | 206 (8.1%) |
| 15 to 19 Years | 229 (11.3%) | 119 (4.7%) |
| 20 to 24 Years | 82 (4.1%) | 183 (7.2%) |
| 25 to 29 Years | 90 (4.4%) | 219 (8.6%) |
| 30 to 34 Years | 283 (14.0%) | 101 (4.0%) |
| 35 to 39 Years | 98 (4.8%) | 140 (5.5%) |
| 40 to 44 Years | 11 (0.5%) | 143 (5.6%) |
| 45 to 49 Years | 61 (3.0%) | 86 (3.4%) |
| 50 to 54 Years | 213 (10.5%) | 128 (5.0%) |
| 55 to 59 Years | 86 (4.2%) | 98 (3.8%) |
| 60 to 64 Years | 136 (6.7%) | 257 (10.1%) |
| 65 to 69 Years | 119 (5.9%) | 128 (5.0%) |
| 70 to 74 Years | 78 (3.8%) | 85 (3.3%) |
| 75 to 79 Years | 28 (1.4%) | 102 (4.0%) |
| 80 to 84 Years | 40 (2.0%) | 85 (3.3%) |
| 85 Years and over | 40 (2.0%) | 64 (2.5%) |
| Total | 2,027 (100.0%) | 2,550 (100.0%) |
Families and Households in Buhl
Median Family Size in Buhl
The median family size in Buhl is 3.22 persons per family, with single female/mother families (261 | 22.9%) accounting for the largest median family size of 3.78 persons per family. On the other hand, single male/father families (33 | 2.9%) represent the smallest median family size with 1.91 persons per family.
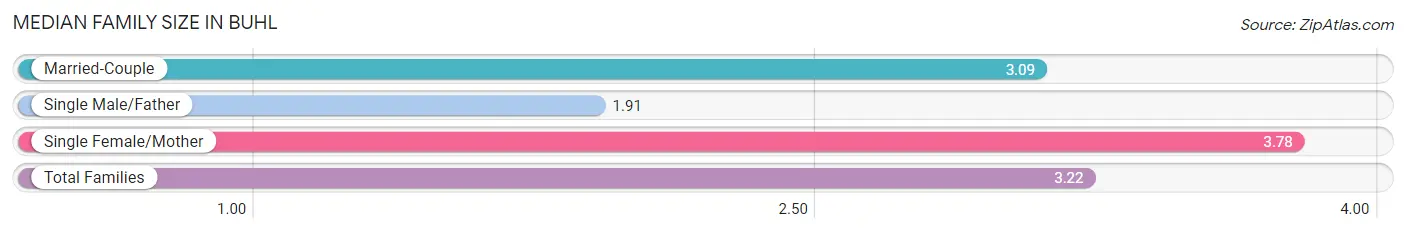
| Family Type | # Families | Family Size |
| Married-Couple | 844 (74.2%) | 3.09 |
| Single Male/Father | 33 (2.9%) | 1.91 |
| Single Female/Mother | 261 (22.9%) | 3.78 |
| Total Families | 1,138 (100.0%) | 3.22 |
Median Household Size in Buhl
The median household size in Buhl is 2.52 persons per household, with single female/mother households (261 | 14.6%) accounting for the largest median household size of 4.13 persons per household. non-family households (653 | 36.5%) represent the smallest median household size with 1.13 persons per household.
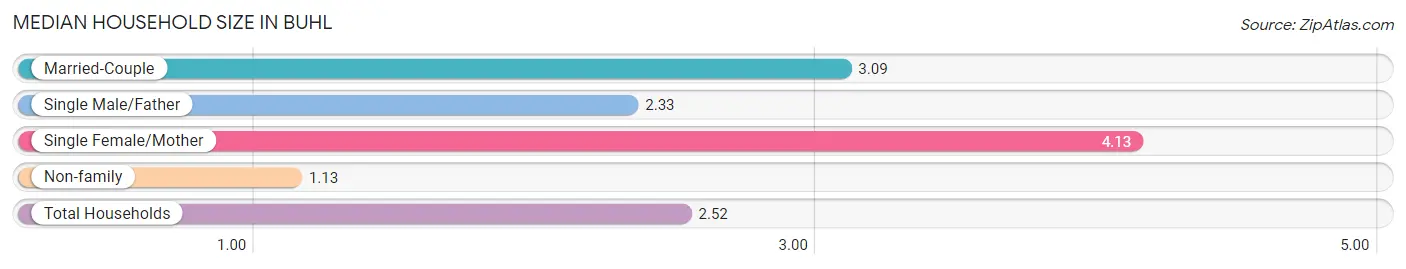
| Household Type | # Households | Household Size |
| Married-Couple | 844 (47.1%) | 3.09 |
| Single Male/Father | 33 (1.8%) | 2.33 |
| Single Female/Mother | 261 (14.6%) | 4.13 |
| Non-family | 653 (36.5%) | 1.13 |
| Total Households | 1,791 (100.0%) | 2.52 |
Household Size by Marriage Status in Buhl
Out of a total of 1,791 households in Buhl, 1,138 (63.5%) are family households, while 653 (36.5%) are nonfamily households. The most numerous type of family households are 2-person households, comprising 526, and the most common type of nonfamily households are 1-person households, comprising 604.
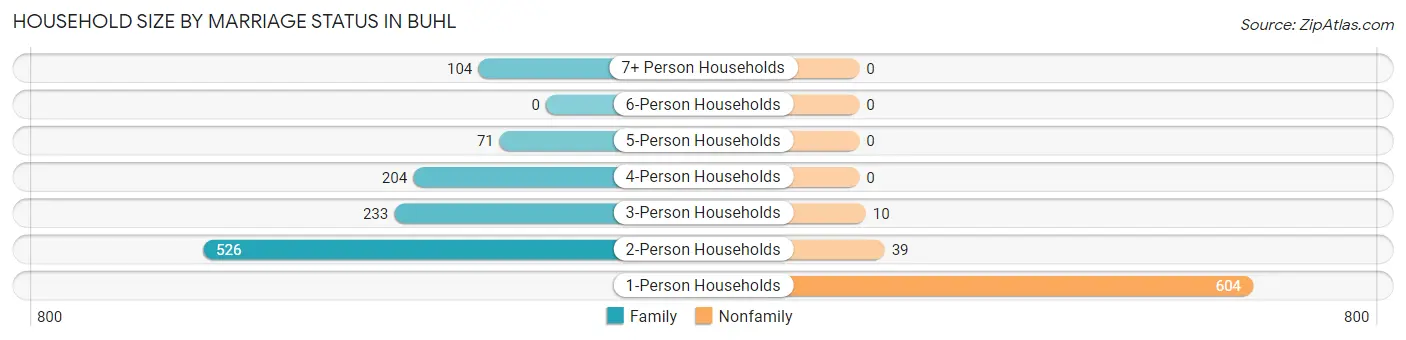
| Household Size | Family Households | Nonfamily Households |
| 1-Person Households | - | 604 (33.7%) |
| 2-Person Households | 526 (29.4%) | 39 (2.2%) |
| 3-Person Households | 233 (13.0%) | 10 (0.6%) |
| 4-Person Households | 204 (11.4%) | 0 (0.0%) |
| 5-Person Households | 71 (4.0%) | 0 (0.0%) |
| 6-Person Households | 0 (0.0%) | 0 (0.0%) |
| 7+ Person Households | 104 (5.8%) | 0 (0.0%) |
| Total | 1,138 (63.5%) | 653 (36.5%) |
Female Fertility in Buhl
Fertility by Age in Buhl
Average fertility rate in Buhl is 41.0 births per 1,000 women. Women in the age bracket of 20 to 34 years have the highest fertility rate with 82.0 births per 1,000 women. Women in the age bracket of 20 to 34 years acount for 100.0% of all women with births.
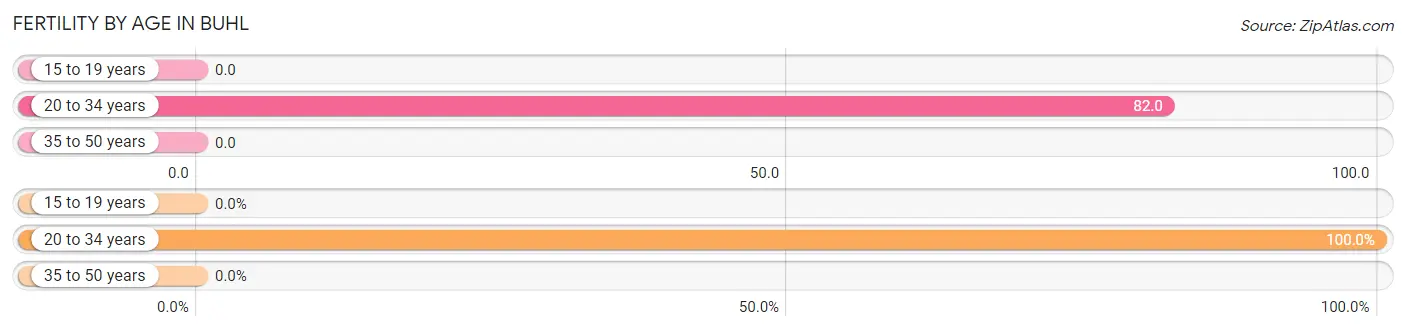
| Age Bracket | Women with Births | Births / 1,000 Women |
| 15 to 19 years | 0 (0.0%) | 0.0 |
| 20 to 34 years | 41 (100.0%) | 82.0 |
| 35 to 50 years | 0 (0.0%) | 0.0 |
| Total | 41 (100.0%) | 41.0 |
Fertility by Age by Marriage Status in Buhl
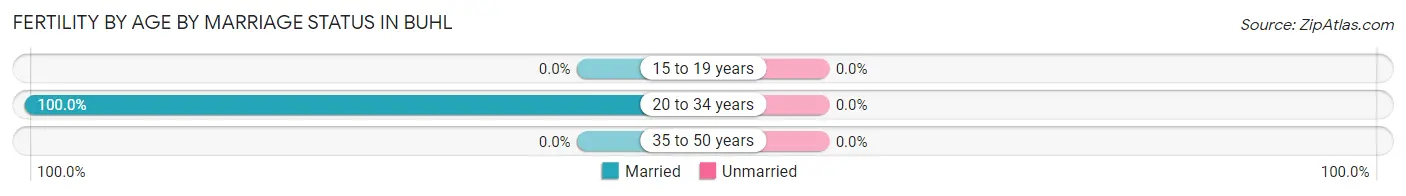
| Age Bracket | Married | Unmarried |
| 15 to 19 years | 0 (0.0%) | 0 (0.0%) |
| 20 to 34 years | 41 (100.0%) | 0 (0.0%) |
| 35 to 50 years | 0 (0.0%) | 0 (0.0%) |
| Total | 41 (100.0%) | 0 (0.0%) |
Fertility by Education in Buhl
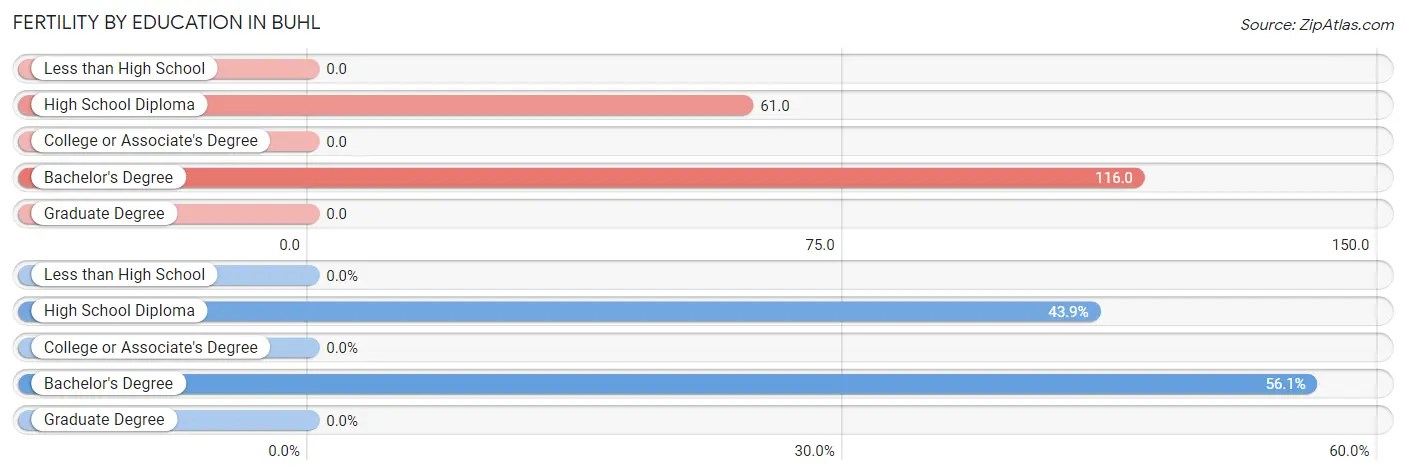
| Educational Attainment | Women with Births | Births / 1,000 Women |
| Less than High School | 0 (0.0%) | 0.0 |
| High School Diploma | 18 (43.9%) | 61.0 |
| College or Associate's Degree | 0 (0.0%) | 0.0 |
| Bachelor's Degree | 23 (56.1%) | 116.0 |
| Graduate Degree | 0 (0.0%) | 0.0 |
| Total | 41 (100.0%) | 41.0 |
Fertility by Education by Marriage Status in Buhl
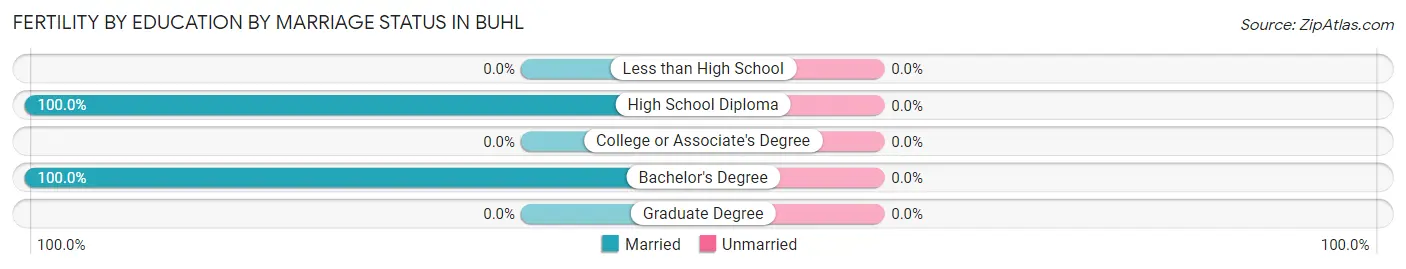
| Educational Attainment | Married | Unmarried |
| Less than High School | 0 (0.0%) | 0 (0.0%) |
| High School Diploma | 18 (100.0%) | 0 (0.0%) |
| College or Associate's Degree | 0 (0.0%) | 0 (0.0%) |
| Bachelor's Degree | 23 (100.0%) | 0 (0.0%) |
| Graduate Degree | 0 (0.0%) | 0 (0.0%) |
| Total | 41 (100.0%) | 0 (0.0%) |
Employment Characteristics in Buhl
Employment by Class of Employer in Buhl
Among the 2,048 employed individuals in Buhl, private company employees (1,466 | 71.6%), not-for-profit organizations (165 | 8.1%), and local government employees (148 | 7.2%) make up the most common classes of employment.
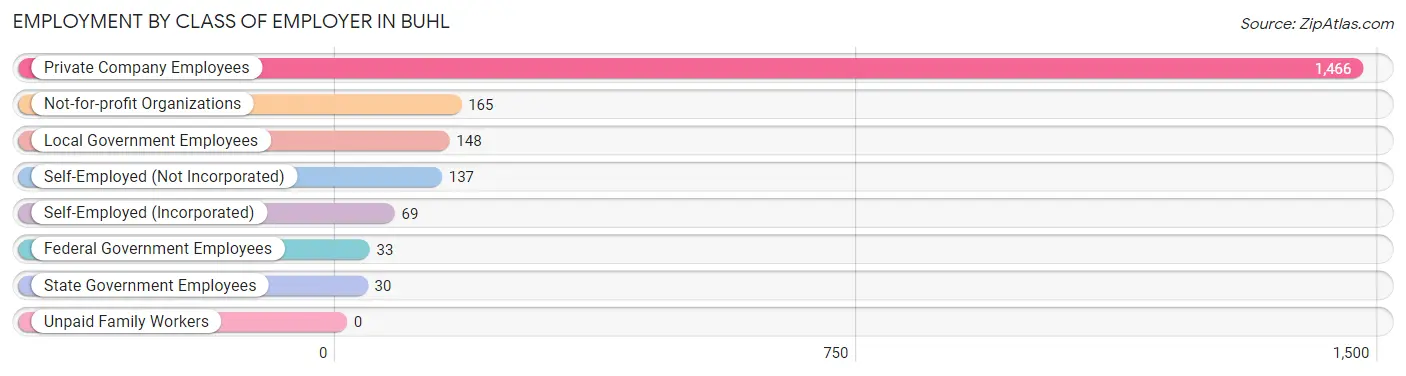
| Employer Class | # Employees | % Employees |
| Private Company Employees | 1,466 | 71.6% |
| Self-Employed (Incorporated) | 69 | 3.4% |
| Self-Employed (Not Incorporated) | 137 | 6.7% |
| Not-for-profit Organizations | 165 | 8.1% |
| Local Government Employees | 148 | 7.2% |
| State Government Employees | 30 | 1.5% |
| Federal Government Employees | 33 | 1.6% |
| Unpaid Family Workers | 0 | 0.0% |
| Total | 2,048 | 100.0% |
Employment Status by Age in Buhl
According to the labor force statistics for Buhl, out of the total population over 16 years of age (3,426), 62.8% or 2,152 individuals are in the labor force, with 4.0% or 86 of them unemployed. The age group with the highest labor force participation rate is 45 to 54 years, with 92.8% or 453 individuals in the labor force. Within the labor force, the 75 years and over age range has the highest percentage of unemployed individuals, with 100.0% or 9 of them being unemployed.
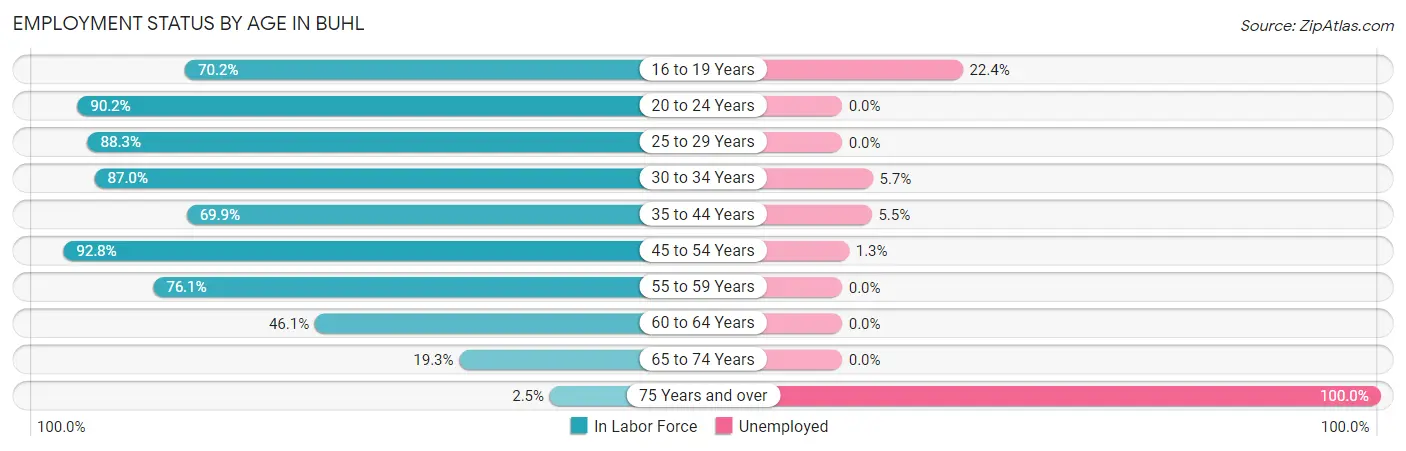
| Age Bracket | In Labor Force | Unemployed |
| 16 to 19 Years | 170 (70.2%) | 38 (22.4%) |
| 20 to 24 Years | 239 (90.2%) | 0 (0.0%) |
| 25 to 29 Years | 273 (88.3%) | 0 (0.0%) |
| 30 to 34 Years | 334 (87.0%) | 19 (5.7%) |
| 35 to 44 Years | 274 (69.9%) | 15 (5.5%) |
| 45 to 54 Years | 453 (92.8%) | 6 (1.3%) |
| 55 to 59 Years | 140 (76.1%) | 0 (0.0%) |
| 60 to 64 Years | 181 (46.1%) | 0 (0.0%) |
| 65 to 74 Years | 79 (19.3%) | 0 (0.0%) |
| 75 Years and over | 9 (2.5%) | 9 (100.0%) |
| Total | 2,152 (62.8%) | 86 (4.0%) |
Employment Status by Educational Attainment in Buhl
According to labor force statistics for Buhl, 77.0% of individuals (1,656) out of the total population between 25 and 64 years of age (2,150) are in the labor force, with 2.4% or 40 of them being unemployed. The group with the highest labor force participation rate are those with the educational attainment of college / associate degree, with 81.5% or 576 individuals in the labor force. Within the labor force, individuals with high school diploma education have the highest percentage of unemployment, with 10.6% or 40 of them being unemployed.
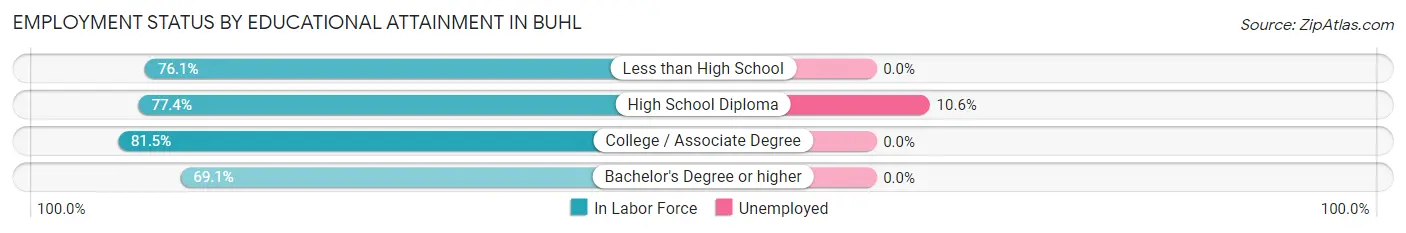
| Educational Attainment | In Labor Force | Unemployed |
| Less than High School | 455 (76.1%) | 0 (0.0%) |
| High School Diploma | 376 (77.4%) | 52 (10.6%) |
| College / Associate Degree | 576 (81.5%) | 0 (0.0%) |
| Bachelor's Degree or higher | 248 (69.1%) | 0 (0.0%) |
| Total | 1,656 (77.0%) | 52 (2.4%) |
Employment Occupations by Sex in Buhl
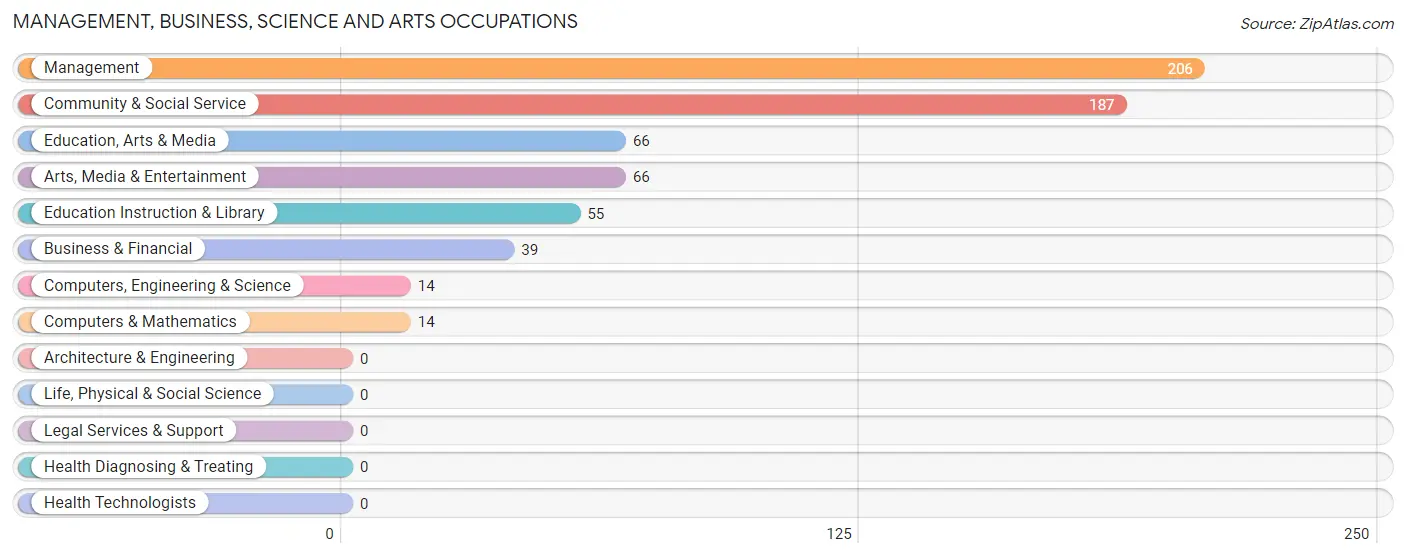
Management, Business, Science and Arts Occupations
The most common Management, Business, Science and Arts occupations in Buhl are Management (206 | 10.0%), Community & Social Service (187 | 9.1%), Education, Arts & Media (66 | 3.2%), Arts, Media & Entertainment (66 | 3.2%), and Education Instruction & Library (55 | 2.7%).
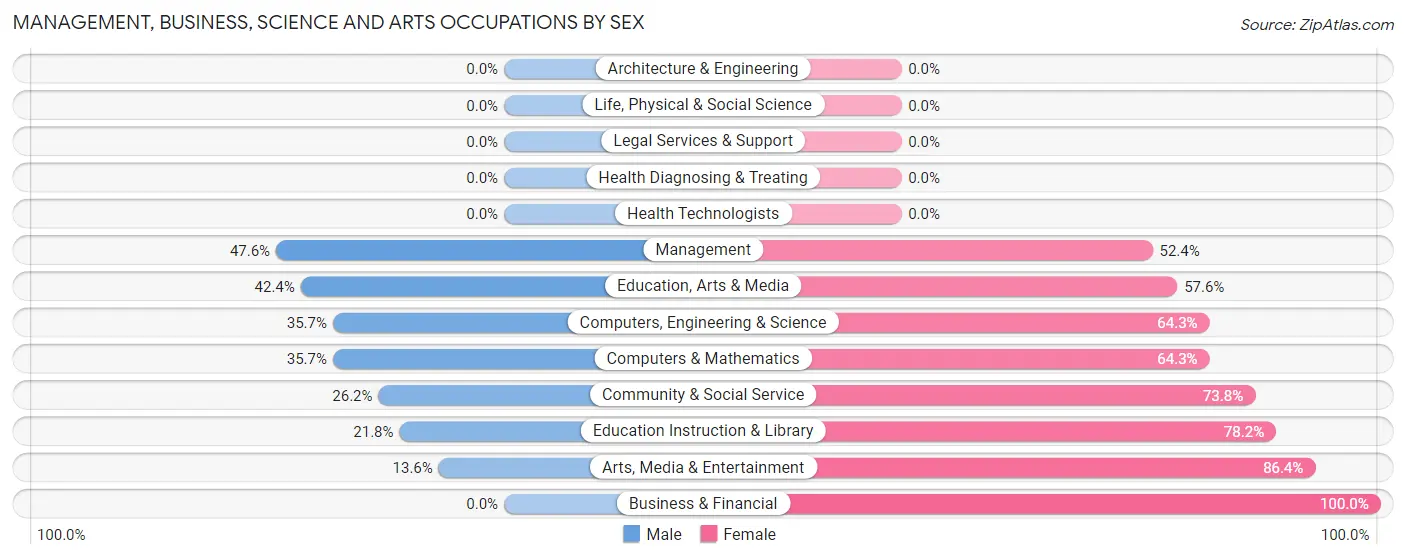
Management, Business, Science and Arts Occupations by Sex
Within the Management, Business, Science and Arts occupations in Buhl, the most male-oriented occupations are Management (47.6%), Education, Arts & Media (42.4%), and Computers, Engineering & Science (35.7%), while the most female-oriented occupations are Business & Financial (100.0%), Arts, Media & Entertainment (86.4%), and Education Instruction & Library (78.2%).
| Occupation | Male | Female |
| Management | 98 (47.6%) | 108 (52.4%) |
| Business & Financial | 0 (0.0%) | 39 (100.0%) |
| Computers, Engineering & Science | 5 (35.7%) | 9 (64.3%) |
| Computers & Mathematics | 5 (35.7%) | 9 (64.3%) |
| Architecture & Engineering | 0 (0.0%) | 0 (0.0%) |
| Life, Physical & Social Science | 0 (0.0%) | 0 (0.0%) |
| Community & Social Service | 49 (26.2%) | 138 (73.8%) |
| Education, Arts & Media | 28 (42.4%) | 38 (57.6%) |
| Legal Services & Support | 0 (0.0%) | 0 (0.0%) |
| Education Instruction & Library | 12 (21.8%) | 43 (78.2%) |
| Arts, Media & Entertainment | 9 (13.6%) | 57 (86.4%) |
| Health Diagnosing & Treating | 0 (0.0%) | 0 (0.0%) |
| Health Technologists | 0 (0.0%) | 0 (0.0%) |
| Total (Category) | 152 (34.1%) | 294 (65.9%) |
| Total (Overall) | 1,068 (51.7%) | 997 (48.3%) |
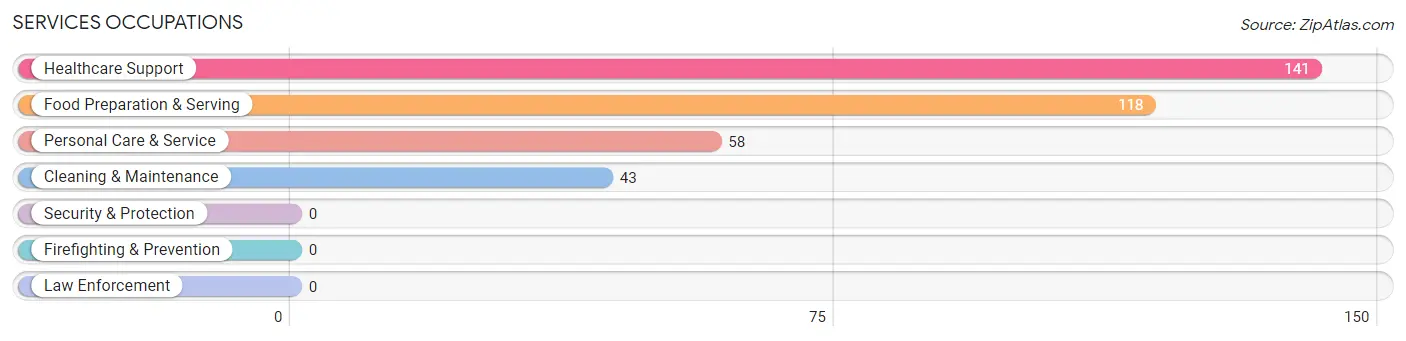
Services Occupations
The most common Services occupations in Buhl are Healthcare Support (141 | 6.8%), Food Preparation & Serving (118 | 5.7%), Personal Care & Service (58 | 2.8%), and Cleaning & Maintenance (43 | 2.1%).
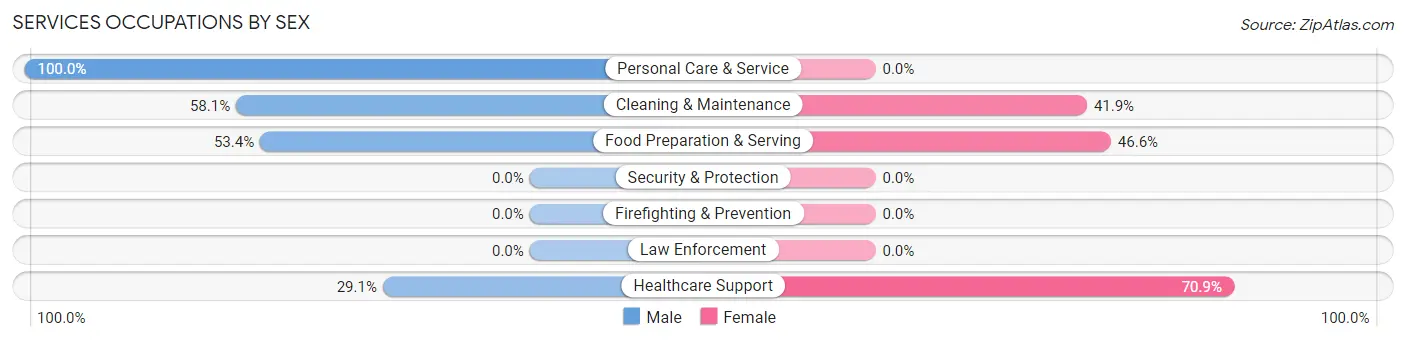
Services Occupations by Sex
Within the Services occupations in Buhl, the most male-oriented occupations are Personal Care & Service (100.0%), Cleaning & Maintenance (58.1%), and Food Preparation & Serving (53.4%), while the most female-oriented occupations are Healthcare Support (70.9%), Food Preparation & Serving (46.6%), and Cleaning & Maintenance (41.9%).
| Occupation | Male | Female |
| Healthcare Support | 41 (29.1%) | 100 (70.9%) |
| Security & Protection | 0 (0.0%) | 0 (0.0%) |
| Firefighting & Prevention | 0 (0.0%) | 0 (0.0%) |
| Law Enforcement | 0 (0.0%) | 0 (0.0%) |
| Food Preparation & Serving | 63 (53.4%) | 55 (46.6%) |
| Cleaning & Maintenance | 25 (58.1%) | 18 (41.9%) |
| Personal Care & Service | 58 (100.0%) | 0 (0.0%) |
| Total (Category) | 187 (51.9%) | 173 (48.1%) |
| Total (Overall) | 1,068 (51.7%) | 997 (48.3%) |
Sales and Office Occupations
The most common Sales and Office occupations in Buhl are Sales & Related (287 | 13.9%), and Office & Administration (192 | 9.3%).
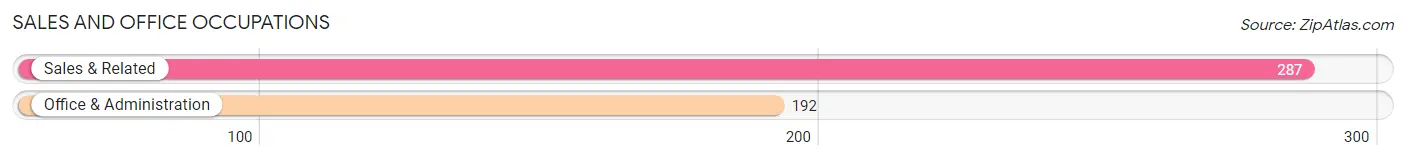
Sales and Office Occupations by Sex

| Occupation | Male | Female |
| Sales & Related | 104 (36.2%) | 183 (63.8%) |
| Office & Administration | 8 (4.2%) | 184 (95.8%) |
| Total (Category) | 112 (23.4%) | 367 (76.6%) |
| Total (Overall) | 1,068 (51.7%) | 997 (48.3%) |
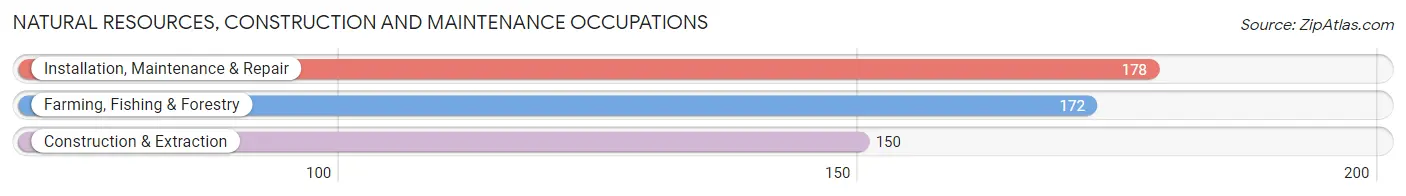
Natural Resources, Construction and Maintenance Occupations
The most common Natural Resources, Construction and Maintenance occupations in Buhl are Installation, Maintenance & Repair (178 | 8.6%), Farming, Fishing & Forestry (172 | 8.3%), and Construction & Extraction (150 | 7.3%).
Natural Resources, Construction and Maintenance Occupations by Sex
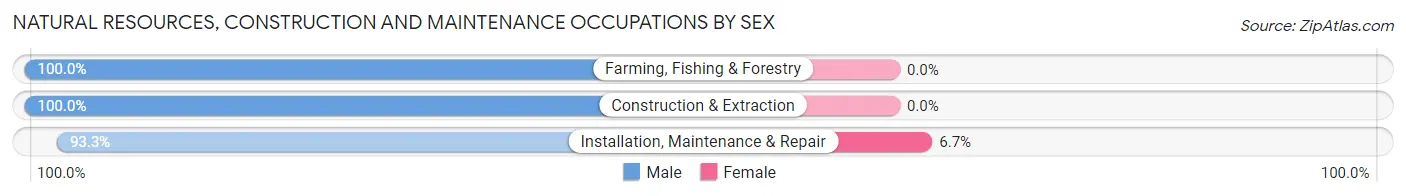
| Occupation | Male | Female |
| Farming, Fishing & Forestry | 172 (100.0%) | 0 (0.0%) |
| Construction & Extraction | 150 (100.0%) | 0 (0.0%) |
| Installation, Maintenance & Repair | 166 (93.3%) | 12 (6.7%) |
| Total (Category) | 488 (97.6%) | 12 (2.4%) |
| Total (Overall) | 1,068 (51.7%) | 997 (48.3%) |
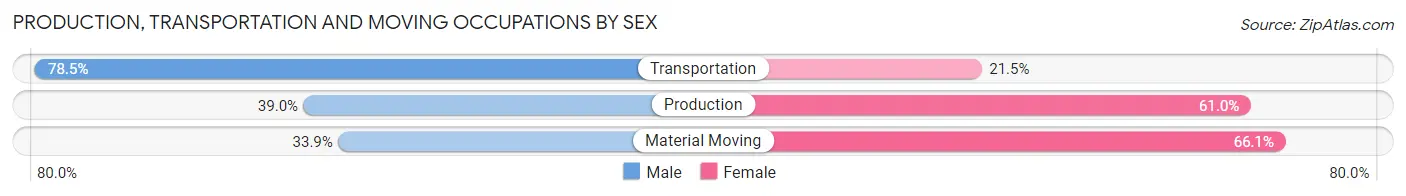
Production, Transportation and Moving Occupations
The most common Production, Transportation and Moving occupations in Buhl are Material Moving (115 | 5.6%), Production (100 | 4.8%), and Transportation (65 | 3.2%).
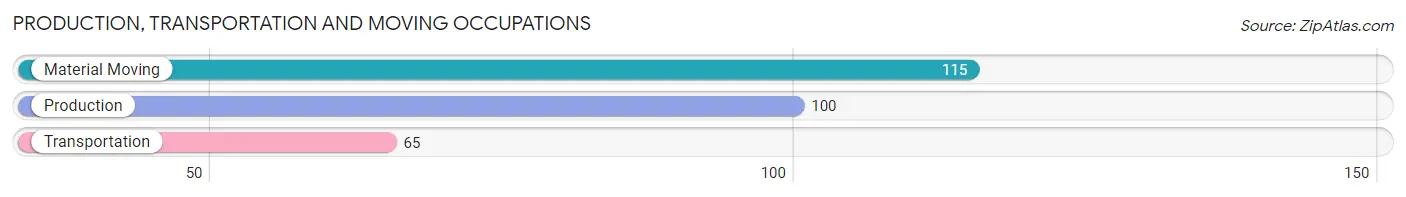
Production, Transportation and Moving Occupations by Sex
| Occupation | Male | Female |
| Production | 39 (39.0%) | 61 (61.0%) |
| Transportation | 51 (78.5%) | 14 (21.5%) |
| Material Moving | 39 (33.9%) | 76 (66.1%) |
| Total (Category) | 129 (46.1%) | 151 (53.9%) |
| Total (Overall) | 1,068 (51.7%) | 997 (48.3%) |
Employment Industries by Sex in Buhl
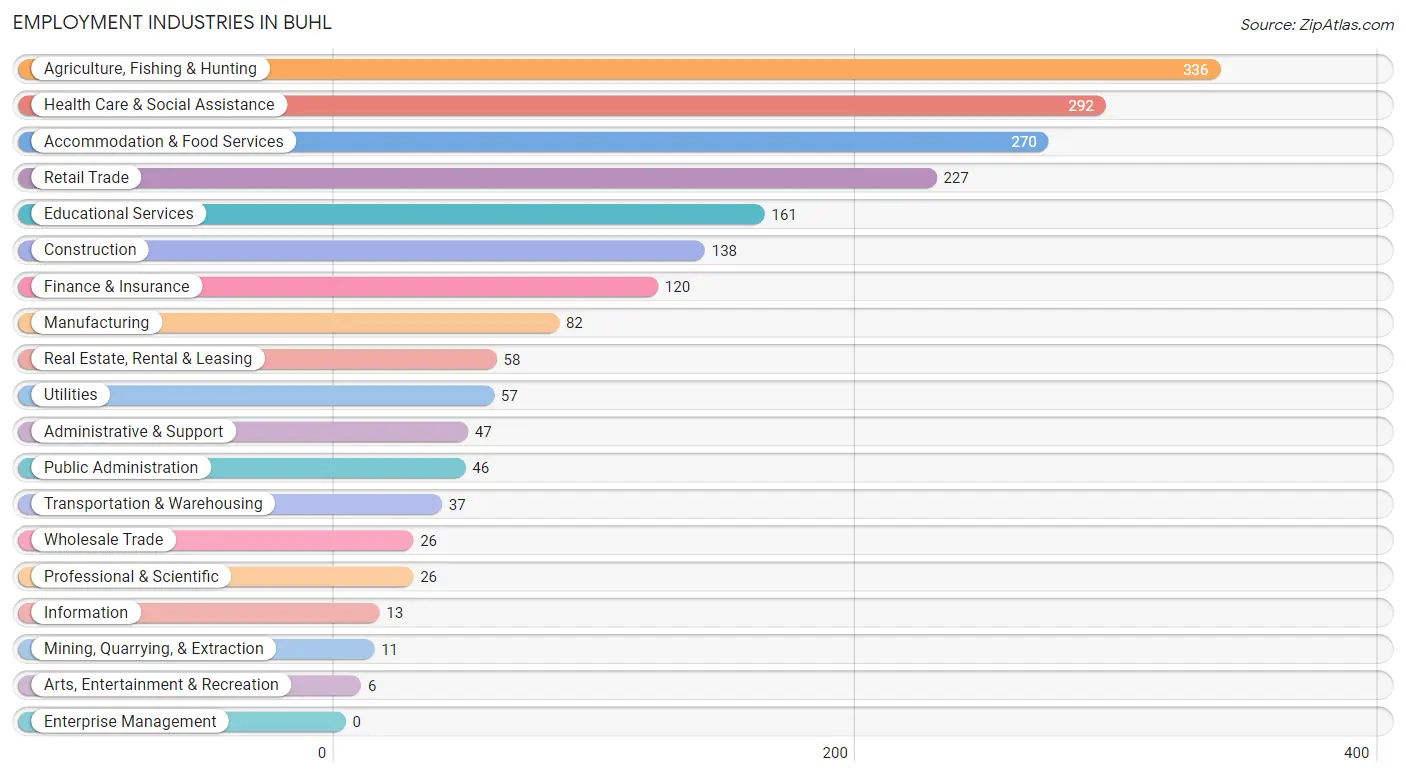
Employment Industries in Buhl
The major employment industries in Buhl include Agriculture, Fishing & Hunting (336 | 16.3%), Health Care & Social Assistance (292 | 14.1%), Accommodation & Food Services (270 | 13.1%), Retail Trade (227 | 11.0%), and Educational Services (161 | 7.8%).
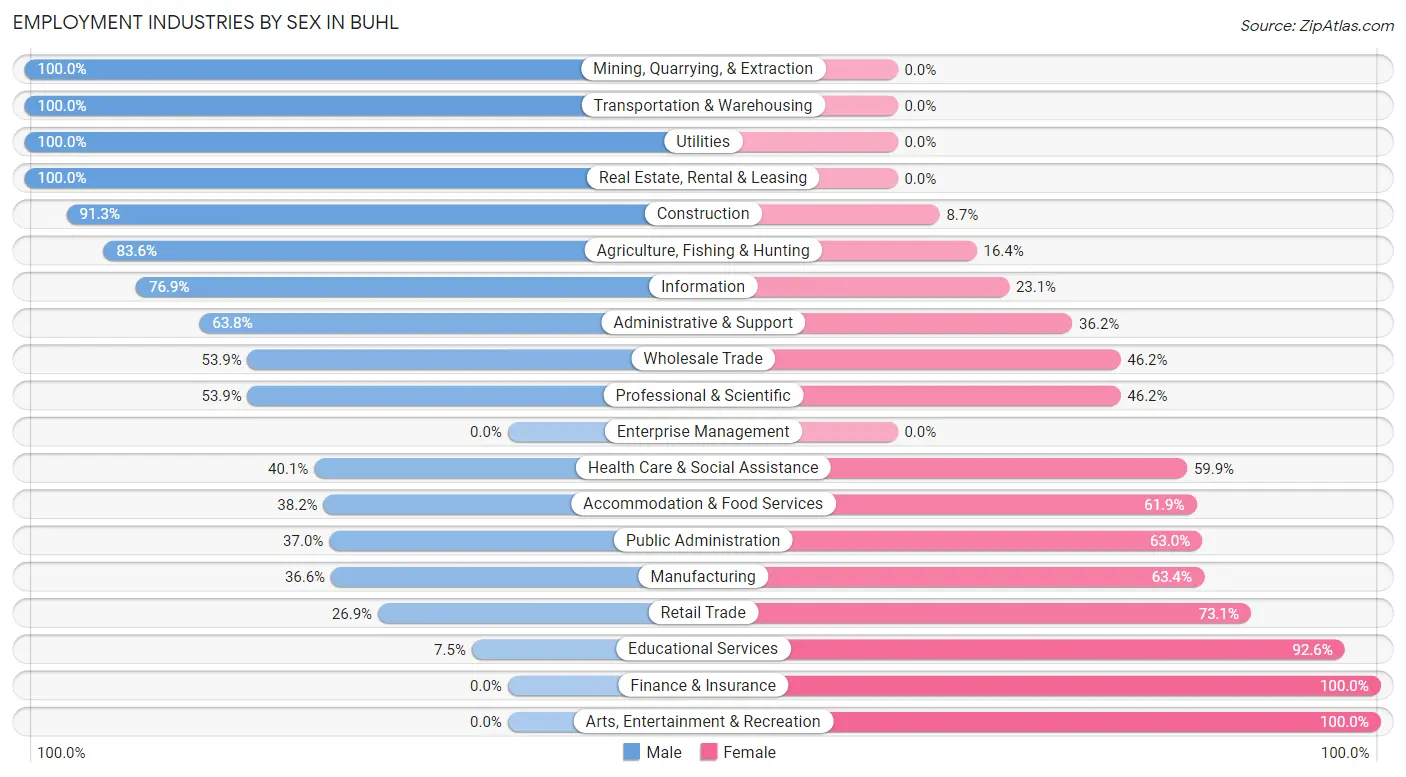
Employment Industries by Sex in Buhl
The Buhl industries that see more men than women are Mining, Quarrying, & Extraction (100.0%), Transportation & Warehousing (100.0%), and Utilities (100.0%), whereas the industries that tend to have a higher number of women are Finance & Insurance (100.0%), Arts, Entertainment & Recreation (100.0%), and Educational Services (92.5%).
| Industry | Male | Female |
| Agriculture, Fishing & Hunting | 281 (83.6%) | 55 (16.4%) |
| Mining, Quarrying, & Extraction | 11 (100.0%) | 0 (0.0%) |
| Construction | 126 (91.3%) | 12 (8.7%) |
| Manufacturing | 30 (36.6%) | 52 (63.4%) |
| Wholesale Trade | 14 (53.8%) | 12 (46.2%) |
| Retail Trade | 61 (26.9%) | 166 (73.1%) |
| Transportation & Warehousing | 37 (100.0%) | 0 (0.0%) |
| Utilities | 57 (100.0%) | 0 (0.0%) |
| Information | 10 (76.9%) | 3 (23.1%) |
| Finance & Insurance | 0 (0.0%) | 120 (100.0%) |
| Real Estate, Rental & Leasing | 58 (100.0%) | 0 (0.0%) |
| Professional & Scientific | 14 (53.8%) | 12 (46.2%) |
| Enterprise Management | 0 (0.0%) | 0 (0.0%) |
| Administrative & Support | 30 (63.8%) | 17 (36.2%) |
| Educational Services | 12 (7.4%) | 149 (92.5%) |
| Health Care & Social Assistance | 117 (40.1%) | 175 (59.9%) |
| Arts, Entertainment & Recreation | 0 (0.0%) | 6 (100.0%) |
| Accommodation & Food Services | 103 (38.2%) | 167 (61.9%) |
| Public Administration | 17 (37.0%) | 29 (63.0%) |
| Total | 1,068 (51.7%) | 997 (48.3%) |
Education in Buhl
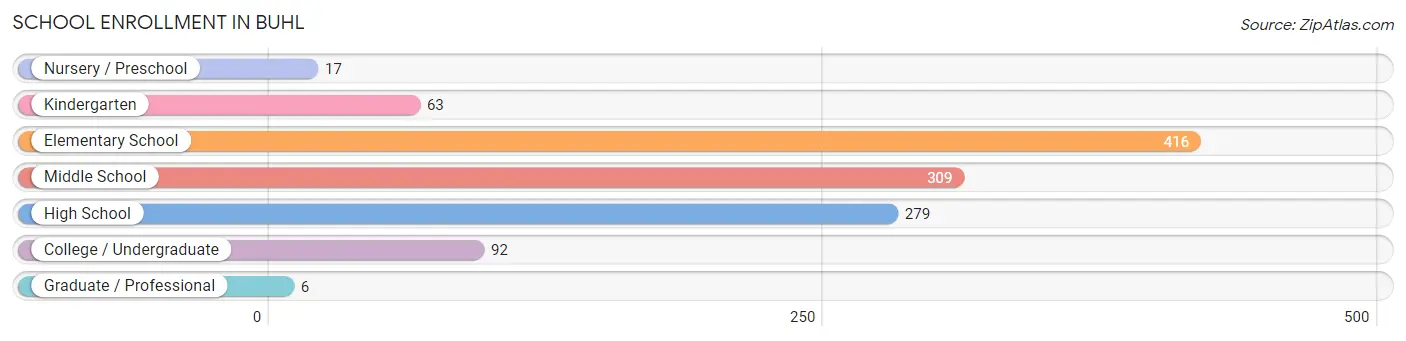
School Enrollment in Buhl
The most common levels of schooling among the 1,182 students in Buhl are elementary school (416 | 35.2%), middle school (309 | 26.1%), and high school (279 | 23.6%).
| School Level | # Students | % Students |
| Nursery / Preschool | 17 | 1.4% |
| Kindergarten | 63 | 5.3% |
| Elementary School | 416 | 35.2% |
| Middle School | 309 | 26.1% |
| High School | 279 | 23.6% |
| College / Undergraduate | 92 | 7.8% |
| Graduate / Professional | 6 | 0.5% |
| Total | 1,182 | 100.0% |
School Enrollment by Age by Funding Source in Buhl
Out of a total of 1,182 students who are enrolled in schools in Buhl, 35 (3.0%) attend a private institution, while the remaining 1,147 (97.0%) are enrolled in public schools. The age group of 25 to 34 year olds has the highest likelihood of being enrolled in private schools, with 6 (46.2% in the age bracket) enrolled. Conversely, the age group of 3 to 4 year olds has the lowest likelihood of being enrolled in a private school, with 17 (100.0% in the age bracket) attending a public institution.
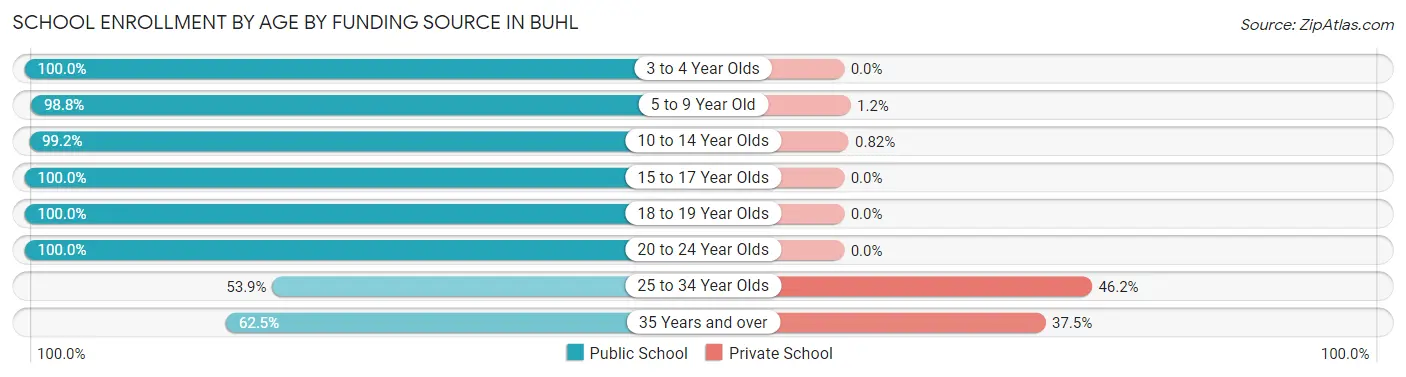
| Age Bracket | Public School | Private School |
| 3 to 4 Year Olds | 17 (100.0%) | 0 (0.0%) |
| 5 to 9 Year Old | 416 (98.8%) | 5 (1.2%) |
| 10 to 14 Year Olds | 364 (99.2%) | 3 (0.8%) |
| 15 to 17 Year Olds | 231 (100.0%) | 0 (0.0%) |
| 18 to 19 Year Olds | 60 (100.0%) | 0 (0.0%) |
| 20 to 24 Year Olds | 17 (100.0%) | 0 (0.0%) |
| 25 to 34 Year Olds | 7 (53.8%) | 6 (46.2%) |
| 35 Years and over | 35 (62.5%) | 21 (37.5%) |
| Total | 1,147 (97.0%) | 35 (3.0%) |
Educational Attainment by Field of Study in Buhl
Education (109 | 23.0%), business (105 | 22.1%), arts & humanities (66 | 13.9%), bio, nature & agricultural (50 | 10.5%), and psychology (46 | 9.7%) are the most common fields of study among 475 individuals in Buhl who have obtained a bachelor's degree or higher.
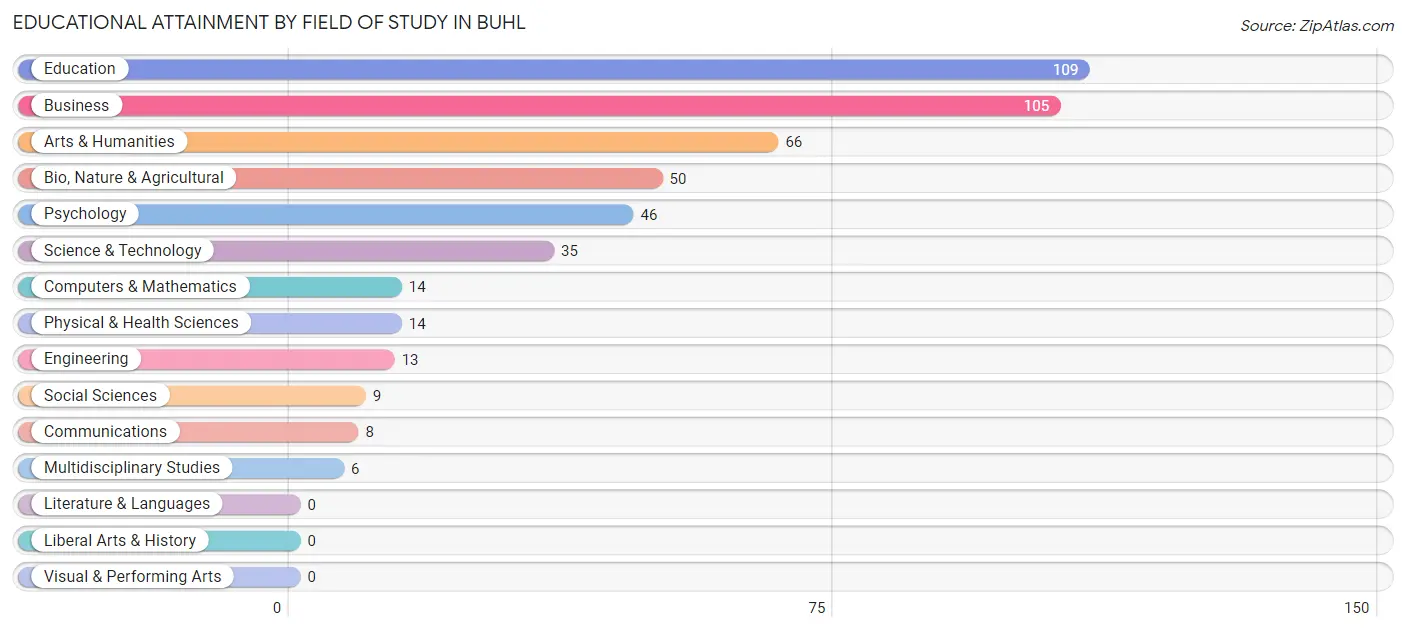
| Field of Study | # Graduates | % Graduates |
| Computers & Mathematics | 14 | 2.9% |
| Bio, Nature & Agricultural | 50 | 10.5% |
| Physical & Health Sciences | 14 | 2.9% |
| Psychology | 46 | 9.7% |
| Social Sciences | 9 | 1.9% |
| Engineering | 13 | 2.7% |
| Multidisciplinary Studies | 6 | 1.3% |
| Science & Technology | 35 | 7.4% |
| Business | 105 | 22.1% |
| Education | 109 | 23.0% |
| Literature & Languages | 0 | 0.0% |
| Liberal Arts & History | 0 | 0.0% |
| Visual & Performing Arts | 0 | 0.0% |
| Communications | 8 | 1.7% |
| Arts & Humanities | 66 | 13.9% |
| Total | 475 | 100.0% |
Transportation & Commute in Buhl
Vehicle Availability by Sex in Buhl
The most prevalent vehicle ownership categories in Buhl are males with 2 vehicles (383, accounting for 36.2%) and females with 2 vehicles (316, making up 38.7%).
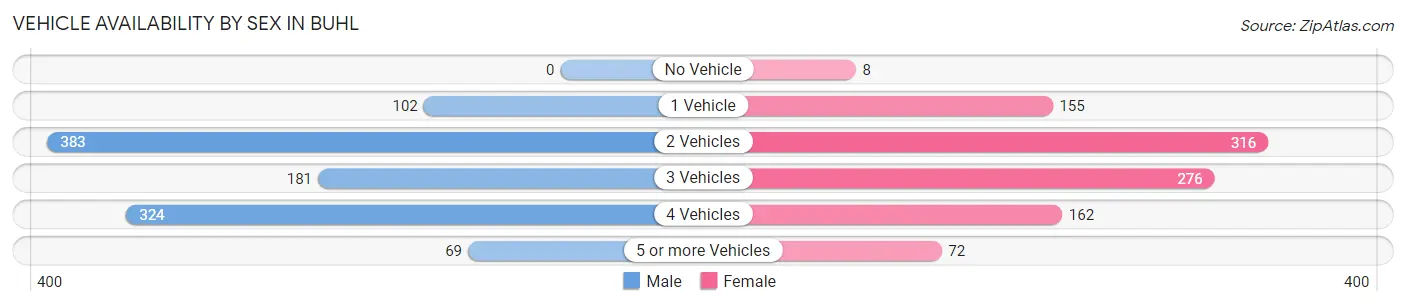
| Vehicles Available | Male | Female |
| No Vehicle | 0 (0.0%) | 8 (0.8%) |
| 1 Vehicle | 102 (9.6%) | 155 (15.7%) |
| 2 Vehicles | 383 (36.2%) | 316 (32.0%) |
| 3 Vehicles | 181 (17.1%) | 276 (27.9%) |
| 4 Vehicles | 324 (30.6%) | 162 (16.4%) |
| 5 or more Vehicles | 69 (6.5%) | 72 (7.3%) |
| Total | 1,059 (100.0%) | 989 (100.0%) |
Commute Time in Buhl
The most frequently occuring commute durations in Buhl are 20 to 24 minutes (304 commuters, 15.8%), 5 to 9 minutes (287 commuters, 14.9%), and 30 to 34 minutes (279 commuters, 14.5%).
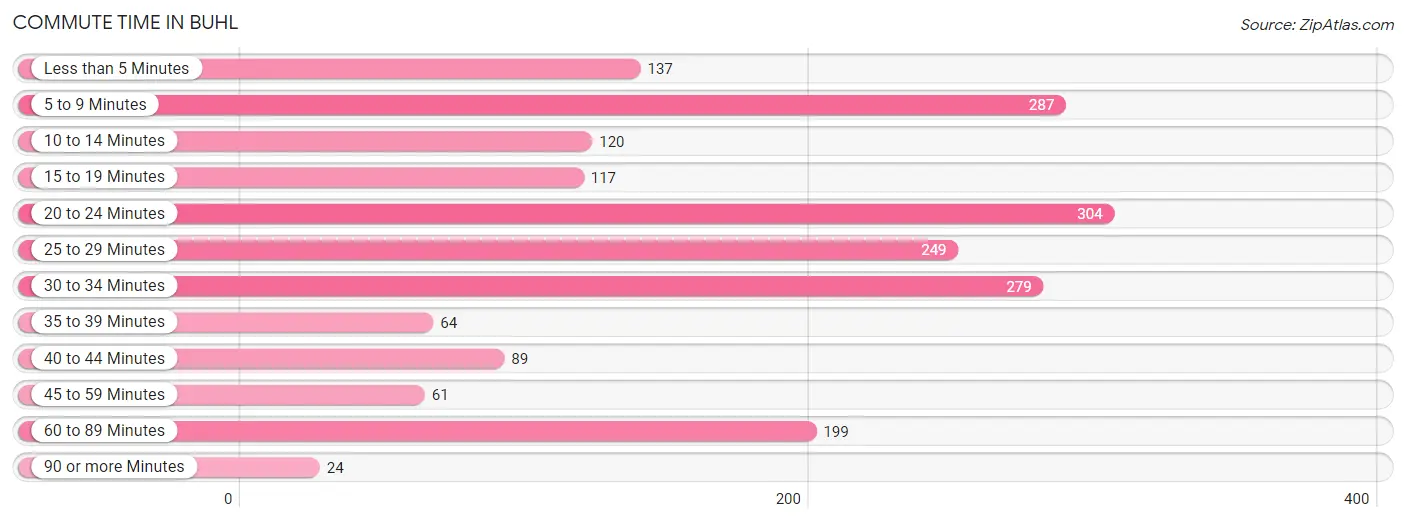
| Commute Time | # Commuters | % Commuters |
| Less than 5 Minutes | 137 | 7.1% |
| 5 to 9 Minutes | 287 | 14.9% |
| 10 to 14 Minutes | 120 | 6.2% |
| 15 to 19 Minutes | 117 | 6.1% |
| 20 to 24 Minutes | 304 | 15.8% |
| 25 to 29 Minutes | 249 | 12.9% |
| 30 to 34 Minutes | 279 | 14.5% |
| 35 to 39 Minutes | 64 | 3.3% |
| 40 to 44 Minutes | 89 | 4.6% |
| 45 to 59 Minutes | 61 | 3.2% |
| 60 to 89 Minutes | 199 | 10.3% |
| 90 or more Minutes | 24 | 1.2% |
Commute Time by Sex in Buhl
The most common commute times in Buhl are 25 to 29 minutes (146 commuters, 14.7%) for males and 5 to 9 minutes (202 commuters, 21.5%) for females.
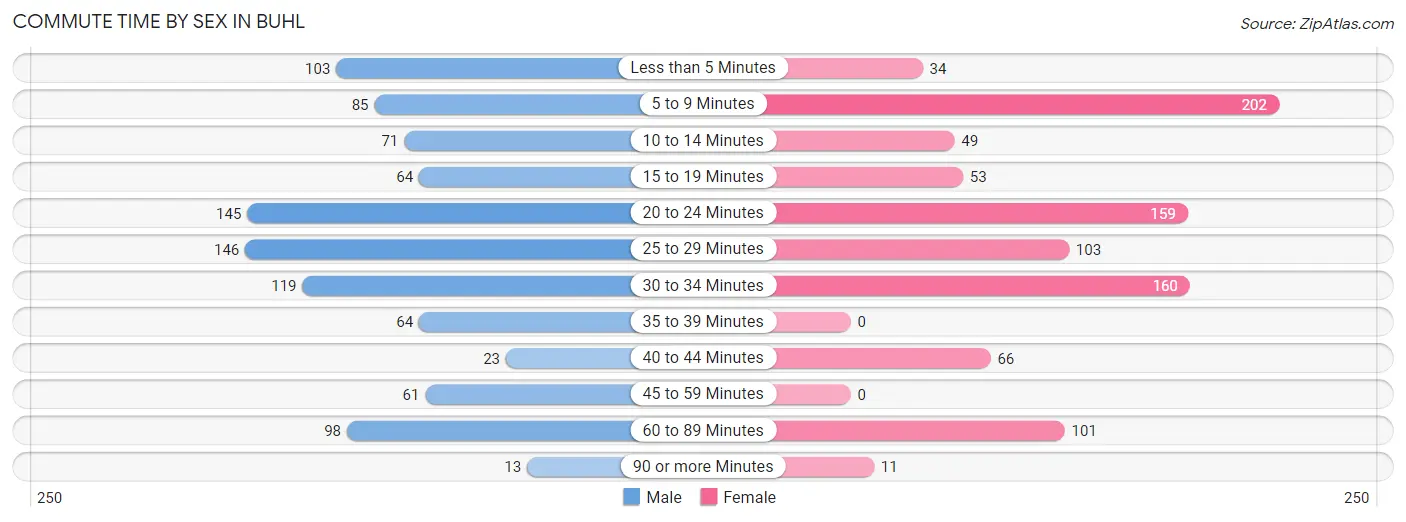
| Commute Time | Male | Female |
| Less than 5 Minutes | 103 (10.4%) | 34 (3.6%) |
| 5 to 9 Minutes | 85 (8.6%) | 202 (21.5%) |
| 10 to 14 Minutes | 71 (7.2%) | 49 (5.2%) |
| 15 to 19 Minutes | 64 (6.5%) | 53 (5.7%) |
| 20 to 24 Minutes | 145 (14.6%) | 159 (17.0%) |
| 25 to 29 Minutes | 146 (14.7%) | 103 (11.0%) |
| 30 to 34 Minutes | 119 (12.0%) | 160 (17.1%) |
| 35 to 39 Minutes | 64 (6.5%) | 0 (0.0%) |
| 40 to 44 Minutes | 23 (2.3%) | 66 (7.0%) |
| 45 to 59 Minutes | 61 (6.1%) | 0 (0.0%) |
| 60 to 89 Minutes | 98 (9.9%) | 101 (10.8%) |
| 90 or more Minutes | 13 (1.3%) | 11 (1.2%) |
Time of Departure to Work by Sex in Buhl
The most frequent times of departure to work in Buhl are 6:30 AM to 6:59 AM (164, 16.5%) for males and 7:30 AM to 7:59 AM (171, 18.2%) for females.
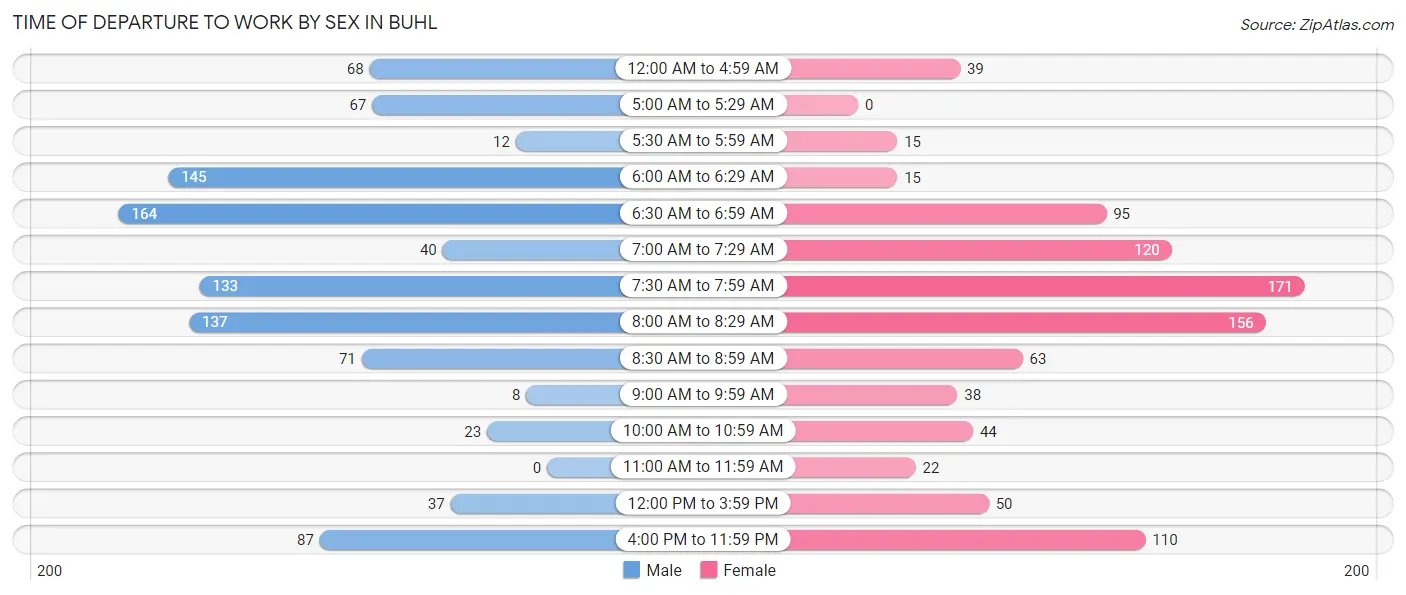
| Time of Departure | Male | Female |
| 12:00 AM to 4:59 AM | 68 (6.9%) | 39 (4.2%) |
| 5:00 AM to 5:29 AM | 67 (6.8%) | 0 (0.0%) |
| 5:30 AM to 5:59 AM | 12 (1.2%) | 15 (1.6%) |
| 6:00 AM to 6:29 AM | 145 (14.6%) | 15 (1.6%) |
| 6:30 AM to 6:59 AM | 164 (16.5%) | 95 (10.1%) |
| 7:00 AM to 7:29 AM | 40 (4.0%) | 120 (12.8%) |
| 7:30 AM to 7:59 AM | 133 (13.4%) | 171 (18.2%) |
| 8:00 AM to 8:29 AM | 137 (13.8%) | 156 (16.6%) |
| 8:30 AM to 8:59 AM | 71 (7.2%) | 63 (6.7%) |
| 9:00 AM to 9:59 AM | 8 (0.8%) | 38 (4.1%) |
| 10:00 AM to 10:59 AM | 23 (2.3%) | 44 (4.7%) |
| 11:00 AM to 11:59 AM | 0 (0.0%) | 22 (2.4%) |
| 12:00 PM to 3:59 PM | 37 (3.7%) | 50 (5.3%) |
| 4:00 PM to 11:59 PM | 87 (8.8%) | 110 (11.7%) |
| Total | 992 (100.0%) | 938 (100.0%) |
Housing Occupancy in Buhl
Occupancy by Ownership in Buhl
Of the total 1,791 dwellings in Buhl, owner-occupied units account for 1,434 (80.1%), while renter-occupied units make up 357 (19.9%).
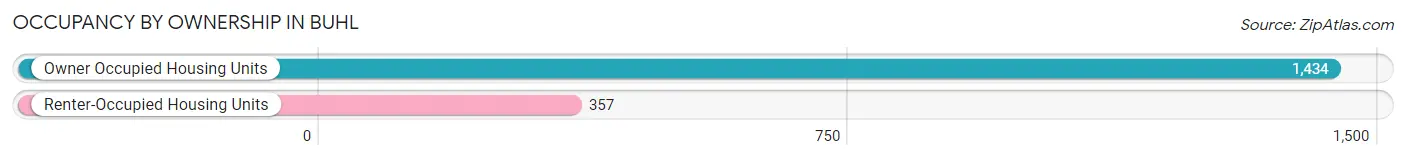
| Occupancy | # Housing Units | % Housing Units |
| Owner Occupied Housing Units | 1,434 | 80.1% |
| Renter-Occupied Housing Units | 357 | 19.9% |
| Total Occupied Housing Units | 1,791 | 100.0% |
Occupancy by Household Size in Buhl
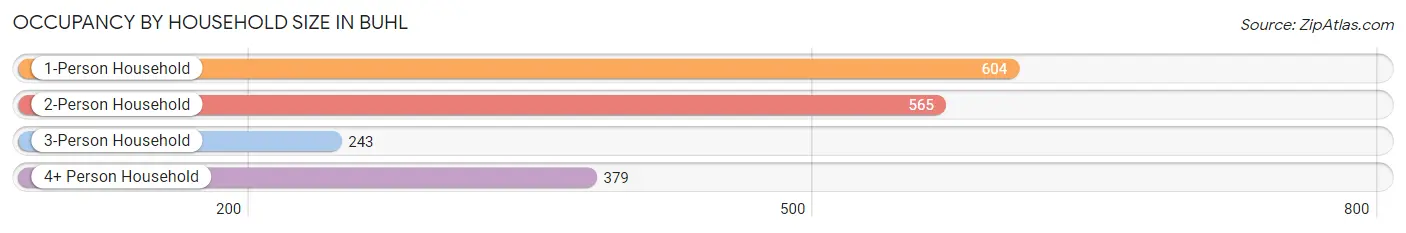
| Household Size | # Housing Units | % Housing Units |
| 1-Person Household | 604 | 33.7% |
| 2-Person Household | 565 | 31.6% |
| 3-Person Household | 243 | 13.6% |
| 4+ Person Household | 379 | 21.2% |
| Total Housing Units | 1,791 | 100.0% |
Occupancy by Ownership by Household Size in Buhl
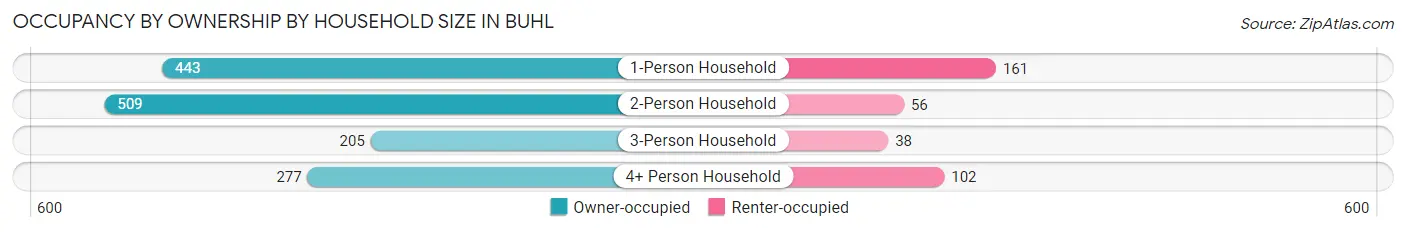
| Household Size | Owner-occupied | Renter-occupied |
| 1-Person Household | 443 (73.3%) | 161 (26.7%) |
| 2-Person Household | 509 (90.1%) | 56 (9.9%) |
| 3-Person Household | 205 (84.4%) | 38 (15.6%) |
| 4+ Person Household | 277 (73.1%) | 102 (26.9%) |
| Total Housing Units | 1,434 (80.1%) | 357 (19.9%) |
Occupancy by Educational Attainment in Buhl
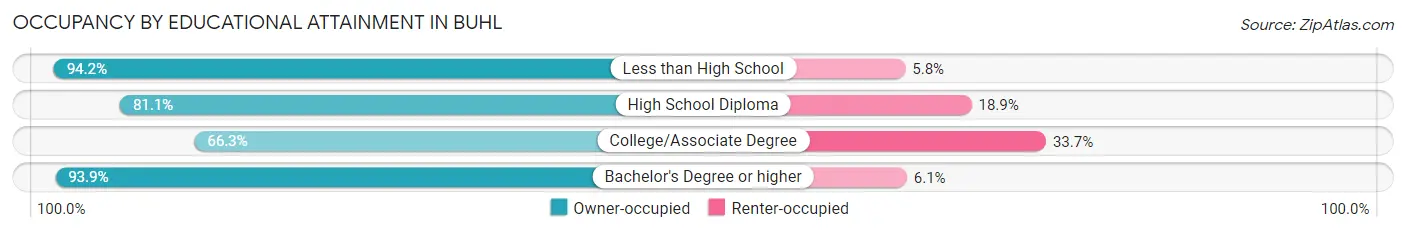
| Household Size | Owner-occupied | Renter-occupied |
| Less than High School | 326 (94.2%) | 20 (5.8%) |
| High School Diploma | 373 (81.1%) | 87 (18.9%) |
| College/Associate Degree | 457 (66.3%) | 232 (33.7%) |
| Bachelor's Degree or higher | 278 (93.9%) | 18 (6.1%) |
Occupancy by Age of Householder in Buhl
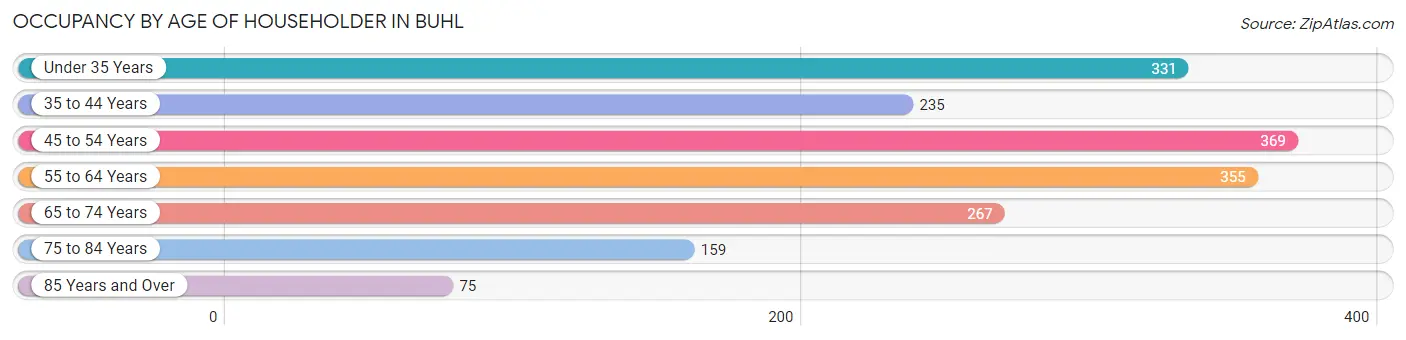
| Age Bracket | # Households | % Households |
| Under 35 Years | 331 | 18.5% |
| 35 to 44 Years | 235 | 13.1% |
| 45 to 54 Years | 369 | 20.6% |
| 55 to 64 Years | 355 | 19.8% |
| 65 to 74 Years | 267 | 14.9% |
| 75 to 84 Years | 159 | 8.9% |
| 85 Years and Over | 75 | 4.2% |
| Total | 1,791 | 100.0% |
Housing Finances in Buhl
Median Income by Occupancy in Buhl
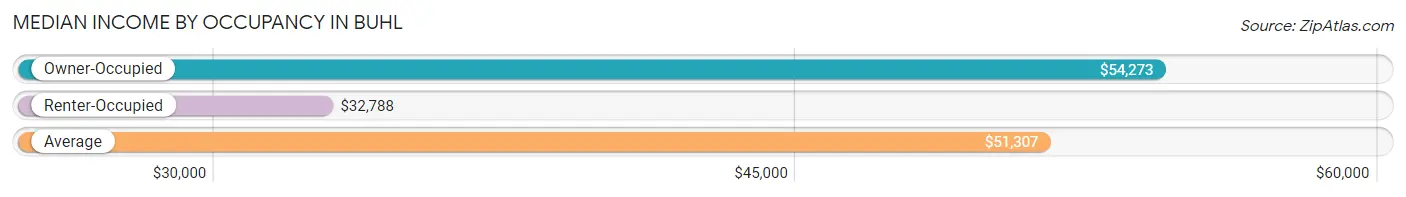
| Occupancy Type | # Households | Median Income |
| Owner-Occupied | 1,434 (80.1%) | $54,273 |
| Renter-Occupied | 357 (19.9%) | $32,788 |
| Average | 1,791 (100.0%) | $51,307 |
Occupancy by Householder Income Bracket in Buhl
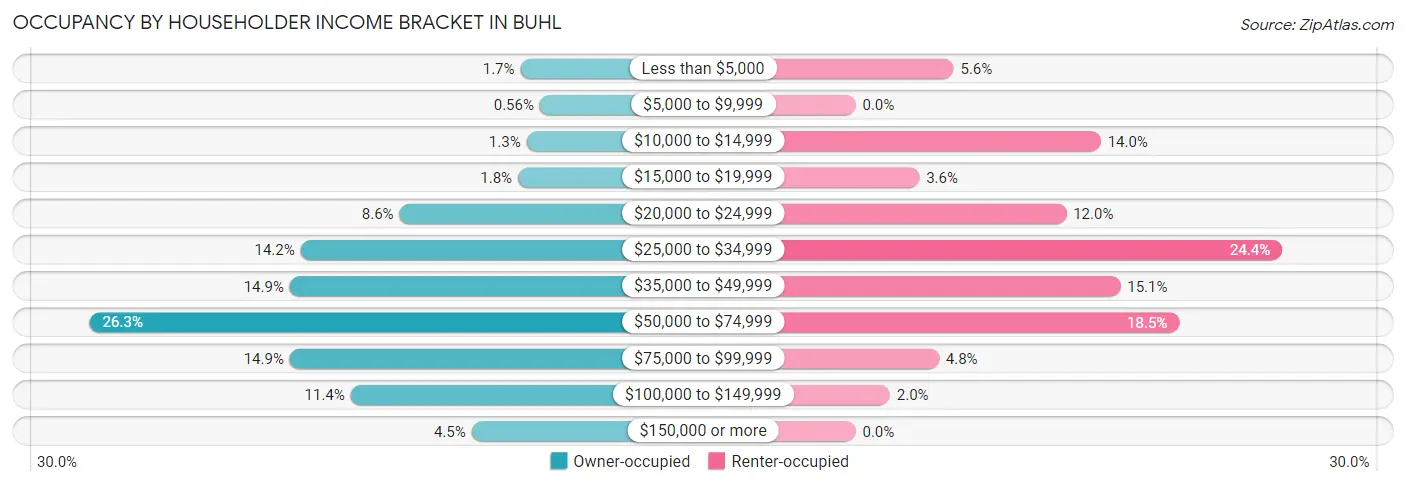
| Income Bracket | Owner-occupied | Renter-occupied |
| Less than $5,000 | 24 (1.7%) | 20 (5.6%) |
| $5,000 to $9,999 | 8 (0.6%) | 0 (0.0%) |
| $10,000 to $14,999 | 19 (1.3%) | 50 (14.0%) |
| $15,000 to $19,999 | 26 (1.8%) | 13 (3.6%) |
| $20,000 to $24,999 | 123 (8.6%) | 43 (12.0%) |
| $25,000 to $34,999 | 204 (14.2%) | 87 (24.4%) |
| $35,000 to $49,999 | 213 (14.8%) | 54 (15.1%) |
| $50,000 to $74,999 | 377 (26.3%) | 66 (18.5%) |
| $75,000 to $99,999 | 213 (14.8%) | 17 (4.8%) |
| $100,000 to $149,999 | 163 (11.4%) | 7 (2.0%) |
| $150,000 or more | 64 (4.5%) | 0 (0.0%) |
| Total | 1,434 (100.0%) | 357 (100.0%) |
Monthly Housing Cost Tiers in Buhl
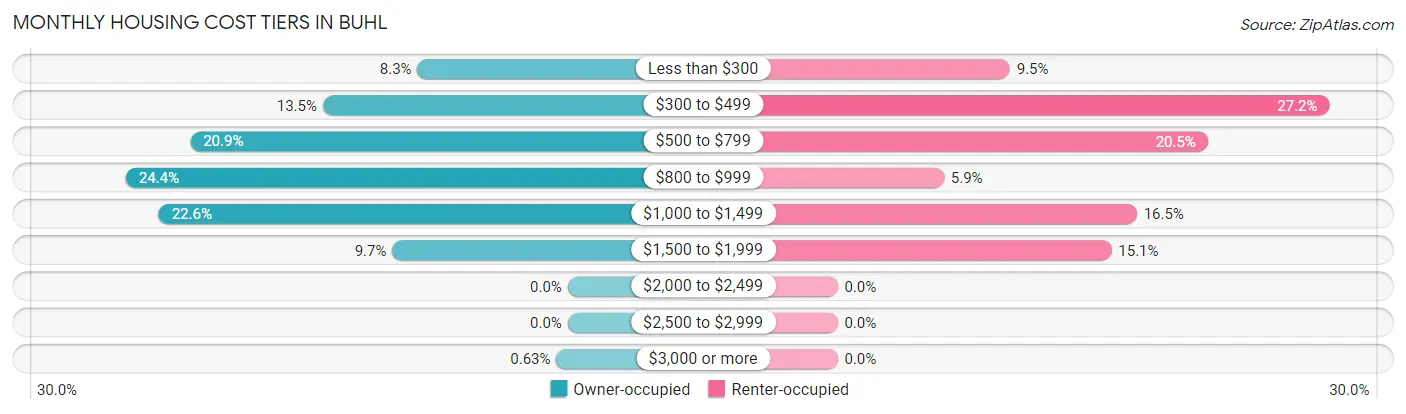
| Monthly Cost | Owner-occupied | Renter-occupied |
| Less than $300 | 119 (8.3%) | 34 (9.5%) |
| $300 to $499 | 194 (13.5%) | 97 (27.2%) |
| $500 to $799 | 299 (20.8%) | 73 (20.4%) |
| $800 to $999 | 350 (24.4%) | 21 (5.9%) |
| $1,000 to $1,499 | 324 (22.6%) | 59 (16.5%) |
| $1,500 to $1,999 | 139 (9.7%) | 54 (15.1%) |
| $2,000 to $2,499 | 0 (0.0%) | 0 (0.0%) |
| $2,500 to $2,999 | 0 (0.0%) | 0 (0.0%) |
| $3,000 or more | 9 (0.6%) | 0 (0.0%) |
| Total | 1,434 (100.0%) | 357 (100.0%) |
Physical Housing Characteristics in Buhl
Housing Structures in Buhl
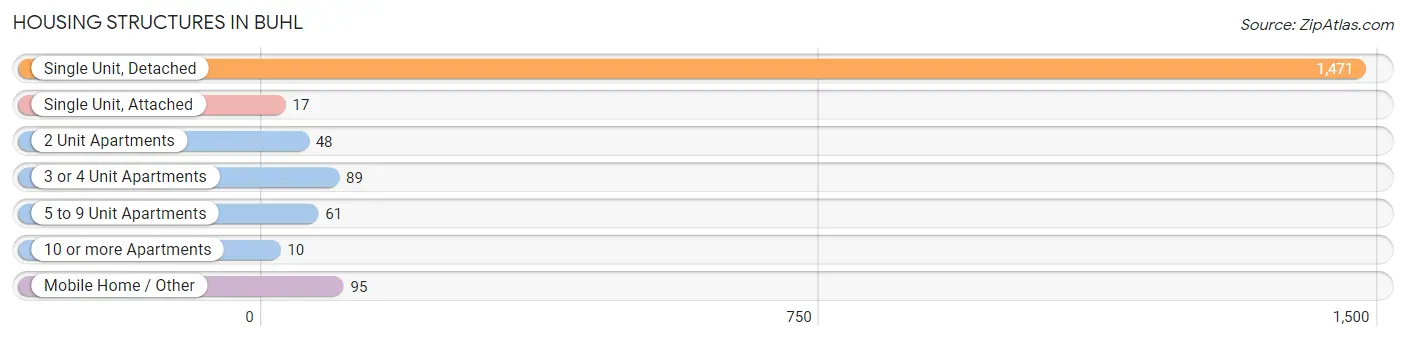
| Structure Type | # Housing Units | % Housing Units |
| Single Unit, Detached | 1,471 | 82.1% |
| Single Unit, Attached | 17 | 0.9% |
| 2 Unit Apartments | 48 | 2.7% |
| 3 or 4 Unit Apartments | 89 | 5.0% |
| 5 to 9 Unit Apartments | 61 | 3.4% |
| 10 or more Apartments | 10 | 0.6% |
| Mobile Home / Other | 95 | 5.3% |
| Total | 1,791 | 100.0% |
Housing Structures by Occupancy in Buhl
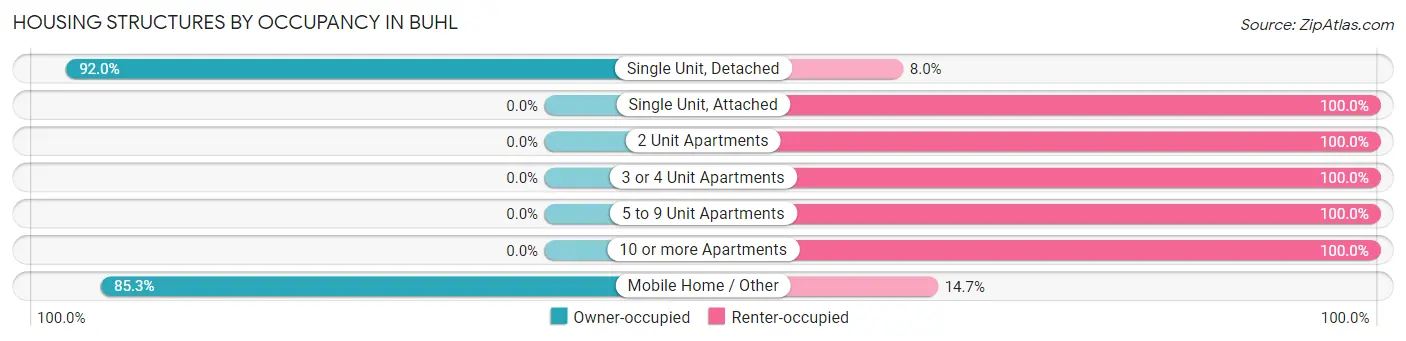
| Structure Type | Owner-occupied | Renter-occupied |
| Single Unit, Detached | 1,353 (92.0%) | 118 (8.0%) |
| Single Unit, Attached | 0 (0.0%) | 17 (100.0%) |
| 2 Unit Apartments | 0 (0.0%) | 48 (100.0%) |
| 3 or 4 Unit Apartments | 0 (0.0%) | 89 (100.0%) |
| 5 to 9 Unit Apartments | 0 (0.0%) | 61 (100.0%) |
| 10 or more Apartments | 0 (0.0%) | 10 (100.0%) |
| Mobile Home / Other | 81 (85.3%) | 14 (14.7%) |
| Total | 1,434 (80.1%) | 357 (19.9%) |
Housing Structures by Number of Rooms in Buhl
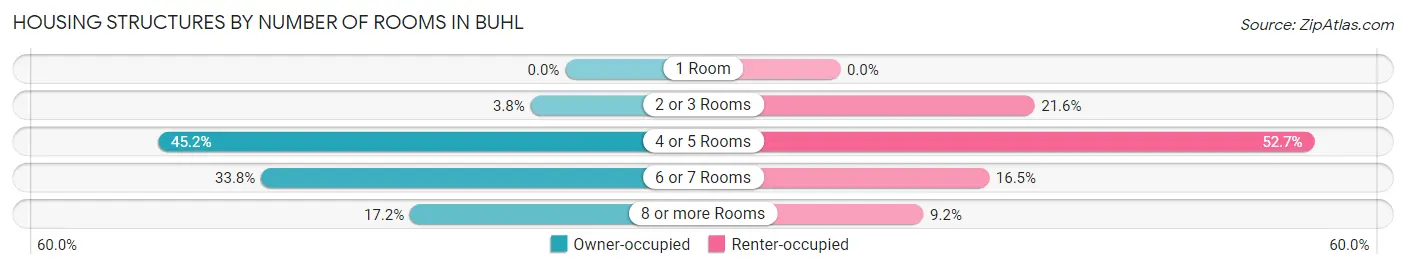
| Number of Rooms | Owner-occupied | Renter-occupied |
| 1 Room | 0 (0.0%) | 0 (0.0%) |
| 2 or 3 Rooms | 55 (3.8%) | 77 (21.6%) |
| 4 or 5 Rooms | 648 (45.2%) | 188 (52.7%) |
| 6 or 7 Rooms | 484 (33.8%) | 59 (16.5%) |
| 8 or more Rooms | 247 (17.2%) | 33 (9.2%) |
| Total | 1,434 (100.0%) | 357 (100.0%) |
Housing Structure by Heating Type in Buhl
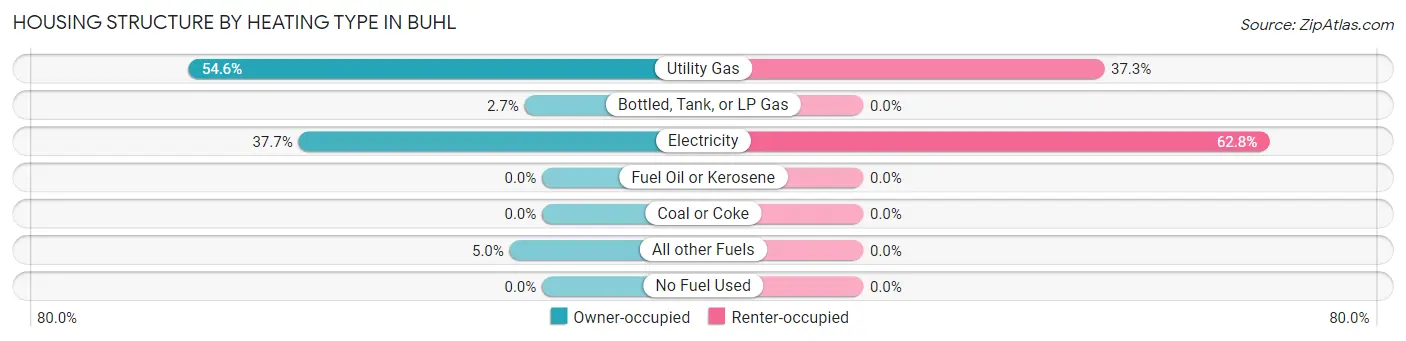
| Heating Type | Owner-occupied | Renter-occupied |
| Utility Gas | 783 (54.6%) | 133 (37.2%) |
| Bottled, Tank, or LP Gas | 39 (2.7%) | 0 (0.0%) |
| Electricity | 540 (37.7%) | 224 (62.7%) |
| Fuel Oil or Kerosene | 0 (0.0%) | 0 (0.0%) |
| Coal or Coke | 0 (0.0%) | 0 (0.0%) |
| All other Fuels | 72 (5.0%) | 0 (0.0%) |
| No Fuel Used | 0 (0.0%) | 0 (0.0%) |
| Total | 1,434 (100.0%) | 357 (100.0%) |
Household Vehicle Usage in Buhl
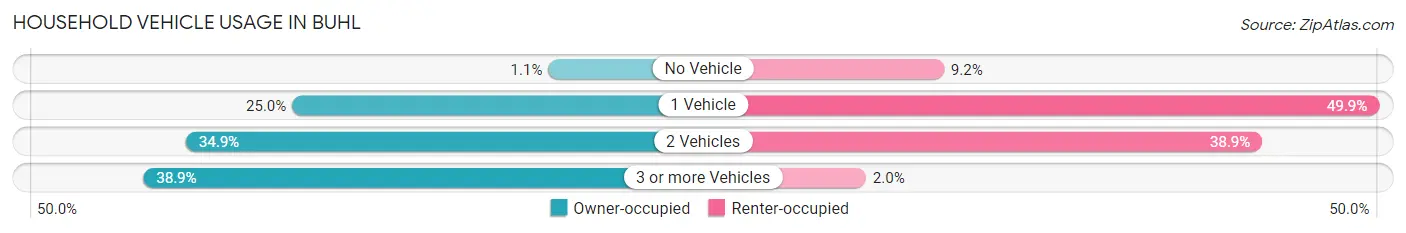
| Vehicles per Household | Owner-occupied | Renter-occupied |
| No Vehicle | 16 (1.1%) | 33 (9.2%) |
| 1 Vehicle | 359 (25.0%) | 178 (49.9%) |
| 2 Vehicles | 501 (34.9%) | 139 (38.9%) |
| 3 or more Vehicles | 558 (38.9%) | 7 (2.0%) |
| Total | 1,434 (100.0%) | 357 (100.0%) |
Real Estate & Mortgages in Buhl
Real Estate and Mortgage Overview in Buhl
| Characteristic | Without Mortgage | With Mortgage |
| Housing Units | 479 | 955 |
| Median Property Value | $148,800 | $193,500 |
| Median Household Income | $40,625 | $46 |
| Monthly Housing Costs | $467 | $0 |
| Real Estate Taxes | $1,329 | $38 |
Property Value by Mortgage Status in Buhl
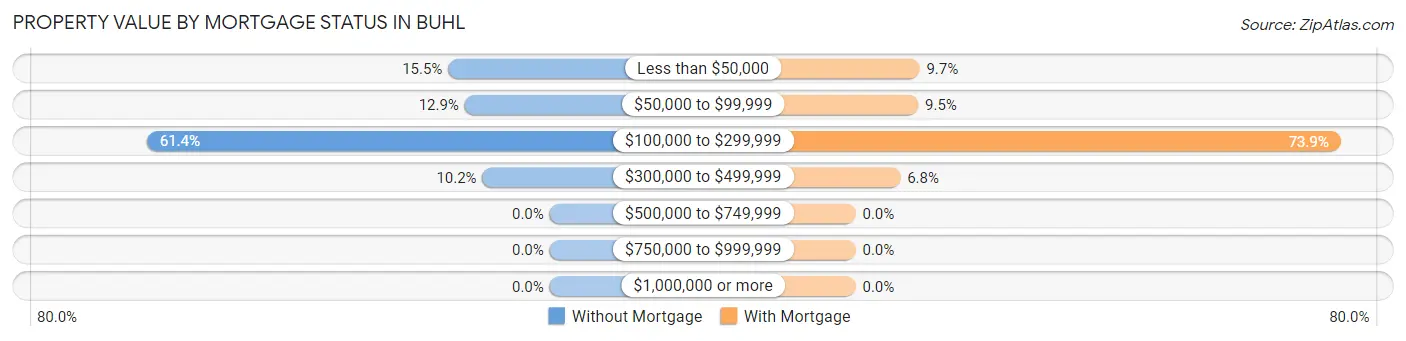
| Property Value | Without Mortgage | With Mortgage |
| Less than $50,000 | 74 (15.4%) | 93 (9.7%) |
| $50,000 to $99,999 | 62 (12.9%) | 91 (9.5%) |
| $100,000 to $299,999 | 294 (61.4%) | 706 (73.9%) |
| $300,000 to $499,999 | 49 (10.2%) | 65 (6.8%) |
| $500,000 to $749,999 | 0 (0.0%) | 0 (0.0%) |
| $750,000 to $999,999 | 0 (0.0%) | 0 (0.0%) |
| $1,000,000 or more | 0 (0.0%) | 0 (0.0%) |
| Total | 479 (100.0%) | 955 (100.0%) |
Household Income by Mortgage Status in Buhl
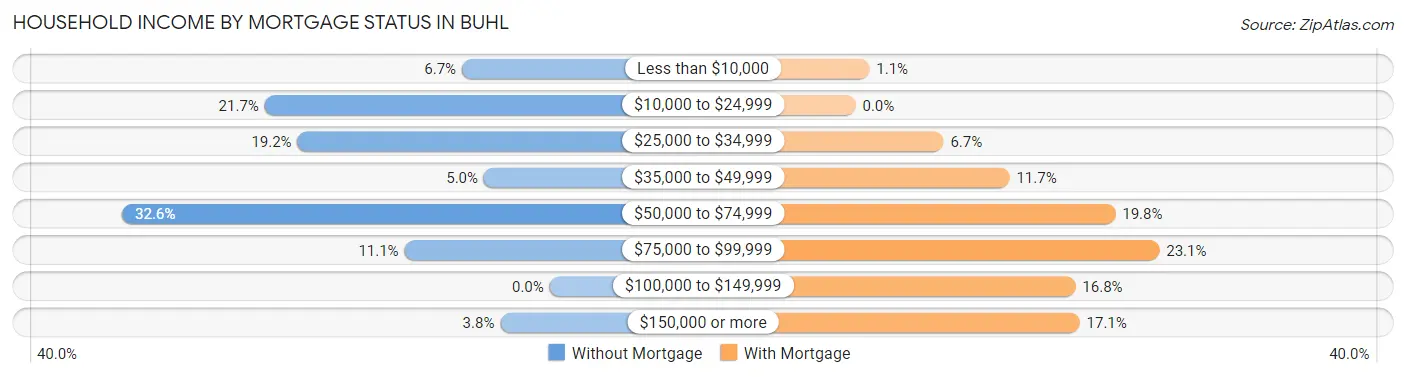
| Household Income | Without Mortgage | With Mortgage |
| Less than $10,000 | 32 (6.7%) | 10 (1.1%) |
| $10,000 to $24,999 | 104 (21.7%) | 0 (0.0%) |
| $25,000 to $34,999 | 92 (19.2%) | 64 (6.7%) |
| $35,000 to $49,999 | 24 (5.0%) | 112 (11.7%) |
| $50,000 to $74,999 | 156 (32.6%) | 189 (19.8%) |
| $75,000 to $99,999 | 53 (11.1%) | 221 (23.1%) |
| $100,000 to $149,999 | 0 (0.0%) | 160 (16.8%) |
| $150,000 or more | 18 (3.8%) | 163 (17.1%) |
| Total | 479 (100.0%) | 955 (100.0%) |
Property Value to Household Income Ratio in Buhl
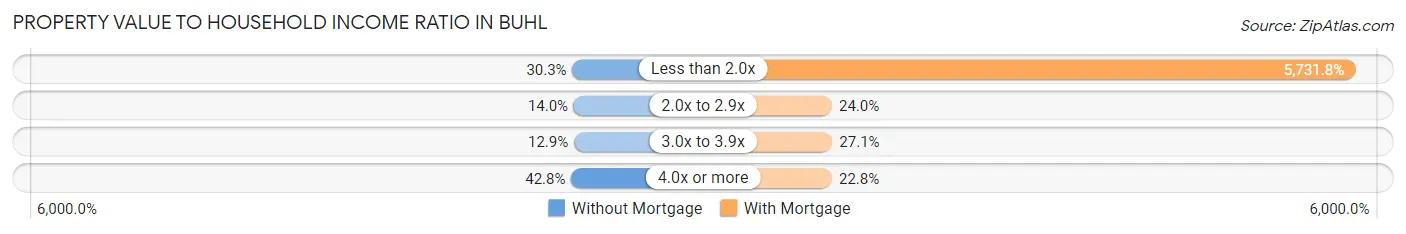
| Value-to-Income Ratio | Without Mortgage | With Mortgage |
| Less than 2.0x | 145 (30.3%) | 54,739 (5,731.8%) |
| 2.0x to 2.9x | 67 (14.0%) | 229 (24.0%) |
| 3.0x to 3.9x | 62 (12.9%) | 259 (27.1%) |
| 4.0x or more | 205 (42.8%) | 218 (22.8%) |
| Total | 479 (100.0%) | 955 (100.0%) |
Real Estate Taxes by Mortgage Status in Buhl
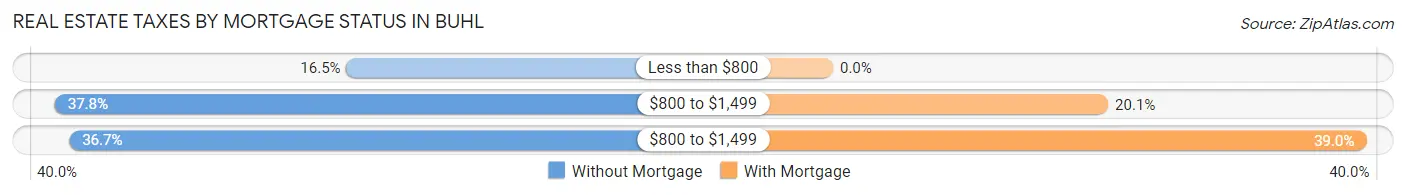
| Property Taxes | Without Mortgage | With Mortgage |
| Less than $800 | 79 (16.5%) | 0 (0.0%) |
| $800 to $1,499 | 181 (37.8%) | 192 (20.1%) |
| $800 to $1,499 | 176 (36.7%) | 372 (39.0%) |
| Total | 479 (100.0%) | 955 (100.0%) |
Health & Disability in Buhl
Health Insurance Coverage by Age in Buhl
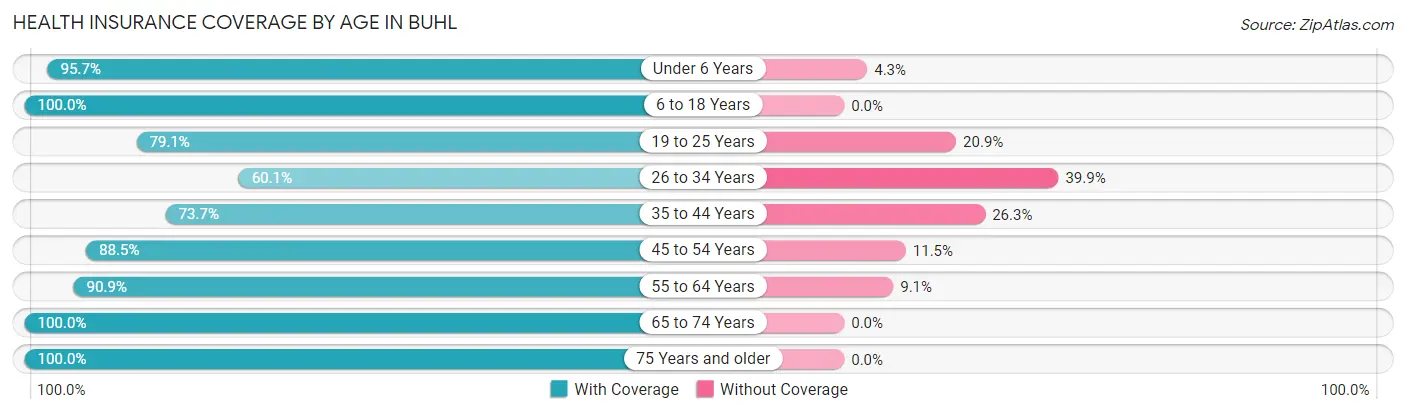
| Age Bracket | With Coverage | Without Coverage |
| Under 6 Years | 290 (95.7%) | 13 (4.3%) |
| 6 to 18 Years | 1,042 (100.0%) | 0 (0.0%) |
| 19 to 25 Years | 277 (79.1%) | 73 (20.9%) |
| 26 to 34 Years | 394 (60.1%) | 262 (39.9%) |
| 35 to 44 Years | 289 (73.7%) | 103 (26.3%) |
| 45 to 54 Years | 432 (88.5%) | 56 (11.5%) |
| 55 to 64 Years | 507 (90.9%) | 51 (9.1%) |
| 65 to 74 Years | 399 (100.0%) | 0 (0.0%) |
| 75 Years and older | 318 (100.0%) | 0 (0.0%) |
| Total | 3,948 (87.6%) | 558 (12.4%) |
Health Insurance Coverage by Citizenship Status in Buhl
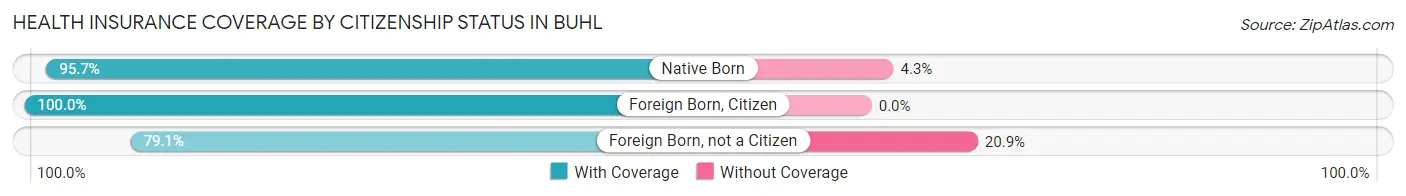
| Citizenship Status | With Coverage | Without Coverage |
| Native Born | 290 (95.7%) | 13 (4.3%) |
| Foreign Born, Citizen | 1,042 (100.0%) | 0 (0.0%) |
| Foreign Born, not a Citizen | 277 (79.1%) | 73 (20.9%) |
Health Insurance Coverage by Household Income in Buhl
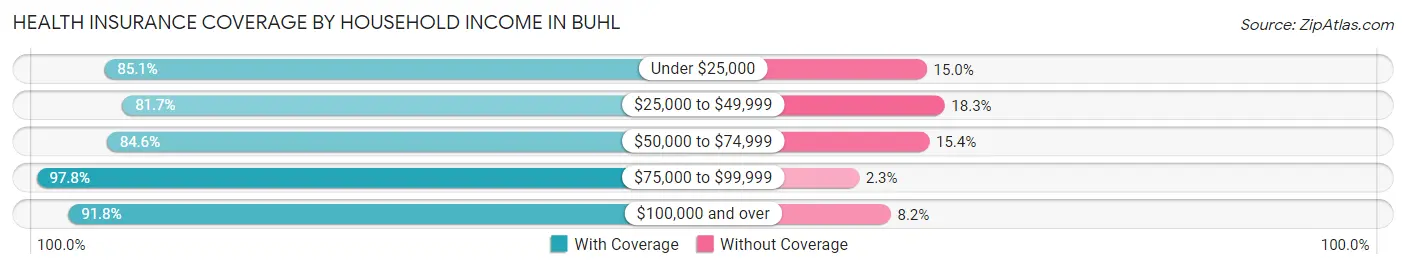
| Household Income | With Coverage | Without Coverage |
| Under $25,000 | 364 (85.1%) | 64 (14.9%) |
| $25,000 to $49,999 | 1,023 (81.7%) | 229 (18.3%) |
| $50,000 to $74,999 | 917 (84.6%) | 167 (15.4%) |
| $75,000 to $99,999 | 737 (97.8%) | 17 (2.2%) |
| $100,000 and over | 907 (91.8%) | 81 (8.2%) |
Public vs Private Health Insurance Coverage by Age in Buhl
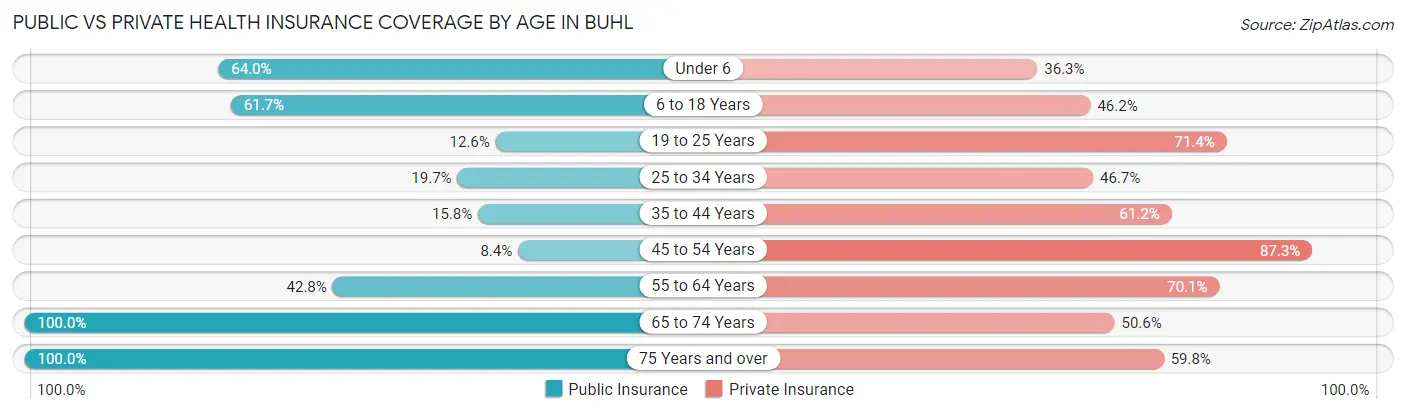
| Age Bracket | Public Insurance | Private Insurance |
| Under 6 | 194 (64.0%) | 110 (36.3%) |
| 6 to 18 Years | 643 (61.7%) | 481 (46.2%) |
| 19 to 25 Years | 44 (12.6%) | 250 (71.4%) |
| 25 to 34 Years | 129 (19.7%) | 306 (46.7%) |
| 35 to 44 Years | 62 (15.8%) | 240 (61.2%) |
| 45 to 54 Years | 41 (8.4%) | 426 (87.3%) |
| 55 to 64 Years | 239 (42.8%) | 391 (70.1%) |
| 65 to 74 Years | 399 (100.0%) | 202 (50.6%) |
| 75 Years and over | 318 (100.0%) | 190 (59.8%) |
| Total | 2,069 (45.9%) | 2,596 (57.6%) |
Disability Status by Sex by Age in Buhl
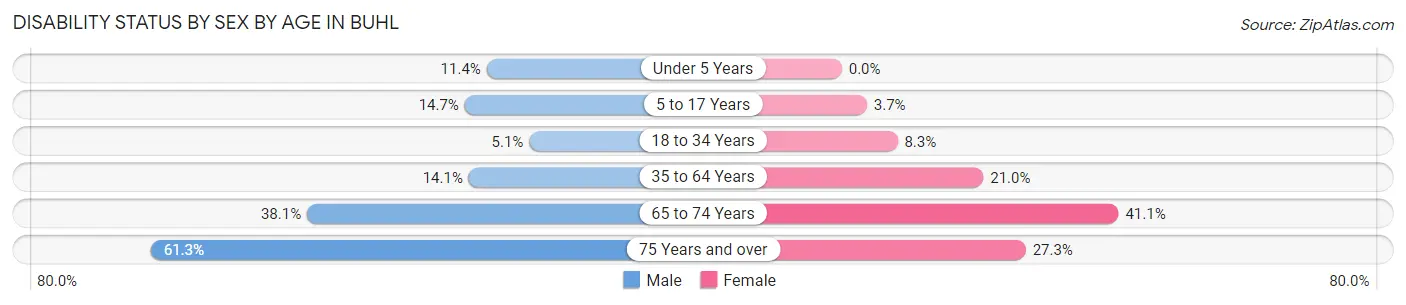
| Age Bracket | Male | Female |
| Under 5 Years | 9 (11.4%) | 0 (0.0%) |
| 5 to 17 Years | 74 (14.6%) | 21 (3.7%) |
| 18 to 34 Years | 27 (5.1%) | 44 (8.3%) |
| 35 to 64 Years | 85 (14.1%) | 175 (21.0%) |
| 65 to 74 Years | 75 (38.1%) | 83 (41.1%) |
| 75 Years and over | 49 (61.3%) | 65 (27.3%) |
Disability Class by Sex by Age in Buhl
Disability Class: Hearing Difficulty
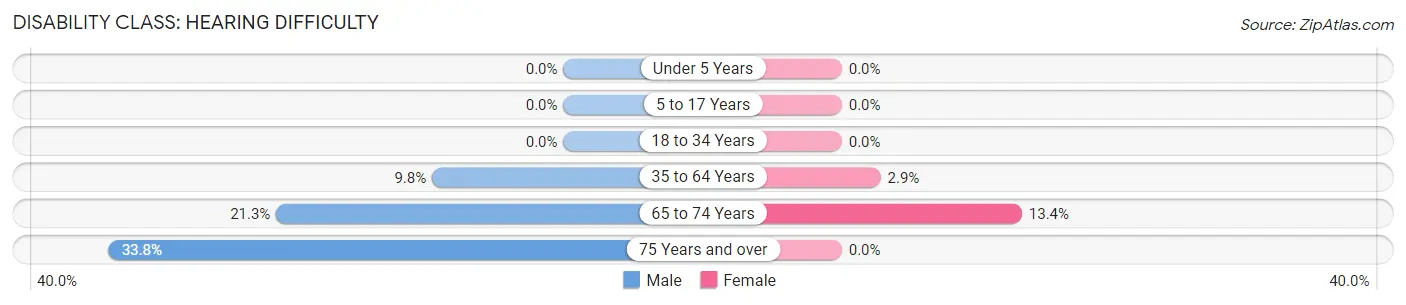
| Age Bracket | Male | Female |
| Under 5 Years | 0 (0.0%) | 0 (0.0%) |
| 5 to 17 Years | 0 (0.0%) | 0 (0.0%) |
| 18 to 34 Years | 0 (0.0%) | 0 (0.0%) |
| 35 to 64 Years | 59 (9.8%) | 24 (2.9%) |
| 65 to 74 Years | 42 (21.3%) | 27 (13.4%) |
| 75 Years and over | 27 (33.8%) | 0 (0.0%) |
Disability Class: Vision Difficulty
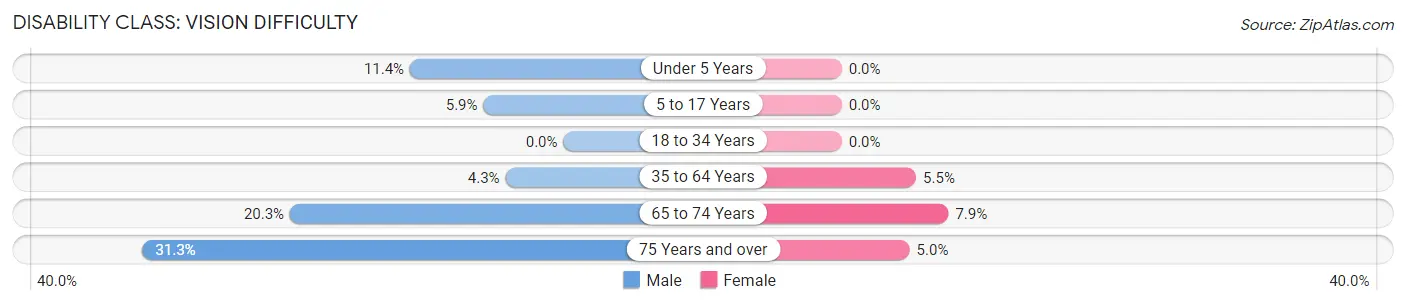
| Age Bracket | Male | Female |
| Under 5 Years | 9 (11.4%) | 0 (0.0%) |
| 5 to 17 Years | 30 (5.9%) | 0 (0.0%) |
| 18 to 34 Years | 0 (0.0%) | 0 (0.0%) |
| 35 to 64 Years | 26 (4.3%) | 46 (5.5%) |
| 65 to 74 Years | 40 (20.3%) | 16 (7.9%) |
| 75 Years and over | 25 (31.2%) | 12 (5.0%) |
Disability Class: Cognitive Difficulty
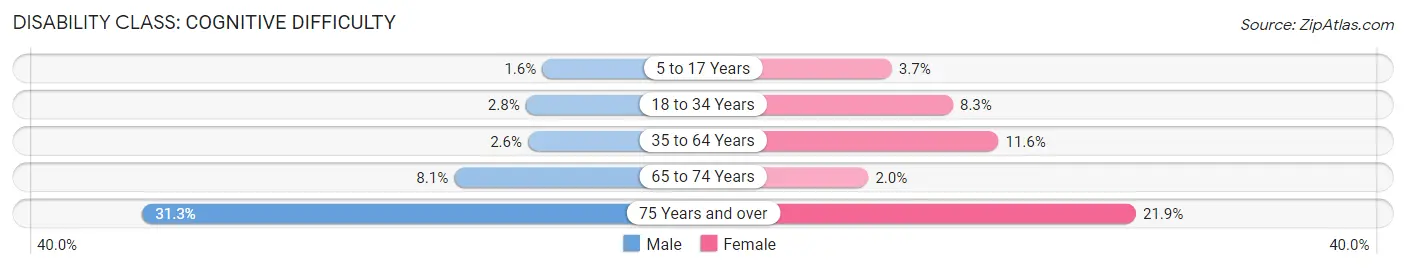
| Age Bracket | Male | Female |
| 5 to 17 Years | 8 (1.6%) | 21 (3.7%) |
| 18 to 34 Years | 15 (2.8%) | 44 (8.3%) |
| 35 to 64 Years | 16 (2.6%) | 97 (11.6%) |
| 65 to 74 Years | 16 (8.1%) | 4 (2.0%) |
| 75 Years and over | 25 (31.2%) | 52 (21.8%) |
Disability Class: Ambulatory Difficulty
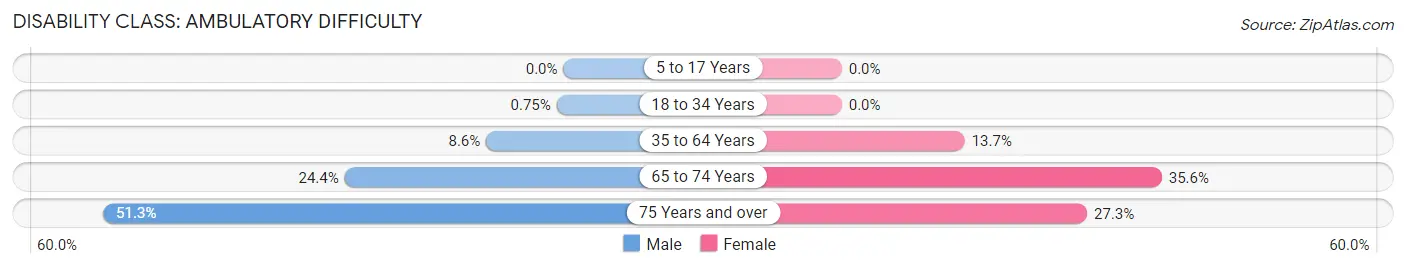
| Age Bracket | Male | Female |
| 5 to 17 Years | 0 (0.0%) | 0 (0.0%) |
| 18 to 34 Years | 4 (0.7%) | 0 (0.0%) |
| 35 to 64 Years | 52 (8.6%) | 114 (13.7%) |
| 65 to 74 Years | 48 (24.4%) | 72 (35.6%) |
| 75 Years and over | 41 (51.2%) | 65 (27.3%) |
Disability Class: Self-Care Difficulty
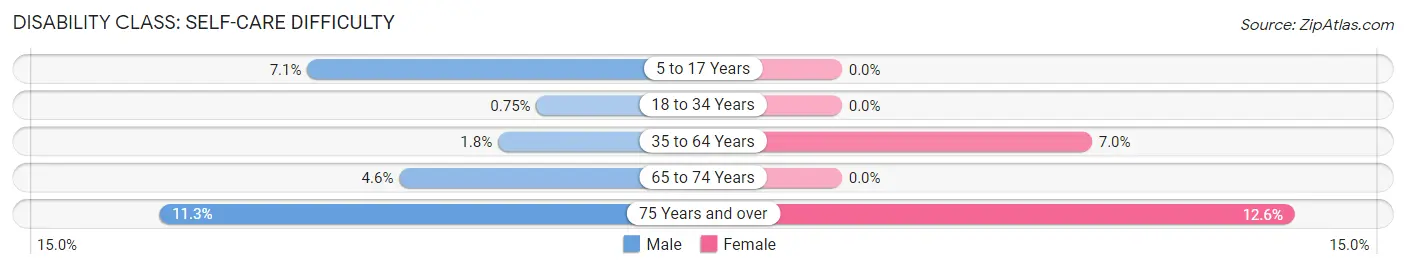
| Age Bracket | Male | Female |
| 5 to 17 Years | 36 (7.1%) | 0 (0.0%) |
| 18 to 34 Years | 4 (0.7%) | 0 (0.0%) |
| 35 to 64 Years | 11 (1.8%) | 58 (7.0%) |
| 65 to 74 Years | 9 (4.6%) | 0 (0.0%) |
| 75 Years and over | 9 (11.3%) | 30 (12.6%) |
Technology Access in Buhl
Computing Device Access in Buhl
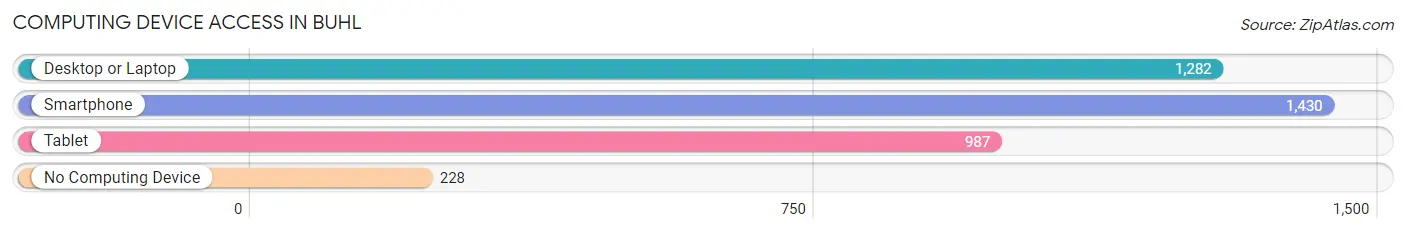
| Device Type | # Households | % Households |
| Desktop or Laptop | 1,282 | 71.6% |
| Smartphone | 1,430 | 79.8% |
| Tablet | 987 | 55.1% |
| No Computing Device | 228 | 12.7% |
| Total | 1,791 | 100.0% |
Internet Access in Buhl
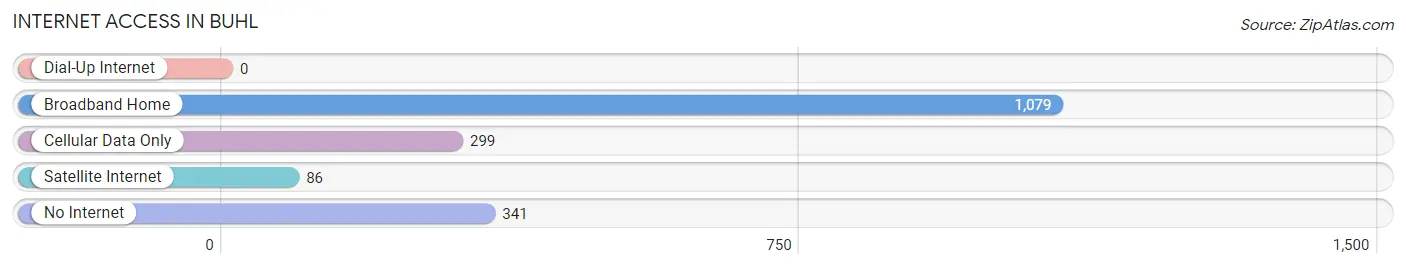
| Internet Type | # Households | % Households |
| Dial-Up Internet | 0 | 0.0% |
| Broadband Home | 1,079 | 60.3% |
| Cellular Data Only | 299 | 16.7% |
| Satellite Internet | 86 | 4.8% |
| No Internet | 341 | 19.0% |
| Total | 1,791 | 100.0% |
Buhl Summary
Buhl, Idaho is a small city located in the south-central part of the state, in Twin Falls County. It is situated along the Snake River, and is surrounded by the Snake River Plain. The city has a population of 5,105, according to the 2010 census.
History
The area that is now Buhl was first settled in the late 1800s by Mormon pioneers. The city was officially incorporated in 1907, and was named after a local rancher, John Buhl. The city was originally a farming and ranching community, and the economy was largely based on agriculture.
In the early 1900s, the city began to grow and develop. The first bank was established in 1910, and the first school was built in 1911. The city also had a post office, a hotel, and a newspaper.
In the 1920s, the city began to experience a period of growth and prosperity. The population increased from 1,000 to 2,000, and the economy shifted from agriculture to manufacturing. The city was home to several factories, including a sugar beet processing plant, a cannery, and a flour mill.
In the 1950s, the city experienced a period of decline. The factories closed, and the population decreased. The city was also affected by the construction of the nearby Minidoka Dam, which flooded much of the surrounding farmland.
Geography
Buhl is located in the south-central part of Idaho, in Twin Falls County. It is situated along the Snake River, and is surrounded by the Snake River Plain. The city has a total area of 4.2 square miles, all of which is land.
The city has a semi-arid climate, with hot summers and cold winters. The average annual temperature is 50°F, and the average annual precipitation is 11.5 inches.
Economy
The economy of Buhl is largely based on agriculture and manufacturing. The city is home to several factories, including a sugar beet processing plant, a cannery, and a flour mill. The city also has a number of retail stores, restaurants, and other businesses.
The city is also home to several educational institutions, including Buhl High School, Buhl Junior High School, and Buhl Elementary School.
Demographics
According to the 2010 census, the population of Buhl was 5,105. The racial makeup of the city was 90.3% White, 0.7% African American, 0.7% Native American, 0.3% Asian, 0.1% Pacific Islander, 5.3% from other races, and 2.6% from two or more races. Hispanic or Latino of any race were 11.2% of the population.
The median household income in Buhl was $37,917, and the median family income was $45,938. The per capita income was $17,945. About 14.2% of the population was below the poverty line.
Common Questions
What is Per Capita Income in Buhl?
Per Capita income in Buhl is $24,073.
What is the Median Family Income in Buhl?
Median Family Income in Buhl is $62,879.
What is the Median Household income in Buhl?
Median Household Income in Buhl is $51,307.
What is Income or Wage Gap in Buhl?
Income or Wage Gap in Buhl is 43.2%.
Women in Buhl earn 56.8 cents for every dollar earned by a man.
What is Inequality or Gini Index in Buhl?
Inequality or Gini Index in Buhl is 0.39.
What is the Total Population of Buhl?
Total Population of Buhl is 4,577.
What is the Total Male Population of Buhl?
Total Male Population of Buhl is 2,027.
What is the Total Female Population of Buhl?
Total Female Population of Buhl is 2,550.
What is the Ratio of Males per 100 Females in Buhl?
There are 79.49 Males per 100 Females in Buhl.
What is the Ratio of Females per 100 Males in Buhl?
There are 125.80 Females per 100 Males in Buhl.
What is the Median Population Age in Buhl?
Median Population Age in Buhl is 34.4 Years.
What is the Average Family Size in Buhl
Average Family Size in Buhl is 3.2 People.
What is the Average Household Size in Buhl
Average Household Size in Buhl is 2.5 People.
How Large is the Labor Force in Buhl?
There are 2,152 People in the Labor Forcein in Buhl.
What is the Percentage of People in the Labor Force in Buhl?
62.8% of People are in the Labor Force in Buhl.
What is the Unemployment Rate in Buhl?
Unemployment Rate in Buhl is 4.0%.