Sleepy Hollow, IL Map & Demographics
Sleepy Hollow Map
Sleepy Hollow Overview
$66,393
PER CAPITA INCOME
$149,419
AVG FAMILY INCOME
$139,955
AVG HOUSEHOLD INCOME
31.2%
WAGE / INCOME GAP [ % ]
68.8¢/ $1
WAGE / INCOME GAP [ $ ]
0.46
INEQUALITY / GINI INDEX
3,205
TOTAL POPULATION
1,569
MALE POPULATION
1,636
FEMALE POPULATION
95.90
MALES / 100 FEMALES
104.27
FEMALES / 100 MALES
48.4
MEDIAN AGE
3.1
AVG FAMILY SIZE
2.8
AVG HOUSEHOLD SIZE
1,856
LABOR FORCE [ PEOPLE ]
67.1%
PERCENT IN LABOR FORCE
1.9%
UNEMPLOYMENT RATE
Income in Sleepy Hollow
Income Overview in Sleepy Hollow
Per Capita Income in Sleepy Hollow is $66,393, while median incomes of families and households are $149,419 and $139,955 respectively.
| Characteristic | Number | Measure |
| Per Capita Income | 3,205 | $66,393 |
| Median Family Income | 884 | $149,419 |
| Mean Family Income | 884 | $205,901 |
| Median Household Income | 1,142 | $139,955 |
| Mean Household Income | 1,142 | $185,141 |
| Income Deficit | 884 | $0 |
| Wage / Income Gap (%) | 3,205 | 31.18% |
| Wage / Income Gap ($) | 3,205 | 68.82¢ per $1 |
| Gini / Inequality Index | 3,205 | 0.46 |
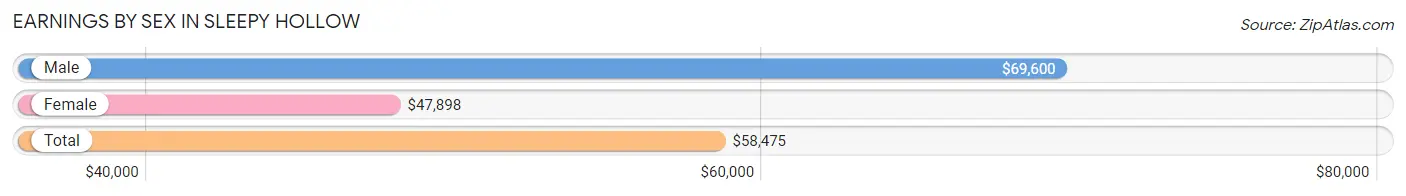
Earnings by Sex in Sleepy Hollow
Average Earnings in Sleepy Hollow are $58,475, $69,600 for men and $47,898 for women, a difference of 31.2%.
| Sex | Number | Average Earnings |
| Male | 1,084 (55.8%) | $69,600 |
| Female | 858 (44.2%) | $47,898 |
| Total | 1,942 (100.0%) | $58,475 |
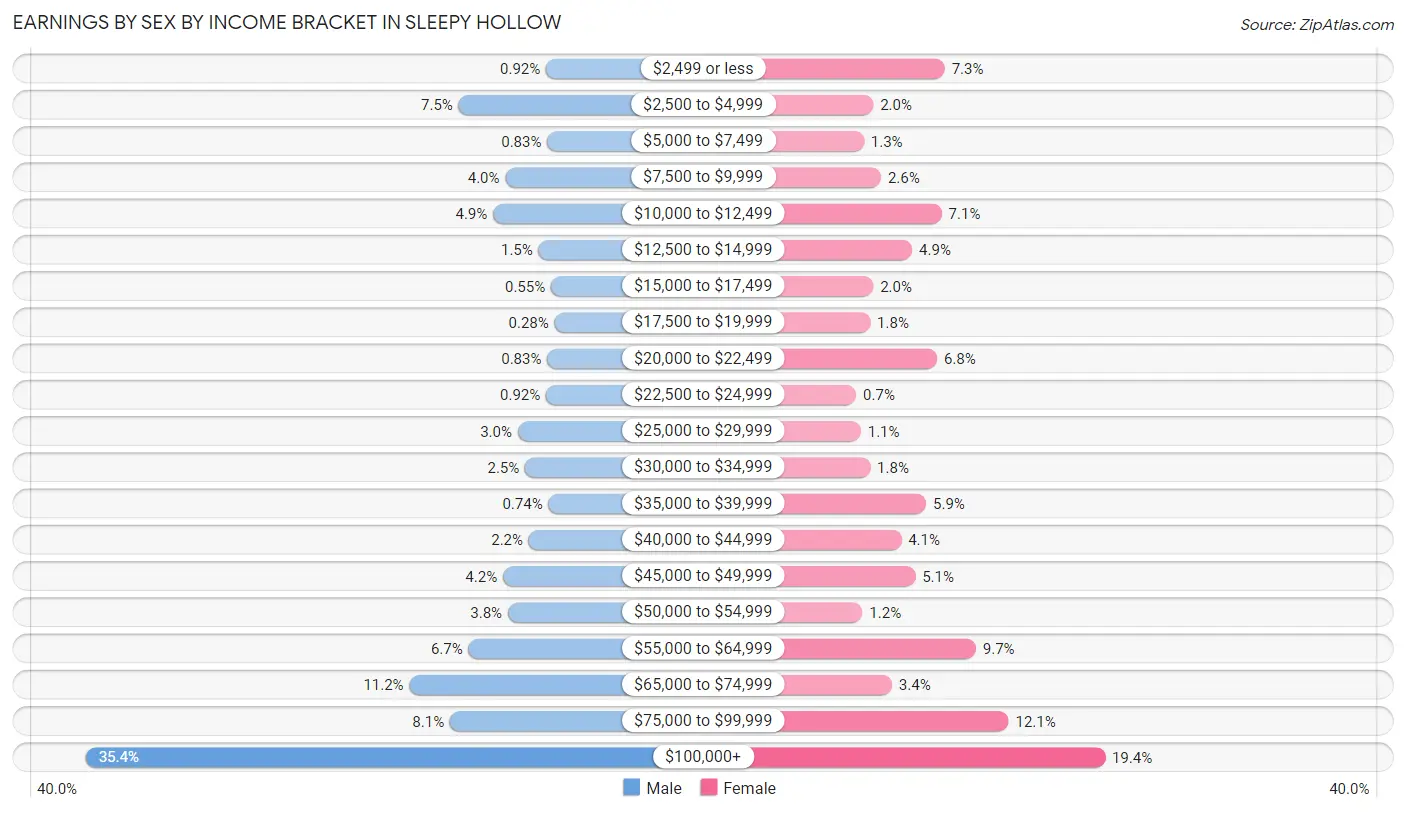
Earnings by Sex by Income Bracket in Sleepy Hollow
The most common earnings brackets in Sleepy Hollow are $100,000+ for men (384 | 35.4%) and $100,000+ for women (166 | 19.4%).
| Income | Male | Female |
| $2,499 or less | 10 (0.9%) | 63 (7.3%) |
| $2,500 to $4,999 | 81 (7.5%) | 17 (2.0%) |
| $5,000 to $7,499 | 9 (0.8%) | 11 (1.3%) |
| $7,500 to $9,999 | 43 (4.0%) | 22 (2.6%) |
| $10,000 to $12,499 | 53 (4.9%) | 61 (7.1%) |
| $12,500 to $14,999 | 16 (1.5%) | 42 (4.9%) |
| $15,000 to $17,499 | 6 (0.5%) | 17 (2.0%) |
| $17,500 to $19,999 | 3 (0.3%) | 15 (1.8%) |
| $20,000 to $22,499 | 9 (0.8%) | 58 (6.8%) |
| $22,500 to $24,999 | 10 (0.9%) | 6 (0.7%) |
| $25,000 to $29,999 | 33 (3.0%) | 9 (1.1%) |
| $30,000 to $34,999 | 27 (2.5%) | 15 (1.8%) |
| $35,000 to $39,999 | 8 (0.7%) | 51 (5.9%) |
| $40,000 to $44,999 | 24 (2.2%) | 35 (4.1%) |
| $45,000 to $49,999 | 45 (4.2%) | 44 (5.1%) |
| $50,000 to $54,999 | 41 (3.8%) | 10 (1.2%) |
| $55,000 to $64,999 | 73 (6.7%) | 83 (9.7%) |
| $65,000 to $74,999 | 121 (11.2%) | 29 (3.4%) |
| $75,000 to $99,999 | 88 (8.1%) | 104 (12.1%) |
| $100,000+ | 384 (35.4%) | 166 (19.4%) |
| Total | 1,084 (100.0%) | 858 (100.0%) |
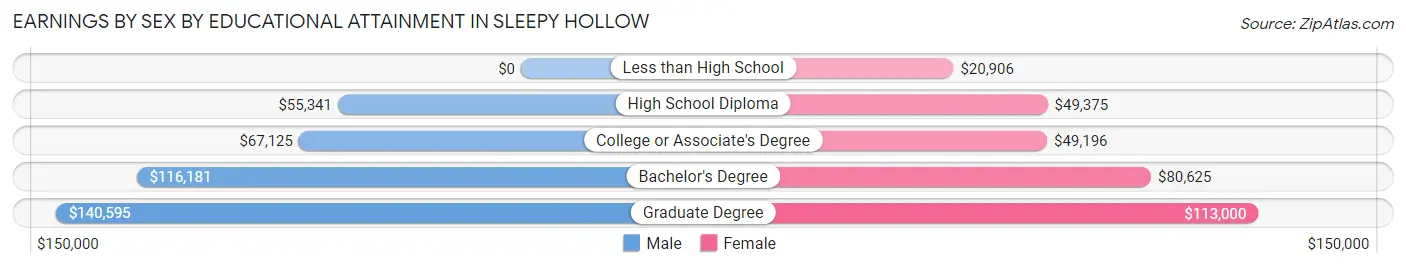
Earnings by Sex by Educational Attainment in Sleepy Hollow
Average earnings in Sleepy Hollow are $74,775 for men and $58,056 for women, a difference of 22.4%. Men with an educational attainment of graduate degree enjoy the highest average annual earnings of $140,595, while those with high school diploma education earn the least with $55,341. Women with an educational attainment of graduate degree earn the most with the average annual earnings of $113,000, while those with less than high school education have the smallest earnings of $20,906.
| Educational Attainment | Male Income | Female Income |
| Less than High School | - | - |
| High School Diploma | $55,341 | $49,375 |
| College or Associate's Degree | $67,125 | $49,196 |
| Bachelor's Degree | $116,181 | $80,625 |
| Graduate Degree | $140,595 | $113,000 |
| Total | $74,775 | $58,056 |
Family Income in Sleepy Hollow
Family Income Brackets in Sleepy Hollow
According to the Sleepy Hollow family income data, there are 293 families falling into the $200,000+ income range, which is the most common income bracket and makes up 33.1% of all families. Conversely, the $15,000 to $24,999 income bracket is the least frequent group with only 4 families (0.4%) belonging to this category.
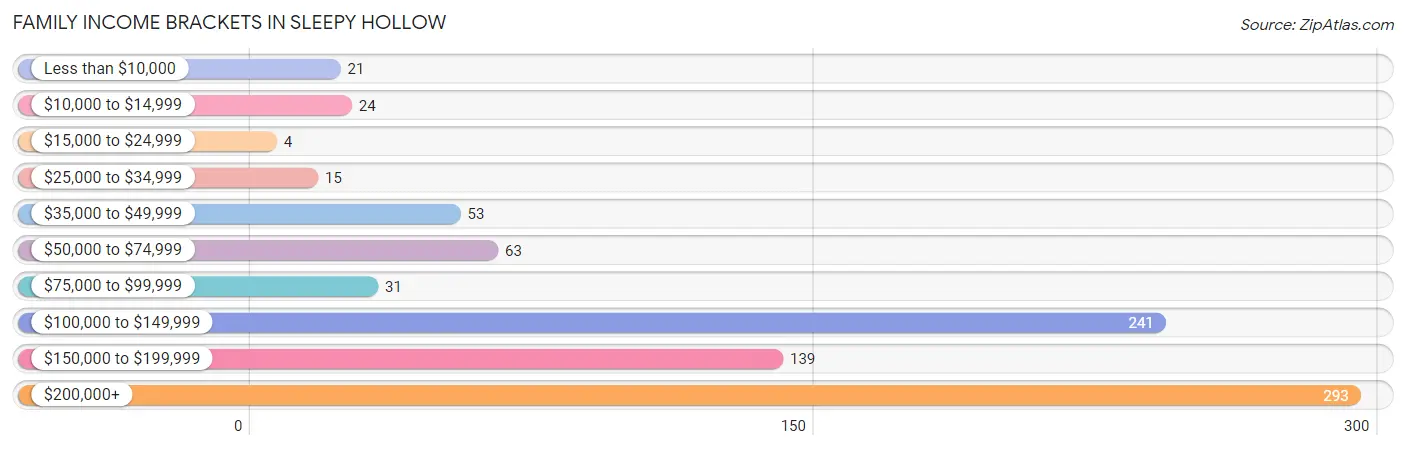
| Income Bracket | # Families | % Families |
| Less than $10,000 | 21 | 2.4% |
| $10,000 to $14,999 | 24 | 2.7% |
| $15,000 to $24,999 | 4 | 0.5% |
| $25,000 to $34,999 | 15 | 1.7% |
| $35,000 to $49,999 | 53 | 6.0% |
| $50,000 to $74,999 | 63 | 7.1% |
| $75,000 to $99,999 | 31 | 3.5% |
| $100,000 to $149,999 | 241 | 27.3% |
| $150,000 to $199,999 | 139 | 15.7% |
| $200,000+ | 293 | 33.1% |
Family Income by Famaliy Size in Sleepy Hollow
4-person families (142 | 16.1%) account for the highest median family income in Sleepy Hollow with $166,250 per family, while 2-person families (395 | 44.7%) have the highest median income of $71,340 per family member.
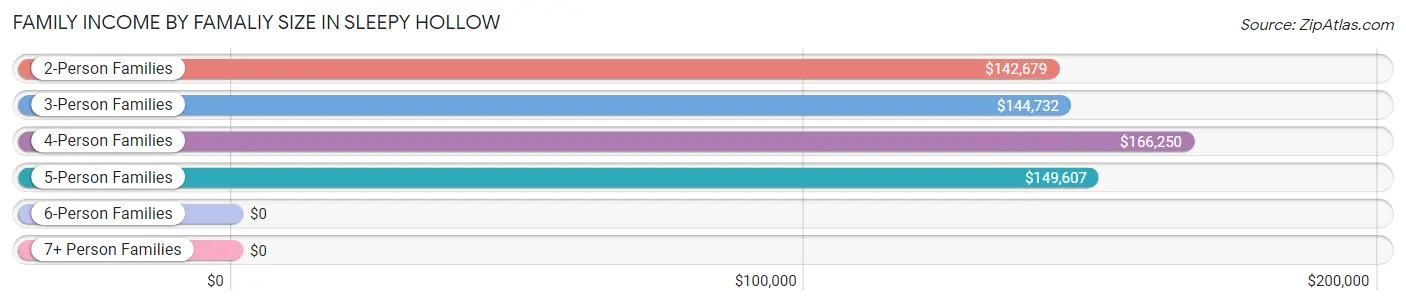
| Income Bracket | # Families | Median Income |
| 2-Person Families | 395 (44.7%) | $142,679 |
| 3-Person Families | 211 (23.9%) | $144,732 |
| 4-Person Families | 142 (16.1%) | $166,250 |
| 5-Person Families | 115 (13.0%) | $149,607 |
| 6-Person Families | 15 (1.7%) | $0 |
| 7+ Person Families | 6 (0.7%) | $0 |
| Total | 884 (100.0%) | $149,419 |
Family Income by Number of Earners in Sleepy Hollow
The median family income in Sleepy Hollow is $149,419, with families comprising 2 earners (425) having the highest median family income of $168,917, while families with no earners (115) have the lowest median family income of $106,750, accounting for 48.1% and 13.0% of families, respectively.
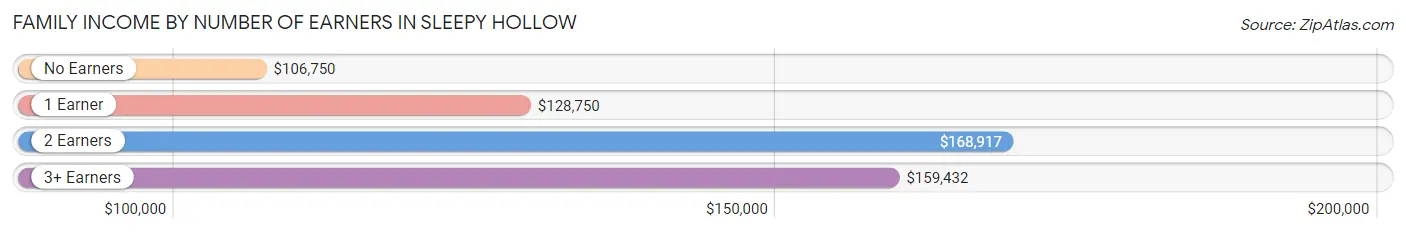
| Number of Earners | # Families | Median Income |
| No Earners | 115 (13.0%) | $106,750 |
| 1 Earner | 147 (16.6%) | $128,750 |
| 2 Earners | 425 (48.1%) | $168,917 |
| 3+ Earners | 197 (22.3%) | $159,432 |
| Total | 884 (100.0%) | $149,419 |
Household Income in Sleepy Hollow
Household Income Brackets in Sleepy Hollow
With 355 households falling in the category, the $200,000+ income range is the most frequent in Sleepy Hollow, accounting for 31.1% of all households. In contrast, only 9 households (0.8%) fall into the $15,000 to $24,999 income bracket, making it the least populous group.
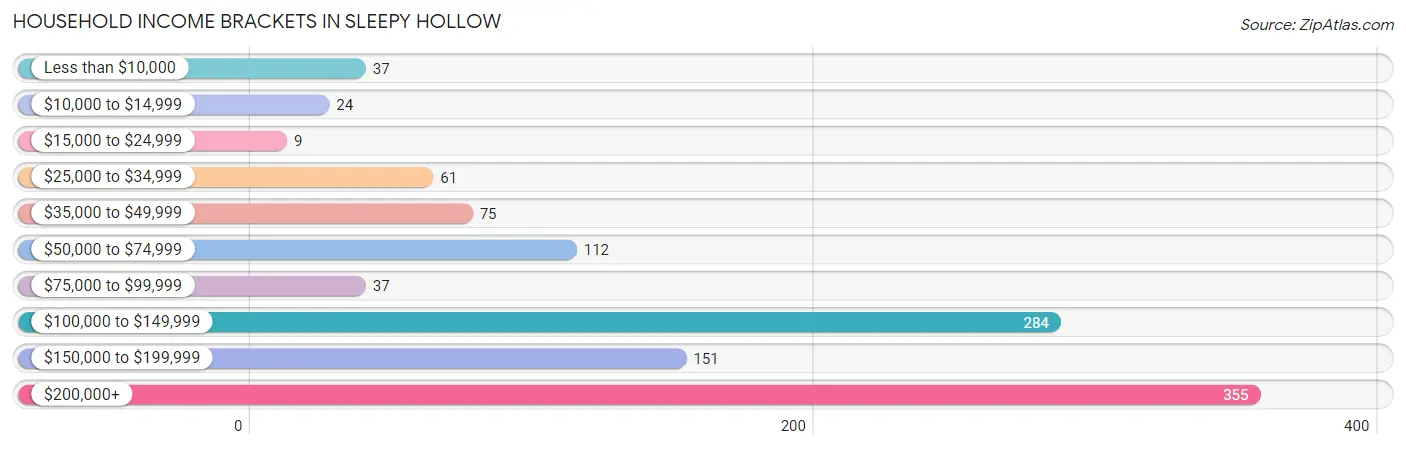
| Income Bracket | # Households | % Households |
| Less than $10,000 | 37 | 3.2% |
| $10,000 to $14,999 | 24 | 2.1% |
| $15,000 to $24,999 | 9 | 0.8% |
| $25,000 to $34,999 | 61 | 5.3% |
| $35,000 to $49,999 | 75 | 6.6% |
| $50,000 to $74,999 | 112 | 9.8% |
| $75,000 to $99,999 | 37 | 3.2% |
| $100,000 to $149,999 | 284 | 24.9% |
| $150,000 to $199,999 | 151 | 13.2% |
| $200,000+ | 355 | 31.1% |
Household Income by Householder Age in Sleepy Hollow
The median household income in Sleepy Hollow is $139,955, with the highest median household income of $146,111 found in the 45 to 64 years age bracket for the primary householder. A total of 576 households (50.4%) fall into this category.
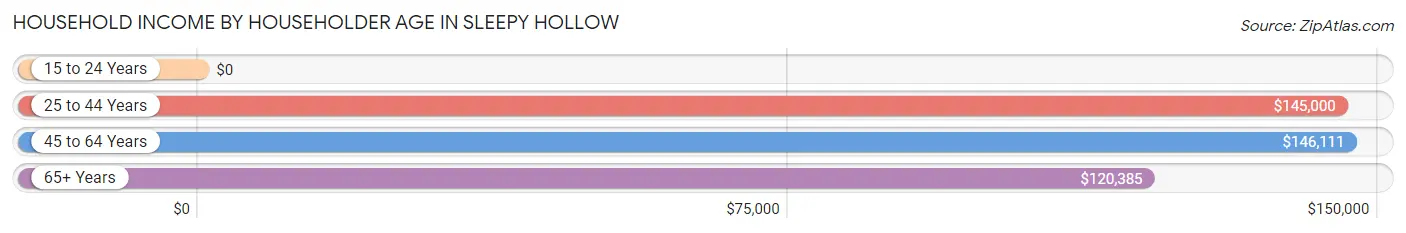
| Income Bracket | # Households | Median Income |
| 15 to 24 Years | 0 (0.0%) | $0 |
| 25 to 44 Years | 218 (19.1%) | $145,000 |
| 45 to 64 Years | 576 (50.4%) | $146,111 |
| 65+ Years | 348 (30.5%) | $120,385 |
| Total | 1,142 (100.0%) | $139,955 |
Poverty in Sleepy Hollow
Income Below Poverty by Sex and Age in Sleepy Hollow
With 5.9% poverty level for males and 4.3% for females among the residents of Sleepy Hollow, 12 to 14 year old males and 16 and 17 year old females are the most vulnerable to poverty, with 13 males (29.5%) and 9 females (14.1%) in their respective age groups living below the poverty level.
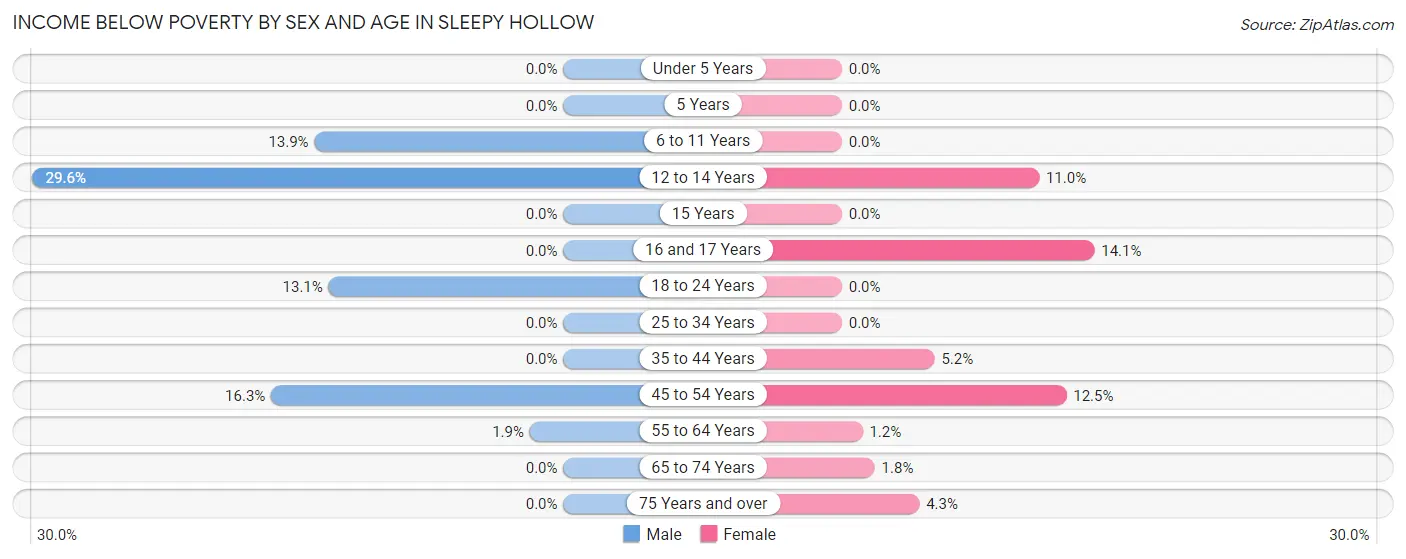
| Age Bracket | Male | Female |
| Under 5 Years | 0 (0.0%) | 0 (0.0%) |
| 5 Years | 0 (0.0%) | 0 (0.0%) |
| 6 to 11 Years | 14 (13.9%) | 0 (0.0%) |
| 12 to 14 Years | 13 (29.5%) | 9 (11.0%) |
| 15 Years | 0 (0.0%) | 0 (0.0%) |
| 16 and 17 Years | 0 (0.0%) | 9 (14.1%) |
| 18 to 24 Years | 20 (13.1%) | 0 (0.0%) |
| 25 to 34 Years | 0 (0.0%) | 0 (0.0%) |
| 35 to 44 Years | 0 (0.0%) | 8 (5.2%) |
| 45 to 54 Years | 41 (16.3%) | 31 (12.5%) |
| 55 to 64 Years | 5 (1.9%) | 4 (1.1%) |
| 65 to 74 Years | 0 (0.0%) | 4 (1.8%) |
| 75 Years and over | 0 (0.0%) | 5 (4.3%) |
| Total | 93 (5.9%) | 70 (4.3%) |
Income Above Poverty by Sex and Age in Sleepy Hollow
According to the poverty statistics in Sleepy Hollow, males aged under 5 years and females aged under 5 years are the age groups that are most secure financially, with 100.0% of males and 100.0% of females in these age groups living above the poverty line.
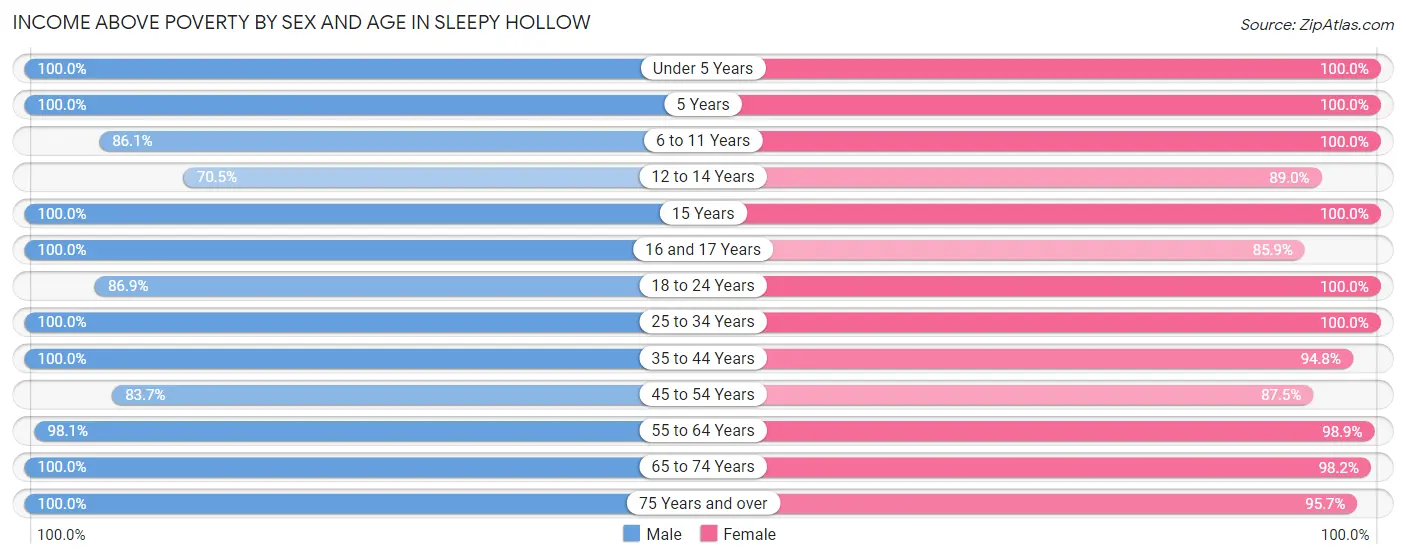
| Age Bracket | Male | Female |
| Under 5 Years | 31 (100.0%) | 28 (100.0%) |
| 5 Years | 6 (100.0%) | 9 (100.0%) |
| 6 to 11 Years | 87 (86.1%) | 82 (100.0%) |
| 12 to 14 Years | 31 (70.5%) | 73 (89.0%) |
| 15 Years | 10 (100.0%) | 34 (100.0%) |
| 16 and 17 Years | 27 (100.0%) | 55 (85.9%) |
| 18 to 24 Years | 133 (86.9%) | 163 (100.0%) |
| 25 to 34 Years | 136 (100.0%) | 76 (100.0%) |
| 35 to 44 Years | 235 (100.0%) | 147 (94.8%) |
| 45 to 54 Years | 211 (83.7%) | 217 (87.5%) |
| 55 to 64 Years | 262 (98.1%) | 345 (98.9%) |
| 65 to 74 Years | 197 (100.0%) | 214 (98.2%) |
| 75 Years and over | 110 (100.0%) | 111 (95.7%) |
| Total | 1,476 (94.1%) | 1,554 (95.7%) |
Income Below Poverty Among Married-Couple Families in Sleepy Hollow
The poverty statistics for married-couple families in Sleepy Hollow show that 2.4% or 17 of the total 712 families live below the poverty line. Families with 1 or 2 children have the highest poverty rate of 8.0%, comprising of 13 families. On the other hand, families with 3 or 4 children have the lowest poverty rate of 0.0%, which includes 0 families.
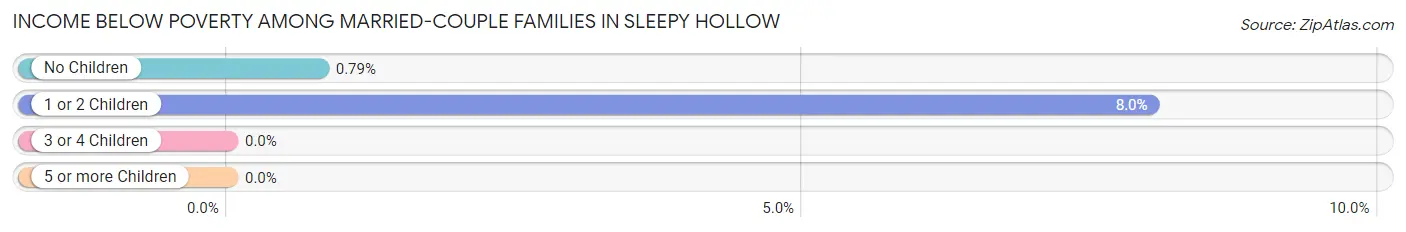
| Children | Above Poverty | Below Poverty |
| No Children | 501 (99.2%) | 4 (0.8%) |
| 1 or 2 Children | 149 (92.0%) | 13 (8.0%) |
| 3 or 4 Children | 45 (100.0%) | 0 (0.0%) |
| 5 or more Children | 0 (0.0%) | 0 (0.0%) |
| Total | 695 (97.6%) | 17 (2.4%) |
Income Below Poverty Among Single-Parent Households in Sleepy Hollow
According to the poverty data in Sleepy Hollow, 31.2% or 20 single-father households and 7.4% or 8 single-mother households are living below the poverty line. Among single-father households, those with no children have the highest poverty rate, with 20 households (100.0%) experiencing poverty. Likewise, among single-mother households, those with 1 or 2 children have the highest poverty rate, with 8 households (21.6%) falling below the poverty line.
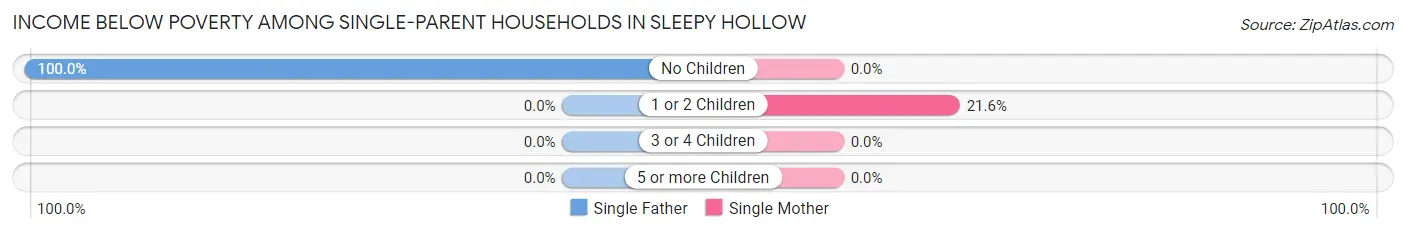
| Children | Single Father | Single Mother |
| No Children | 20 (100.0%) | 0 (0.0%) |
| 1 or 2 Children | 0 (0.0%) | 8 (21.6%) |
| 3 or 4 Children | 0 (0.0%) | 0 (0.0%) |
| 5 or more Children | 0 (0.0%) | 0 (0.0%) |
| Total | 20 (31.2%) | 8 (7.4%) |
Income Below Poverty Among Married-Couple vs Single-Parent Households in Sleepy Hollow
The poverty data for Sleepy Hollow shows that 17 of the married-couple family households (2.4%) and 28 of the single-parent households (16.3%) are living below the poverty level. Within the married-couple family households, those with 1 or 2 children have the highest poverty rate, with 13 households (8.0%) falling below the poverty line. Among the single-parent households, those with no children have the highest poverty rate, with 20 household (22.0%) living below poverty.
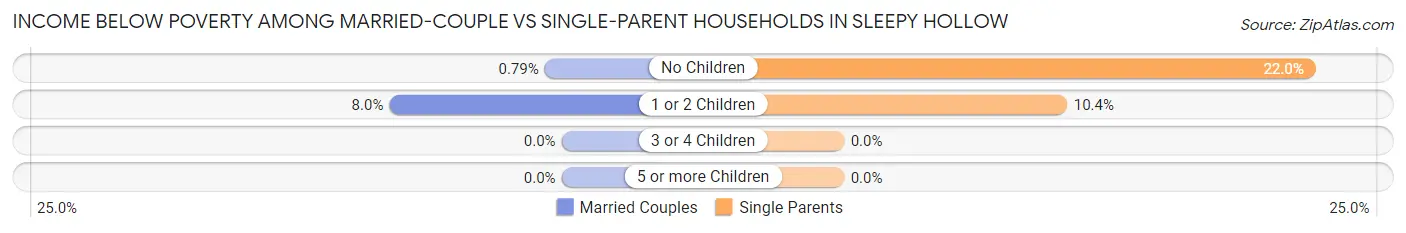
| Children | Married-Couple Families | Single-Parent Households |
| No Children | 4 (0.8%) | 20 (22.0%) |
| 1 or 2 Children | 13 (8.0%) | 8 (10.4%) |
| 3 or 4 Children | 0 (0.0%) | 0 (0.0%) |
| 5 or more Children | 0 (0.0%) | 0 (0.0%) |
| Total | 17 (2.4%) | 28 (16.3%) |
Race in Sleepy Hollow
The most populous races in Sleepy Hollow are White / Caucasian (2,580 | 80.5%), Hispanic or Latino (689 | 21.5%), and Some other Race (322 | 10.1%).
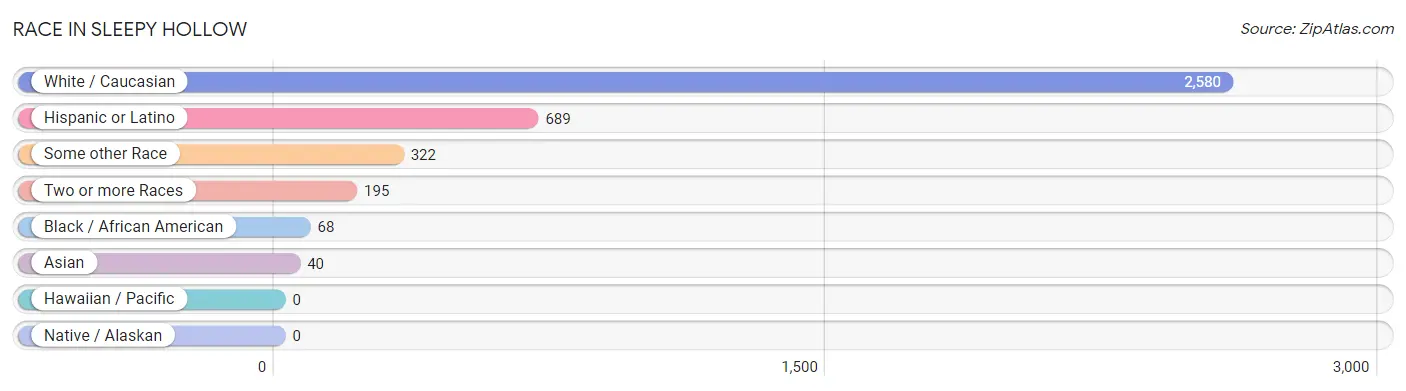
| Race | # Population | % Population |
| Asian | 40 | 1.3% |
| Black / African American | 68 | 2.1% |
| Hawaiian / Pacific | 0 | 0.0% |
| Hispanic or Latino | 689 | 21.5% |
| Native / Alaskan | 0 | 0.0% |
| White / Caucasian | 2,580 | 80.5% |
| Two or more Races | 195 | 6.1% |
| Some other Race | 322 | 10.1% |
| Total | 3,205 | 100.0% |
Ancestry in Sleepy Hollow
The most populous ancestries reported in Sleepy Hollow are German (735 | 22.9%), Irish (601 | 18.8%), Mexican (595 | 18.6%), Polish (381 | 11.9%), and Italian (320 | 10.0%), together accounting for 82.1% of all Sleepy Hollow residents.
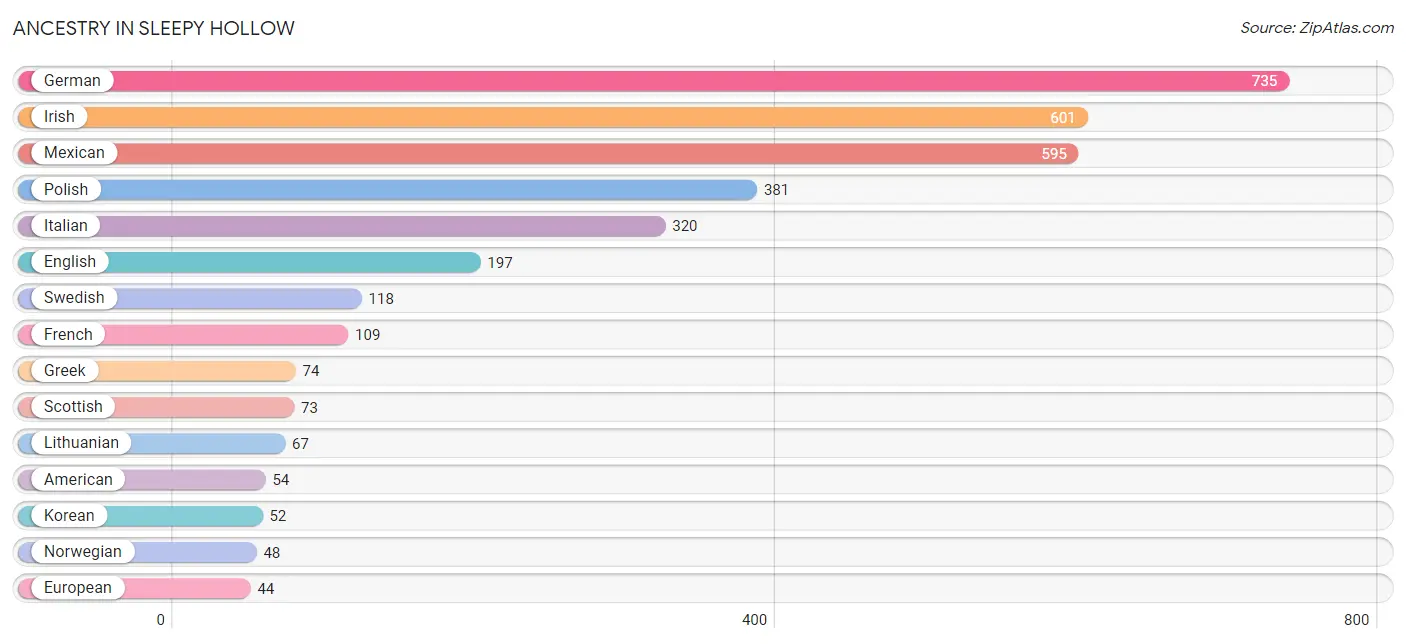
| Ancestry | # Population | % Population |
| American | 54 | 1.7% |
| Arab | 2 | 0.1% |
| Austrian | 38 | 1.2% |
| Belgian | 4 | 0.1% |
| Bhutanese | 16 | 0.5% |
| Brazilian | 6 | 0.2% |
| British | 5 | 0.2% |
| Bulgarian | 4 | 0.1% |
| Burmese | 10 | 0.3% |
| Central American | 38 | 1.2% |
| Cherokee | 11 | 0.3% |
| Croatian | 21 | 0.7% |
| Cuban | 6 | 0.2% |
| Czech | 31 | 1.0% |
| Danish | 34 | 1.1% |
| Dutch | 34 | 1.1% |
| Eastern European | 18 | 0.6% |
| Ecuadorian | 10 | 0.3% |
| English | 197 | 6.1% |
| European | 44 | 1.4% |
| Finnish | 34 | 1.1% |
| French | 109 | 3.4% |
| French Canadian | 8 | 0.3% |
| German | 735 | 22.9% |
| Greek | 74 | 2.3% |
| Haitian | 6 | 0.2% |
| Hungarian | 19 | 0.6% |
| Indian (Asian) | 10 | 0.3% |
| Irish | 601 | 18.8% |
| Italian | 320 | 10.0% |
| Korean | 52 | 1.6% |
| Lebanese | 2 | 0.1% |
| Lithuanian | 67 | 2.1% |
| Menominee | 9 | 0.3% |
| Mexican | 595 | 18.6% |
| Northern European | 5 | 0.2% |
| Norwegian | 48 | 1.5% |
| Panamanian | 38 | 1.2% |
| Polish | 381 | 11.9% |
| Portuguese | 5 | 0.2% |
| Puerto Rican | 4 | 0.1% |
| Scandinavian | 4 | 0.1% |
| Scotch-Irish | 29 | 0.9% |
| Scottish | 73 | 2.3% |
| Serbian | 5 | 0.2% |
| Slovak | 10 | 0.3% |
| Slovene | 12 | 0.4% |
| South American | 10 | 0.3% |
| Spaniard | 36 | 1.1% |
| Sri Lankan | 9 | 0.3% |
| Swedish | 118 | 3.7% |
| Swiss | 5 | 0.2% |
| Welsh | 23 | 0.7% | View All 53 Rows |
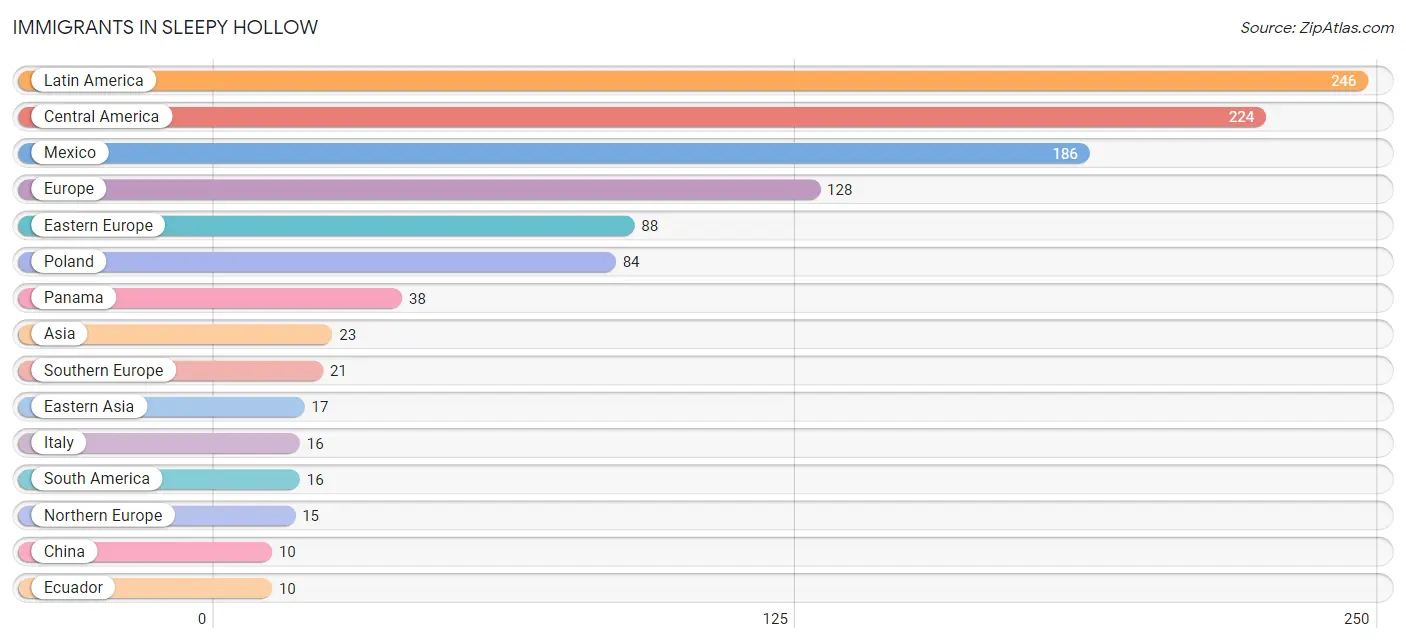
Immigrants in Sleepy Hollow
The most numerous immigrant groups reported in Sleepy Hollow came from Latin America (246 | 7.7%), Central America (224 | 7.0%), Mexico (186 | 5.8%), Europe (128 | 4.0%), and Eastern Europe (88 | 2.8%), together accounting for 27.2% of all Sleepy Hollow residents.
| Immigration Origin | # Population | % Population |
| Asia | 23 | 0.7% |
| Azores | 5 | 0.2% |
| Brazil | 6 | 0.2% |
| Bulgaria | 4 | 0.1% |
| Caribbean | 6 | 0.2% |
| Central America | 224 | 7.0% |
| China | 10 | 0.3% |
| Eastern Asia | 17 | 0.5% |
| Eastern Europe | 88 | 2.8% |
| Ecuador | 10 | 0.3% |
| Europe | 128 | 4.0% |
| Germany | 4 | 0.1% |
| Haiti | 6 | 0.2% |
| Ireland | 5 | 0.2% |
| Italy | 16 | 0.5% |
| Korea | 7 | 0.2% |
| Latin America | 246 | 7.7% |
| Mexico | 186 | 5.8% |
| Northern Europe | 15 | 0.5% |
| Panama | 38 | 1.2% |
| Poland | 84 | 2.6% |
| Portugal | 5 | 0.2% |
| Scotland | 4 | 0.1% |
| South America | 16 | 0.5% |
| South Eastern Asia | 6 | 0.2% |
| Southern Europe | 21 | 0.7% |
| Sweden | 6 | 0.2% |
| Thailand | 6 | 0.2% |
| Western Europe | 4 | 0.1% | View All 29 Rows |
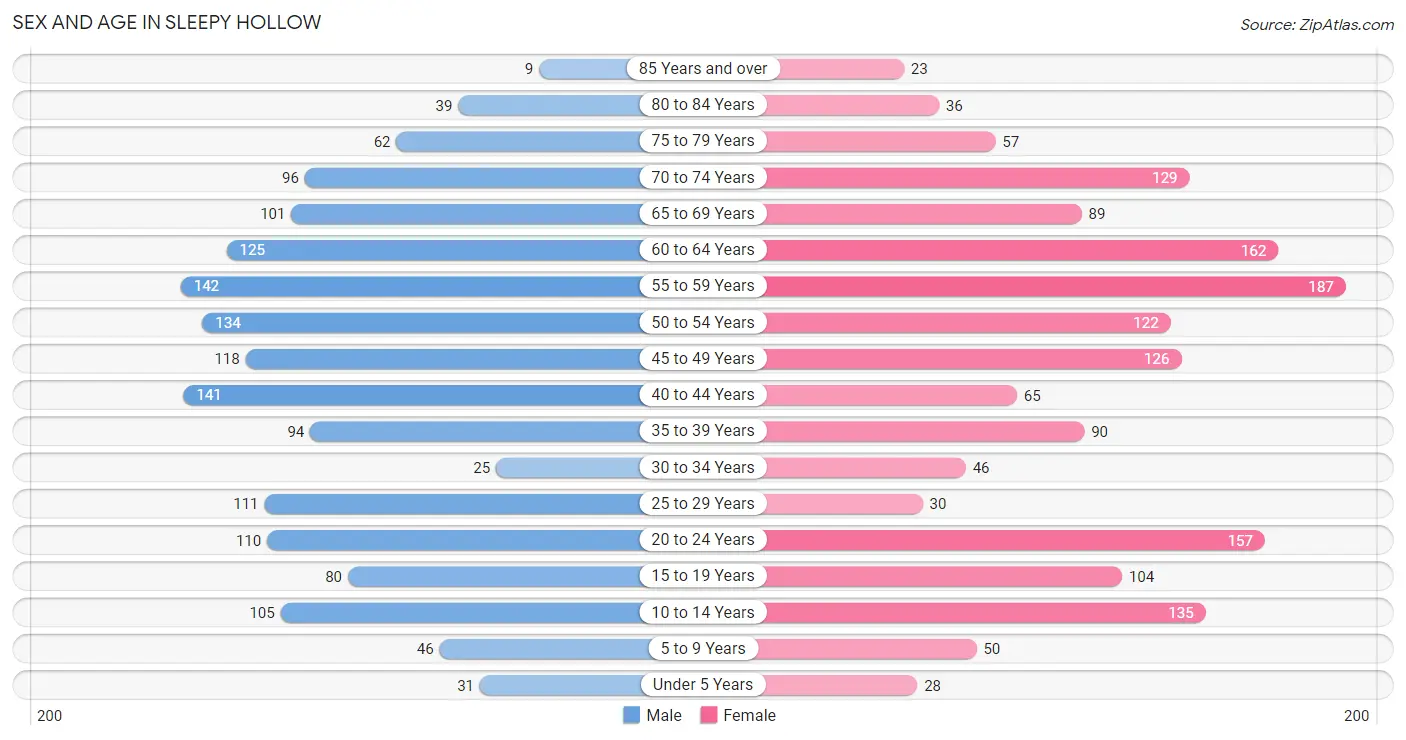
Sex and Age in Sleepy Hollow
Sex and Age in Sleepy Hollow
The most populous age groups in Sleepy Hollow are 55 to 59 Years (142 | 9.0%) for men and 55 to 59 Years (187 | 11.4%) for women.
| Age Bracket | Male | Female |
| Under 5 Years | 31 (2.0%) | 28 (1.7%) |
| 5 to 9 Years | 46 (2.9%) | 50 (3.1%) |
| 10 to 14 Years | 105 (6.7%) | 135 (8.3%) |
| 15 to 19 Years | 80 (5.1%) | 104 (6.4%) |
| 20 to 24 Years | 110 (7.0%) | 157 (9.6%) |
| 25 to 29 Years | 111 (7.1%) | 30 (1.8%) |
| 30 to 34 Years | 25 (1.6%) | 46 (2.8%) |
| 35 to 39 Years | 94 (6.0%) | 90 (5.5%) |
| 40 to 44 Years | 141 (9.0%) | 65 (4.0%) |
| 45 to 49 Years | 118 (7.5%) | 126 (7.7%) |
| 50 to 54 Years | 134 (8.5%) | 122 (7.5%) |
| 55 to 59 Years | 142 (9.0%) | 187 (11.4%) |
| 60 to 64 Years | 125 (8.0%) | 162 (9.9%) |
| 65 to 69 Years | 101 (6.4%) | 89 (5.4%) |
| 70 to 74 Years | 96 (6.1%) | 129 (7.9%) |
| 75 to 79 Years | 62 (4.0%) | 57 (3.5%) |
| 80 to 84 Years | 39 (2.5%) | 36 (2.2%) |
| 85 Years and over | 9 (0.6%) | 23 (1.4%) |
| Total | 1,569 (100.0%) | 1,636 (100.0%) |
Families and Households in Sleepy Hollow
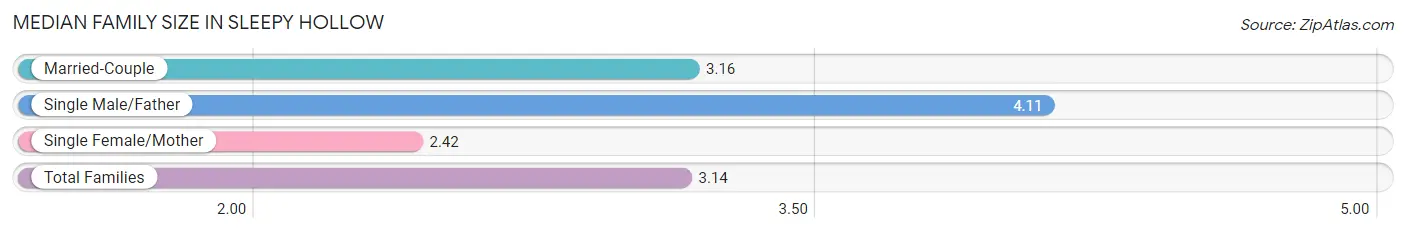
Median Family Size in Sleepy Hollow
The median family size in Sleepy Hollow is 3.14 persons per family, with single male/father families (64 | 7.2%) accounting for the largest median family size of 4.11 persons per family. On the other hand, single female/mother families (108 | 12.2%) represent the smallest median family size with 2.42 persons per family.
| Family Type | # Families | Family Size |
| Married-Couple | 712 (80.5%) | 3.16 |
| Single Male/Father | 64 (7.2%) | 4.11 |
| Single Female/Mother | 108 (12.2%) | 2.42 |
| Total Families | 884 (100.0%) | 3.14 |
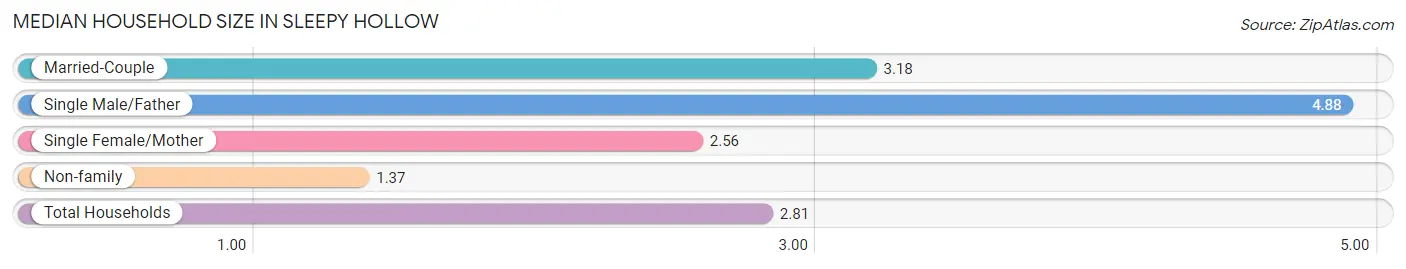
Median Household Size in Sleepy Hollow
The median household size in Sleepy Hollow is 2.81 persons per household, with single male/father households (64 | 5.6%) accounting for the largest median household size of 4.88 persons per household. non-family households (258 | 22.6%) represent the smallest median household size with 1.37 persons per household.
| Household Type | # Households | Household Size |
| Married-Couple | 712 (62.4%) | 3.18 |
| Single Male/Father | 64 (5.6%) | 4.88 |
| Single Female/Mother | 108 (9.5%) | 2.56 |
| Non-family | 258 (22.6%) | 1.37 |
| Total Households | 1,142 (100.0%) | 2.81 |
Household Size by Marriage Status in Sleepy Hollow
Out of a total of 1,142 households in Sleepy Hollow, 884 (77.4%) are family households, while 258 (22.6%) are nonfamily households. The most numerous type of family households are 2-person households, comprising 366, and the most common type of nonfamily households are 1-person households, comprising 177.
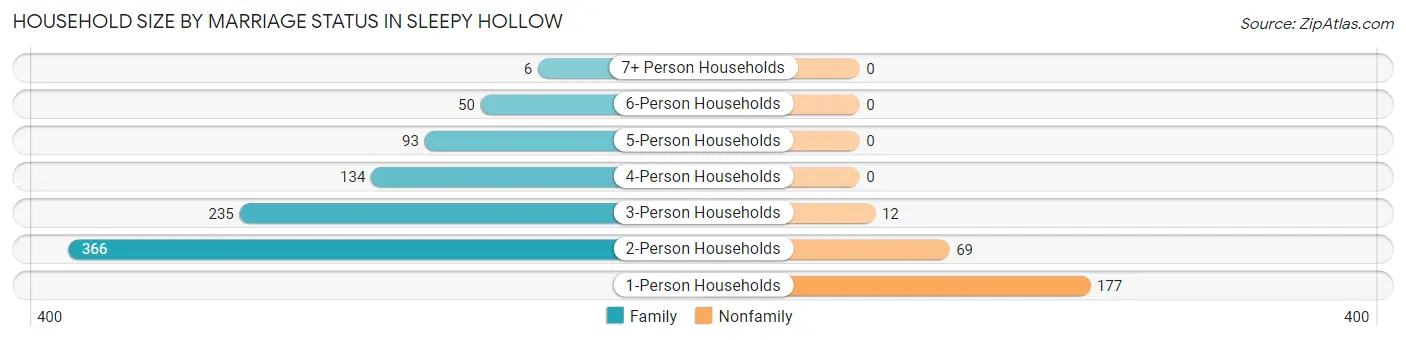
| Household Size | Family Households | Nonfamily Households |
| 1-Person Households | - | 177 (15.5%) |
| 2-Person Households | 366 (32.1%) | 69 (6.0%) |
| 3-Person Households | 235 (20.6%) | 12 (1.1%) |
| 4-Person Households | 134 (11.7%) | 0 (0.0%) |
| 5-Person Households | 93 (8.1%) | 0 (0.0%) |
| 6-Person Households | 50 (4.4%) | 0 (0.0%) |
| 7+ Person Households | 6 (0.5%) | 0 (0.0%) |
| Total | 884 (77.4%) | 258 (22.6%) |
Female Fertility in Sleepy Hollow
Fertility by Age in Sleepy Hollow
Average fertility rate in Sleepy Hollow is 11.0 births per 1,000 women. Women in the age bracket of 20 to 34 years have the highest fertility rate with 30.0 births per 1,000 women. Women in the age bracket of 20 to 34 years acount for 100.0% of all women with births.
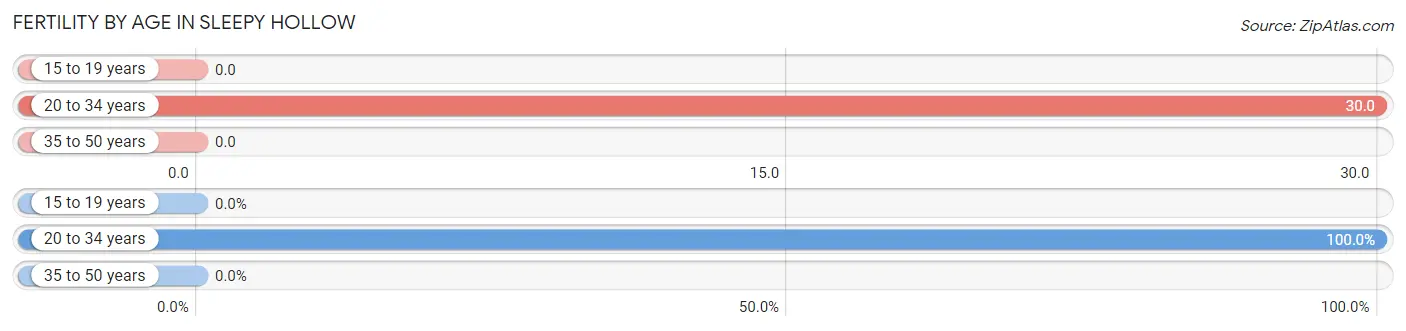
| Age Bracket | Women with Births | Births / 1,000 Women |
| 15 to 19 years | 0 (0.0%) | 0.0 |
| 20 to 34 years | 7 (100.0%) | 30.0 |
| 35 to 50 years | 0 (0.0%) | 0.0 |
| Total | 7 (100.0%) | 11.0 |
Fertility by Age by Marriage Status in Sleepy Hollow
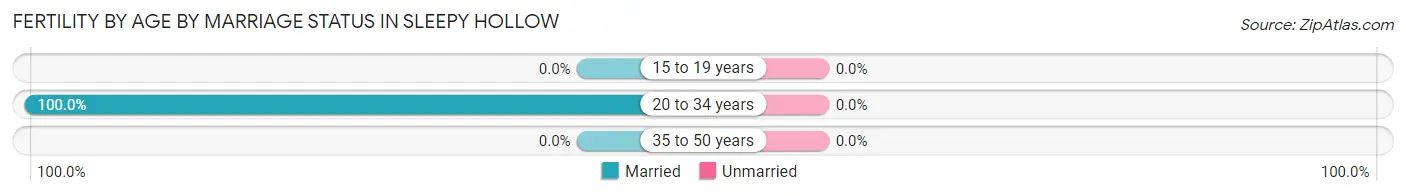
| Age Bracket | Married | Unmarried |
| 15 to 19 years | 0 (0.0%) | 0 (0.0%) |
| 20 to 34 years | 7 (100.0%) | 0 (0.0%) |
| 35 to 50 years | 0 (0.0%) | 0 (0.0%) |
| Total | 7 (100.0%) | 0 (0.0%) |
Fertility by Education in Sleepy Hollow
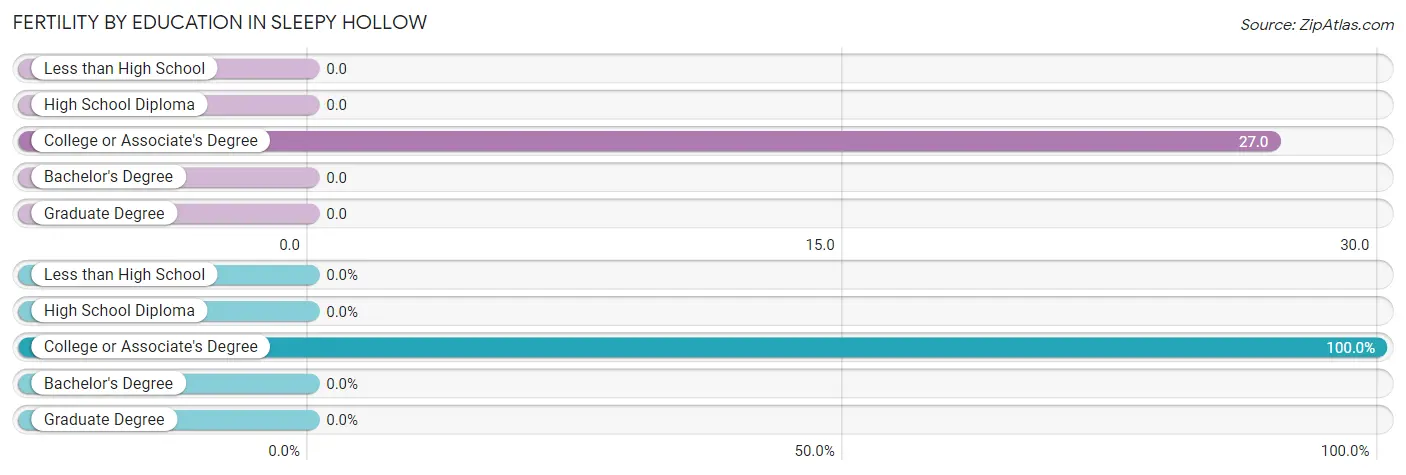
| Educational Attainment | Women with Births | Births / 1,000 Women |
| Less than High School | 0 (0.0%) | 0.0 |
| High School Diploma | 0 (0.0%) | 0.0 |
| College or Associate's Degree | 7 (100.0%) | 27.0 |
| Bachelor's Degree | 0 (0.0%) | 0.0 |
| Graduate Degree | 0 (0.0%) | 0.0 |
| Total | 7 (100.0%) | 11.0 |
Fertility by Education by Marriage Status in Sleepy Hollow
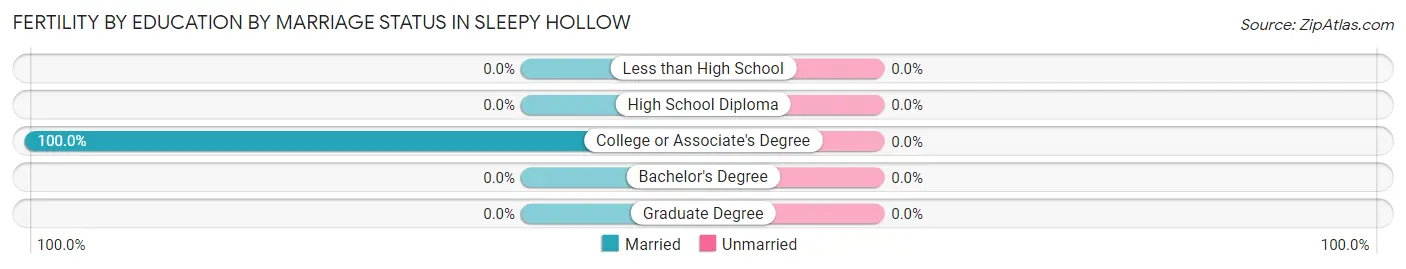
| Educational Attainment | Married | Unmarried |
| Less than High School | 0 (0.0%) | 0 (0.0%) |
| High School Diploma | 0 (0.0%) | 0 (0.0%) |
| College or Associate's Degree | 7 (100.0%) | 0 (0.0%) |
| Bachelor's Degree | 0 (0.0%) | 0 (0.0%) |
| Graduate Degree | 0 (0.0%) | 0 (0.0%) |
| Total | 7 (100.0%) | 0 (0.0%) |
Employment Characteristics in Sleepy Hollow
Employment by Class of Employer in Sleepy Hollow
Among the 1,738 employed individuals in Sleepy Hollow, private company employees (1,236 | 71.1%), self-employed (incorporated) (163 | 9.4%), and not-for-profit organizations (103 | 5.9%) make up the most common classes of employment.
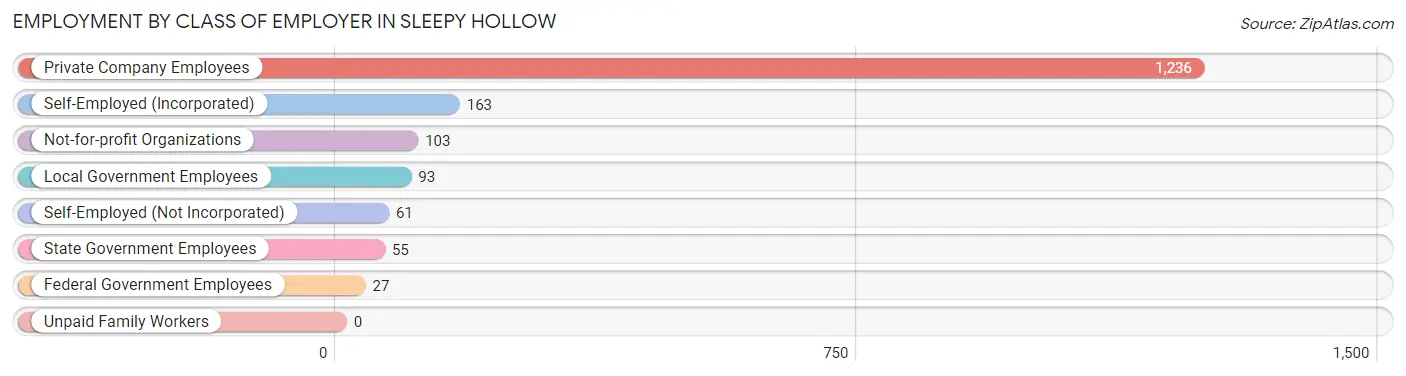
| Employer Class | # Employees | % Employees |
| Private Company Employees | 1,236 | 71.1% |
| Self-Employed (Incorporated) | 163 | 9.4% |
| Self-Employed (Not Incorporated) | 61 | 3.5% |
| Not-for-profit Organizations | 103 | 5.9% |
| Local Government Employees | 93 | 5.3% |
| State Government Employees | 55 | 3.2% |
| Federal Government Employees | 27 | 1.5% |
| Unpaid Family Workers | 0 | 0.0% |
| Total | 1,738 | 100.0% |
Employment Status by Age in Sleepy Hollow
According to the labor force statistics for Sleepy Hollow, out of the total population over 16 years of age (2,766), 67.1% or 1,856 individuals are in the labor force, with 1.9% or 35 of them unemployed. The age group with the highest labor force participation rate is 35 to 44 years, with 91.0% or 355 individuals in the labor force. Within the labor force, the 16 to 19 years age range has the highest percentage of unemployed individuals, with 37.7% or 20 of them being unemployed.
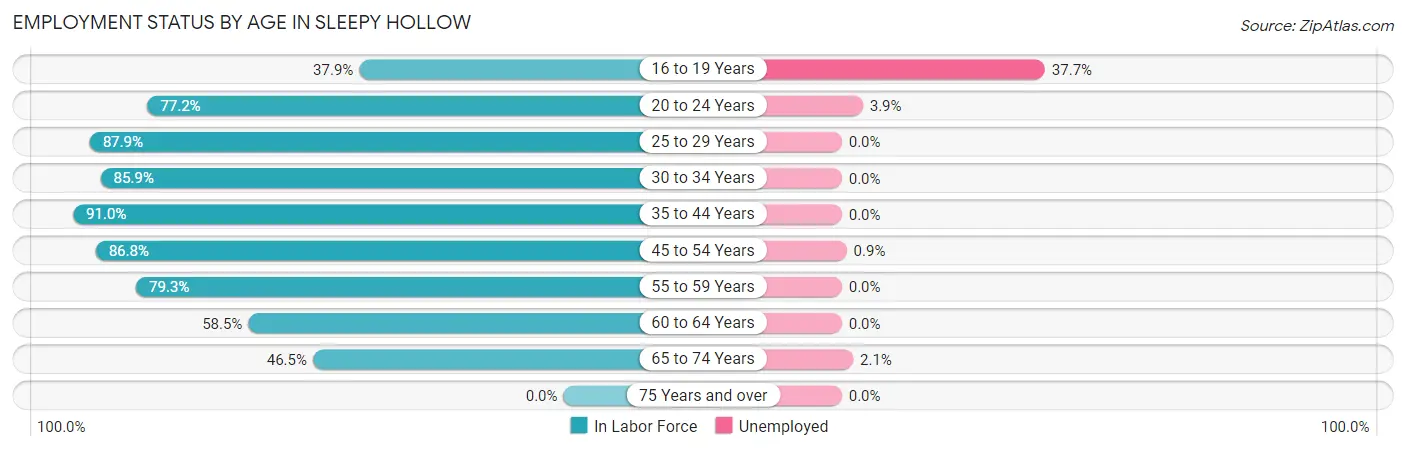
| Age Bracket | In Labor Force | Unemployed |
| 16 to 19 Years | 53 (37.9%) | 20 (37.7%) |
| 20 to 24 Years | 206 (77.2%) | 8 (3.9%) |
| 25 to 29 Years | 124 (87.9%) | 0 (0.0%) |
| 30 to 34 Years | 61 (85.9%) | 0 (0.0%) |
| 35 to 44 Years | 355 (91.0%) | 0 (0.0%) |
| 45 to 54 Years | 434 (86.8%) | 4 (0.9%) |
| 55 to 59 Years | 261 (79.3%) | 0 (0.0%) |
| 60 to 64 Years | 168 (58.5%) | 0 (0.0%) |
| 65 to 74 Years | 193 (46.5%) | 4 (2.1%) |
| 75 Years and over | 0 (0.0%) | 0 (0.0%) |
| Total | 1,856 (67.1%) | 35 (1.9%) |
Employment Status by Educational Attainment in Sleepy Hollow
According to labor force statistics for Sleepy Hollow, 81.7% of individuals (1,404) out of the total population between 25 and 64 years of age (1,718) are in the labor force, with 0.3% or 4 of them being unemployed. The group with the highest labor force participation rate are those with the educational attainment of high school diploma, with 86.3% or 295 individuals in the labor force. Within the labor force, individuals with high school diploma education have the highest percentage of unemployment, with 1.4% or 4 of them being unemployed.
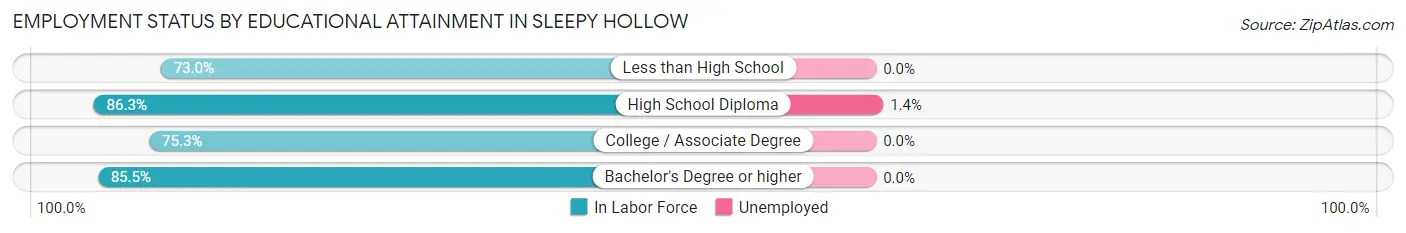
| Educational Attainment | In Labor Force | Unemployed |
| Less than High School | 103 (73.0%) | 0 (0.0%) |
| High School Diploma | 295 (86.3%) | 5 (1.4%) |
| College / Associate Degree | 378 (75.3%) | 0 (0.0%) |
| Bachelor's Degree or higher | 627 (85.5%) | 0 (0.0%) |
| Total | 1,404 (81.7%) | 5 (0.3%) |
Employment Occupations by Sex in Sleepy Hollow
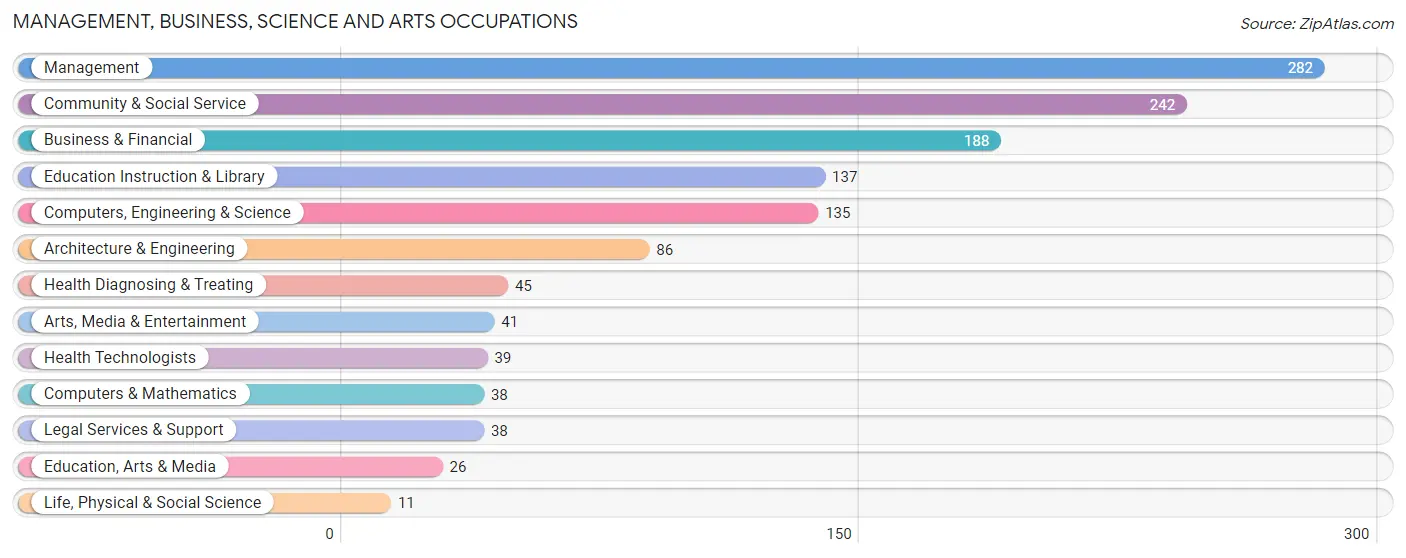
Management, Business, Science and Arts Occupations
The most common Management, Business, Science and Arts occupations in Sleepy Hollow are Management (282 | 15.5%), Community & Social Service (242 | 13.3%), Business & Financial (188 | 10.3%), Education Instruction & Library (137 | 7.5%), and Computers, Engineering & Science (135 | 7.4%).
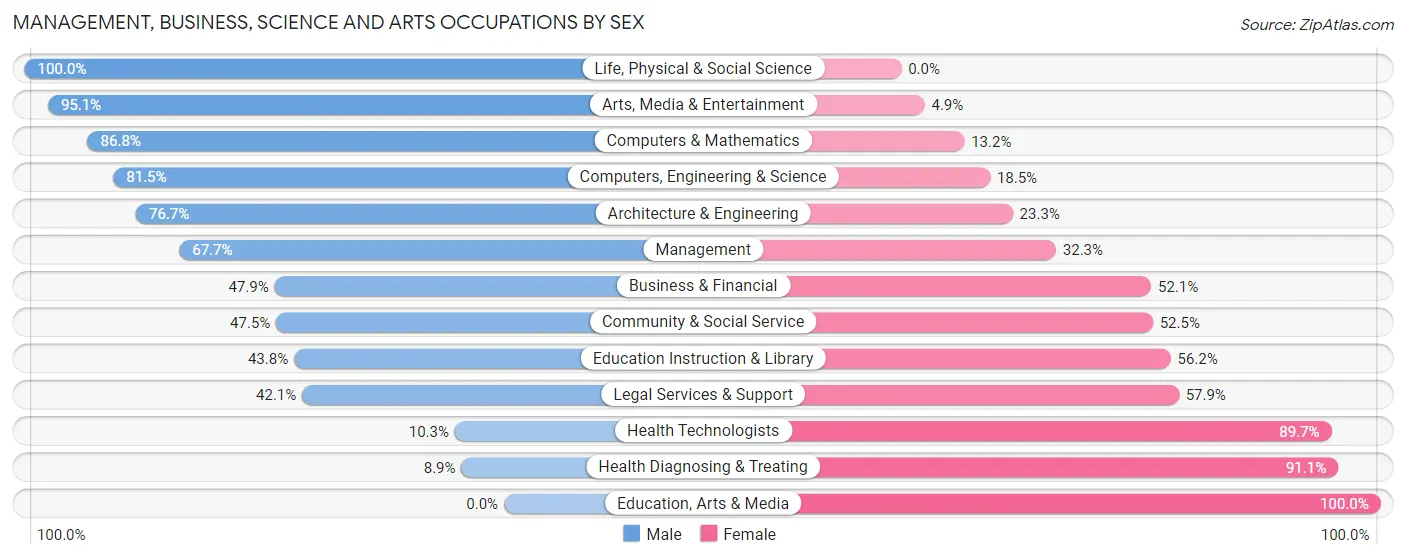
Management, Business, Science and Arts Occupations by Sex
Within the Management, Business, Science and Arts occupations in Sleepy Hollow, the most male-oriented occupations are Life, Physical & Social Science (100.0%), Arts, Media & Entertainment (95.1%), and Computers & Mathematics (86.8%), while the most female-oriented occupations are Education, Arts & Media (100.0%), Health Diagnosing & Treating (91.1%), and Health Technologists (89.7%).
| Occupation | Male | Female |
| Management | 191 (67.7%) | 91 (32.3%) |
| Business & Financial | 90 (47.9%) | 98 (52.1%) |
| Computers, Engineering & Science | 110 (81.5%) | 25 (18.5%) |
| Computers & Mathematics | 33 (86.8%) | 5 (13.2%) |
| Architecture & Engineering | 66 (76.7%) | 20 (23.3%) |
| Life, Physical & Social Science | 11 (100.0%) | 0 (0.0%) |
| Community & Social Service | 115 (47.5%) | 127 (52.5%) |
| Education, Arts & Media | 0 (0.0%) | 26 (100.0%) |
| Legal Services & Support | 16 (42.1%) | 22 (57.9%) |
| Education Instruction & Library | 60 (43.8%) | 77 (56.2%) |
| Arts, Media & Entertainment | 39 (95.1%) | 2 (4.9%) |
| Health Diagnosing & Treating | 4 (8.9%) | 41 (91.1%) |
| Health Technologists | 4 (10.3%) | 35 (89.7%) |
| Total (Category) | 510 (57.2%) | 382 (42.8%) |
| Total (Overall) | 987 (54.3%) | 832 (45.7%) |
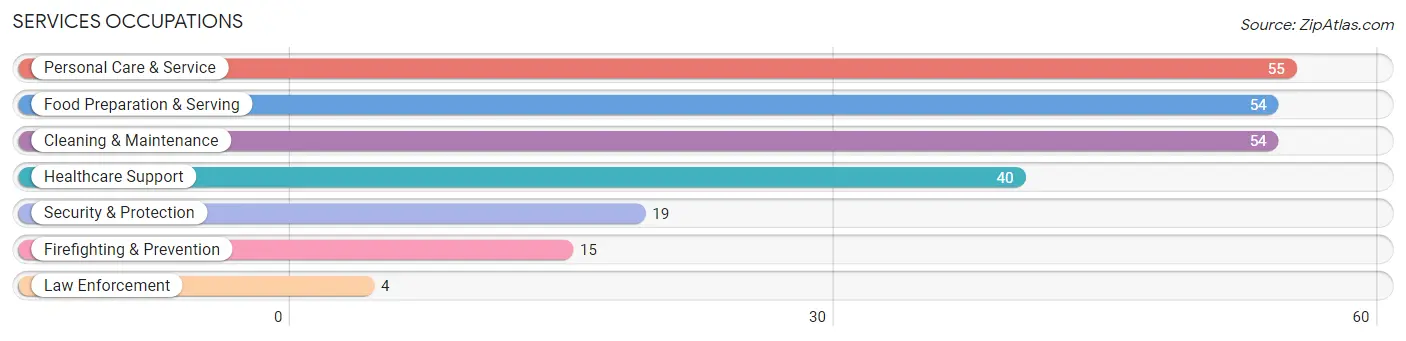
Services Occupations
The most common Services occupations in Sleepy Hollow are Personal Care & Service (55 | 3.0%), Food Preparation & Serving (54 | 3.0%), Cleaning & Maintenance (54 | 3.0%), Healthcare Support (40 | 2.2%), and Security & Protection (19 | 1.0%).
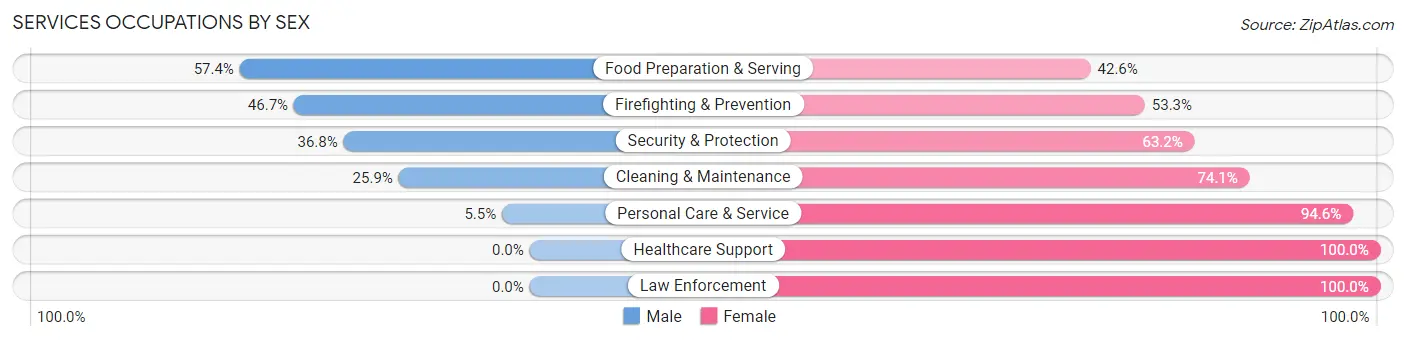
Services Occupations by Sex
Within the Services occupations in Sleepy Hollow, the most male-oriented occupations are Food Preparation & Serving (57.4%), Firefighting & Prevention (46.7%), and Security & Protection (36.8%), while the most female-oriented occupations are Healthcare Support (100.0%), Law Enforcement (100.0%), and Personal Care & Service (94.6%).
| Occupation | Male | Female |
| Healthcare Support | 0 (0.0%) | 40 (100.0%) |
| Security & Protection | 7 (36.8%) | 12 (63.2%) |
| Firefighting & Prevention | 7 (46.7%) | 8 (53.3%) |
| Law Enforcement | 0 (0.0%) | 4 (100.0%) |
| Food Preparation & Serving | 31 (57.4%) | 23 (42.6%) |
| Cleaning & Maintenance | 14 (25.9%) | 40 (74.1%) |
| Personal Care & Service | 3 (5.4%) | 52 (94.6%) |
| Total (Category) | 55 (24.8%) | 167 (75.2%) |
| Total (Overall) | 987 (54.3%) | 832 (45.7%) |
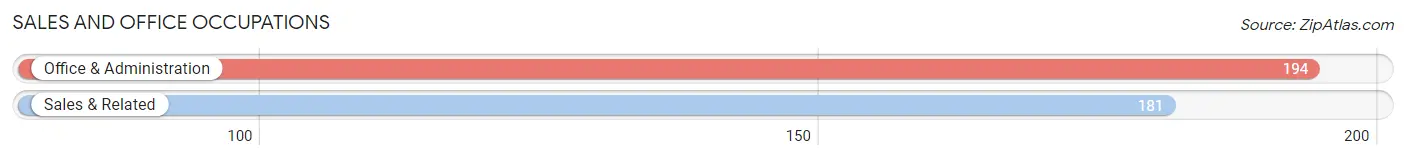
Sales and Office Occupations
The most common Sales and Office occupations in Sleepy Hollow are Office & Administration (194 | 10.7%), and Sales & Related (181 | 10.0%).
Sales and Office Occupations by Sex
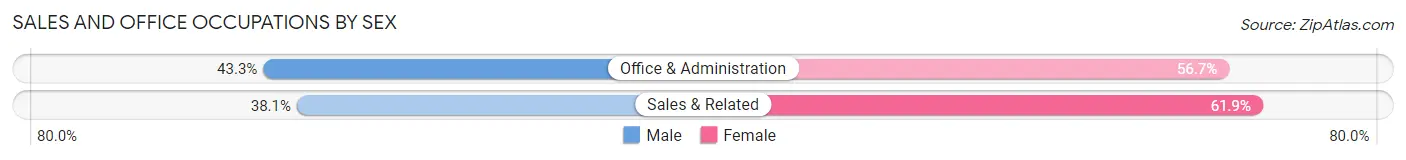
| Occupation | Male | Female |
| Sales & Related | 69 (38.1%) | 112 (61.9%) |
| Office & Administration | 84 (43.3%) | 110 (56.7%) |
| Total (Category) | 153 (40.8%) | 222 (59.2%) |
| Total (Overall) | 987 (54.3%) | 832 (45.7%) |
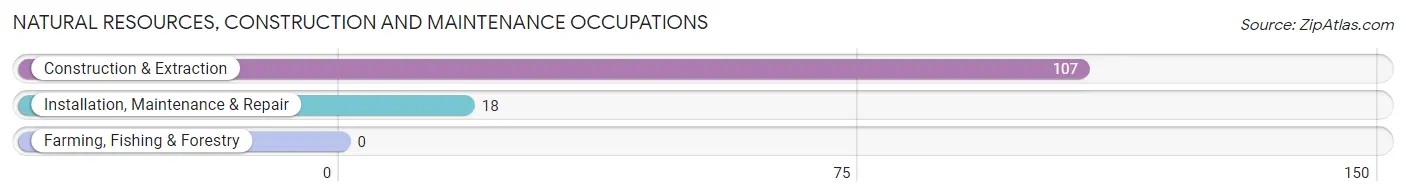
Natural Resources, Construction and Maintenance Occupations
The most common Natural Resources, Construction and Maintenance occupations in Sleepy Hollow are Construction & Extraction (107 | 5.9%), and Installation, Maintenance & Repair (18 | 1.0%).
Natural Resources, Construction and Maintenance Occupations by Sex
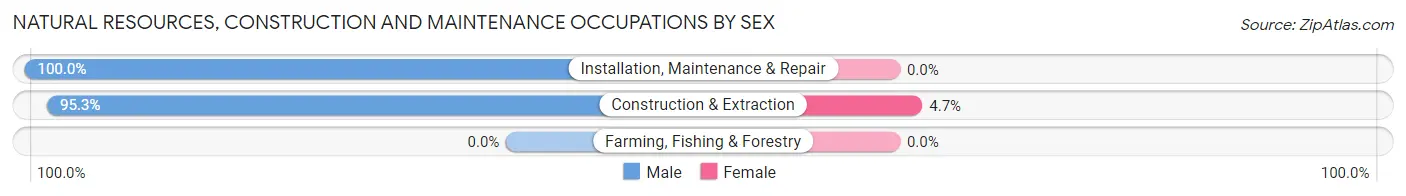
| Occupation | Male | Female |
| Farming, Fishing & Forestry | 0 (0.0%) | 0 (0.0%) |
| Construction & Extraction | 102 (95.3%) | 5 (4.7%) |
| Installation, Maintenance & Repair | 18 (100.0%) | 0 (0.0%) |
| Total (Category) | 120 (96.0%) | 5 (4.0%) |
| Total (Overall) | 987 (54.3%) | 832 (45.7%) |
Production, Transportation and Moving Occupations
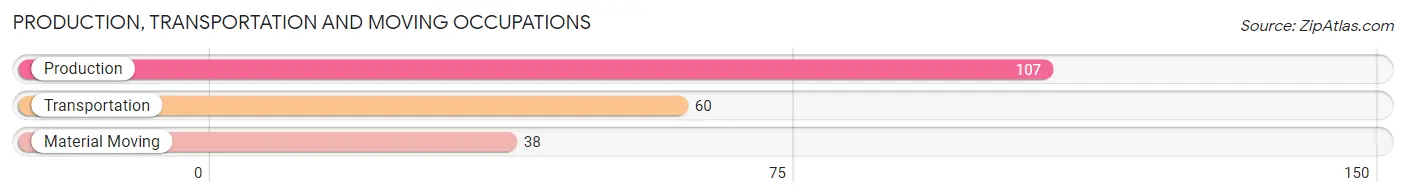
The most common Production, Transportation and Moving occupations in Sleepy Hollow are Production (107 | 5.9%), Transportation (60 | 3.3%), and Material Moving (38 | 2.1%).
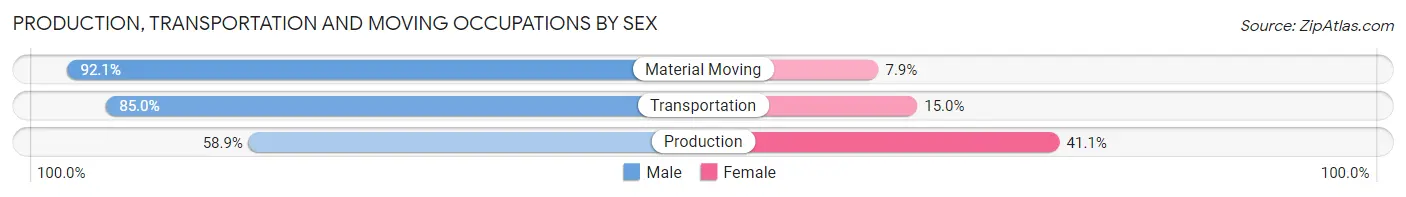
Production, Transportation and Moving Occupations by Sex
| Occupation | Male | Female |
| Production | 63 (58.9%) | 44 (41.1%) |
| Transportation | 51 (85.0%) | 9 (15.0%) |
| Material Moving | 35 (92.1%) | 3 (7.9%) |
| Total (Category) | 149 (72.7%) | 56 (27.3%) |
| Total (Overall) | 987 (54.3%) | 832 (45.7%) |
Employment Industries by Sex in Sleepy Hollow
Employment Industries in Sleepy Hollow
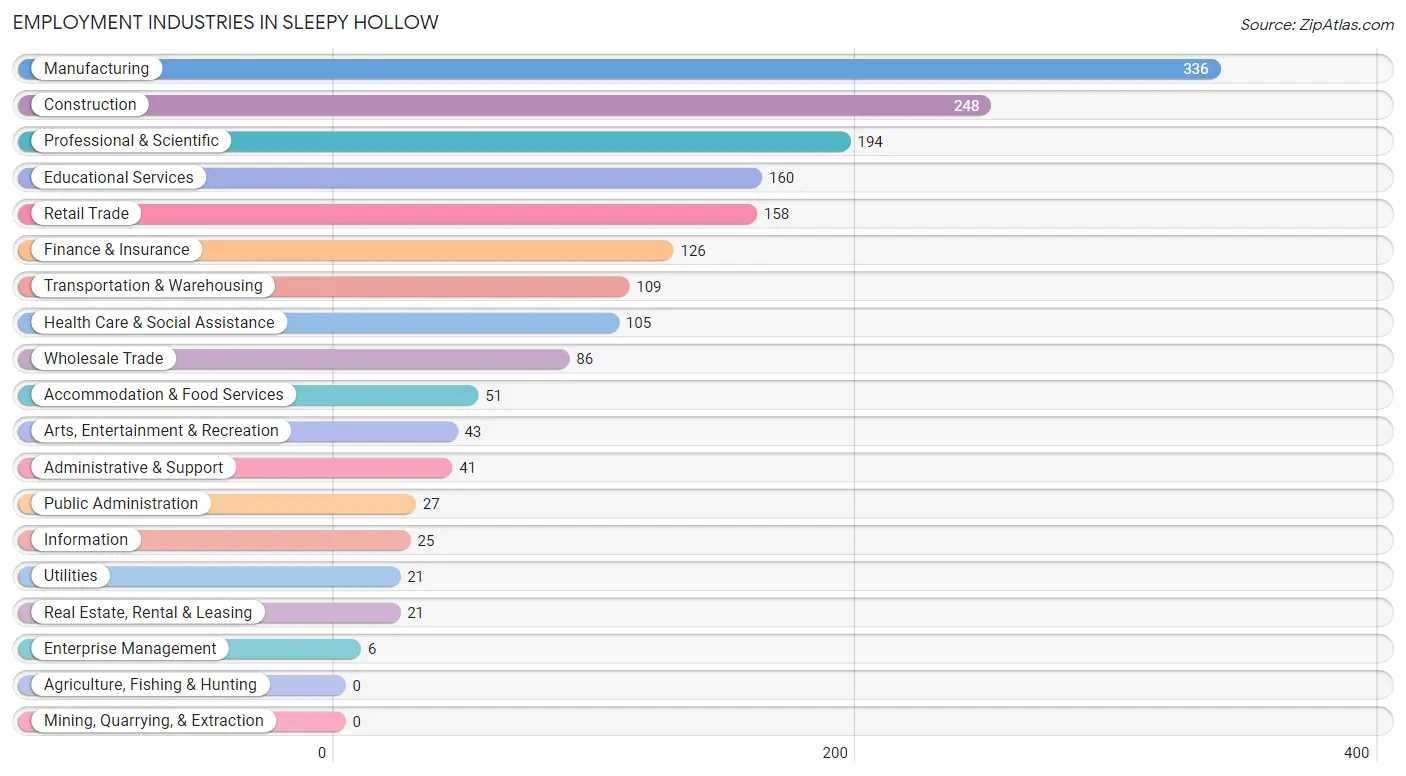
The major employment industries in Sleepy Hollow include Manufacturing (336 | 18.5%), Construction (248 | 13.6%), Professional & Scientific (194 | 10.7%), Educational Services (160 | 8.8%), and Retail Trade (158 | 8.7%).
Employment Industries by Sex in Sleepy Hollow
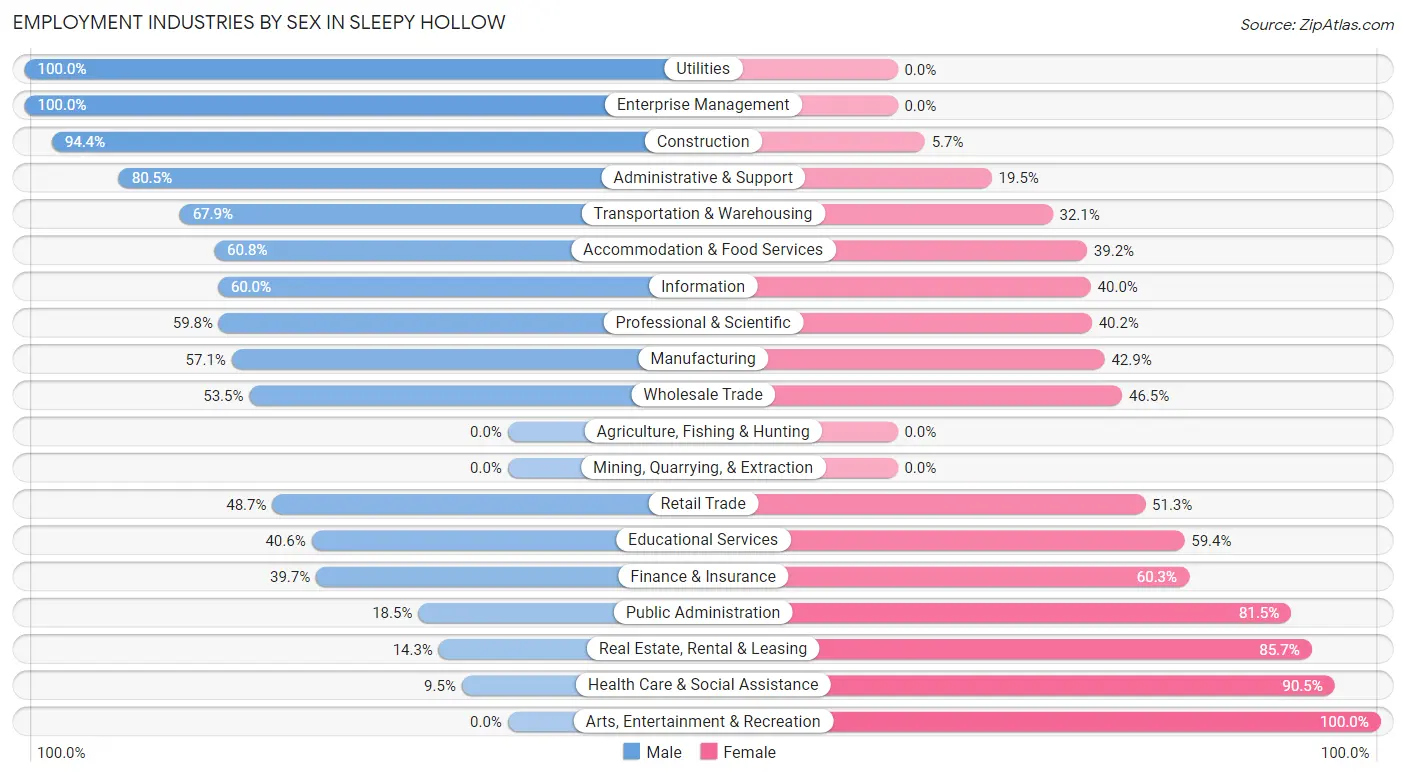
The Sleepy Hollow industries that see more men than women are Utilities (100.0%), Enterprise Management (100.0%), and Construction (94.4%), whereas the industries that tend to have a higher number of women are Arts, Entertainment & Recreation (100.0%), Health Care & Social Assistance (90.5%), and Real Estate, Rental & Leasing (85.7%).
| Industry | Male | Female |
| Agriculture, Fishing & Hunting | 0 (0.0%) | 0 (0.0%) |
| Mining, Quarrying, & Extraction | 0 (0.0%) | 0 (0.0%) |
| Construction | 234 (94.4%) | 14 (5.7%) |
| Manufacturing | 192 (57.1%) | 144 (42.9%) |
| Wholesale Trade | 46 (53.5%) | 40 (46.5%) |
| Retail Trade | 77 (48.7%) | 81 (51.3%) |
| Transportation & Warehousing | 74 (67.9%) | 35 (32.1%) |
| Utilities | 21 (100.0%) | 0 (0.0%) |
| Information | 15 (60.0%) | 10 (40.0%) |
| Finance & Insurance | 50 (39.7%) | 76 (60.3%) |
| Real Estate, Rental & Leasing | 3 (14.3%) | 18 (85.7%) |
| Professional & Scientific | 116 (59.8%) | 78 (40.2%) |
| Enterprise Management | 6 (100.0%) | 0 (0.0%) |
| Administrative & Support | 33 (80.5%) | 8 (19.5%) |
| Educational Services | 65 (40.6%) | 95 (59.4%) |
| Health Care & Social Assistance | 10 (9.5%) | 95 (90.5%) |
| Arts, Entertainment & Recreation | 0 (0.0%) | 43 (100.0%) |
| Accommodation & Food Services | 31 (60.8%) | 20 (39.2%) |
| Public Administration | 5 (18.5%) | 22 (81.5%) |
| Total | 987 (54.3%) | 832 (45.7%) |
Education in Sleepy Hollow
School Enrollment in Sleepy Hollow
The most common levels of schooling among the 762 students in Sleepy Hollow are college / undergraduate (226 | 29.7%), middle school (225 | 29.5%), and high school (185 | 24.3%).
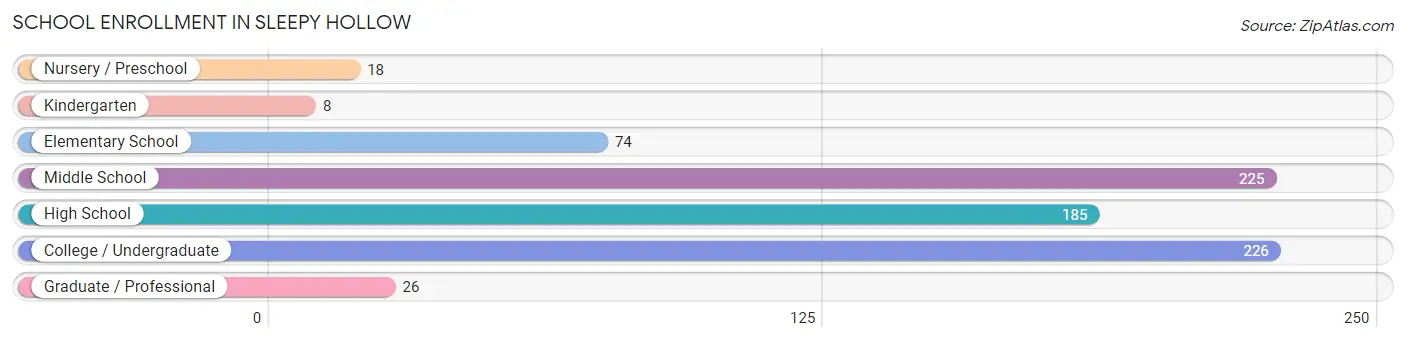
| School Level | # Students | % Students |
| Nursery / Preschool | 18 | 2.4% |
| Kindergarten | 8 | 1.1% |
| Elementary School | 74 | 9.7% |
| Middle School | 225 | 29.5% |
| High School | 185 | 24.3% |
| College / Undergraduate | 226 | 29.7% |
| Graduate / Professional | 26 | 3.4% |
| Total | 762 | 100.0% |
School Enrollment by Age by Funding Source in Sleepy Hollow
Out of a total of 762 students who are enrolled in schools in Sleepy Hollow, 164 (21.5%) attend a private institution, while the remaining 598 (78.5%) are enrolled in public schools. The age group of 3 to 4 year olds has the highest likelihood of being enrolled in private schools, with 4 (50.0% in the age bracket) enrolled. Conversely, the age group of 35 years and over has the lowest likelihood of being enrolled in a private school, with 31 (100.0% in the age bracket) attending a public institution.
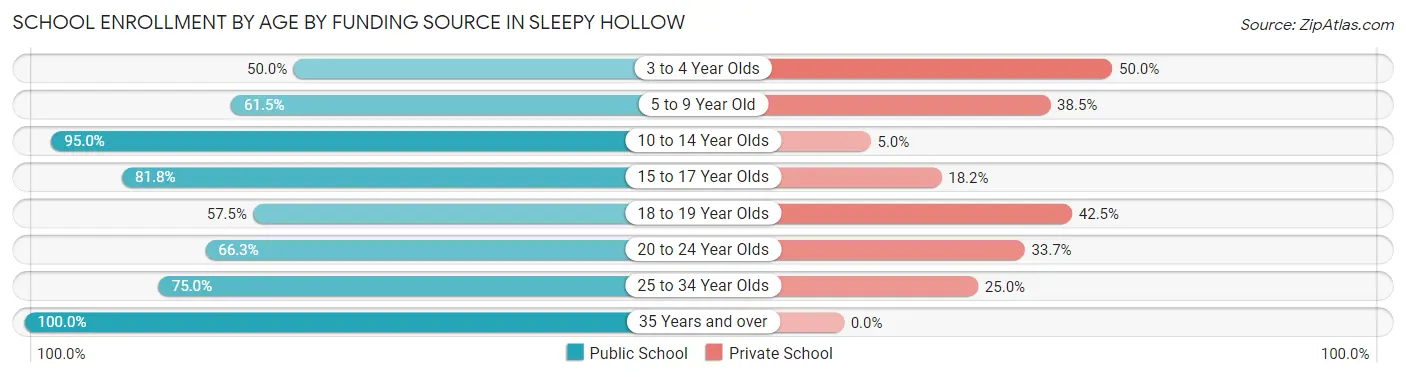
| Age Bracket | Public School | Private School |
| 3 to 4 Year Olds | 4 (50.0%) | 4 (50.0%) |
| 5 to 9 Year Old | 56 (61.5%) | 35 (38.5%) |
| 10 to 14 Year Olds | 228 (95.0%) | 12 (5.0%) |
| 15 to 17 Year Olds | 108 (81.8%) | 24 (18.2%) |
| 18 to 19 Year Olds | 23 (57.5%) | 17 (42.5%) |
| 20 to 24 Year Olds | 130 (66.3%) | 66 (33.7%) |
| 25 to 34 Year Olds | 18 (75.0%) | 6 (25.0%) |
| 35 Years and over | 31 (100.0%) | 0 (0.0%) |
| Total | 598 (78.5%) | 164 (21.5%) |
Educational Attainment by Field of Study in Sleepy Hollow
Business (250 | 21.3%), education (162 | 13.8%), engineering (151 | 12.9%), science & technology (97 | 8.3%), and arts & humanities (79 | 6.7%) are the most common fields of study among 1,175 individuals in Sleepy Hollow who have obtained a bachelor's degree or higher.
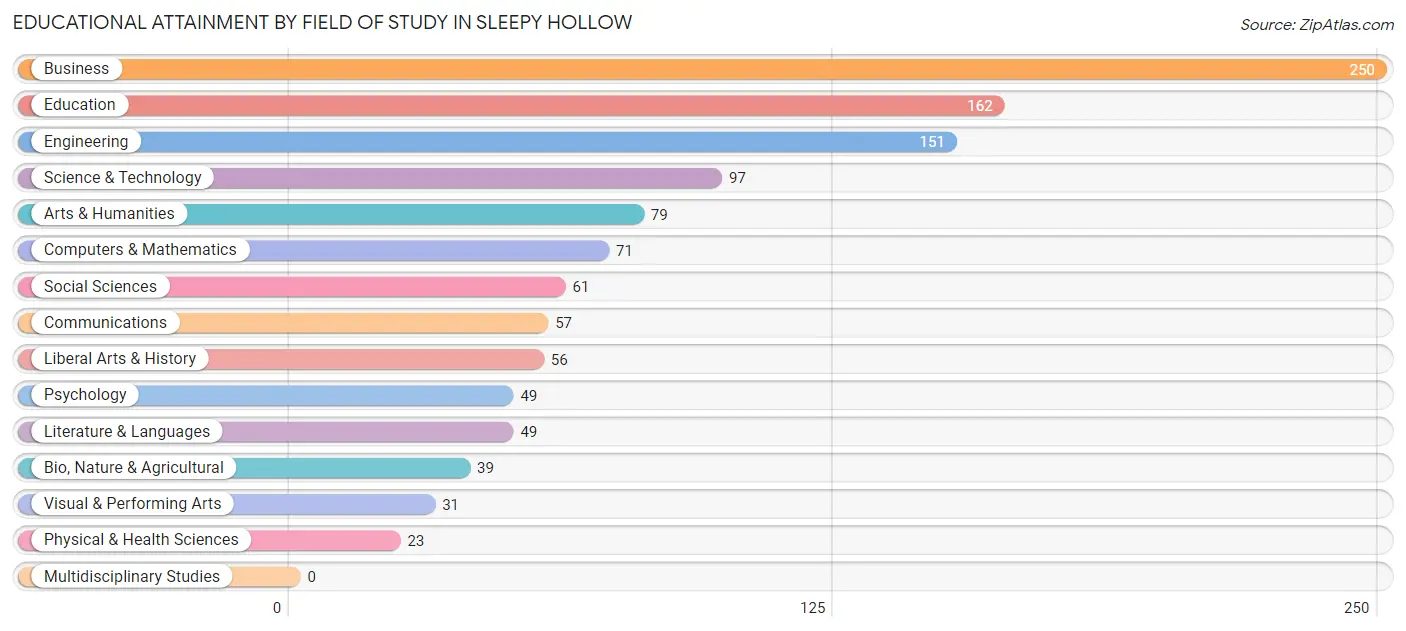
| Field of Study | # Graduates | % Graduates |
| Computers & Mathematics | 71 | 6.0% |
| Bio, Nature & Agricultural | 39 | 3.3% |
| Physical & Health Sciences | 23 | 2.0% |
| Psychology | 49 | 4.2% |
| Social Sciences | 61 | 5.2% |
| Engineering | 151 | 12.9% |
| Multidisciplinary Studies | 0 | 0.0% |
| Science & Technology | 97 | 8.3% |
| Business | 250 | 21.3% |
| Education | 162 | 13.8% |
| Literature & Languages | 49 | 4.2% |
| Liberal Arts & History | 56 | 4.8% |
| Visual & Performing Arts | 31 | 2.6% |
| Communications | 57 | 4.9% |
| Arts & Humanities | 79 | 6.7% |
| Total | 1,175 | 100.0% |
Transportation & Commute in Sleepy Hollow
Vehicle Availability by Sex in Sleepy Hollow
The most prevalent vehicle ownership categories in Sleepy Hollow are males with 3 vehicles (432, accounting for 44.4%) and females with 3 vehicles (319, making up 56.5%).
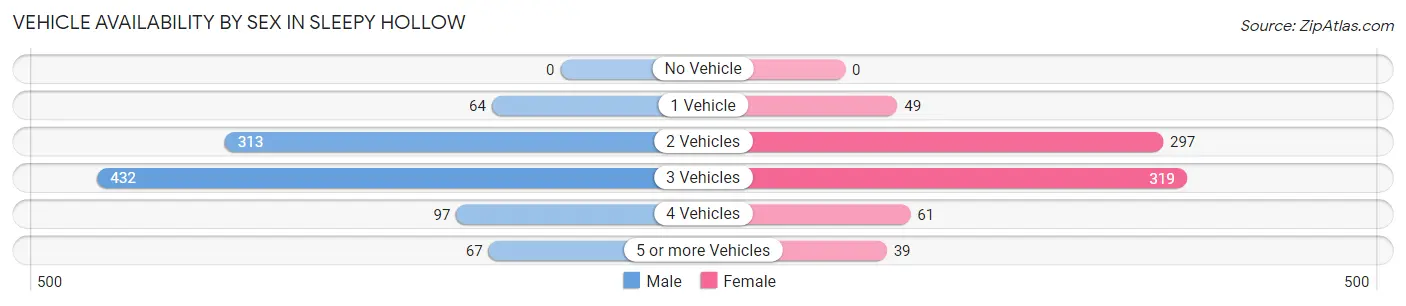
| Vehicles Available | Male | Female |
| No Vehicle | 0 (0.0%) | 0 (0.0%) |
| 1 Vehicle | 64 (6.6%) | 49 (6.4%) |
| 2 Vehicles | 313 (32.2%) | 297 (38.8%) |
| 3 Vehicles | 432 (44.4%) | 319 (41.7%) |
| 4 Vehicles | 97 (10.0%) | 61 (8.0%) |
| 5 or more Vehicles | 67 (6.9%) | 39 (5.1%) |
| Total | 973 (100.0%) | 765 (100.0%) |
Commute Time in Sleepy Hollow
The most frequently occuring commute durations in Sleepy Hollow are 30 to 34 minutes (223 commuters, 14.5%), 45 to 59 minutes (201 commuters, 13.1%), and 40 to 44 minutes (184 commuters, 11.9%).
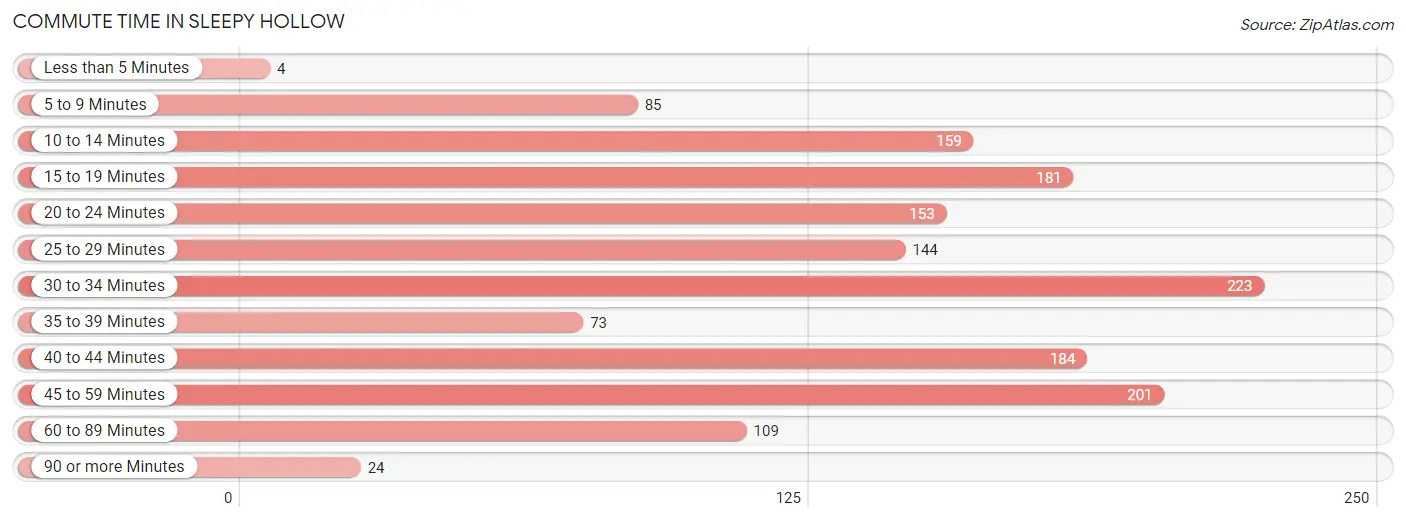
| Commute Time | # Commuters | % Commuters |
| Less than 5 Minutes | 4 | 0.3% |
| 5 to 9 Minutes | 85 | 5.5% |
| 10 to 14 Minutes | 159 | 10.3% |
| 15 to 19 Minutes | 181 | 11.7% |
| 20 to 24 Minutes | 153 | 9.9% |
| 25 to 29 Minutes | 144 | 9.3% |
| 30 to 34 Minutes | 223 | 14.5% |
| 35 to 39 Minutes | 73 | 4.7% |
| 40 to 44 Minutes | 184 | 11.9% |
| 45 to 59 Minutes | 201 | 13.1% |
| 60 to 89 Minutes | 109 | 7.1% |
| 90 or more Minutes | 24 | 1.6% |
Commute Time by Sex in Sleepy Hollow
The most common commute times in Sleepy Hollow are 45 to 59 minutes (143 commuters, 16.3%) for males and 15 to 19 minutes (119 commuters, 17.9%) for females.
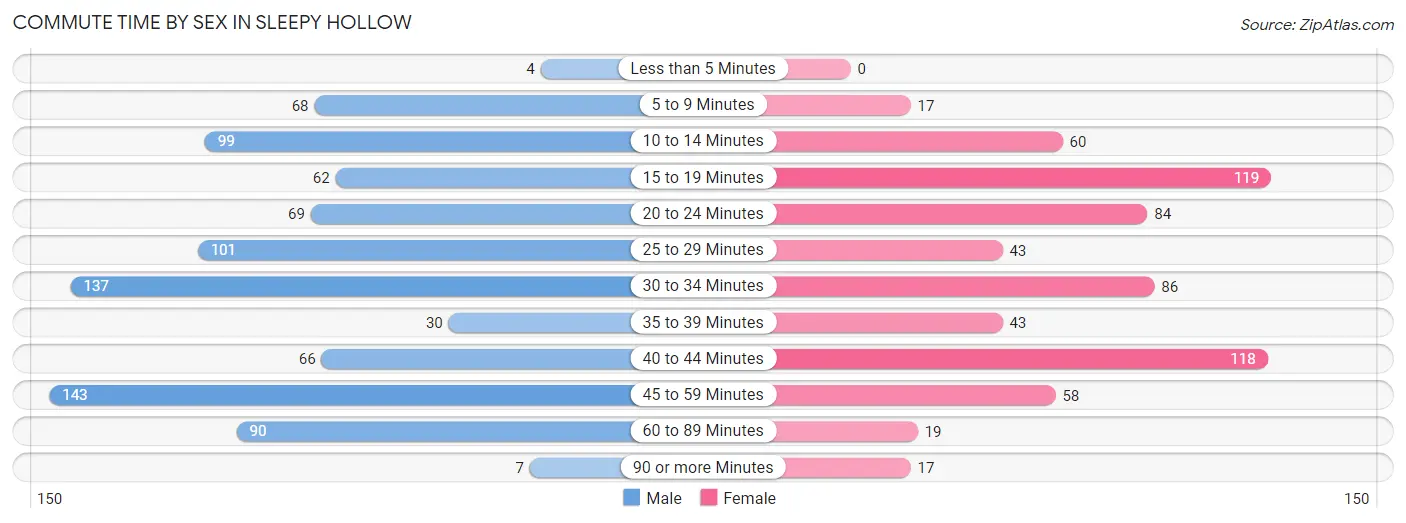
| Commute Time | Male | Female |
| Less than 5 Minutes | 4 (0.5%) | 0 (0.0%) |
| 5 to 9 Minutes | 68 (7.8%) | 17 (2.6%) |
| 10 to 14 Minutes | 99 (11.3%) | 60 (9.0%) |
| 15 to 19 Minutes | 62 (7.1%) | 119 (17.9%) |
| 20 to 24 Minutes | 69 (7.9%) | 84 (12.7%) |
| 25 to 29 Minutes | 101 (11.5%) | 43 (6.5%) |
| 30 to 34 Minutes | 137 (15.6%) | 86 (13.0%) |
| 35 to 39 Minutes | 30 (3.4%) | 43 (6.5%) |
| 40 to 44 Minutes | 66 (7.5%) | 118 (17.8%) |
| 45 to 59 Minutes | 143 (16.3%) | 58 (8.7%) |
| 60 to 89 Minutes | 90 (10.3%) | 19 (2.9%) |
| 90 or more Minutes | 7 (0.8%) | 17 (2.6%) |
Time of Departure to Work by Sex in Sleepy Hollow
The most frequent times of departure to work in Sleepy Hollow are 7:30 AM to 7:59 AM (162, 18.5%) for males and 6:30 AM to 6:59 AM (107, 16.1%) for females.
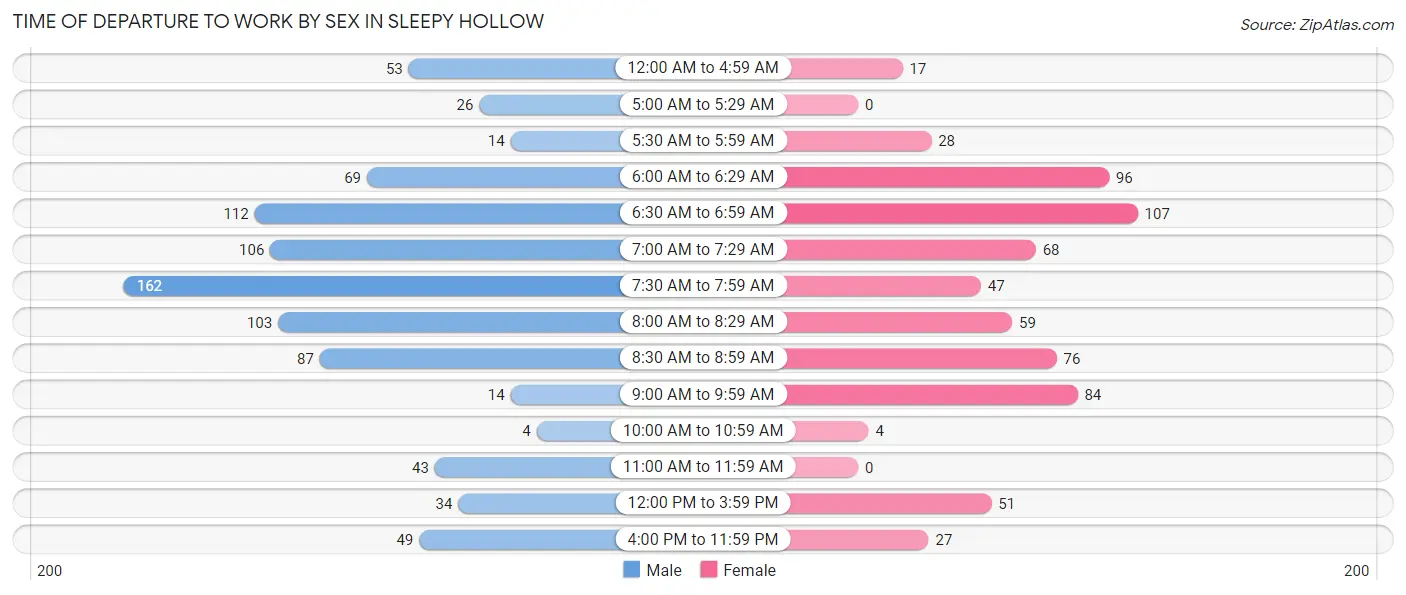
| Time of Departure | Male | Female |
| 12:00 AM to 4:59 AM | 53 (6.0%) | 17 (2.6%) |
| 5:00 AM to 5:29 AM | 26 (3.0%) | 0 (0.0%) |
| 5:30 AM to 5:59 AM | 14 (1.6%) | 28 (4.2%) |
| 6:00 AM to 6:29 AM | 69 (7.9%) | 96 (14.5%) |
| 6:30 AM to 6:59 AM | 112 (12.8%) | 107 (16.1%) |
| 7:00 AM to 7:29 AM | 106 (12.1%) | 68 (10.2%) |
| 7:30 AM to 7:59 AM | 162 (18.5%) | 47 (7.1%) |
| 8:00 AM to 8:29 AM | 103 (11.8%) | 59 (8.9%) |
| 8:30 AM to 8:59 AM | 87 (9.9%) | 76 (11.5%) |
| 9:00 AM to 9:59 AM | 14 (1.6%) | 84 (12.7%) |
| 10:00 AM to 10:59 AM | 4 (0.5%) | 4 (0.6%) |
| 11:00 AM to 11:59 AM | 43 (4.9%) | 0 (0.0%) |
| 12:00 PM to 3:59 PM | 34 (3.9%) | 51 (7.7%) |
| 4:00 PM to 11:59 PM | 49 (5.6%) | 27 (4.1%) |
| Total | 876 (100.0%) | 664 (100.0%) |
Housing Occupancy in Sleepy Hollow
Occupancy by Ownership in Sleepy Hollow
Of the total 1,142 dwellings in Sleepy Hollow, owner-occupied units account for 1,063 (93.1%), while renter-occupied units make up 79 (6.9%).
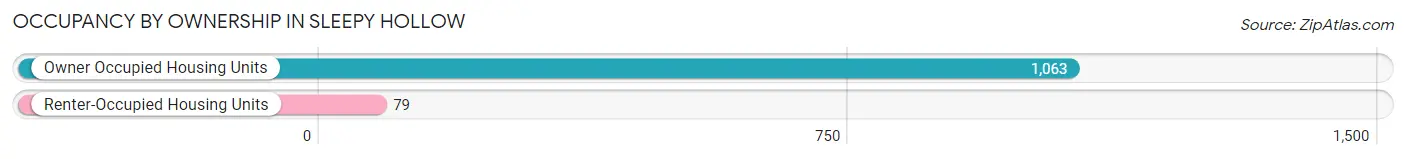
| Occupancy | # Housing Units | % Housing Units |
| Owner Occupied Housing Units | 1,063 | 93.1% |
| Renter-Occupied Housing Units | 79 | 6.9% |
| Total Occupied Housing Units | 1,142 | 100.0% |
Occupancy by Household Size in Sleepy Hollow
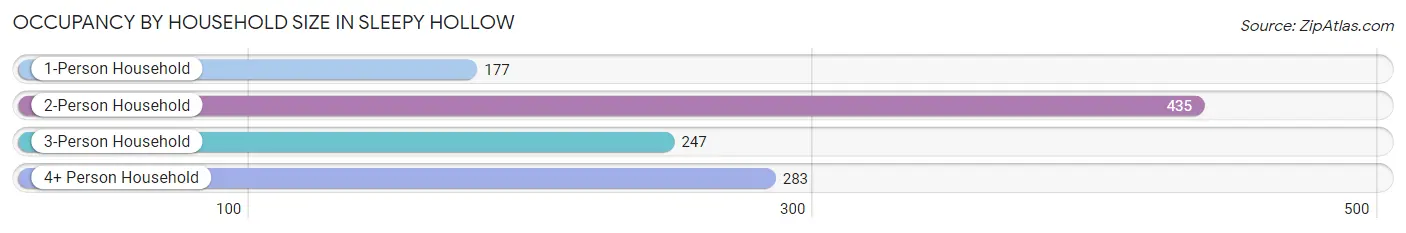
| Household Size | # Housing Units | % Housing Units |
| 1-Person Household | 177 | 15.5% |
| 2-Person Household | 435 | 38.1% |
| 3-Person Household | 247 | 21.6% |
| 4+ Person Household | 283 | 24.8% |
| Total Housing Units | 1,142 | 100.0% |
Occupancy by Ownership by Household Size in Sleepy Hollow
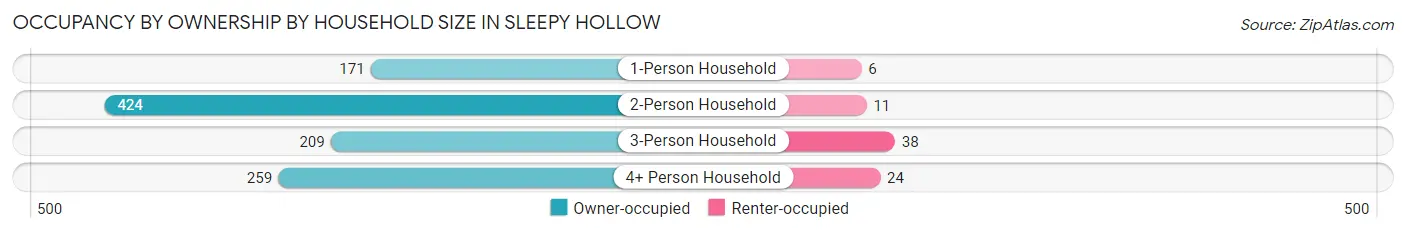
| Household Size | Owner-occupied | Renter-occupied |
| 1-Person Household | 171 (96.6%) | 6 (3.4%) |
| 2-Person Household | 424 (97.5%) | 11 (2.5%) |
| 3-Person Household | 209 (84.6%) | 38 (15.4%) |
| 4+ Person Household | 259 (91.5%) | 24 (8.5%) |
| Total Housing Units | 1,063 (93.1%) | 79 (6.9%) |
Occupancy by Educational Attainment in Sleepy Hollow
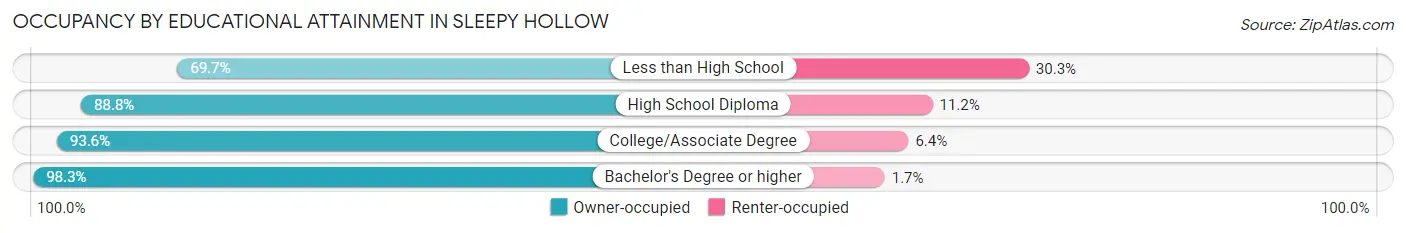
| Household Size | Owner-occupied | Renter-occupied |
| Less than High School | 76 (69.7%) | 33 (30.3%) |
| High School Diploma | 135 (88.8%) | 17 (11.2%) |
| College/Associate Degree | 278 (93.6%) | 19 (6.4%) |
| Bachelor's Degree or higher | 574 (98.3%) | 10 (1.7%) |
Occupancy by Age of Householder in Sleepy Hollow
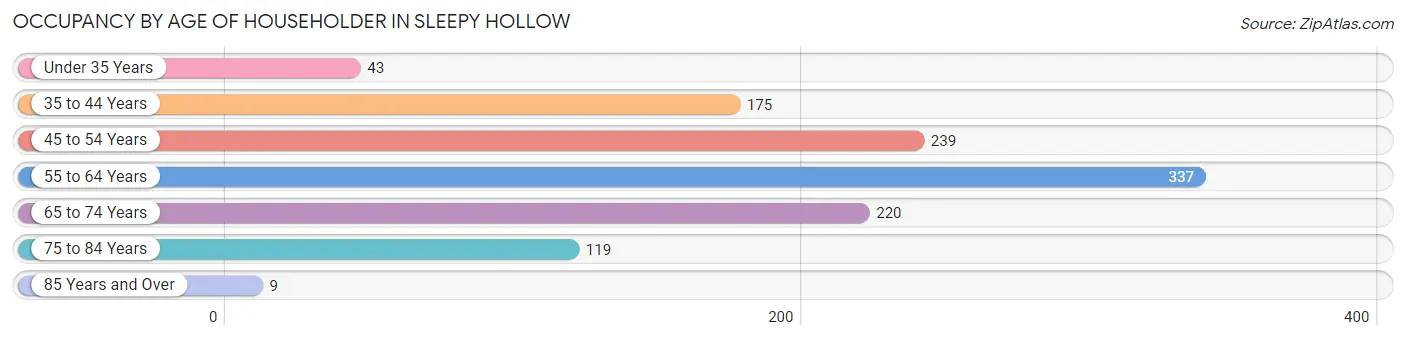
| Age Bracket | # Households | % Households |
| Under 35 Years | 43 | 3.8% |
| 35 to 44 Years | 175 | 15.3% |
| 45 to 54 Years | 239 | 20.9% |
| 55 to 64 Years | 337 | 29.5% |
| 65 to 74 Years | 220 | 19.3% |
| 75 to 84 Years | 119 | 10.4% |
| 85 Years and Over | 9 | 0.8% |
| Total | 1,142 | 100.0% |
Housing Finances in Sleepy Hollow
Median Income by Occupancy in Sleepy Hollow
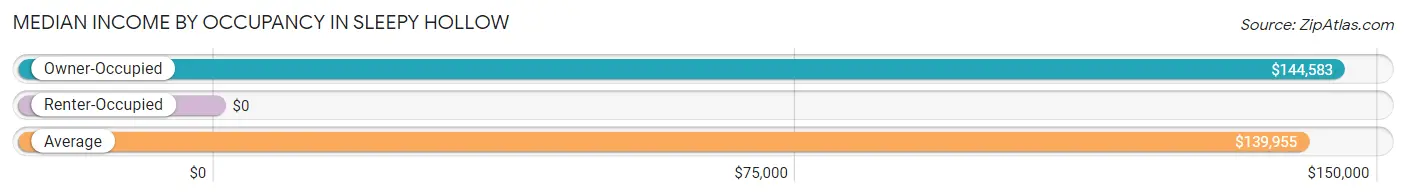
| Occupancy Type | # Households | Median Income |
| Owner-Occupied | 1,063 (93.1%) | $144,583 |
| Renter-Occupied | 79 (6.9%) | $0 |
| Average | 1,142 (100.0%) | $139,955 |
Occupancy by Householder Income Bracket in Sleepy Hollow
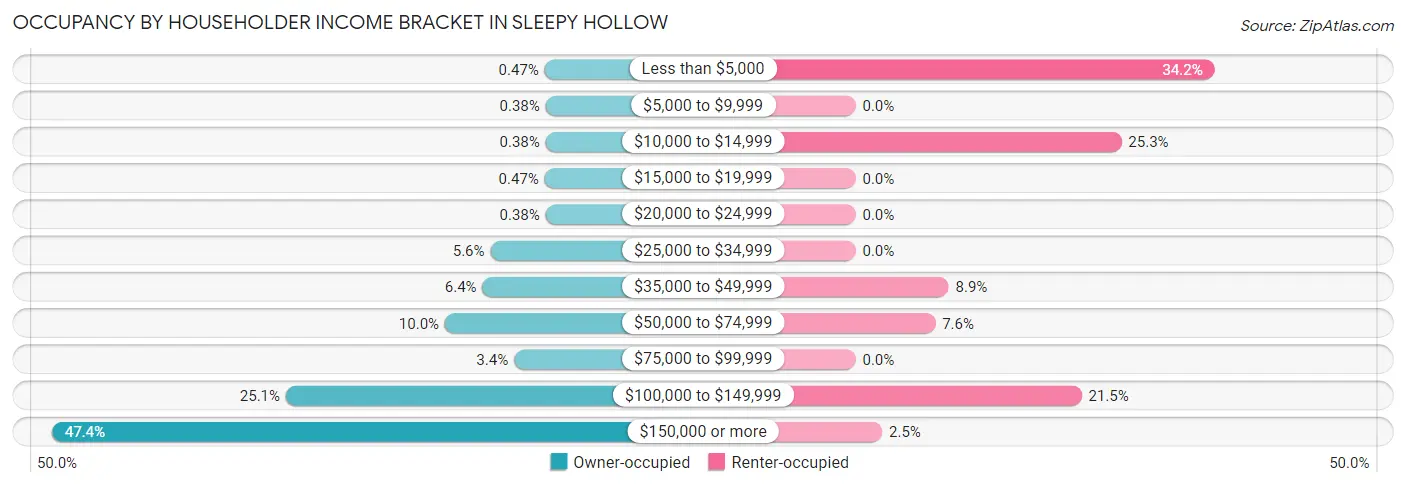
| Income Bracket | Owner-occupied | Renter-occupied |
| Less than $5,000 | 5 (0.5%) | 27 (34.2%) |
| $5,000 to $9,999 | 4 (0.4%) | 0 (0.0%) |
| $10,000 to $14,999 | 4 (0.4%) | 20 (25.3%) |
| $15,000 to $19,999 | 5 (0.5%) | 0 (0.0%) |
| $20,000 to $24,999 | 4 (0.4%) | 0 (0.0%) |
| $25,000 to $34,999 | 60 (5.6%) | 0 (0.0%) |
| $35,000 to $49,999 | 68 (6.4%) | 7 (8.9%) |
| $50,000 to $74,999 | 106 (10.0%) | 6 (7.6%) |
| $75,000 to $99,999 | 36 (3.4%) | 0 (0.0%) |
| $100,000 to $149,999 | 267 (25.1%) | 17 (21.5%) |
| $150,000 or more | 504 (47.4%) | 2 (2.5%) |
| Total | 1,063 (100.0%) | 79 (100.0%) |
Monthly Housing Cost Tiers in Sleepy Hollow
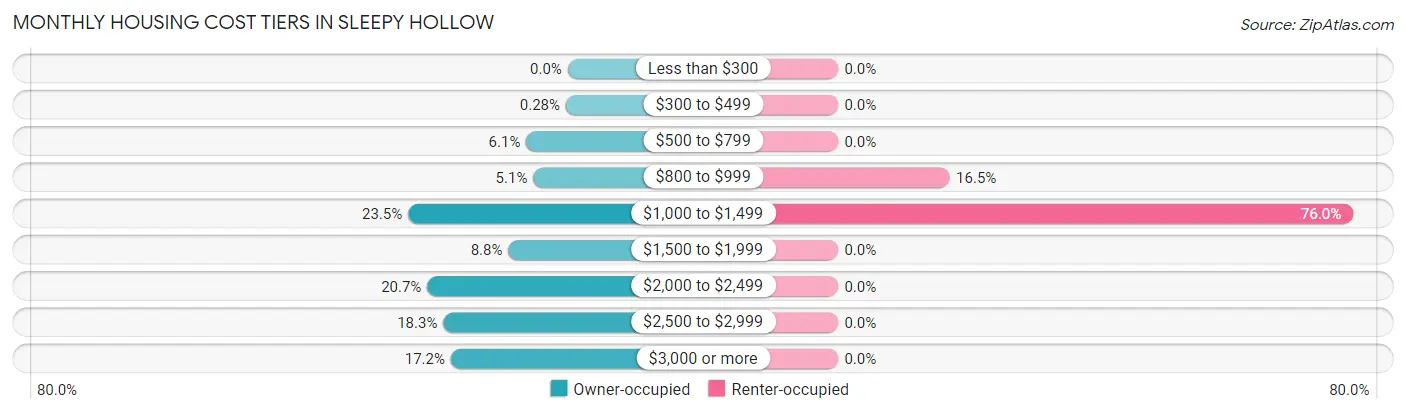
| Monthly Cost | Owner-occupied | Renter-occupied |
| Less than $300 | 0 (0.0%) | 0 (0.0%) |
| $300 to $499 | 3 (0.3%) | 0 (0.0%) |
| $500 to $799 | 65 (6.1%) | 0 (0.0%) |
| $800 to $999 | 54 (5.1%) | 13 (16.5%) |
| $1,000 to $1,499 | 250 (23.5%) | 60 (75.9%) |
| $1,500 to $1,999 | 93 (8.7%) | 0 (0.0%) |
| $2,000 to $2,499 | 220 (20.7%) | 0 (0.0%) |
| $2,500 to $2,999 | 195 (18.3%) | 0 (0.0%) |
| $3,000 or more | 183 (17.2%) | 0 (0.0%) |
| Total | 1,063 (100.0%) | 79 (100.0%) |
Physical Housing Characteristics in Sleepy Hollow
Housing Structures in Sleepy Hollow
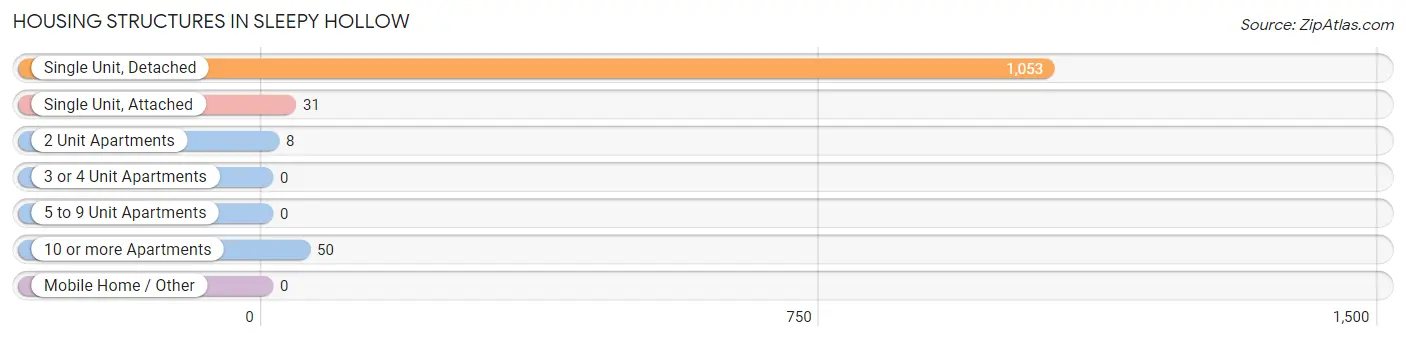
| Structure Type | # Housing Units | % Housing Units |
| Single Unit, Detached | 1,053 | 92.2% |
| Single Unit, Attached | 31 | 2.7% |
| 2 Unit Apartments | 8 | 0.7% |
| 3 or 4 Unit Apartments | 0 | 0.0% |
| 5 to 9 Unit Apartments | 0 | 0.0% |
| 10 or more Apartments | 50 | 4.4% |
| Mobile Home / Other | 0 | 0.0% |
| Total | 1,142 | 100.0% |
Housing Structures by Occupancy in Sleepy Hollow
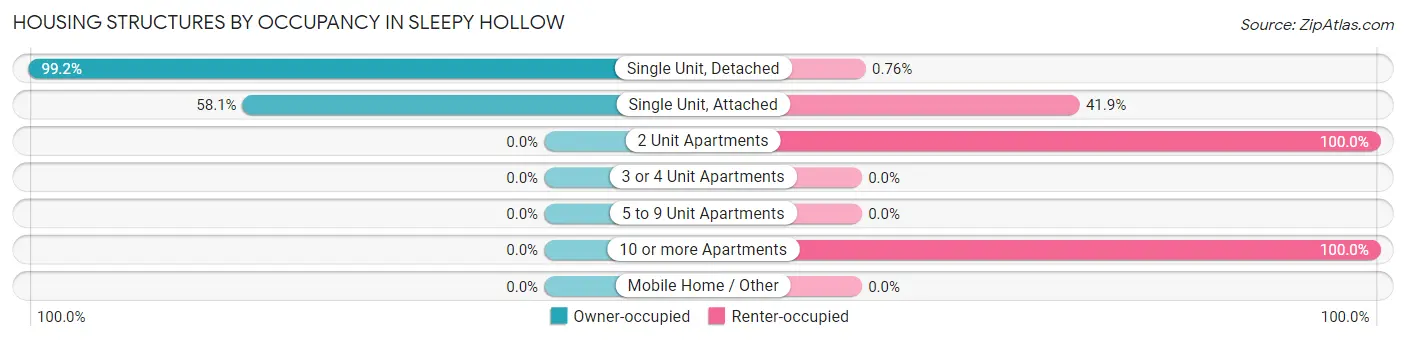
| Structure Type | Owner-occupied | Renter-occupied |
| Single Unit, Detached | 1,045 (99.2%) | 8 (0.8%) |
| Single Unit, Attached | 18 (58.1%) | 13 (41.9%) |
| 2 Unit Apartments | 0 (0.0%) | 8 (100.0%) |
| 3 or 4 Unit Apartments | 0 (0.0%) | 0 (0.0%) |
| 5 to 9 Unit Apartments | 0 (0.0%) | 0 (0.0%) |
| 10 or more Apartments | 0 (0.0%) | 50 (100.0%) |
| Mobile Home / Other | 0 (0.0%) | 0 (0.0%) |
| Total | 1,063 (93.1%) | 79 (6.9%) |
Housing Structures by Number of Rooms in Sleepy Hollow
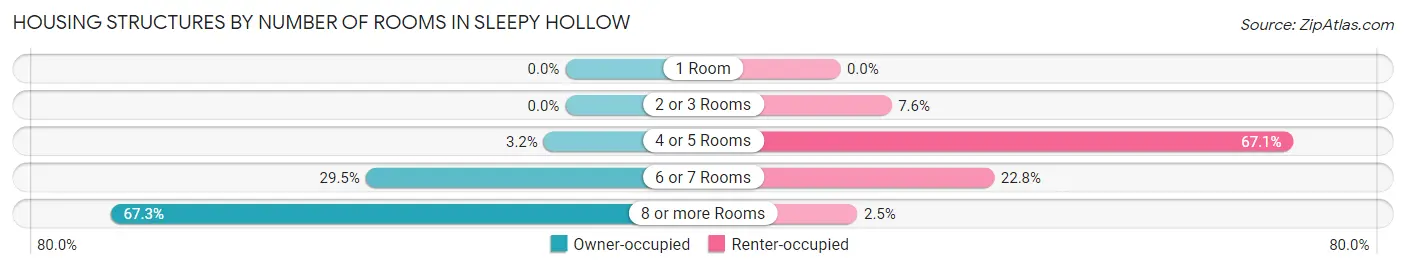
| Number of Rooms | Owner-occupied | Renter-occupied |
| 1 Room | 0 (0.0%) | 0 (0.0%) |
| 2 or 3 Rooms | 0 (0.0%) | 6 (7.6%) |
| 4 or 5 Rooms | 34 (3.2%) | 53 (67.1%) |
| 6 or 7 Rooms | 314 (29.5%) | 18 (22.8%) |
| 8 or more Rooms | 715 (67.3%) | 2 (2.5%) |
| Total | 1,063 (100.0%) | 79 (100.0%) |
Housing Structure by Heating Type in Sleepy Hollow
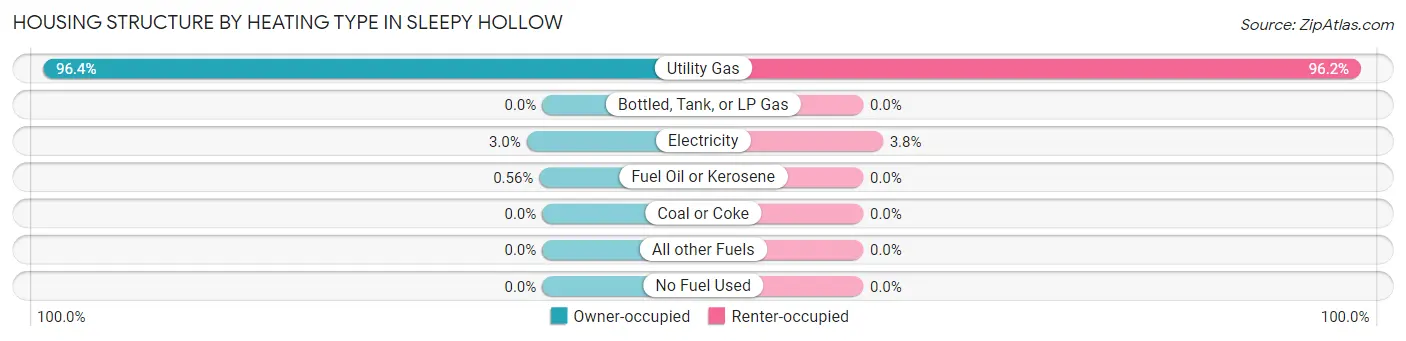
| Heating Type | Owner-occupied | Renter-occupied |
| Utility Gas | 1,025 (96.4%) | 76 (96.2%) |
| Bottled, Tank, or LP Gas | 0 (0.0%) | 0 (0.0%) |
| Electricity | 32 (3.0%) | 3 (3.8%) |
| Fuel Oil or Kerosene | 6 (0.6%) | 0 (0.0%) |
| Coal or Coke | 0 (0.0%) | 0 (0.0%) |
| All other Fuels | 0 (0.0%) | 0 (0.0%) |
| No Fuel Used | 0 (0.0%) | 0 (0.0%) |
| Total | 1,063 (100.0%) | 79 (100.0%) |
Household Vehicle Usage in Sleepy Hollow
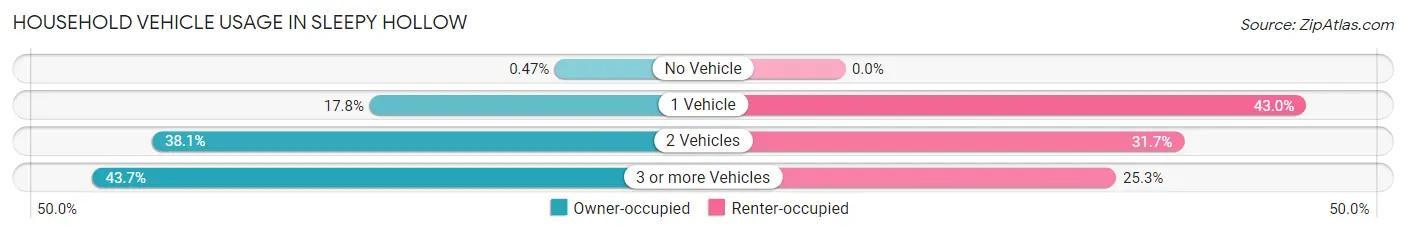
| Vehicles per Household | Owner-occupied | Renter-occupied |
| No Vehicle | 5 (0.5%) | 0 (0.0%) |
| 1 Vehicle | 189 (17.8%) | 34 (43.0%) |
| 2 Vehicles | 405 (38.1%) | 25 (31.7%) |
| 3 or more Vehicles | 464 (43.6%) | 20 (25.3%) |
| Total | 1,063 (100.0%) | 79 (100.0%) |
Real Estate & Mortgages in Sleepy Hollow
Real Estate and Mortgage Overview in Sleepy Hollow
| Characteristic | Without Mortgage | With Mortgage |
| Housing Units | 366 | 697 |
| Median Property Value | $358,600 | $349,300 |
| Median Household Income | $125,500 | $367 |
| Monthly Housing Costs | $1,122 | $157 |
| Real Estate Taxes | $8,757 | $0 |
Property Value by Mortgage Status in Sleepy Hollow
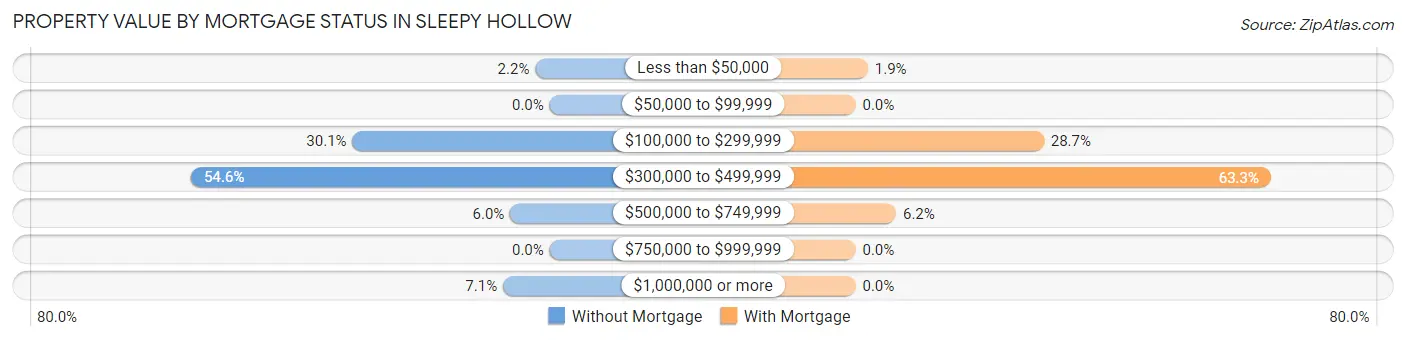
| Property Value | Without Mortgage | With Mortgage |
| Less than $50,000 | 8 (2.2%) | 13 (1.9%) |
| $50,000 to $99,999 | 0 (0.0%) | 0 (0.0%) |
| $100,000 to $299,999 | 110 (30.0%) | 200 (28.7%) |
| $300,000 to $499,999 | 200 (54.6%) | 441 (63.3%) |
| $500,000 to $749,999 | 22 (6.0%) | 43 (6.2%) |
| $750,000 to $999,999 | 0 (0.0%) | 0 (0.0%) |
| $1,000,000 or more | 26 (7.1%) | 0 (0.0%) |
| Total | 366 (100.0%) | 697 (100.0%) |
Household Income by Mortgage Status in Sleepy Hollow
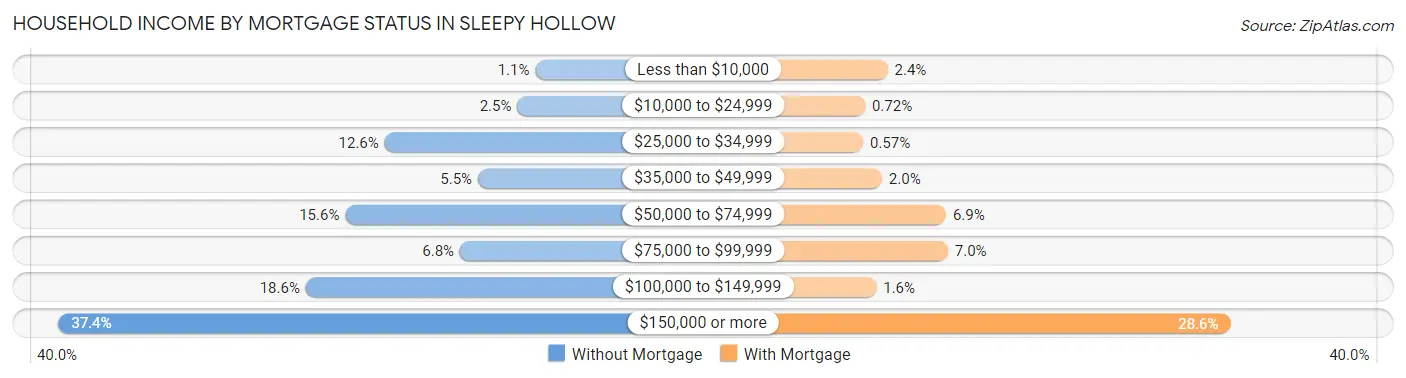
| Household Income | Without Mortgage | With Mortgage |
| Less than $10,000 | 4 (1.1%) | 17 (2.4%) |
| $10,000 to $24,999 | 9 (2.5%) | 5 (0.7%) |
| $25,000 to $34,999 | 46 (12.6%) | 4 (0.6%) |
| $35,000 to $49,999 | 20 (5.5%) | 14 (2.0%) |
| $50,000 to $74,999 | 57 (15.6%) | 48 (6.9%) |
| $75,000 to $99,999 | 25 (6.8%) | 49 (7.0%) |
| $100,000 to $149,999 | 68 (18.6%) | 11 (1.6%) |
| $150,000 or more | 137 (37.4%) | 199 (28.5%) |
| Total | 366 (100.0%) | 697 (100.0%) |
Property Value to Household Income Ratio in Sleepy Hollow
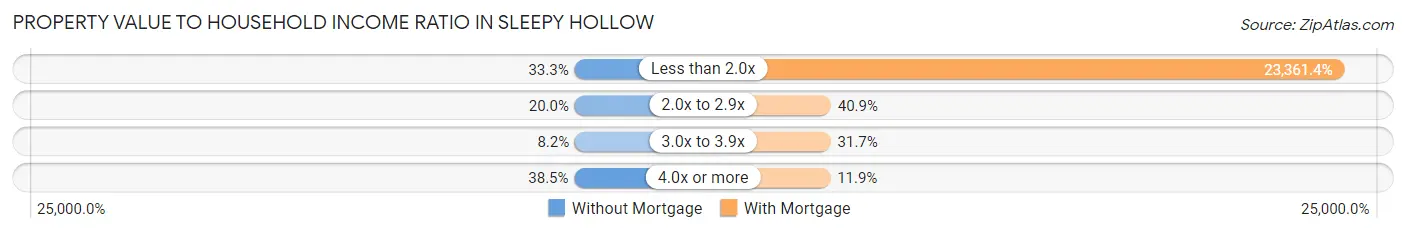
| Value-to-Income Ratio | Without Mortgage | With Mortgage |
| Less than 2.0x | 122 (33.3%) | 162,829 (23,361.4%) |
| 2.0x to 2.9x | 73 (20.0%) | 285 (40.9%) |
| 3.0x to 3.9x | 30 (8.2%) | 221 (31.7%) |
| 4.0x or more | 141 (38.5%) | 83 (11.9%) |
| Total | 366 (100.0%) | 697 (100.0%) |
Real Estate Taxes by Mortgage Status in Sleepy Hollow
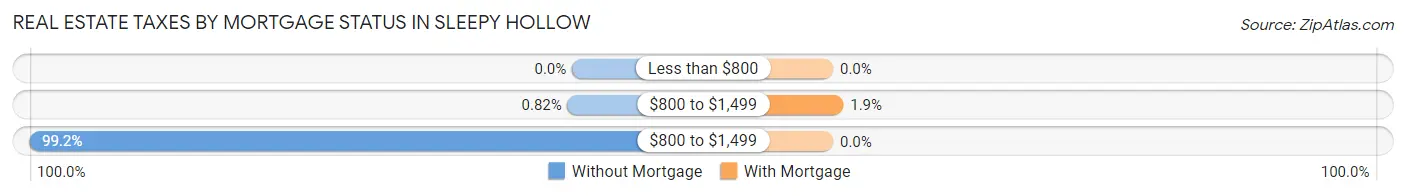
| Property Taxes | Without Mortgage | With Mortgage |
| Less than $800 | 0 (0.0%) | 0 (0.0%) |
| $800 to $1,499 | 3 (0.8%) | 13 (1.9%) |
| $800 to $1,499 | 363 (99.2%) | 0 (0.0%) |
| Total | 366 (100.0%) | 697 (100.0%) |
Health & Disability in Sleepy Hollow
Health Insurance Coverage by Age in Sleepy Hollow
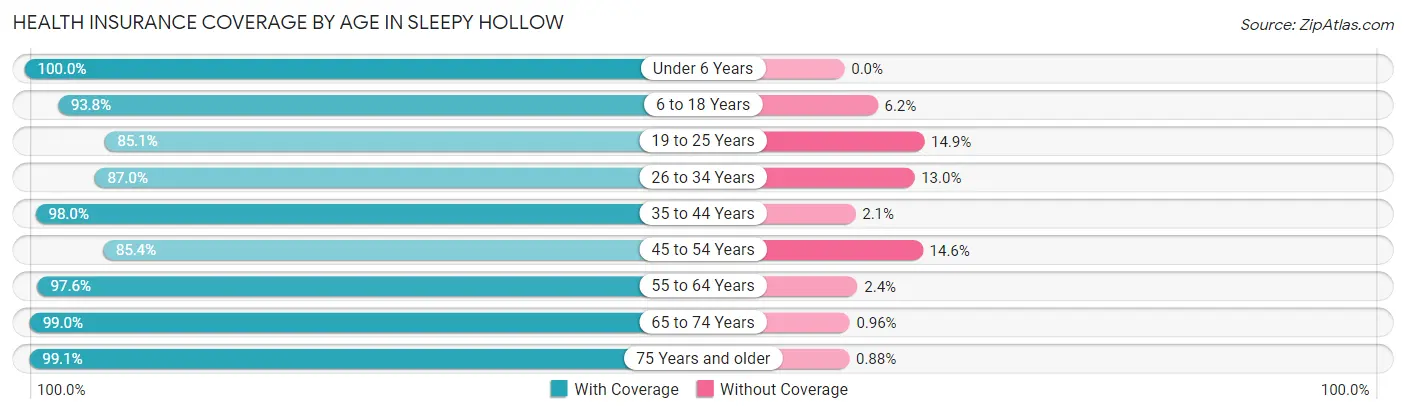
| Age Bracket | With Coverage | Without Coverage |
| Under 6 Years | 74 (100.0%) | 0 (0.0%) |
| 6 to 18 Years | 454 (93.8%) | 30 (6.2%) |
| 19 to 25 Years | 269 (85.1%) | 47 (14.9%) |
| 26 to 34 Years | 160 (87.0%) | 24 (13.0%) |
| 35 to 44 Years | 382 (98.0%) | 8 (2.1%) |
| 45 to 54 Years | 427 (85.4%) | 73 (14.6%) |
| 55 to 64 Years | 601 (97.6%) | 15 (2.4%) |
| 65 to 74 Years | 411 (99.0%) | 4 (1.0%) |
| 75 Years and older | 224 (99.1%) | 2 (0.9%) |
| Total | 3,002 (93.7%) | 203 (6.3%) |
Health Insurance Coverage by Citizenship Status in Sleepy Hollow
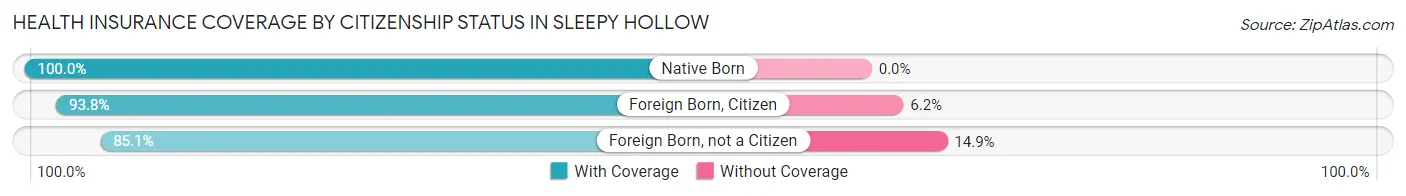
| Citizenship Status | With Coverage | Without Coverage |
| Native Born | 74 (100.0%) | 0 (0.0%) |
| Foreign Born, Citizen | 454 (93.8%) | 30 (6.2%) |
| Foreign Born, not a Citizen | 269 (85.1%) | 47 (14.9%) |
Health Insurance Coverage by Household Income in Sleepy Hollow
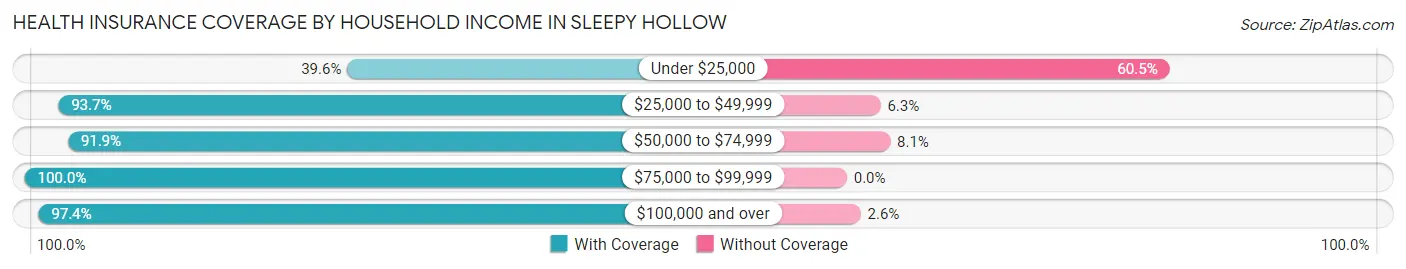
| Household Income | With Coverage | Without Coverage |
| Under $25,000 | 70 (39.6%) | 107 (60.5%) |
| $25,000 to $49,999 | 193 (93.7%) | 13 (6.3%) |
| $50,000 to $74,999 | 204 (91.9%) | 18 (8.1%) |
| $75,000 to $99,999 | 92 (100.0%) | 0 (0.0%) |
| $100,000 and over | 2,443 (97.4%) | 65 (2.6%) |
Public vs Private Health Insurance Coverage by Age in Sleepy Hollow
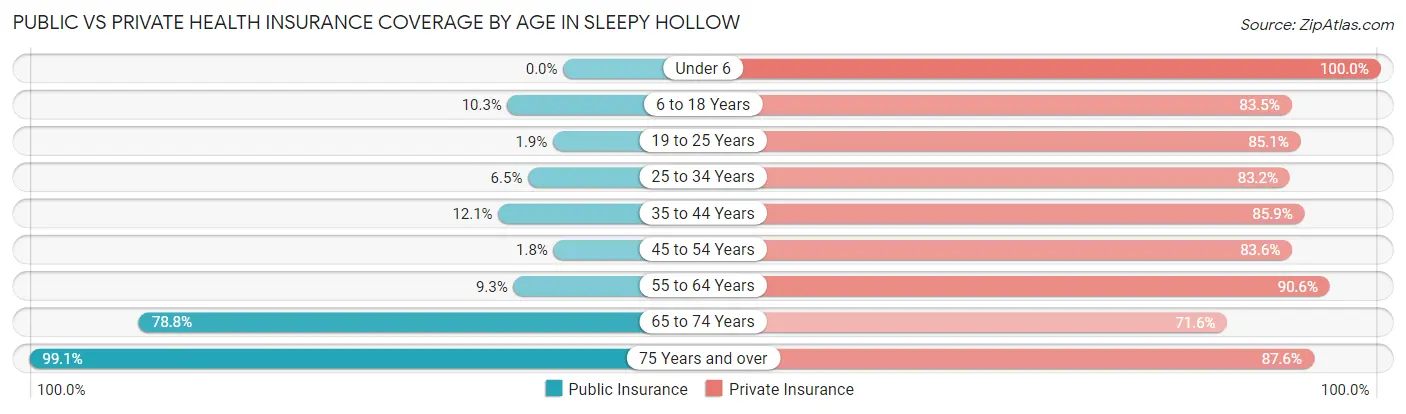
| Age Bracket | Public Insurance | Private Insurance |
| Under 6 | 0 (0.0%) | 74 (100.0%) |
| 6 to 18 Years | 50 (10.3%) | 404 (83.5%) |
| 19 to 25 Years | 6 (1.9%) | 269 (85.1%) |
| 25 to 34 Years | 12 (6.5%) | 153 (83.2%) |
| 35 to 44 Years | 47 (12.0%) | 335 (85.9%) |
| 45 to 54 Years | 9 (1.8%) | 418 (83.6%) |
| 55 to 64 Years | 57 (9.2%) | 558 (90.6%) |
| 65 to 74 Years | 327 (78.8%) | 297 (71.6%) |
| 75 Years and over | 224 (99.1%) | 198 (87.6%) |
| Total | 732 (22.8%) | 2,706 (84.4%) |
Disability Status by Sex by Age in Sleepy Hollow
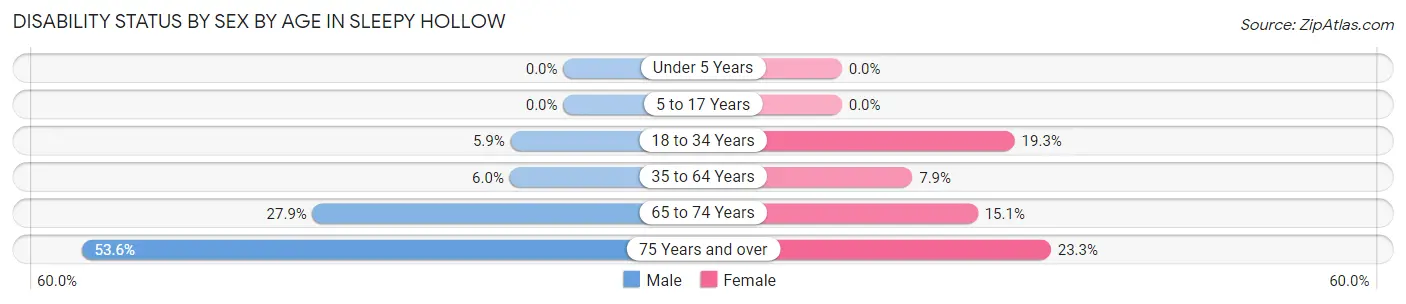
| Age Bracket | Male | Female |
| Under 5 Years | 0 (0.0%) | 0 (0.0%) |
| 5 to 17 Years | 0 (0.0%) | 0 (0.0%) |
| 18 to 34 Years | 17 (5.9%) | 46 (19.3%) |
| 35 to 64 Years | 45 (6.0%) | 59 (7.9%) |
| 65 to 74 Years | 55 (27.9%) | 33 (15.1%) |
| 75 Years and over | 59 (53.6%) | 27 (23.3%) |
Disability Class by Sex by Age in Sleepy Hollow
Disability Class: Hearing Difficulty
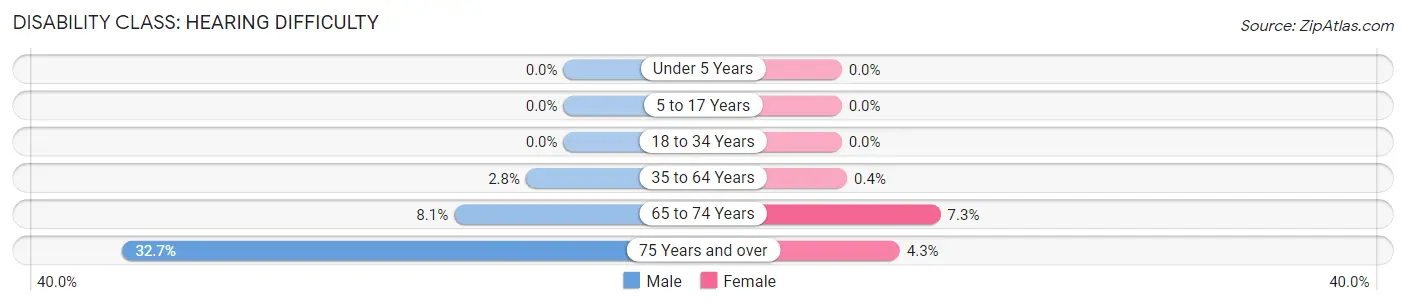
| Age Bracket | Male | Female |
| Under 5 Years | 0 (0.0%) | 0 (0.0%) |
| 5 to 17 Years | 0 (0.0%) | 0 (0.0%) |
| 18 to 34 Years | 0 (0.0%) | 0 (0.0%) |
| 35 to 64 Years | 21 (2.8%) | 3 (0.4%) |
| 65 to 74 Years | 16 (8.1%) | 16 (7.3%) |
| 75 Years and over | 36 (32.7%) | 5 (4.3%) |
Disability Class: Vision Difficulty
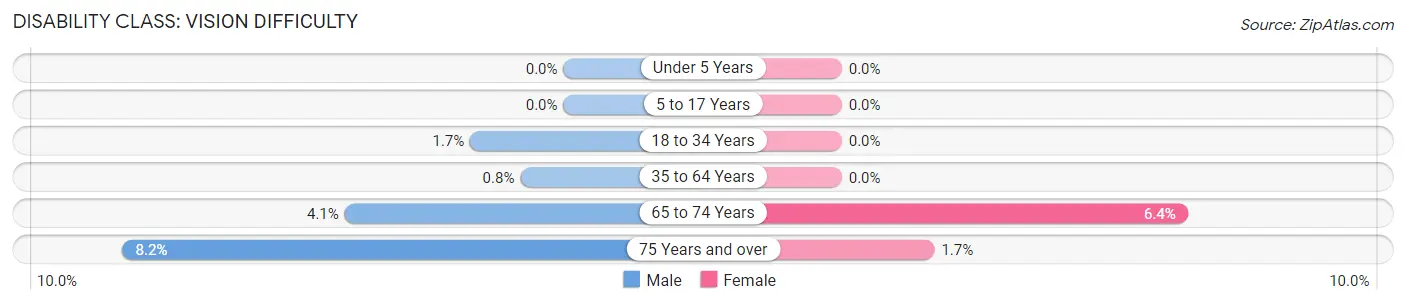
| Age Bracket | Male | Female |
| Under 5 Years | 0 (0.0%) | 0 (0.0%) |
| 5 to 17 Years | 0 (0.0%) | 0 (0.0%) |
| 18 to 34 Years | 5 (1.7%) | 0 (0.0%) |
| 35 to 64 Years | 6 (0.8%) | 0 (0.0%) |
| 65 to 74 Years | 8 (4.1%) | 14 (6.4%) |
| 75 Years and over | 9 (8.2%) | 2 (1.7%) |
Disability Class: Cognitive Difficulty
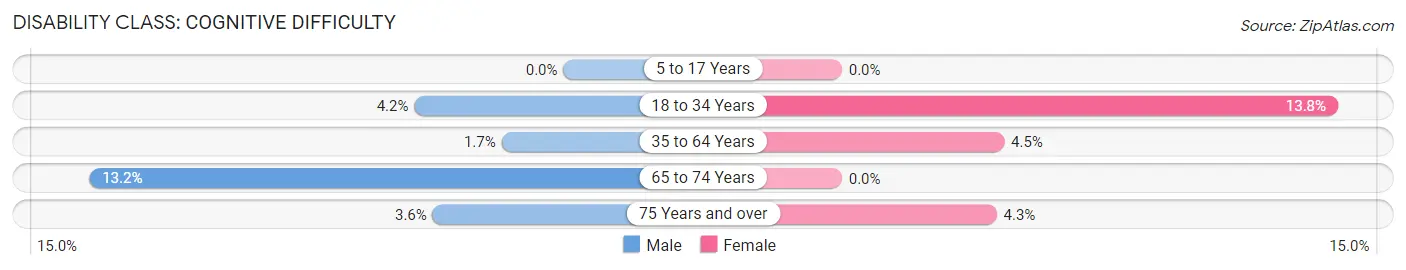
| Age Bracket | Male | Female |
| 5 to 17 Years | 0 (0.0%) | 0 (0.0%) |
| 18 to 34 Years | 12 (4.2%) | 33 (13.8%) |
| 35 to 64 Years | 13 (1.7%) | 34 (4.5%) |
| 65 to 74 Years | 26 (13.2%) | 0 (0.0%) |
| 75 Years and over | 4 (3.6%) | 5 (4.3%) |
Disability Class: Ambulatory Difficulty
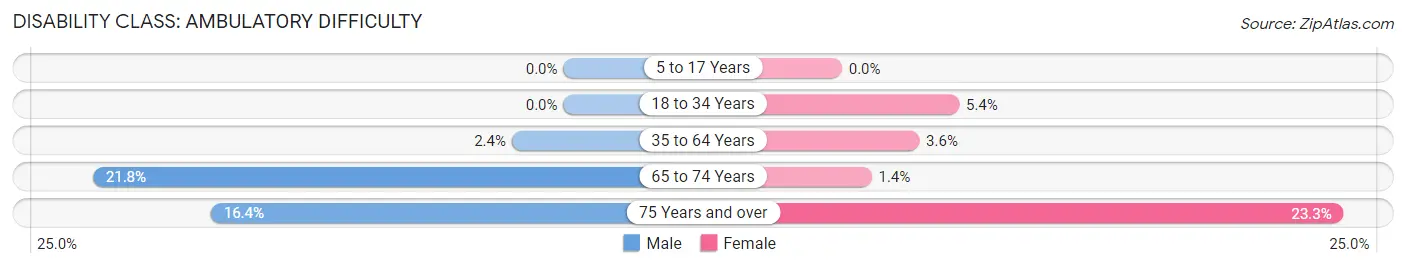
| Age Bracket | Male | Female |
| 5 to 17 Years | 0 (0.0%) | 0 (0.0%) |
| 18 to 34 Years | 0 (0.0%) | 13 (5.4%) |
| 35 to 64 Years | 18 (2.4%) | 27 (3.6%) |
| 65 to 74 Years | 43 (21.8%) | 3 (1.4%) |
| 75 Years and over | 18 (16.4%) | 27 (23.3%) |
Disability Class: Self-Care Difficulty
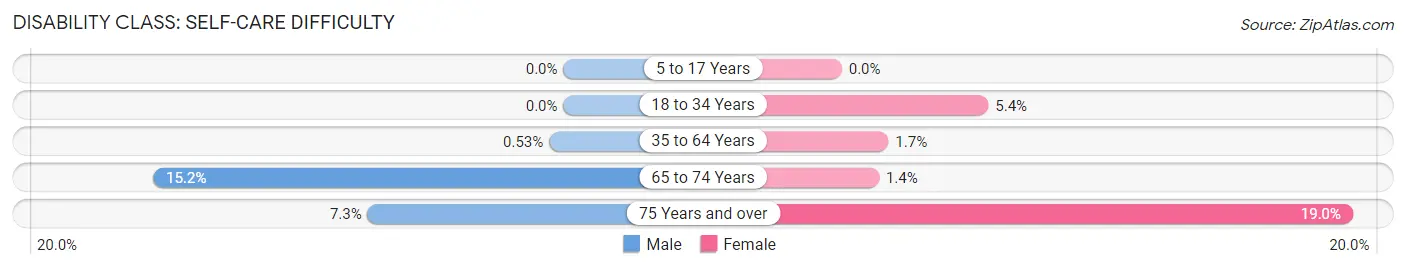
| Age Bracket | Male | Female |
| 5 to 17 Years | 0 (0.0%) | 0 (0.0%) |
| 18 to 34 Years | 0 (0.0%) | 13 (5.4%) |
| 35 to 64 Years | 4 (0.5%) | 13 (1.7%) |
| 65 to 74 Years | 30 (15.2%) | 3 (1.4%) |
| 75 Years and over | 8 (7.3%) | 22 (19.0%) |
Technology Access in Sleepy Hollow
Computing Device Access in Sleepy Hollow
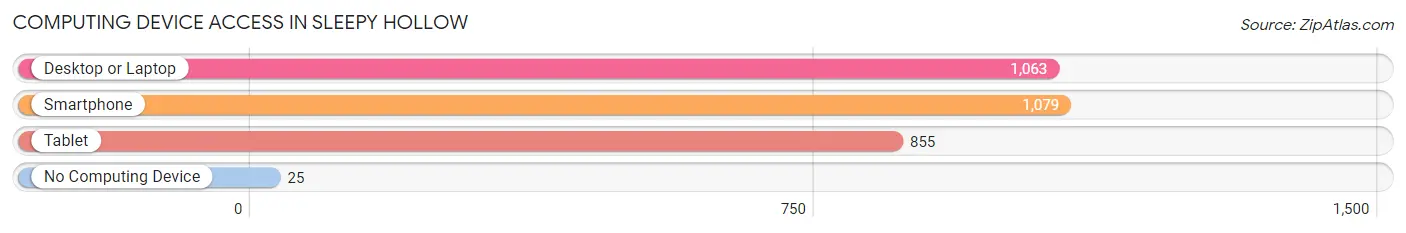
| Device Type | # Households | % Households |
| Desktop or Laptop | 1,063 | 93.1% |
| Smartphone | 1,079 | 94.5% |
| Tablet | 855 | 74.9% |
| No Computing Device | 25 | 2.2% |
| Total | 1,142 | 100.0% |
Internet Access in Sleepy Hollow
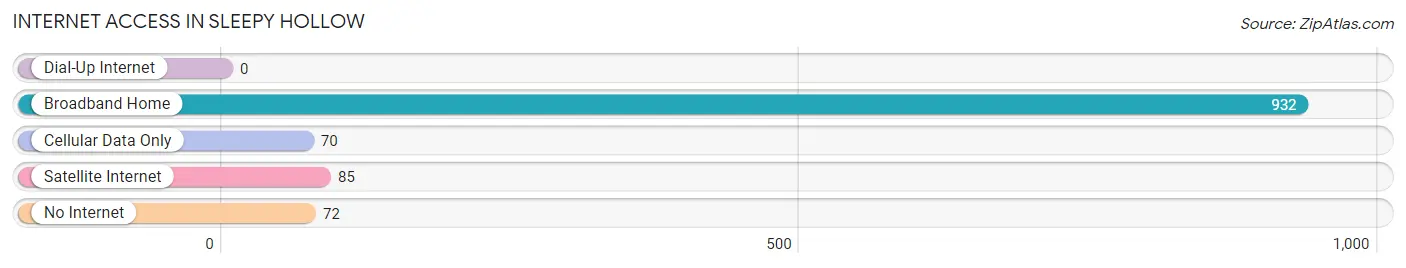
| Internet Type | # Households | % Households |
| Dial-Up Internet | 0 | 0.0% |
| Broadband Home | 932 | 81.6% |
| Cellular Data Only | 70 | 6.1% |
| Satellite Internet | 85 | 7.4% |
| No Internet | 72 | 6.3% |
| Total | 1,142 | 100.0% |
Sleepy Hollow Summary
Sleepy Hollow is a village located in Kane County, Illinois, United States. It is a small, rural community with a population of just over 4,000 people. The village is situated on the Fox River, and is part of the Chicago metropolitan area.
History
The area that is now Sleepy Hollow was first settled in the early 1800s by a group of settlers from New England. The village was originally known as “New England Settlement”, and was later renamed “Sleepy Hollow” in 1845. The name was chosen to reflect the peaceful, rural atmosphere of the area.
The village was incorporated in 1872, and the first mayor was elected in 1873. The village grew slowly over the years, and by the early 1900s, it had become a popular summer resort destination for Chicagoans.
Geography
Sleepy Hollow is located in Kane County, Illinois, about 40 miles west of Chicago. The village is situated on the Fox River, and is surrounded by rolling hills and farmland. The village is located in the Fox River Valley, and is part of the Chicago metropolitan area.
The village has a total area of 2.2 square miles, all of which is land. The village is located at an elevation of 690 feet above sea level.
Economy
The economy of Sleepy Hollow is largely based on agriculture and tourism. The village is home to several farms, which produce a variety of crops, including corn, soybeans, and wheat. The village is also home to several wineries, which produce a variety of wines.
The village is also a popular tourist destination, and is home to several attractions, including the Fox River Bike Trail, the Sleepy Hollow State Park, and the Sleepy Hollow Golf Course. The village also hosts several annual events, including the Sleepy Hollow Arts Festival and the Sleepy Hollow Scarecrow Festival.
Demographics
As of the 2010 census, the population of Sleepy Hollow was 4,068. The racial makeup of the village was 94.3% White, 1.2% African American, 0.3% Native American, 0.7% Asian, 0.1% Pacific Islander, 1.2% from other races, and 2.3% from two or more races. Hispanic or Latino of any race were 4.2% of the population.
The median household income in Sleepy Hollow was $68,958, and the median family income was $76,958. The per capita income for the village was $30,958. About 4.3% of families and 5.3% of the population were below the poverty line, including 6.3% of those under age 18 and 4.3% of those age 65 or over.
Sleepy Hollow is a small, rural village with a rich history and a strong agricultural and tourism-based economy. The village is home to a diverse population, and offers a variety of attractions and activities for visitors and residents alike.
Common Questions
What is Per Capita Income in Sleepy Hollow?
Per Capita income in Sleepy Hollow is $66,393.
What is the Median Family Income in Sleepy Hollow?
Median Family Income in Sleepy Hollow is $149,419.
What is the Median Household income in Sleepy Hollow?
Median Household Income in Sleepy Hollow is $139,955.
What is Income or Wage Gap in Sleepy Hollow?
Income or Wage Gap in Sleepy Hollow is 31.2%.
Women in Sleepy Hollow earn 68.8 cents for every dollar earned by a man.
What is Inequality or Gini Index in Sleepy Hollow?
Inequality or Gini Index in Sleepy Hollow is 0.46.
What is the Total Population of Sleepy Hollow?
Total Population of Sleepy Hollow is 3,205.
What is the Total Male Population of Sleepy Hollow?
Total Male Population of Sleepy Hollow is 1,569.
What is the Total Female Population of Sleepy Hollow?
Total Female Population of Sleepy Hollow is 1,636.
What is the Ratio of Males per 100 Females in Sleepy Hollow?
There are 95.90 Males per 100 Females in Sleepy Hollow.
What is the Ratio of Females per 100 Males in Sleepy Hollow?
There are 104.27 Females per 100 Males in Sleepy Hollow.
What is the Median Population Age in Sleepy Hollow?
Median Population Age in Sleepy Hollow is 48.4 Years.
What is the Average Family Size in Sleepy Hollow
Average Family Size in Sleepy Hollow is 3.1 People.
What is the Average Household Size in Sleepy Hollow
Average Household Size in Sleepy Hollow is 2.8 People.
How Large is the Labor Force in Sleepy Hollow?
There are 1,856 People in the Labor Forcein in Sleepy Hollow.
What is the Percentage of People in the Labor Force in Sleepy Hollow?
67.1% of People are in the Labor Force in Sleepy Hollow.
What is the Unemployment Rate in Sleepy Hollow?
Unemployment Rate in Sleepy Hollow is 1.9%.