Palermo, CA Map & Demographics
Palermo Map
Palermo Overview
$29,064
PER CAPITA INCOME
$63,980
AVG FAMILY INCOME
$46,905
AVG HOUSEHOLD INCOME
13.5%
WAGE / INCOME GAP [ % ]
86.5¢/ $1
WAGE / INCOME GAP [ $ ]
0.49
INEQUALITY / GINI INDEX
5,516
TOTAL POPULATION
2,952
MALE POPULATION
2,564
FEMALE POPULATION
115.13
MALES / 100 FEMALES
86.86
FEMALES / 100 MALES
40.6
MEDIAN AGE
3.2
AVG FAMILY SIZE
2.6
AVG HOUSEHOLD SIZE
2,460
LABOR FORCE [ PEOPLE ]
55.8%
PERCENT IN LABOR FORCE
11.7%
UNEMPLOYMENT RATE
Palermo Zip Codes
Palermo Area Codes
Income in Palermo
Income Overview in Palermo
Per Capita Income in Palermo is $29,064, while median incomes of families and households are $63,980 and $46,905 respectively.
| Characteristic | Number | Measure |
| Per Capita Income | 5,516 | $29,064 |
| Median Family Income | 1,445 | $63,980 |
| Mean Family Income | 1,445 | $86,669 |
| Median Household Income | 2,088 | $46,905 |
| Mean Household Income | 2,088 | $74,029 |
| Income Deficit | 1,445 | $0 |
| Wage / Income Gap (%) | 5,516 | 13.46% |
| Wage / Income Gap ($) | 5,516 | 86.54¢ per $1 |
| Gini / Inequality Index | 5,516 | 0.49 |
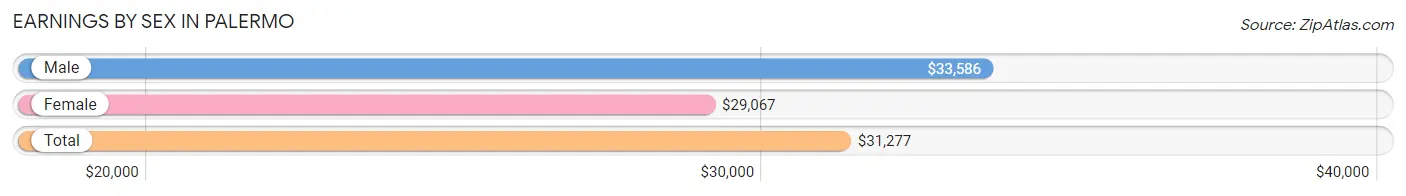
Earnings by Sex in Palermo
Average Earnings in Palermo are $31,277, $33,586 for men and $29,067 for women, a difference of 13.5%.
| Sex | Number | Average Earnings |
| Male | 1,427 (56.3%) | $33,586 |
| Female | 1,108 (43.7%) | $29,067 |
| Total | 2,535 (100.0%) | $31,277 |
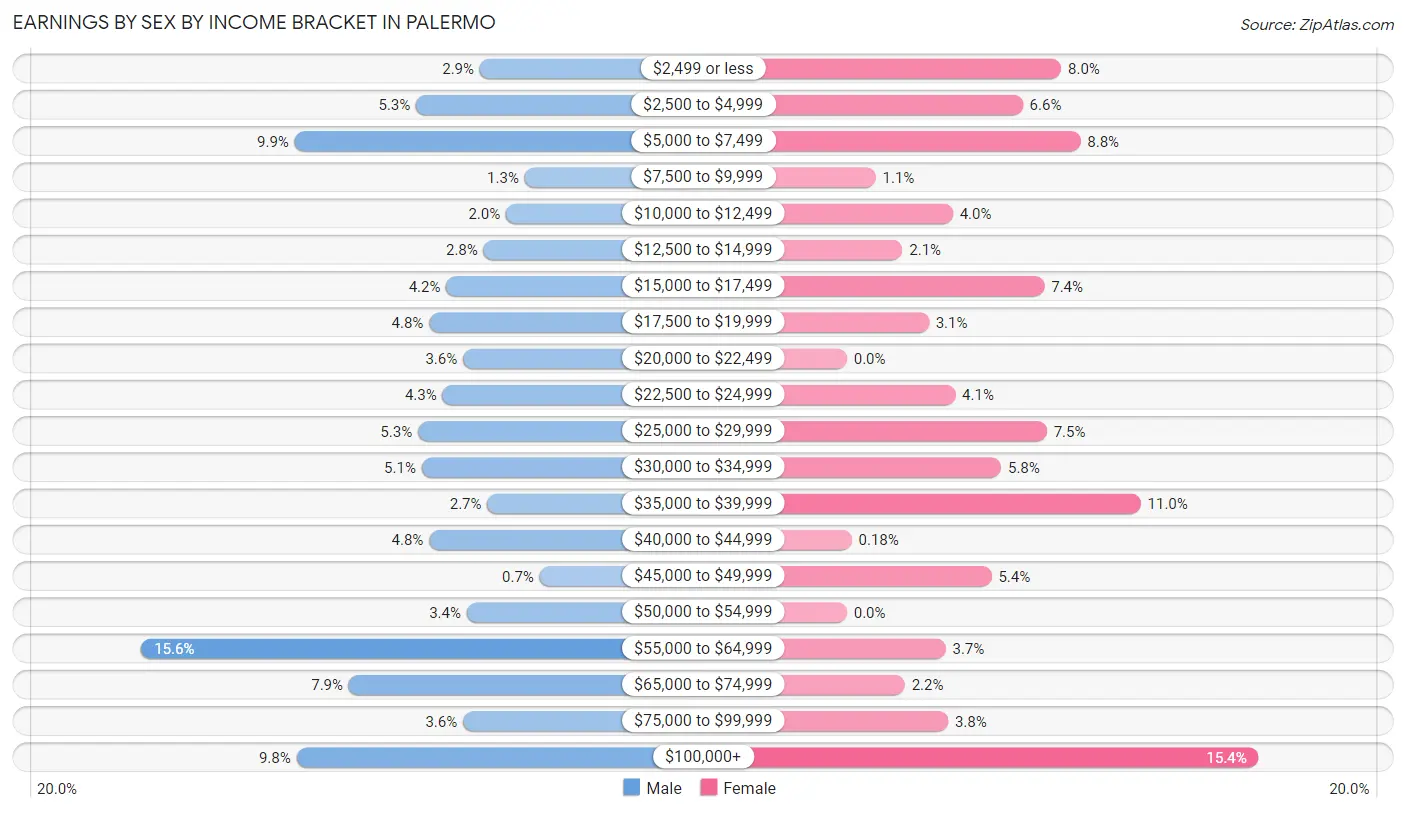
Earnings by Sex by Income Bracket in Palermo
The most common earnings brackets in Palermo are $55,000 to $64,999 for men (223 | 15.6%) and $100,000+ for women (171 | 15.4%).
| Income | Male | Female |
| $2,499 or less | 42 (2.9%) | 89 (8.0%) |
| $2,500 to $4,999 | 76 (5.3%) | 73 (6.6%) |
| $5,000 to $7,499 | 141 (9.9%) | 97 (8.7%) |
| $7,500 to $9,999 | 18 (1.3%) | 12 (1.1%) |
| $10,000 to $12,499 | 28 (2.0%) | 44 (4.0%) |
| $12,500 to $14,999 | 40 (2.8%) | 23 (2.1%) |
| $15,000 to $17,499 | 60 (4.2%) | 82 (7.4%) |
| $17,500 to $19,999 | 69 (4.8%) | 34 (3.1%) |
| $20,000 to $22,499 | 51 (3.6%) | 0 (0.0%) |
| $22,500 to $24,999 | 62 (4.3%) | 45 (4.1%) |
| $25,000 to $29,999 | 75 (5.3%) | 83 (7.5%) |
| $30,000 to $34,999 | 73 (5.1%) | 64 (5.8%) |
| $35,000 to $39,999 | 38 (2.7%) | 122 (11.0%) |
| $40,000 to $44,999 | 69 (4.8%) | 2 (0.2%) |
| $45,000 to $49,999 | 10 (0.7%) | 60 (5.4%) |
| $50,000 to $54,999 | 49 (3.4%) | 0 (0.0%) |
| $55,000 to $64,999 | 223 (15.6%) | 41 (3.7%) |
| $65,000 to $74,999 | 112 (7.9%) | 24 (2.2%) |
| $75,000 to $99,999 | 51 (3.6%) | 42 (3.8%) |
| $100,000+ | 140 (9.8%) | 171 (15.4%) |
| Total | 1,427 (100.0%) | 1,108 (100.0%) |
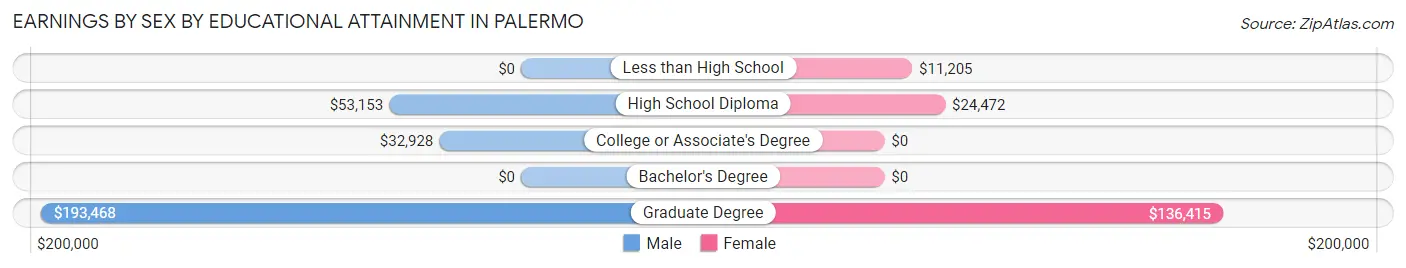
Earnings by Sex by Educational Attainment in Palermo
Average earnings in Palermo are $34,737 for men and $33,892 for women, a difference of 2.4%. Men with an educational attainment of graduate degree enjoy the highest average annual earnings of $193,468, while those with college or associate's degree education earn the least with $32,928. Women with an educational attainment of graduate degree earn the most with the average annual earnings of $136,415, while those with less than high school education have the smallest earnings of $11,205.
| Educational Attainment | Male Income | Female Income |
| Less than High School | - | - |
| High School Diploma | $53,153 | $24,472 |
| College or Associate's Degree | $32,928 | $0 |
| Bachelor's Degree | - | - |
| Graduate Degree | $193,468 | $136,415 |
| Total | $34,737 | $33,892 |
Family Income in Palermo
Family Income Brackets in Palermo
According to the Palermo family income data, there are 259 families falling into the $50,000 to $74,999 income range, which is the most common income bracket and makes up 17.9% of all families. Conversely, the less than $10,000 income bracket is the least frequent group with only 38 families (2.6%) belonging to this category.
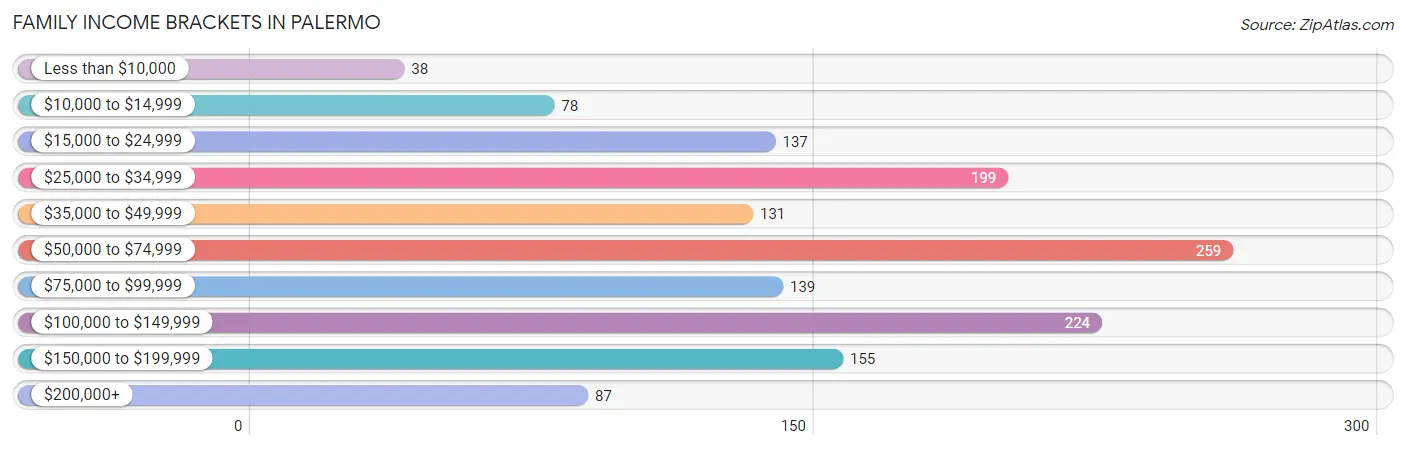
| Income Bracket | # Families | % Families |
| Less than $10,000 | 38 | 2.6% |
| $10,000 to $14,999 | 78 | 5.4% |
| $15,000 to $24,999 | 137 | 9.5% |
| $25,000 to $34,999 | 199 | 13.8% |
| $35,000 to $49,999 | 131 | 9.1% |
| $50,000 to $74,999 | 259 | 17.9% |
| $75,000 to $99,999 | 139 | 9.6% |
| $100,000 to $149,999 | 224 | 15.5% |
| $150,000 to $199,999 | 155 | 10.7% |
| $200,000+ | 87 | 6.0% |
Family Income by Famaliy Size in Palermo
4-person families (237 | 16.4%) account for the highest median family income in Palermo with $102,083 per family, while 2-person families (820 | 56.8%) have the highest median income of $32,336 per family member.
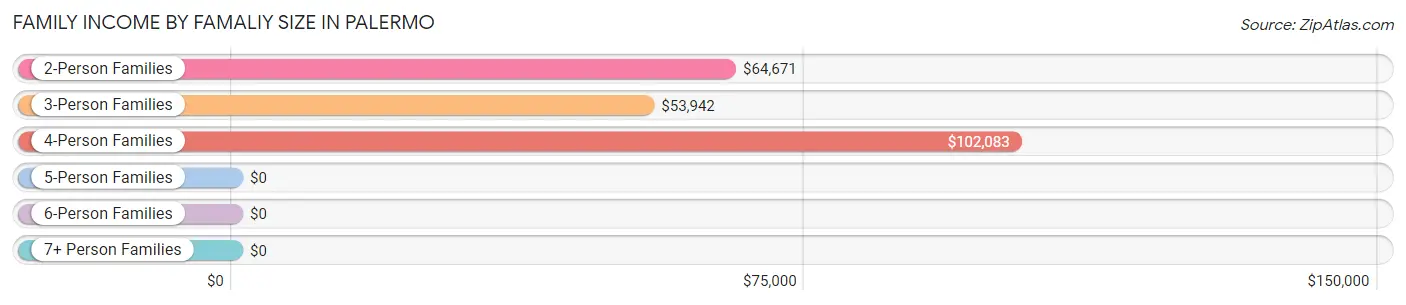
| Income Bracket | # Families | Median Income |
| 2-Person Families | 820 (56.8%) | $64,671 |
| 3-Person Families | 147 (10.2%) | $53,942 |
| 4-Person Families | 237 (16.4%) | $102,083 |
| 5-Person Families | 180 (12.5%) | $0 |
| 6-Person Families | 61 (4.2%) | $0 |
| 7+ Person Families | 0 (0.0%) | $0 |
| Total | 1,445 (100.0%) | $63,980 |
Family Income by Number of Earners in Palermo
The median family income in Palermo is $63,980, with families comprising 3+ earners (174) having the highest median family income of $99,444, while families with no earners (362) have the lowest median family income of $24,597, accounting for 12.0% and 25.1% of families, respectively.
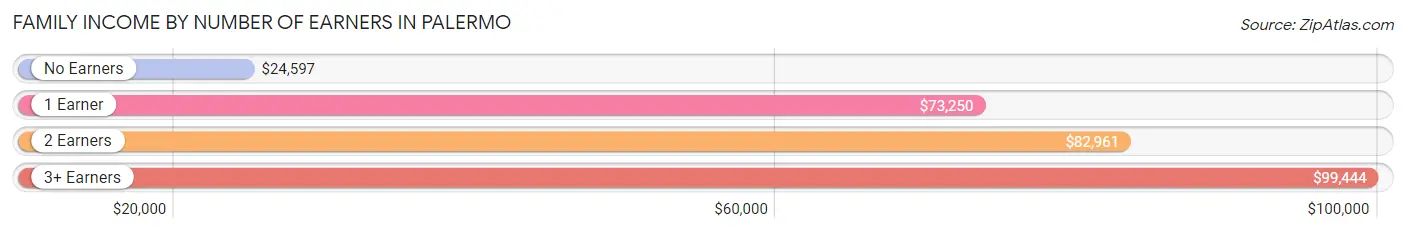
| Number of Earners | # Families | Median Income |
| No Earners | 362 (25.1%) | $24,597 |
| 1 Earner | 360 (24.9%) | $73,250 |
| 2 Earners | 549 (38.0%) | $82,961 |
| 3+ Earners | 174 (12.0%) | $99,444 |
| Total | 1,445 (100.0%) | $63,980 |
Household Income in Palermo
Household Income Brackets in Palermo
With 326 households falling in the category, the $50,000 to $74,999 income range is the most frequent in Palermo, accounting for 15.6% of all households. In contrast, only 100 households (4.8%) fall into the less than $10,000 income bracket, making it the least populous group.
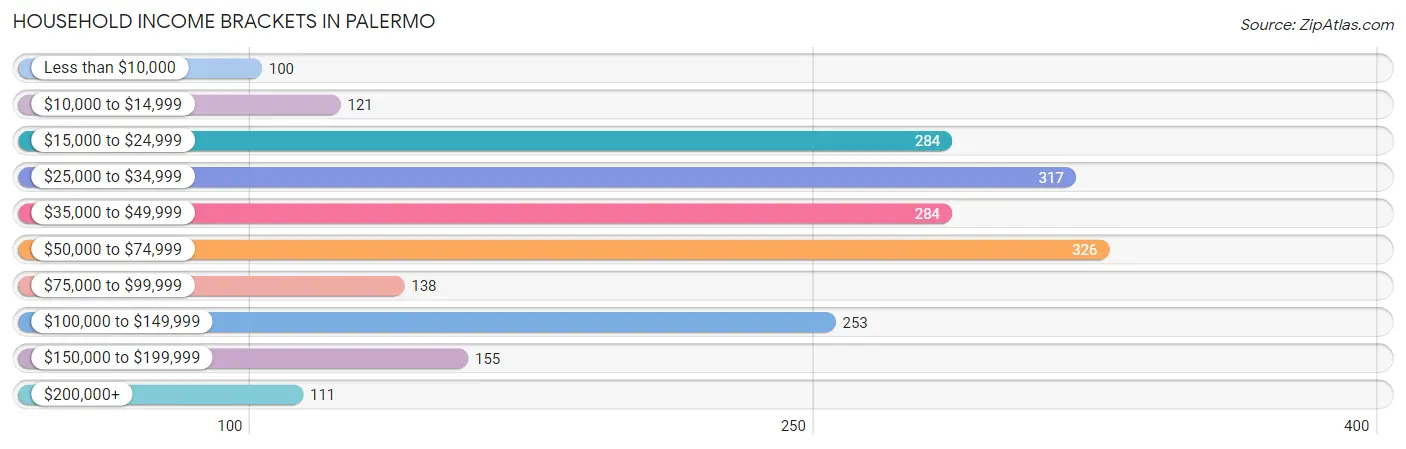
| Income Bracket | # Households | % Households |
| Less than $10,000 | 100 | 4.8% |
| $10,000 to $14,999 | 121 | 5.8% |
| $15,000 to $24,999 | 284 | 13.6% |
| $25,000 to $34,999 | 317 | 15.2% |
| $35,000 to $49,999 | 284 | 13.6% |
| $50,000 to $74,999 | 326 | 15.6% |
| $75,000 to $99,999 | 138 | 6.6% |
| $100,000 to $149,999 | 253 | 12.1% |
| $150,000 to $199,999 | 155 | 7.4% |
| $200,000+ | 111 | 5.3% |
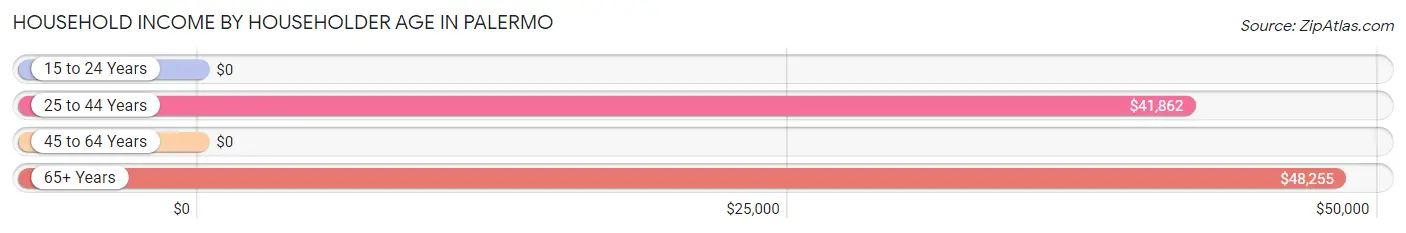
Household Income by Householder Age in Palermo
The median household income in Palermo is $46,905, with the highest median household income of $48,255 found in the 65+ years age bracket for the primary householder. A total of 719 households (34.4%) fall into this category. Meanwhile, the 15 to 24 years age bracket for the primary householder has the lowest median household income of $0, with 42 households (2.0%) in this group.
| Income Bracket | # Households | Median Income |
| 15 to 24 Years | 42 (2.0%) | $0 |
| 25 to 44 Years | 615 (29.4%) | $41,862 |
| 45 to 64 Years | 712 (34.1%) | $0 |
| 65+ Years | 719 (34.4%) | $48,255 |
| Total | 2,088 (100.0%) | $46,905 |
Poverty in Palermo
Income Below Poverty by Sex and Age in Palermo
With 20.6% poverty level for males and 22.7% for females among the residents of Palermo, 12 to 14 year old males and under 5 year old females are the most vulnerable to poverty, with 21 males (84.0%) and 111 females (67.3%) in their respective age groups living below the poverty level.
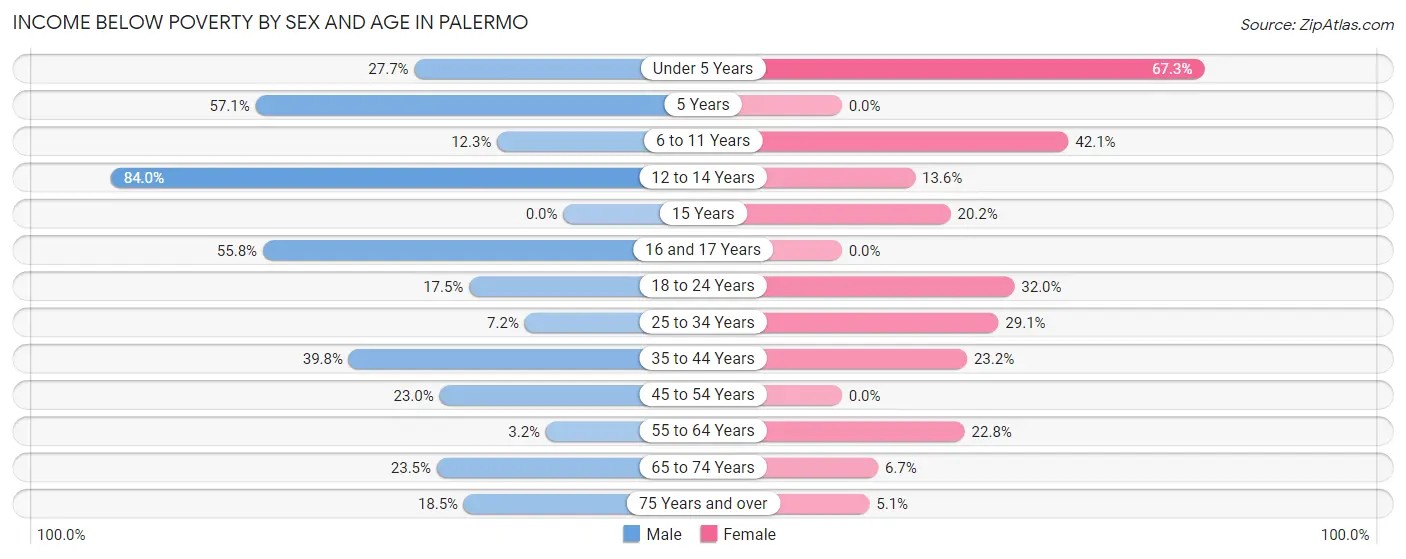
| Age Bracket | Male | Female |
| Under 5 Years | 60 (27.7%) | 111 (67.3%) |
| 5 Years | 60 (57.1%) | 0 (0.0%) |
| 6 to 11 Years | 20 (12.3%) | 90 (42.1%) |
| 12 to 14 Years | 21 (84.0%) | 14 (13.6%) |
| 15 Years | 0 (0.0%) | 21 (20.2%) |
| 16 and 17 Years | 29 (55.8%) | 0 (0.0%) |
| 18 to 24 Years | 36 (17.5%) | 49 (32.0%) |
| 25 to 34 Years | 35 (7.2%) | 75 (29.1%) |
| 35 to 44 Years | 133 (39.8%) | 79 (23.2%) |
| 45 to 54 Years | 74 (23.0%) | 0 (0.0%) |
| 55 to 64 Years | 15 (3.2%) | 106 (22.8%) |
| 65 to 74 Years | 93 (23.5%) | 28 (6.7%) |
| 75 Years and over | 31 (18.4%) | 9 (5.1%) |
| Total | 607 (20.6%) | 582 (22.7%) |
Income Above Poverty by Sex and Age in Palermo
According to the poverty statistics in Palermo, males aged 15 years and females aged 16 and 17 years are the age groups that are most secure financially, with 100.0% of males and 100.0% of females in these age groups living above the poverty line.
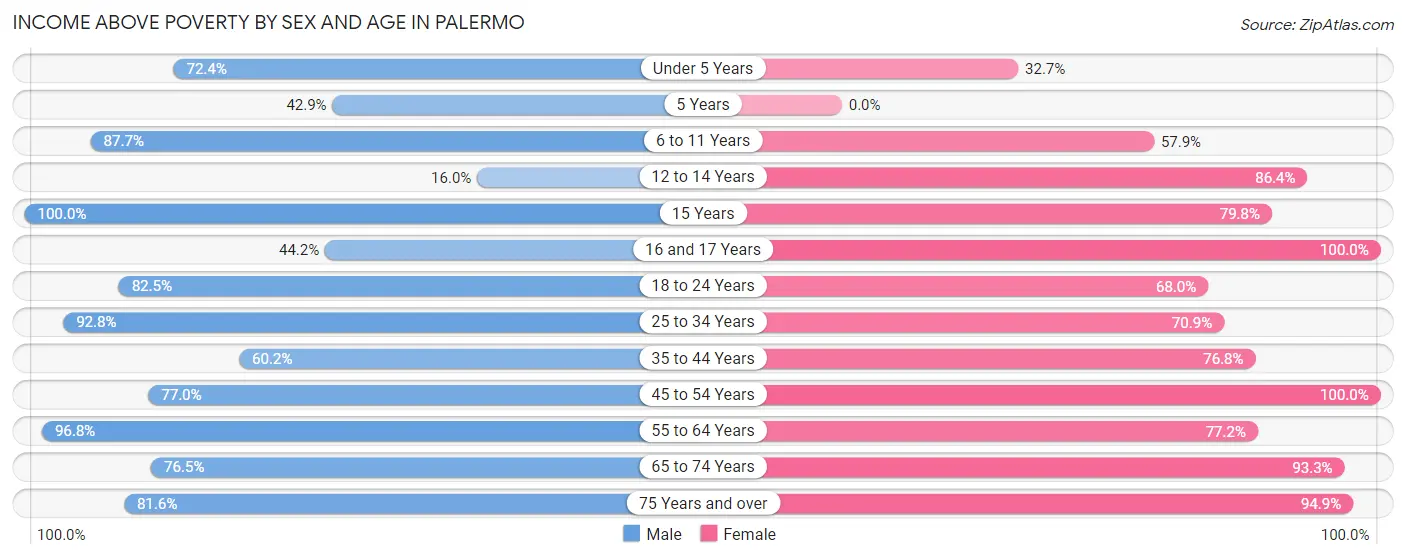
| Age Bracket | Male | Female |
| Under 5 Years | 157 (72.4%) | 54 (32.7%) |
| 5 Years | 45 (42.9%) | 0 (0.0%) |
| 6 to 11 Years | 143 (87.7%) | 124 (57.9%) |
| 12 to 14 Years | 4 (16.0%) | 89 (86.4%) |
| 15 Years | 12 (100.0%) | 83 (79.8%) |
| 16 and 17 Years | 23 (44.2%) | 71 (100.0%) |
| 18 to 24 Years | 170 (82.5%) | 104 (68.0%) |
| 25 to 34 Years | 453 (92.8%) | 183 (70.9%) |
| 35 to 44 Years | 201 (60.2%) | 261 (76.8%) |
| 45 to 54 Years | 248 (77.0%) | 98 (100.0%) |
| 55 to 64 Years | 449 (96.8%) | 359 (77.2%) |
| 65 to 74 Years | 303 (76.5%) | 389 (93.3%) |
| 75 Years and over | 137 (81.6%) | 167 (94.9%) |
| Total | 2,345 (79.4%) | 1,982 (77.3%) |
Income Below Poverty Among Married-Couple Families in Palermo
The poverty statistics for married-couple families in Palermo show that 15.3% or 153 of the total 998 families live below the poverty line. Families with 3 or 4 children have the highest poverty rate of 50.7%, comprising of 75 families. On the other hand, families with no children have the lowest poverty rate of 7.3%, which includes 46 families.
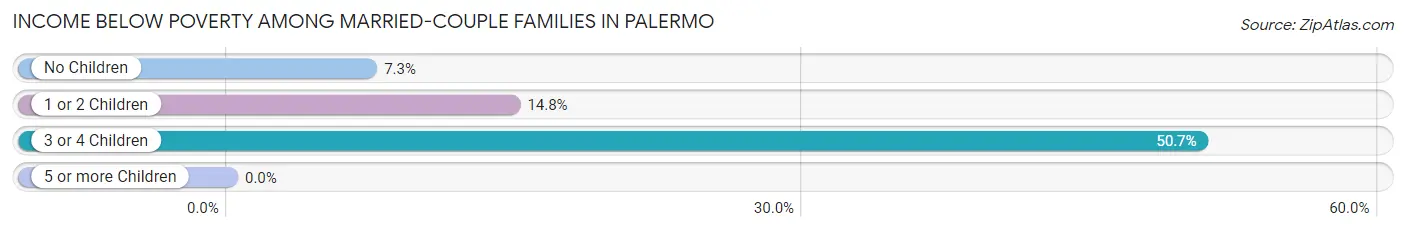
| Children | Above Poverty | Below Poverty |
| No Children | 587 (92.7%) | 46 (7.3%) |
| 1 or 2 Children | 185 (85.3%) | 32 (14.7%) |
| 3 or 4 Children | 73 (49.3%) | 75 (50.7%) |
| 5 or more Children | 0 (0.0%) | 0 (0.0%) |
| Total | 845 (84.7%) | 153 (15.3%) |
Income Below Poverty Among Single-Parent Households in Palermo
According to the poverty data in Palermo, 17.4% or 39 single-father households and 21.5% or 48 single-mother households are living below the poverty line. Among single-father households, those with 1 or 2 children have the highest poverty rate, with 39 households (62.9%) experiencing poverty. Likewise, among single-mother households, those with 1 or 2 children have the highest poverty rate, with 48 households (38.7%) falling below the poverty line.
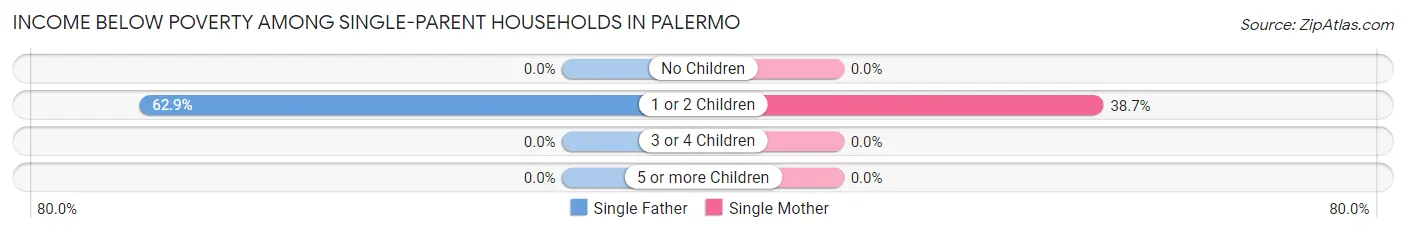
| Children | Single Father | Single Mother |
| No Children | 0 (0.0%) | 0 (0.0%) |
| 1 or 2 Children | 39 (62.9%) | 48 (38.7%) |
| 3 or 4 Children | 0 (0.0%) | 0 (0.0%) |
| 5 or more Children | 0 (0.0%) | 0 (0.0%) |
| Total | 39 (17.4%) | 48 (21.5%) |
Income Below Poverty Among Married-Couple vs Single-Parent Households in Palermo
The poverty data for Palermo shows that 153 of the married-couple family households (15.3%) and 87 of the single-parent households (19.5%) are living below the poverty level. Within the married-couple family households, those with 3 or 4 children have the highest poverty rate, with 75 households (50.7%) falling below the poverty line. Among the single-parent households, those with 1 or 2 children have the highest poverty rate, with 87 household (46.8%) living below poverty.
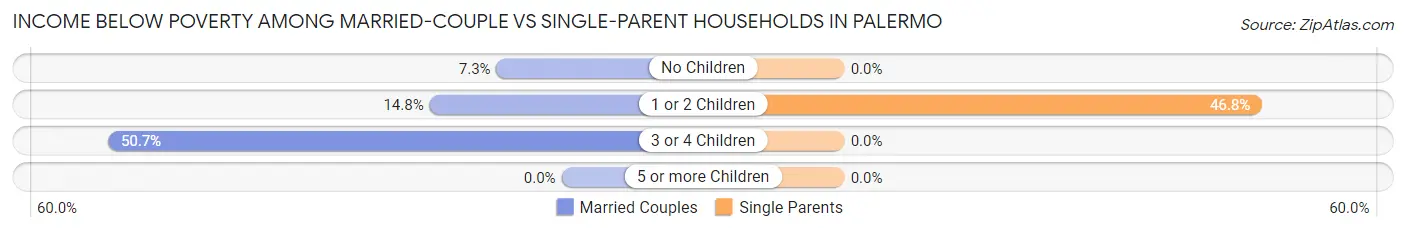
| Children | Married-Couple Families | Single-Parent Households |
| No Children | 46 (7.3%) | 0 (0.0%) |
| 1 or 2 Children | 32 (14.7%) | 87 (46.8%) |
| 3 or 4 Children | 75 (50.7%) | 0 (0.0%) |
| 5 or more Children | 0 (0.0%) | 0 (0.0%) |
| Total | 153 (15.3%) | 87 (19.5%) |
Race in Palermo
The most populous races in Palermo are White / Caucasian (3,774 | 68.4%), Hispanic or Latino (1,217 | 22.1%), and Two or more Races (679 | 12.3%).
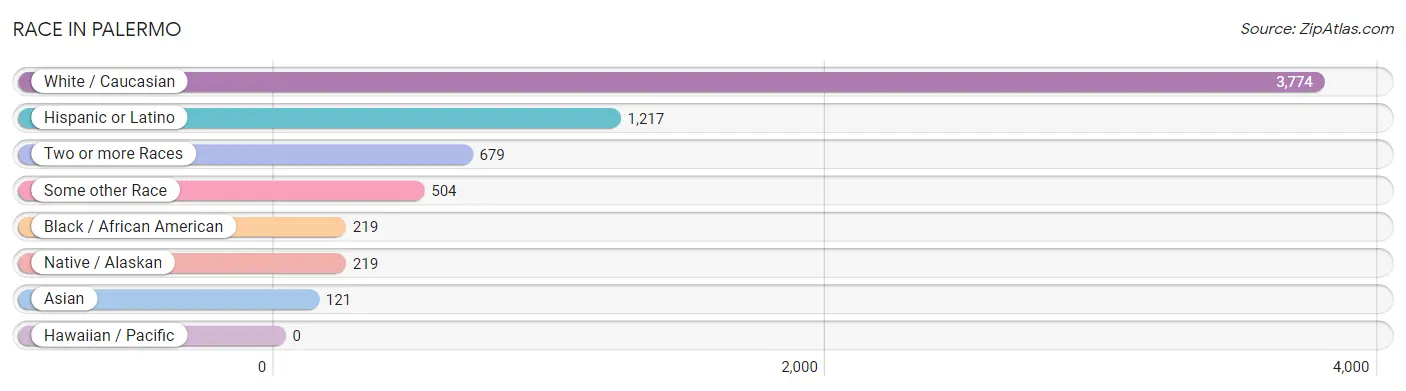
| Race | # Population | % Population |
| Asian | 121 | 2.2% |
| Black / African American | 219 | 4.0% |
| Hawaiian / Pacific | 0 | 0.0% |
| Hispanic or Latino | 1,217 | 22.1% |
| Native / Alaskan | 219 | 4.0% |
| White / Caucasian | 3,774 | 68.4% |
| Two or more Races | 679 | 12.3% |
| Some other Race | 504 | 9.1% |
| Total | 5,516 | 100.0% |
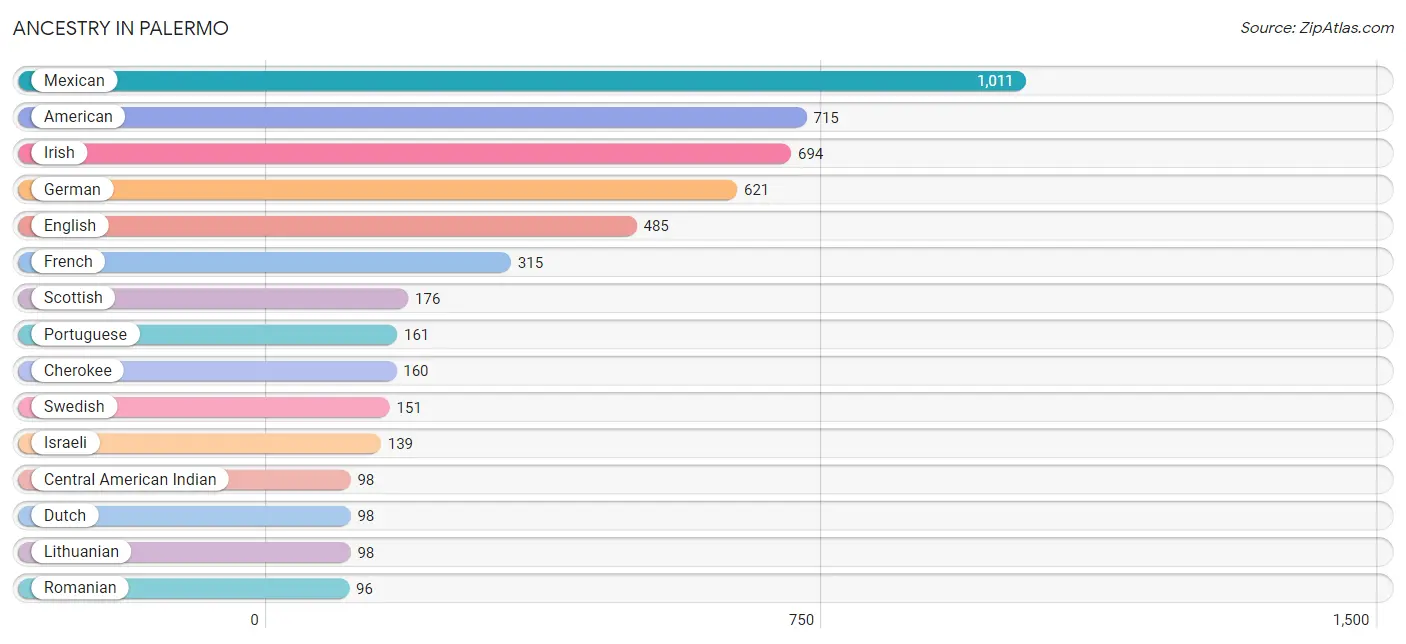
Ancestry in Palermo
The most populous ancestries reported in Palermo are Mexican (1,011 | 18.3%), American (715 | 13.0%), Irish (694 | 12.6%), German (621 | 11.3%), and English (485 | 8.8%), together accounting for 63.9% of all Palermo residents.
| Ancestry | # Population | % Population |
| American | 715 | 13.0% |
| Apache | 3 | 0.1% |
| Bangladeshi | 23 | 0.4% |
| Basque | 11 | 0.2% |
| Bhutanese | 12 | 0.2% |
| Blackfeet | 79 | 1.4% |
| British | 23 | 0.4% |
| Celtic | 8 | 0.2% |
| Central American | 35 | 0.6% |
| Central American Indian | 98 | 1.8% |
| Cherokee | 160 | 2.9% |
| Chippewa | 41 | 0.7% |
| Choctaw | 14 | 0.3% |
| Danish | 54 | 1.0% |
| Dutch | 98 | 1.8% |
| English | 485 | 8.8% |
| European | 72 | 1.3% |
| Finnish | 16 | 0.3% |
| French | 315 | 5.7% |
| French Canadian | 9 | 0.2% |
| German | 621 | 11.3% |
| Greek | 24 | 0.4% |
| Indian (Asian) | 32 | 0.6% |
| Irish | 694 | 12.6% |
| Iroquois | 85 | 1.5% |
| Israeli | 139 | 2.5% |
| Italian | 64 | 1.2% |
| Korean | 46 | 0.8% |
| Lithuanian | 98 | 1.8% |
| Malaysian | 62 | 1.1% |
| Mexican | 1,011 | 18.3% |
| Mexican American Indian | 7 | 0.1% |
| Northern European | 17 | 0.3% |
| Norwegian | 68 | 1.2% |
| Peruvian | 16 | 0.3% |
| Polish | 67 | 1.2% |
| Portuguese | 161 | 2.9% |
| Puerto Rican | 31 | 0.6% |
| Puget Sound Salish | 14 | 0.3% |
| Romanian | 96 | 1.7% |
| Russian | 8 | 0.2% |
| Salvadoran | 35 | 0.6% |
| Scandinavian | 21 | 0.4% |
| Scotch-Irish | 18 | 0.3% |
| Scottish | 176 | 3.2% |
| Sioux | 40 | 0.7% |
| South American | 16 | 0.3% |
| Spaniard | 24 | 0.4% |
| Spanish | 37 | 0.7% |
| Subsaharan African | 8 | 0.2% |
| Swedish | 151 | 2.7% |
| Swiss | 23 | 0.4% |
| Ukrainian | 36 | 0.6% |
| Zimbabwean | 8 | 0.2% | View All 54 Rows |
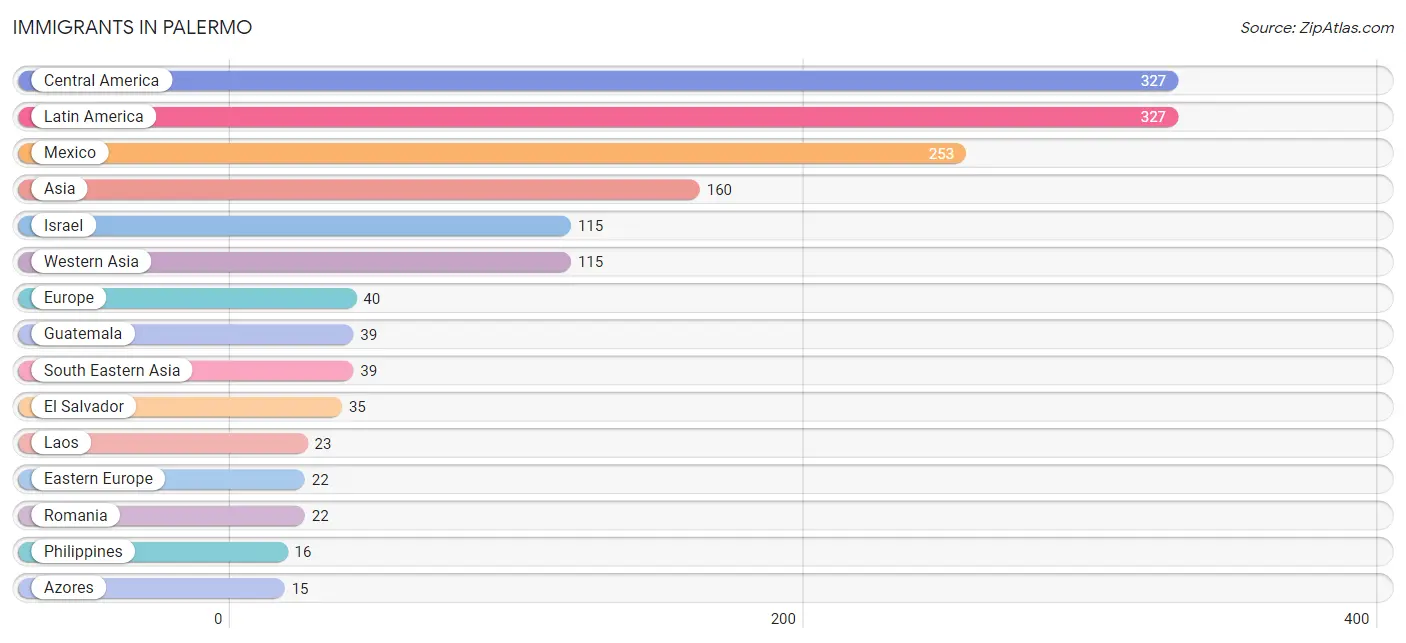
Immigrants in Palermo
The most numerous immigrant groups reported in Palermo came from Central America (327 | 5.9%), Latin America (327 | 5.9%), Mexico (253 | 4.6%), Asia (160 | 2.9%), and Israel (115 | 2.1%), together accounting for 21.4% of all Palermo residents.
| Immigration Origin | # Population | % Population |
| Asia | 160 | 2.9% |
| Azores | 15 | 0.3% |
| Central America | 327 | 5.9% |
| Eastern Asia | 6 | 0.1% |
| Eastern Europe | 22 | 0.4% |
| El Salvador | 35 | 0.6% |
| Europe | 40 | 0.7% |
| Germany | 3 | 0.1% |
| Guatemala | 39 | 0.7% |
| Israel | 115 | 2.1% |
| Japan | 6 | 0.1% |
| Laos | 23 | 0.4% |
| Latin America | 327 | 5.9% |
| Mexico | 253 | 4.6% |
| Philippines | 16 | 0.3% |
| Portugal | 15 | 0.3% |
| Romania | 22 | 0.4% |
| South Eastern Asia | 39 | 0.7% |
| Southern Europe | 15 | 0.3% |
| Western Asia | 115 | 2.1% |
| Western Europe | 3 | 0.1% | View All 21 Rows |
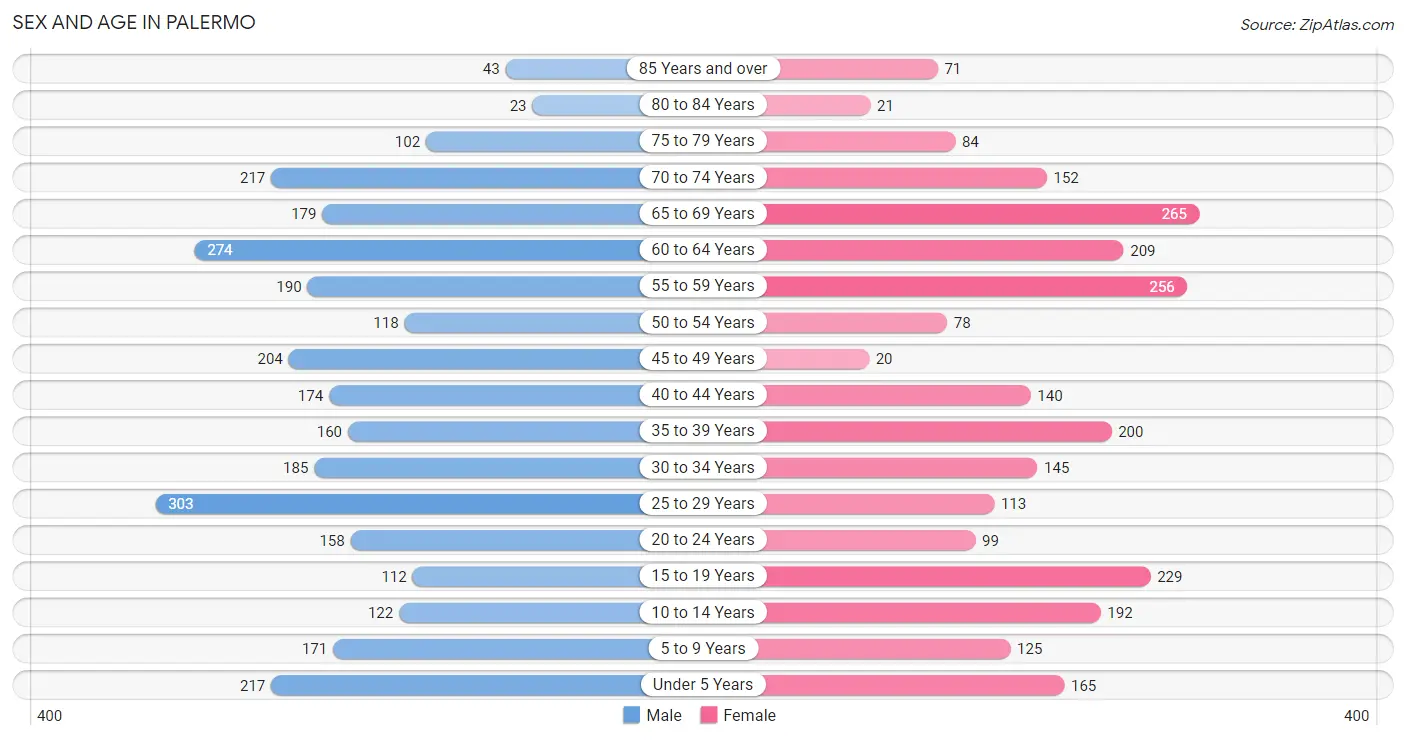
Sex and Age in Palermo
Sex and Age in Palermo
The most populous age groups in Palermo are 25 to 29 Years (303 | 10.3%) for men and 65 to 69 Years (265 | 10.3%) for women.
| Age Bracket | Male | Female |
| Under 5 Years | 217 (7.3%) | 165 (6.4%) |
| 5 to 9 Years | 171 (5.8%) | 125 (4.9%) |
| 10 to 14 Years | 122 (4.1%) | 192 (7.5%) |
| 15 to 19 Years | 112 (3.8%) | 229 (8.9%) |
| 20 to 24 Years | 158 (5.3%) | 99 (3.9%) |
| 25 to 29 Years | 303 (10.3%) | 113 (4.4%) |
| 30 to 34 Years | 185 (6.3%) | 145 (5.7%) |
| 35 to 39 Years | 160 (5.4%) | 200 (7.8%) |
| 40 to 44 Years | 174 (5.9%) | 140 (5.5%) |
| 45 to 49 Years | 204 (6.9%) | 20 (0.8%) |
| 50 to 54 Years | 118 (4.0%) | 78 (3.0%) |
| 55 to 59 Years | 190 (6.4%) | 256 (10.0%) |
| 60 to 64 Years | 274 (9.3%) | 209 (8.2%) |
| 65 to 69 Years | 179 (6.1%) | 265 (10.3%) |
| 70 to 74 Years | 217 (7.3%) | 152 (5.9%) |
| 75 to 79 Years | 102 (3.5%) | 84 (3.3%) |
| 80 to 84 Years | 23 (0.8%) | 21 (0.8%) |
| 85 Years and over | 43 (1.5%) | 71 (2.8%) |
| Total | 2,952 (100.0%) | 2,564 (100.0%) |
Families and Households in Palermo
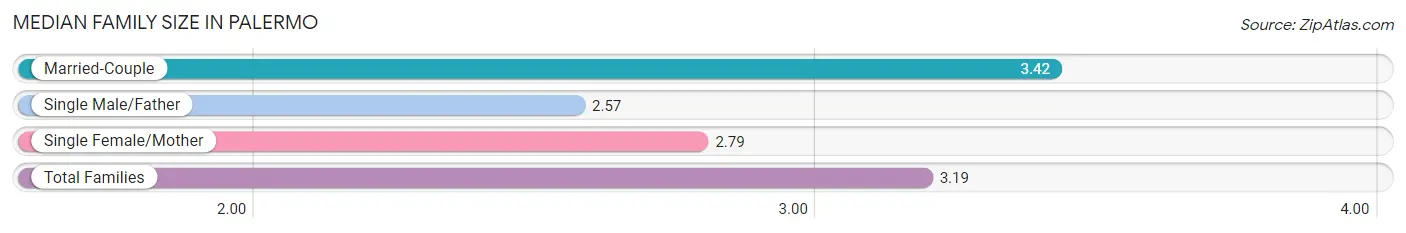
Median Family Size in Palermo
The median family size in Palermo is 3.19 persons per family, with married-couple families (998 | 69.1%) accounting for the largest median family size of 3.42 persons per family. On the other hand, single male/father families (224 | 15.5%) represent the smallest median family size with 2.57 persons per family.
| Family Type | # Families | Family Size |
| Married-Couple | 998 (69.1%) | 3.42 |
| Single Male/Father | 224 (15.5%) | 2.57 |
| Single Female/Mother | 223 (15.4%) | 2.79 |
| Total Families | 1,445 (100.0%) | 3.19 |
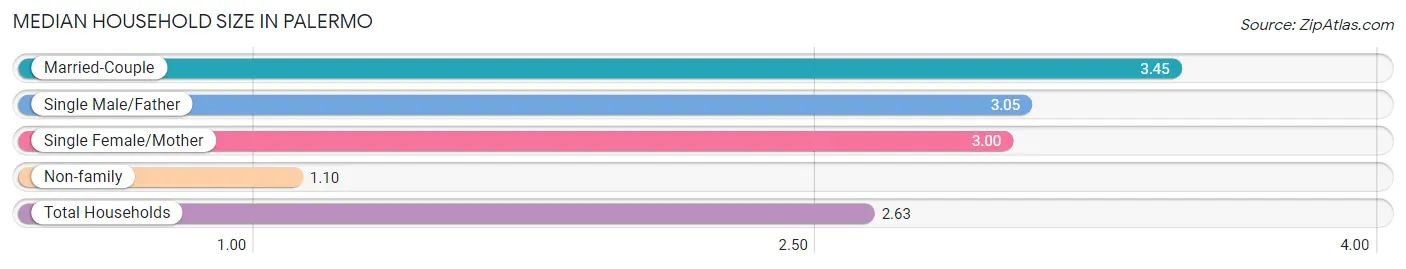
Median Household Size in Palermo
The median household size in Palermo is 2.63 persons per household, with married-couple households (998 | 47.8%) accounting for the largest median household size of 3.45 persons per household. non-family households (643 | 30.8%) represent the smallest median household size with 1.10 persons per household.
| Household Type | # Households | Household Size |
| Married-Couple | 998 (47.8%) | 3.45 |
| Single Male/Father | 224 (10.7%) | 3.05 |
| Single Female/Mother | 223 (10.7%) | 3.00 |
| Non-family | 643 (30.8%) | 1.10 |
| Total Households | 2,088 (100.0%) | 2.63 |
Household Size by Marriage Status in Palermo
Out of a total of 2,088 households in Palermo, 1,445 (69.2%) are family households, while 643 (30.8%) are nonfamily households. The most numerous type of family households are 2-person households, comprising 711, and the most common type of nonfamily households are 1-person households, comprising 603.
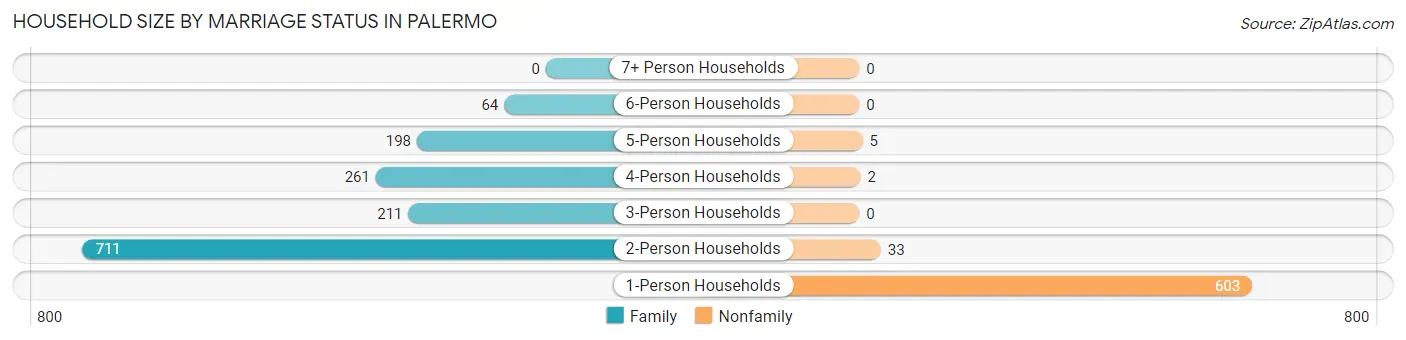
| Household Size | Family Households | Nonfamily Households |
| 1-Person Households | - | 603 (28.9%) |
| 2-Person Households | 711 (34.1%) | 33 (1.6%) |
| 3-Person Households | 211 (10.1%) | 0 (0.0%) |
| 4-Person Households | 261 (12.5%) | 2 (0.1%) |
| 5-Person Households | 198 (9.5%) | 5 (0.2%) |
| 6-Person Households | 64 (3.1%) | 0 (0.0%) |
| 7+ Person Households | 0 (0.0%) | 0 (0.0%) |
| Total | 1,445 (69.2%) | 643 (30.8%) |
Female Fertility in Palermo
Fertility by Age in Palermo
Average fertility rate in Palermo is 101.0 births per 1,000 women. Women in the age bracket of 20 to 34 years have the highest fertility rate with 193.0 births per 1,000 women. Women in the age bracket of 20 to 34 years acount for 70.4% of all women with births.
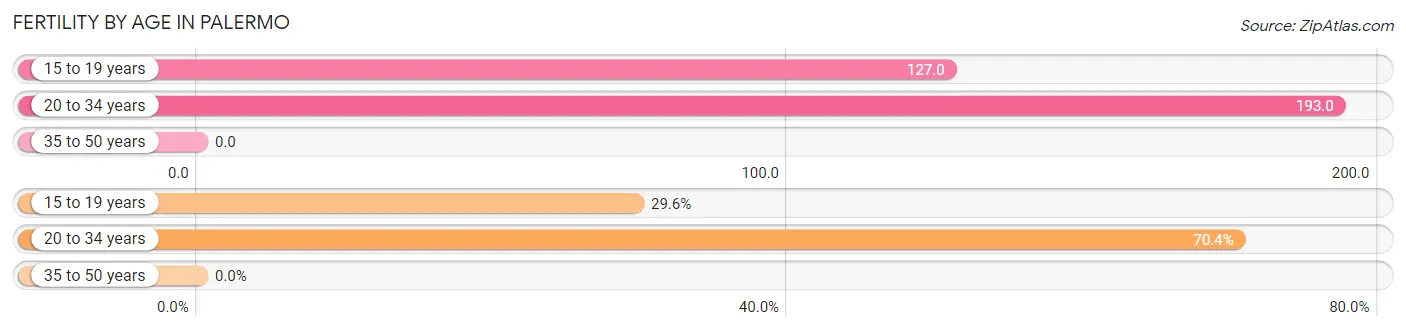
| Age Bracket | Women with Births | Births / 1,000 Women |
| 15 to 19 years | 29 (29.6%) | 127.0 |
| 20 to 34 years | 69 (70.4%) | 193.0 |
| 35 to 50 years | 0 (0.0%) | 0.0 |
| Total | 98 (100.0%) | 101.0 |
Fertility by Age by Marriage Status in Palermo
70.4% of women with births (98) in Palermo are married. The highest percentage of unmarried women with births falls into 15 to 19 years age bracket with 100.0% of them unmarried at the time of birth, while the lowest percentage of unmarried women with births belong to 20 to 34 years age bracket with 0.0% of them unmarried.
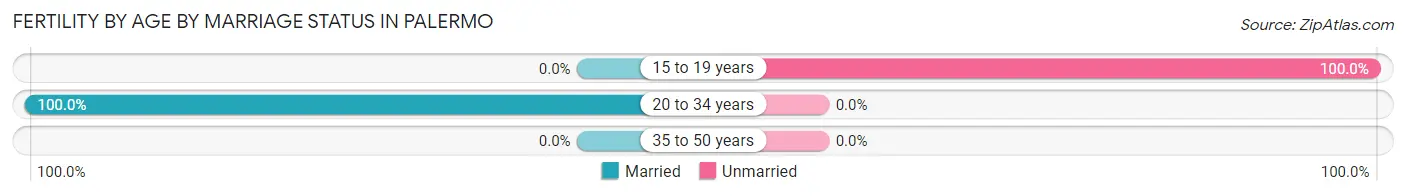
| Age Bracket | Married | Unmarried |
| 15 to 19 years | 0 (0.0%) | 29 (100.0%) |
| 20 to 34 years | 69 (100.0%) | 0 (0.0%) |
| 35 to 50 years | 0 (0.0%) | 0 (0.0%) |
| Total | 69 (70.4%) | 29 (29.6%) |
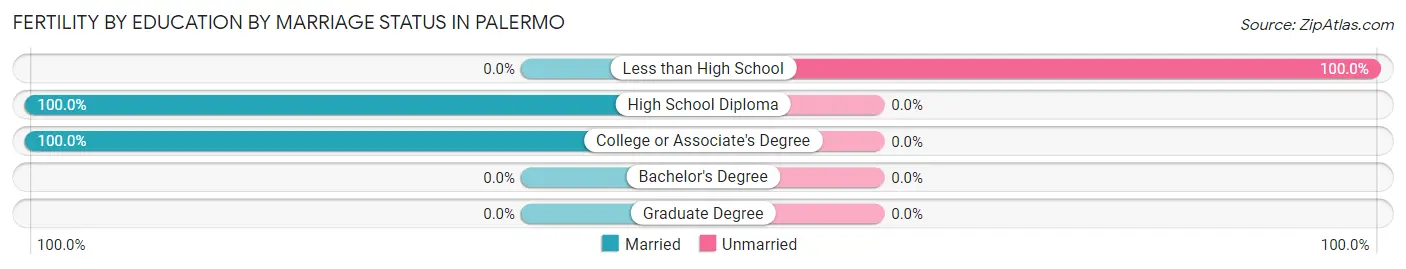
Fertility by Education in Palermo
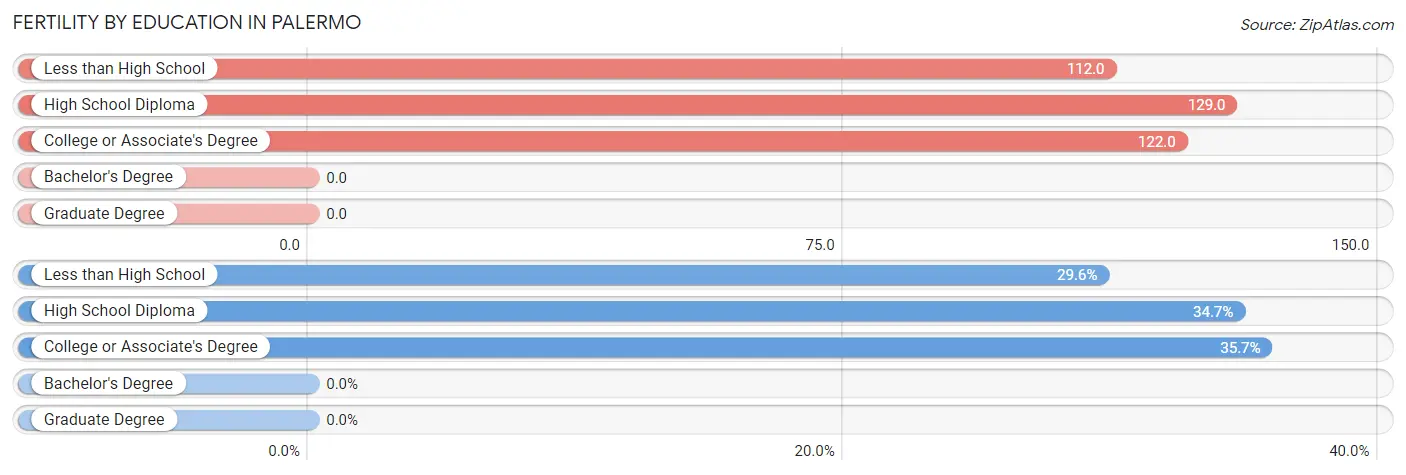
| Educational Attainment | Women with Births | Births / 1,000 Women |
| Less than High School | 29 (29.6%) | 112.0 |
| High School Diploma | 34 (34.7%) | 129.0 |
| College or Associate's Degree | 35 (35.7%) | 122.0 |
| Bachelor's Degree | 0 (0.0%) | 0.0 |
| Graduate Degree | 0 (0.0%) | 0.0 |
| Total | 98 (100.0%) | 101.0 |
Fertility by Education by Marriage Status in Palermo
29.6% of women with births in Palermo are unmarried. Women with the educational attainment of high school diploma are most likely to be married with 100.0% of them married at childbirth, while women with the educational attainment of less than high school are least likely to be married with 100.0% of them unmarried at childbirth.
| Educational Attainment | Married | Unmarried |
| Less than High School | 0 (0.0%) | 29 (100.0%) |
| High School Diploma | 34 (100.0%) | 0 (0.0%) |
| College or Associate's Degree | 35 (100.0%) | 0 (0.0%) |
| Bachelor's Degree | 0 (0.0%) | 0 (0.0%) |
| Graduate Degree | 0 (0.0%) | 0 (0.0%) |
| Total | 69 (70.4%) | 29 (29.6%) |
Employment Characteristics in Palermo
Employment by Class of Employer in Palermo
Among the 2,116 employed individuals in Palermo, private company employees (1,376 | 65.0%), self-employed (not incorporated) (229 | 10.8%), and not-for-profit organizations (186 | 8.8%) make up the most common classes of employment.
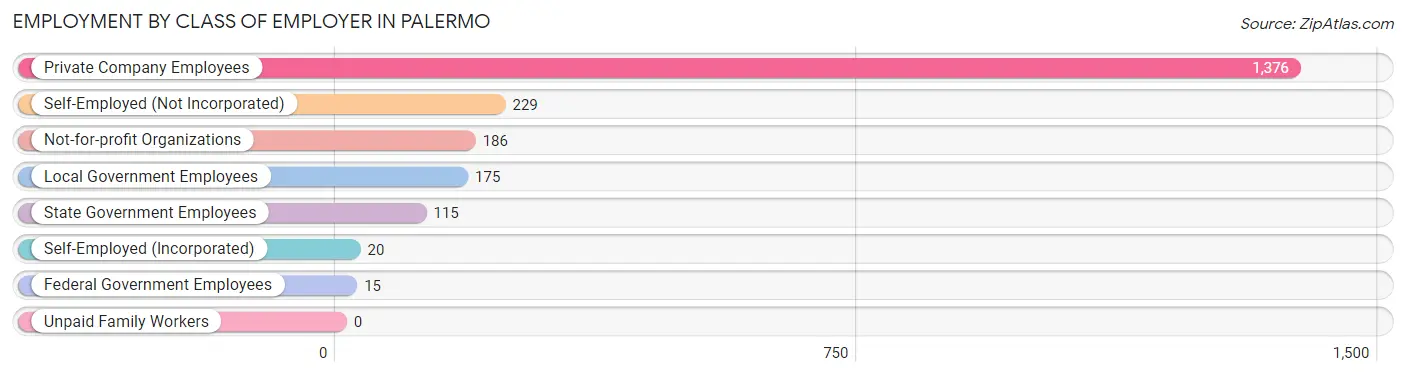
| Employer Class | # Employees | % Employees |
| Private Company Employees | 1,376 | 65.0% |
| Self-Employed (Incorporated) | 20 | 0.9% |
| Self-Employed (Not Incorporated) | 229 | 10.8% |
| Not-for-profit Organizations | 186 | 8.8% |
| Local Government Employees | 175 | 8.3% |
| State Government Employees | 115 | 5.4% |
| Federal Government Employees | 15 | 0.7% |
| Unpaid Family Workers | 0 | 0.0% |
| Total | 2,116 | 100.0% |
Employment Status by Age in Palermo
According to the labor force statistics for Palermo, out of the total population over 16 years of age (4,408), 55.8% or 2,460 individuals are in the labor force, with 11.7% or 288 of them unemployed. The age group with the highest labor force participation rate is 45 to 54 years, with 84.5% or 355 individuals in the labor force. Within the labor force, the 20 to 24 years age range has the highest percentage of unemployed individuals, with 29.5% or 61 of them being unemployed.
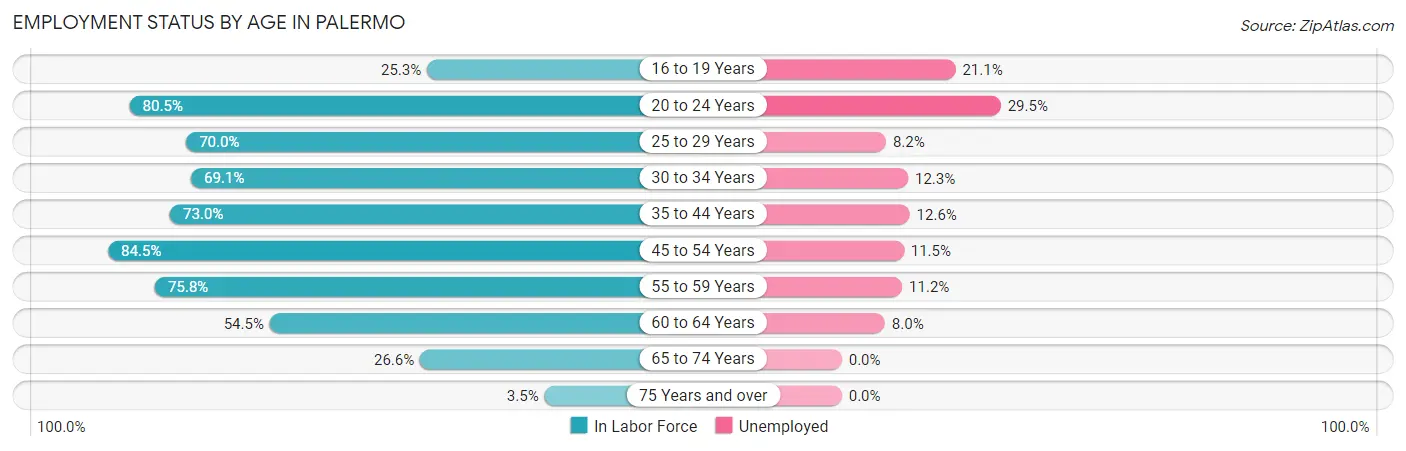
| Age Bracket | In Labor Force | Unemployed |
| 16 to 19 Years | 57 (25.3%) | 12 (21.1%) |
| 20 to 24 Years | 207 (80.5%) | 61 (29.5%) |
| 25 to 29 Years | 291 (70.0%) | 24 (8.2%) |
| 30 to 34 Years | 228 (69.1%) | 28 (12.3%) |
| 35 to 44 Years | 492 (73.0%) | 62 (12.6%) |
| 45 to 54 Years | 355 (84.5%) | 41 (11.5%) |
| 55 to 59 Years | 338 (75.8%) | 38 (11.2%) |
| 60 to 64 Years | 263 (54.5%) | 21 (8.0%) |
| 65 to 74 Years | 216 (26.6%) | 0 (0.0%) |
| 75 Years and over | 12 (3.5%) | 0 (0.0%) |
| Total | 2,460 (55.8%) | 288 (11.7%) |
Employment Status by Educational Attainment in Palermo
According to labor force statistics for Palermo, 71.0% of individuals (1,966) out of the total population between 25 and 64 years of age (2,769) are in the labor force, with 10.9% or 214 of them being unemployed. The group with the highest labor force participation rate are those with the educational attainment of bachelor's degree or higher, with 94.8% or 347 individuals in the labor force. Within the labor force, individuals with high school diploma education have the highest percentage of unemployment, with 15.6% or 112 of them being unemployed.
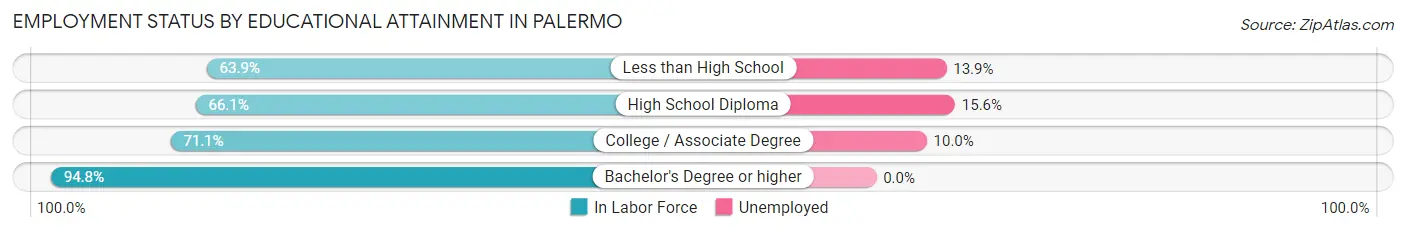
| Educational Attainment | In Labor Force | Unemployed |
| Less than High School | 303 (63.9%) | 66 (13.9%) |
| High School Diploma | 717 (66.1%) | 169 (15.6%) |
| College / Associate Degree | 600 (71.1%) | 84 (10.0%) |
| Bachelor's Degree or higher | 347 (94.8%) | 0 (0.0%) |
| Total | 1,966 (71.0%) | 302 (10.9%) |
Employment Occupations by Sex in Palermo
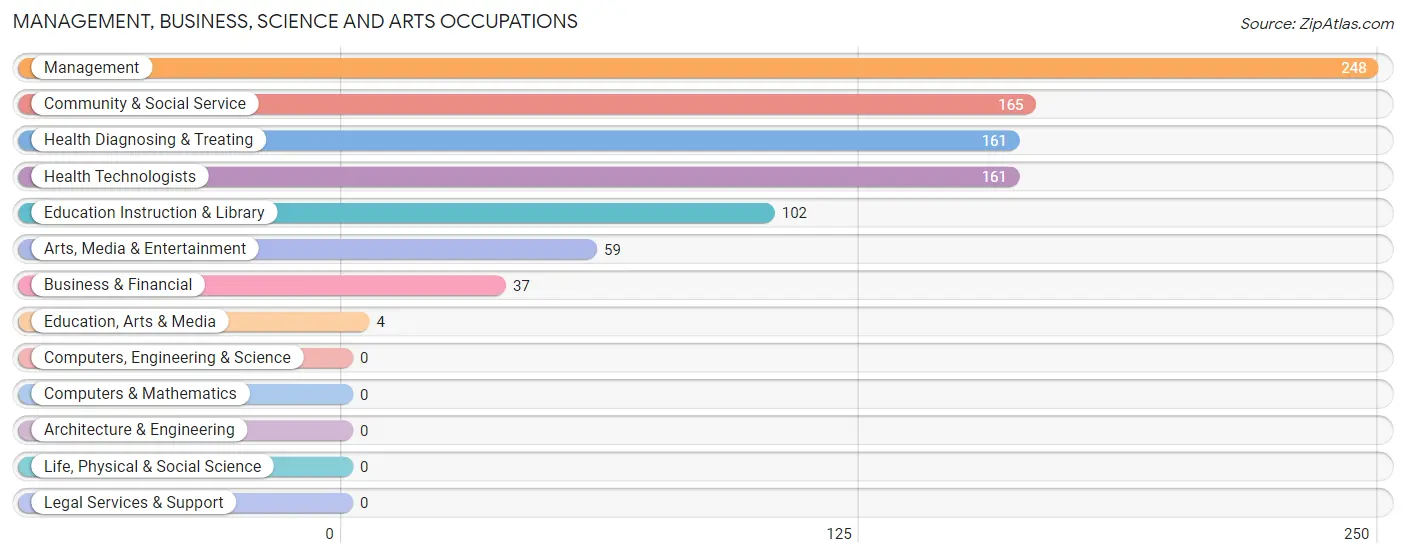
Management, Business, Science and Arts Occupations
The most common Management, Business, Science and Arts occupations in Palermo are Management (248 | 11.4%), Community & Social Service (165 | 7.6%), Health Diagnosing & Treating (161 | 7.4%), Health Technologists (161 | 7.4%), and Education Instruction & Library (102 | 4.7%).
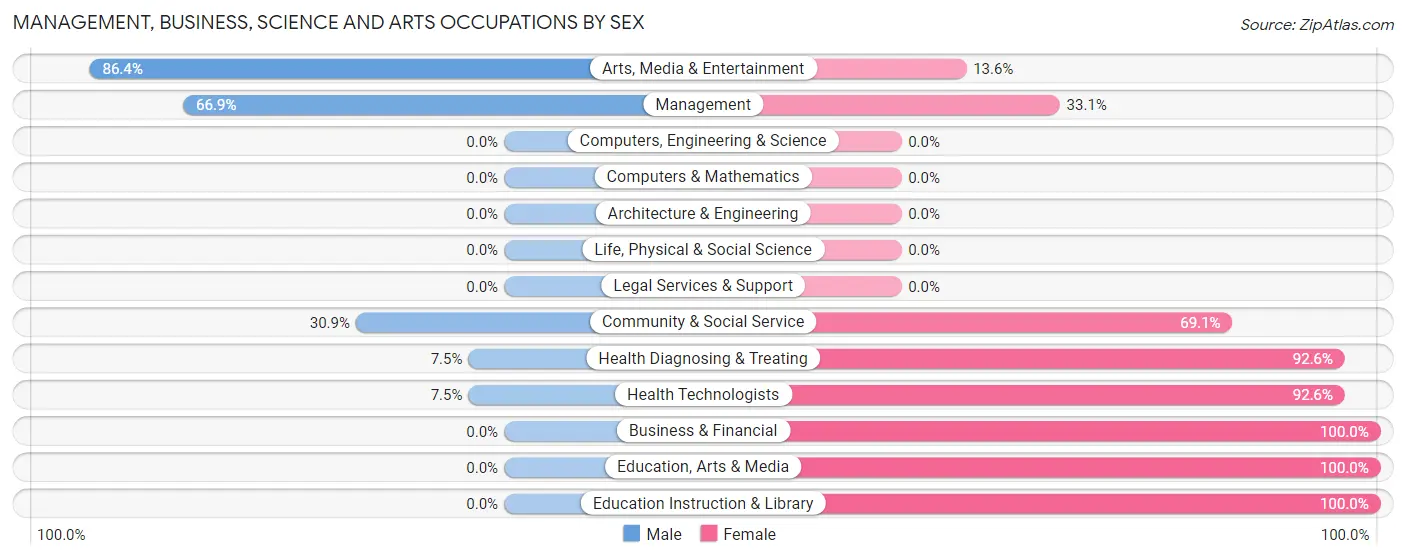
Management, Business, Science and Arts Occupations by Sex
Within the Management, Business, Science and Arts occupations in Palermo, the most male-oriented occupations are Arts, Media & Entertainment (86.4%), Management (66.9%), and Community & Social Service (30.9%), while the most female-oriented occupations are Business & Financial (100.0%), Education, Arts & Media (100.0%), and Education Instruction & Library (100.0%).
| Occupation | Male | Female |
| Management | 166 (66.9%) | 82 (33.1%) |
| Business & Financial | 0 (0.0%) | 37 (100.0%) |
| Computers, Engineering & Science | 0 (0.0%) | 0 (0.0%) |
| Computers & Mathematics | 0 (0.0%) | 0 (0.0%) |
| Architecture & Engineering | 0 (0.0%) | 0 (0.0%) |
| Life, Physical & Social Science | 0 (0.0%) | 0 (0.0%) |
| Community & Social Service | 51 (30.9%) | 114 (69.1%) |
| Education, Arts & Media | 0 (0.0%) | 4 (100.0%) |
| Legal Services & Support | 0 (0.0%) | 0 (0.0%) |
| Education Instruction & Library | 0 (0.0%) | 102 (100.0%) |
| Arts, Media & Entertainment | 51 (86.4%) | 8 (13.6%) |
| Health Diagnosing & Treating | 12 (7.4%) | 149 (92.5%) |
| Health Technologists | 12 (7.4%) | 149 (92.5%) |
| Total (Category) | 229 (37.5%) | 382 (62.5%) |
| Total (Overall) | 1,219 (56.1%) | 953 (43.9%) |
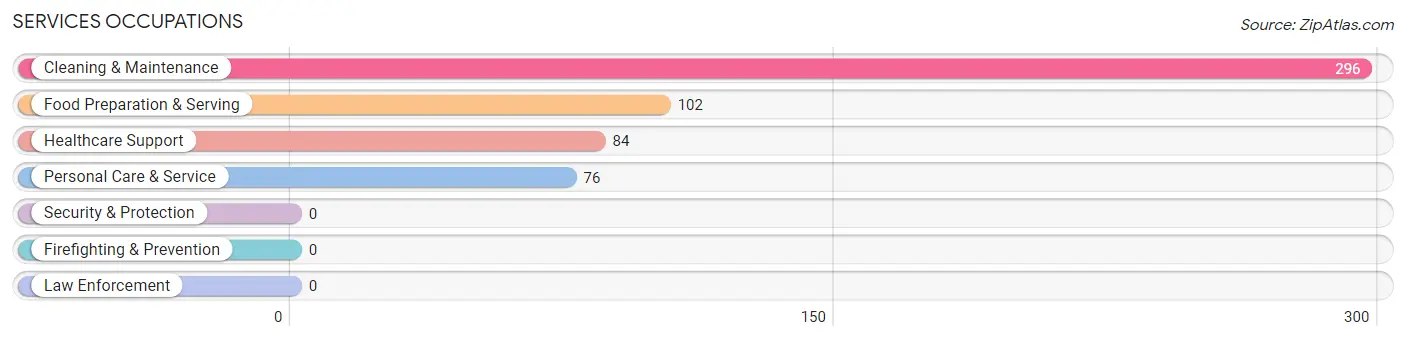
Services Occupations
The most common Services occupations in Palermo are Cleaning & Maintenance (296 | 13.6%), Food Preparation & Serving (102 | 4.7%), Healthcare Support (84 | 3.9%), and Personal Care & Service (76 | 3.5%).
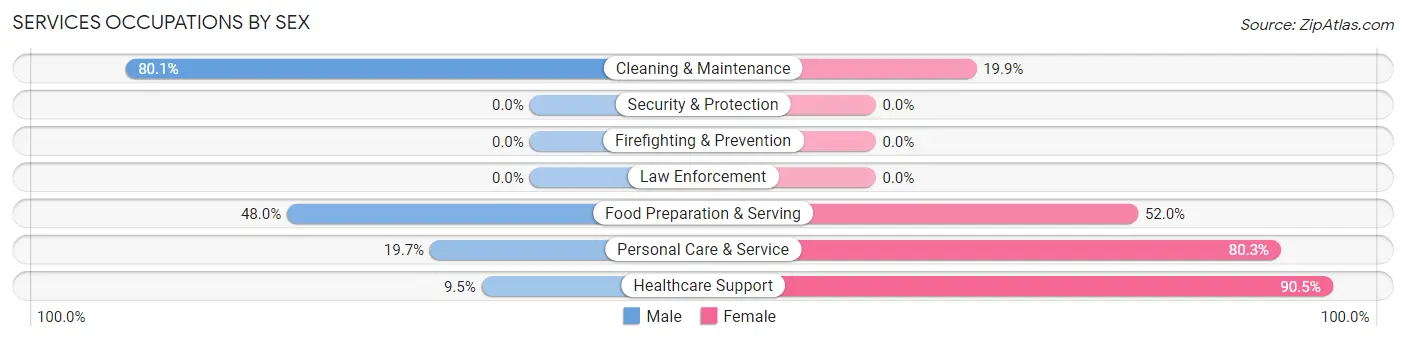
Services Occupations by Sex
Within the Services occupations in Palermo, the most male-oriented occupations are Cleaning & Maintenance (80.1%), Food Preparation & Serving (48.0%), and Personal Care & Service (19.7%), while the most female-oriented occupations are Healthcare Support (90.5%), Personal Care & Service (80.3%), and Food Preparation & Serving (52.0%).
| Occupation | Male | Female |
| Healthcare Support | 8 (9.5%) | 76 (90.5%) |
| Security & Protection | 0 (0.0%) | 0 (0.0%) |
| Firefighting & Prevention | 0 (0.0%) | 0 (0.0%) |
| Law Enforcement | 0 (0.0%) | 0 (0.0%) |
| Food Preparation & Serving | 49 (48.0%) | 53 (52.0%) |
| Cleaning & Maintenance | 237 (80.1%) | 59 (19.9%) |
| Personal Care & Service | 15 (19.7%) | 61 (80.3%) |
| Total (Category) | 309 (55.4%) | 249 (44.6%) |
| Total (Overall) | 1,219 (56.1%) | 953 (43.9%) |
Sales and Office Occupations
The most common Sales and Office occupations in Palermo are Office & Administration (206 | 9.5%), and Sales & Related (68 | 3.1%).
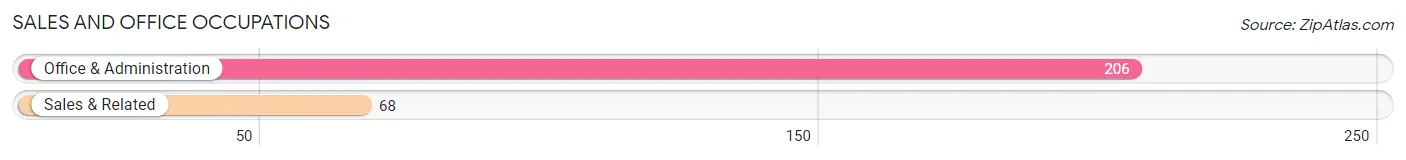
Sales and Office Occupations by Sex

| Occupation | Male | Female |
| Sales & Related | 52 (76.5%) | 16 (23.5%) |
| Office & Administration | 0 (0.0%) | 206 (100.0%) |
| Total (Category) | 52 (19.0%) | 222 (81.0%) |
| Total (Overall) | 1,219 (56.1%) | 953 (43.9%) |
Natural Resources, Construction and Maintenance Occupations
The most common Natural Resources, Construction and Maintenance occupations in Palermo are Construction & Extraction (176 | 8.1%), Farming, Fishing & Forestry (75 | 3.5%), and Installation, Maintenance & Repair (12 | 0.5%).
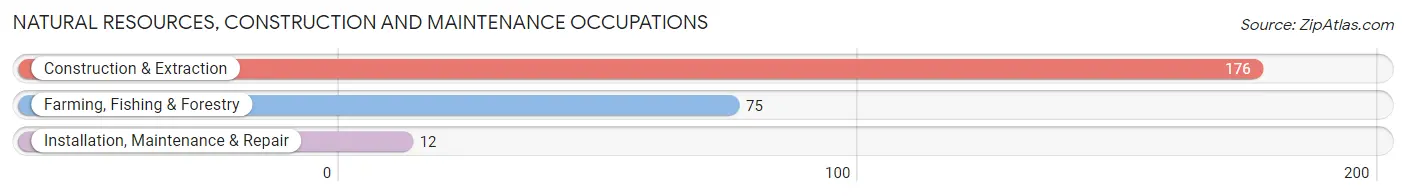
Natural Resources, Construction and Maintenance Occupations by Sex
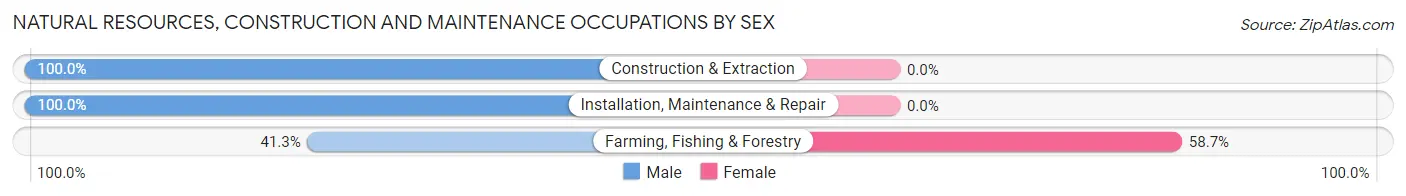
| Occupation | Male | Female |
| Farming, Fishing & Forestry | 31 (41.3%) | 44 (58.7%) |
| Construction & Extraction | 176 (100.0%) | 0 (0.0%) |
| Installation, Maintenance & Repair | 12 (100.0%) | 0 (0.0%) |
| Total (Category) | 219 (83.3%) | 44 (16.7%) |
| Total (Overall) | 1,219 (56.1%) | 953 (43.9%) |
Production, Transportation and Moving Occupations
The most common Production, Transportation and Moving occupations in Palermo are Production (249 | 11.5%), Material Moving (183 | 8.4%), and Transportation (34 | 1.6%).
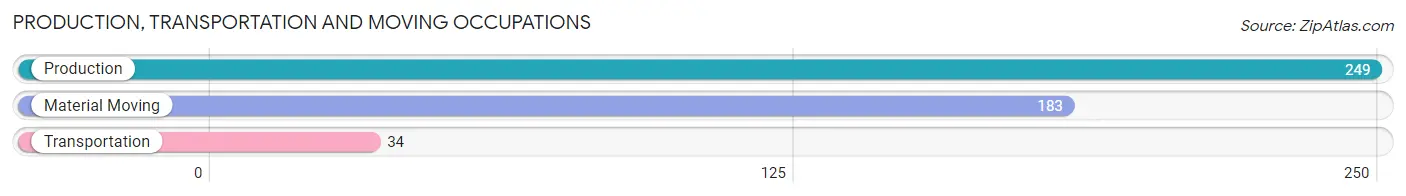
Production, Transportation and Moving Occupations by Sex
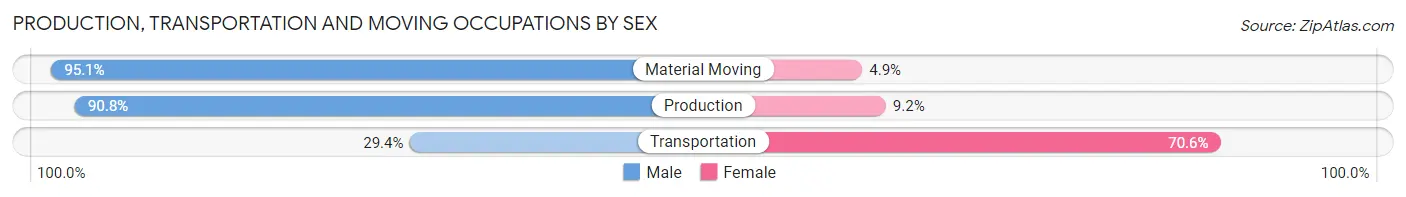
| Occupation | Male | Female |
| Production | 226 (90.8%) | 23 (9.2%) |
| Transportation | 10 (29.4%) | 24 (70.6%) |
| Material Moving | 174 (95.1%) | 9 (4.9%) |
| Total (Category) | 410 (88.0%) | 56 (12.0%) |
| Total (Overall) | 1,219 (56.1%) | 953 (43.9%) |
Employment Industries by Sex in Palermo
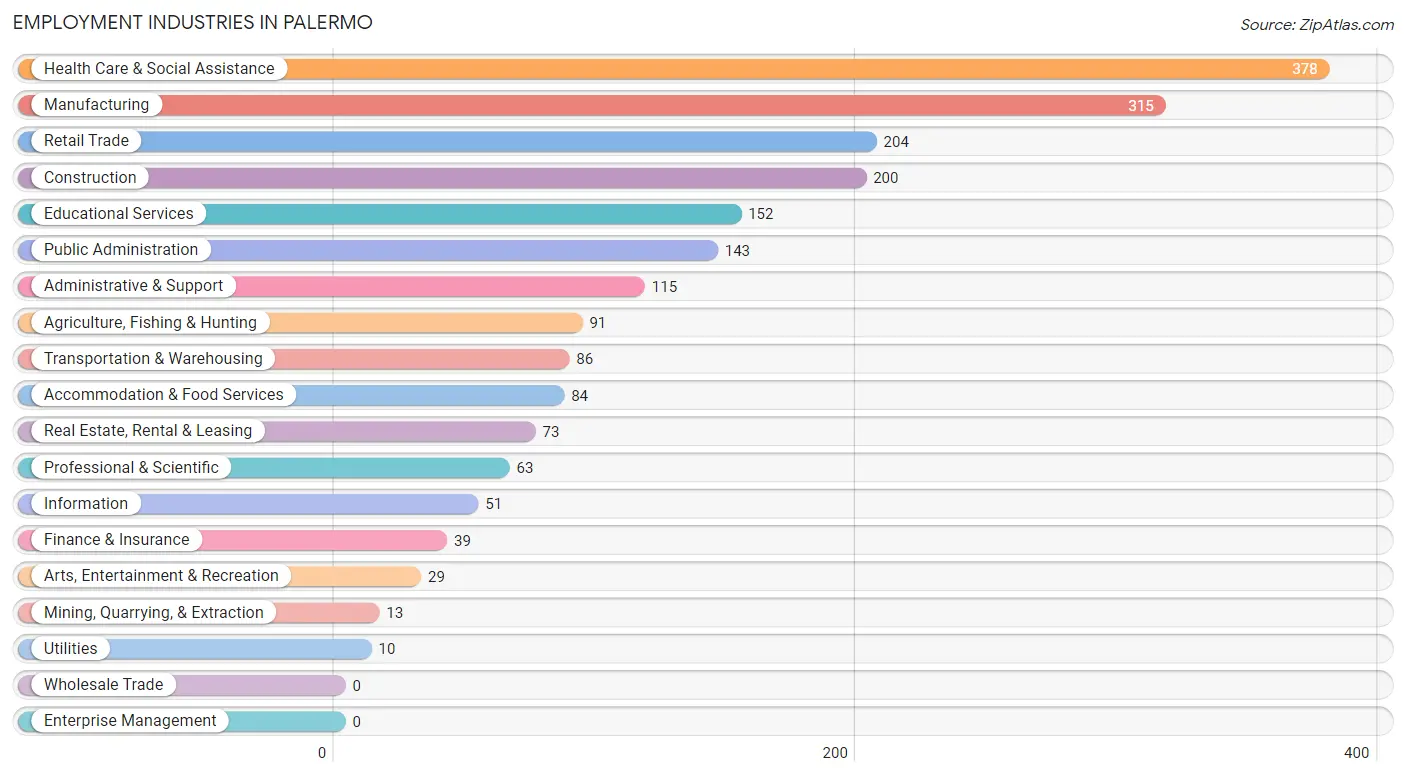
Employment Industries in Palermo
The major employment industries in Palermo include Health Care & Social Assistance (378 | 17.4%), Manufacturing (315 | 14.5%), Retail Trade (204 | 9.4%), Construction (200 | 9.2%), and Educational Services (152 | 7.0%).
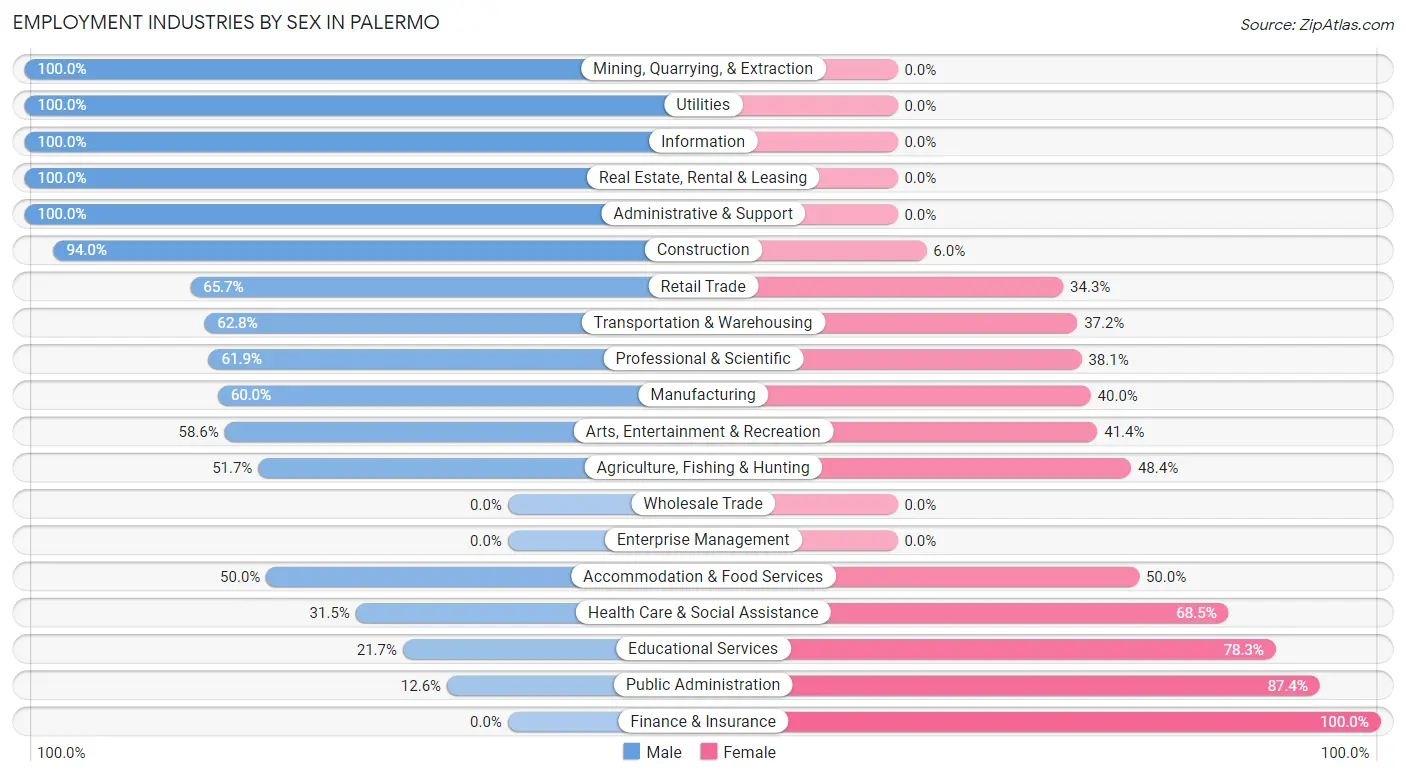
Employment Industries by Sex in Palermo
The Palermo industries that see more men than women are Mining, Quarrying, & Extraction (100.0%), Utilities (100.0%), and Information (100.0%), whereas the industries that tend to have a higher number of women are Finance & Insurance (100.0%), Public Administration (87.4%), and Educational Services (78.3%).
| Industry | Male | Female |
| Agriculture, Fishing & Hunting | 47 (51.6%) | 44 (48.3%) |
| Mining, Quarrying, & Extraction | 13 (100.0%) | 0 (0.0%) |
| Construction | 188 (94.0%) | 12 (6.0%) |
| Manufacturing | 189 (60.0%) | 126 (40.0%) |
| Wholesale Trade | 0 (0.0%) | 0 (0.0%) |
| Retail Trade | 134 (65.7%) | 70 (34.3%) |
| Transportation & Warehousing | 54 (62.8%) | 32 (37.2%) |
| Utilities | 10 (100.0%) | 0 (0.0%) |
| Information | 51 (100.0%) | 0 (0.0%) |
| Finance & Insurance | 0 (0.0%) | 39 (100.0%) |
| Real Estate, Rental & Leasing | 73 (100.0%) | 0 (0.0%) |
| Professional & Scientific | 39 (61.9%) | 24 (38.1%) |
| Enterprise Management | 0 (0.0%) | 0 (0.0%) |
| Administrative & Support | 115 (100.0%) | 0 (0.0%) |
| Educational Services | 33 (21.7%) | 119 (78.3%) |
| Health Care & Social Assistance | 119 (31.5%) | 259 (68.5%) |
| Arts, Entertainment & Recreation | 17 (58.6%) | 12 (41.4%) |
| Accommodation & Food Services | 42 (50.0%) | 42 (50.0%) |
| Public Administration | 18 (12.6%) | 125 (87.4%) |
| Total | 1,219 (56.1%) | 953 (43.9%) |
Education in Palermo
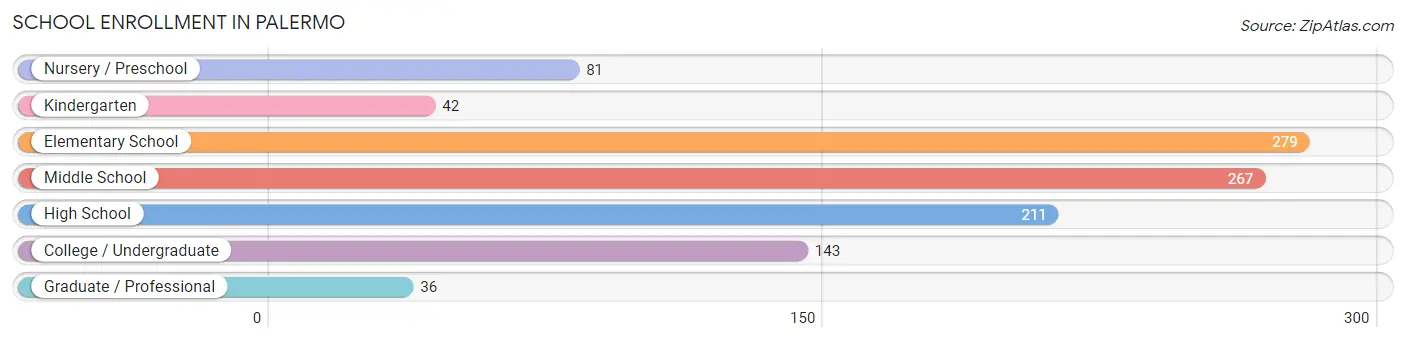
School Enrollment in Palermo
The most common levels of schooling among the 1,059 students in Palermo are elementary school (279 | 26.4%), middle school (267 | 25.2%), and high school (211 | 19.9%).
| School Level | # Students | % Students |
| Nursery / Preschool | 81 | 7.6% |
| Kindergarten | 42 | 4.0% |
| Elementary School | 279 | 26.4% |
| Middle School | 267 | 25.2% |
| High School | 211 | 19.9% |
| College / Undergraduate | 143 | 13.5% |
| Graduate / Professional | 36 | 3.4% |
| Total | 1,059 | 100.0% |
School Enrollment by Age by Funding Source in Palermo
Out of a total of 1,059 students who are enrolled in schools in Palermo, 89 (8.4%) attend a private institution, while the remaining 970 (91.6%) are enrolled in public schools. The age group of 20 to 24 year olds has the highest likelihood of being enrolled in private schools, with 21 (26.9% in the age bracket) enrolled. Conversely, the age group of 3 to 4 year olds has the lowest likelihood of being enrolled in a private school, with 68 (100.0% in the age bracket) attending a public institution.
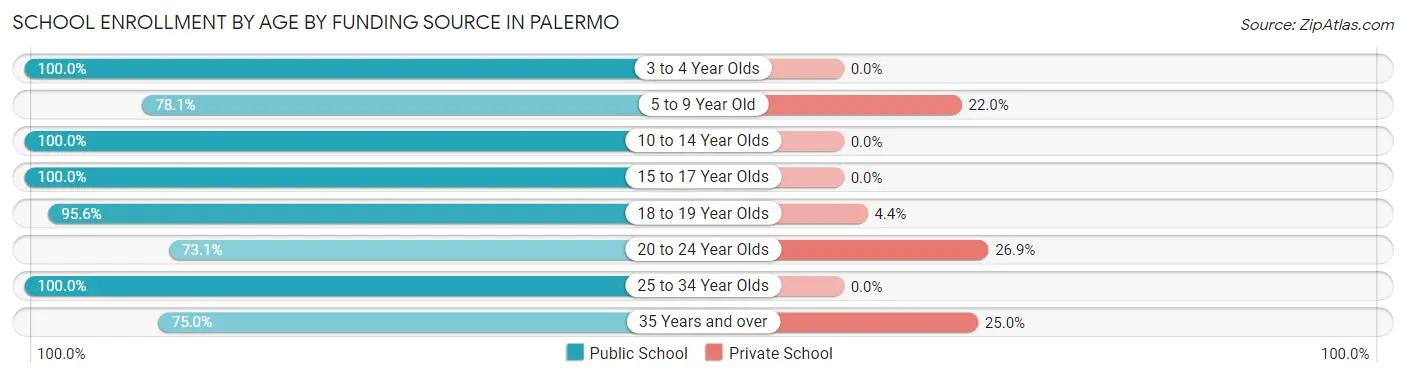
| Age Bracket | Public School | Private School |
| 3 to 4 Year Olds | 68 (100.0%) | 0 (0.0%) |
| 5 to 9 Year Old | 192 (78.0%) | 54 (22.0%) |
| 10 to 14 Year Olds | 314 (100.0%) | 0 (0.0%) |
| 15 to 17 Year Olds | 239 (100.0%) | 0 (0.0%) |
| 18 to 19 Year Olds | 43 (95.6%) | 2 (4.4%) |
| 20 to 24 Year Olds | 57 (73.1%) | 21 (26.9%) |
| 25 to 34 Year Olds | 21 (100.0%) | 0 (0.0%) |
| 35 Years and over | 36 (75.0%) | 12 (25.0%) |
| Total | 970 (91.6%) | 89 (8.4%) |
Educational Attainment by Field of Study in Palermo
Science & technology (124 | 22.0%), communications (70 | 12.4%), literature & languages (69 | 12.2%), business (66 | 11.7%), and engineering (65 | 11.5%) are the most common fields of study among 565 individuals in Palermo who have obtained a bachelor's degree or higher.
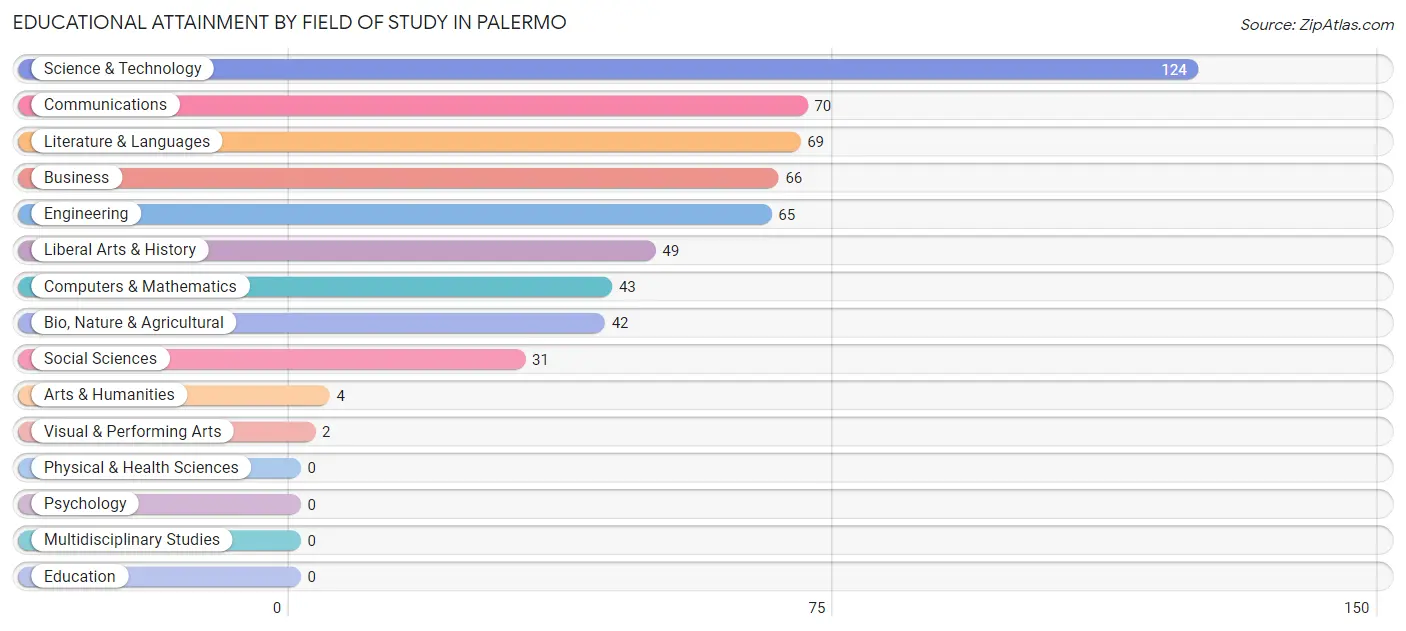
| Field of Study | # Graduates | % Graduates |
| Computers & Mathematics | 43 | 7.6% |
| Bio, Nature & Agricultural | 42 | 7.4% |
| Physical & Health Sciences | 0 | 0.0% |
| Psychology | 0 | 0.0% |
| Social Sciences | 31 | 5.5% |
| Engineering | 65 | 11.5% |
| Multidisciplinary Studies | 0 | 0.0% |
| Science & Technology | 124 | 22.0% |
| Business | 66 | 11.7% |
| Education | 0 | 0.0% |
| Literature & Languages | 69 | 12.2% |
| Liberal Arts & History | 49 | 8.7% |
| Visual & Performing Arts | 2 | 0.4% |
| Communications | 70 | 12.4% |
| Arts & Humanities | 4 | 0.7% |
| Total | 565 | 100.0% |
Transportation & Commute in Palermo
Vehicle Availability by Sex in Palermo
The most prevalent vehicle ownership categories in Palermo are males with 2 vehicles (415, accounting for 35.0%) and females with 2 vehicles (265, making up 45.4%).

| Vehicles Available | Male | Female |
| No Vehicle | 12 (1.0%) | 39 (4.3%) |
| 1 Vehicle | 168 (14.2%) | 156 (17.1%) |
| 2 Vehicles | 415 (35.0%) | 265 (29.0%) |
| 3 Vehicles | 170 (14.3%) | 197 (21.5%) |
| 4 Vehicles | 184 (15.5%) | 137 (15.0%) |
| 5 or more Vehicles | 236 (19.9%) | 121 (13.2%) |
| Total | 1,185 (100.0%) | 915 (100.0%) |
Commute Time in Palermo
The most frequently occuring commute durations in Palermo are 10 to 14 minutes (464 commuters, 24.4%), 15 to 19 minutes (388 commuters, 20.4%), and 30 to 34 minutes (321 commuters, 16.9%).
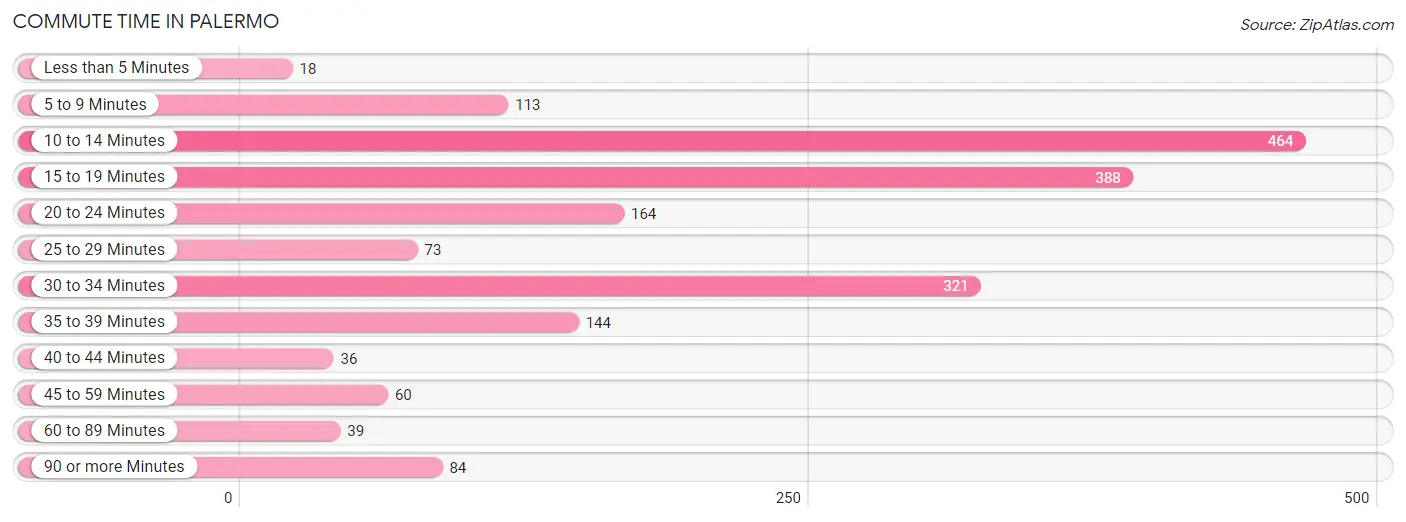
| Commute Time | # Commuters | % Commuters |
| Less than 5 Minutes | 18 | 0.9% |
| 5 to 9 Minutes | 113 | 5.9% |
| 10 to 14 Minutes | 464 | 24.4% |
| 15 to 19 Minutes | 388 | 20.4% |
| 20 to 24 Minutes | 164 | 8.6% |
| 25 to 29 Minutes | 73 | 3.8% |
| 30 to 34 Minutes | 321 | 16.9% |
| 35 to 39 Minutes | 144 | 7.6% |
| 40 to 44 Minutes | 36 | 1.9% |
| 45 to 59 Minutes | 60 | 3.2% |
| 60 to 89 Minutes | 39 | 2.1% |
| 90 or more Minutes | 84 | 4.4% |
Commute Time by Sex in Palermo
The most common commute times in Palermo are 30 to 34 minutes (273 commuters, 25.7%) for males and 10 to 14 minutes (273 commuters, 32.5%) for females.
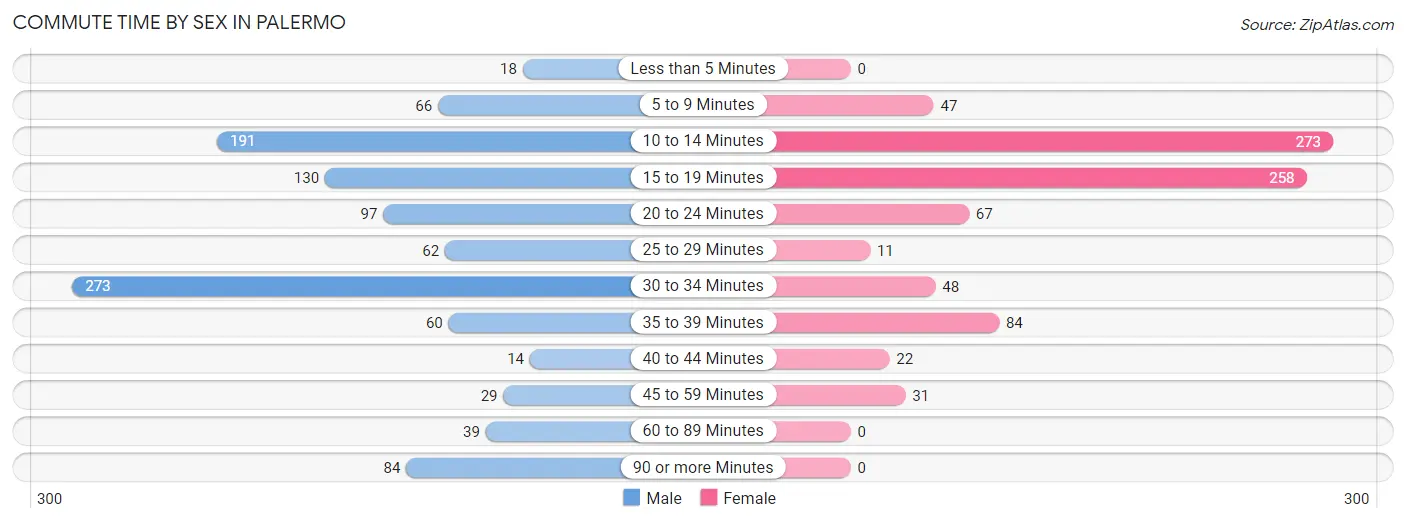
| Commute Time | Male | Female |
| Less than 5 Minutes | 18 (1.7%) | 0 (0.0%) |
| 5 to 9 Minutes | 66 (6.2%) | 47 (5.6%) |
| 10 to 14 Minutes | 191 (18.0%) | 273 (32.5%) |
| 15 to 19 Minutes | 130 (12.2%) | 258 (30.7%) |
| 20 to 24 Minutes | 97 (9.1%) | 67 (8.0%) |
| 25 to 29 Minutes | 62 (5.8%) | 11 (1.3%) |
| 30 to 34 Minutes | 273 (25.7%) | 48 (5.7%) |
| 35 to 39 Minutes | 60 (5.6%) | 84 (10.0%) |
| 40 to 44 Minutes | 14 (1.3%) | 22 (2.6%) |
| 45 to 59 Minutes | 29 (2.7%) | 31 (3.7%) |
| 60 to 89 Minutes | 39 (3.7%) | 0 (0.0%) |
| 90 or more Minutes | 84 (7.9%) | 0 (0.0%) |
Time of Departure to Work by Sex in Palermo
The most frequent times of departure to work in Palermo are 5:00 AM to 5:29 AM (216, 20.3%) for males and 7:30 AM to 7:59 AM (239, 28.4%) for females.
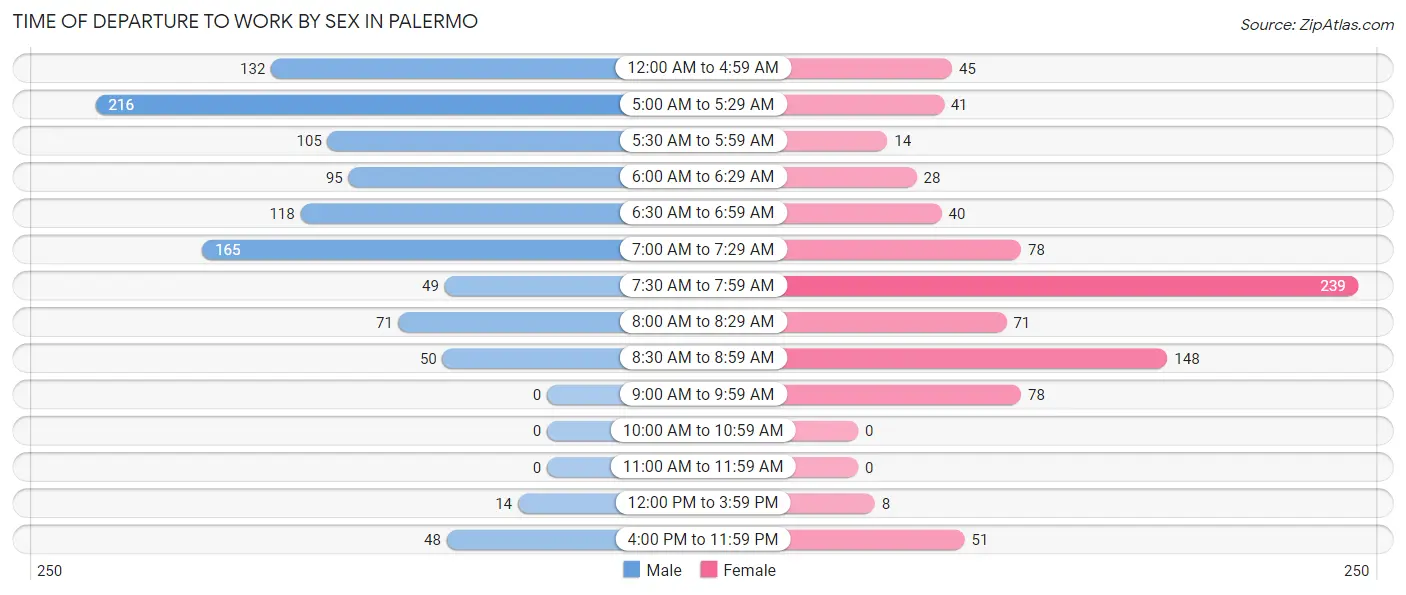
| Time of Departure | Male | Female |
| 12:00 AM to 4:59 AM | 132 (12.4%) | 45 (5.3%) |
| 5:00 AM to 5:29 AM | 216 (20.3%) | 41 (4.9%) |
| 5:30 AM to 5:59 AM | 105 (9.9%) | 14 (1.7%) |
| 6:00 AM to 6:29 AM | 95 (8.9%) | 28 (3.3%) |
| 6:30 AM to 6:59 AM | 118 (11.1%) | 40 (4.8%) |
| 7:00 AM to 7:29 AM | 165 (15.5%) | 78 (9.3%) |
| 7:30 AM to 7:59 AM | 49 (4.6%) | 239 (28.4%) |
| 8:00 AM to 8:29 AM | 71 (6.7%) | 71 (8.4%) |
| 8:30 AM to 8:59 AM | 50 (4.7%) | 148 (17.6%) |
| 9:00 AM to 9:59 AM | 0 (0.0%) | 78 (9.3%) |
| 10:00 AM to 10:59 AM | 0 (0.0%) | 0 (0.0%) |
| 11:00 AM to 11:59 AM | 0 (0.0%) | 0 (0.0%) |
| 12:00 PM to 3:59 PM | 14 (1.3%) | 8 (0.9%) |
| 4:00 PM to 11:59 PM | 48 (4.5%) | 51 (6.1%) |
| Total | 1,063 (100.0%) | 841 (100.0%) |
Housing Occupancy in Palermo
Occupancy by Ownership in Palermo
Of the total 2,088 dwellings in Palermo, owner-occupied units account for 1,381 (66.1%), while renter-occupied units make up 707 (33.9%).
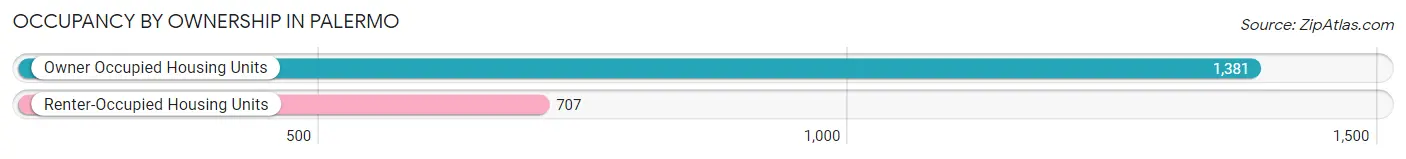
| Occupancy | # Housing Units | % Housing Units |
| Owner Occupied Housing Units | 1,381 | 66.1% |
| Renter-Occupied Housing Units | 707 | 33.9% |
| Total Occupied Housing Units | 2,088 | 100.0% |
Occupancy by Household Size in Palermo
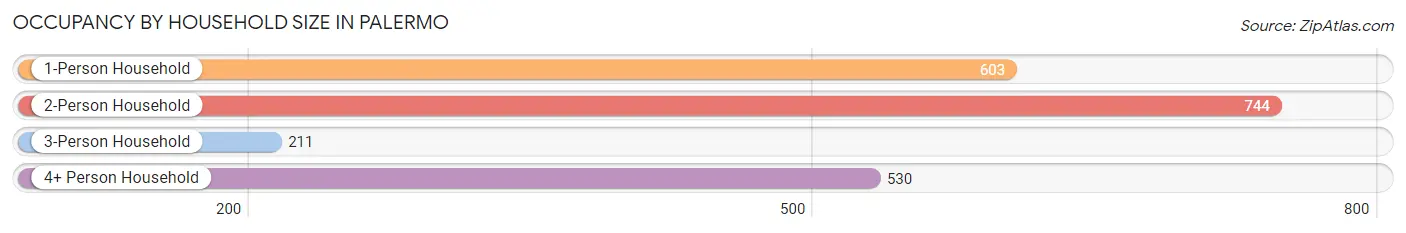
| Household Size | # Housing Units | % Housing Units |
| 1-Person Household | 603 | 28.9% |
| 2-Person Household | 744 | 35.6% |
| 3-Person Household | 211 | 10.1% |
| 4+ Person Household | 530 | 25.4% |
| Total Housing Units | 2,088 | 100.0% |
Occupancy by Ownership by Household Size in Palermo
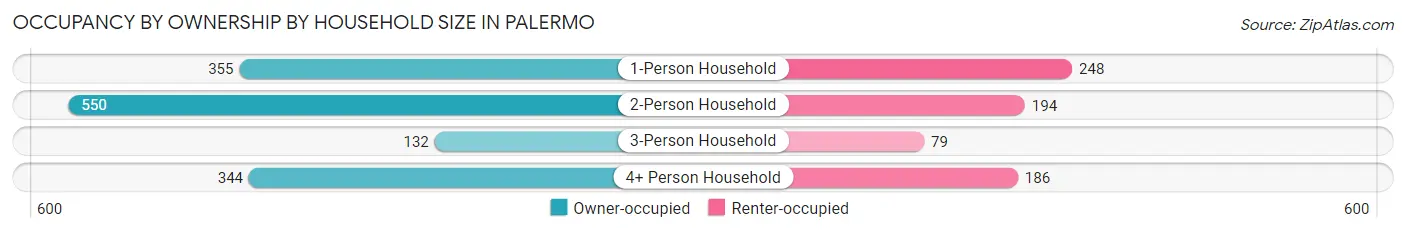
| Household Size | Owner-occupied | Renter-occupied |
| 1-Person Household | 355 (58.9%) | 248 (41.1%) |
| 2-Person Household | 550 (73.9%) | 194 (26.1%) |
| 3-Person Household | 132 (62.6%) | 79 (37.4%) |
| 4+ Person Household | 344 (64.9%) | 186 (35.1%) |
| Total Housing Units | 1,381 (66.1%) | 707 (33.9%) |
Occupancy by Educational Attainment in Palermo
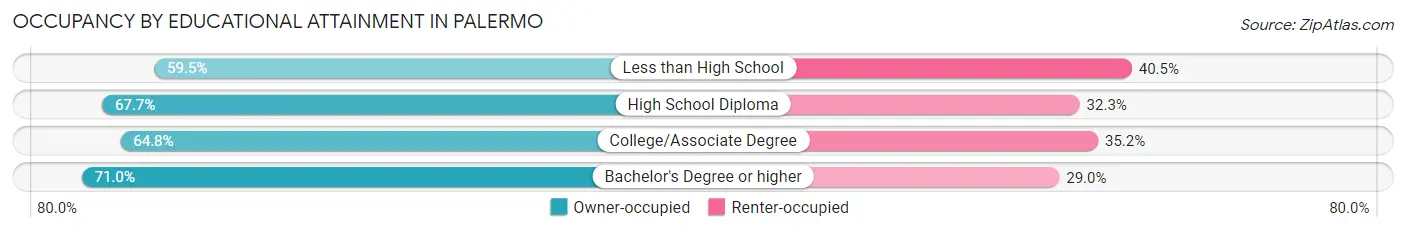
| Household Size | Owner-occupied | Renter-occupied |
| Less than High School | 176 (59.5%) | 120 (40.5%) |
| High School Diploma | 491 (67.7%) | 234 (32.3%) |
| College/Associate Degree | 455 (64.8%) | 247 (35.2%) |
| Bachelor's Degree or higher | 259 (71.0%) | 106 (29.0%) |
Occupancy by Age of Householder in Palermo
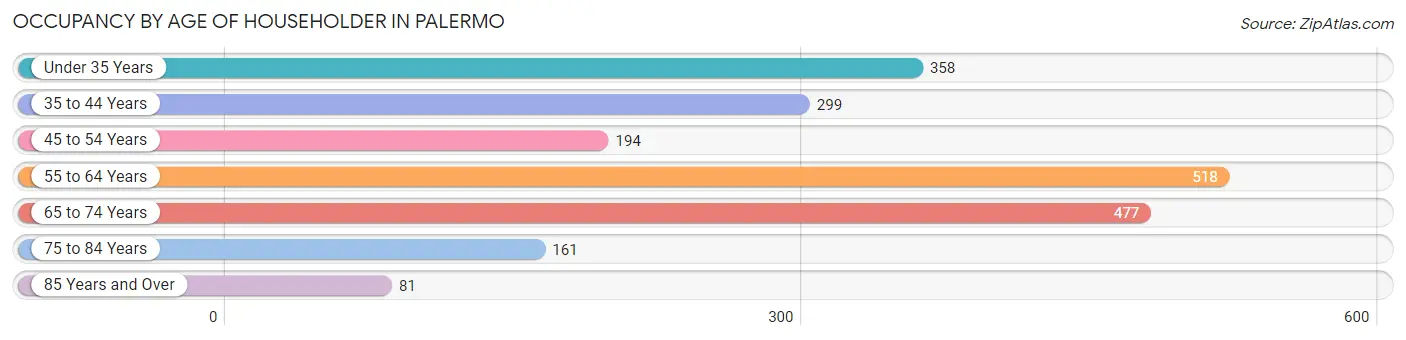
| Age Bracket | # Households | % Households |
| Under 35 Years | 358 | 17.2% |
| 35 to 44 Years | 299 | 14.3% |
| 45 to 54 Years | 194 | 9.3% |
| 55 to 64 Years | 518 | 24.8% |
| 65 to 74 Years | 477 | 22.8% |
| 75 to 84 Years | 161 | 7.7% |
| 85 Years and Over | 81 | 3.9% |
| Total | 2,088 | 100.0% |
Housing Finances in Palermo
Median Income by Occupancy in Palermo
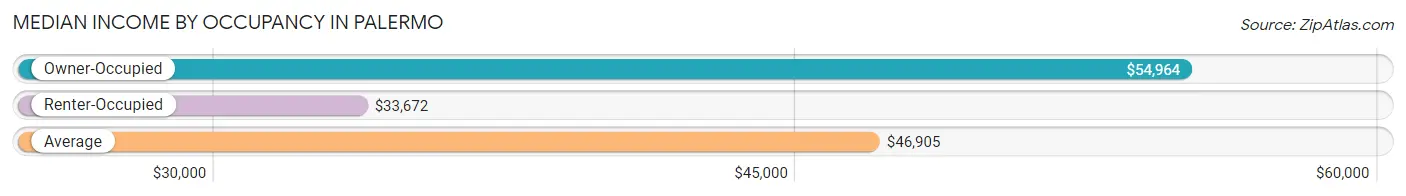
| Occupancy Type | # Households | Median Income |
| Owner-Occupied | 1,381 (66.1%) | $54,964 |
| Renter-Occupied | 707 (33.9%) | $33,672 |
| Average | 2,088 (100.0%) | $46,905 |
Occupancy by Householder Income Bracket in Palermo
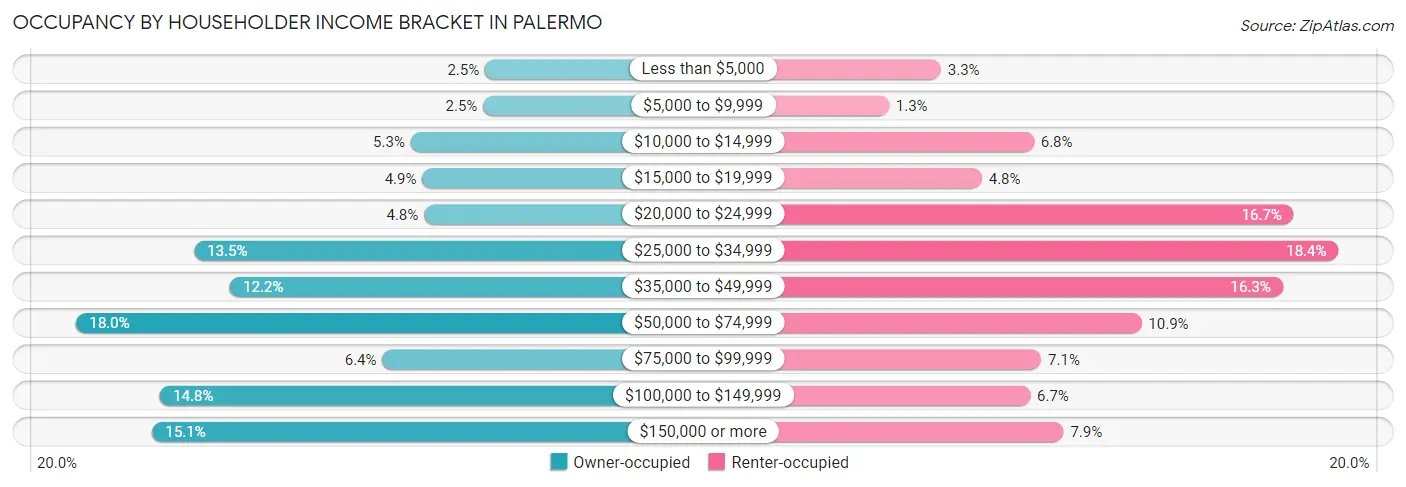
| Income Bracket | Owner-occupied | Renter-occupied |
| Less than $5,000 | 34 (2.5%) | 23 (3.3%) |
| $5,000 to $9,999 | 35 (2.5%) | 9 (1.3%) |
| $10,000 to $14,999 | 73 (5.3%) | 48 (6.8%) |
| $15,000 to $19,999 | 67 (4.9%) | 34 (4.8%) |
| $20,000 to $24,999 | 66 (4.8%) | 118 (16.7%) |
| $25,000 to $34,999 | 187 (13.5%) | 130 (18.4%) |
| $35,000 to $49,999 | 168 (12.2%) | 115 (16.3%) |
| $50,000 to $74,999 | 249 (18.0%) | 77 (10.9%) |
| $75,000 to $99,999 | 88 (6.4%) | 50 (7.1%) |
| $100,000 to $149,999 | 205 (14.8%) | 47 (6.7%) |
| $150,000 or more | 209 (15.1%) | 56 (7.9%) |
| Total | 1,381 (100.0%) | 707 (100.0%) |
Monthly Housing Cost Tiers in Palermo
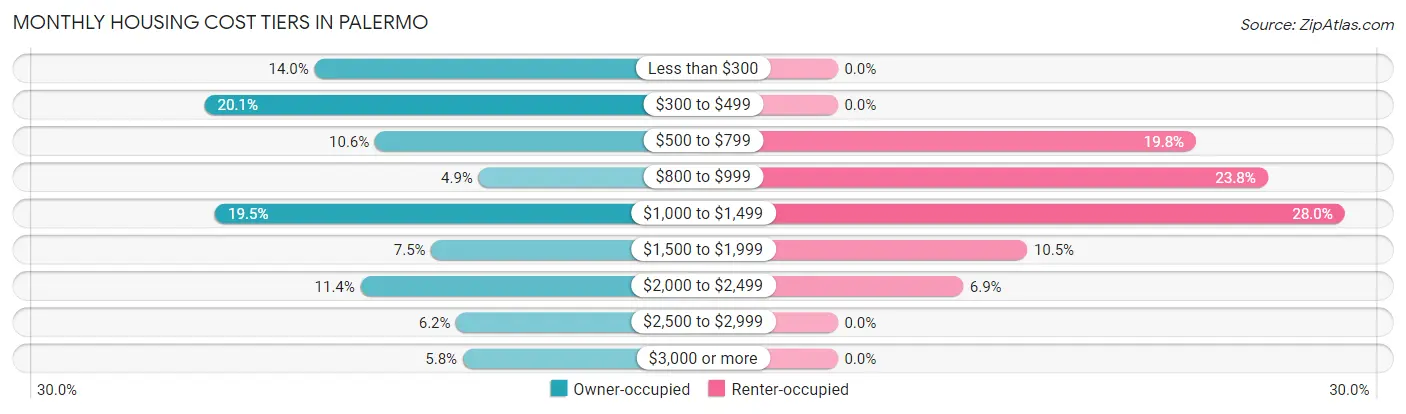
| Monthly Cost | Owner-occupied | Renter-occupied |
| Less than $300 | 193 (14.0%) | 0 (0.0%) |
| $300 to $499 | 277 (20.1%) | 0 (0.0%) |
| $500 to $799 | 147 (10.6%) | 140 (19.8%) |
| $800 to $999 | 68 (4.9%) | 168 (23.8%) |
| $1,000 to $1,499 | 269 (19.5%) | 198 (28.0%) |
| $1,500 to $1,999 | 104 (7.5%) | 74 (10.5%) |
| $2,000 to $2,499 | 158 (11.4%) | 49 (6.9%) |
| $2,500 to $2,999 | 85 (6.1%) | 0 (0.0%) |
| $3,000 or more | 80 (5.8%) | 0 (0.0%) |
| Total | 1,381 (100.0%) | 707 (100.0%) |
Physical Housing Characteristics in Palermo
Housing Structures in Palermo
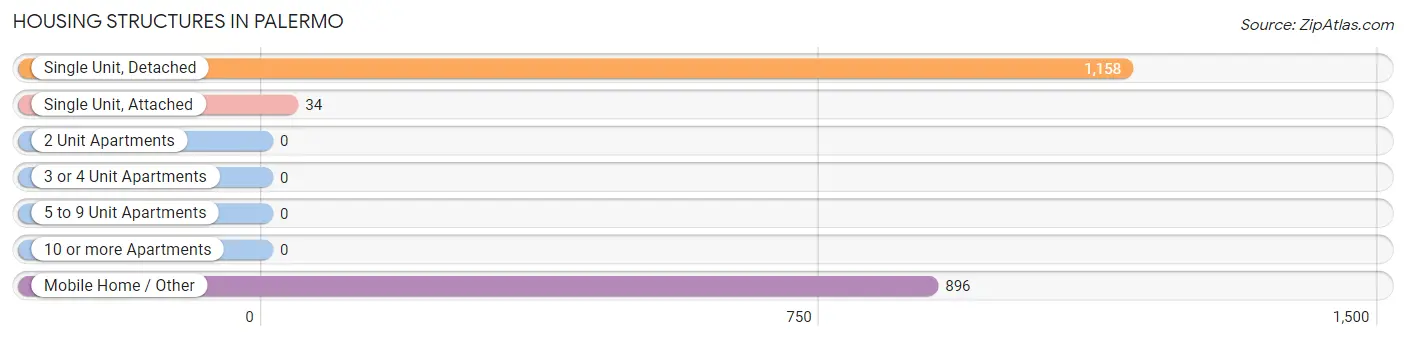
| Structure Type | # Housing Units | % Housing Units |
| Single Unit, Detached | 1,158 | 55.5% |
| Single Unit, Attached | 34 | 1.6% |
| 2 Unit Apartments | 0 | 0.0% |
| 3 or 4 Unit Apartments | 0 | 0.0% |
| 5 to 9 Unit Apartments | 0 | 0.0% |
| 10 or more Apartments | 0 | 0.0% |
| Mobile Home / Other | 896 | 42.9% |
| Total | 2,088 | 100.0% |
Housing Structures by Occupancy in Palermo
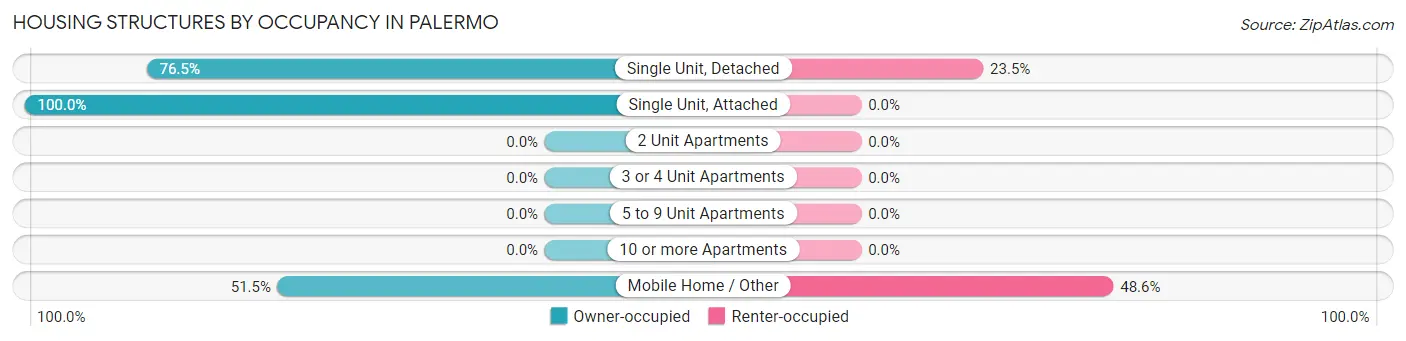
| Structure Type | Owner-occupied | Renter-occupied |
| Single Unit, Detached | 886 (76.5%) | 272 (23.5%) |
| Single Unit, Attached | 34 (100.0%) | 0 (0.0%) |
| 2 Unit Apartments | 0 (0.0%) | 0 (0.0%) |
| 3 or 4 Unit Apartments | 0 (0.0%) | 0 (0.0%) |
| 5 to 9 Unit Apartments | 0 (0.0%) | 0 (0.0%) |
| 10 or more Apartments | 0 (0.0%) | 0 (0.0%) |
| Mobile Home / Other | 461 (51.4%) | 435 (48.5%) |
| Total | 1,381 (66.1%) | 707 (33.9%) |
Housing Structures by Number of Rooms in Palermo
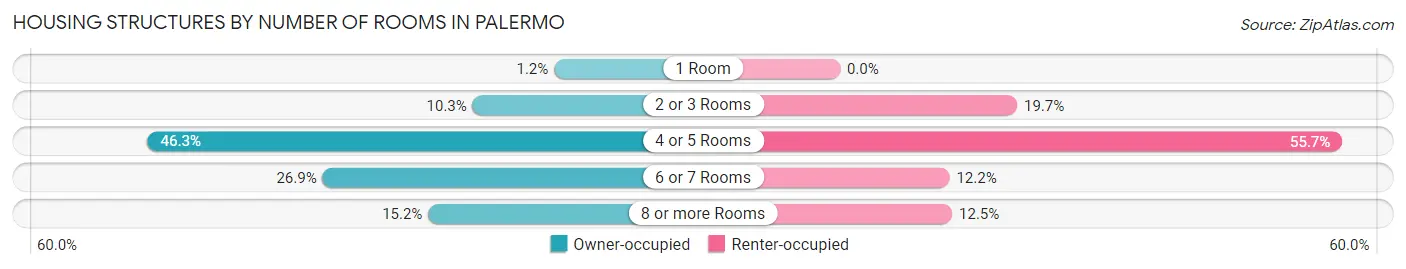
| Number of Rooms | Owner-occupied | Renter-occupied |
| 1 Room | 17 (1.2%) | 0 (0.0%) |
| 2 or 3 Rooms | 142 (10.3%) | 139 (19.7%) |
| 4 or 5 Rooms | 640 (46.3%) | 394 (55.7%) |
| 6 or 7 Rooms | 372 (26.9%) | 86 (12.2%) |
| 8 or more Rooms | 210 (15.2%) | 88 (12.4%) |
| Total | 1,381 (100.0%) | 707 (100.0%) |
Housing Structure by Heating Type in Palermo
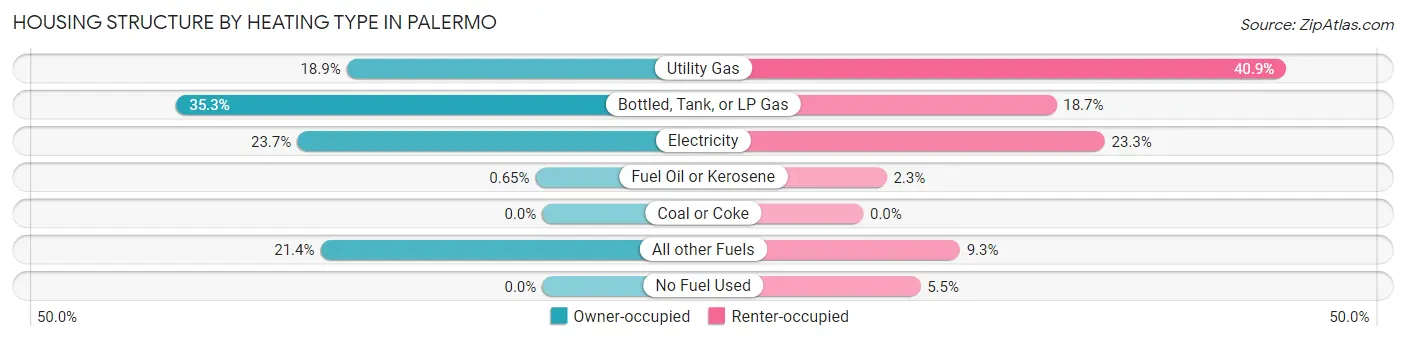
| Heating Type | Owner-occupied | Renter-occupied |
| Utility Gas | 261 (18.9%) | 289 (40.9%) |
| Bottled, Tank, or LP Gas | 488 (35.3%) | 132 (18.7%) |
| Electricity | 327 (23.7%) | 165 (23.3%) |
| Fuel Oil or Kerosene | 9 (0.6%) | 16 (2.3%) |
| Coal or Coke | 0 (0.0%) | 0 (0.0%) |
| All other Fuels | 296 (21.4%) | 66 (9.3%) |
| No Fuel Used | 0 (0.0%) | 39 (5.5%) |
| Total | 1,381 (100.0%) | 707 (100.0%) |
Household Vehicle Usage in Palermo
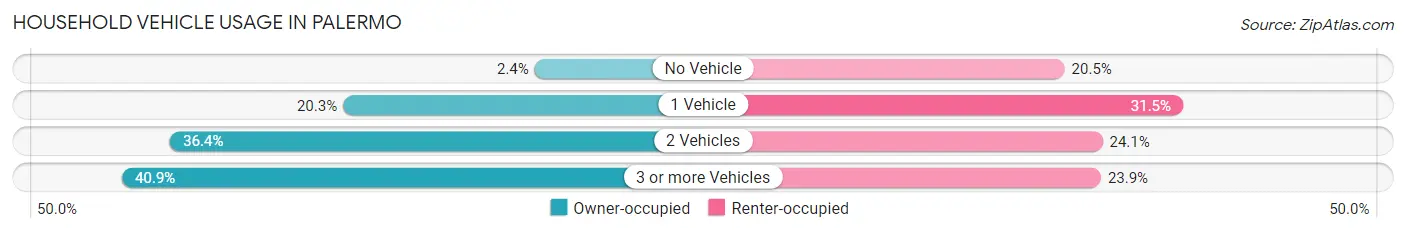
| Vehicles per Household | Owner-occupied | Renter-occupied |
| No Vehicle | 33 (2.4%) | 145 (20.5%) |
| 1 Vehicle | 280 (20.3%) | 223 (31.5%) |
| 2 Vehicles | 503 (36.4%) | 170 (24.0%) |
| 3 or more Vehicles | 565 (40.9%) | 169 (23.9%) |
| Total | 1,381 (100.0%) | 707 (100.0%) |
Real Estate & Mortgages in Palermo
Real Estate and Mortgage Overview in Palermo
| Characteristic | Without Mortgage | With Mortgage |
| Housing Units | 777 | 604 |
| Median Property Value | $172,100 | $323,300 |
| Median Household Income | $45,072 | $160 |
| Monthly Housing Costs | $445 | $80 |
| Real Estate Taxes | $780 | $24 |
Property Value by Mortgage Status in Palermo
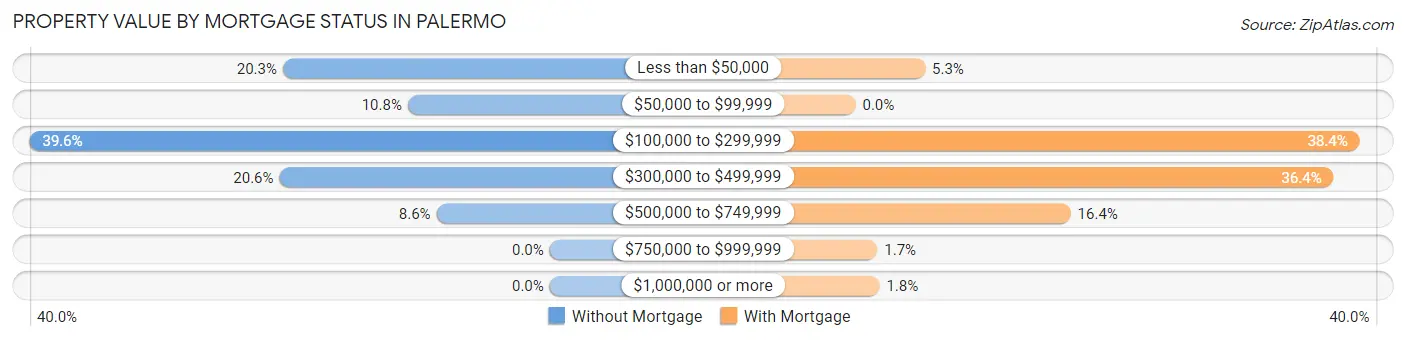
| Property Value | Without Mortgage | With Mortgage |
| Less than $50,000 | 158 (20.3%) | 32 (5.3%) |
| $50,000 to $99,999 | 84 (10.8%) | 0 (0.0%) |
| $100,000 to $299,999 | 308 (39.6%) | 232 (38.4%) |
| $300,000 to $499,999 | 160 (20.6%) | 220 (36.4%) |
| $500,000 to $749,999 | 67 (8.6%) | 99 (16.4%) |
| $750,000 to $999,999 | 0 (0.0%) | 10 (1.7%) |
| $1,000,000 or more | 0 (0.0%) | 11 (1.8%) |
| Total | 777 (100.0%) | 604 (100.0%) |
Household Income by Mortgage Status in Palermo
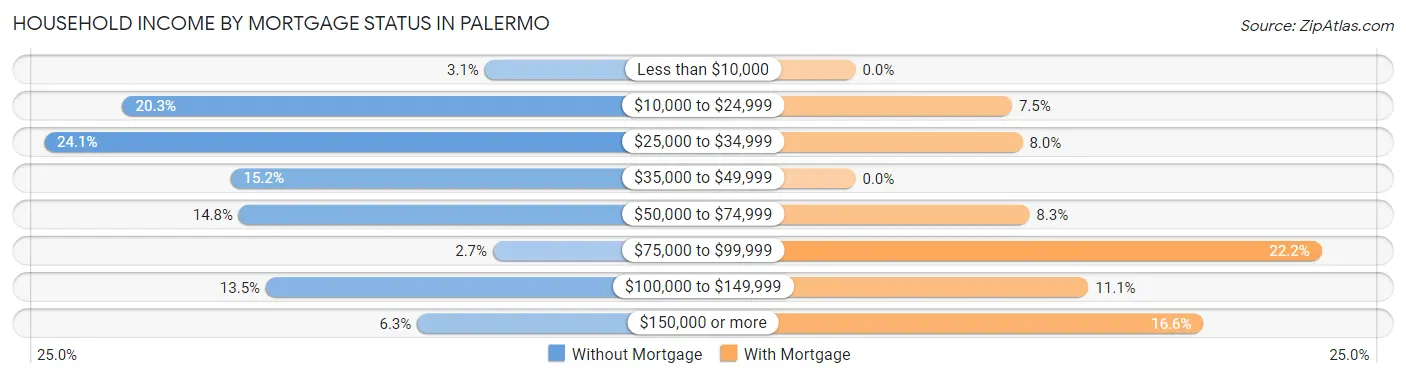
| Household Income | Without Mortgage | With Mortgage |
| Less than $10,000 | 24 (3.1%) | 0 (0.0%) |
| $10,000 to $24,999 | 158 (20.3%) | 45 (7.4%) |
| $25,000 to $34,999 | 187 (24.1%) | 48 (8.0%) |
| $35,000 to $49,999 | 118 (15.2%) | 0 (0.0%) |
| $50,000 to $74,999 | 115 (14.8%) | 50 (8.3%) |
| $75,000 to $99,999 | 21 (2.7%) | 134 (22.2%) |
| $100,000 to $149,999 | 105 (13.5%) | 67 (11.1%) |
| $150,000 or more | 49 (6.3%) | 100 (16.6%) |
| Total | 777 (100.0%) | 604 (100.0%) |
Property Value to Household Income Ratio in Palermo
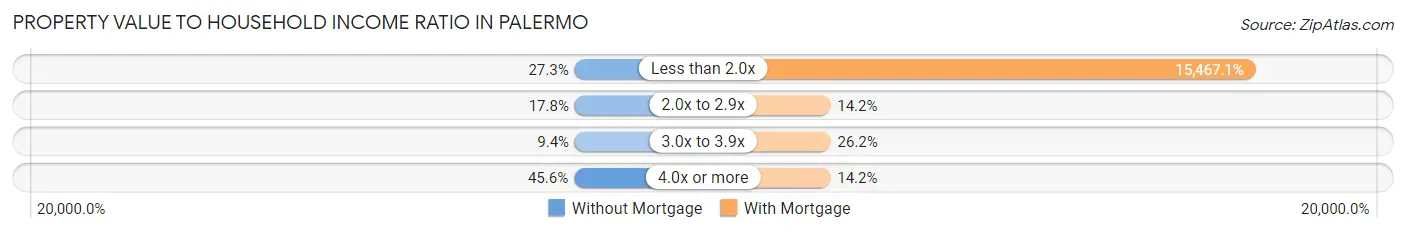
| Value-to-Income Ratio | Without Mortgage | With Mortgage |
| Less than 2.0x | 212 (27.3%) | 93,421 (15,467.1%) |
| 2.0x to 2.9x | 138 (17.8%) | 86 (14.2%) |
| 3.0x to 3.9x | 73 (9.4%) | 158 (26.2%) |
| 4.0x or more | 354 (45.6%) | 86 (14.2%) |
| Total | 777 (100.0%) | 604 (100.0%) |
Real Estate Taxes by Mortgage Status in Palermo
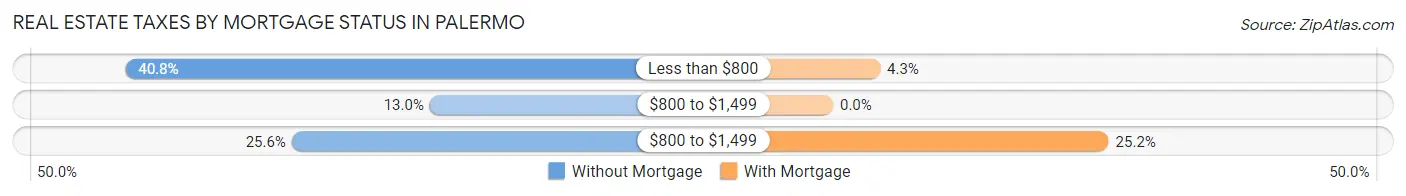
| Property Taxes | Without Mortgage | With Mortgage |
| Less than $800 | 317 (40.8%) | 26 (4.3%) |
| $800 to $1,499 | 101 (13.0%) | 0 (0.0%) |
| $800 to $1,499 | 199 (25.6%) | 152 (25.2%) |
| Total | 777 (100.0%) | 604 (100.0%) |
Health & Disability in Palermo
Health Insurance Coverage by Age in Palermo
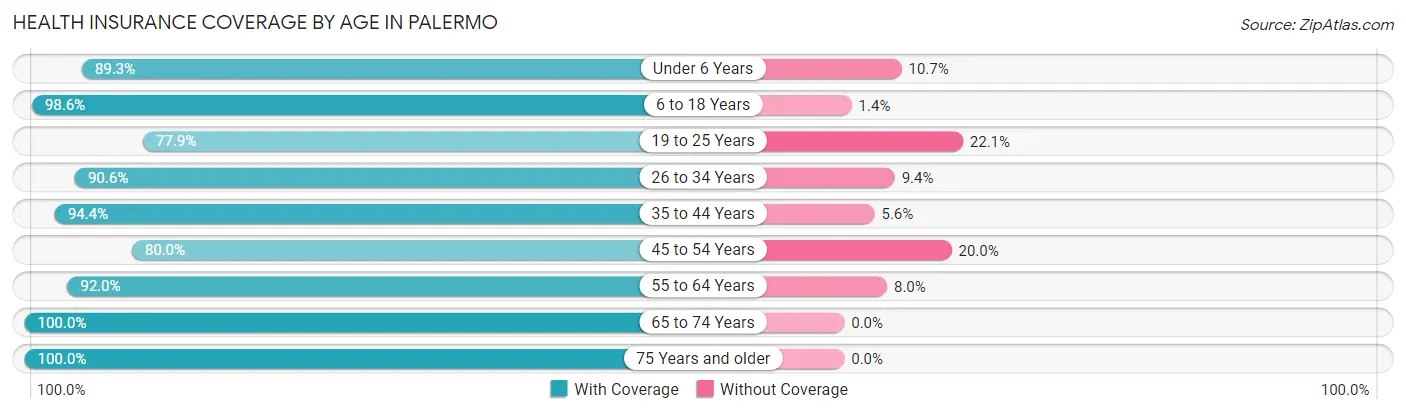
| Age Bracket | With Coverage | Without Coverage |
| Under 6 Years | 435 (89.3%) | 52 (10.7%) |
| 6 to 18 Years | 793 (98.6%) | 11 (1.4%) |
| 19 to 25 Years | 317 (77.9%) | 90 (22.1%) |
| 26 to 34 Years | 578 (90.6%) | 60 (9.4%) |
| 35 to 44 Years | 636 (94.4%) | 38 (5.6%) |
| 45 to 54 Years | 336 (80.0%) | 84 (20.0%) |
| 55 to 64 Years | 855 (92.0%) | 74 (8.0%) |
| 65 to 74 Years | 813 (100.0%) | 0 (0.0%) |
| 75 Years and older | 344 (100.0%) | 0 (0.0%) |
| Total | 5,107 (92.6%) | 409 (7.4%) |
Health Insurance Coverage by Citizenship Status in Palermo
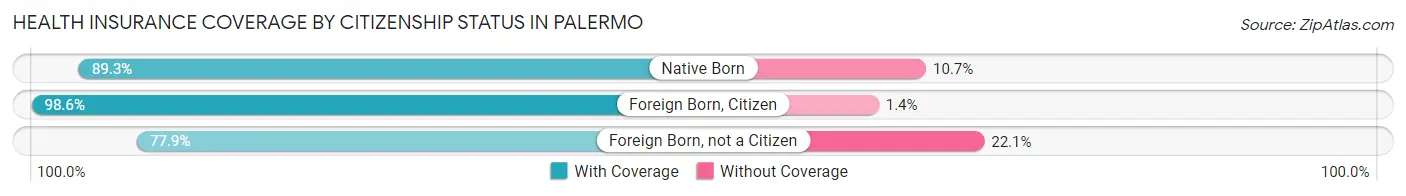
| Citizenship Status | With Coverage | Without Coverage |
| Native Born | 435 (89.3%) | 52 (10.7%) |
| Foreign Born, Citizen | 793 (98.6%) | 11 (1.4%) |
| Foreign Born, not a Citizen | 317 (77.9%) | 90 (22.1%) |
Health Insurance Coverage by Household Income in Palermo
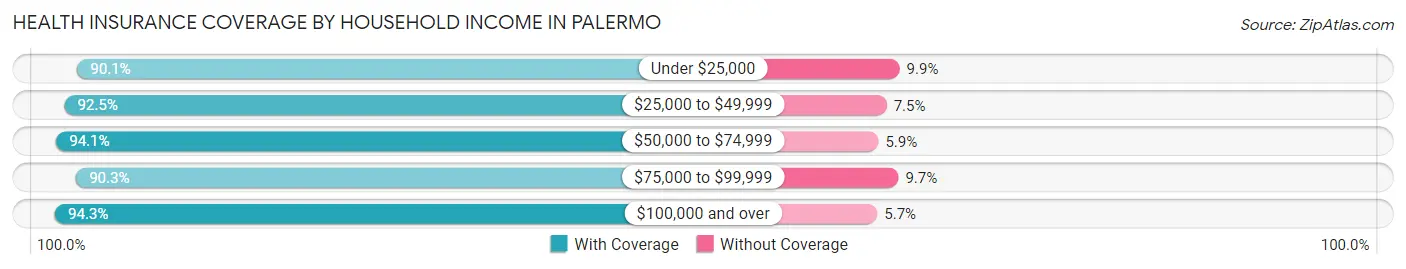
| Household Income | With Coverage | Without Coverage |
| Under $25,000 | 1,010 (90.1%) | 111 (9.9%) |
| $25,000 to $49,999 | 1,372 (92.5%) | 111 (7.5%) |
| $50,000 to $74,999 | 712 (94.1%) | 45 (5.9%) |
| $75,000 to $99,999 | 448 (90.3%) | 48 (9.7%) |
| $100,000 and over | 1,549 (94.3%) | 94 (5.7%) |
Public vs Private Health Insurance Coverage by Age in Palermo
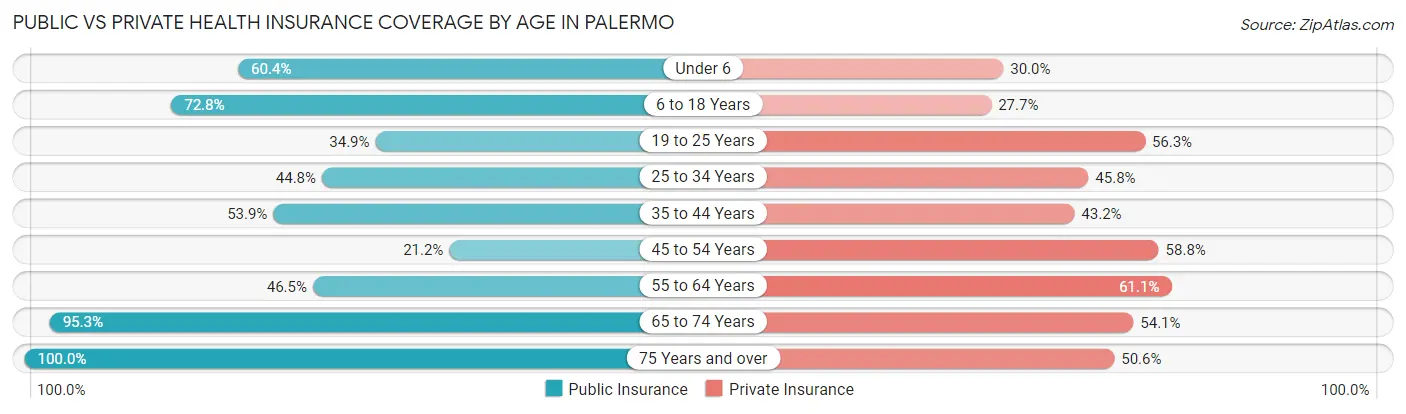
| Age Bracket | Public Insurance | Private Insurance |
| Under 6 | 294 (60.4%) | 146 (30.0%) |
| 6 to 18 Years | 585 (72.8%) | 223 (27.7%) |
| 19 to 25 Years | 142 (34.9%) | 229 (56.3%) |
| 25 to 34 Years | 286 (44.8%) | 292 (45.8%) |
| 35 to 44 Years | 363 (53.9%) | 291 (43.2%) |
| 45 to 54 Years | 89 (21.2%) | 247 (58.8%) |
| 55 to 64 Years | 432 (46.5%) | 568 (61.1%) |
| 65 to 74 Years | 775 (95.3%) | 440 (54.1%) |
| 75 Years and over | 344 (100.0%) | 174 (50.6%) |
| Total | 3,310 (60.0%) | 2,610 (47.3%) |
Disability Status by Sex by Age in Palermo
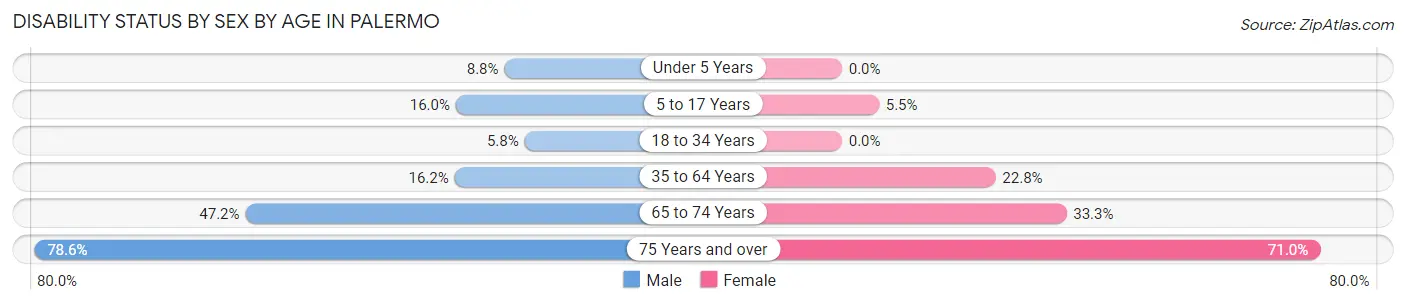
| Age Bracket | Male | Female |
| Under 5 Years | 19 (8.8%) | 0 (0.0%) |
| 5 to 17 Years | 57 (16.0%) | 27 (5.5%) |
| 18 to 34 Years | 40 (5.8%) | 0 (0.0%) |
| 35 to 64 Years | 181 (16.2%) | 206 (22.8%) |
| 65 to 74 Years | 187 (47.2%) | 139 (33.3%) |
| 75 Years and over | 132 (78.6%) | 125 (71.0%) |
Disability Class by Sex by Age in Palermo
Disability Class: Hearing Difficulty
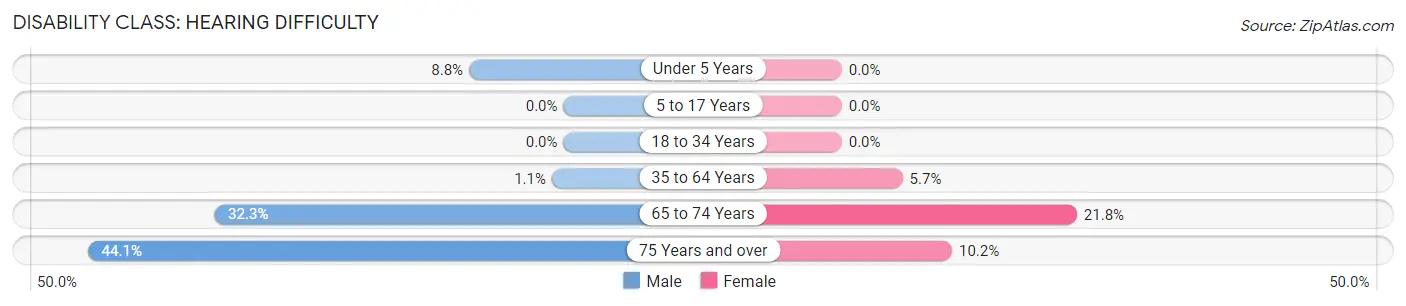
| Age Bracket | Male | Female |
| Under 5 Years | 19 (8.8%) | 0 (0.0%) |
| 5 to 17 Years | 0 (0.0%) | 0 (0.0%) |
| 18 to 34 Years | 0 (0.0%) | 0 (0.0%) |
| 35 to 64 Years | 12 (1.1%) | 51 (5.7%) |
| 65 to 74 Years | 128 (32.3%) | 91 (21.8%) |
| 75 Years and over | 74 (44.1%) | 18 (10.2%) |
Disability Class: Vision Difficulty
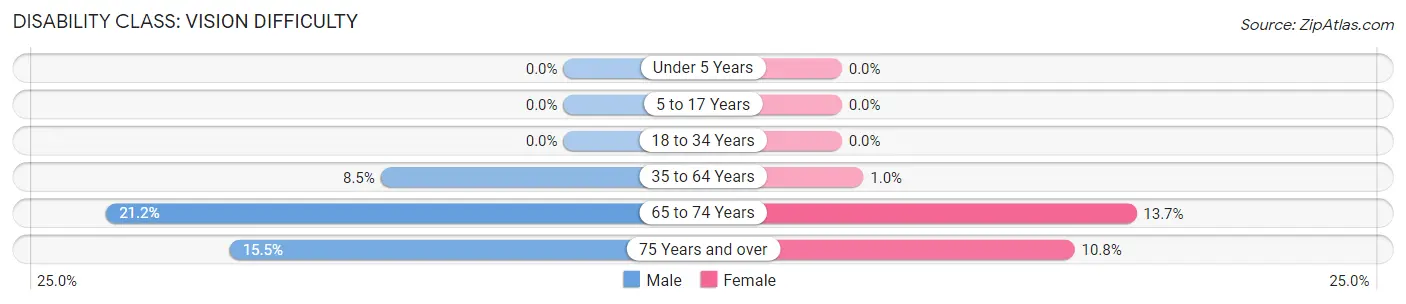
| Age Bracket | Male | Female |
| Under 5 Years | 0 (0.0%) | 0 (0.0%) |
| 5 to 17 Years | 0 (0.0%) | 0 (0.0%) |
| 18 to 34 Years | 0 (0.0%) | 0 (0.0%) |
| 35 to 64 Years | 95 (8.5%) | 9 (1.0%) |
| 65 to 74 Years | 84 (21.2%) | 57 (13.7%) |
| 75 Years and over | 26 (15.5%) | 19 (10.8%) |
Disability Class: Cognitive Difficulty
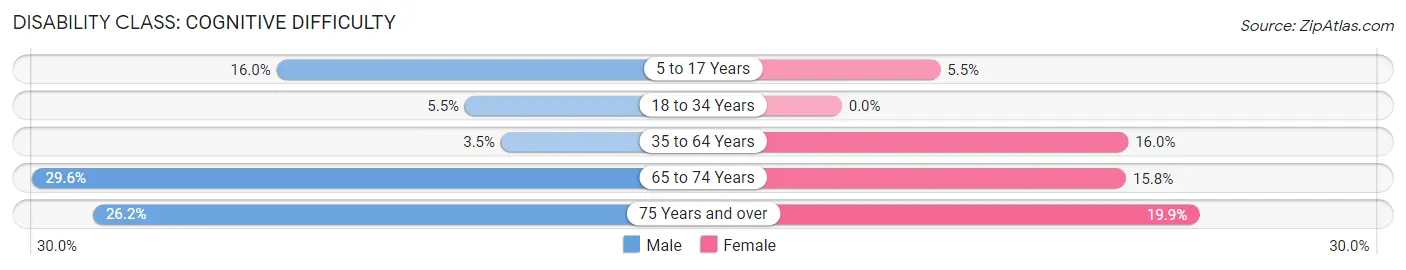
| Age Bracket | Male | Female |
| 5 to 17 Years | 57 (16.0%) | 27 (5.5%) |
| 18 to 34 Years | 38 (5.5%) | 0 (0.0%) |
| 35 to 64 Years | 39 (3.5%) | 144 (16.0%) |
| 65 to 74 Years | 117 (29.5%) | 66 (15.8%) |
| 75 Years and over | 44 (26.2%) | 35 (19.9%) |
Disability Class: Ambulatory Difficulty
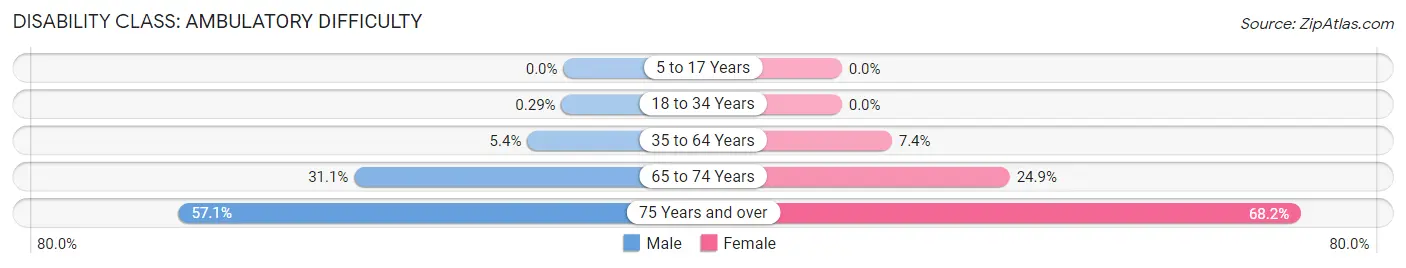
| Age Bracket | Male | Female |
| 5 to 17 Years | 0 (0.0%) | 0 (0.0%) |
| 18 to 34 Years | 2 (0.3%) | 0 (0.0%) |
| 35 to 64 Years | 60 (5.4%) | 67 (7.4%) |
| 65 to 74 Years | 123 (31.1%) | 104 (24.9%) |
| 75 Years and over | 96 (57.1%) | 120 (68.2%) |
Disability Class: Self-Care Difficulty
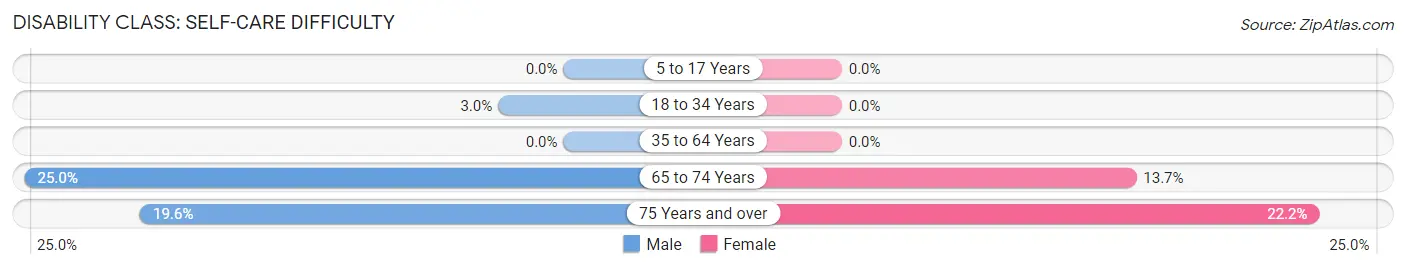
| Age Bracket | Male | Female |
| 5 to 17 Years | 0 (0.0%) | 0 (0.0%) |
| 18 to 34 Years | 21 (3.0%) | 0 (0.0%) |
| 35 to 64 Years | 0 (0.0%) | 0 (0.0%) |
| 65 to 74 Years | 99 (25.0%) | 57 (13.7%) |
| 75 Years and over | 33 (19.6%) | 39 (22.2%) |
Technology Access in Palermo
Computing Device Access in Palermo
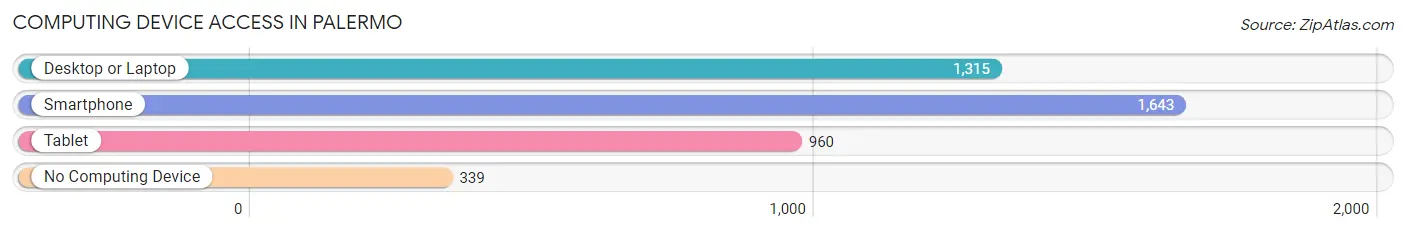
| Device Type | # Households | % Households |
| Desktop or Laptop | 1,315 | 63.0% |
| Smartphone | 1,643 | 78.7% |
| Tablet | 960 | 46.0% |
| No Computing Device | 339 | 16.2% |
| Total | 2,088 | 100.0% |
Internet Access in Palermo
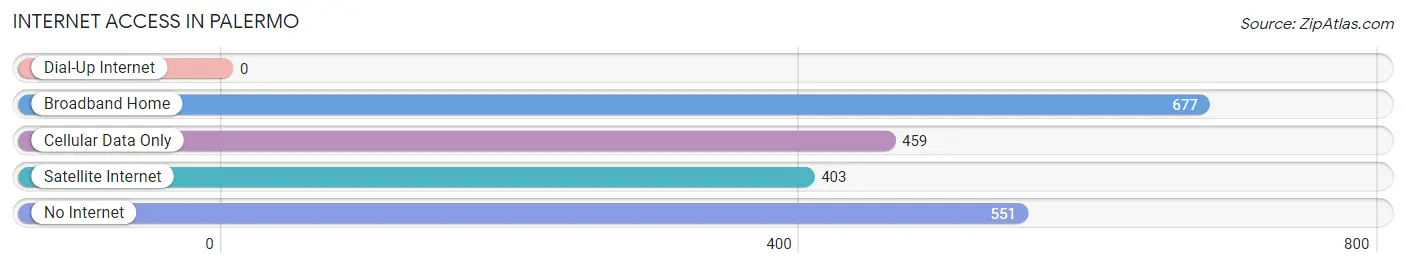
| Internet Type | # Households | % Households |
| Dial-Up Internet | 0 | 0.0% |
| Broadband Home | 677 | 32.4% |
| Cellular Data Only | 459 | 22.0% |
| Satellite Internet | 403 | 19.3% |
| No Internet | 551 | 26.4% |
| Total | 2,088 | 100.0% |
Palermo Summary
Palermo, California is a small unincorporated community located in Butte County, California. It is situated in the foothills of the Sierra Nevada Mountains, approximately 10 miles north of the city of Oroville. The population of Palermo was estimated to be 1,845 in the 2010 census.
History
The area that is now Palermo was originally inhabited by the Maidu Native American tribe. The first European settlers arrived in the area in the mid-1800s, and the town was officially founded in 1856. The town was named after Palermo, Sicily, by the first postmaster, who was of Italian descent.
In the late 1800s, Palermo was a thriving agricultural community, with many of the residents working in the local fruit orchards. The town was also home to several sawmills and lumber mills, which provided employment for many of the residents.
In the early 1900s, Palermo began to experience a decline in population as many of the residents moved away to find work in larger cities. The town was further impacted by the Great Depression, and by the 1940s, the population had dropped to just over 500.
Geography
Palermo is located in the foothills of the Sierra Nevada Mountains, approximately 10 miles north of the city of Oroville. The town is situated at an elevation of 1,100 feet above sea level.
The climate in Palermo is classified as Mediterranean, with hot, dry summers and mild, wet winters. The average annual temperature is around 60 degrees Fahrenheit, and the average annual precipitation is around 20 inches.
Economy
The economy of Palermo is largely based on agriculture. The town is home to several fruit orchards, as well as several wineries and vineyards. The town is also home to several small businesses, including restaurants, shops, and services.
Demographics
As of the 2010 census, the population of Palermo was estimated to be 1,845. The racial makeup of the town was 79.3% White, 0.7% African American, 0.7% Native American, 0.7% Asian, 0.2% Pacific Islander, and 17.3% from other races. The median household income was $41,250, and the median family income was $45,625.
Palermo is a small, rural community with a diverse population. The town is home to a variety of cultures and backgrounds, and is a great place to live and work.
Common Questions
What is Per Capita Income in Palermo?
Per Capita income in Palermo is $29,064.
What is the Median Family Income in Palermo?
Median Family Income in Palermo is $63,980.
What is the Median Household income in Palermo?
Median Household Income in Palermo is $46,905.
What is Income or Wage Gap in Palermo?
Income or Wage Gap in Palermo is 13.5%.
Women in Palermo earn 86.5 cents for every dollar earned by a man.
What is Inequality or Gini Index in Palermo?
Inequality or Gini Index in Palermo is 0.49.
What is the Total Population of Palermo?
Total Population of Palermo is 5,516.
What is the Total Male Population of Palermo?
Total Male Population of Palermo is 2,952.
What is the Total Female Population of Palermo?
Total Female Population of Palermo is 2,564.
What is the Ratio of Males per 100 Females in Palermo?
There are 115.13 Males per 100 Females in Palermo.
What is the Ratio of Females per 100 Males in Palermo?
There are 86.86 Females per 100 Males in Palermo.
What is the Median Population Age in Palermo?
Median Population Age in Palermo is 40.6 Years.
What is the Average Family Size in Palermo
Average Family Size in Palermo is 3.2 People.
What is the Average Household Size in Palermo
Average Household Size in Palermo is 2.6 People.
How Large is the Labor Force in Palermo?
There are 2,460 People in the Labor Forcein in Palermo.
What is the Percentage of People in the Labor Force in Palermo?
55.8% of People are in the Labor Force in Palermo.
What is the Unemployment Rate in Palermo?
Unemployment Rate in Palermo is 11.7%.