Newcastle, CA Map & Demographics
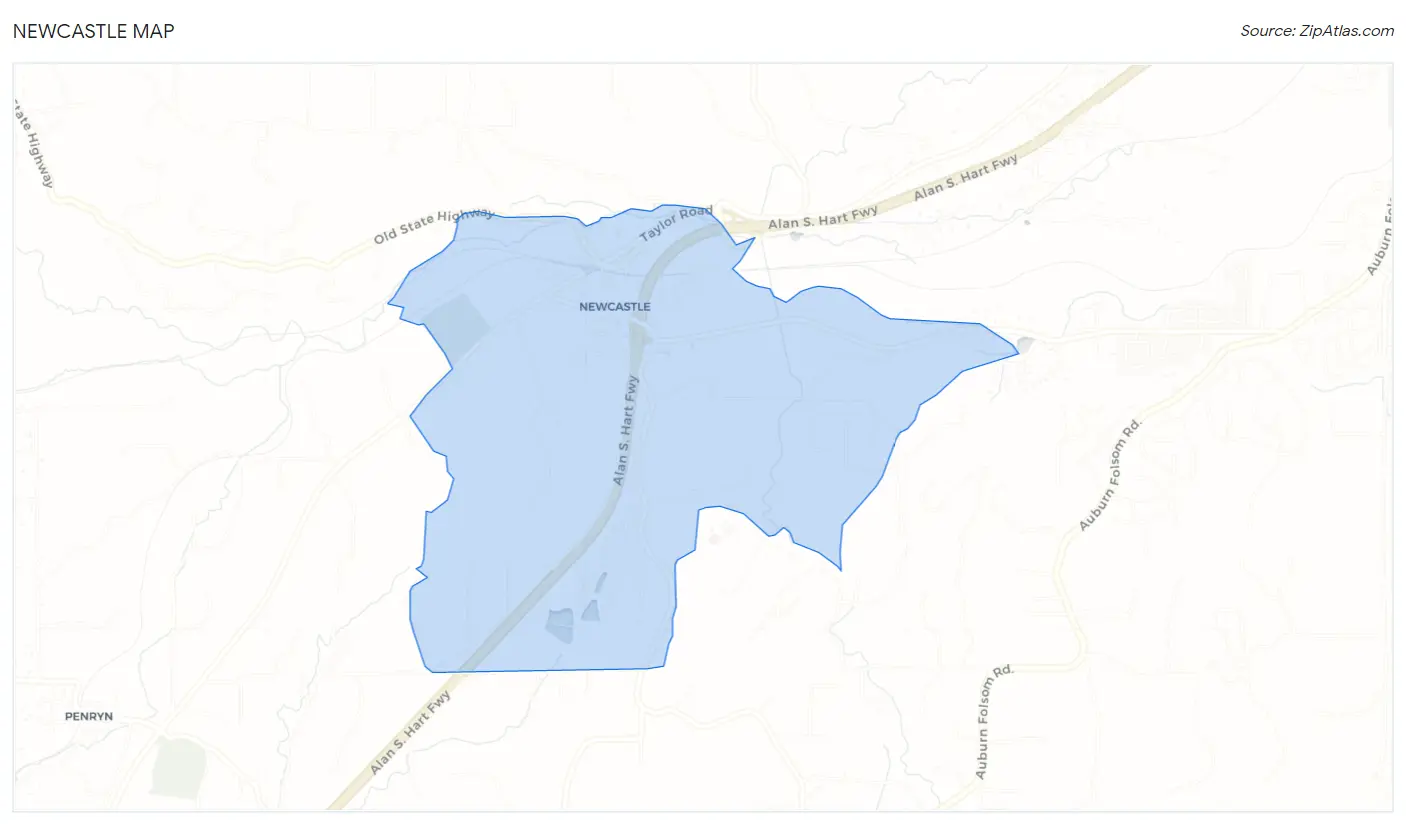
Newcastle Map
Newcastle Overview
$47,152
PER CAPITA INCOME
$147,813
AVG FAMILY INCOME
$101,925
AVG HOUSEHOLD INCOME
50.2%
WAGE / INCOME GAP [ % ]
49.8¢/ $1
WAGE / INCOME GAP [ $ ]
0.42
INEQUALITY / GINI INDEX
1,501
TOTAL POPULATION
764
MALE POPULATION
737
FEMALE POPULATION
103.66
MALES / 100 FEMALES
96.47
FEMALES / 100 MALES
43.2
MEDIAN AGE
3.2
AVG FAMILY SIZE
2.5
AVG HOUSEHOLD SIZE
497
LABOR FORCE [ PEOPLE ]
41.0%
PERCENT IN LABOR FORCE
4.2%
UNEMPLOYMENT RATE
Newcastle Zip Codes
Income in Newcastle
Income Overview in Newcastle
Per Capita Income in Newcastle is $47,152, while median incomes of families and households are $147,813 and $101,925 respectively.
| Characteristic | Number | Measure |
| Per Capita Income | 1,501 | $47,152 |
| Median Family Income | 373 | $147,813 |
| Mean Family Income | 373 | $156,815 |
| Median Household Income | 599 | $101,925 |
| Mean Household Income | 599 | $118,173 |
| Income Deficit | 373 | $0 |
| Wage / Income Gap (%) | 1,501 | 50.16% |
| Wage / Income Gap ($) | 1,501 | 49.84¢ per $1 |
| Gini / Inequality Index | 1,501 | 0.42 |
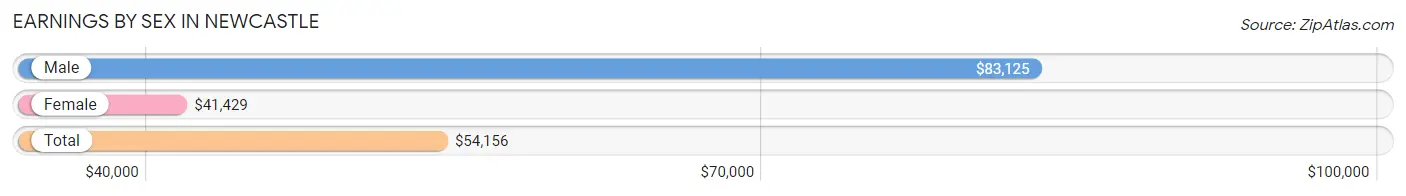
Earnings by Sex in Newcastle
Average Earnings in Newcastle are $54,156, $83,125 for men and $41,429 for women, a difference of 50.2%.
| Sex | Number | Average Earnings |
| Male | 317 (53.6%) | $83,125 |
| Female | 274 (46.4%) | $41,429 |
| Total | 591 (100.0%) | $54,156 |
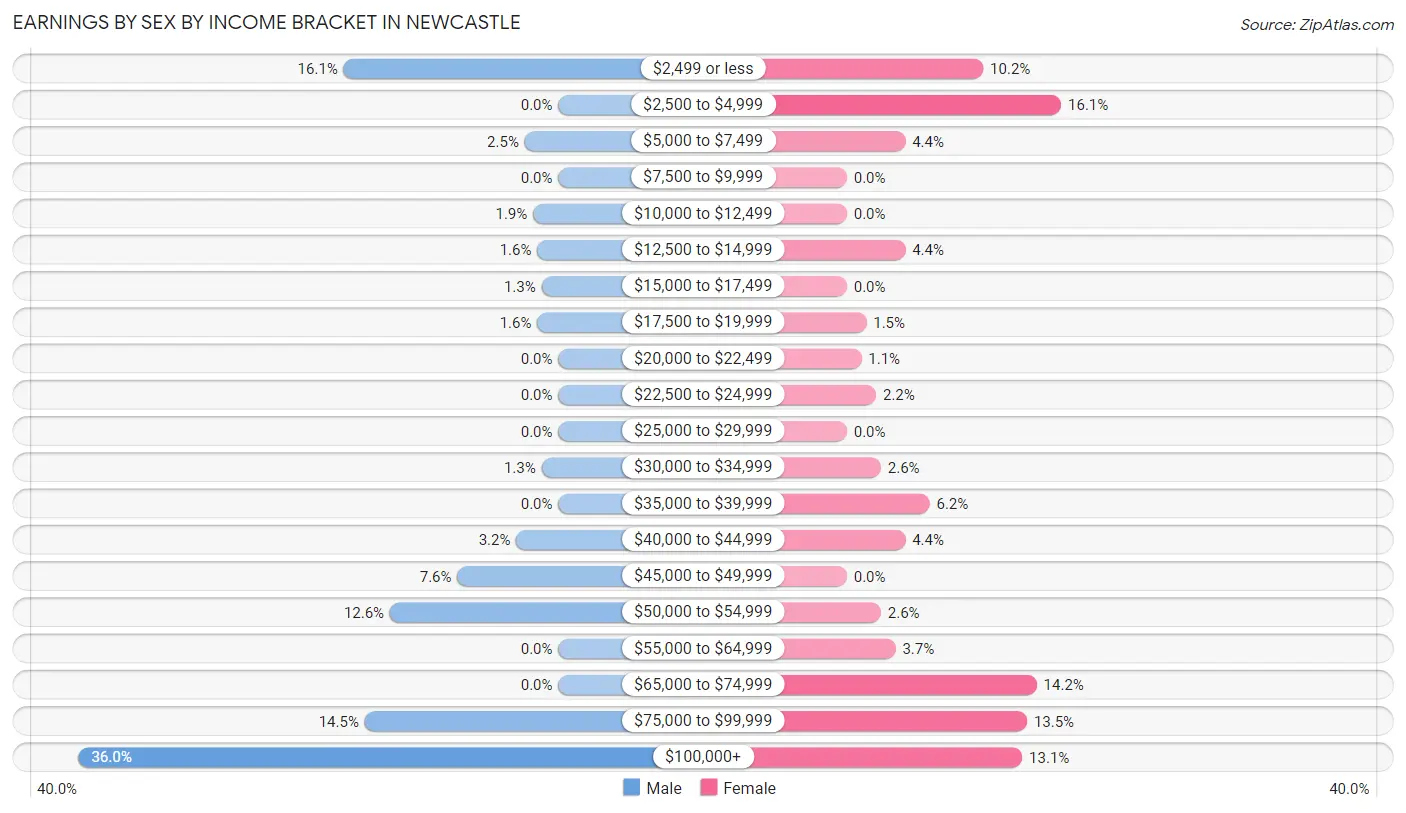
Earnings by Sex by Income Bracket in Newcastle
The most common earnings brackets in Newcastle are $100,000+ for men (114 | 36.0%) and $2,500 to $4,999 for women (44 | 16.1%).
| Income | Male | Female |
| $2,499 or less | 51 (16.1%) | 28 (10.2%) |
| $2,500 to $4,999 | 0 (0.0%) | 44 (16.1%) |
| $5,000 to $7,499 | 8 (2.5%) | 12 (4.4%) |
| $7,500 to $9,999 | 0 (0.0%) | 0 (0.0%) |
| $10,000 to $12,499 | 6 (1.9%) | 0 (0.0%) |
| $12,500 to $14,999 | 5 (1.6%) | 12 (4.4%) |
| $15,000 to $17,499 | 4 (1.3%) | 0 (0.0%) |
| $17,500 to $19,999 | 5 (1.6%) | 4 (1.5%) |
| $20,000 to $22,499 | 0 (0.0%) | 3 (1.1%) |
| $22,500 to $24,999 | 0 (0.0%) | 6 (2.2%) |
| $25,000 to $29,999 | 0 (0.0%) | 0 (0.0%) |
| $30,000 to $34,999 | 4 (1.3%) | 7 (2.5%) |
| $35,000 to $39,999 | 0 (0.0%) | 17 (6.2%) |
| $40,000 to $44,999 | 10 (3.2%) | 12 (4.4%) |
| $45,000 to $49,999 | 24 (7.6%) | 0 (0.0%) |
| $50,000 to $54,999 | 40 (12.6%) | 7 (2.5%) |
| $55,000 to $64,999 | 0 (0.0%) | 10 (3.6%) |
| $65,000 to $74,999 | 0 (0.0%) | 39 (14.2%) |
| $75,000 to $99,999 | 46 (14.5%) | 37 (13.5%) |
| $100,000+ | 114 (36.0%) | 36 (13.1%) |
| Total | 317 (100.0%) | 274 (100.0%) |
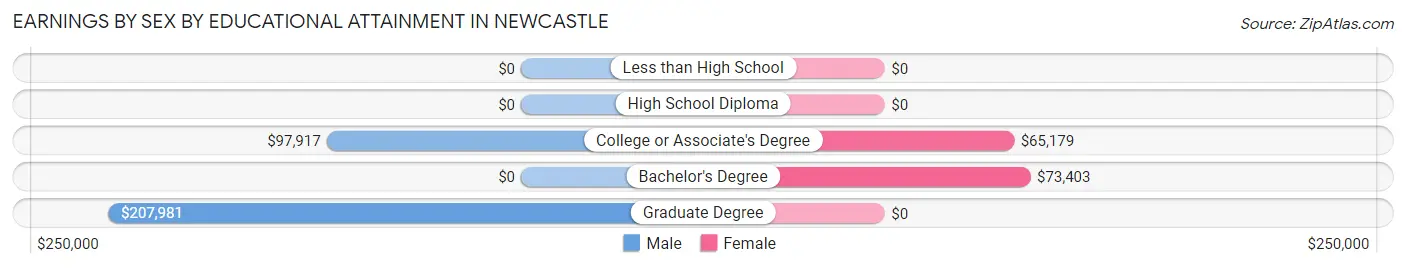
Earnings by Sex by Educational Attainment in Newcastle
Average earnings in Newcastle are $85,521 for men and $52,143 for women, a difference of 39.0%. Men with an educational attainment of graduate degree enjoy the highest average annual earnings of $207,981, while those with college or associate's degree education earn the least with $97,917. Women with an educational attainment of bachelor's degree earn the most with the average annual earnings of $73,403, while those with college or associate's degree education have the smallest earnings of $65,179.
| Educational Attainment | Male Income | Female Income |
| Less than High School | - | - |
| High School Diploma | - | - |
| College or Associate's Degree | $97,917 | $65,179 |
| Bachelor's Degree | - | - |
| Graduate Degree | $207,981 | $0 |
| Total | $85,521 | $52,143 |
Family Income in Newcastle
Family Income Brackets in Newcastle
According to the Newcastle family income data, there are 115 families falling into the $150,000 to $199,999 income range, which is the most common income bracket and makes up 30.8% of all families.
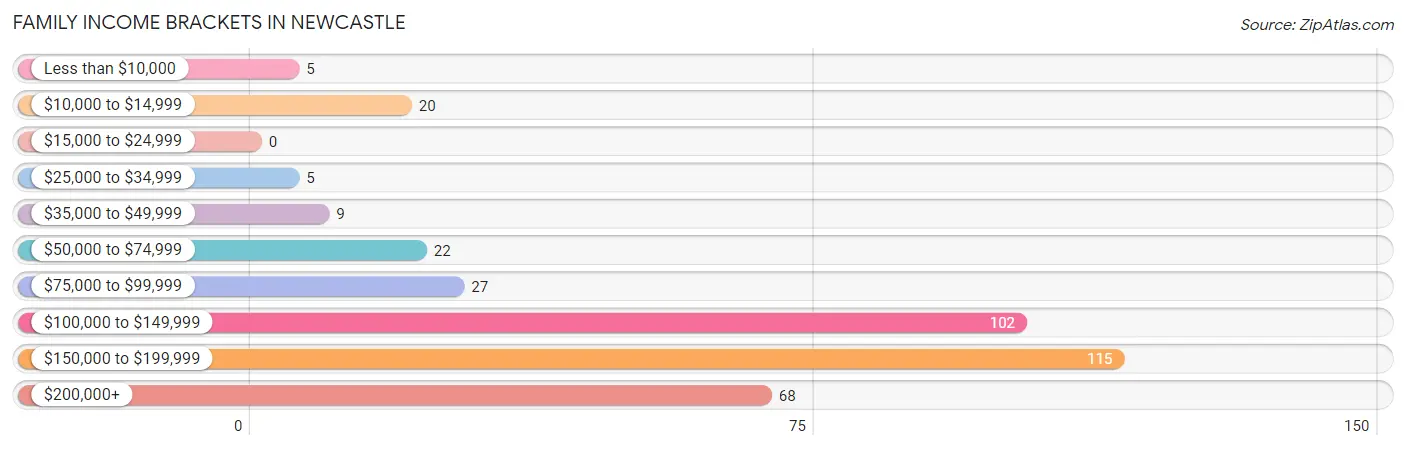
| Income Bracket | # Families | % Families |
| Less than $10,000 | 5 | 1.3% |
| $10,000 to $14,999 | 20 | 5.4% |
| $15,000 to $24,999 | 0 | 0.0% |
| $25,000 to $34,999 | 5 | 1.3% |
| $35,000 to $49,999 | 9 | 2.4% |
| $50,000 to $74,999 | 22 | 5.9% |
| $75,000 to $99,999 | 27 | 7.2% |
| $100,000 to $149,999 | 102 | 27.3% |
| $150,000 to $199,999 | 115 | 30.8% |
| $200,000+ | 68 | 18.2% |
Family Income by Famaliy Size in Newcastle
2-person families (215 | 57.6%) account for the highest median family income in Newcastle with $160,347 per family, while 2-person families (215 | 57.6%) have the highest median income of $80,174 per family member.
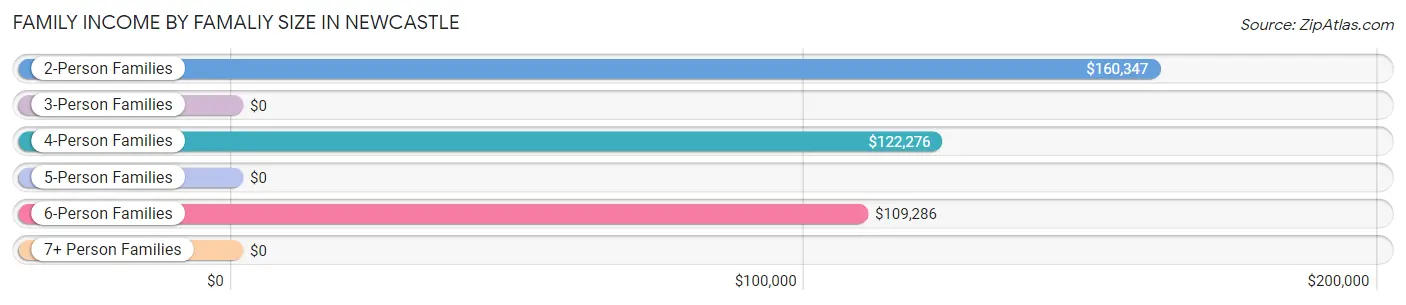
| Income Bracket | # Families | Median Income |
| 2-Person Families | 215 (57.6%) | $160,347 |
| 3-Person Families | 19 (5.1%) | $0 |
| 4-Person Families | 85 (22.8%) | $122,276 |
| 5-Person Families | 10 (2.7%) | $0 |
| 6-Person Families | 24 (6.4%) | $109,286 |
| 7+ Person Families | 20 (5.4%) | $0 |
| Total | 373 (100.0%) | $147,813 |
Family Income by Number of Earners in Newcastle
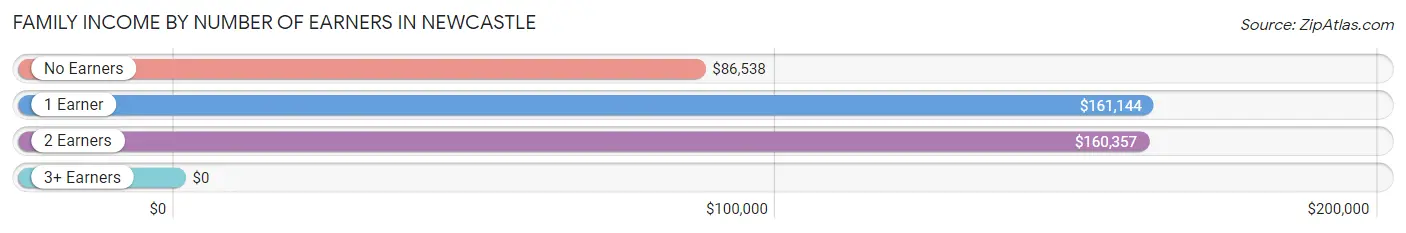
| Number of Earners | # Families | Median Income |
| No Earners | 86 (23.1%) | $86,538 |
| 1 Earner | 131 (35.1%) | $161,144 |
| 2 Earners | 144 (38.6%) | $160,357 |
| 3+ Earners | 12 (3.2%) | $0 |
| Total | 373 (100.0%) | $147,813 |
Household Income in Newcastle
Household Income Brackets in Newcastle
With 150 households falling in the category, the $100,000 to $149,999 income range is the most frequent in Newcastle, accounting for 25.0% of all households. In contrast, only 15 households (2.5%) fall into the less than $10,000 income bracket, making it the least populous group.
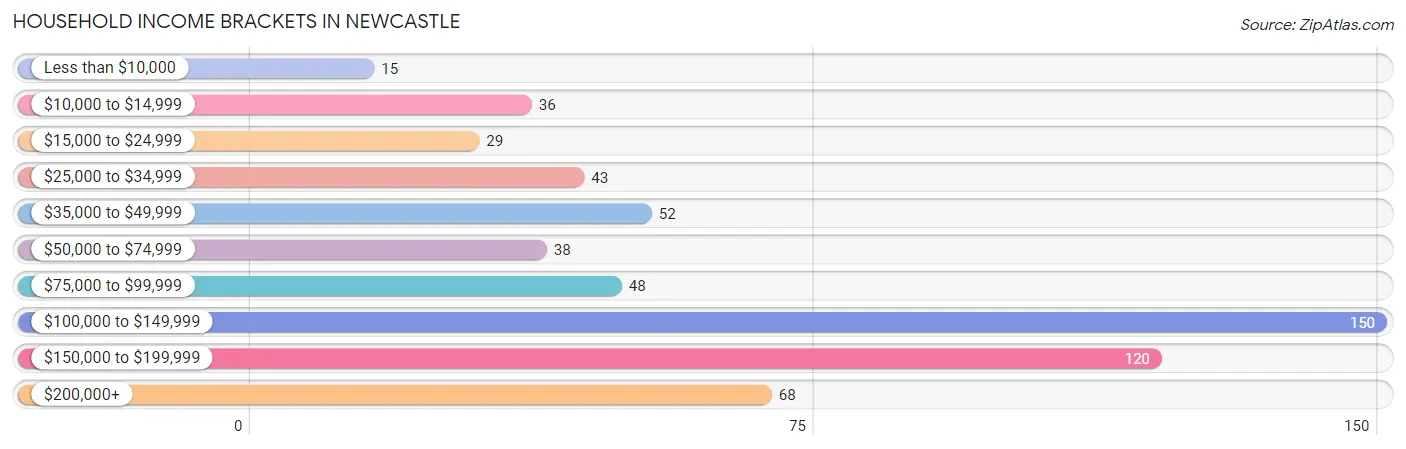
| Income Bracket | # Households | % Households |
| Less than $10,000 | 15 | 2.5% |
| $10,000 to $14,999 | 36 | 6.0% |
| $15,000 to $24,999 | 29 | 4.8% |
| $25,000 to $34,999 | 43 | 7.2% |
| $35,000 to $49,999 | 52 | 8.7% |
| $50,000 to $74,999 | 38 | 6.3% |
| $75,000 to $99,999 | 48 | 8.0% |
| $100,000 to $149,999 | 150 | 25.0% |
| $150,000 to $199,999 | 120 | 20.0% |
| $200,000+ | 68 | 11.4% |
Household Income by Householder Age in Newcastle
The median household income in Newcastle is $101,925, with the highest median household income of $166,144 found in the 25 to 44 years age bracket for the primary householder. A total of 155 households (25.9%) fall into this category.
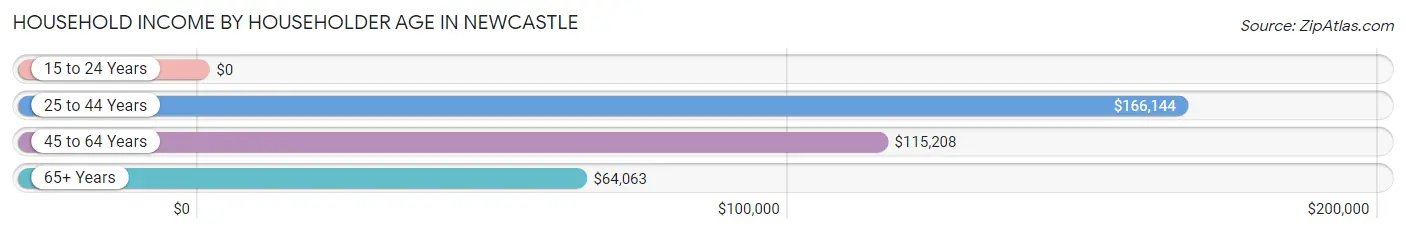
| Income Bracket | # Households | Median Income |
| 15 to 24 Years | 0 (0.0%) | $0 |
| 25 to 44 Years | 155 (25.9%) | $166,144 |
| 45 to 64 Years | 101 (16.9%) | $115,208 |
| 65+ Years | 343 (57.3%) | $64,063 |
| Total | 599 (100.0%) | $101,925 |
Poverty in Newcastle
Income Below Poverty by Sex and Age in Newcastle
With 2.4% poverty level for males and 17.1% for females among the residents of Newcastle, 75 year old and over males and 25 to 34 year old females are the most vulnerable to poverty, with 5 males (6.6%) and 38 females (47.5%) in their respective age groups living below the poverty level.
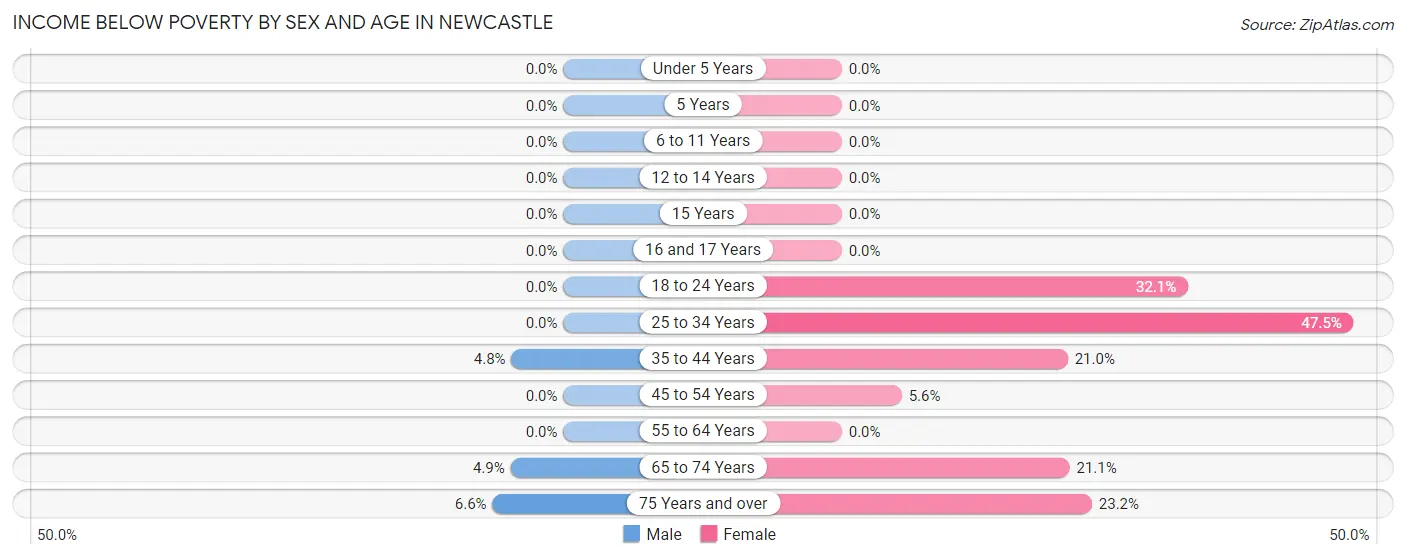
| Age Bracket | Male | Female |
| Under 5 Years | 0 (0.0%) | 0 (0.0%) |
| 5 Years | 0 (0.0%) | 0 (0.0%) |
| 6 to 11 Years | 0 (0.0%) | 0 (0.0%) |
| 12 to 14 Years | 0 (0.0%) | 0 (0.0%) |
| 15 Years | 0 (0.0%) | 0 (0.0%) |
| 16 and 17 Years | 0 (0.0%) | 0 (0.0%) |
| 18 to 24 Years | 0 (0.0%) | 9 (32.1%) |
| 25 to 34 Years | 0 (0.0%) | 38 (47.5%) |
| 35 to 44 Years | 8 (4.8%) | 13 (21.0%) |
| 45 to 54 Years | 0 (0.0%) | 3 (5.6%) |
| 55 to 64 Years | 0 (0.0%) | 0 (0.0%) |
| 65 to 74 Years | 5 (4.9%) | 37 (21.1%) |
| 75 Years and over | 5 (6.6%) | 26 (23.2%) |
| Total | 18 (2.4%) | 126 (17.1%) |
Income Above Poverty by Sex and Age in Newcastle
According to the poverty statistics in Newcastle, males aged under 5 years and females aged under 5 years are the age groups that are most secure financially, with 100.0% of males and 100.0% of females in these age groups living above the poverty line.
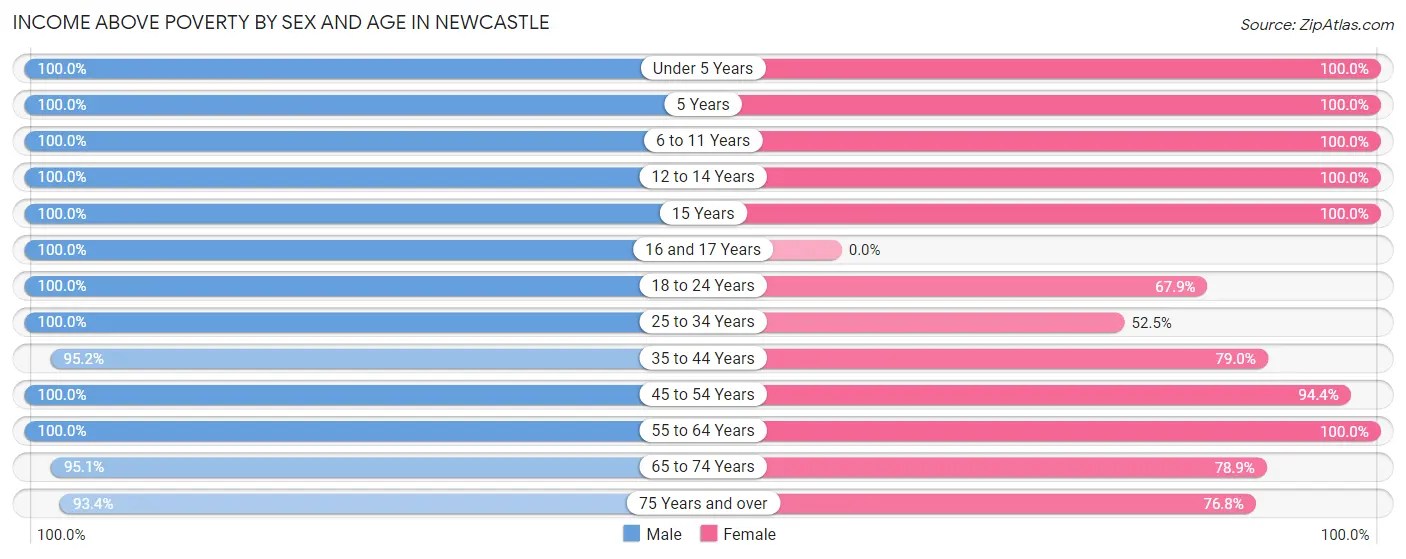
| Age Bracket | Male | Female |
| Under 5 Years | 7 (100.0%) | 29 (100.0%) |
| 5 Years | 14 (100.0%) | 14 (100.0%) |
| 6 to 11 Years | 76 (100.0%) | 67 (100.0%) |
| 12 to 14 Years | 35 (100.0%) | 21 (100.0%) |
| 15 Years | 8 (100.0%) | 19 (100.0%) |
| 16 and 17 Years | 10 (100.0%) | 0 (0.0%) |
| 18 to 24 Years | 14 (100.0%) | 19 (67.9%) |
| 25 to 34 Years | 146 (100.0%) | 42 (52.5%) |
| 35 to 44 Years | 158 (95.2%) | 49 (79.0%) |
| 45 to 54 Years | 23 (100.0%) | 51 (94.4%) |
| 55 to 64 Years | 87 (100.0%) | 76 (100.0%) |
| 65 to 74 Years | 97 (95.1%) | 138 (78.9%) |
| 75 Years and over | 71 (93.4%) | 86 (76.8%) |
| Total | 746 (97.6%) | 611 (82.9%) |
Income Below Poverty Among Married-Couple Families in Newcastle
The poverty statistics for married-couple families in Newcastle show that 1.9% or 5 of the total 260 families live below the poverty line. Families with no children have the highest poverty rate of 3.0%, comprising of 5 families. On the other hand, families with 1 or 2 children have the lowest poverty rate of 0.0%, which includes 0 families.
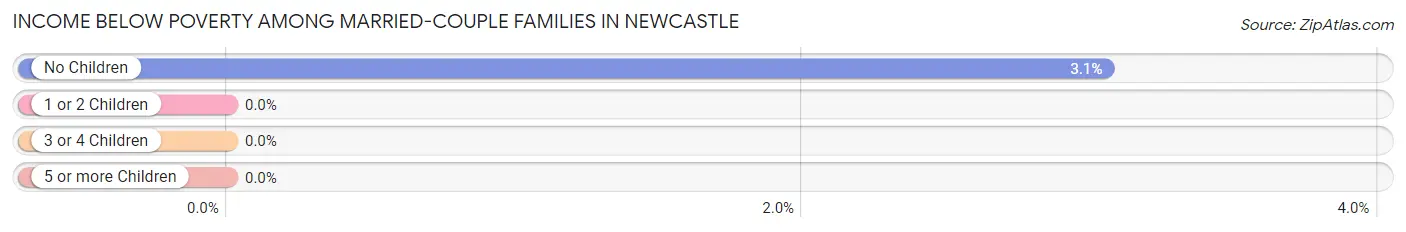
| Children | Above Poverty | Below Poverty |
| No Children | 159 (97.0%) | 5 (3.0%) |
| 1 or 2 Children | 52 (100.0%) | 0 (0.0%) |
| 3 or 4 Children | 24 (100.0%) | 0 (0.0%) |
| 5 or more Children | 20 (100.0%) | 0 (0.0%) |
| Total | 255 (98.1%) | 5 (1.9%) |
Income Below Poverty Among Single-Parent Households in Newcastle
According to the poverty data in Newcastle, 8.2% or 5 single-father households and 28.8% or 15 single-mother households are living below the poverty line. Among single-father households, those with no children have the highest poverty rate, with 5 households (8.2%) experiencing poverty. Likewise, among single-mother households, those with no children have the highest poverty rate, with 15 households (71.4%) falling below the poverty line.
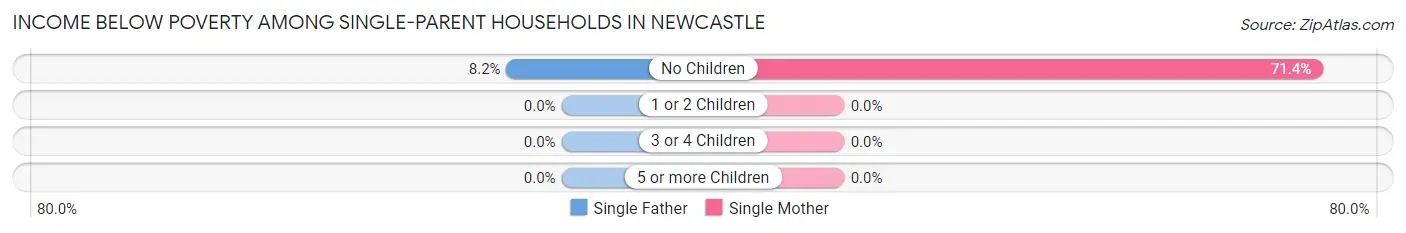
| Children | Single Father | Single Mother |
| No Children | 5 (8.2%) | 15 (71.4%) |
| 1 or 2 Children | 0 (0.0%) | 0 (0.0%) |
| 3 or 4 Children | 0 (0.0%) | 0 (0.0%) |
| 5 or more Children | 0 (0.0%) | 0 (0.0%) |
| Total | 5 (8.2%) | 15 (28.8%) |
Income Below Poverty Among Married-Couple vs Single-Parent Households in Newcastle
The poverty data for Newcastle shows that 5 of the married-couple family households (1.9%) and 20 of the single-parent households (17.7%) are living below the poverty level. Within the married-couple family households, those with no children have the highest poverty rate, with 5 households (3.0%) falling below the poverty line. Among the single-parent households, those with no children have the highest poverty rate, with 20 household (24.4%) living below poverty.
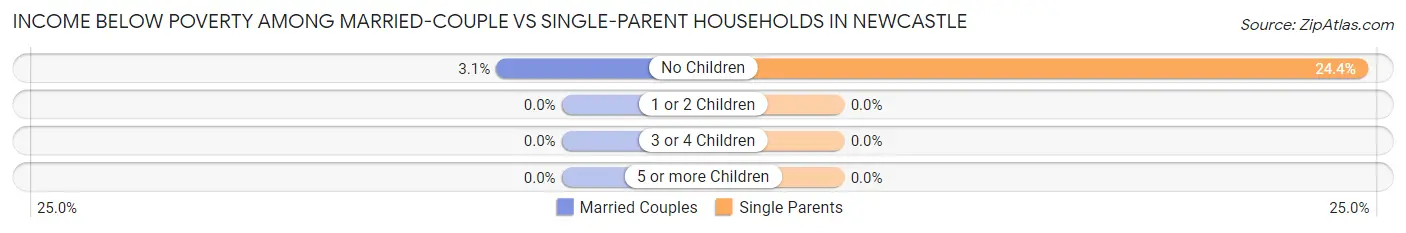
| Children | Married-Couple Families | Single-Parent Households |
| No Children | 5 (3.0%) | 20 (24.4%) |
| 1 or 2 Children | 0 (0.0%) | 0 (0.0%) |
| 3 or 4 Children | 0 (0.0%) | 0 (0.0%) |
| 5 or more Children | 0 (0.0%) | 0 (0.0%) |
| Total | 5 (1.9%) | 20 (17.7%) |
Race in Newcastle
The most populous races in Newcastle are White / Caucasian (1,277 | 85.1%), Hispanic or Latino (247 | 16.5%), and Two or more Races (172 | 11.5%).
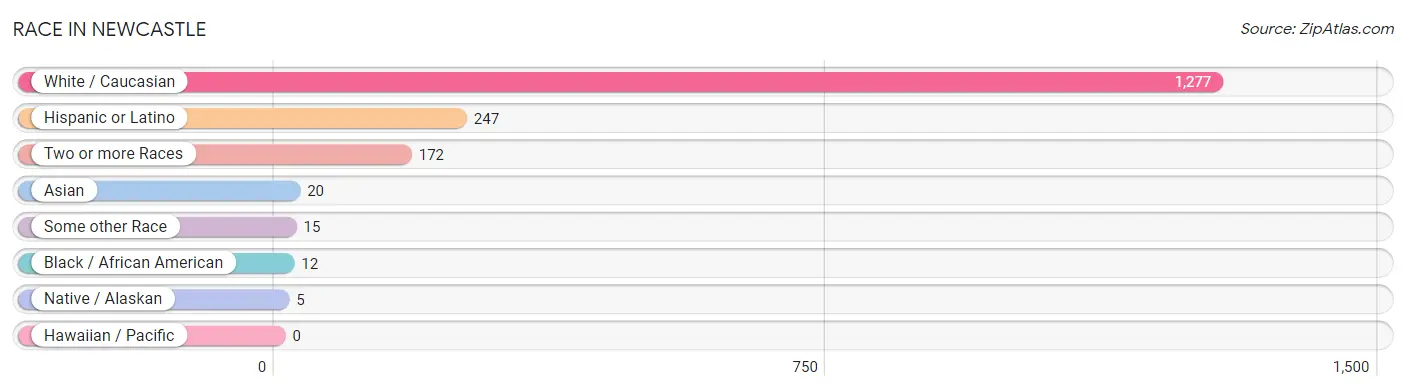
| Race | # Population | % Population |
| Asian | 20 | 1.3% |
| Black / African American | 12 | 0.8% |
| Hawaiian / Pacific | 0 | 0.0% |
| Hispanic or Latino | 247 | 16.5% |
| Native / Alaskan | 5 | 0.3% |
| White / Caucasian | 1,277 | 85.1% |
| Two or more Races | 172 | 11.5% |
| Some other Race | 15 | 1.0% |
| Total | 1,501 | 100.0% |
Ancestry in Newcastle
The most populous ancestries reported in Newcastle are Mexican (231 | 15.4%), English (192 | 12.8%), German (187 | 12.5%), Irish (94 | 6.3%), and Bhutanese (90 | 6.0%), together accounting for 52.9% of all Newcastle residents.
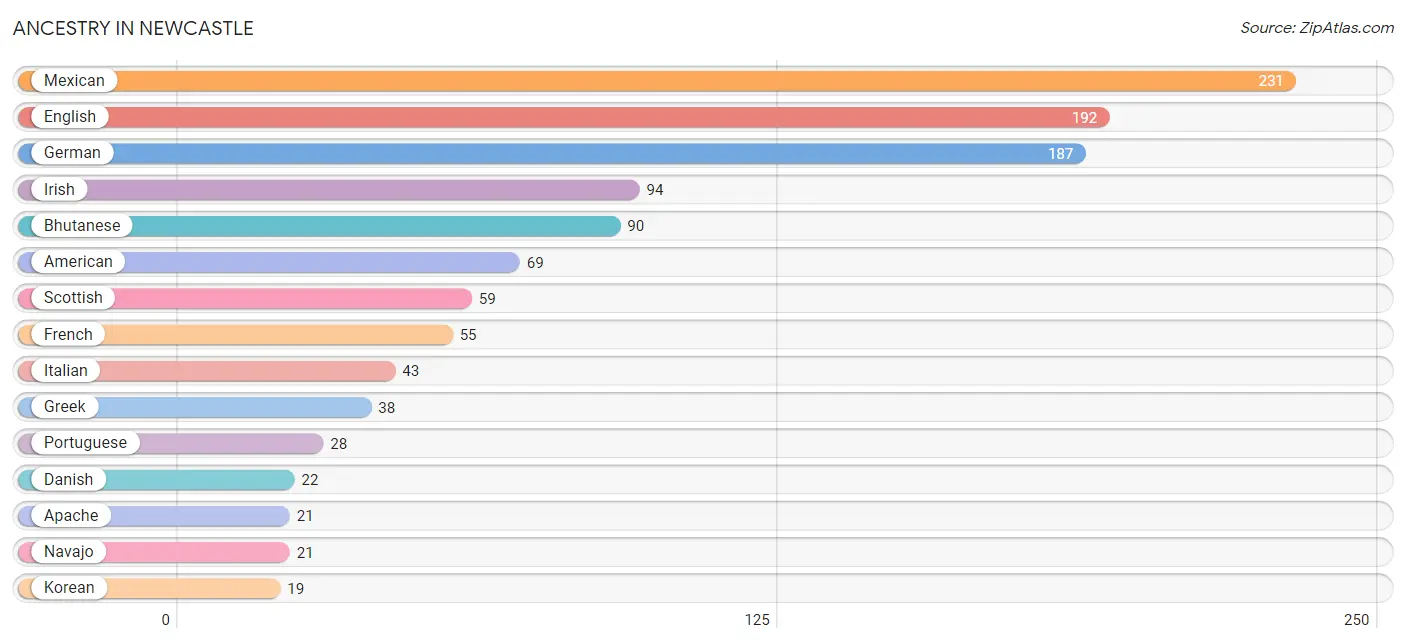
| Ancestry | # Population | % Population |
| American | 69 | 4.6% |
| Apache | 21 | 1.4% |
| Austrian | 9 | 0.6% |
| Bhutanese | 90 | 6.0% |
| British | 7 | 0.5% |
| Cherokee | 8 | 0.5% |
| Danish | 22 | 1.5% |
| Dutch | 5 | 0.3% |
| English | 192 | 12.8% |
| European | 12 | 0.8% |
| French | 55 | 3.7% |
| German | 187 | 12.5% |
| Greek | 38 | 2.5% |
| Indian (Asian) | 13 | 0.9% |
| Irish | 94 | 6.3% |
| Italian | 43 | 2.9% |
| Korean | 19 | 1.3% |
| Lithuanian | 5 | 0.3% |
| Mexican | 231 | 15.4% |
| Navajo | 21 | 1.4% |
| Norwegian | 10 | 0.7% |
| Polish | 11 | 0.7% |
| Portuguese | 28 | 1.9% |
| Scandinavian | 17 | 1.1% |
| Scottish | 59 | 3.9% |
| Spaniard | 6 | 0.4% |
| Spanish | 10 | 0.7% |
| Swiss | 4 | 0.3% |
| Welsh | 4 | 0.3% |
| Yugoslavian | 12 | 0.8% | View All 30 Rows |
Immigrants in Newcastle
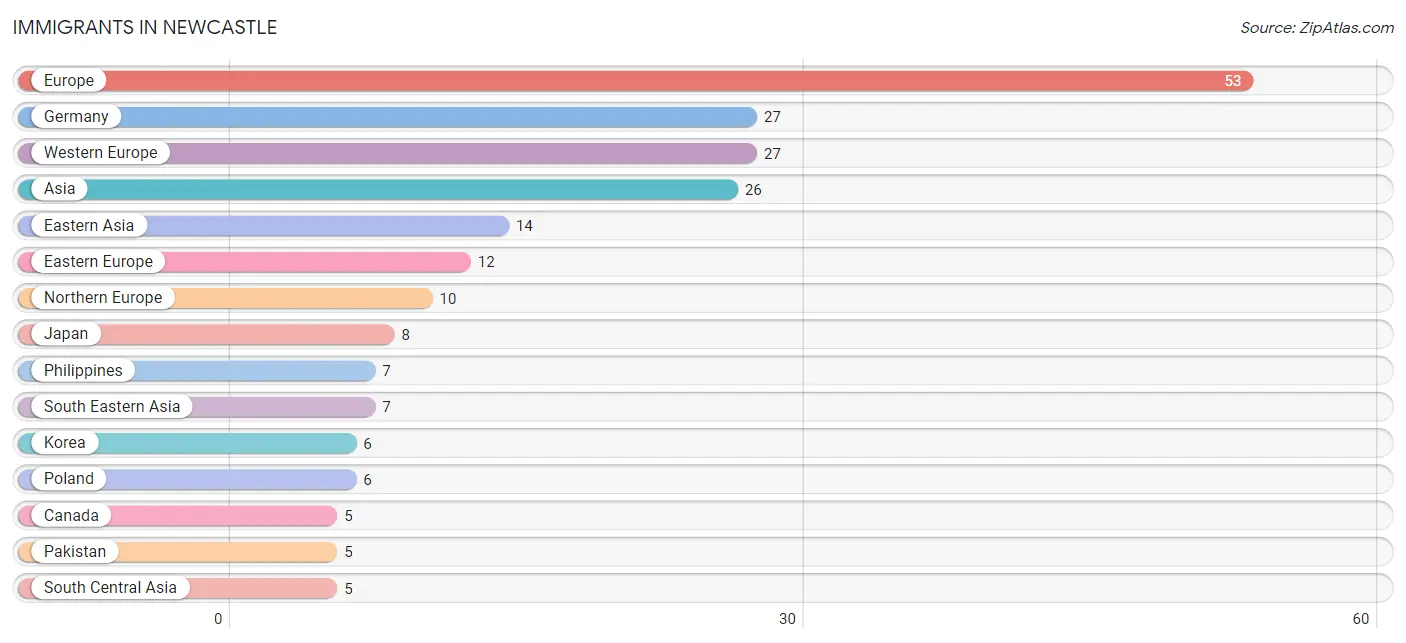
The most numerous immigrant groups reported in Newcastle came from Europe (53 | 3.5%), Germany (27 | 1.8%), Western Europe (27 | 1.8%), Asia (26 | 1.7%), and Eastern Asia (14 | 0.9%), together accounting for 9.8% of all Newcastle residents.
| Immigration Origin | # Population | % Population |
| Asia | 26 | 1.7% |
| Azores | 4 | 0.3% |
| Canada | 5 | 0.3% |
| Central America | 3 | 0.2% |
| Denmark | 4 | 0.3% |
| Eastern Asia | 14 | 0.9% |
| Eastern Europe | 12 | 0.8% |
| Europe | 53 | 3.5% |
| Germany | 27 | 1.8% |
| Japan | 8 | 0.5% |
| Korea | 6 | 0.4% |
| Latin America | 3 | 0.2% |
| Mexico | 3 | 0.2% |
| Northern Europe | 10 | 0.7% |
| Pakistan | 5 | 0.3% |
| Philippines | 7 | 0.5% |
| Poland | 6 | 0.4% |
| Portugal | 4 | 0.3% |
| South Central Asia | 5 | 0.3% |
| South Eastern Asia | 7 | 0.5% |
| Southern Europe | 4 | 0.3% |
| Western Europe | 27 | 1.8% | View All 22 Rows |
Sex and Age in Newcastle
Sex and Age in Newcastle
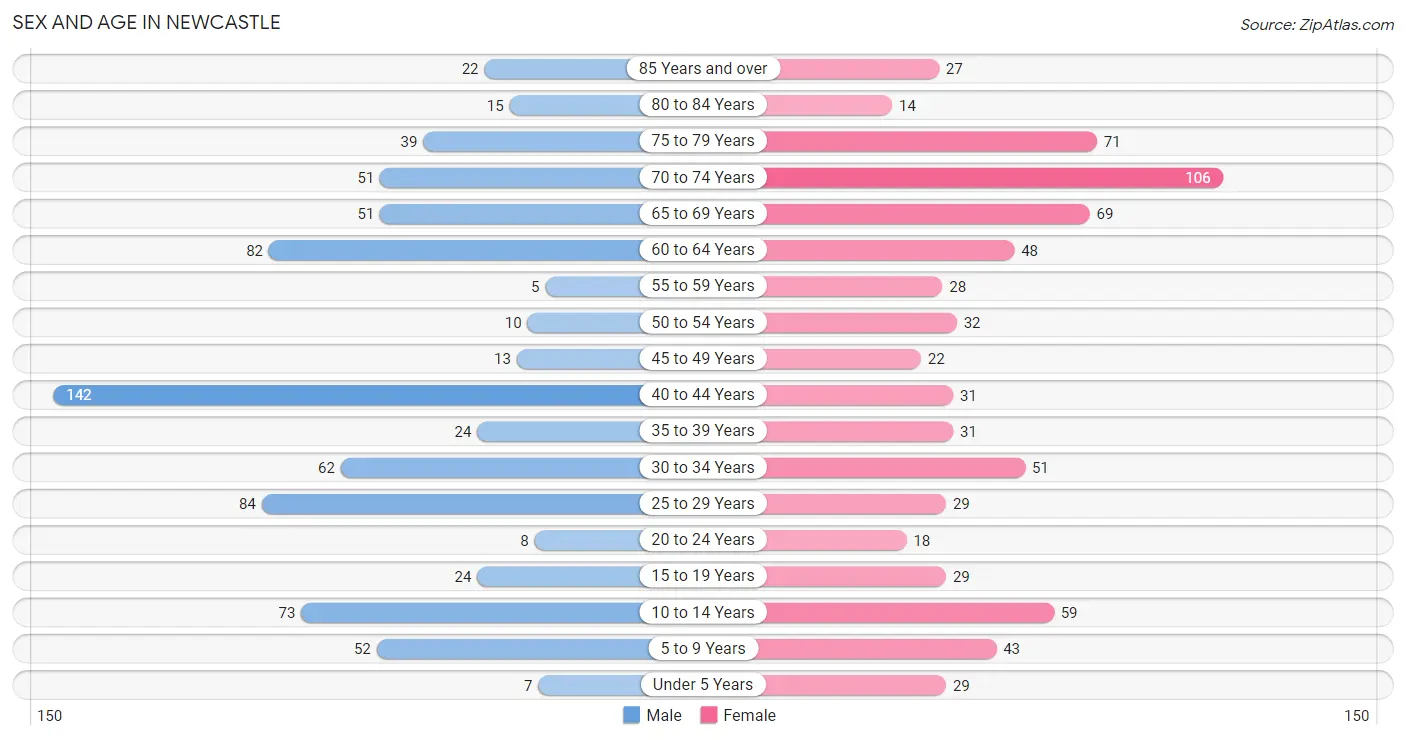
The most populous age groups in Newcastle are 40 to 44 Years (142 | 18.6%) for men and 70 to 74 Years (106 | 14.4%) for women.
| Age Bracket | Male | Female |
| Under 5 Years | 7 (0.9%) | 29 (3.9%) |
| 5 to 9 Years | 52 (6.8%) | 43 (5.8%) |
| 10 to 14 Years | 73 (9.6%) | 59 (8.0%) |
| 15 to 19 Years | 24 (3.1%) | 29 (3.9%) |
| 20 to 24 Years | 8 (1.1%) | 18 (2.4%) |
| 25 to 29 Years | 84 (11.0%) | 29 (3.9%) |
| 30 to 34 Years | 62 (8.1%) | 51 (6.9%) |
| 35 to 39 Years | 24 (3.1%) | 31 (4.2%) |
| 40 to 44 Years | 142 (18.6%) | 31 (4.2%) |
| 45 to 49 Years | 13 (1.7%) | 22 (3.0%) |
| 50 to 54 Years | 10 (1.3%) | 32 (4.3%) |
| 55 to 59 Years | 5 (0.6%) | 28 (3.8%) |
| 60 to 64 Years | 82 (10.7%) | 48 (6.5%) |
| 65 to 69 Years | 51 (6.7%) | 69 (9.4%) |
| 70 to 74 Years | 51 (6.7%) | 106 (14.4%) |
| 75 to 79 Years | 39 (5.1%) | 71 (9.6%) |
| 80 to 84 Years | 15 (2.0%) | 14 (1.9%) |
| 85 Years and over | 22 (2.9%) | 27 (3.7%) |
| Total | 764 (100.0%) | 737 (100.0%) |
Families and Households in Newcastle
Median Family Size in Newcastle
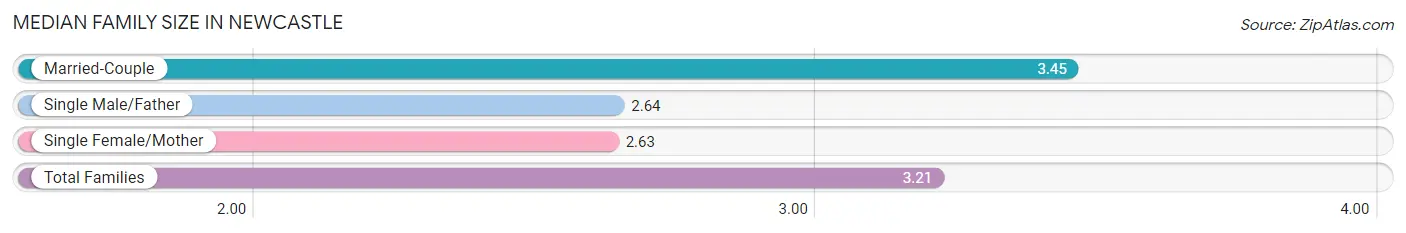
The median family size in Newcastle is 3.21 persons per family, with married-couple families (260 | 69.7%) accounting for the largest median family size of 3.45 persons per family. On the other hand, single female/mother families (52 | 13.9%) represent the smallest median family size with 2.63 persons per family.
| Family Type | # Families | Family Size |
| Married-Couple | 260 (69.7%) | 3.45 |
| Single Male/Father | 61 (16.4%) | 2.64 |
| Single Female/Mother | 52 (13.9%) | 2.63 |
| Total Families | 373 (100.0%) | 3.21 |
Median Household Size in Newcastle
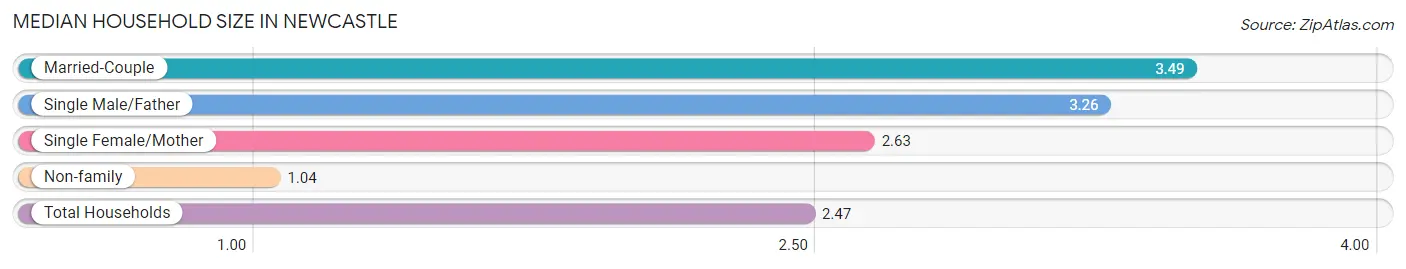
The median household size in Newcastle is 2.47 persons per household, with married-couple households (260 | 43.4%) accounting for the largest median household size of 3.49 persons per household. non-family households (226 | 37.7%) represent the smallest median household size with 1.04 persons per household.
| Household Type | # Households | Household Size |
| Married-Couple | 260 (43.4%) | 3.49 |
| Single Male/Father | 61 (10.2%) | 3.26 |
| Single Female/Mother | 52 (8.7%) | 2.63 |
| Non-family | 226 (37.7%) | 1.04 |
| Total Households | 599 (100.0%) | 2.47 |
Household Size by Marriage Status in Newcastle
Out of a total of 599 households in Newcastle, 373 (62.3%) are family households, while 226 (37.7%) are nonfamily households. The most numerous type of family households are 2-person households, comprising 168, and the most common type of nonfamily households are 1-person households, comprising 217.
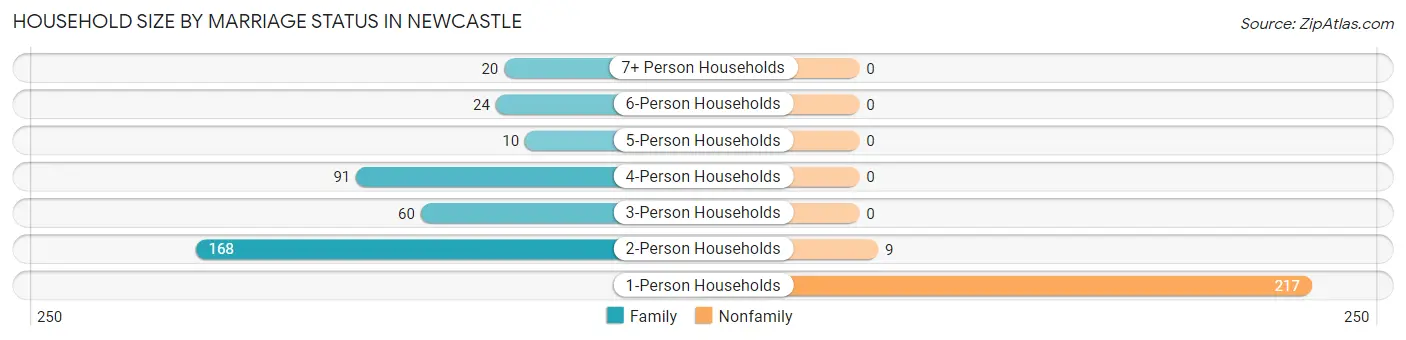
| Household Size | Family Households | Nonfamily Households |
| 1-Person Households | - | 217 (36.2%) |
| 2-Person Households | 168 (28.1%) | 9 (1.5%) |
| 3-Person Households | 60 (10.0%) | 0 (0.0%) |
| 4-Person Households | 91 (15.2%) | 0 (0.0%) |
| 5-Person Households | 10 (1.7%) | 0 (0.0%) |
| 6-Person Households | 24 (4.0%) | 0 (0.0%) |
| 7+ Person Households | 20 (3.3%) | 0 (0.0%) |
| Total | 373 (62.3%) | 226 (37.7%) |
Female Fertility in Newcastle
Fertility by Age in Newcastle
Average fertility rate in Newcastle is 80.0 births per 1,000 women. Women in the age bracket of 35 to 50 years have the highest fertility rate with 186.0 births per 1,000 women. Women in the age bracket of 35 to 50 years acount for 100.0% of all women with births.
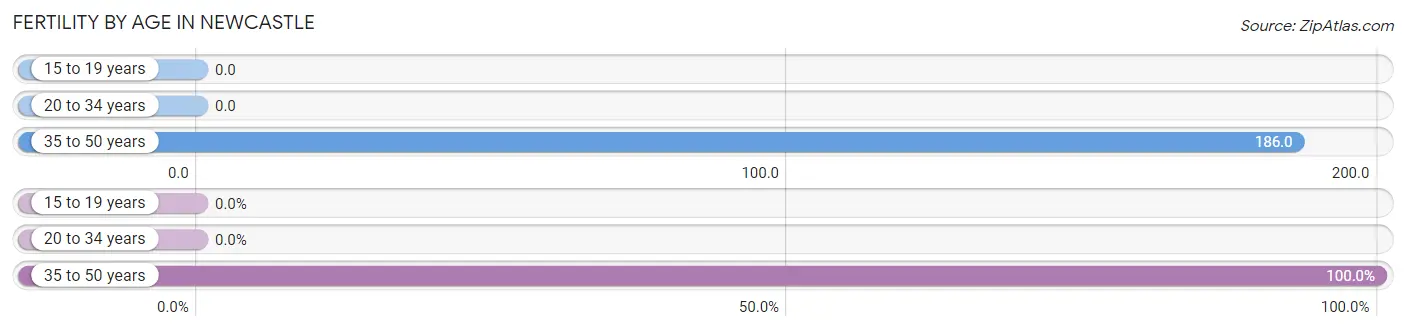
| Age Bracket | Women with Births | Births / 1,000 Women |
| 15 to 19 years | 0 (0.0%) | 0.0 |
| 20 to 34 years | 0 (0.0%) | 0.0 |
| 35 to 50 years | 18 (100.0%) | 186.0 |
| Total | 18 (100.0%) | 80.0 |
Fertility by Age by Marriage Status in Newcastle
66.7% of women with births (18) in Newcastle are married. The highest percentage of unmarried women with births falls into 35 to 50 years age bracket with 33.3% of them unmarried at the time of birth, while the lowest percentage of unmarried women with births belong to 35 to 50 years age bracket with 33.3% of them unmarried.
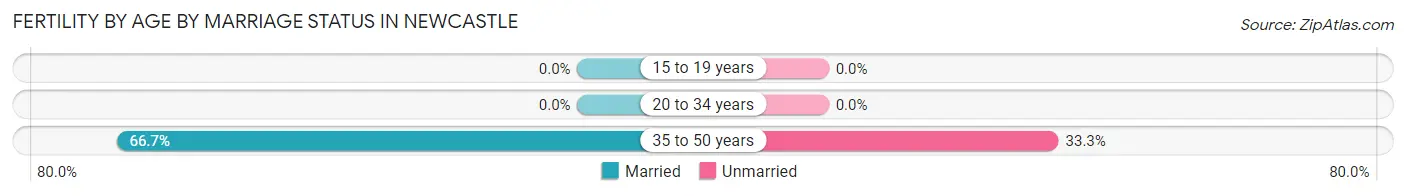
| Age Bracket | Married | Unmarried |
| 15 to 19 years | 0 (0.0%) | 0 (0.0%) |
| 20 to 34 years | 0 (0.0%) | 0 (0.0%) |
| 35 to 50 years | 12 (66.7%) | 6 (33.3%) |
| Total | 12 (66.7%) | 6 (33.3%) |
Fertility by Education in Newcastle
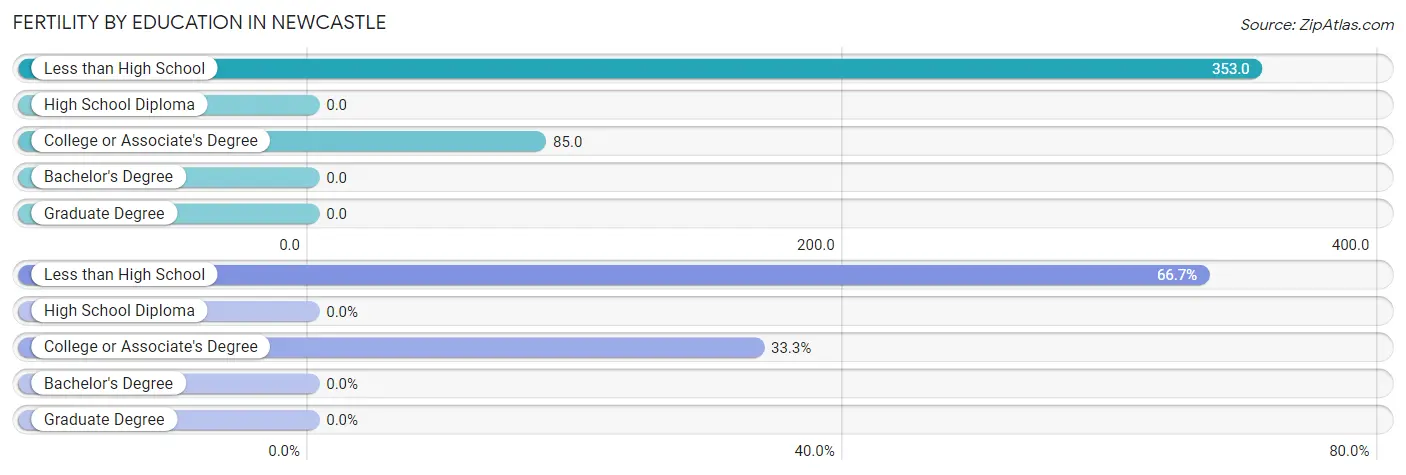
| Educational Attainment | Women with Births | Births / 1,000 Women |
| Less than High School | 12 (66.7%) | 353.0 |
| High School Diploma | 0 (0.0%) | 0.0 |
| College or Associate's Degree | 6 (33.3%) | 85.0 |
| Bachelor's Degree | 0 (0.0%) | 0.0 |
| Graduate Degree | 0 (0.0%) | 0.0 |
| Total | 18 (100.0%) | 80.0 |
Fertility by Education by Marriage Status in Newcastle
33.3% of women with births in Newcastle are unmarried. Women with the educational attainment of less than high school are most likely to be married with 100.0% of them married at childbirth, while women with the educational attainment of college or associate's degree are least likely to be married with 100.0% of them unmarried at childbirth.
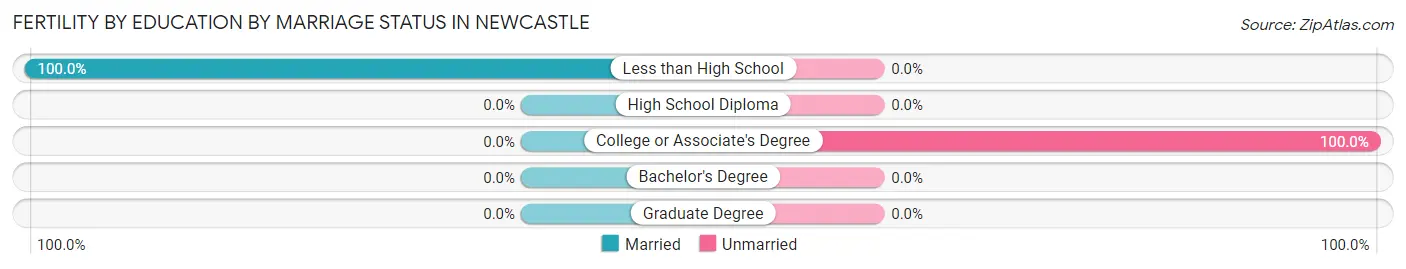
| Educational Attainment | Married | Unmarried |
| Less than High School | 12 (100.0%) | 0 (0.0%) |
| High School Diploma | 0 (0.0%) | 0 (0.0%) |
| College or Associate's Degree | 0 (0.0%) | 6 (100.0%) |
| Bachelor's Degree | 0 (0.0%) | 0 (0.0%) |
| Graduate Degree | 0 (0.0%) | 0 (0.0%) |
| Total | 12 (66.7%) | 6 (33.3%) |
Employment Characteristics in Newcastle
Employment by Class of Employer in Newcastle
Among the 461 employed individuals in Newcastle, private company employees (340 | 73.8%), self-employed (not incorporated) (40 | 8.7%), and state government employees (25 | 5.4%) make up the most common classes of employment.
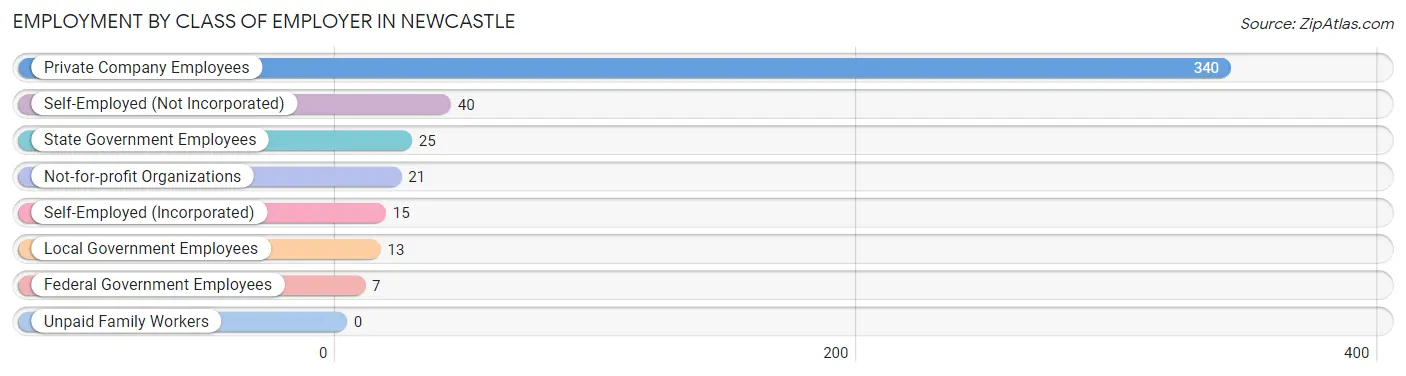
| Employer Class | # Employees | % Employees |
| Private Company Employees | 340 | 73.8% |
| Self-Employed (Incorporated) | 15 | 3.3% |
| Self-Employed (Not Incorporated) | 40 | 8.7% |
| Not-for-profit Organizations | 21 | 4.6% |
| Local Government Employees | 13 | 2.8% |
| State Government Employees | 25 | 5.4% |
| Federal Government Employees | 7 | 1.5% |
| Unpaid Family Workers | 0 | 0.0% |
| Total | 461 | 100.0% |
Employment Status by Age in Newcastle
According to the labor force statistics for Newcastle, out of the total population over 16 years of age (1,211), 41.0% or 497 individuals are in the labor force, with 4.2% or 21 of them unemployed. The age group with the highest labor force participation rate is 20 to 24 years, with 100.0% or 26 individuals in the labor force. Within the labor force, the 35 to 44 years age range has the highest percentage of unemployed individuals, with 15.6% or 19 of them being unemployed.
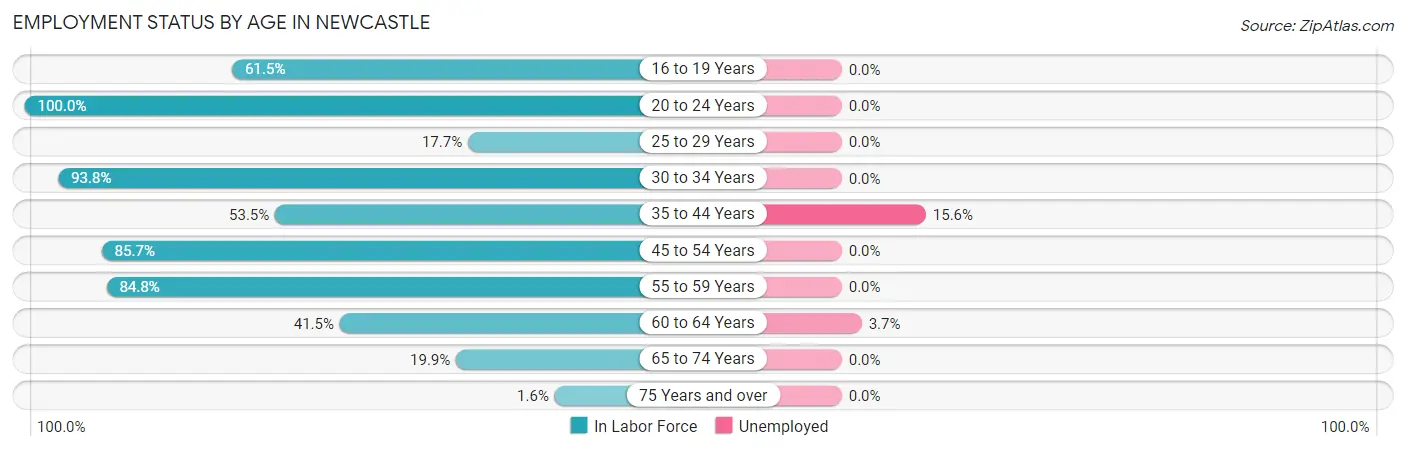
| Age Bracket | In Labor Force | Unemployed |
| 16 to 19 Years | 16 (61.5%) | 0 (0.0%) |
| 20 to 24 Years | 26 (100.0%) | 0 (0.0%) |
| 25 to 29 Years | 20 (17.7%) | 0 (0.0%) |
| 30 to 34 Years | 106 (93.8%) | 0 (0.0%) |
| 35 to 44 Years | 122 (53.5%) | 19 (15.6%) |
| 45 to 54 Years | 66 (85.7%) | 0 (0.0%) |
| 55 to 59 Years | 28 (84.8%) | 0 (0.0%) |
| 60 to 64 Years | 54 (41.5%) | 2 (3.7%) |
| 65 to 74 Years | 55 (19.9%) | 0 (0.0%) |
| 75 Years and over | 3 (1.6%) | 0 (0.0%) |
| Total | 497 (41.0%) | 21 (4.2%) |
Employment Status by Educational Attainment in Newcastle
According to labor force statistics for Newcastle, 57.1% of individuals (396) out of the total population between 25 and 64 years of age (694) are in the labor force, with 5.3% or 21 of them being unemployed. The group with the highest labor force participation rate are those with the educational attainment of bachelor's degree or higher, with 91.1% or 123 individuals in the labor force. Within the labor force, individuals with bachelor's degree or higher education have the highest percentage of unemployment, with 8.9% or 11 of them being unemployed.
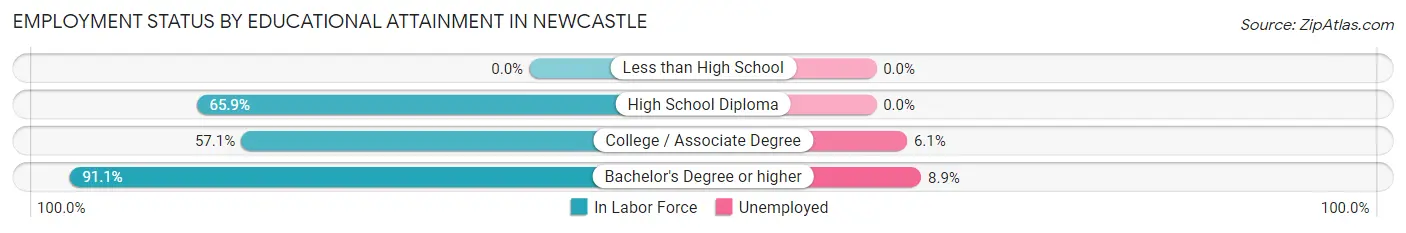
| Educational Attainment | In Labor Force | Unemployed |
| Less than High School | 0 (0.0%) | 0 (0.0%) |
| High School Diploma | 108 (65.9%) | 0 (0.0%) |
| College / Associate Degree | 165 (57.1%) | 18 (6.1%) |
| Bachelor's Degree or higher | 123 (91.1%) | 12 (8.9%) |
| Total | 396 (57.1%) | 37 (5.3%) |
Employment Occupations by Sex in Newcastle
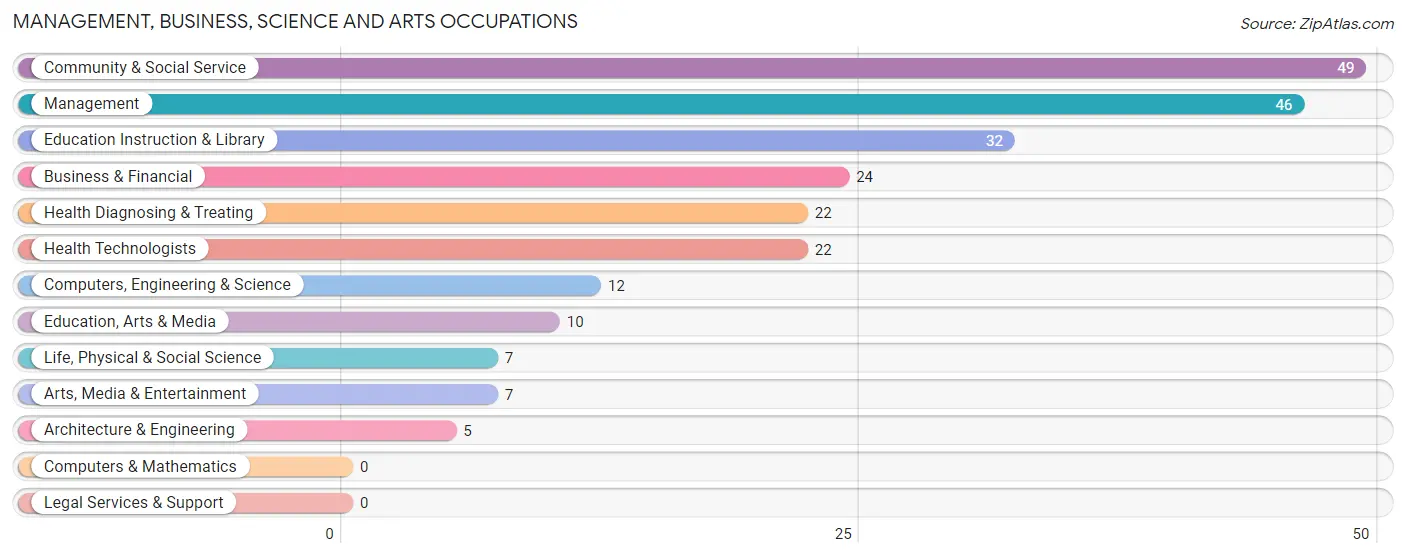
Management, Business, Science and Arts Occupations
The most common Management, Business, Science and Arts occupations in Newcastle are Community & Social Service (49 | 10.3%), Management (46 | 9.7%), Education Instruction & Library (32 | 6.7%), Business & Financial (24 | 5.1%), and Health Diagnosing & Treating (22 | 4.6%).
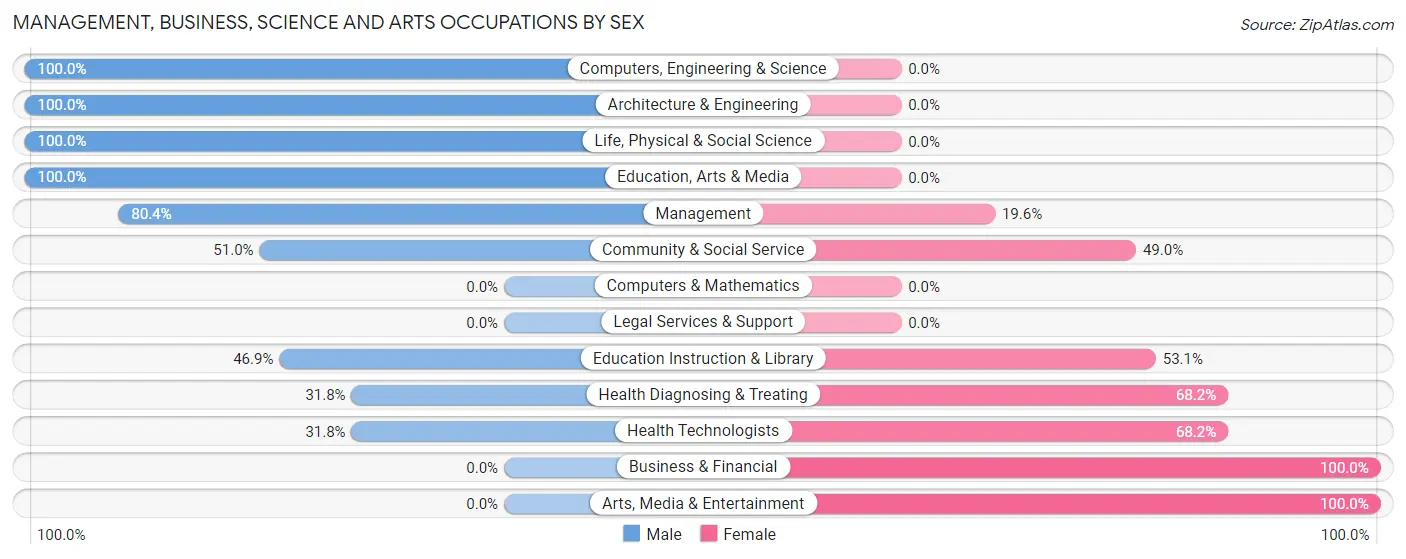
Management, Business, Science and Arts Occupations by Sex
Within the Management, Business, Science and Arts occupations in Newcastle, the most male-oriented occupations are Computers, Engineering & Science (100.0%), Architecture & Engineering (100.0%), and Life, Physical & Social Science (100.0%), while the most female-oriented occupations are Business & Financial (100.0%), Arts, Media & Entertainment (100.0%), and Health Diagnosing & Treating (68.2%).
| Occupation | Male | Female |
| Management | 37 (80.4%) | 9 (19.6%) |
| Business & Financial | 0 (0.0%) | 24 (100.0%) |
| Computers, Engineering & Science | 12 (100.0%) | 0 (0.0%) |
| Computers & Mathematics | 0 (0.0%) | 0 (0.0%) |
| Architecture & Engineering | 5 (100.0%) | 0 (0.0%) |
| Life, Physical & Social Science | 7 (100.0%) | 0 (0.0%) |
| Community & Social Service | 25 (51.0%) | 24 (49.0%) |
| Education, Arts & Media | 10 (100.0%) | 0 (0.0%) |
| Legal Services & Support | 0 (0.0%) | 0 (0.0%) |
| Education Instruction & Library | 15 (46.9%) | 17 (53.1%) |
| Arts, Media & Entertainment | 0 (0.0%) | 7 (100.0%) |
| Health Diagnosing & Treating | 7 (31.8%) | 15 (68.2%) |
| Health Technologists | 7 (31.8%) | 15 (68.2%) |
| Total (Category) | 81 (52.9%) | 72 (47.1%) |
| Total (Overall) | 226 (47.6%) | 249 (52.4%) |
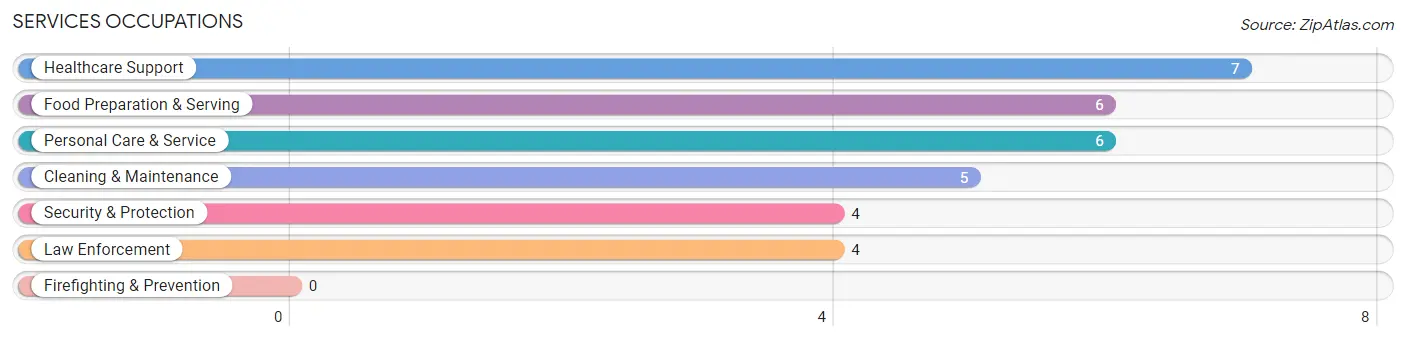
Services Occupations
The most common Services occupations in Newcastle are Healthcare Support (7 | 1.5%), Food Preparation & Serving (6 | 1.3%), Personal Care & Service (6 | 1.3%), Cleaning & Maintenance (5 | 1.1%), and Security & Protection (4 | 0.8%).
Services Occupations by Sex
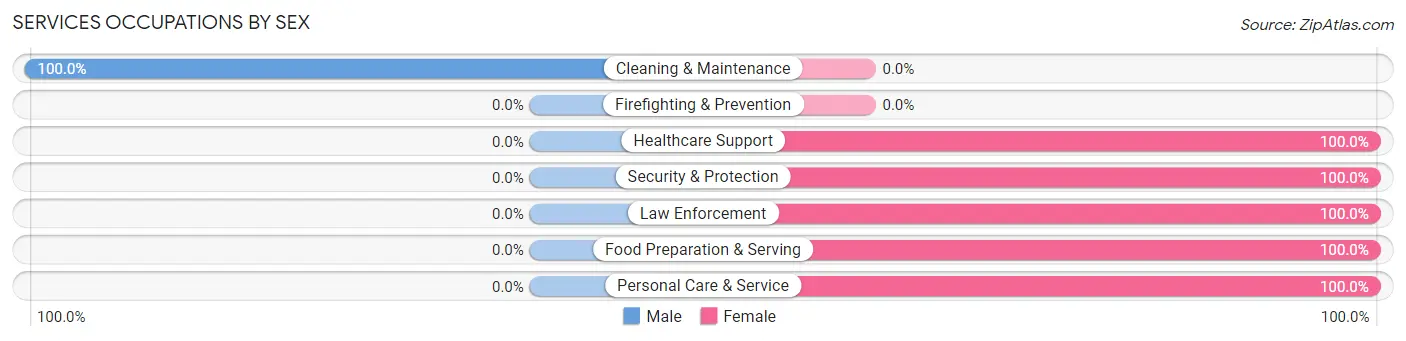
| Occupation | Male | Female |
| Healthcare Support | 0 (0.0%) | 7 (100.0%) |
| Security & Protection | 0 (0.0%) | 4 (100.0%) |
| Firefighting & Prevention | 0 (0.0%) | 0 (0.0%) |
| Law Enforcement | 0 (0.0%) | 4 (100.0%) |
| Food Preparation & Serving | 0 (0.0%) | 6 (100.0%) |
| Cleaning & Maintenance | 5 (100.0%) | 0 (0.0%) |
| Personal Care & Service | 0 (0.0%) | 6 (100.0%) |
| Total (Category) | 5 (17.9%) | 23 (82.1%) |
| Total (Overall) | 226 (47.6%) | 249 (52.4%) |
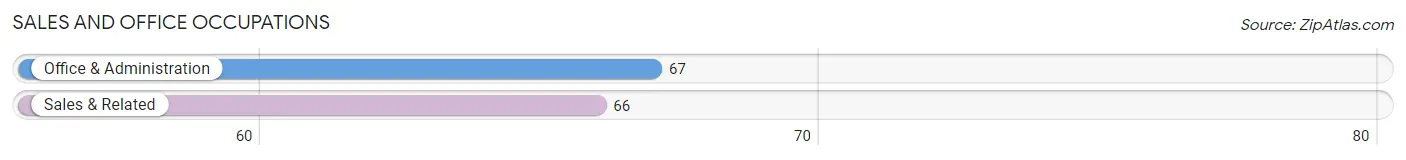
Sales and Office Occupations
The most common Sales and Office occupations in Newcastle are Office & Administration (67 | 14.1%), and Sales & Related (66 | 13.9%).
Sales and Office Occupations by Sex
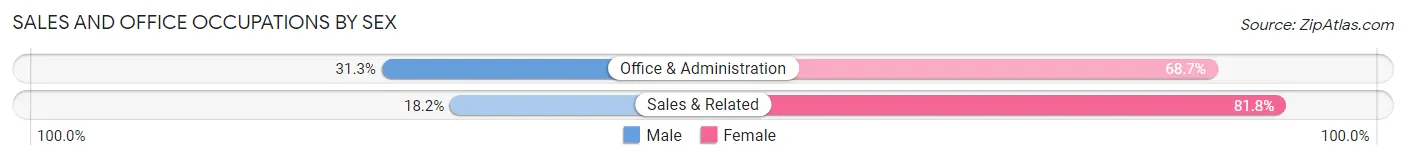
| Occupation | Male | Female |
| Sales & Related | 12 (18.2%) | 54 (81.8%) |
| Office & Administration | 21 (31.3%) | 46 (68.7%) |
| Total (Category) | 33 (24.8%) | 100 (75.2%) |
| Total (Overall) | 226 (47.6%) | 249 (52.4%) |
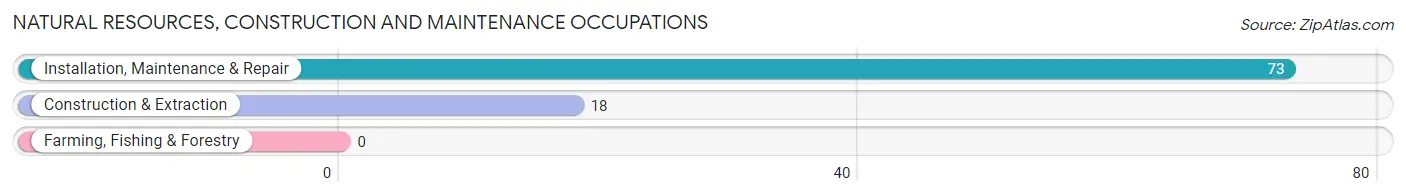
Natural Resources, Construction and Maintenance Occupations
The most common Natural Resources, Construction and Maintenance occupations in Newcastle are Installation, Maintenance & Repair (73 | 15.4%), and Construction & Extraction (18 | 3.8%).
Natural Resources, Construction and Maintenance Occupations by Sex
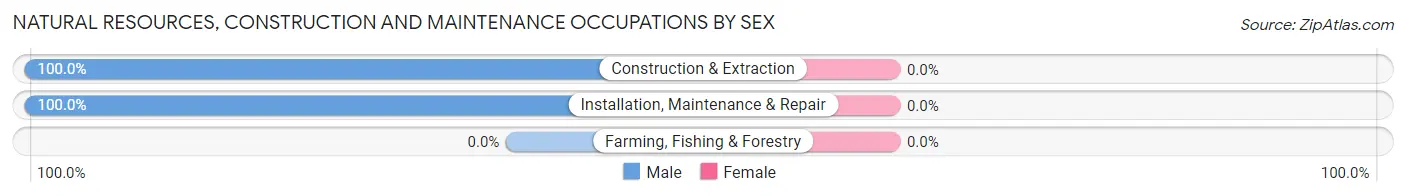
| Occupation | Male | Female |
| Farming, Fishing & Forestry | 0 (0.0%) | 0 (0.0%) |
| Construction & Extraction | 18 (100.0%) | 0 (0.0%) |
| Installation, Maintenance & Repair | 73 (100.0%) | 0 (0.0%) |
| Total (Category) | 91 (100.0%) | 0 (0.0%) |
| Total (Overall) | 226 (47.6%) | 249 (52.4%) |
Production, Transportation and Moving Occupations
The most common Production, Transportation and Moving occupations in Newcastle are Production (55 | 11.6%), Material Moving (9 | 1.9%), and Transportation (6 | 1.3%).
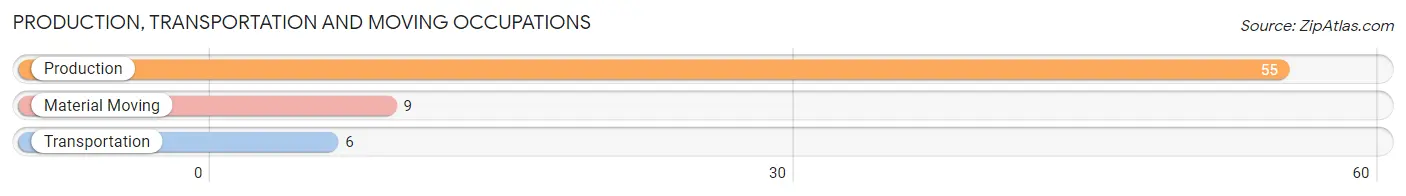
Production, Transportation and Moving Occupations by Sex
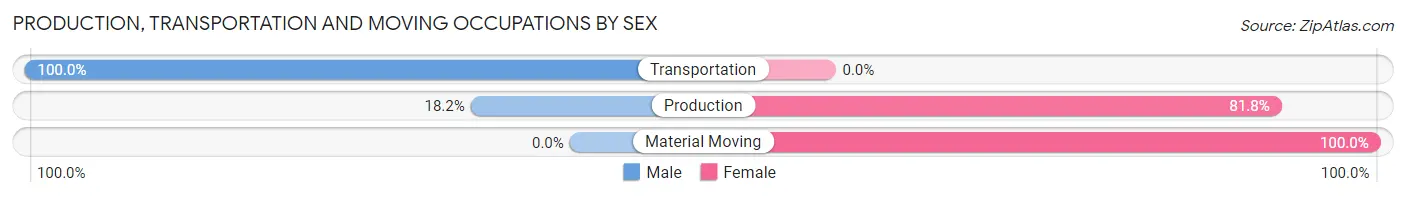
| Occupation | Male | Female |
| Production | 10 (18.2%) | 45 (81.8%) |
| Transportation | 6 (100.0%) | 0 (0.0%) |
| Material Moving | 0 (0.0%) | 9 (100.0%) |
| Total (Category) | 16 (22.9%) | 54 (77.1%) |
| Total (Overall) | 226 (47.6%) | 249 (52.4%) |
Employment Industries by Sex in Newcastle
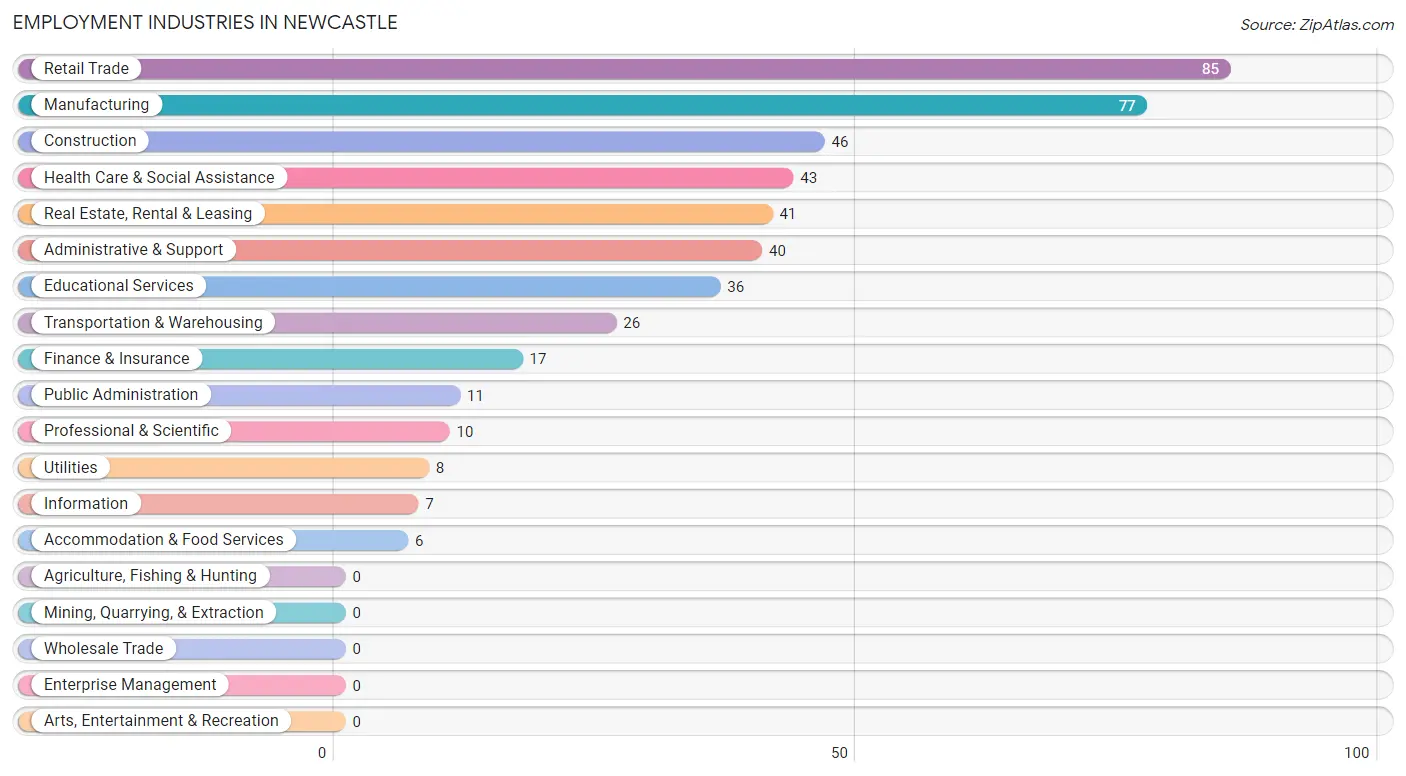
Employment Industries in Newcastle
The major employment industries in Newcastle include Retail Trade (85 | 17.9%), Manufacturing (77 | 16.2%), Construction (46 | 9.7%), Health Care & Social Assistance (43 | 9.0%), and Real Estate, Rental & Leasing (41 | 8.6%).
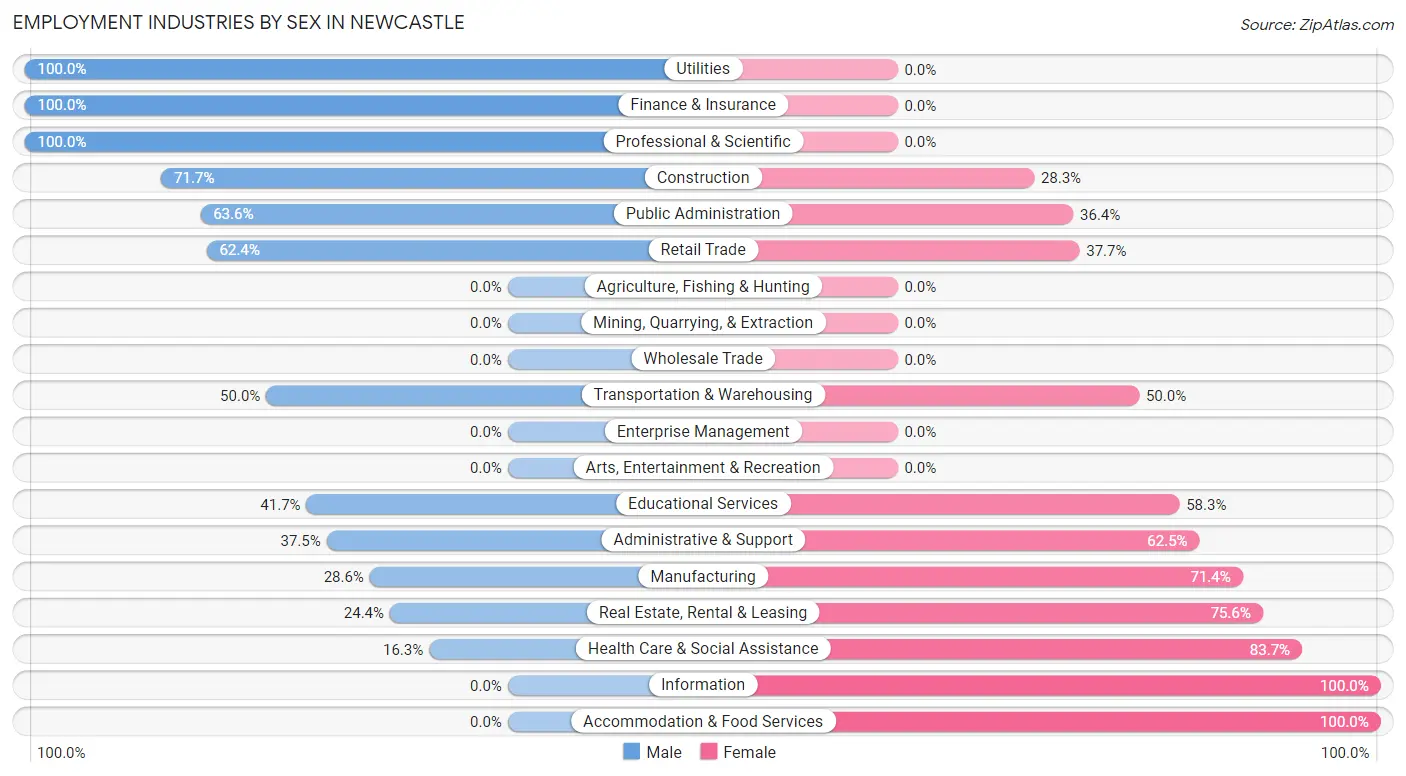
Employment Industries by Sex in Newcastle
The Newcastle industries that see more men than women are Utilities (100.0%), Finance & Insurance (100.0%), and Professional & Scientific (100.0%), whereas the industries that tend to have a higher number of women are Information (100.0%), Accommodation & Food Services (100.0%), and Health Care & Social Assistance (83.7%).
| Industry | Male | Female |
| Agriculture, Fishing & Hunting | 0 (0.0%) | 0 (0.0%) |
| Mining, Quarrying, & Extraction | 0 (0.0%) | 0 (0.0%) |
| Construction | 33 (71.7%) | 13 (28.3%) |
| Manufacturing | 22 (28.6%) | 55 (71.4%) |
| Wholesale Trade | 0 (0.0%) | 0 (0.0%) |
| Retail Trade | 53 (62.4%) | 32 (37.7%) |
| Transportation & Warehousing | 13 (50.0%) | 13 (50.0%) |
| Utilities | 8 (100.0%) | 0 (0.0%) |
| Information | 0 (0.0%) | 7 (100.0%) |
| Finance & Insurance | 17 (100.0%) | 0 (0.0%) |
| Real Estate, Rental & Leasing | 10 (24.4%) | 31 (75.6%) |
| Professional & Scientific | 10 (100.0%) | 0 (0.0%) |
| Enterprise Management | 0 (0.0%) | 0 (0.0%) |
| Administrative & Support | 15 (37.5%) | 25 (62.5%) |
| Educational Services | 15 (41.7%) | 21 (58.3%) |
| Health Care & Social Assistance | 7 (16.3%) | 36 (83.7%) |
| Arts, Entertainment & Recreation | 0 (0.0%) | 0 (0.0%) |
| Accommodation & Food Services | 0 (0.0%) | 6 (100.0%) |
| Public Administration | 7 (63.6%) | 4 (36.4%) |
| Total | 226 (47.6%) | 249 (52.4%) |
Education in Newcastle
School Enrollment in Newcastle
The most common levels of schooling among the 288 students in Newcastle are middle school (101 | 35.1%), elementary school (67 | 23.3%), and high school (61 | 21.2%).
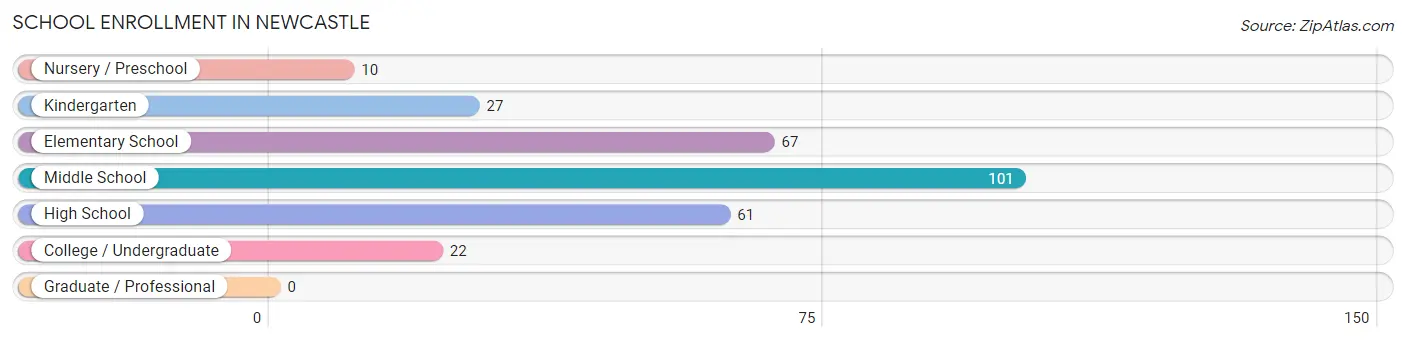
| School Level | # Students | % Students |
| Nursery / Preschool | 10 | 3.5% |
| Kindergarten | 27 | 9.4% |
| Elementary School | 67 | 23.3% |
| Middle School | 101 | 35.1% |
| High School | 61 | 21.2% |
| College / Undergraduate | 22 | 7.6% |
| Graduate / Professional | 0 | 0.0% |
| Total | 288 | 100.0% |
School Enrollment by Age by Funding Source in Newcastle
Out of a total of 288 students who are enrolled in schools in Newcastle, 61 (21.2%) attend a private institution, while the remaining 227 (78.8%) are enrolled in public schools. The age group of 5 to 9 year old has the highest likelihood of being enrolled in private schools, with 34 (39.1% in the age bracket) enrolled. Conversely, the age group of 3 to 4 year olds has the lowest likelihood of being enrolled in a private school, with 10 (100.0% in the age bracket) attending a public institution.
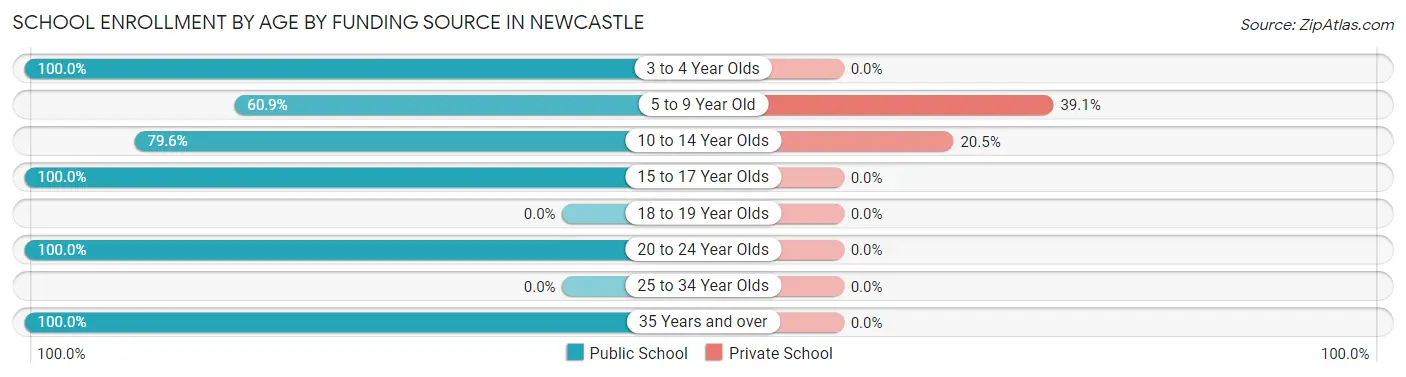
| Age Bracket | Public School | Private School |
| 3 to 4 Year Olds | 10 (100.0%) | 0 (0.0%) |
| 5 to 9 Year Old | 53 (60.9%) | 34 (39.1%) |
| 10 to 14 Year Olds | 105 (79.5%) | 27 (20.4%) |
| 15 to 17 Year Olds | 37 (100.0%) | 0 (0.0%) |
| 18 to 19 Year Olds | 0 (0.0%) | 0 (0.0%) |
| 20 to 24 Year Olds | 9 (100.0%) | 0 (0.0%) |
| 25 to 34 Year Olds | 0 (0.0%) | 0 (0.0%) |
| 35 Years and over | 13 (100.0%) | 0 (0.0%) |
| Total | 227 (78.8%) | 61 (21.2%) |
Educational Attainment by Field of Study in Newcastle
Business (56 | 19.2%), psychology (47 | 16.2%), education (41 | 14.1%), social sciences (39 | 13.4%), and engineering (21 | 7.2%) are the most common fields of study among 291 individuals in Newcastle who have obtained a bachelor's degree or higher.
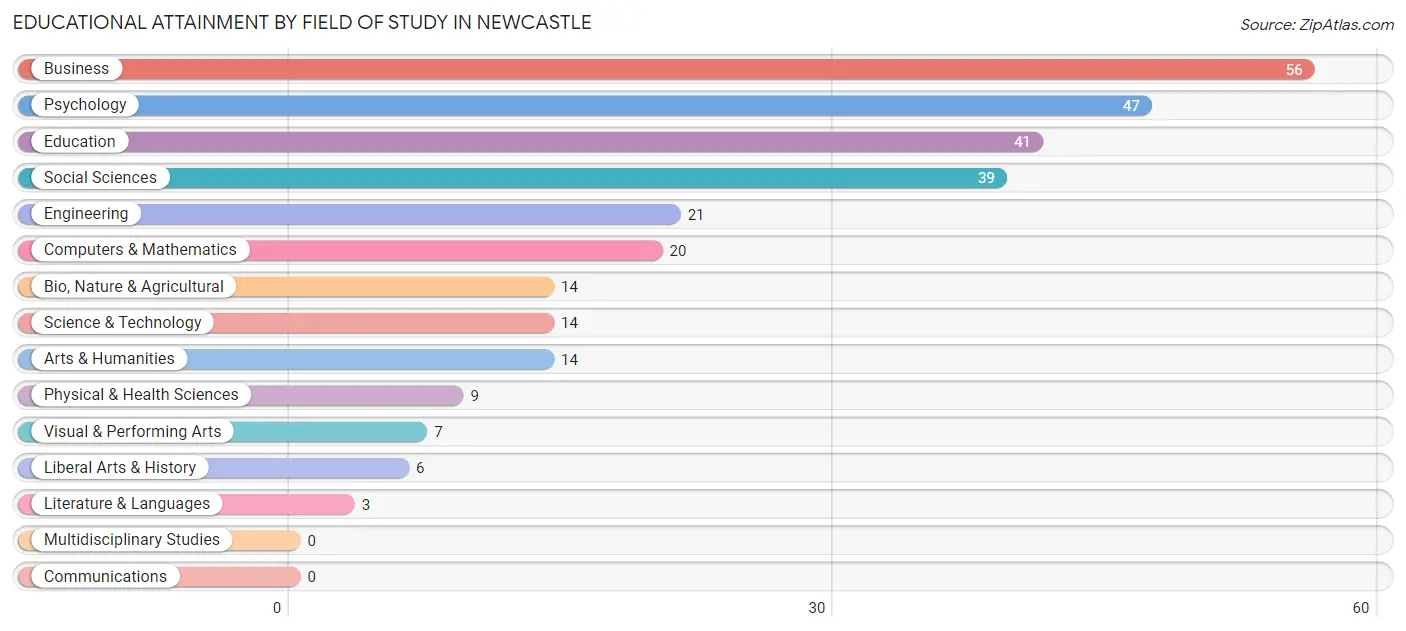
| Field of Study | # Graduates | % Graduates |
| Computers & Mathematics | 20 | 6.9% |
| Bio, Nature & Agricultural | 14 | 4.8% |
| Physical & Health Sciences | 9 | 3.1% |
| Psychology | 47 | 16.2% |
| Social Sciences | 39 | 13.4% |
| Engineering | 21 | 7.2% |
| Multidisciplinary Studies | 0 | 0.0% |
| Science & Technology | 14 | 4.8% |
| Business | 56 | 19.2% |
| Education | 41 | 14.1% |
| Literature & Languages | 3 | 1.0% |
| Liberal Arts & History | 6 | 2.1% |
| Visual & Performing Arts | 7 | 2.4% |
| Communications | 0 | 0.0% |
| Arts & Humanities | 14 | 4.8% |
| Total | 291 | 100.0% |
Transportation & Commute in Newcastle
Vehicle Availability by Sex in Newcastle
The most prevalent vehicle ownership categories in Newcastle are males with 3 vehicles (75, accounting for 34.3%) and females with 3 vehicles (39, making up 31.0%).
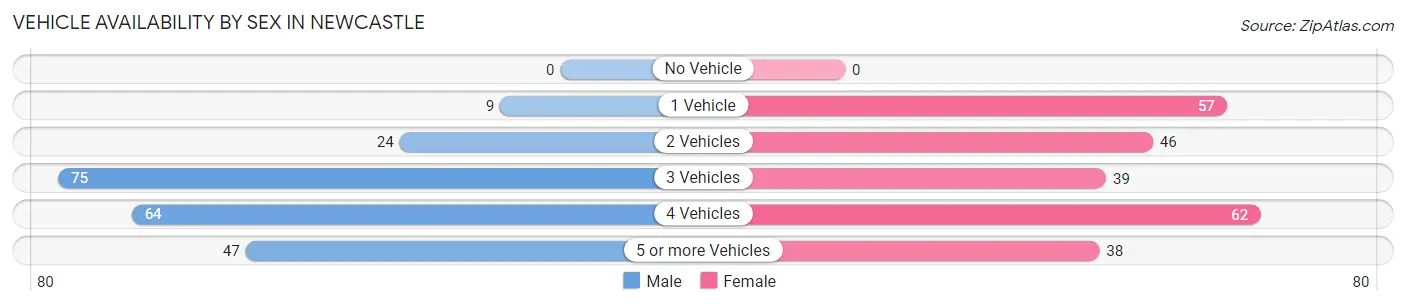
| Vehicles Available | Male | Female |
| No Vehicle | 0 (0.0%) | 0 (0.0%) |
| 1 Vehicle | 9 (4.1%) | 57 (23.5%) |
| 2 Vehicles | 24 (11.0%) | 46 (19.0%) |
| 3 Vehicles | 75 (34.3%) | 39 (16.1%) |
| 4 Vehicles | 64 (29.2%) | 62 (25.6%) |
| 5 or more Vehicles | 47 (21.5%) | 38 (15.7%) |
| Total | 219 (100.0%) | 242 (100.0%) |
Commute Time in Newcastle
The most frequently occuring commute durations in Newcastle are 10 to 14 minutes (80 commuters, 20.9%), 5 to 9 minutes (63 commuters, 16.5%), and 30 to 34 minutes (62 commuters, 16.2%).
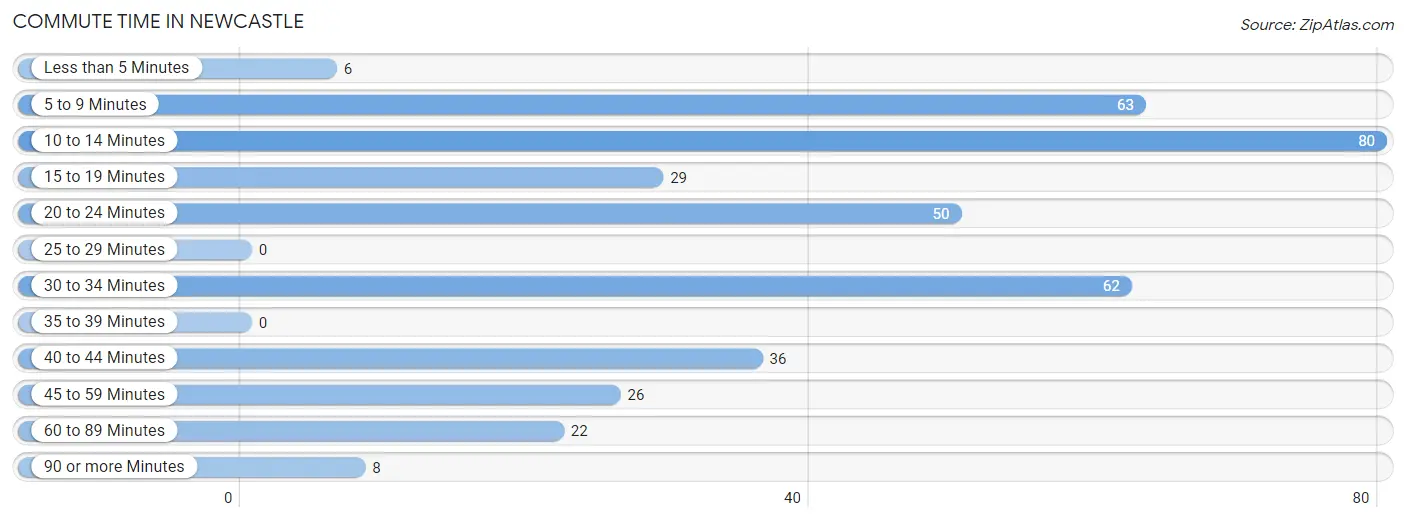
| Commute Time | # Commuters | % Commuters |
| Less than 5 Minutes | 6 | 1.6% |
| 5 to 9 Minutes | 63 | 16.5% |
| 10 to 14 Minutes | 80 | 20.9% |
| 15 to 19 Minutes | 29 | 7.6% |
| 20 to 24 Minutes | 50 | 13.1% |
| 25 to 29 Minutes | 0 | 0.0% |
| 30 to 34 Minutes | 62 | 16.2% |
| 35 to 39 Minutes | 0 | 0.0% |
| 40 to 44 Minutes | 36 | 9.4% |
| 45 to 59 Minutes | 26 | 6.8% |
| 60 to 89 Minutes | 22 | 5.8% |
| 90 or more Minutes | 8 | 2.1% |
Commute Time by Sex in Newcastle
The most common commute times in Newcastle are 10 to 14 minutes (59 commuters, 32.2%) for males and 5 to 9 minutes (58 commuters, 29.1%) for females.
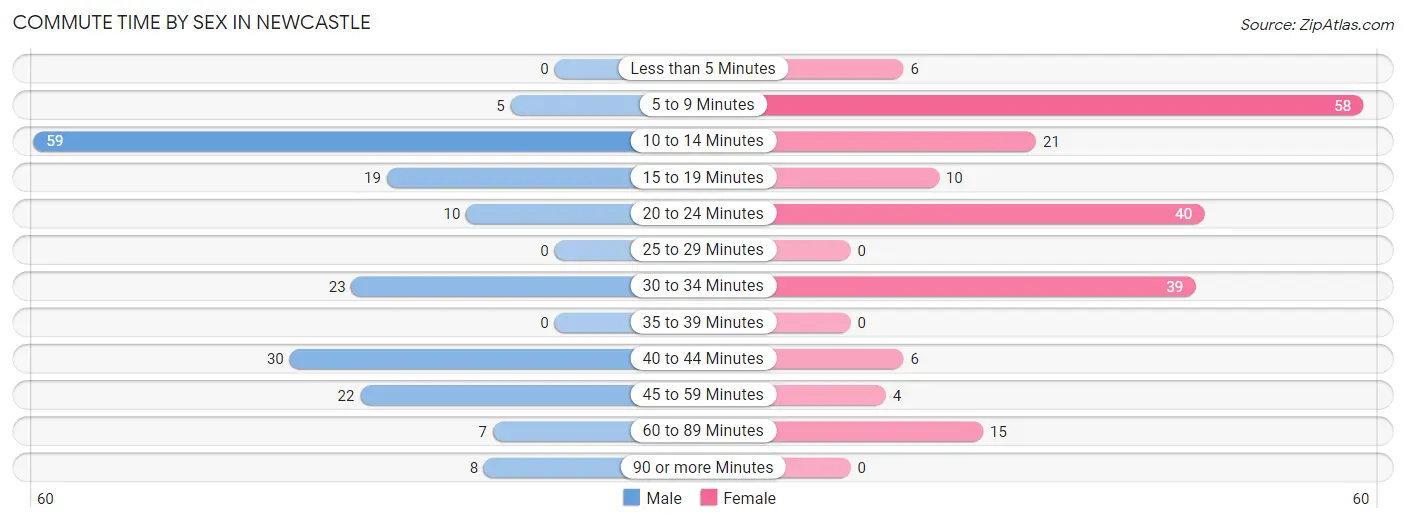
| Commute Time | Male | Female |
| Less than 5 Minutes | 0 (0.0%) | 6 (3.0%) |
| 5 to 9 Minutes | 5 (2.7%) | 58 (29.1%) |
| 10 to 14 Minutes | 59 (32.2%) | 21 (10.5%) |
| 15 to 19 Minutes | 19 (10.4%) | 10 (5.0%) |
| 20 to 24 Minutes | 10 (5.5%) | 40 (20.1%) |
| 25 to 29 Minutes | 0 (0.0%) | 0 (0.0%) |
| 30 to 34 Minutes | 23 (12.6%) | 39 (19.6%) |
| 35 to 39 Minutes | 0 (0.0%) | 0 (0.0%) |
| 40 to 44 Minutes | 30 (16.4%) | 6 (3.0%) |
| 45 to 59 Minutes | 22 (12.0%) | 4 (2.0%) |
| 60 to 89 Minutes | 7 (3.8%) | 15 (7.5%) |
| 90 or more Minutes | 8 (4.4%) | 0 (0.0%) |
Time of Departure to Work by Sex in Newcastle
The most frequent times of departure to work in Newcastle are 7:00 AM to 7:29 AM (84, 45.9%) for males and 9:00 AM to 9:59 AM (38, 19.1%) for females.
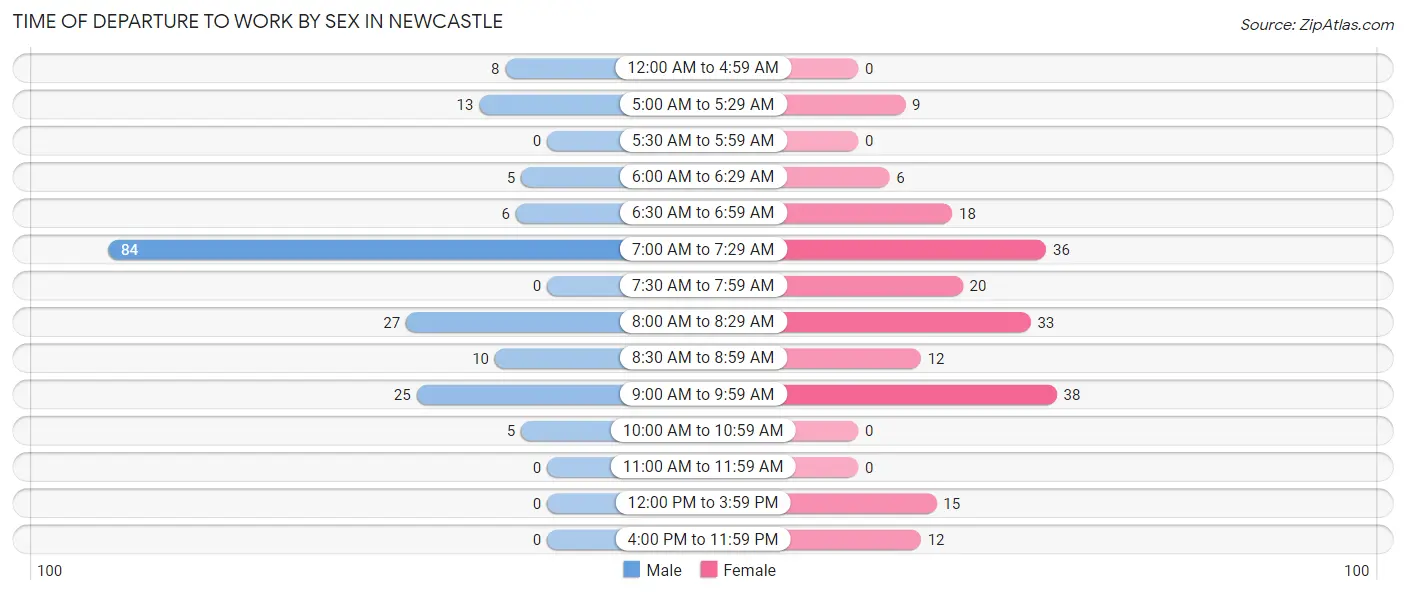
| Time of Departure | Male | Female |
| 12:00 AM to 4:59 AM | 8 (4.4%) | 0 (0.0%) |
| 5:00 AM to 5:29 AM | 13 (7.1%) | 9 (4.5%) |
| 5:30 AM to 5:59 AM | 0 (0.0%) | 0 (0.0%) |
| 6:00 AM to 6:29 AM | 5 (2.7%) | 6 (3.0%) |
| 6:30 AM to 6:59 AM | 6 (3.3%) | 18 (9.0%) |
| 7:00 AM to 7:29 AM | 84 (45.9%) | 36 (18.1%) |
| 7:30 AM to 7:59 AM | 0 (0.0%) | 20 (10.1%) |
| 8:00 AM to 8:29 AM | 27 (14.7%) | 33 (16.6%) |
| 8:30 AM to 8:59 AM | 10 (5.5%) | 12 (6.0%) |
| 9:00 AM to 9:59 AM | 25 (13.7%) | 38 (19.1%) |
| 10:00 AM to 10:59 AM | 5 (2.7%) | 0 (0.0%) |
| 11:00 AM to 11:59 AM | 0 (0.0%) | 0 (0.0%) |
| 12:00 PM to 3:59 PM | 0 (0.0%) | 15 (7.5%) |
| 4:00 PM to 11:59 PM | 0 (0.0%) | 12 (6.0%) |
| Total | 183 (100.0%) | 199 (100.0%) |
Housing Occupancy in Newcastle
Occupancy by Ownership in Newcastle
Of the total 599 dwellings in Newcastle, owner-occupied units account for 572 (95.5%), while renter-occupied units make up 27 (4.5%).
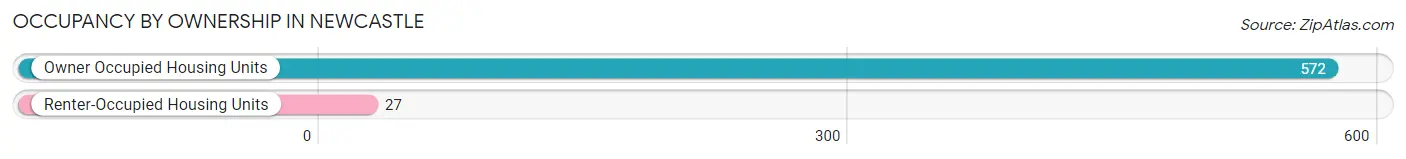
| Occupancy | # Housing Units | % Housing Units |
| Owner Occupied Housing Units | 572 | 95.5% |
| Renter-Occupied Housing Units | 27 | 4.5% |
| Total Occupied Housing Units | 599 | 100.0% |
Occupancy by Household Size in Newcastle
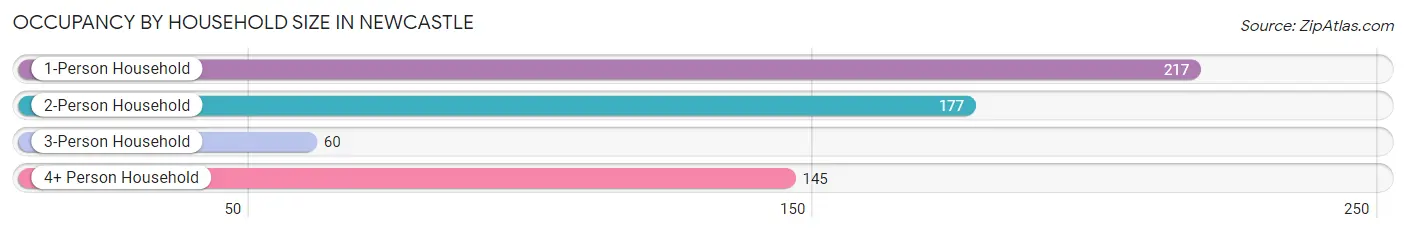
| Household Size | # Housing Units | % Housing Units |
| 1-Person Household | 217 | 36.2% |
| 2-Person Household | 177 | 29.5% |
| 3-Person Household | 60 | 10.0% |
| 4+ Person Household | 145 | 24.2% |
| Total Housing Units | 599 | 100.0% |
Occupancy by Ownership by Household Size in Newcastle
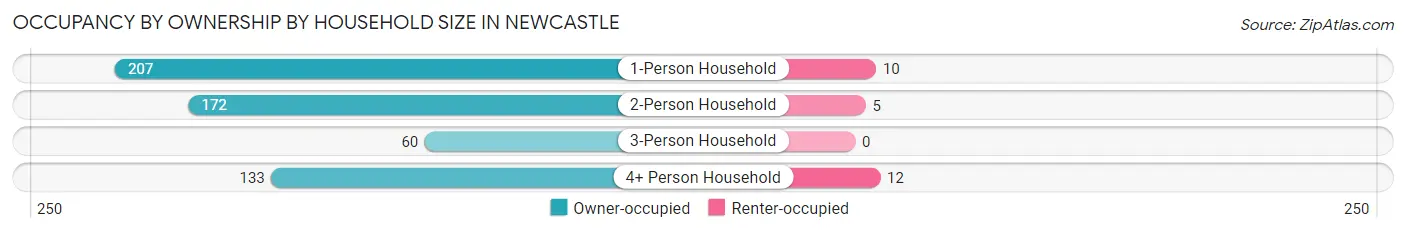
| Household Size | Owner-occupied | Renter-occupied |
| 1-Person Household | 207 (95.4%) | 10 (4.6%) |
| 2-Person Household | 172 (97.2%) | 5 (2.8%) |
| 3-Person Household | 60 (100.0%) | 0 (0.0%) |
| 4+ Person Household | 133 (91.7%) | 12 (8.3%) |
| Total Housing Units | 572 (95.5%) | 27 (4.5%) |
Occupancy by Educational Attainment in Newcastle
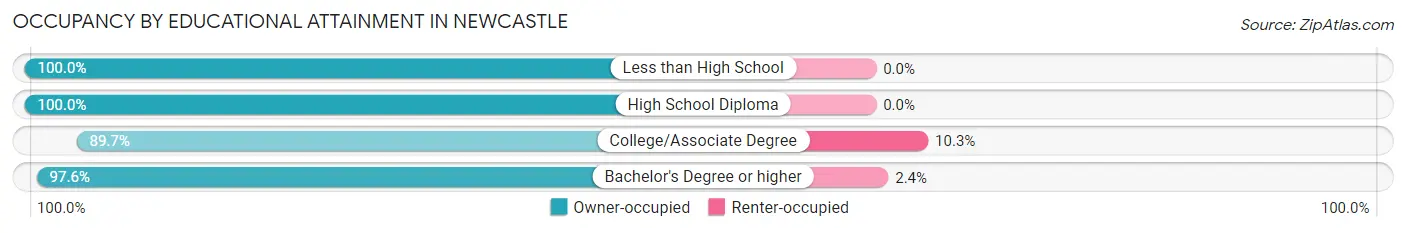
| Household Size | Owner-occupied | Renter-occupied |
| Less than High School | 24 (100.0%) | 0 (0.0%) |
| High School Diploma | 185 (100.0%) | 0 (0.0%) |
| College/Associate Degree | 200 (89.7%) | 23 (10.3%) |
| Bachelor's Degree or higher | 163 (97.6%) | 4 (2.4%) |
Occupancy by Age of Householder in Newcastle
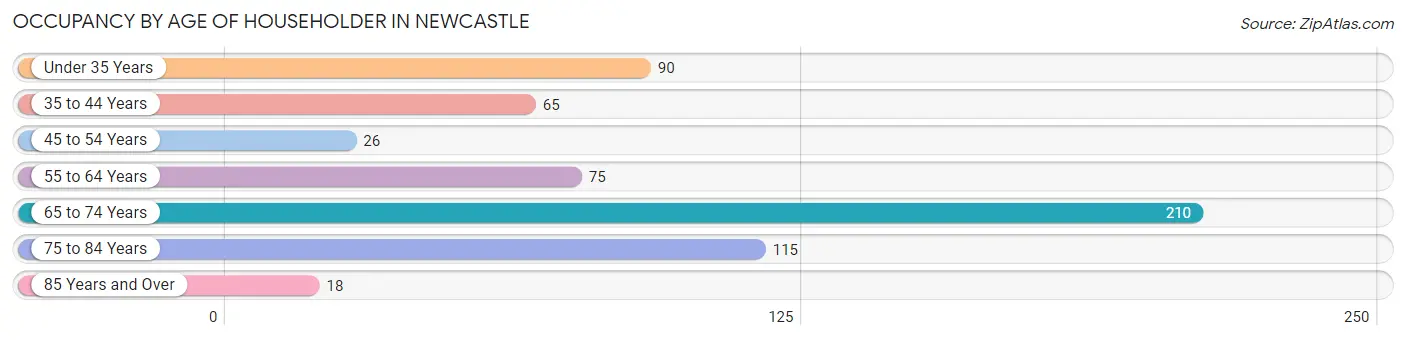
| Age Bracket | # Households | % Households |
| Under 35 Years | 90 | 15.0% |
| 35 to 44 Years | 65 | 10.8% |
| 45 to 54 Years | 26 | 4.3% |
| 55 to 64 Years | 75 | 12.5% |
| 65 to 74 Years | 210 | 35.1% |
| 75 to 84 Years | 115 | 19.2% |
| 85 Years and Over | 18 | 3.0% |
| Total | 599 | 100.0% |
Housing Finances in Newcastle
Median Income by Occupancy in Newcastle
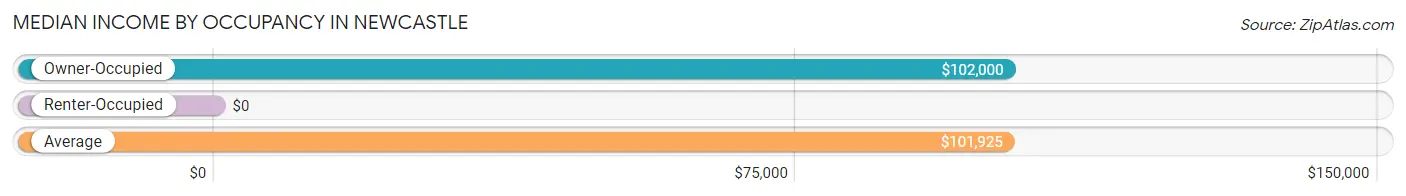
| Occupancy Type | # Households | Median Income |
| Owner-Occupied | 572 (95.5%) | $102,000 |
| Renter-Occupied | 27 (4.5%) | $0 |
| Average | 599 (100.0%) | $101,925 |
Occupancy by Householder Income Bracket in Newcastle
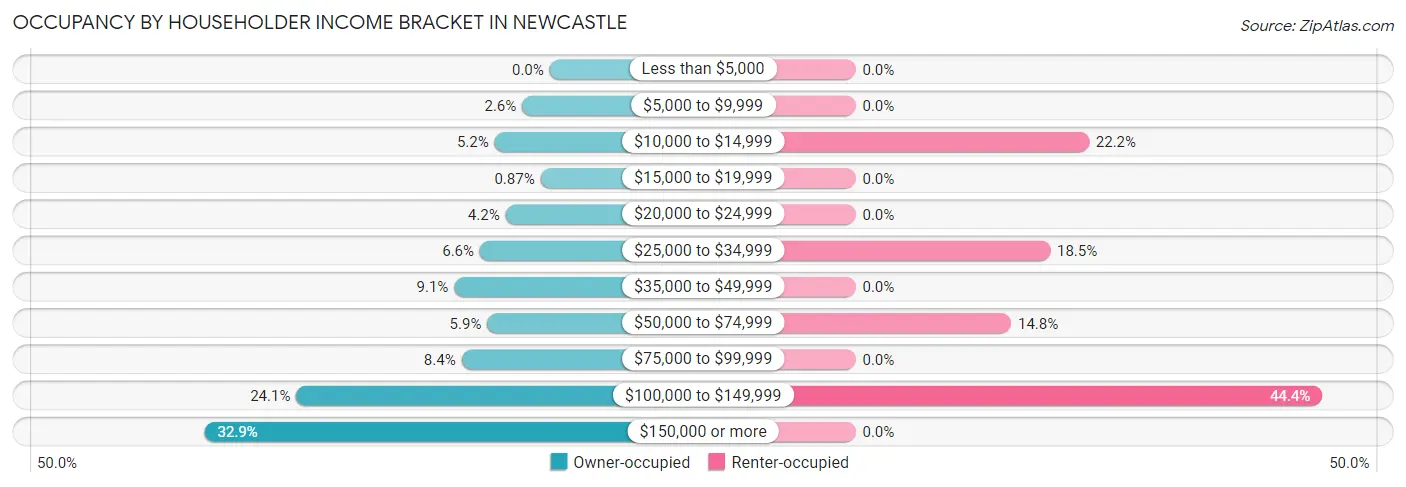
| Income Bracket | Owner-occupied | Renter-occupied |
| Less than $5,000 | 0 (0.0%) | 0 (0.0%) |
| $5,000 to $9,999 | 15 (2.6%) | 0 (0.0%) |
| $10,000 to $14,999 | 30 (5.2%) | 6 (22.2%) |
| $15,000 to $19,999 | 5 (0.9%) | 0 (0.0%) |
| $20,000 to $24,999 | 24 (4.2%) | 0 (0.0%) |
| $25,000 to $34,999 | 38 (6.6%) | 5 (18.5%) |
| $35,000 to $49,999 | 52 (9.1%) | 0 (0.0%) |
| $50,000 to $74,999 | 34 (5.9%) | 4 (14.8%) |
| $75,000 to $99,999 | 48 (8.4%) | 0 (0.0%) |
| $100,000 to $149,999 | 138 (24.1%) | 12 (44.4%) |
| $150,000 or more | 188 (32.9%) | 0 (0.0%) |
| Total | 572 (100.0%) | 27 (100.0%) |
Monthly Housing Cost Tiers in Newcastle
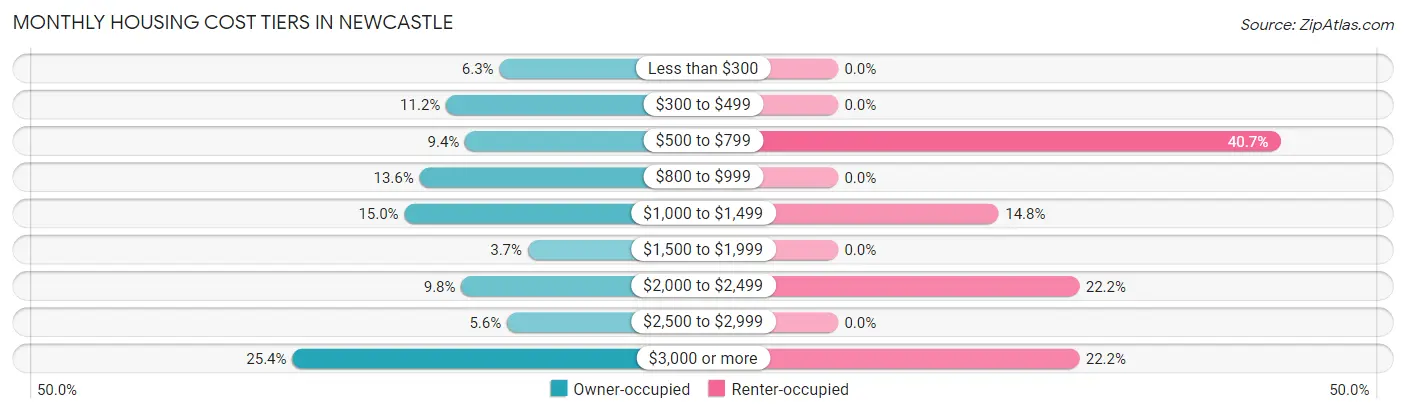
| Monthly Cost | Owner-occupied | Renter-occupied |
| Less than $300 | 36 (6.3%) | 0 (0.0%) |
| $300 to $499 | 64 (11.2%) | 0 (0.0%) |
| $500 to $799 | 54 (9.4%) | 11 (40.7%) |
| $800 to $999 | 78 (13.6%) | 0 (0.0%) |
| $1,000 to $1,499 | 86 (15.0%) | 4 (14.8%) |
| $1,500 to $1,999 | 21 (3.7%) | 0 (0.0%) |
| $2,000 to $2,499 | 56 (9.8%) | 6 (22.2%) |
| $2,500 to $2,999 | 32 (5.6%) | 0 (0.0%) |
| $3,000 or more | 145 (25.4%) | 6 (22.2%) |
| Total | 572 (100.0%) | 27 (100.0%) |
Physical Housing Characteristics in Newcastle
Housing Structures in Newcastle
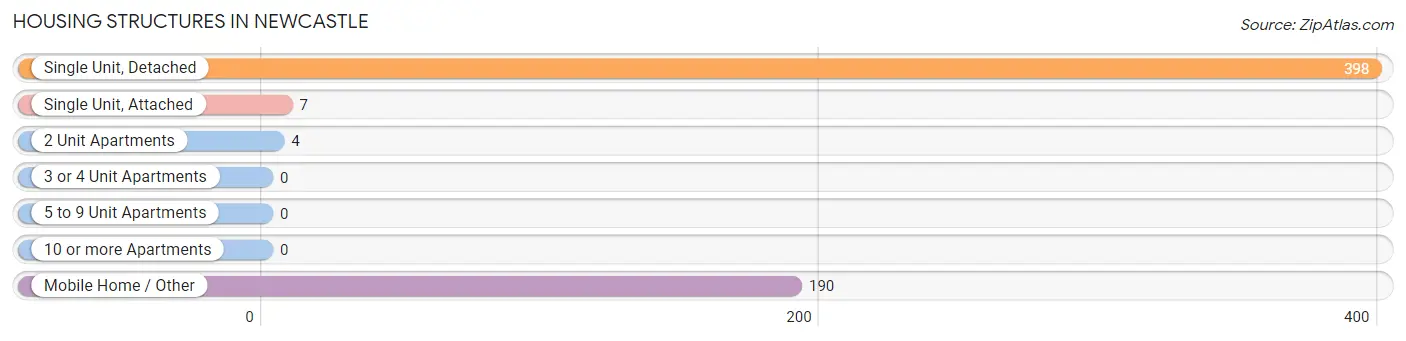
| Structure Type | # Housing Units | % Housing Units |
| Single Unit, Detached | 398 | 66.4% |
| Single Unit, Attached | 7 | 1.2% |
| 2 Unit Apartments | 4 | 0.7% |
| 3 or 4 Unit Apartments | 0 | 0.0% |
| 5 to 9 Unit Apartments | 0 | 0.0% |
| 10 or more Apartments | 0 | 0.0% |
| Mobile Home / Other | 190 | 31.7% |
| Total | 599 | 100.0% |
Housing Structures by Occupancy in Newcastle
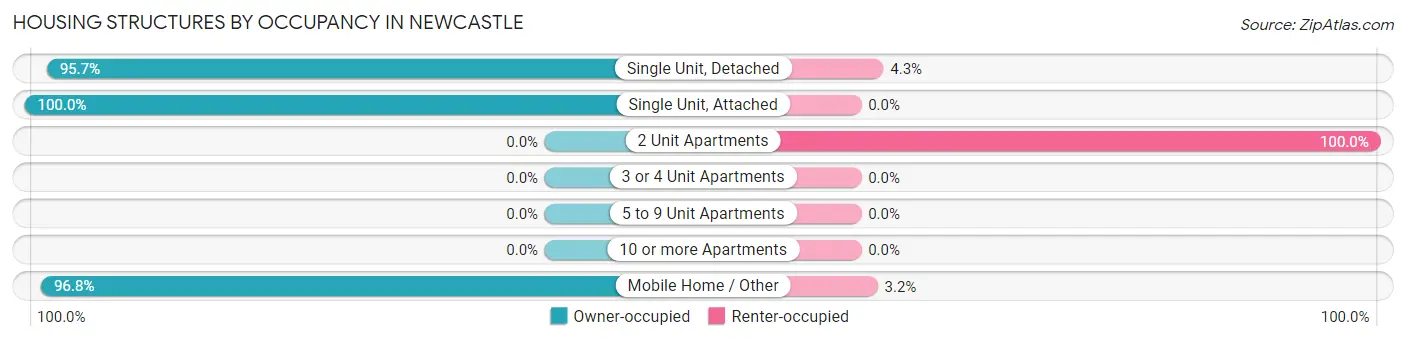
| Structure Type | Owner-occupied | Renter-occupied |
| Single Unit, Detached | 381 (95.7%) | 17 (4.3%) |
| Single Unit, Attached | 7 (100.0%) | 0 (0.0%) |
| 2 Unit Apartments | 0 (0.0%) | 4 (100.0%) |
| 3 or 4 Unit Apartments | 0 (0.0%) | 0 (0.0%) |
| 5 to 9 Unit Apartments | 0 (0.0%) | 0 (0.0%) |
| 10 or more Apartments | 0 (0.0%) | 0 (0.0%) |
| Mobile Home / Other | 184 (96.8%) | 6 (3.2%) |
| Total | 572 (95.5%) | 27 (4.5%) |
Housing Structures by Number of Rooms in Newcastle
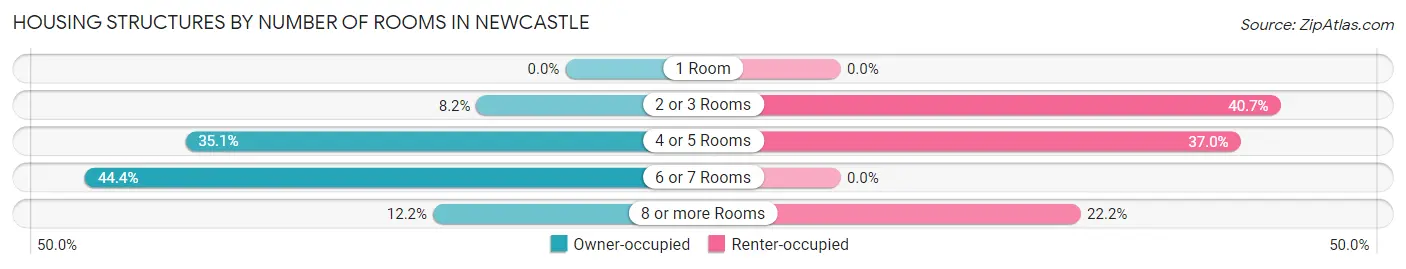
| Number of Rooms | Owner-occupied | Renter-occupied |
| 1 Room | 0 (0.0%) | 0 (0.0%) |
| 2 or 3 Rooms | 47 (8.2%) | 11 (40.7%) |
| 4 or 5 Rooms | 201 (35.1%) | 10 (37.0%) |
| 6 or 7 Rooms | 254 (44.4%) | 0 (0.0%) |
| 8 or more Rooms | 70 (12.2%) | 6 (22.2%) |
| Total | 572 (100.0%) | 27 (100.0%) |
Housing Structure by Heating Type in Newcastle
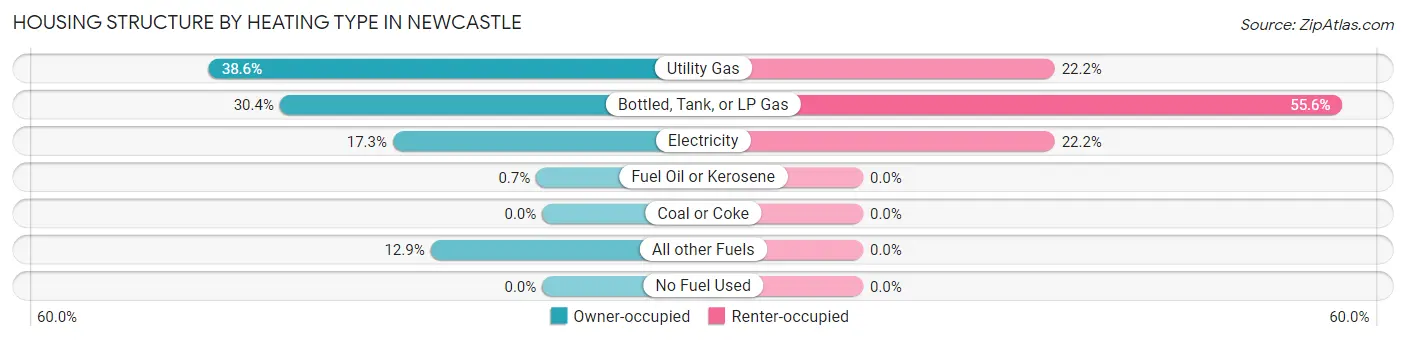
| Heating Type | Owner-occupied | Renter-occupied |
| Utility Gas | 221 (38.6%) | 6 (22.2%) |
| Bottled, Tank, or LP Gas | 174 (30.4%) | 15 (55.6%) |
| Electricity | 99 (17.3%) | 6 (22.2%) |
| Fuel Oil or Kerosene | 4 (0.7%) | 0 (0.0%) |
| Coal or Coke | 0 (0.0%) | 0 (0.0%) |
| All other Fuels | 74 (12.9%) | 0 (0.0%) |
| No Fuel Used | 0 (0.0%) | 0 (0.0%) |
| Total | 572 (100.0%) | 27 (100.0%) |
Household Vehicle Usage in Newcastle
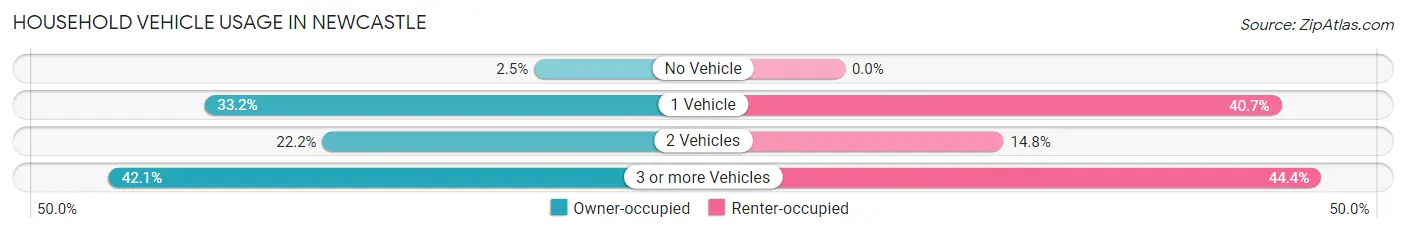
| Vehicles per Household | Owner-occupied | Renter-occupied |
| No Vehicle | 14 (2.5%) | 0 (0.0%) |
| 1 Vehicle | 190 (33.2%) | 11 (40.7%) |
| 2 Vehicles | 127 (22.2%) | 4 (14.8%) |
| 3 or more Vehicles | 241 (42.1%) | 12 (44.4%) |
| Total | 572 (100.0%) | 27 (100.0%) |
Real Estate & Mortgages in Newcastle
Real Estate and Mortgage Overview in Newcastle
| Characteristic | Without Mortgage | With Mortgage |
| Housing Units | 287 | 285 |
| Median Property Value | $173,300 | $835,600 |
| Median Household Income | $54,063 | $175 |
| Monthly Housing Costs | $754 | $138 |
| Real Estate Taxes | - | - |
Property Value by Mortgage Status in Newcastle
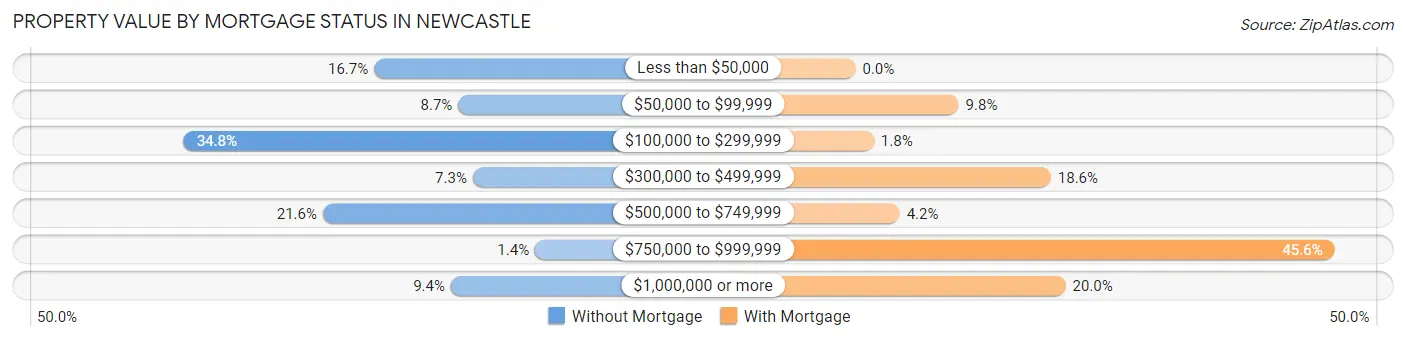
| Property Value | Without Mortgage | With Mortgage |
| Less than $50,000 | 48 (16.7%) | 0 (0.0%) |
| $50,000 to $99,999 | 25 (8.7%) | 28 (9.8%) |
| $100,000 to $299,999 | 100 (34.8%) | 5 (1.8%) |
| $300,000 to $499,999 | 21 (7.3%) | 53 (18.6%) |
| $500,000 to $749,999 | 62 (21.6%) | 12 (4.2%) |
| $750,000 to $999,999 | 4 (1.4%) | 130 (45.6%) |
| $1,000,000 or more | 27 (9.4%) | 57 (20.0%) |
| Total | 287 (100.0%) | 285 (100.0%) |
Household Income by Mortgage Status in Newcastle
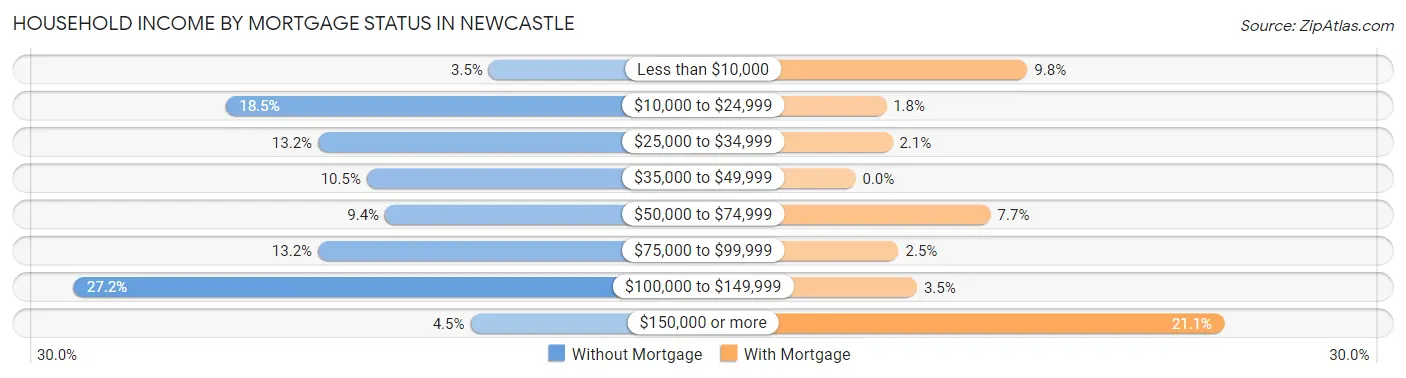
| Household Income | Without Mortgage | With Mortgage |
| Less than $10,000 | 10 (3.5%) | 28 (9.8%) |
| $10,000 to $24,999 | 53 (18.5%) | 5 (1.8%) |
| $25,000 to $34,999 | 38 (13.2%) | 6 (2.1%) |
| $35,000 to $49,999 | 30 (10.4%) | 0 (0.0%) |
| $50,000 to $74,999 | 27 (9.4%) | 22 (7.7%) |
| $75,000 to $99,999 | 38 (13.2%) | 7 (2.5%) |
| $100,000 to $149,999 | 78 (27.2%) | 10 (3.5%) |
| $150,000 or more | 13 (4.5%) | 60 (21.0%) |
| Total | 287 (100.0%) | 285 (100.0%) |
Property Value to Household Income Ratio in Newcastle
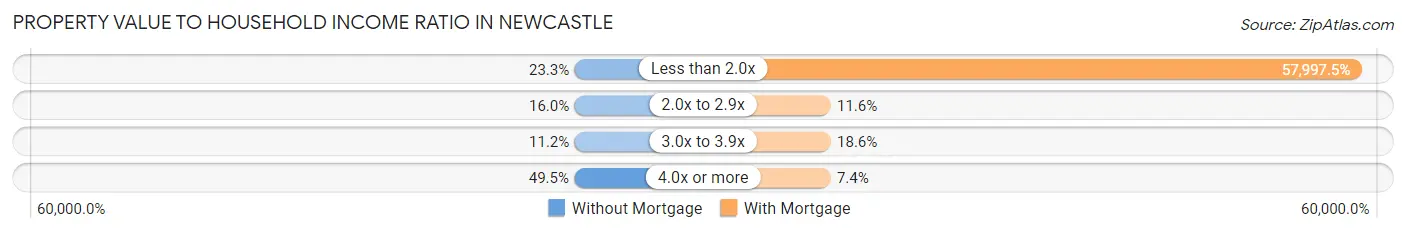
| Value-to-Income Ratio | Without Mortgage | With Mortgage |
| Less than 2.0x | 67 (23.3%) | 165,293 (57,997.5%) |
| 2.0x to 2.9x | 46 (16.0%) | 33 (11.6%) |
| 3.0x to 3.9x | 32 (11.2%) | 53 (18.6%) |
| 4.0x or more | 142 (49.5%) | 21 (7.4%) |
| Total | 287 (100.0%) | 285 (100.0%) |
Real Estate Taxes by Mortgage Status in Newcastle
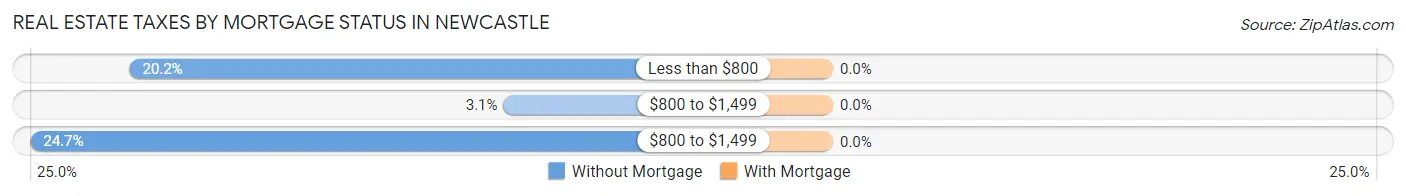
| Property Taxes | Without Mortgage | With Mortgage |
| Less than $800 | 58 (20.2%) | 0 (0.0%) |
| $800 to $1,499 | 9 (3.1%) | 0 (0.0%) |
| $800 to $1,499 | 71 (24.7%) | 0 (0.0%) |
| Total | 287 (100.0%) | 285 (100.0%) |
Health & Disability in Newcastle
Health Insurance Coverage by Age in Newcastle
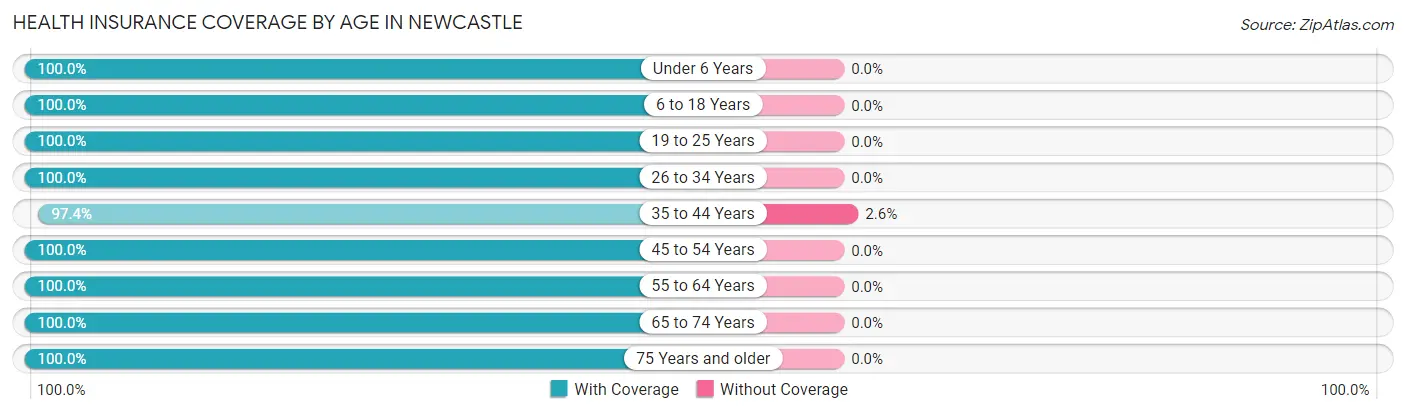
| Age Bracket | With Coverage | Without Coverage |
| Under 6 Years | 64 (100.0%) | 0 (0.0%) |
| 6 to 18 Years | 246 (100.0%) | 0 (0.0%) |
| 19 to 25 Years | 116 (100.0%) | 0 (0.0%) |
| 26 to 34 Years | 142 (100.0%) | 0 (0.0%) |
| 35 to 44 Years | 222 (97.4%) | 6 (2.6%) |
| 45 to 54 Years | 77 (100.0%) | 0 (0.0%) |
| 55 to 64 Years | 163 (100.0%) | 0 (0.0%) |
| 65 to 74 Years | 277 (100.0%) | 0 (0.0%) |
| 75 Years and older | 188 (100.0%) | 0 (0.0%) |
| Total | 1,495 (99.6%) | 6 (0.4%) |
Health Insurance Coverage by Citizenship Status in Newcastle
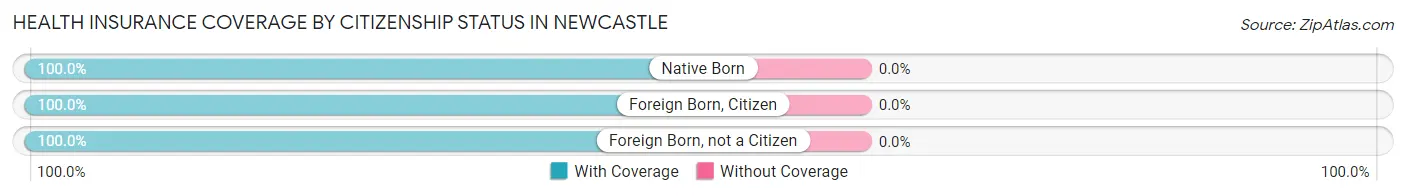
| Citizenship Status | With Coverage | Without Coverage |
| Native Born | 64 (100.0%) | 0 (0.0%) |
| Foreign Born, Citizen | 246 (100.0%) | 0 (0.0%) |
| Foreign Born, not a Citizen | 116 (100.0%) | 0 (0.0%) |
Health Insurance Coverage by Household Income in Newcastle
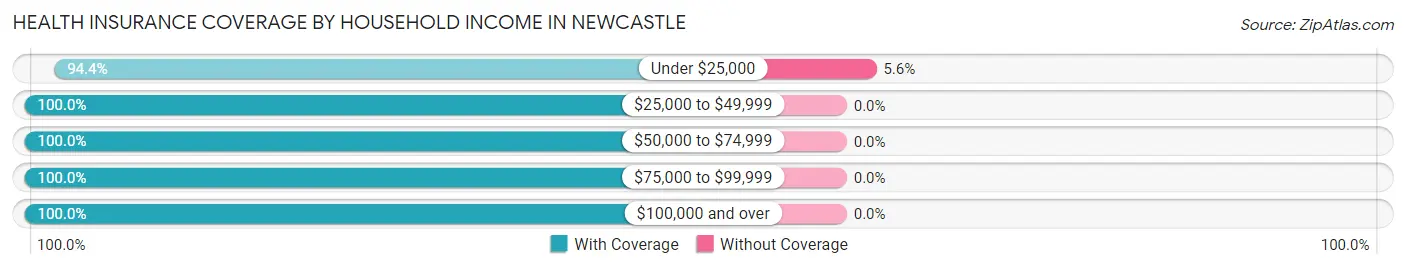
| Household Income | With Coverage | Without Coverage |
| Under $25,000 | 102 (94.4%) | 6 (5.6%) |
| $25,000 to $49,999 | 107 (100.0%) | 0 (0.0%) |
| $50,000 to $74,999 | 110 (100.0%) | 0 (0.0%) |
| $75,000 to $99,999 | 77 (100.0%) | 0 (0.0%) |
| $100,000 and over | 1,076 (100.0%) | 0 (0.0%) |
Public vs Private Health Insurance Coverage by Age in Newcastle
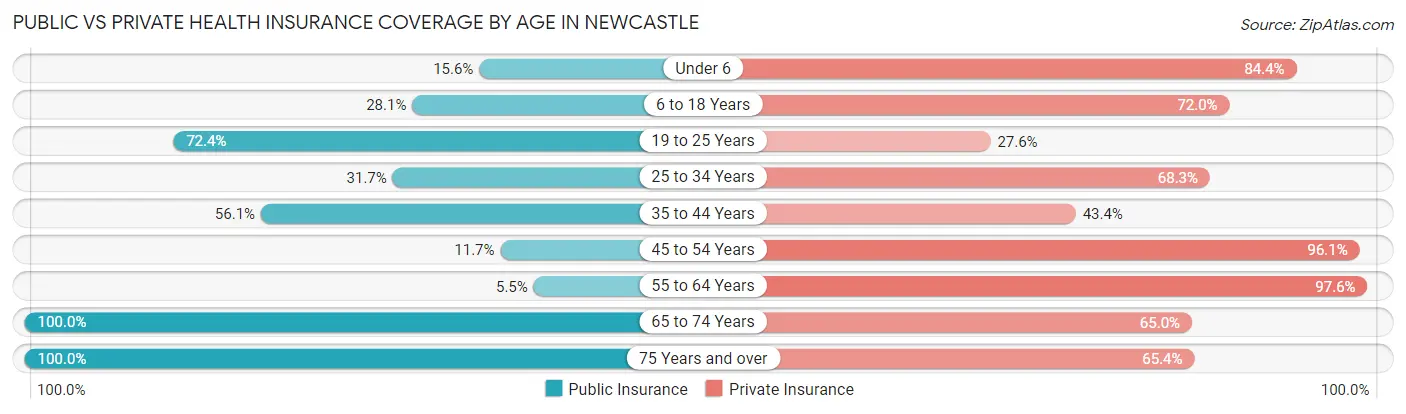
| Age Bracket | Public Insurance | Private Insurance |
| Under 6 | 10 (15.6%) | 54 (84.4%) |
| 6 to 18 Years | 69 (28.1%) | 177 (72.0%) |
| 19 to 25 Years | 84 (72.4%) | 32 (27.6%) |
| 25 to 34 Years | 45 (31.7%) | 97 (68.3%) |
| 35 to 44 Years | 128 (56.1%) | 99 (43.4%) |
| 45 to 54 Years | 9 (11.7%) | 74 (96.1%) |
| 55 to 64 Years | 9 (5.5%) | 159 (97.6%) |
| 65 to 74 Years | 277 (100.0%) | 180 (65.0%) |
| 75 Years and over | 188 (100.0%) | 123 (65.4%) |
| Total | 819 (54.6%) | 995 (66.3%) |
Disability Status by Sex by Age in Newcastle
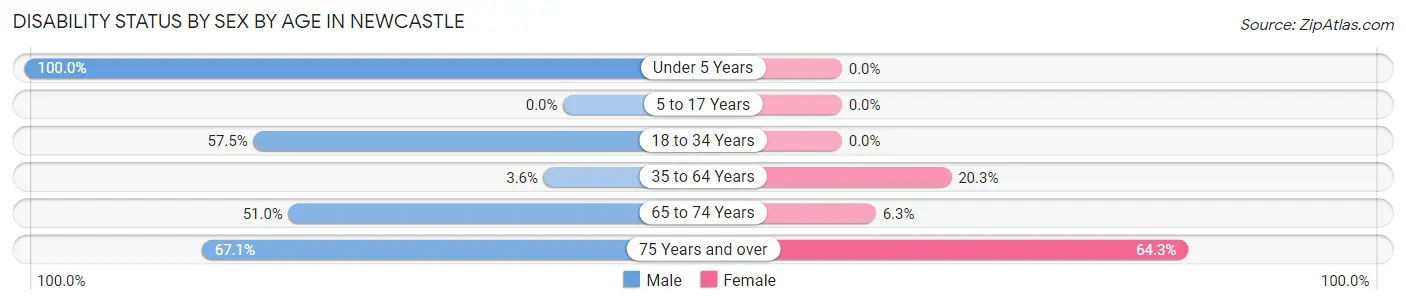
| Age Bracket | Male | Female |
| Under 5 Years | 7 (100.0%) | 0 (0.0%) |
| 5 to 17 Years | 0 (0.0%) | 0 (0.0%) |
| 18 to 34 Years | 92 (57.5%) | 0 (0.0%) |
| 35 to 64 Years | 10 (3.6%) | 39 (20.3%) |
| 65 to 74 Years | 52 (51.0%) | 11 (6.3%) |
| 75 Years and over | 51 (67.1%) | 72 (64.3%) |
Disability Class by Sex by Age in Newcastle
Disability Class: Hearing Difficulty
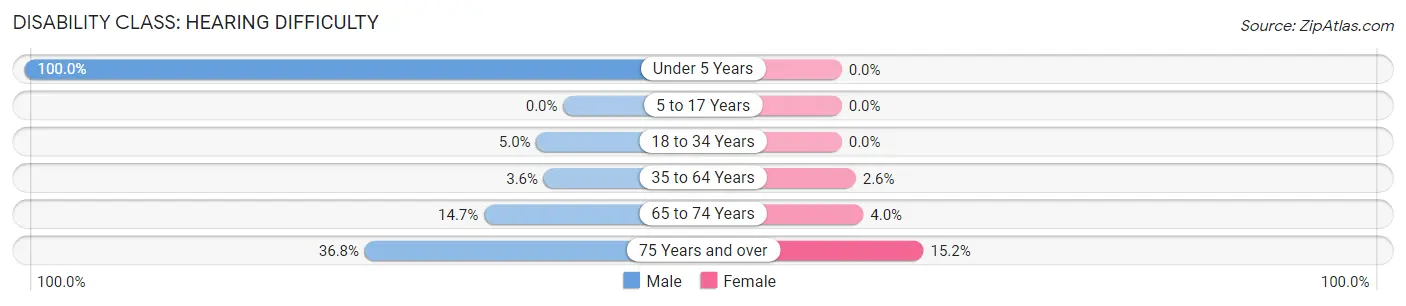
| Age Bracket | Male | Female |
| Under 5 Years | 7 (100.0%) | 0 (0.0%) |
| 5 to 17 Years | 0 (0.0%) | 0 (0.0%) |
| 18 to 34 Years | 8 (5.0%) | 0 (0.0%) |
| 35 to 64 Years | 10 (3.6%) | 5 (2.6%) |
| 65 to 74 Years | 15 (14.7%) | 7 (4.0%) |
| 75 Years and over | 28 (36.8%) | 17 (15.2%) |
Disability Class: Vision Difficulty
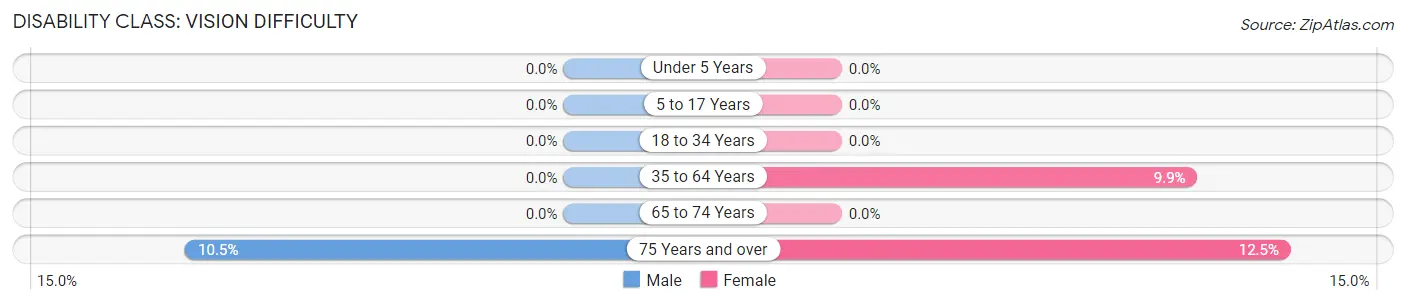
| Age Bracket | Male | Female |
| Under 5 Years | 0 (0.0%) | 0 (0.0%) |
| 5 to 17 Years | 0 (0.0%) | 0 (0.0%) |
| 18 to 34 Years | 0 (0.0%) | 0 (0.0%) |
| 35 to 64 Years | 0 (0.0%) | 19 (9.9%) |
| 65 to 74 Years | 0 (0.0%) | 0 (0.0%) |
| 75 Years and over | 8 (10.5%) | 14 (12.5%) |
Disability Class: Cognitive Difficulty
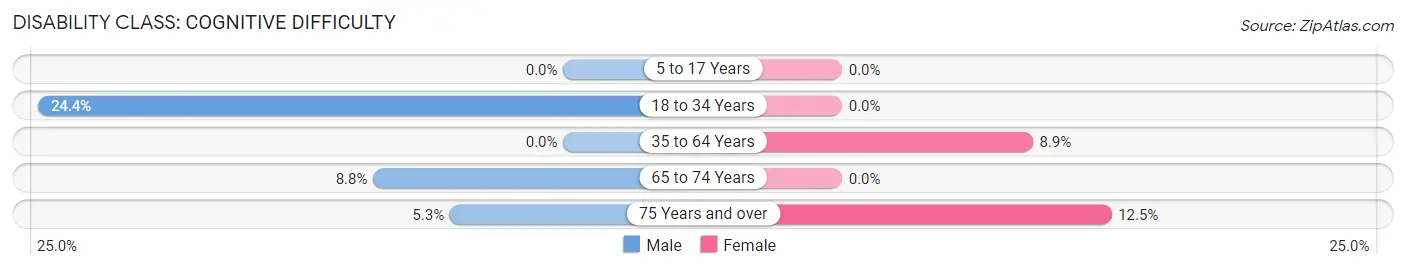
| Age Bracket | Male | Female |
| 5 to 17 Years | 0 (0.0%) | 0 (0.0%) |
| 18 to 34 Years | 39 (24.4%) | 0 (0.0%) |
| 35 to 64 Years | 0 (0.0%) | 17 (8.8%) |
| 65 to 74 Years | 9 (8.8%) | 0 (0.0%) |
| 75 Years and over | 4 (5.3%) | 14 (12.5%) |
Disability Class: Ambulatory Difficulty
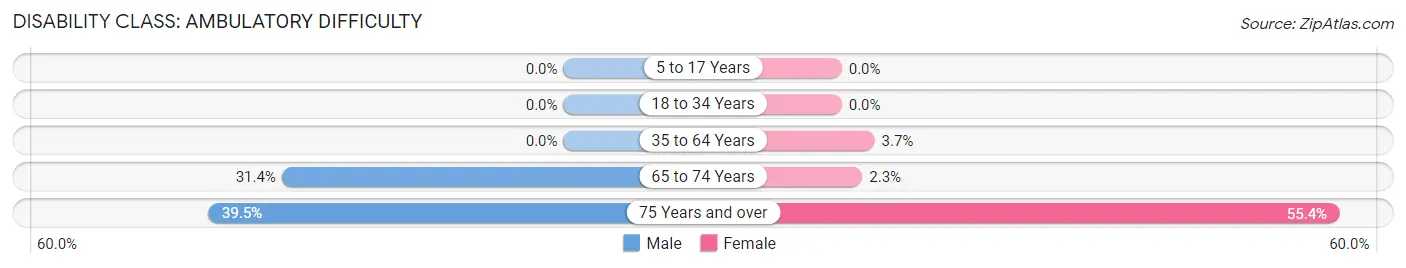
| Age Bracket | Male | Female |
| 5 to 17 Years | 0 (0.0%) | 0 (0.0%) |
| 18 to 34 Years | 0 (0.0%) | 0 (0.0%) |
| 35 to 64 Years | 0 (0.0%) | 7 (3.6%) |
| 65 to 74 Years | 32 (31.4%) | 4 (2.3%) |
| 75 Years and over | 30 (39.5%) | 62 (55.4%) |
Disability Class: Self-Care Difficulty
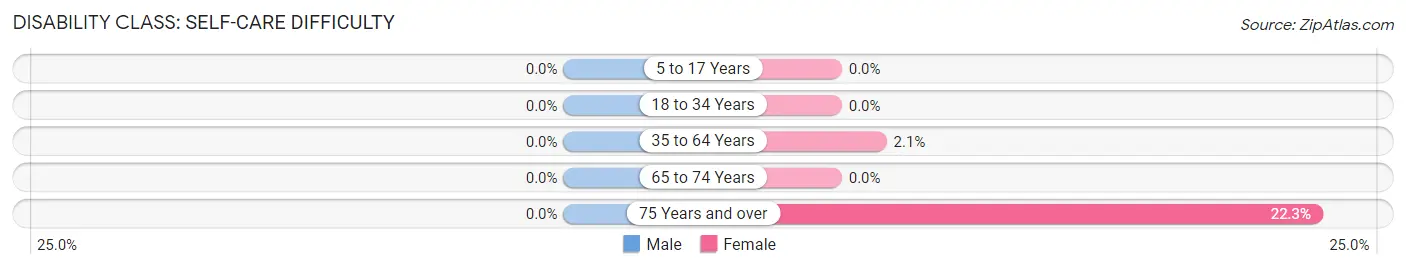
| Age Bracket | Male | Female |
| 5 to 17 Years | 0 (0.0%) | 0 (0.0%) |
| 18 to 34 Years | 0 (0.0%) | 0 (0.0%) |
| 35 to 64 Years | 0 (0.0%) | 4 (2.1%) |
| 65 to 74 Years | 0 (0.0%) | 0 (0.0%) |
| 75 Years and over | 0 (0.0%) | 25 (22.3%) |
Technology Access in Newcastle
Computing Device Access in Newcastle
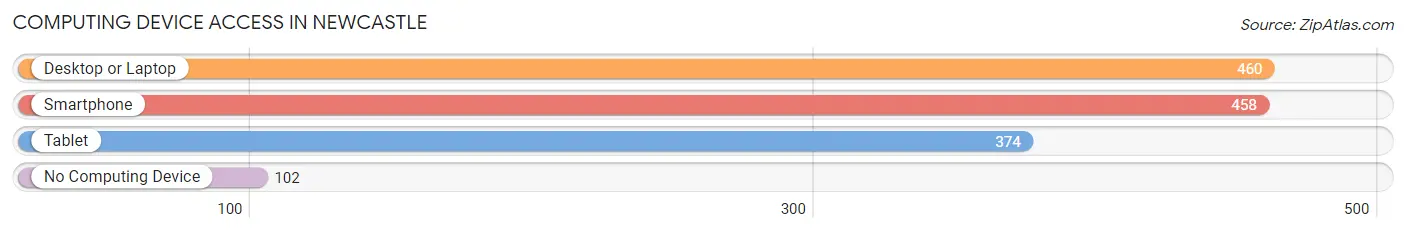
| Device Type | # Households | % Households |
| Desktop or Laptop | 460 | 76.8% |
| Smartphone | 458 | 76.5% |
| Tablet | 374 | 62.4% |
| No Computing Device | 102 | 17.0% |
| Total | 599 | 100.0% |
Internet Access in Newcastle
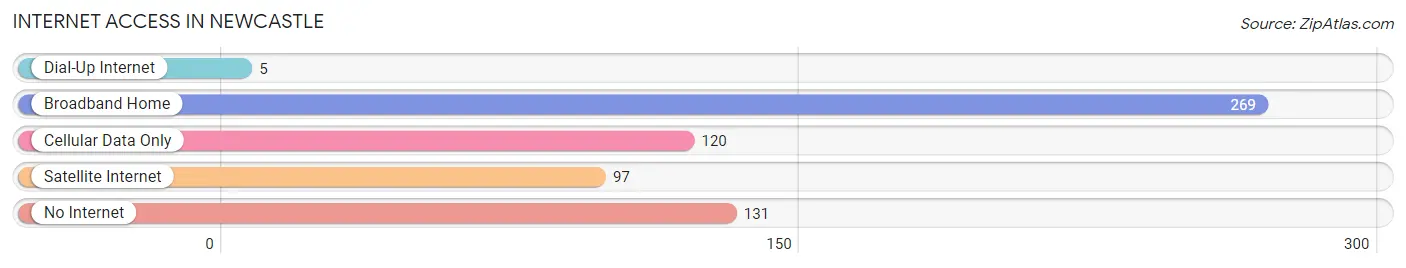
| Internet Type | # Households | % Households |
| Dial-Up Internet | 5 | 0.8% |
| Broadband Home | 269 | 44.9% |
| Cellular Data Only | 120 | 20.0% |
| Satellite Internet | 97 | 16.2% |
| No Internet | 131 | 21.9% |
| Total | 599 | 100.0% |
Newcastle Summary
Newcastle is a small town located in Placer County, California, United States. It is situated in the foothills of the Sierra Nevada Mountains, approximately 25 miles northeast of Sacramento. The town has a population of about 1,200 people and is known for its rural atmosphere and small-town charm.
History
The area that is now Newcastle was originally inhabited by the Maidu Indians. The first European settlers arrived in the area in the mid-1800s, and the town was officially founded in 1864. The town was named after Newcastle-upon-Tyne in England, and the first post office was established in 1867.
In the late 1800s, Newcastle was a bustling mining town, with several gold and silver mines in the area. The town was also home to a number of businesses, including a blacksmith shop, a hotel, a general store, and a saloon.
Geography
Newcastle is located in the foothills of the Sierra Nevada Mountains, at an elevation of 1,200 feet. The town is situated on the banks of the North Fork of the American River, and is surrounded by rolling hills and oak-studded meadows. The climate in Newcastle is mild, with hot summers and cool winters.
Economy
The economy of Newcastle is largely based on agriculture and tourism. The town is home to several wineries, and the surrounding area is known for its apple orchards and vineyards. The town also has a number of small businesses, including restaurants, antique stores, and art galleries.
Demographics
As of the 2010 census, the population of Newcastle was 1,224. The racial makeup of the town was 91.3% White, 0.7% African American, 0.7% Native American, 0.7% Asian, 0.2% Pacific Islander, 4.2% from other races, and 2.1% from two or more races. The median household income in Newcastle was $63,750, and the median family income was $71,250.
Conclusion
Newcastle is a small town located in Placer County, California, United States. It is situated in the foothills of the Sierra Nevada Mountains, approximately 25 miles northeast of Sacramento. The town has a population of about 1,200 people and is known for its rural atmosphere and small-town charm. The economy of Newcastle is largely based on agriculture and tourism, and the town is home to several wineries, apple orchards, and vineyards. The racial makeup of the town is 91.3% White, 0.7% African American, 0.7% Native American, 0.7% Asian, 0.2% Pacific Islander, 4.2% from other races, and 2.1% from two or more races. The median household income in Newcastle was $63,750, and the median family income was $71,250.
Common Questions
What is Per Capita Income in Newcastle?
Per Capita income in Newcastle is $47,152.
What is the Median Family Income in Newcastle?
Median Family Income in Newcastle is $147,813.
What is the Median Household income in Newcastle?
Median Household Income in Newcastle is $101,925.
What is Income or Wage Gap in Newcastle?
Income or Wage Gap in Newcastle is 50.2%.
Women in Newcastle earn 49.8 cents for every dollar earned by a man.
What is Inequality or Gini Index in Newcastle?
Inequality or Gini Index in Newcastle is 0.42.
What is the Total Population of Newcastle?
Total Population of Newcastle is 1,501.
What is the Total Male Population of Newcastle?
Total Male Population of Newcastle is 764.
What is the Total Female Population of Newcastle?
Total Female Population of Newcastle is 737.
What is the Ratio of Males per 100 Females in Newcastle?
There are 103.66 Males per 100 Females in Newcastle.
What is the Ratio of Females per 100 Males in Newcastle?
There are 96.47 Females per 100 Males in Newcastle.
What is the Median Population Age in Newcastle?
Median Population Age in Newcastle is 43.2 Years.
What is the Average Family Size in Newcastle
Average Family Size in Newcastle is 3.2 People.
What is the Average Household Size in Newcastle
Average Household Size in Newcastle is 2.5 People.
How Large is the Labor Force in Newcastle?
There are 497 People in the Labor Forcein in Newcastle.
What is the Percentage of People in the Labor Force in Newcastle?
41.0% of People are in the Labor Force in Newcastle.
What is the Unemployment Rate in Newcastle?
Unemployment Rate in Newcastle is 4.2%.