Elverta, CA Map & Demographics
Elverta Map
Elverta Overview
$38,431
PER CAPITA INCOME
$96,359
AVG FAMILY INCOME
$89,745
AVG HOUSEHOLD INCOME
20.6%
WAGE / INCOME GAP [ % ]
79.4¢/ $1
WAGE / INCOME GAP [ $ ]
0.40
INEQUALITY / GINI INDEX
5,102
TOTAL POPULATION
2,584
MALE POPULATION
2,518
FEMALE POPULATION
102.62
MALES / 100 FEMALES
97.45
FEMALES / 100 MALES
44.9
MEDIAN AGE
3.4
AVG FAMILY SIZE
3.1
AVG HOUSEHOLD SIZE
2,603
LABOR FORCE [ PEOPLE ]
60.4%
PERCENT IN LABOR FORCE
4.2%
UNEMPLOYMENT RATE
Elverta Zip Codes
Elverta Area Codes
Income in Elverta
Income Overview in Elverta
Per Capita Income in Elverta is $38,431, while median incomes of families and households are $96,359 and $89,745 respectively.
| Characteristic | Number | Measure |
| Per Capita Income | 5,102 | $38,431 |
| Median Family Income | 1,313 | $96,359 |
| Mean Family Income | 1,313 | $122,472 |
| Median Household Income | 1,655 | $89,745 |
| Mean Household Income | 1,655 | $114,953 |
| Income Deficit | 1,313 | $0 |
| Wage / Income Gap (%) | 5,102 | 20.61% |
| Wage / Income Gap ($) | 5,102 | 79.39¢ per $1 |
| Gini / Inequality Index | 5,102 | 0.40 |
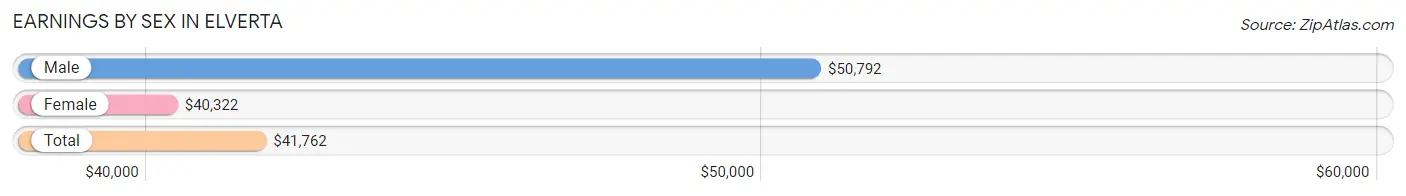
Earnings by Sex in Elverta
Average Earnings in Elverta are $41,762, $50,792 for men and $40,322 for women, a difference of 20.6%.
| Sex | Number | Average Earnings |
| Male | 1,330 (51.0%) | $50,792 |
| Female | 1,279 (49.0%) | $40,322 |
| Total | 2,609 (100.0%) | $41,762 |
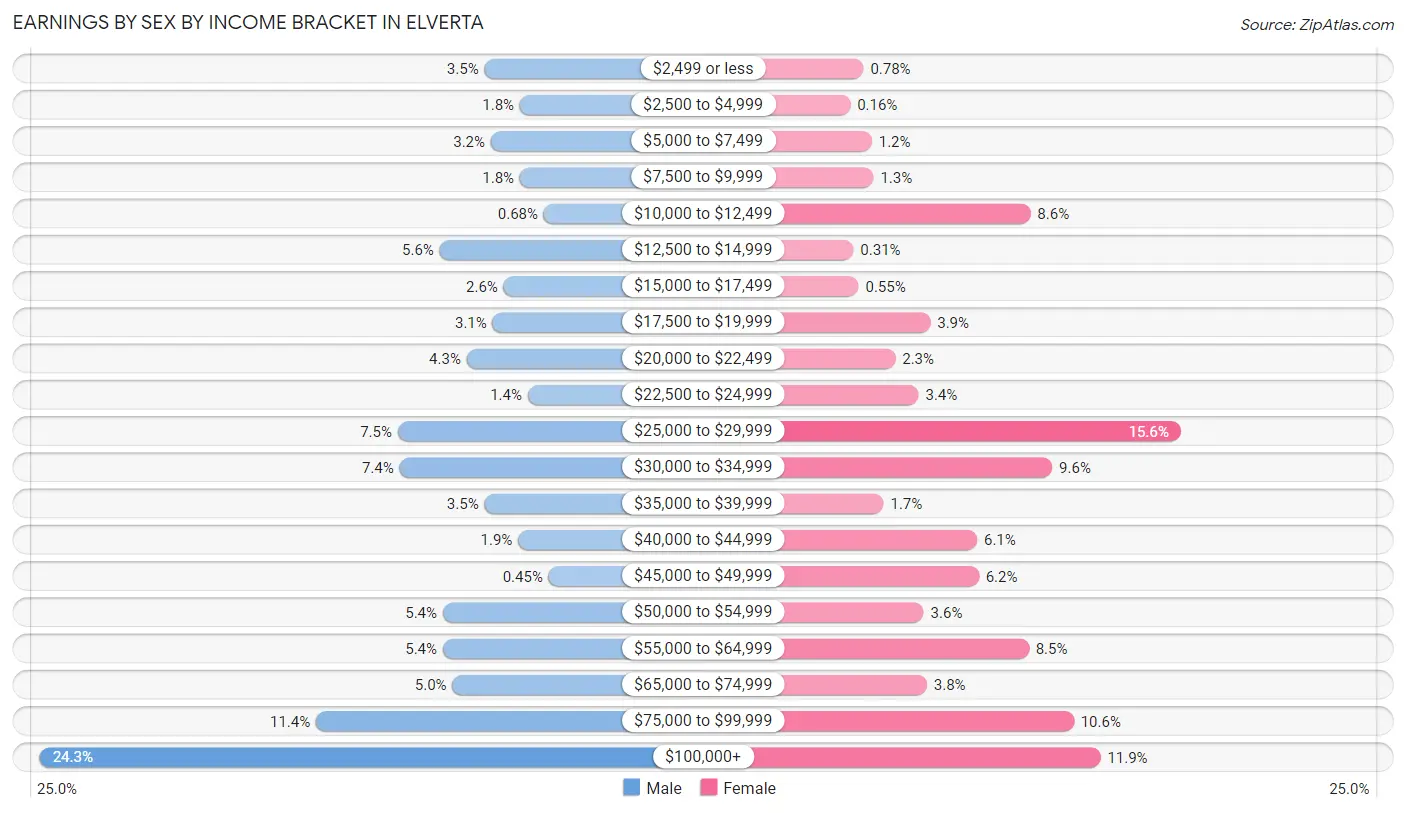
Earnings by Sex by Income Bracket in Elverta
The most common earnings brackets in Elverta are $100,000+ for men (323 | 24.3%) and $25,000 to $29,999 for women (200 | 15.6%).
| Income | Male | Female |
| $2,499 or less | 46 (3.5%) | 10 (0.8%) |
| $2,500 to $4,999 | 24 (1.8%) | 2 (0.2%) |
| $5,000 to $7,499 | 42 (3.2%) | 15 (1.2%) |
| $7,500 to $9,999 | 24 (1.8%) | 16 (1.3%) |
| $10,000 to $12,499 | 9 (0.7%) | 110 (8.6%) |
| $12,500 to $14,999 | 74 (5.6%) | 4 (0.3%) |
| $15,000 to $17,499 | 34 (2.6%) | 7 (0.5%) |
| $17,500 to $19,999 | 41 (3.1%) | 50 (3.9%) |
| $20,000 to $22,499 | 57 (4.3%) | 29 (2.3%) |
| $22,500 to $24,999 | 19 (1.4%) | 43 (3.4%) |
| $25,000 to $29,999 | 100 (7.5%) | 200 (15.6%) |
| $30,000 to $34,999 | 99 (7.4%) | 123 (9.6%) |
| $35,000 to $39,999 | 46 (3.5%) | 22 (1.7%) |
| $40,000 to $44,999 | 25 (1.9%) | 78 (6.1%) |
| $45,000 to $49,999 | 6 (0.4%) | 79 (6.2%) |
| $50,000 to $54,999 | 72 (5.4%) | 46 (3.6%) |
| $55,000 to $64,999 | 72 (5.4%) | 109 (8.5%) |
| $65,000 to $74,999 | 66 (5.0%) | 48 (3.7%) |
| $75,000 to $99,999 | 151 (11.4%) | 136 (10.6%) |
| $100,000+ | 323 (24.3%) | 152 (11.9%) |
| Total | 1,330 (100.0%) | 1,279 (100.0%) |
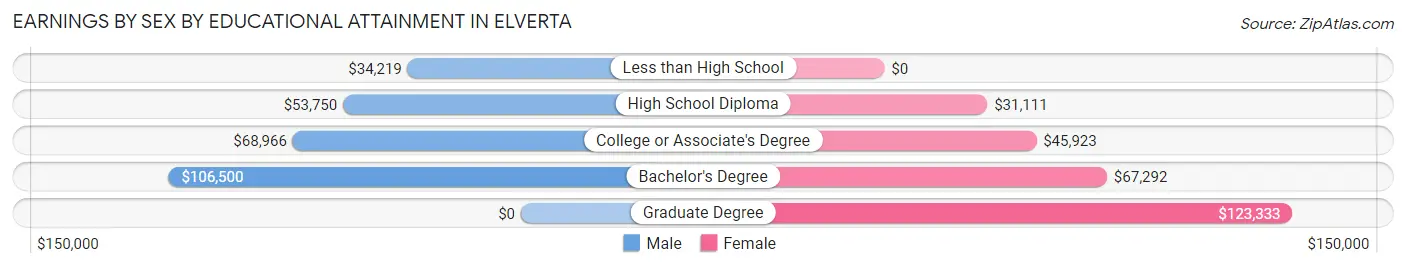
Earnings by Sex by Educational Attainment in Elverta
Average earnings in Elverta are $62,768 for men and $45,485 for women, a difference of 27.5%. Men with an educational attainment of bachelor's degree enjoy the highest average annual earnings of $106,500, while those with less than high school education earn the least with $34,219. Women with an educational attainment of graduate degree earn the most with the average annual earnings of $123,333, while those with high school diploma education have the smallest earnings of $31,111.
| Educational Attainment | Male Income | Female Income |
| Less than High School | $34,219 | $0 |
| High School Diploma | $53,750 | $31,111 |
| College or Associate's Degree | $68,966 | $45,923 |
| Bachelor's Degree | $106,500 | $67,292 |
| Graduate Degree | - | - |
| Total | $62,768 | $45,485 |
Family Income in Elverta
Family Income Brackets in Elverta
According to the Elverta family income data, there are 240 families falling into the $200,000+ income range, which is the most common income bracket and makes up 18.3% of all families. Conversely, the less than $10,000 income bracket is the least frequent group with only 14 families (1.1%) belonging to this category.
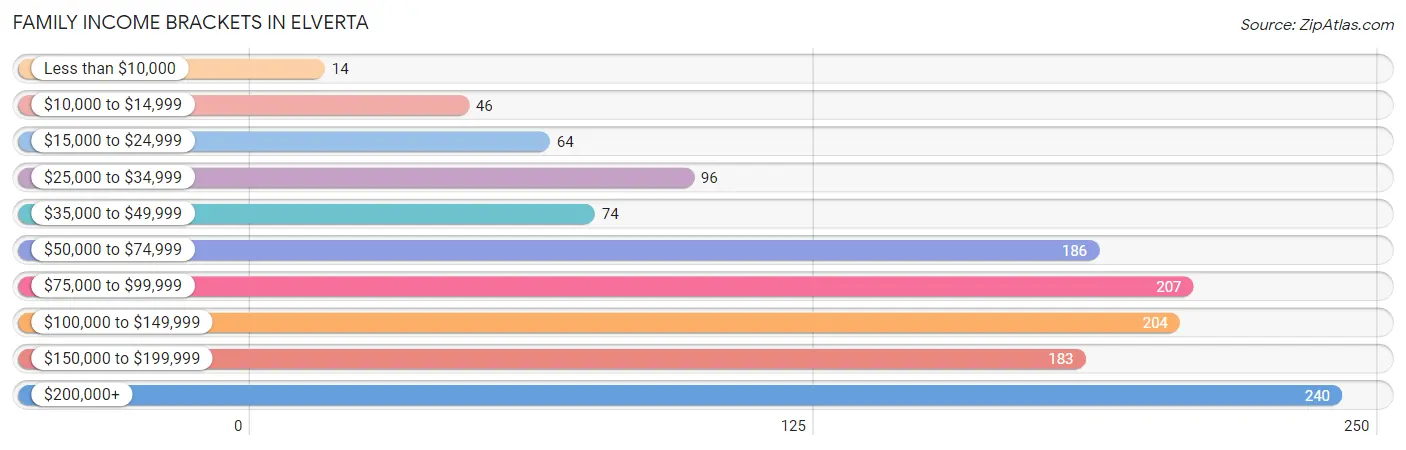
| Income Bracket | # Families | % Families |
| Less than $10,000 | 14 | 1.1% |
| $10,000 to $14,999 | 46 | 3.5% |
| $15,000 to $24,999 | 64 | 4.9% |
| $25,000 to $34,999 | 96 | 7.3% |
| $35,000 to $49,999 | 74 | 5.6% |
| $50,000 to $74,999 | 186 | 14.2% |
| $75,000 to $99,999 | 207 | 15.8% |
| $100,000 to $149,999 | 204 | 15.5% |
| $150,000 to $199,999 | 183 | 13.9% |
| $200,000+ | 240 | 18.3% |
Family Income by Famaliy Size in Elverta
5-person families (187 | 14.2%) account for the highest median family income in Elverta with $218,099 per family, while 2-person families (569 | 43.3%) have the highest median income of $44,375 per family member.
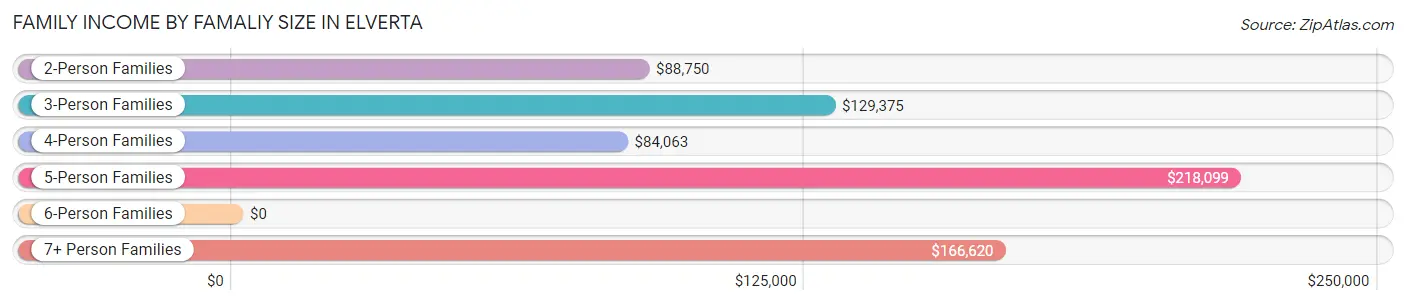
| Income Bracket | # Families | Median Income |
| 2-Person Families | 569 (43.3%) | $88,750 |
| 3-Person Families | 281 (21.4%) | $129,375 |
| 4-Person Families | 195 (14.8%) | $84,063 |
| 5-Person Families | 187 (14.2%) | $218,099 |
| 6-Person Families | 40 (3.0%) | $0 |
| 7+ Person Families | 41 (3.1%) | $166,620 |
| Total | 1,313 (100.0%) | $96,359 |
Family Income by Number of Earners in Elverta
The median family income in Elverta is $96,359, with families comprising 3+ earners (275) having the highest median family income of $217,582, while families with no earners (242) have the lowest median family income of $56,500, accounting for 20.9% and 18.4% of families, respectively.
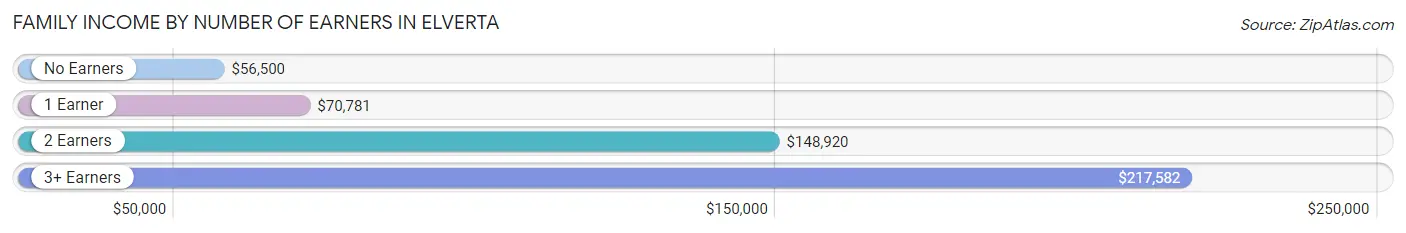
| Number of Earners | # Families | Median Income |
| No Earners | 242 (18.4%) | $56,500 |
| 1 Earner | 435 (33.1%) | $70,781 |
| 2 Earners | 361 (27.5%) | $148,920 |
| 3+ Earners | 275 (20.9%) | $217,582 |
| Total | 1,313 (100.0%) | $96,359 |
Household Income in Elverta
Household Income Brackets in Elverta
With 290 households falling in the category, the $100,000 to $149,999 income range is the most frequent in Elverta, accounting for 17.5% of all households. In contrast, only 48 households (2.9%) fall into the $10,000 to $14,999 income bracket, making it the least populous group.
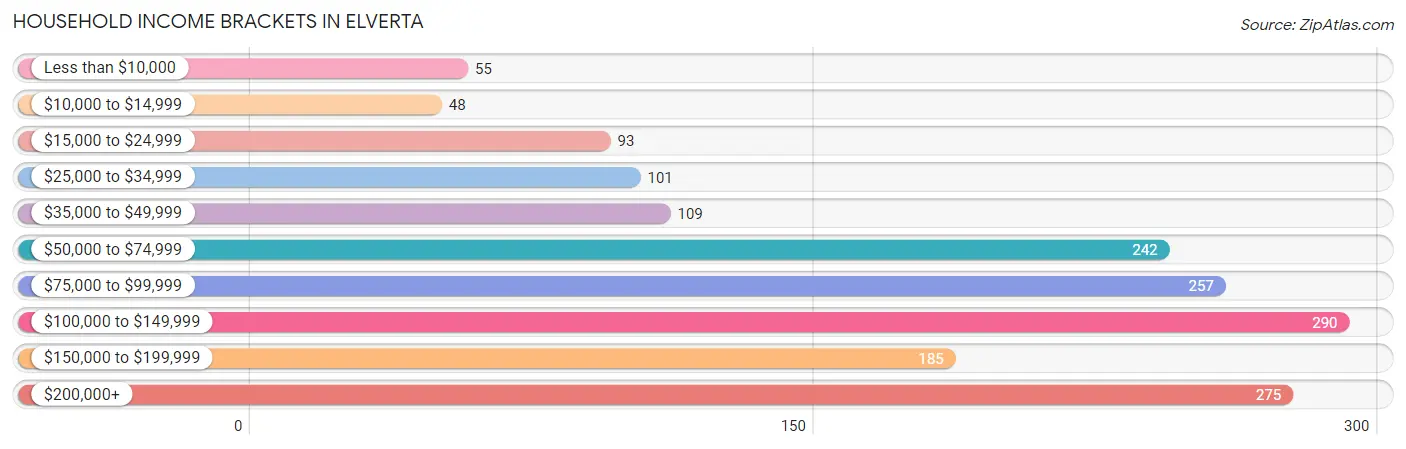
| Income Bracket | # Households | % Households |
| Less than $10,000 | 55 | 3.3% |
| $10,000 to $14,999 | 48 | 2.9% |
| $15,000 to $24,999 | 93 | 5.6% |
| $25,000 to $34,999 | 101 | 6.1% |
| $35,000 to $49,999 | 109 | 6.6% |
| $50,000 to $74,999 | 242 | 14.6% |
| $75,000 to $99,999 | 257 | 15.5% |
| $100,000 to $149,999 | 290 | 17.5% |
| $150,000 to $199,999 | 185 | 11.2% |
| $200,000+ | 275 | 16.6% |
Household Income by Householder Age in Elverta
The median household income in Elverta is $89,745, with the highest median household income of $108,438 found in the 25 to 44 years age bracket for the primary householder. A total of 334 households (20.2%) fall into this category. Meanwhile, the 15 to 24 years age bracket for the primary householder has the lowest median household income of $0, with 6 households (0.4%) in this group.
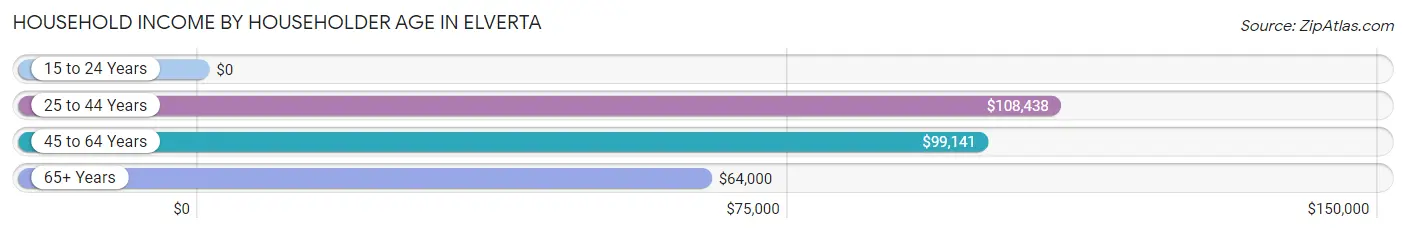
| Income Bracket | # Households | Median Income |
| 15 to 24 Years | 6 (0.4%) | $0 |
| 25 to 44 Years | 334 (20.2%) | $108,438 |
| 45 to 64 Years | 883 (53.3%) | $99,141 |
| 65+ Years | 432 (26.1%) | $64,000 |
| Total | 1,655 (100.0%) | $89,745 |
Poverty in Elverta
Income Below Poverty by Sex and Age in Elverta
With 8.4% poverty level for males and 11.5% for females among the residents of Elverta, 16 and 17 year old males and 15 year old females are the most vulnerable to poverty, with 20 males (23.3%) and 23 females (100.0%) in their respective age groups living below the poverty level.
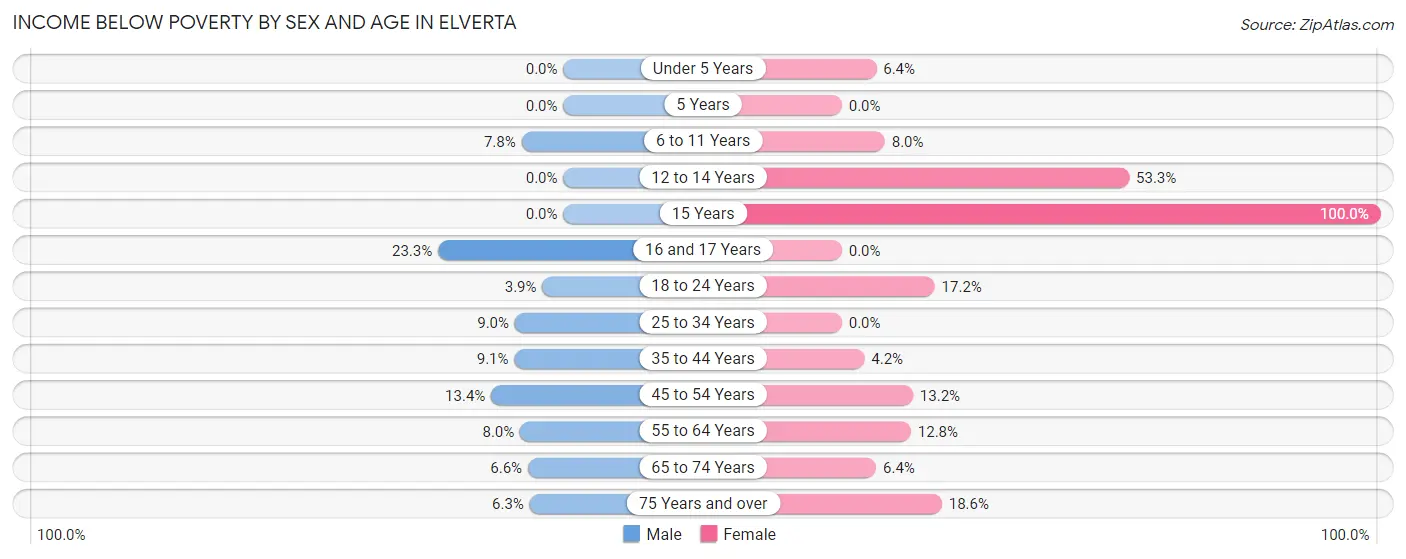
| Age Bracket | Male | Female |
| Under 5 Years | 0 (0.0%) | 8 (6.4%) |
| 5 Years | 0 (0.0%) | 0 (0.0%) |
| 6 to 11 Years | 17 (7.8%) | 13 (8.0%) |
| 12 to 14 Years | 0 (0.0%) | 40 (53.3%) |
| 15 Years | 0 (0.0%) | 23 (100.0%) |
| 16 and 17 Years | 20 (23.3%) | 0 (0.0%) |
| 18 to 24 Years | 11 (3.9%) | 35 (17.2%) |
| 25 to 34 Years | 19 (9.0%) | 0 (0.0%) |
| 35 to 44 Years | 31 (9.1%) | 12 (4.2%) |
| 45 to 54 Years | 54 (13.4%) | 33 (13.2%) |
| 55 to 64 Years | 42 (8.0%) | 74 (12.8%) |
| 65 to 74 Years | 13 (6.6%) | 16 (6.4%) |
| 75 Years and over | 9 (6.2%) | 36 (18.6%) |
| Total | 216 (8.4%) | 290 (11.5%) |
Income Above Poverty by Sex and Age in Elverta
According to the poverty statistics in Elverta, males aged under 5 years and females aged 5 years are the age groups that are most secure financially, with 100.0% of males and 100.0% of females in these age groups living above the poverty line.
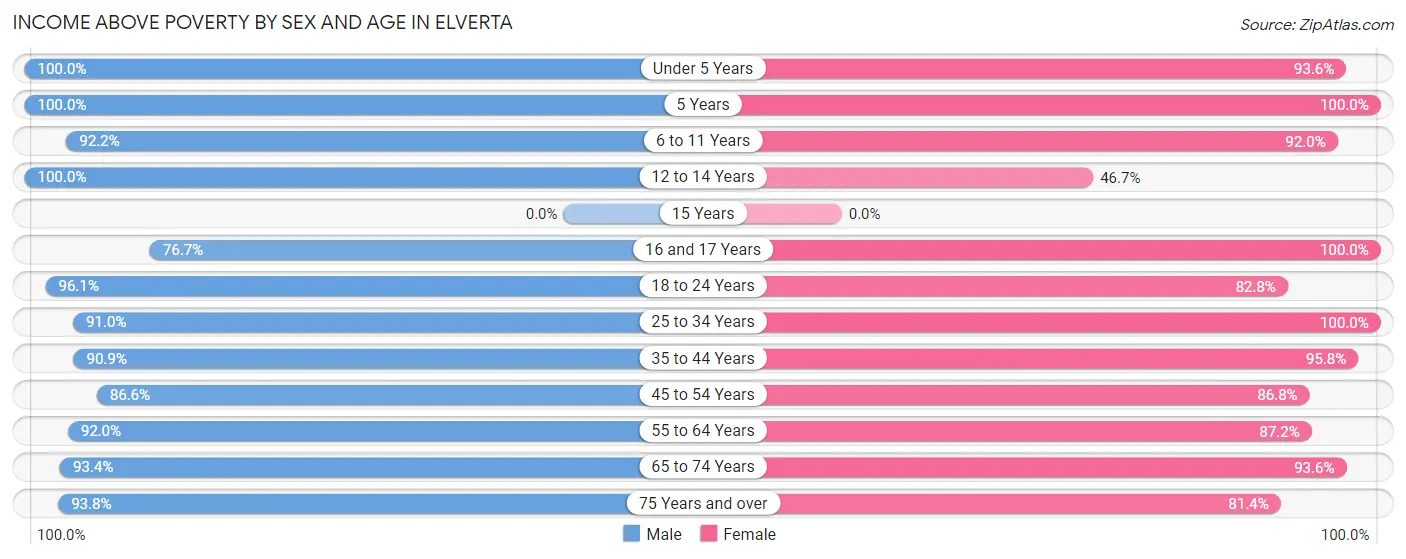
| Age Bracket | Male | Female |
| Under 5 Years | 82 (100.0%) | 117 (93.6%) |
| 5 Years | 4 (100.0%) | 10 (100.0%) |
| 6 to 11 Years | 202 (92.2%) | 150 (92.0%) |
| 12 to 14 Years | 88 (100.0%) | 35 (46.7%) |
| 15 Years | 0 (0.0%) | 0 (0.0%) |
| 16 and 17 Years | 66 (76.7%) | 73 (100.0%) |
| 18 to 24 Years | 271 (96.1%) | 168 (82.8%) |
| 25 to 34 Years | 192 (91.0%) | 287 (100.0%) |
| 35 to 44 Years | 310 (90.9%) | 275 (95.8%) |
| 45 to 54 Years | 349 (86.6%) | 217 (86.8%) |
| 55 to 64 Years | 481 (92.0%) | 503 (87.2%) |
| 65 to 74 Years | 185 (93.4%) | 235 (93.6%) |
| 75 Years and over | 135 (93.8%) | 158 (81.4%) |
| Total | 2,365 (91.6%) | 2,228 (88.5%) |
Income Below Poverty Among Married-Couple Families in Elverta
The poverty statistics for married-couple families in Elverta show that 5.0% or 49 of the total 980 families live below the poverty line. Families with 3 or 4 children have the highest poverty rate of 69.2%, comprising of 9 families. On the other hand, families with 5 or more children have the lowest poverty rate of 0.0%, which includes 0 families.
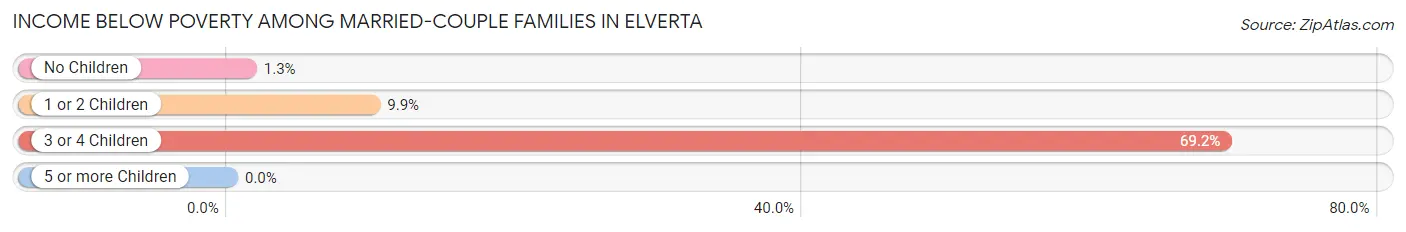
| Children | Above Poverty | Below Poverty |
| No Children | 602 (98.7%) | 8 (1.3%) |
| 1 or 2 Children | 291 (90.1%) | 32 (9.9%) |
| 3 or 4 Children | 4 (30.8%) | 9 (69.2%) |
| 5 or more Children | 34 (100.0%) | 0 (0.0%) |
| Total | 931 (95.0%) | 49 (5.0%) |
Income Below Poverty Among Single-Parent Households in Elverta
According to the poverty data in Elverta, 14.4% or 18 single-father households and 11.5% or 24 single-mother households are living below the poverty line. Among single-father households, those with no children have the highest poverty rate, with 18 households (25.7%) experiencing poverty. Likewise, among single-mother households, those with 3 or 4 children have the highest poverty rate, with 3 households (100.0%) falling below the poverty line.
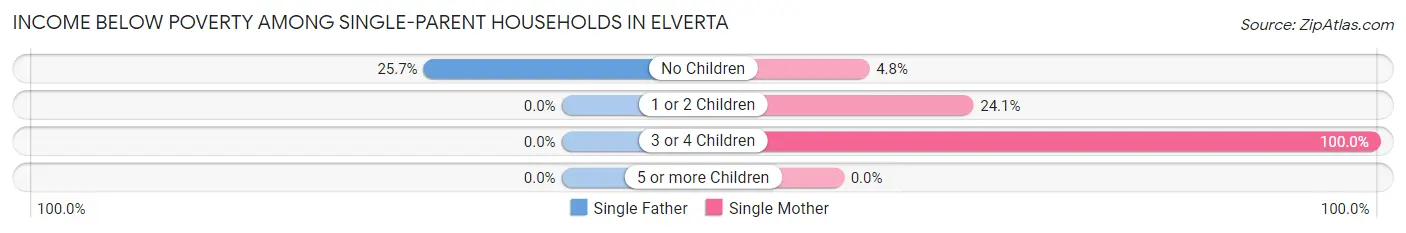
| Children | Single Father | Single Mother |
| No Children | 18 (25.7%) | 7 (4.8%) |
| 1 or 2 Children | 0 (0.0%) | 14 (24.1%) |
| 3 or 4 Children | 0 (0.0%) | 3 (100.0%) |
| 5 or more Children | 0 (0.0%) | 0 (0.0%) |
| Total | 18 (14.4%) | 24 (11.5%) |
Income Below Poverty Among Married-Couple vs Single-Parent Households in Elverta
The poverty data for Elverta shows that 49 of the married-couple family households (5.0%) and 42 of the single-parent households (12.6%) are living below the poverty level. Within the married-couple family households, those with 3 or 4 children have the highest poverty rate, with 9 households (69.2%) falling below the poverty line. Among the single-parent households, those with 3 or 4 children have the highest poverty rate, with 3 household (100.0%) living below poverty.
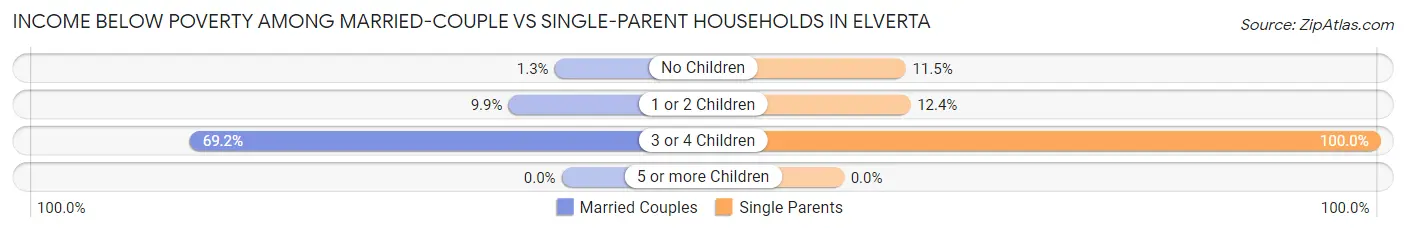
| Children | Married-Couple Families | Single-Parent Households |
| No Children | 8 (1.3%) | 25 (11.5%) |
| 1 or 2 Children | 32 (9.9%) | 14 (12.4%) |
| 3 or 4 Children | 9 (69.2%) | 3 (100.0%) |
| 5 or more Children | 0 (0.0%) | 0 (0.0%) |
| Total | 49 (5.0%) | 42 (12.6%) |
Race in Elverta
The most populous races in Elverta are White / Caucasian (3,819 | 74.9%), Hispanic or Latino (1,005 | 19.7%), and Some other Race (371 | 7.3%).
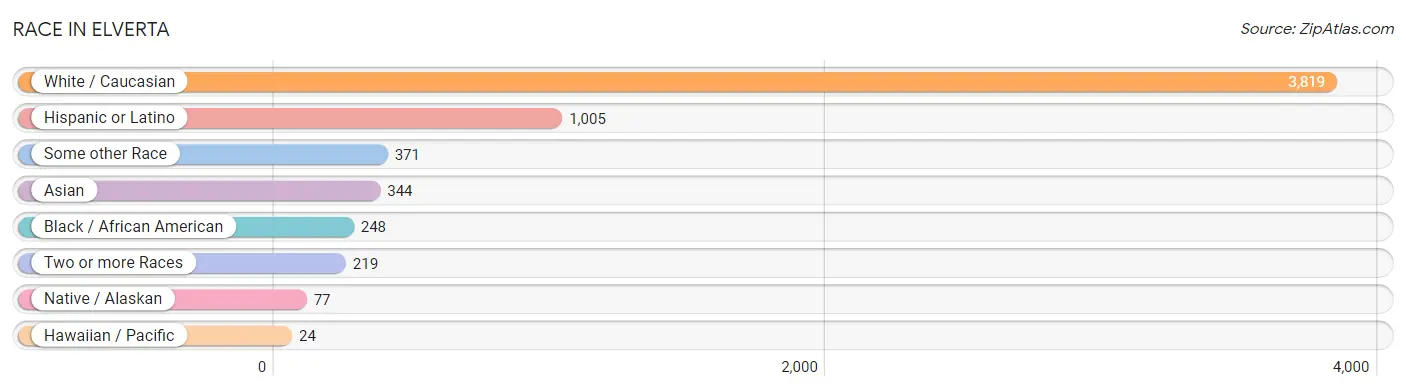
| Race | # Population | % Population |
| Asian | 344 | 6.7% |
| Black / African American | 248 | 4.9% |
| Hawaiian / Pacific | 24 | 0.5% |
| Hispanic or Latino | 1,005 | 19.7% |
| Native / Alaskan | 77 | 1.5% |
| White / Caucasian | 3,819 | 74.9% |
| Two or more Races | 219 | 4.3% |
| Some other Race | 371 | 7.3% |
| Total | 5,102 | 100.0% |
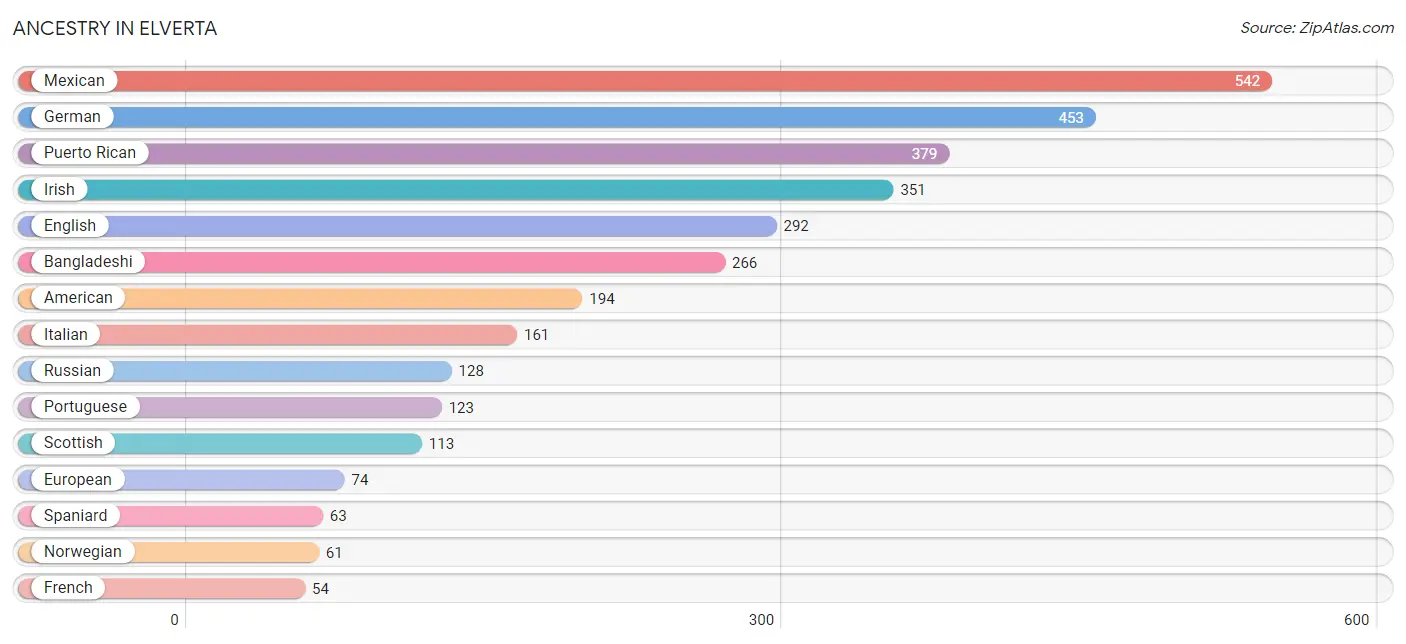
Ancestry in Elverta
The most populous ancestries reported in Elverta are Mexican (542 | 10.6%), German (453 | 8.9%), Puerto Rican (379 | 7.4%), Irish (351 | 6.9%), and English (292 | 5.7%), together accounting for 39.5% of all Elverta residents.
| Ancestry | # Population | % Population |
| American | 194 | 3.8% |
| Arab | 23 | 0.4% |
| Bangladeshi | 266 | 5.2% |
| Bhutanese | 20 | 0.4% |
| Canadian | 4 | 0.1% |
| Cherokee | 20 | 0.4% |
| Chickasaw | 9 | 0.2% |
| Choctaw | 36 | 0.7% |
| Czech | 4 | 0.1% |
| Danish | 6 | 0.1% |
| Dutch | 49 | 1.0% |
| Dutch West Indian | 3 | 0.1% |
| Eastern European | 2 | 0.0% |
| English | 292 | 5.7% |
| European | 74 | 1.5% |
| Filipino | 11 | 0.2% |
| French | 54 | 1.1% |
| German | 453 | 8.9% |
| Indian (Asian) | 6 | 0.1% |
| Irish | 351 | 6.9% |
| Italian | 161 | 3.2% |
| Korean | 43 | 0.8% |
| Lebanese | 7 | 0.1% |
| Mexican | 542 | 10.6% |
| Moroccan | 16 | 0.3% |
| Navajo | 26 | 0.5% |
| Nepalese | 17 | 0.3% |
| Northern European | 2 | 0.0% |
| Norwegian | 61 | 1.2% |
| Pennsylvania German | 5 | 0.1% |
| Peruvian | 9 | 0.2% |
| Polish | 33 | 0.6% |
| Portuguese | 123 | 2.4% |
| Puerto Rican | 379 | 7.4% |
| Romanian | 46 | 0.9% |
| Russian | 128 | 2.5% |
| Scotch-Irish | 40 | 0.8% |
| Scottish | 113 | 2.2% |
| South American | 9 | 0.2% |
| Spaniard | 63 | 1.2% |
| Spanish | 1 | 0.0% |
| Sri Lankan | 11 | 0.2% |
| Swedish | 10 | 0.2% |
| Swiss | 7 | 0.1% |
| Thai | 15 | 0.3% |
| Tongan | 24 | 0.5% |
| Ukrainian | 42 | 0.8% |
| Welsh | 13 | 0.3% | View All 48 Rows |
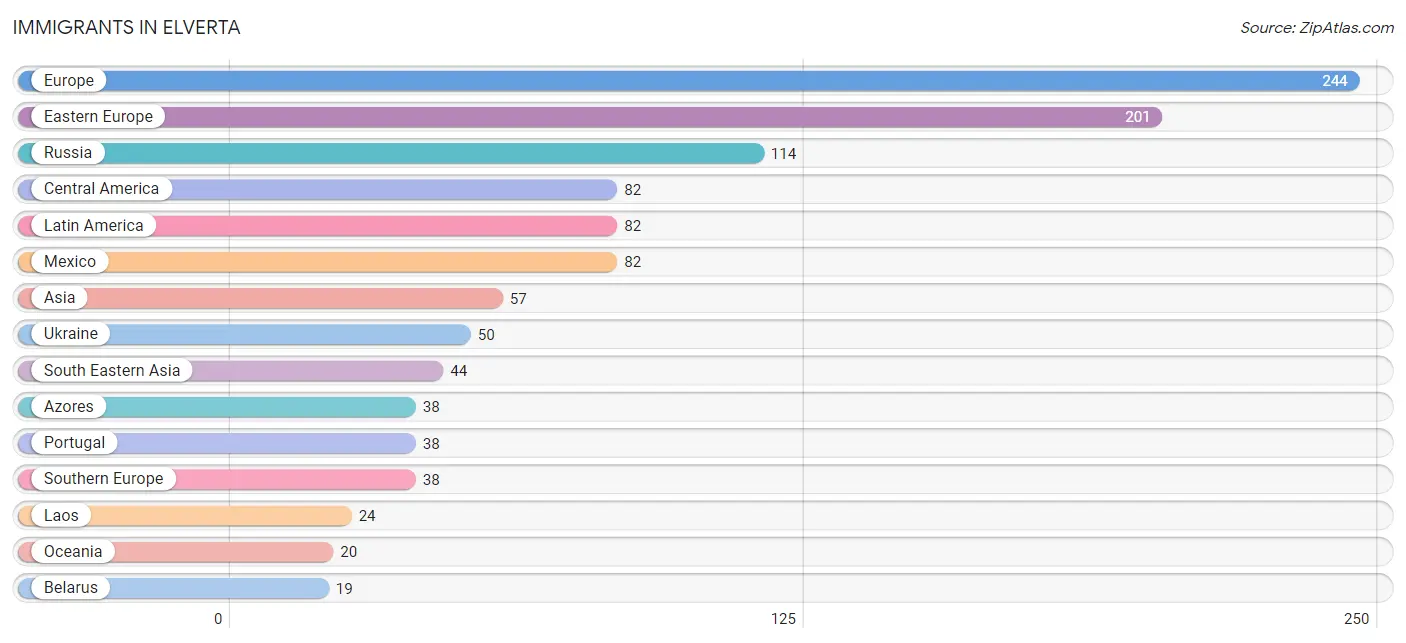
Immigrants in Elverta
The most numerous immigrant groups reported in Elverta came from Europe (244 | 4.8%), Eastern Europe (201 | 3.9%), Russia (114 | 2.2%), Central America (82 | 1.6%), and Latin America (82 | 1.6%), together accounting for 14.2% of all Elverta residents.
| Immigration Origin | # Population | % Population |
| Africa | 4 | 0.1% |
| Asia | 57 | 1.1% |
| Azores | 38 | 0.7% |
| Belarus | 19 | 0.4% |
| Central America | 82 | 1.6% |
| China | 13 | 0.3% |
| Eastern Asia | 13 | 0.3% |
| Eastern Europe | 201 | 3.9% |
| Europe | 244 | 4.8% |
| Germany | 5 | 0.1% |
| Laos | 24 | 0.5% |
| Latin America | 82 | 1.6% |
| Mexico | 82 | 1.6% |
| Moldova | 13 | 0.3% |
| Morocco | 4 | 0.1% |
| Northern Africa | 4 | 0.1% |
| Oceania | 20 | 0.4% |
| Philippines | 12 | 0.2% |
| Poland | 5 | 0.1% |
| Portugal | 38 | 0.7% |
| Russia | 114 | 2.2% |
| South Eastern Asia | 44 | 0.9% |
| Southern Europe | 38 | 0.7% |
| Taiwan | 7 | 0.1% |
| Thailand | 8 | 0.2% |
| Ukraine | 50 | 1.0% |
| Western Europe | 5 | 0.1% | View All 27 Rows |
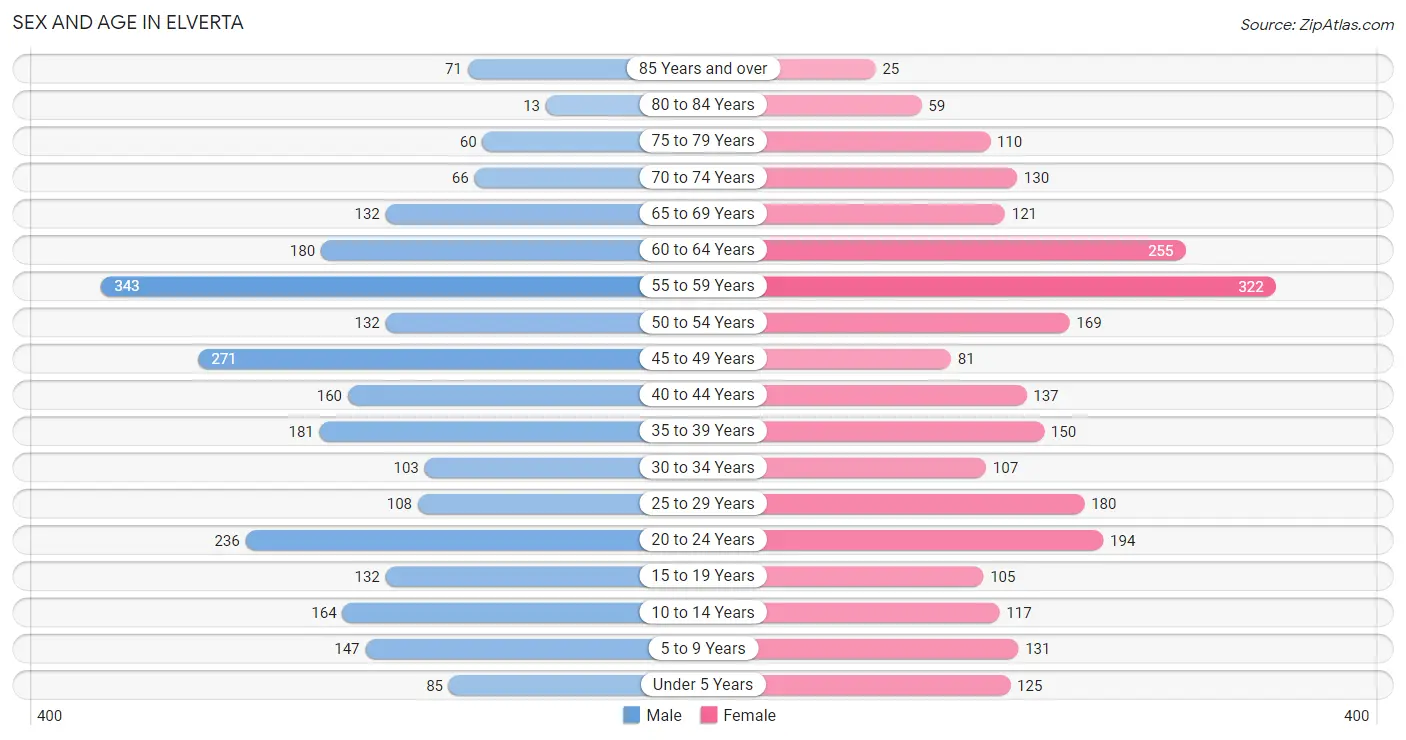
Sex and Age in Elverta
Sex and Age in Elverta
The most populous age groups in Elverta are 55 to 59 Years (343 | 13.3%) for men and 55 to 59 Years (322 | 12.8%) for women.
| Age Bracket | Male | Female |
| Under 5 Years | 85 (3.3%) | 125 (5.0%) |
| 5 to 9 Years | 147 (5.7%) | 131 (5.2%) |
| 10 to 14 Years | 164 (6.4%) | 117 (4.6%) |
| 15 to 19 Years | 132 (5.1%) | 105 (4.2%) |
| 20 to 24 Years | 236 (9.1%) | 194 (7.7%) |
| 25 to 29 Years | 108 (4.2%) | 180 (7.1%) |
| 30 to 34 Years | 103 (4.0%) | 107 (4.3%) |
| 35 to 39 Years | 181 (7.0%) | 150 (6.0%) |
| 40 to 44 Years | 160 (6.2%) | 137 (5.4%) |
| 45 to 49 Years | 271 (10.5%) | 81 (3.2%) |
| 50 to 54 Years | 132 (5.1%) | 169 (6.7%) |
| 55 to 59 Years | 343 (13.3%) | 322 (12.8%) |
| 60 to 64 Years | 180 (7.0%) | 255 (10.1%) |
| 65 to 69 Years | 132 (5.1%) | 121 (4.8%) |
| 70 to 74 Years | 66 (2.5%) | 130 (5.2%) |
| 75 to 79 Years | 60 (2.3%) | 110 (4.4%) |
| 80 to 84 Years | 13 (0.5%) | 59 (2.3%) |
| 85 Years and over | 71 (2.8%) | 25 (1.0%) |
| Total | 2,584 (100.0%) | 2,518 (100.0%) |
Families and Households in Elverta
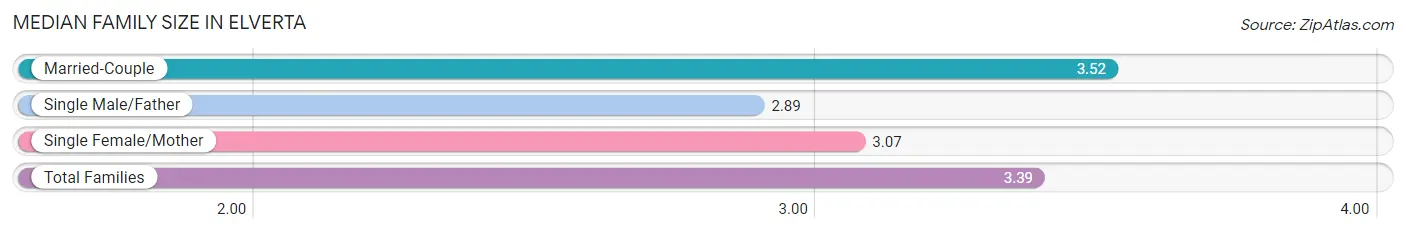
Median Family Size in Elverta
The median family size in Elverta is 3.39 persons per family, with married-couple families (980 | 74.6%) accounting for the largest median family size of 3.52 persons per family. On the other hand, single male/father families (125 | 9.5%) represent the smallest median family size with 2.89 persons per family.
| Family Type | # Families | Family Size |
| Married-Couple | 980 (74.6%) | 3.52 |
| Single Male/Father | 125 (9.5%) | 2.89 |
| Single Female/Mother | 208 (15.8%) | 3.07 |
| Total Families | 1,313 (100.0%) | 3.39 |
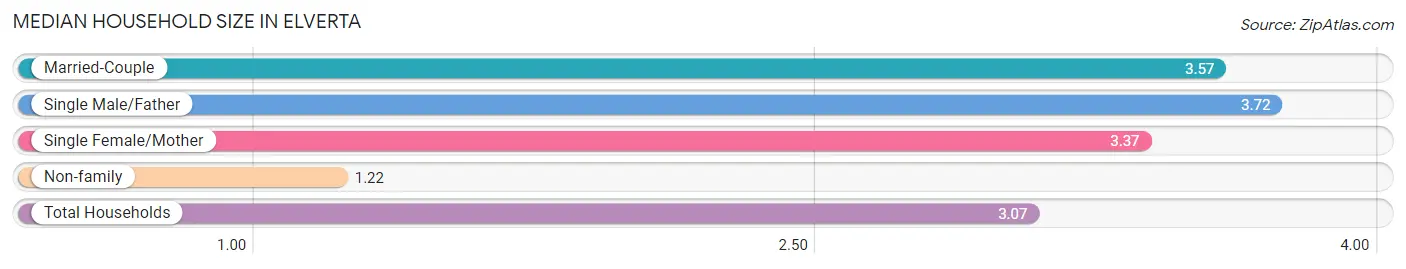
Median Household Size in Elverta
The median household size in Elverta is 3.07 persons per household, with single male/father households (125 | 7.5%) accounting for the largest median household size of 3.72 persons per household. non-family households (342 | 20.7%) represent the smallest median household size with 1.22 persons per household.
| Household Type | # Households | Household Size |
| Married-Couple | 980 (59.2%) | 3.57 |
| Single Male/Father | 125 (7.5%) | 3.72 |
| Single Female/Mother | 208 (12.6%) | 3.37 |
| Non-family | 342 (20.7%) | 1.22 |
| Total Households | 1,655 (100.0%) | 3.07 |
Household Size by Marriage Status in Elverta
Out of a total of 1,655 households in Elverta, 1,313 (79.3%) are family households, while 342 (20.7%) are nonfamily households. The most numerous type of family households are 2-person households, comprising 494, and the most common type of nonfamily households are 1-person households, comprising 266.
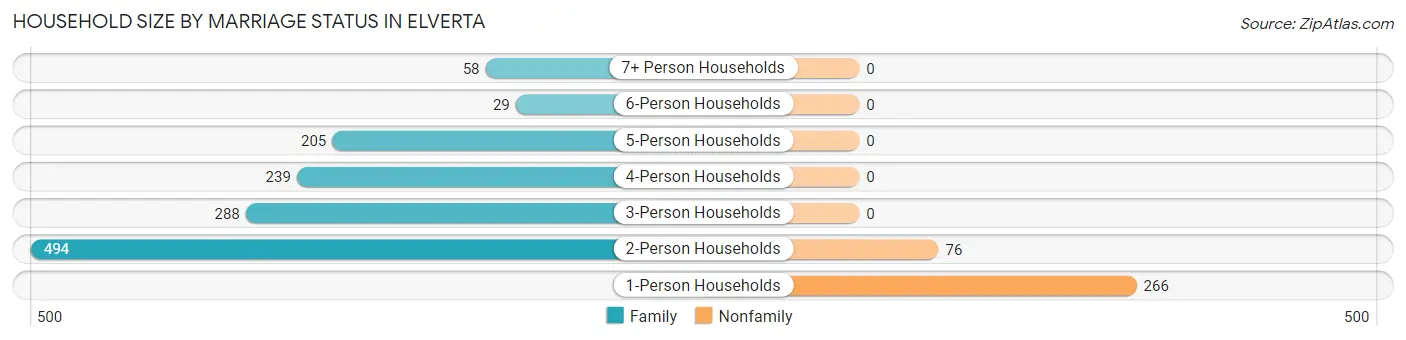
| Household Size | Family Households | Nonfamily Households |
| 1-Person Households | - | 266 (16.1%) |
| 2-Person Households | 494 (29.8%) | 76 (4.6%) |
| 3-Person Households | 288 (17.4%) | 0 (0.0%) |
| 4-Person Households | 239 (14.4%) | 0 (0.0%) |
| 5-Person Households | 205 (12.4%) | 0 (0.0%) |
| 6-Person Households | 29 (1.8%) | 0 (0.0%) |
| 7+ Person Households | 58 (3.5%) | 0 (0.0%) |
| Total | 1,313 (79.3%) | 342 (20.7%) |
Female Fertility in Elverta
Fertility by Age in Elverta
Average fertility rate in Elverta is 45.0 births per 1,000 women. Women in the age bracket of 20 to 34 years have the highest fertility rate with 96.0 births per 1,000 women. Women in the age bracket of 20 to 34 years acount for 100.0% of all women with births.
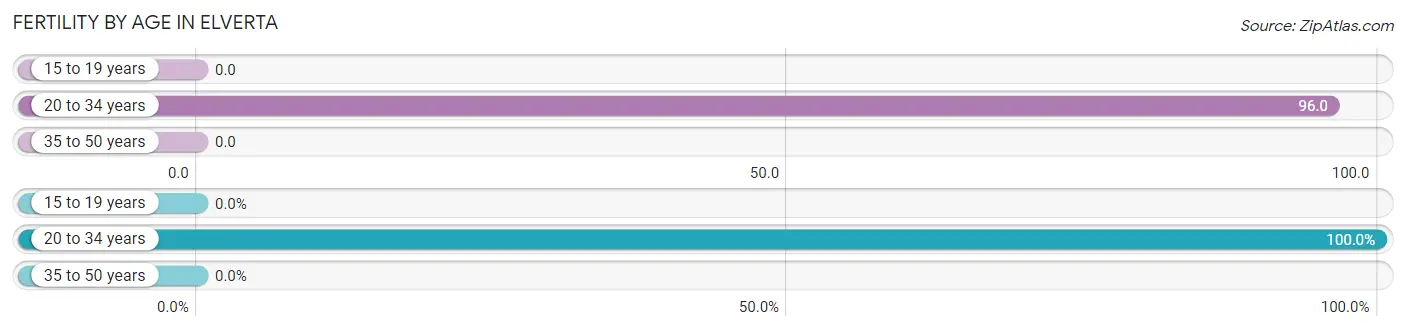
| Age Bracket | Women with Births | Births / 1,000 Women |
| 15 to 19 years | 0 (0.0%) | 0.0 |
| 20 to 34 years | 46 (100.0%) | 96.0 |
| 35 to 50 years | 0 (0.0%) | 0.0 |
| Total | 46 (100.0%) | 45.0 |
Fertility by Age by Marriage Status in Elverta
84.8% of women with births (46) in Elverta are married. The highest percentage of unmarried women with births falls into 20 to 34 years age bracket with 15.2% of them unmarried at the time of birth, while the lowest percentage of unmarried women with births belong to 20 to 34 years age bracket with 15.2% of them unmarried.
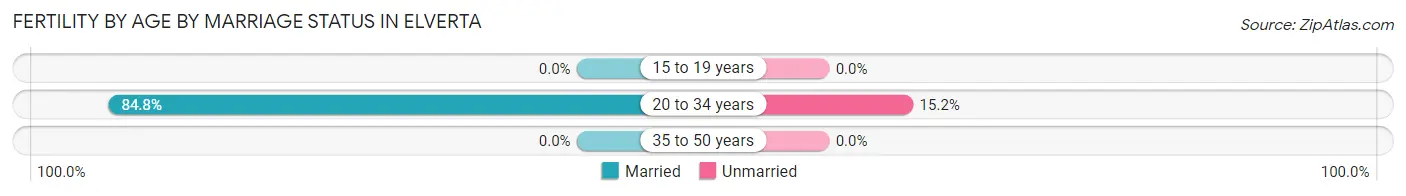
| Age Bracket | Married | Unmarried |
| 15 to 19 years | 0 (0.0%) | 0 (0.0%) |
| 20 to 34 years | 39 (84.8%) | 7 (15.2%) |
| 35 to 50 years | 0 (0.0%) | 0 (0.0%) |
| Total | 39 (84.8%) | 7 (15.2%) |
Fertility by Education in Elverta
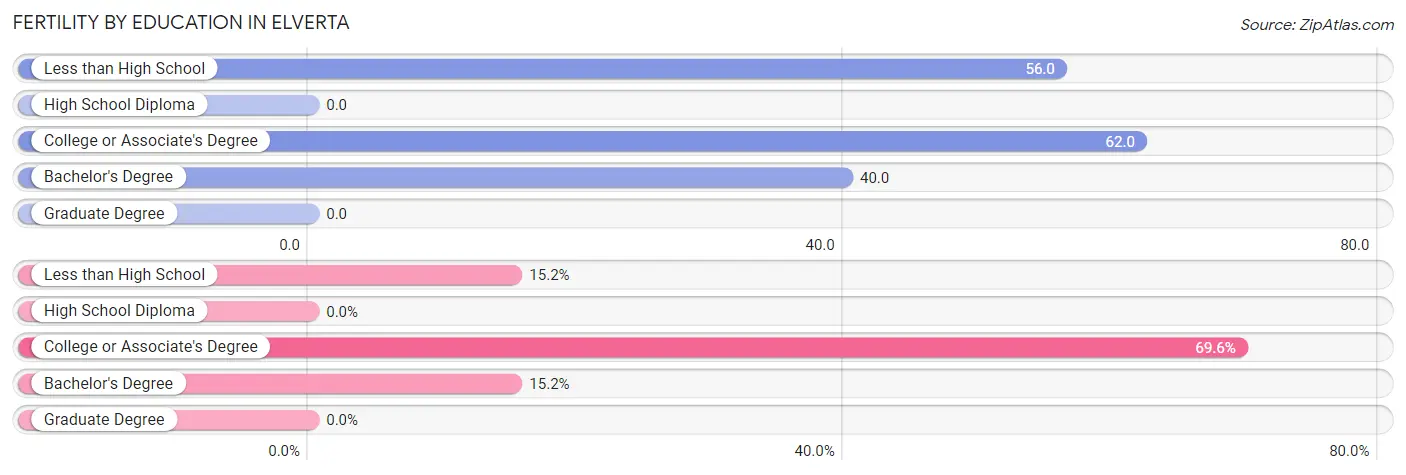
| Educational Attainment | Women with Births | Births / 1,000 Women |
| Less than High School | 7 (15.2%) | 56.0 |
| High School Diploma | 0 (0.0%) | 0.0 |
| College or Associate's Degree | 32 (69.6%) | 62.0 |
| Bachelor's Degree | 7 (15.2%) | 40.0 |
| Graduate Degree | 0 (0.0%) | 0.0 |
| Total | 46 (100.0%) | 45.0 |
Fertility by Education by Marriage Status in Elverta
15.2% of women with births in Elverta are unmarried. Women with the educational attainment of college or associate's degree are most likely to be married with 100.0% of them married at childbirth, while women with the educational attainment of less than high school are least likely to be married with 100.0% of them unmarried at childbirth.
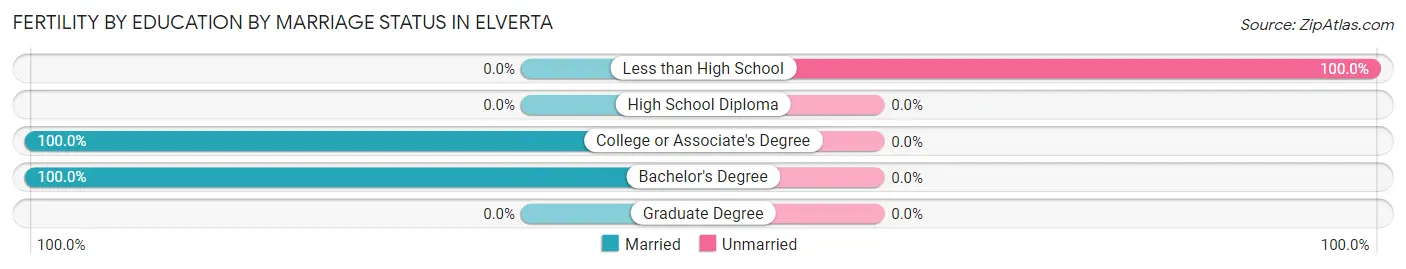
| Educational Attainment | Married | Unmarried |
| Less than High School | 0 (0.0%) | 7 (100.0%) |
| High School Diploma | 0 (0.0%) | 0 (0.0%) |
| College or Associate's Degree | 32 (100.0%) | 0 (0.0%) |
| Bachelor's Degree | 7 (100.0%) | 0 (0.0%) |
| Graduate Degree | 0 (0.0%) | 0 (0.0%) |
| Total | 39 (84.8%) | 7 (15.2%) |
Employment Characteristics in Elverta
Employment by Class of Employer in Elverta
Among the 2,473 employed individuals in Elverta, private company employees (1,795 | 72.6%), state government employees (215 | 8.7%), and not-for-profit organizations (162 | 6.6%) make up the most common classes of employment.
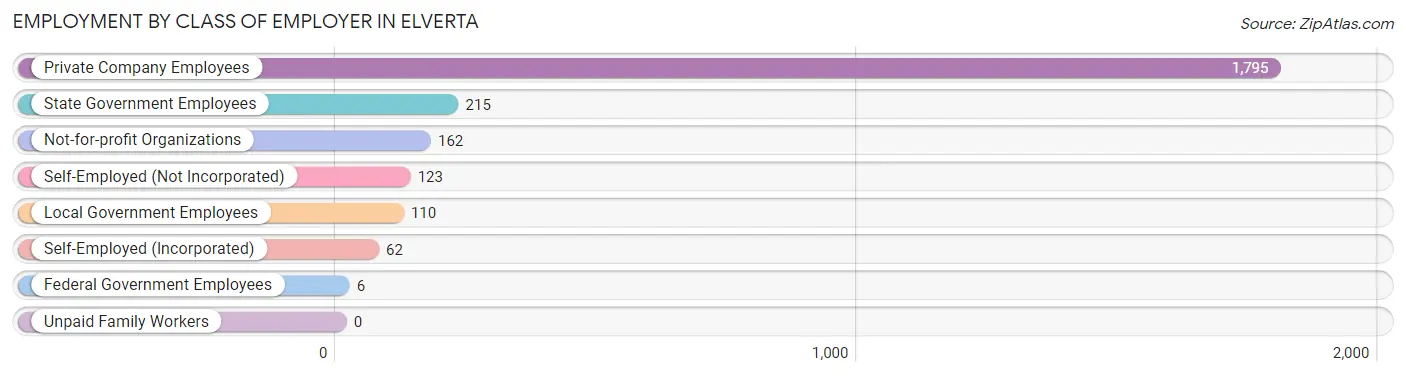
| Employer Class | # Employees | % Employees |
| Private Company Employees | 1,795 | 72.6% |
| Self-Employed (Incorporated) | 62 | 2.5% |
| Self-Employed (Not Incorporated) | 123 | 5.0% |
| Not-for-profit Organizations | 162 | 6.6% |
| Local Government Employees | 110 | 4.4% |
| State Government Employees | 215 | 8.7% |
| Federal Government Employees | 6 | 0.2% |
| Unpaid Family Workers | 0 | 0.0% |
| Total | 2,473 | 100.0% |
Employment Status by Age in Elverta
According to the labor force statistics for Elverta, out of the total population over 16 years of age (4,310), 60.4% or 2,603 individuals are in the labor force, with 4.2% or 109 of them unemployed. The age group with the highest labor force participation rate is 30 to 34 years, with 88.1% or 185 individuals in the labor force. Within the labor force, the 30 to 34 years age range has the highest percentage of unemployed individuals, with 9.7% or 18 of them being unemployed.
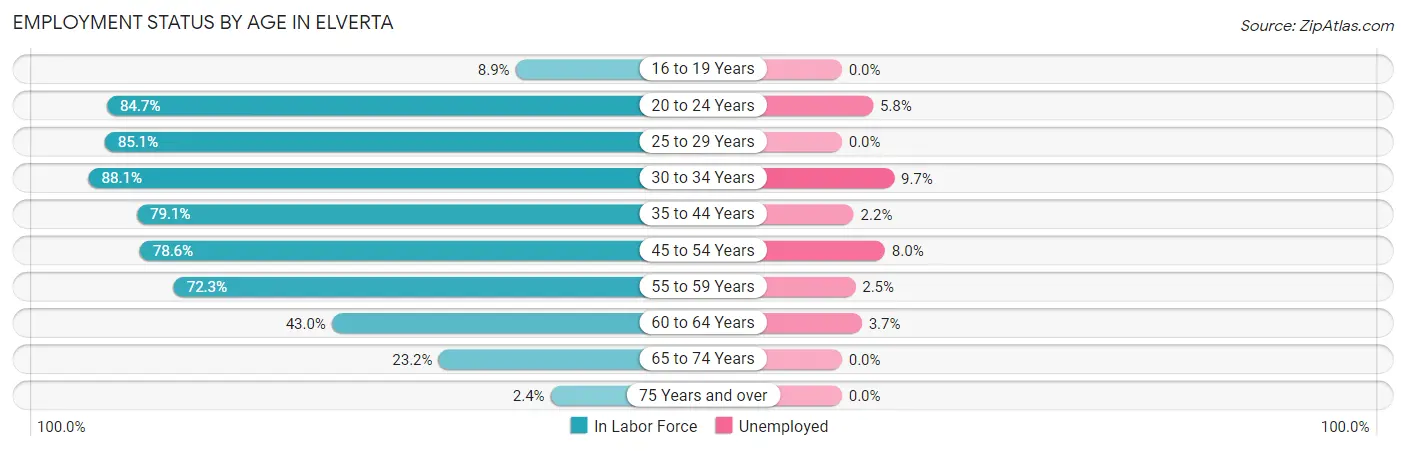
| Age Bracket | In Labor Force | Unemployed |
| 16 to 19 Years | 19 (8.9%) | 0 (0.0%) |
| 20 to 24 Years | 364 (84.7%) | 21 (5.8%) |
| 25 to 29 Years | 245 (85.1%) | 0 (0.0%) |
| 30 to 34 Years | 185 (88.1%) | 18 (9.7%) |
| 35 to 44 Years | 497 (79.1%) | 11 (2.2%) |
| 45 to 54 Years | 513 (78.6%) | 41 (8.0%) |
| 55 to 59 Years | 481 (72.3%) | 12 (2.5%) |
| 60 to 64 Years | 187 (43.0%) | 7 (3.7%) |
| 65 to 74 Years | 104 (23.2%) | 0 (0.0%) |
| 75 Years and over | 8 (2.4%) | 0 (0.0%) |
| Total | 2,603 (60.4%) | 109 (4.2%) |
Employment Status by Educational Attainment in Elverta
According to labor force statistics for Elverta, 73.2% of individuals (2,107) out of the total population between 25 and 64 years of age (2,879) are in the labor force, with 4.2% or 88 of them being unemployed. The group with the highest labor force participation rate are those with the educational attainment of bachelor's degree or higher, with 84.5% or 284 individuals in the labor force. Within the labor force, individuals with less than high school education have the highest percentage of unemployment, with 12.1% or 11 of them being unemployed.
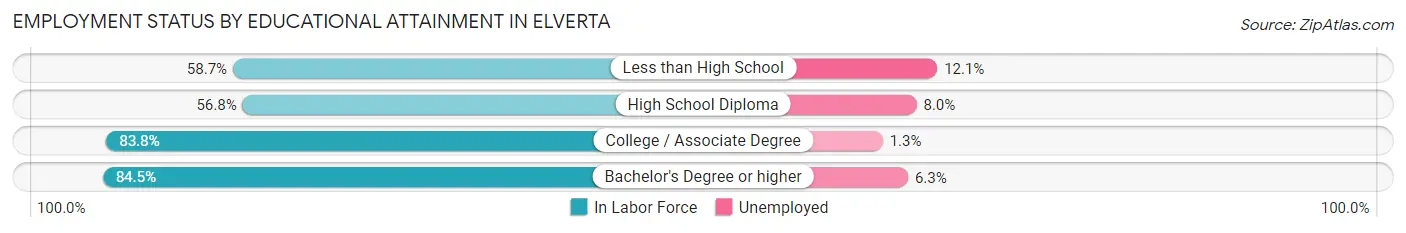
| Educational Attainment | In Labor Force | Unemployed |
| Less than High School | 91 (58.7%) | 19 (12.1%) |
| High School Diploma | 565 (56.8%) | 80 (8.0%) |
| College / Associate Degree | 1,168 (83.8%) | 18 (1.3%) |
| Bachelor's Degree or higher | 284 (84.5%) | 21 (6.3%) |
| Total | 2,107 (73.2%) | 121 (4.2%) |
Employment Occupations by Sex in Elverta
Management, Business, Science and Arts Occupations
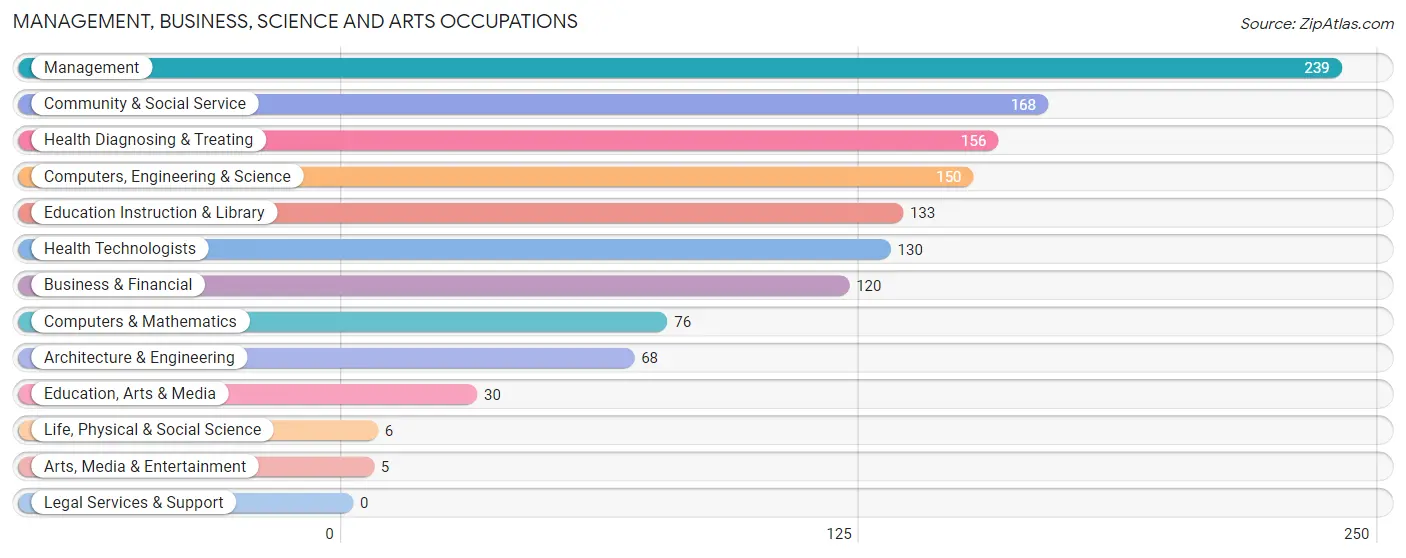
The most common Management, Business, Science and Arts occupations in Elverta are Management (239 | 9.6%), Community & Social Service (168 | 6.7%), Health Diagnosing & Treating (156 | 6.3%), Computers, Engineering & Science (150 | 6.0%), and Education Instruction & Library (133 | 5.3%).
Management, Business, Science and Arts Occupations by Sex
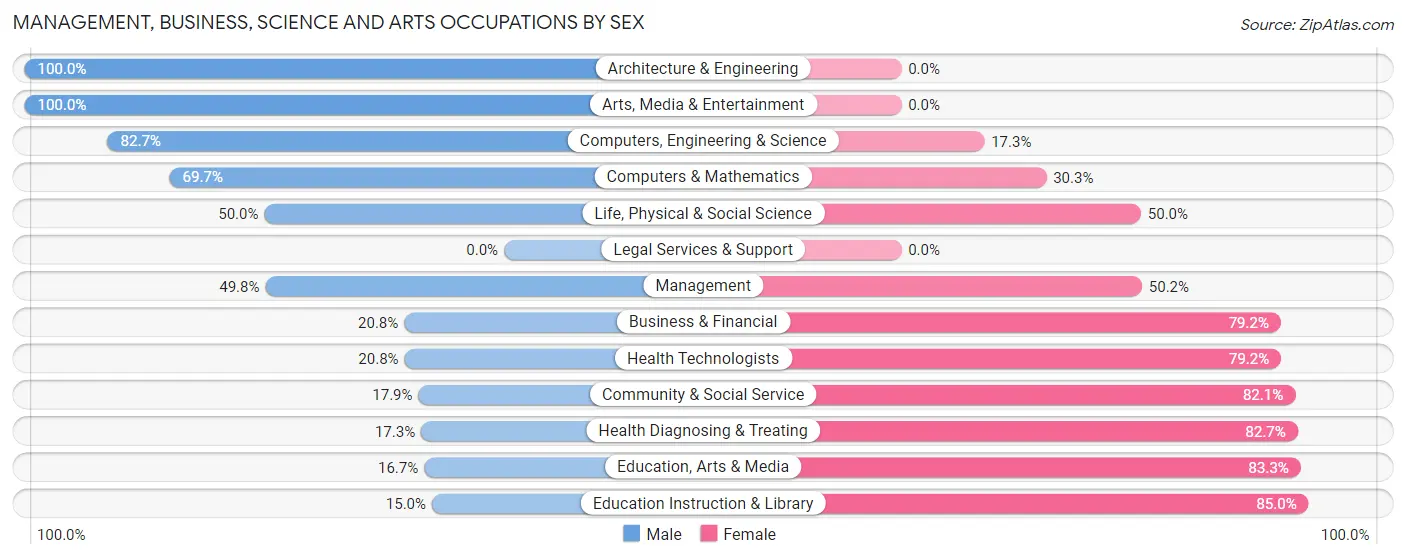
Within the Management, Business, Science and Arts occupations in Elverta, the most male-oriented occupations are Architecture & Engineering (100.0%), Arts, Media & Entertainment (100.0%), and Computers, Engineering & Science (82.7%), while the most female-oriented occupations are Education Instruction & Library (85.0%), Education, Arts & Media (83.3%), and Health Diagnosing & Treating (82.7%).
| Occupation | Male | Female |
| Management | 119 (49.8%) | 120 (50.2%) |
| Business & Financial | 25 (20.8%) | 95 (79.2%) |
| Computers, Engineering & Science | 124 (82.7%) | 26 (17.3%) |
| Computers & Mathematics | 53 (69.7%) | 23 (30.3%) |
| Architecture & Engineering | 68 (100.0%) | 0 (0.0%) |
| Life, Physical & Social Science | 3 (50.0%) | 3 (50.0%) |
| Community & Social Service | 30 (17.9%) | 138 (82.1%) |
| Education, Arts & Media | 5 (16.7%) | 25 (83.3%) |
| Legal Services & Support | 0 (0.0%) | 0 (0.0%) |
| Education Instruction & Library | 20 (15.0%) | 113 (85.0%) |
| Arts, Media & Entertainment | 5 (100.0%) | 0 (0.0%) |
| Health Diagnosing & Treating | 27 (17.3%) | 129 (82.7%) |
| Health Technologists | 27 (20.8%) | 103 (79.2%) |
| Total (Category) | 325 (39.0%) | 508 (61.0%) |
| Total (Overall) | 1,237 (49.6%) | 1,256 (50.4%) |
Services Occupations
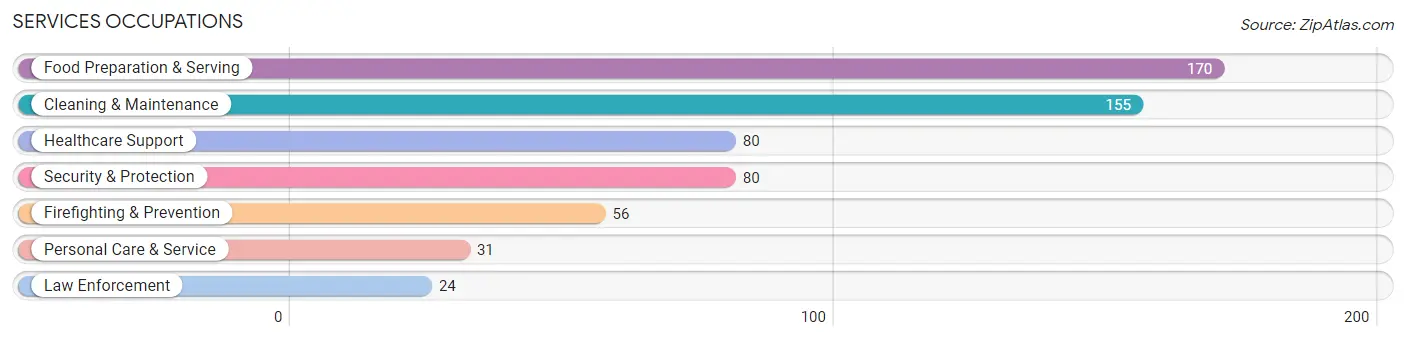
The most common Services occupations in Elverta are Food Preparation & Serving (170 | 6.8%), Cleaning & Maintenance (155 | 6.2%), Healthcare Support (80 | 3.2%), Security & Protection (80 | 3.2%), and Firefighting & Prevention (56 | 2.2%).
Services Occupations by Sex
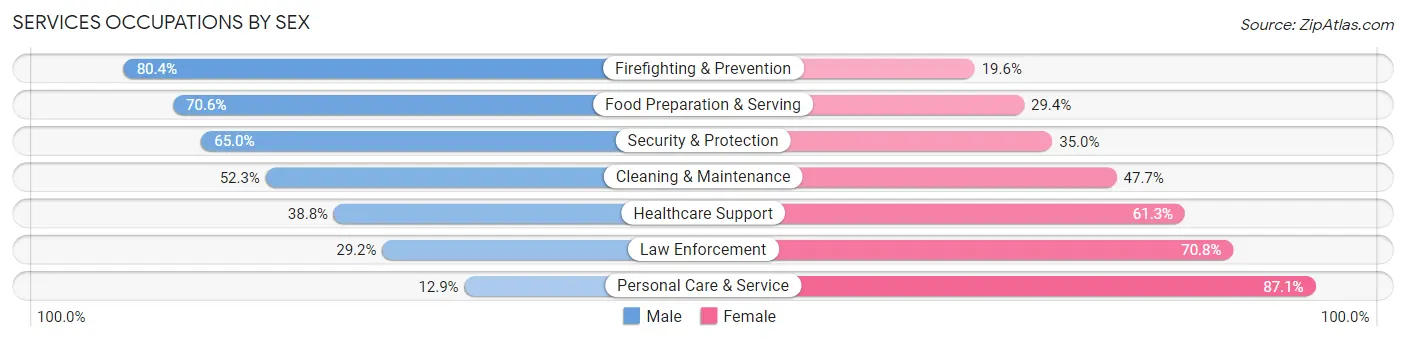
Within the Services occupations in Elverta, the most male-oriented occupations are Firefighting & Prevention (80.4%), Food Preparation & Serving (70.6%), and Security & Protection (65.0%), while the most female-oriented occupations are Personal Care & Service (87.1%), Law Enforcement (70.8%), and Healthcare Support (61.3%).
| Occupation | Male | Female |
| Healthcare Support | 31 (38.8%) | 49 (61.3%) |
| Security & Protection | 52 (65.0%) | 28 (35.0%) |
| Firefighting & Prevention | 45 (80.4%) | 11 (19.6%) |
| Law Enforcement | 7 (29.2%) | 17 (70.8%) |
| Food Preparation & Serving | 120 (70.6%) | 50 (29.4%) |
| Cleaning & Maintenance | 81 (52.3%) | 74 (47.7%) |
| Personal Care & Service | 4 (12.9%) | 27 (87.1%) |
| Total (Category) | 288 (55.8%) | 228 (44.2%) |
| Total (Overall) | 1,237 (49.6%) | 1,256 (50.4%) |
Sales and Office Occupations
The most common Sales and Office occupations in Elverta are Sales & Related (305 | 12.2%), and Office & Administration (304 | 12.2%).
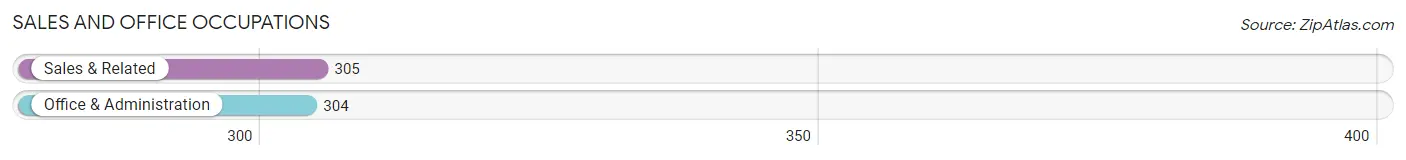
Sales and Office Occupations by Sex
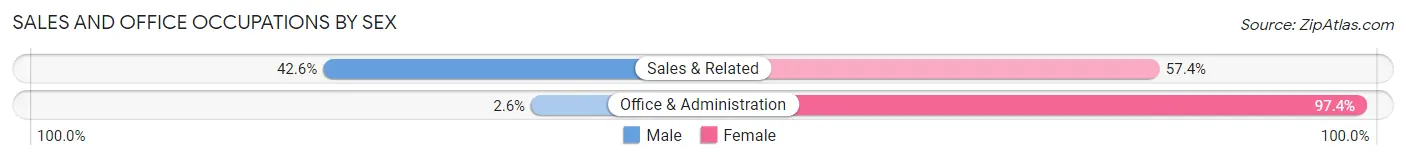
| Occupation | Male | Female |
| Sales & Related | 130 (42.6%) | 175 (57.4%) |
| Office & Administration | 8 (2.6%) | 296 (97.4%) |
| Total (Category) | 138 (22.7%) | 471 (77.3%) |
| Total (Overall) | 1,237 (49.6%) | 1,256 (50.4%) |
Natural Resources, Construction and Maintenance Occupations
The most common Natural Resources, Construction and Maintenance occupations in Elverta are Installation, Maintenance & Repair (154 | 6.2%), Construction & Extraction (107 | 4.3%), and Farming, Fishing & Forestry (19 | 0.8%).
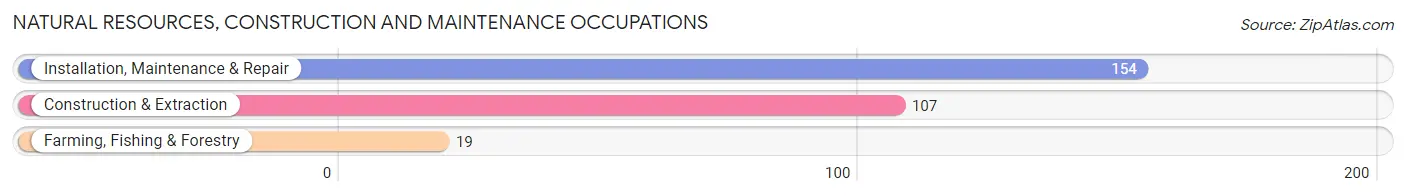
Natural Resources, Construction and Maintenance Occupations by Sex
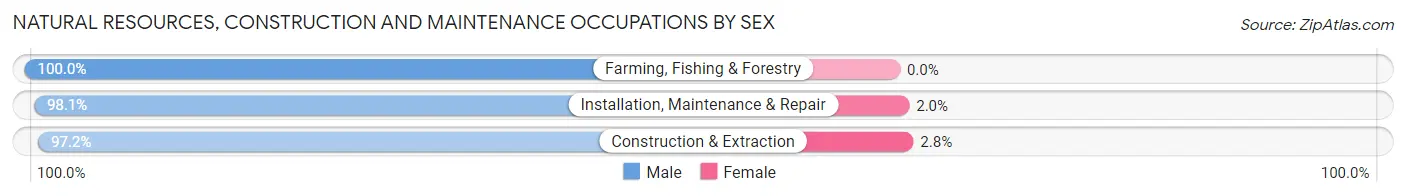
| Occupation | Male | Female |
| Farming, Fishing & Forestry | 19 (100.0%) | 0 (0.0%) |
| Construction & Extraction | 104 (97.2%) | 3 (2.8%) |
| Installation, Maintenance & Repair | 151 (98.1%) | 3 (1.9%) |
| Total (Category) | 274 (97.9%) | 6 (2.1%) |
| Total (Overall) | 1,237 (49.6%) | 1,256 (50.4%) |
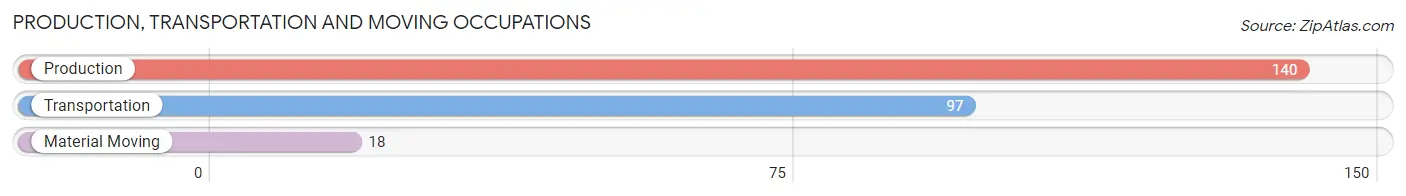
Production, Transportation and Moving Occupations
The most common Production, Transportation and Moving occupations in Elverta are Production (140 | 5.6%), Transportation (97 | 3.9%), and Material Moving (18 | 0.7%).
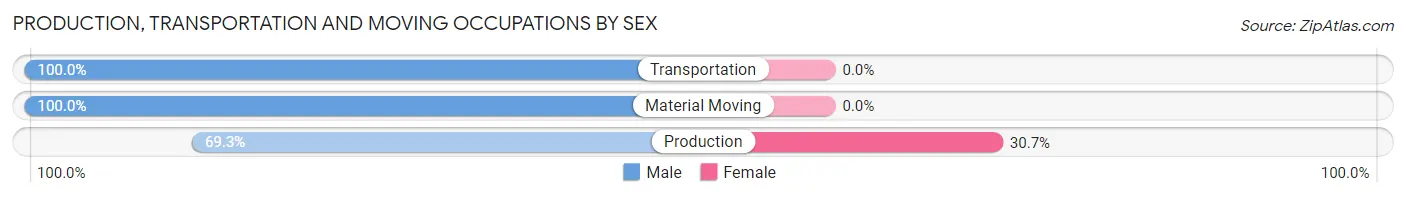
Production, Transportation and Moving Occupations by Sex
| Occupation | Male | Female |
| Production | 97 (69.3%) | 43 (30.7%) |
| Transportation | 97 (100.0%) | 0 (0.0%) |
| Material Moving | 18 (100.0%) | 0 (0.0%) |
| Total (Category) | 212 (83.1%) | 43 (16.9%) |
| Total (Overall) | 1,237 (49.6%) | 1,256 (50.4%) |
Employment Industries by Sex in Elverta
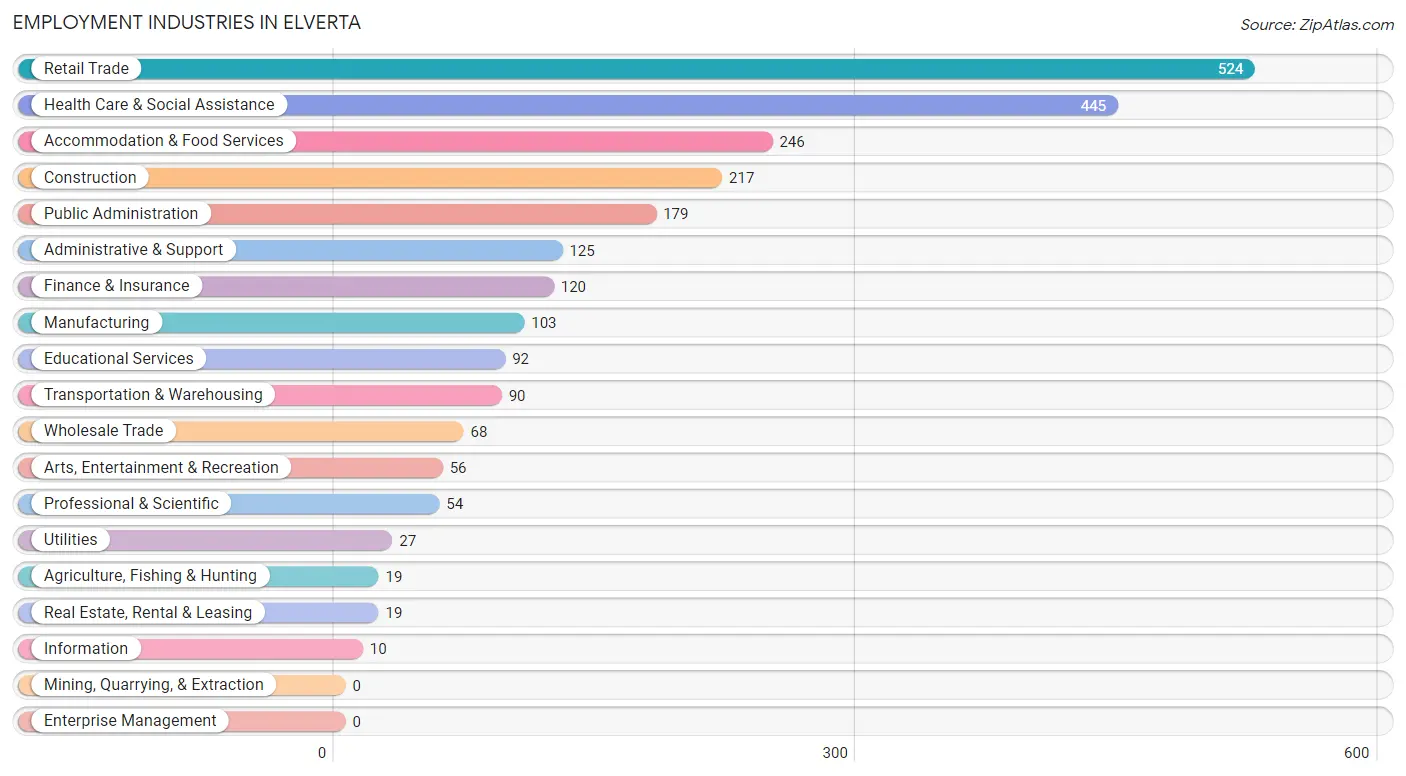
Employment Industries in Elverta
The major employment industries in Elverta include Retail Trade (524 | 21.0%), Health Care & Social Assistance (445 | 17.8%), Accommodation & Food Services (246 | 9.9%), Construction (217 | 8.7%), and Public Administration (179 | 7.2%).
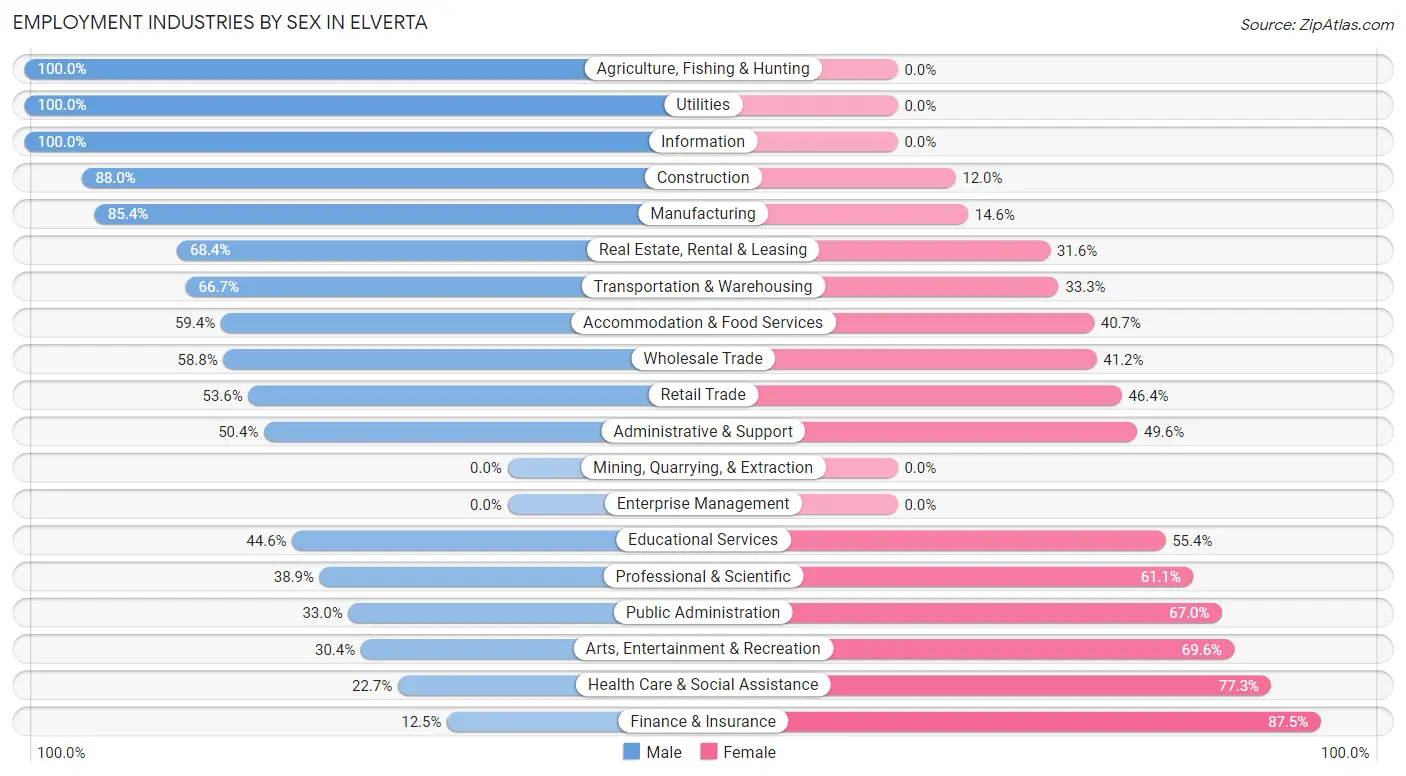
Employment Industries by Sex in Elverta
The Elverta industries that see more men than women are Agriculture, Fishing & Hunting (100.0%), Utilities (100.0%), and Information (100.0%), whereas the industries that tend to have a higher number of women are Finance & Insurance (87.5%), Health Care & Social Assistance (77.3%), and Arts, Entertainment & Recreation (69.6%).
| Industry | Male | Female |
| Agriculture, Fishing & Hunting | 19 (100.0%) | 0 (0.0%) |
| Mining, Quarrying, & Extraction | 0 (0.0%) | 0 (0.0%) |
| Construction | 191 (88.0%) | 26 (12.0%) |
| Manufacturing | 88 (85.4%) | 15 (14.6%) |
| Wholesale Trade | 40 (58.8%) | 28 (41.2%) |
| Retail Trade | 281 (53.6%) | 243 (46.4%) |
| Transportation & Warehousing | 60 (66.7%) | 30 (33.3%) |
| Utilities | 27 (100.0%) | 0 (0.0%) |
| Information | 10 (100.0%) | 0 (0.0%) |
| Finance & Insurance | 15 (12.5%) | 105 (87.5%) |
| Real Estate, Rental & Leasing | 13 (68.4%) | 6 (31.6%) |
| Professional & Scientific | 21 (38.9%) | 33 (61.1%) |
| Enterprise Management | 0 (0.0%) | 0 (0.0%) |
| Administrative & Support | 63 (50.4%) | 62 (49.6%) |
| Educational Services | 41 (44.6%) | 51 (55.4%) |
| Health Care & Social Assistance | 101 (22.7%) | 344 (77.3%) |
| Arts, Entertainment & Recreation | 17 (30.4%) | 39 (69.6%) |
| Accommodation & Food Services | 146 (59.4%) | 100 (40.6%) |
| Public Administration | 59 (33.0%) | 120 (67.0%) |
| Total | 1,237 (49.6%) | 1,256 (50.4%) |
Education in Elverta
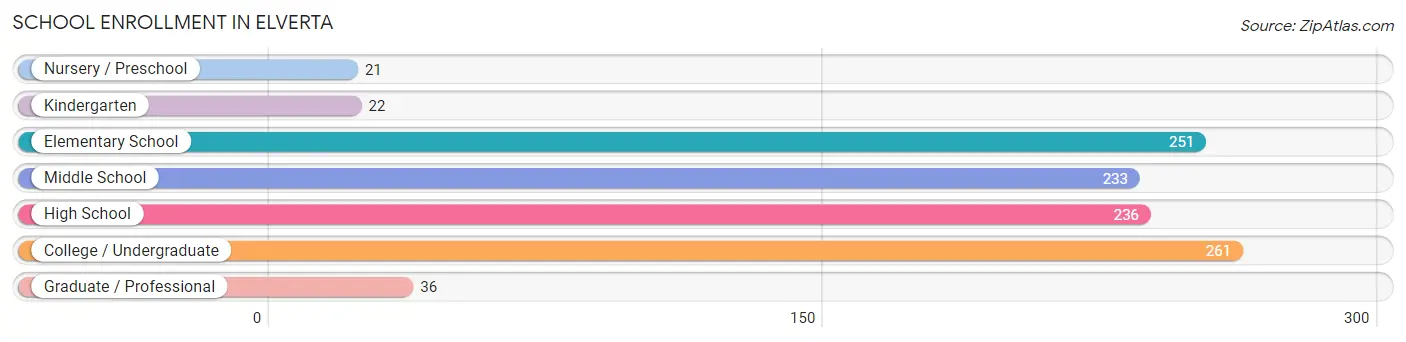
School Enrollment in Elverta
The most common levels of schooling among the 1,060 students in Elverta are college / undergraduate (261 | 24.6%), elementary school (251 | 23.7%), and high school (236 | 22.3%).
| School Level | # Students | % Students |
| Nursery / Preschool | 21 | 2.0% |
| Kindergarten | 22 | 2.1% |
| Elementary School | 251 | 23.7% |
| Middle School | 233 | 22.0% |
| High School | 236 | 22.3% |
| College / Undergraduate | 261 | 24.6% |
| Graduate / Professional | 36 | 3.4% |
| Total | 1,060 | 100.0% |
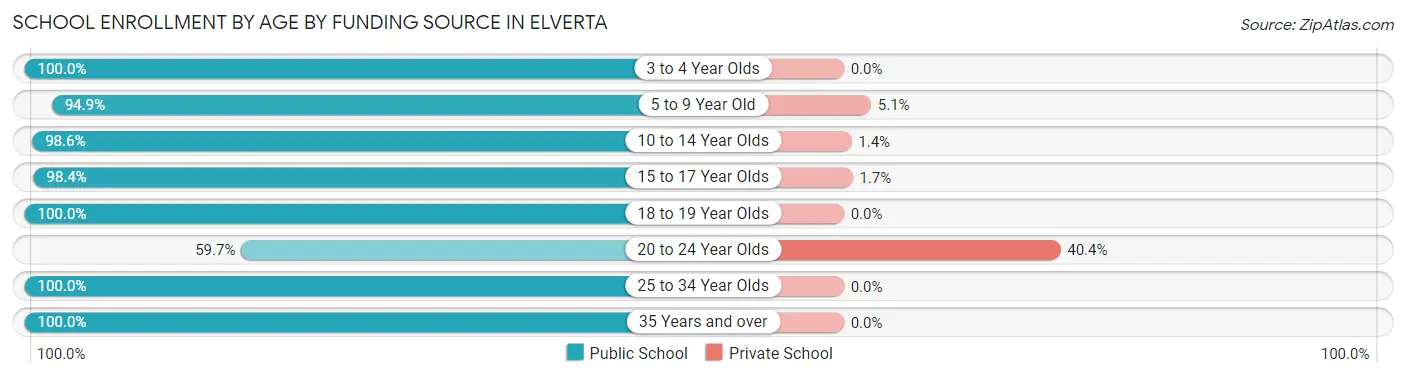
School Enrollment by Age by Funding Source in Elverta
Out of a total of 1,060 students who are enrolled in schools in Elverta, 89 (8.4%) attend a private institution, while the remaining 971 (91.6%) are enrolled in public schools. The age group of 20 to 24 year olds has the highest likelihood of being enrolled in private schools, with 69 (40.4% in the age bracket) enrolled. Conversely, the age group of 3 to 4 year olds has the lowest likelihood of being enrolled in a private school, with 21 (100.0% in the age bracket) attending a public institution.
| Age Bracket | Public School | Private School |
| 3 to 4 Year Olds | 21 (100.0%) | 0 (0.0%) |
| 5 to 9 Year Old | 244 (94.9%) | 13 (5.1%) |
| 10 to 14 Year Olds | 275 (98.6%) | 4 (1.4%) |
| 15 to 17 Year Olds | 179 (98.4%) | 3 (1.7%) |
| 18 to 19 Year Olds | 14 (100.0%) | 0 (0.0%) |
| 20 to 24 Year Olds | 102 (59.7%) | 69 (40.4%) |
| 25 to 34 Year Olds | 50 (100.0%) | 0 (0.0%) |
| 35 Years and over | 86 (100.0%) | 0 (0.0%) |
| Total | 971 (91.6%) | 89 (8.4%) |
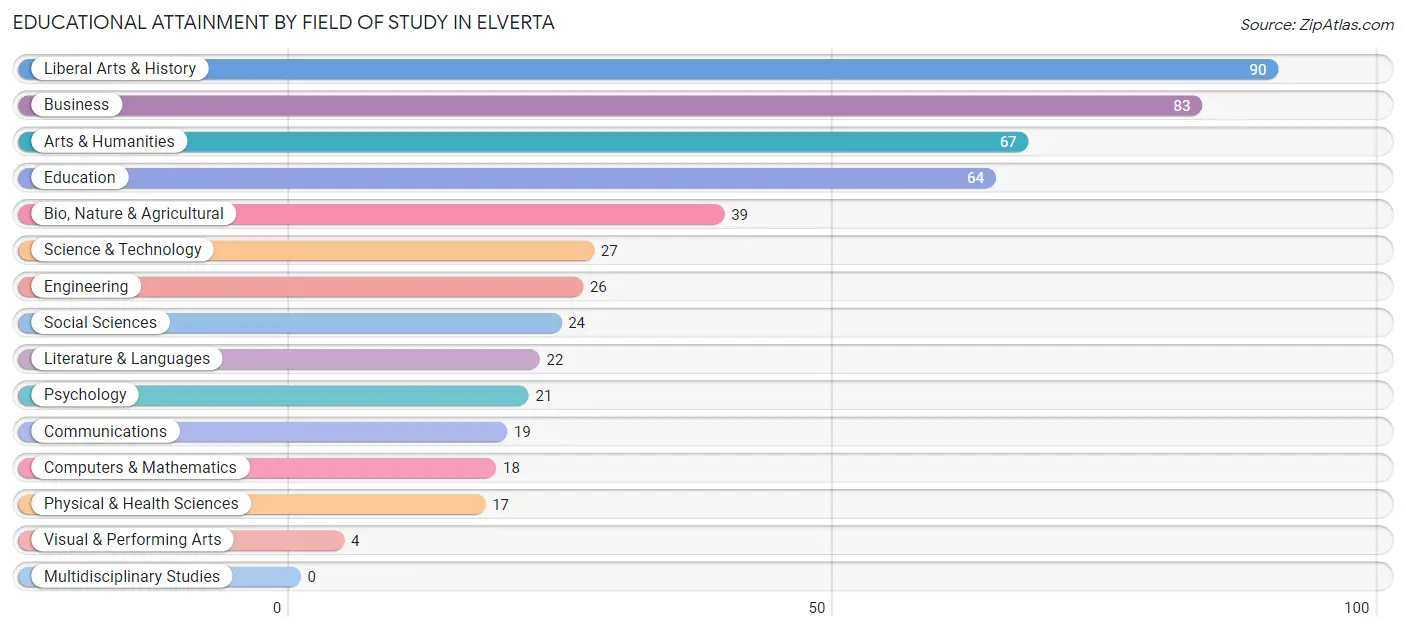
Educational Attainment by Field of Study in Elverta
Liberal arts & history (90 | 17.3%), business (83 | 15.9%), arts & humanities (67 | 12.9%), education (64 | 12.3%), and bio, nature & agricultural (39 | 7.5%) are the most common fields of study among 521 individuals in Elverta who have obtained a bachelor's degree or higher.
| Field of Study | # Graduates | % Graduates |
| Computers & Mathematics | 18 | 3.5% |
| Bio, Nature & Agricultural | 39 | 7.5% |
| Physical & Health Sciences | 17 | 3.3% |
| Psychology | 21 | 4.0% |
| Social Sciences | 24 | 4.6% |
| Engineering | 26 | 5.0% |
| Multidisciplinary Studies | 0 | 0.0% |
| Science & Technology | 27 | 5.2% |
| Business | 83 | 15.9% |
| Education | 64 | 12.3% |
| Literature & Languages | 22 | 4.2% |
| Liberal Arts & History | 90 | 17.3% |
| Visual & Performing Arts | 4 | 0.8% |
| Communications | 19 | 3.6% |
| Arts & Humanities | 67 | 12.9% |
| Total | 521 | 100.0% |
Transportation & Commute in Elverta
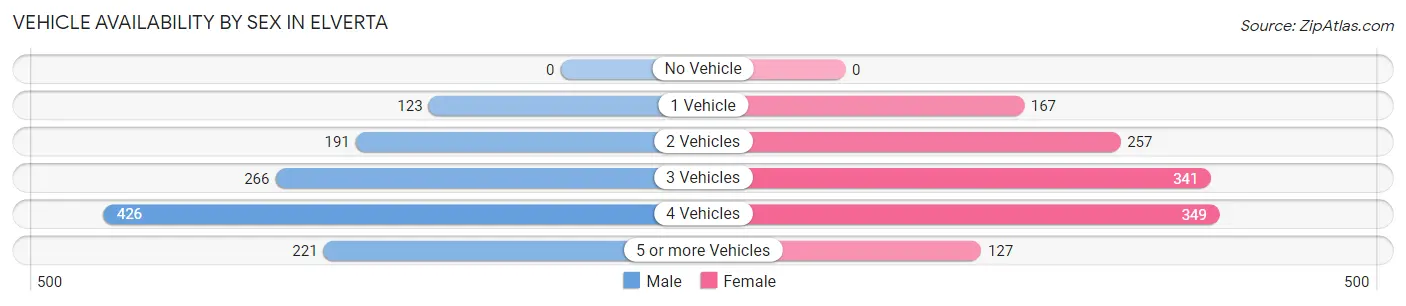
Vehicle Availability by Sex in Elverta
The most prevalent vehicle ownership categories in Elverta are males with 4 vehicles (426, accounting for 34.7%) and females with 4 vehicles (349, making up 34.3%).
| Vehicles Available | Male | Female |
| No Vehicle | 0 (0.0%) | 0 (0.0%) |
| 1 Vehicle | 123 (10.0%) | 167 (13.5%) |
| 2 Vehicles | 191 (15.6%) | 257 (20.7%) |
| 3 Vehicles | 266 (21.7%) | 341 (27.5%) |
| 4 Vehicles | 426 (34.7%) | 349 (28.1%) |
| 5 or more Vehicles | 221 (18.0%) | 127 (10.2%) |
| Total | 1,227 (100.0%) | 1,241 (100.0%) |
Commute Time in Elverta
The most frequently occuring commute durations in Elverta are 30 to 34 minutes (660 commuters, 28.1%), 20 to 24 minutes (381 commuters, 16.2%), and 25 to 29 minutes (206 commuters, 8.8%).
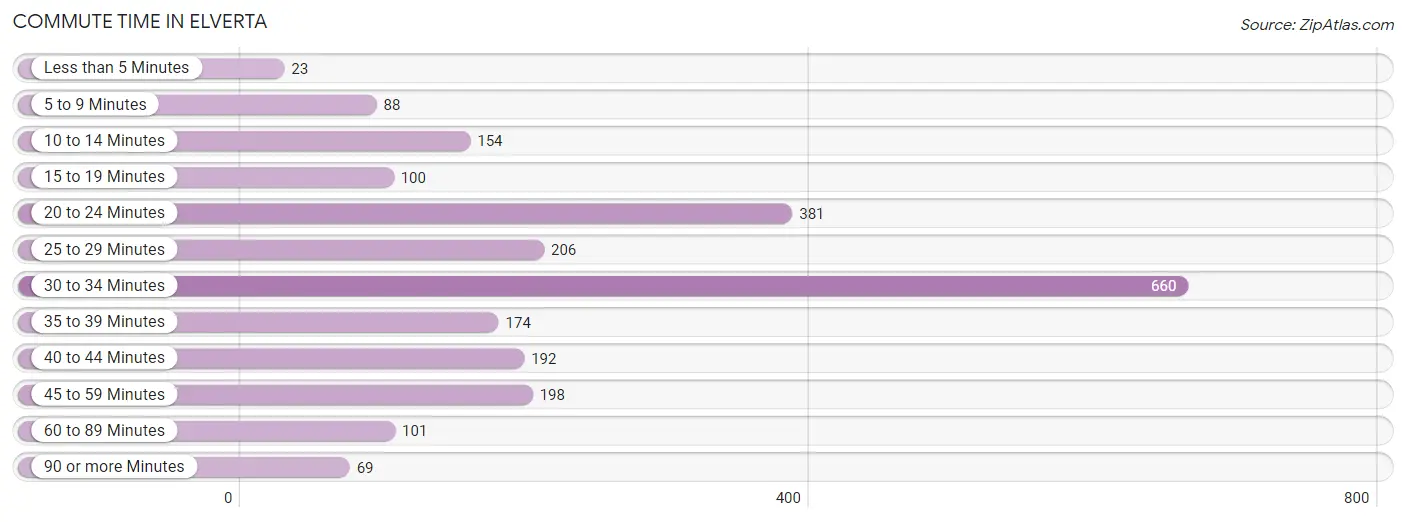
| Commute Time | # Commuters | % Commuters |
| Less than 5 Minutes | 23 | 1.0% |
| 5 to 9 Minutes | 88 | 3.7% |
| 10 to 14 Minutes | 154 | 6.6% |
| 15 to 19 Minutes | 100 | 4.3% |
| 20 to 24 Minutes | 381 | 16.2% |
| 25 to 29 Minutes | 206 | 8.8% |
| 30 to 34 Minutes | 660 | 28.1% |
| 35 to 39 Minutes | 174 | 7.4% |
| 40 to 44 Minutes | 192 | 8.2% |
| 45 to 59 Minutes | 198 | 8.4% |
| 60 to 89 Minutes | 101 | 4.3% |
| 90 or more Minutes | 69 | 2.9% |
Commute Time by Sex in Elverta
The most common commute times in Elverta are 30 to 34 minutes (321 commuters, 27.0%) for males and 30 to 34 minutes (339 commuters, 29.3%) for females.
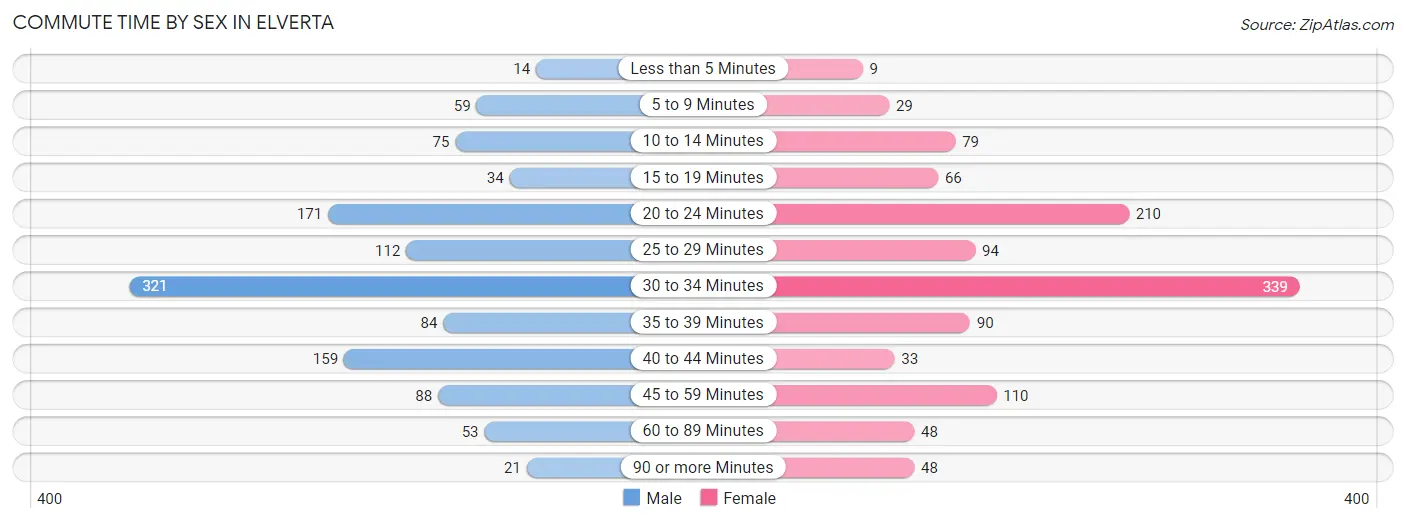
| Commute Time | Male | Female |
| Less than 5 Minutes | 14 (1.2%) | 9 (0.8%) |
| 5 to 9 Minutes | 59 (5.0%) | 29 (2.5%) |
| 10 to 14 Minutes | 75 (6.3%) | 79 (6.8%) |
| 15 to 19 Minutes | 34 (2.9%) | 66 (5.7%) |
| 20 to 24 Minutes | 171 (14.4%) | 210 (18.2%) |
| 25 to 29 Minutes | 112 (9.4%) | 94 (8.1%) |
| 30 to 34 Minutes | 321 (27.0%) | 339 (29.3%) |
| 35 to 39 Minutes | 84 (7.0%) | 90 (7.8%) |
| 40 to 44 Minutes | 159 (13.4%) | 33 (2.9%) |
| 45 to 59 Minutes | 88 (7.4%) | 110 (9.5%) |
| 60 to 89 Minutes | 53 (4.4%) | 48 (4.2%) |
| 90 or more Minutes | 21 (1.8%) | 48 (4.2%) |
Time of Departure to Work by Sex in Elverta
The most frequent times of departure to work in Elverta are 6:00 AM to 6:29 AM (193, 16.2%) for males and 7:30 AM to 7:59 AM (256, 22.2%) for females.
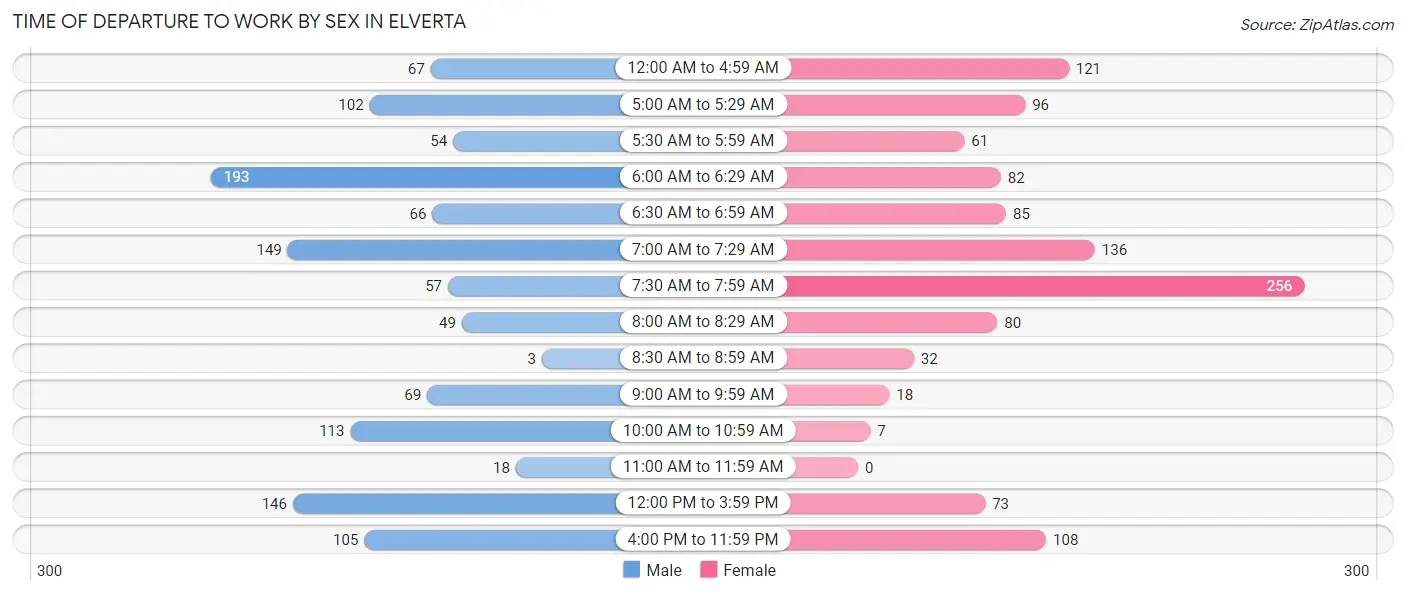
| Time of Departure | Male | Female |
| 12:00 AM to 4:59 AM | 67 (5.6%) | 121 (10.5%) |
| 5:00 AM to 5:29 AM | 102 (8.6%) | 96 (8.3%) |
| 5:30 AM to 5:59 AM | 54 (4.5%) | 61 (5.3%) |
| 6:00 AM to 6:29 AM | 193 (16.2%) | 82 (7.1%) |
| 6:30 AM to 6:59 AM | 66 (5.5%) | 85 (7.4%) |
| 7:00 AM to 7:29 AM | 149 (12.5%) | 136 (11.8%) |
| 7:30 AM to 7:59 AM | 57 (4.8%) | 256 (22.2%) |
| 8:00 AM to 8:29 AM | 49 (4.1%) | 80 (6.9%) |
| 8:30 AM to 8:59 AM | 3 (0.3%) | 32 (2.8%) |
| 9:00 AM to 9:59 AM | 69 (5.8%) | 18 (1.6%) |
| 10:00 AM to 10:59 AM | 113 (9.5%) | 7 (0.6%) |
| 11:00 AM to 11:59 AM | 18 (1.5%) | 0 (0.0%) |
| 12:00 PM to 3:59 PM | 146 (12.3%) | 73 (6.3%) |
| 4:00 PM to 11:59 PM | 105 (8.8%) | 108 (9.3%) |
| Total | 1,191 (100.0%) | 1,155 (100.0%) |
Housing Occupancy in Elverta
Occupancy by Ownership in Elverta
Of the total 1,655 dwellings in Elverta, owner-occupied units account for 1,364 (82.4%), while renter-occupied units make up 291 (17.6%).
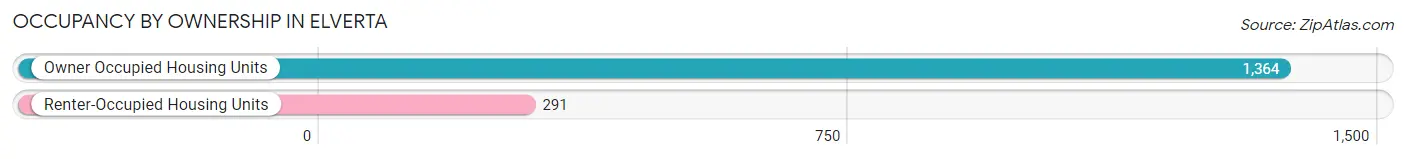
| Occupancy | # Housing Units | % Housing Units |
| Owner Occupied Housing Units | 1,364 | 82.4% |
| Renter-Occupied Housing Units | 291 | 17.6% |
| Total Occupied Housing Units | 1,655 | 100.0% |
Occupancy by Household Size in Elverta
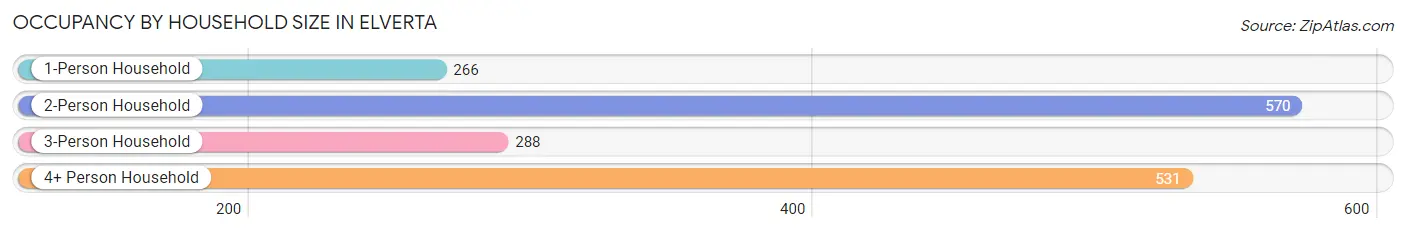
| Household Size | # Housing Units | % Housing Units |
| 1-Person Household | 266 | 16.1% |
| 2-Person Household | 570 | 34.4% |
| 3-Person Household | 288 | 17.4% |
| 4+ Person Household | 531 | 32.1% |
| Total Housing Units | 1,655 | 100.0% |
Occupancy by Ownership by Household Size in Elverta
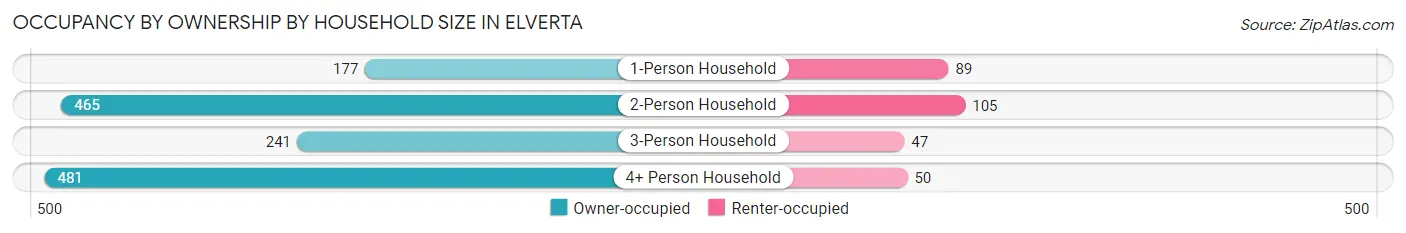
| Household Size | Owner-occupied | Renter-occupied |
| 1-Person Household | 177 (66.5%) | 89 (33.5%) |
| 2-Person Household | 465 (81.6%) | 105 (18.4%) |
| 3-Person Household | 241 (83.7%) | 47 (16.3%) |
| 4+ Person Household | 481 (90.6%) | 50 (9.4%) |
| Total Housing Units | 1,364 (82.4%) | 291 (17.6%) |
Occupancy by Educational Attainment in Elverta
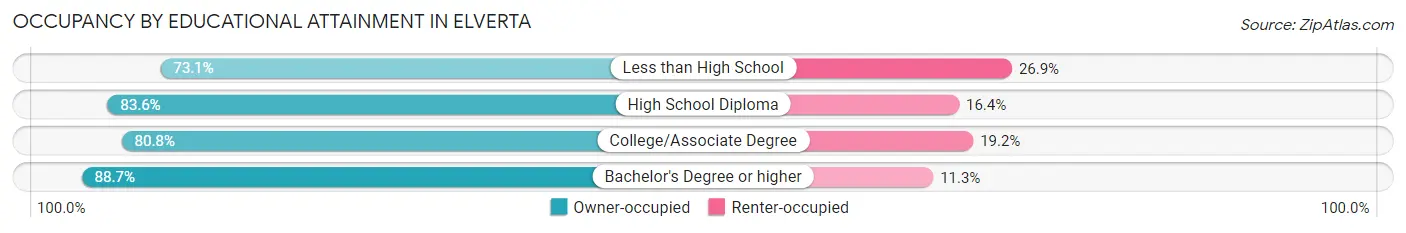
| Household Size | Owner-occupied | Renter-occupied |
| Less than High School | 57 (73.1%) | 21 (26.9%) |
| High School Diploma | 346 (83.6%) | 68 (16.4%) |
| College/Associate Degree | 718 (80.8%) | 171 (19.2%) |
| Bachelor's Degree or higher | 243 (88.7%) | 31 (11.3%) |
Occupancy by Age of Householder in Elverta
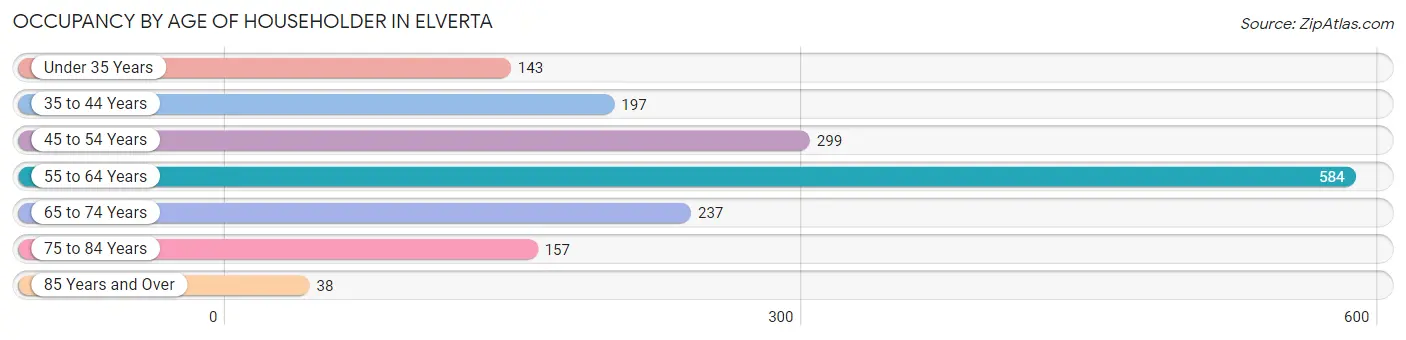
| Age Bracket | # Households | % Households |
| Under 35 Years | 143 | 8.6% |
| 35 to 44 Years | 197 | 11.9% |
| 45 to 54 Years | 299 | 18.1% |
| 55 to 64 Years | 584 | 35.3% |
| 65 to 74 Years | 237 | 14.3% |
| 75 to 84 Years | 157 | 9.5% |
| 85 Years and Over | 38 | 2.3% |
| Total | 1,655 | 100.0% |
Housing Finances in Elverta
Median Income by Occupancy in Elverta
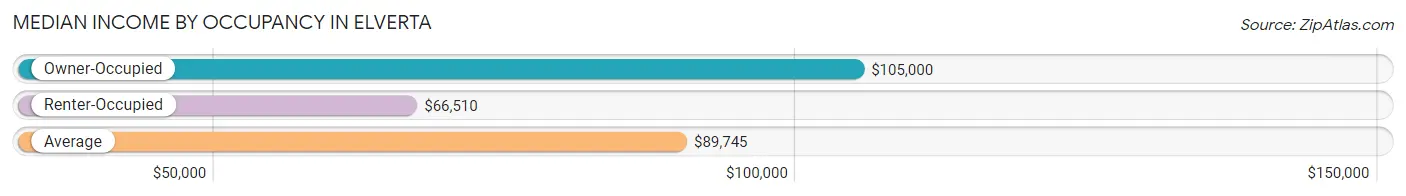
| Occupancy Type | # Households | Median Income |
| Owner-Occupied | 1,364 (82.4%) | $105,000 |
| Renter-Occupied | 291 (17.6%) | $66,510 |
| Average | 1,655 (100.0%) | $89,745 |
Occupancy by Householder Income Bracket in Elverta
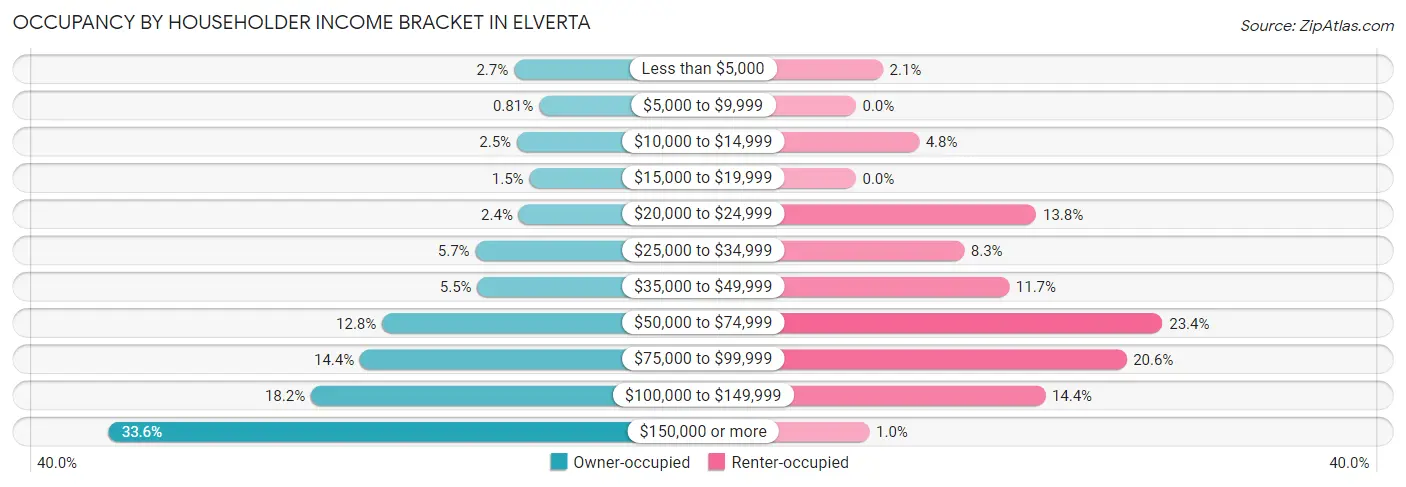
| Income Bracket | Owner-occupied | Renter-occupied |
| Less than $5,000 | 37 (2.7%) | 6 (2.1%) |
| $5,000 to $9,999 | 11 (0.8%) | 0 (0.0%) |
| $10,000 to $14,999 | 34 (2.5%) | 14 (4.8%) |
| $15,000 to $19,999 | 21 (1.5%) | 0 (0.0%) |
| $20,000 to $24,999 | 32 (2.4%) | 40 (13.8%) |
| $25,000 to $34,999 | 77 (5.7%) | 24 (8.3%) |
| $35,000 to $49,999 | 75 (5.5%) | 34 (11.7%) |
| $50,000 to $74,999 | 174 (12.8%) | 68 (23.4%) |
| $75,000 to $99,999 | 197 (14.4%) | 60 (20.6%) |
| $100,000 to $149,999 | 248 (18.2%) | 42 (14.4%) |
| $150,000 or more | 458 (33.6%) | 3 (1.0%) |
| Total | 1,364 (100.0%) | 291 (100.0%) |
Monthly Housing Cost Tiers in Elverta
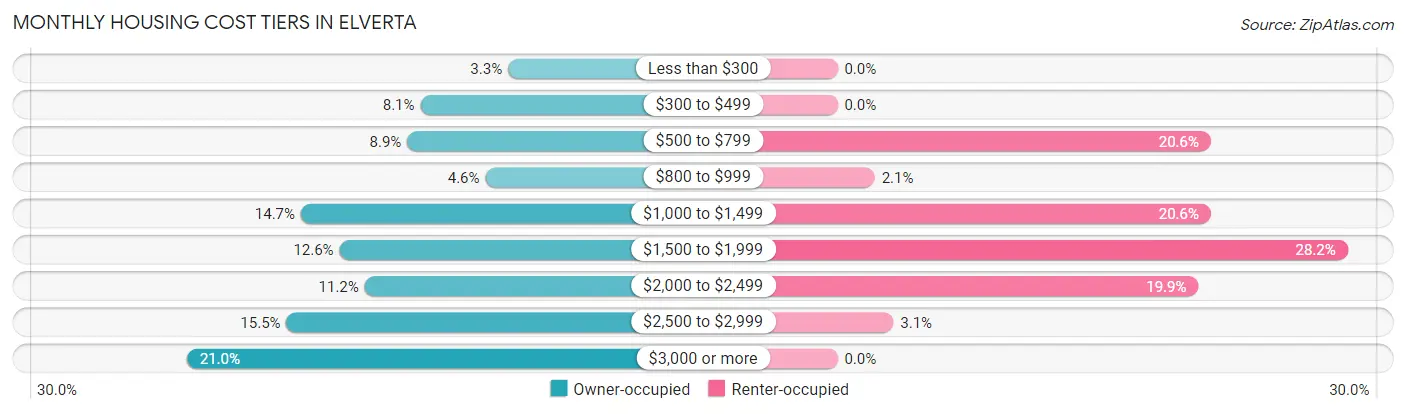
| Monthly Cost | Owner-occupied | Renter-occupied |
| Less than $300 | 45 (3.3%) | 0 (0.0%) |
| $300 to $499 | 111 (8.1%) | 0 (0.0%) |
| $500 to $799 | 121 (8.9%) | 60 (20.6%) |
| $800 to $999 | 62 (4.5%) | 6 (2.1%) |
| $1,000 to $1,499 | 201 (14.7%) | 60 (20.6%) |
| $1,500 to $1,999 | 172 (12.6%) | 82 (28.2%) |
| $2,000 to $2,499 | 153 (11.2%) | 58 (19.9%) |
| $2,500 to $2,999 | 212 (15.5%) | 9 (3.1%) |
| $3,000 or more | 287 (21.0%) | 0 (0.0%) |
| Total | 1,364 (100.0%) | 291 (100.0%) |
Physical Housing Characteristics in Elverta
Housing Structures in Elverta
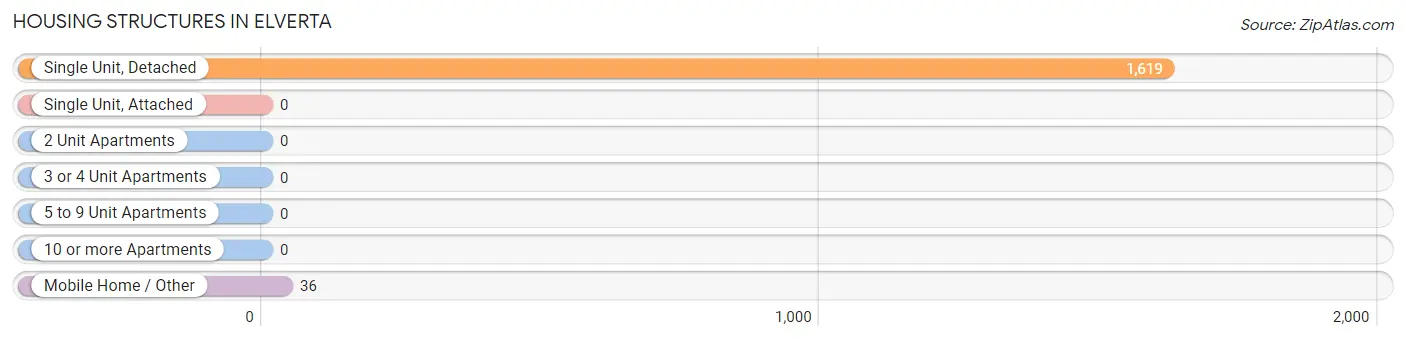
| Structure Type | # Housing Units | % Housing Units |
| Single Unit, Detached | 1,619 | 97.8% |
| Single Unit, Attached | 0 | 0.0% |
| 2 Unit Apartments | 0 | 0.0% |
| 3 or 4 Unit Apartments | 0 | 0.0% |
| 5 to 9 Unit Apartments | 0 | 0.0% |
| 10 or more Apartments | 0 | 0.0% |
| Mobile Home / Other | 36 | 2.2% |
| Total | 1,655 | 100.0% |
Housing Structures by Occupancy in Elverta
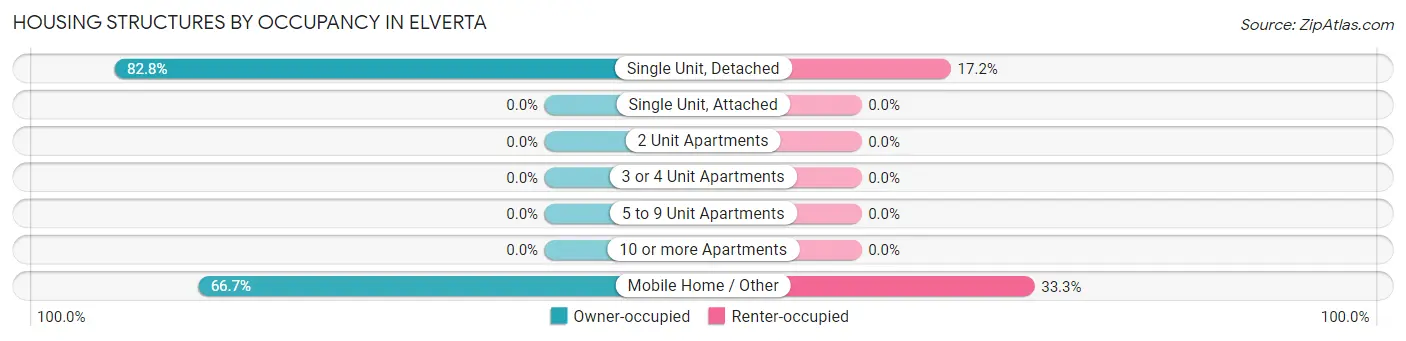
| Structure Type | Owner-occupied | Renter-occupied |
| Single Unit, Detached | 1,340 (82.8%) | 279 (17.2%) |
| Single Unit, Attached | 0 (0.0%) | 0 (0.0%) |
| 2 Unit Apartments | 0 (0.0%) | 0 (0.0%) |
| 3 or 4 Unit Apartments | 0 (0.0%) | 0 (0.0%) |
| 5 to 9 Unit Apartments | 0 (0.0%) | 0 (0.0%) |
| 10 or more Apartments | 0 (0.0%) | 0 (0.0%) |
| Mobile Home / Other | 24 (66.7%) | 12 (33.3%) |
| Total | 1,364 (82.4%) | 291 (17.6%) |
Housing Structures by Number of Rooms in Elverta
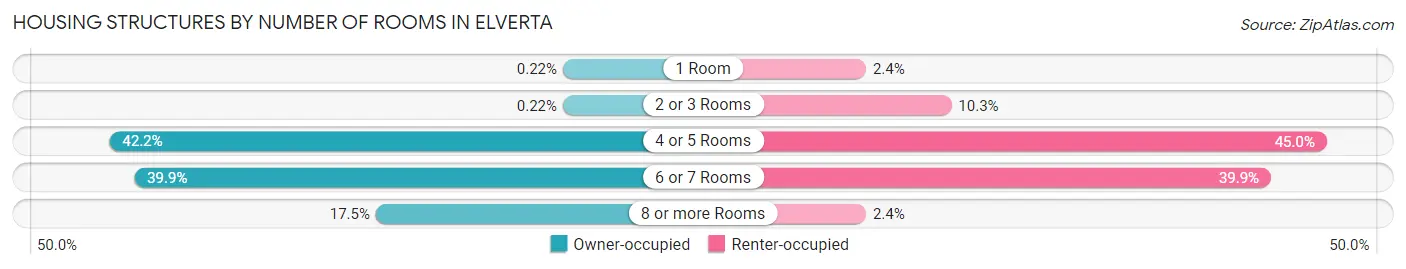
| Number of Rooms | Owner-occupied | Renter-occupied |
| 1 Room | 3 (0.2%) | 7 (2.4%) |
| 2 or 3 Rooms | 3 (0.2%) | 30 (10.3%) |
| 4 or 5 Rooms | 575 (42.2%) | 131 (45.0%) |
| 6 or 7 Rooms | 544 (39.9%) | 116 (39.9%) |
| 8 or more Rooms | 239 (17.5%) | 7 (2.4%) |
| Total | 1,364 (100.0%) | 291 (100.0%) |
Housing Structure by Heating Type in Elverta
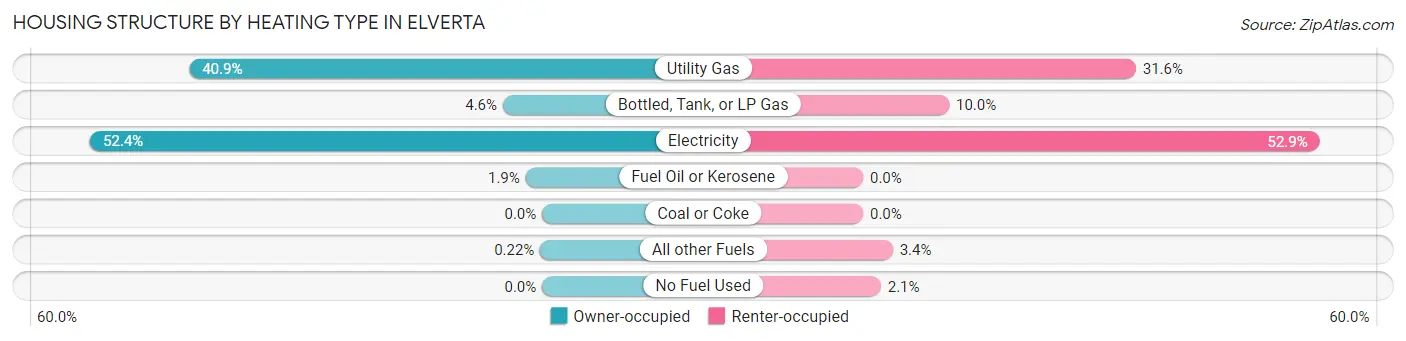
| Heating Type | Owner-occupied | Renter-occupied |
| Utility Gas | 558 (40.9%) | 92 (31.6%) |
| Bottled, Tank, or LP Gas | 62 (4.5%) | 29 (10.0%) |
| Electricity | 715 (52.4%) | 154 (52.9%) |
| Fuel Oil or Kerosene | 26 (1.9%) | 0 (0.0%) |
| Coal or Coke | 0 (0.0%) | 0 (0.0%) |
| All other Fuels | 3 (0.2%) | 10 (3.4%) |
| No Fuel Used | 0 (0.0%) | 6 (2.1%) |
| Total | 1,364 (100.0%) | 291 (100.0%) |
Household Vehicle Usage in Elverta
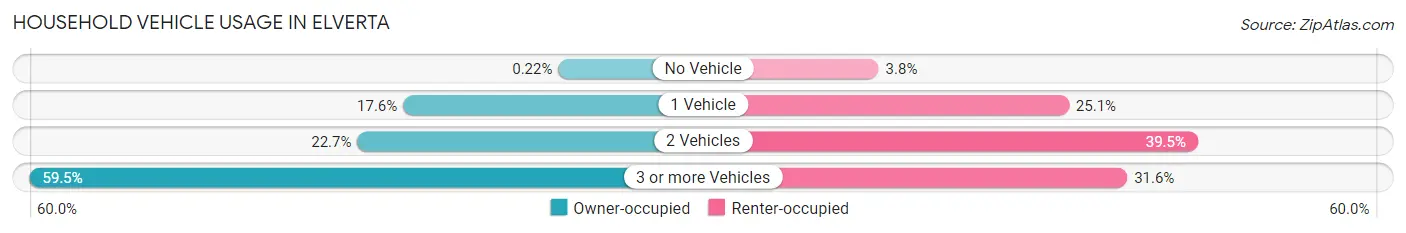
| Vehicles per Household | Owner-occupied | Renter-occupied |
| No Vehicle | 3 (0.2%) | 11 (3.8%) |
| 1 Vehicle | 240 (17.6%) | 73 (25.1%) |
| 2 Vehicles | 310 (22.7%) | 115 (39.5%) |
| 3 or more Vehicles | 811 (59.5%) | 92 (31.6%) |
| Total | 1,364 (100.0%) | 291 (100.0%) |
Real Estate & Mortgages in Elverta
Real Estate and Mortgage Overview in Elverta
| Characteristic | Without Mortgage | With Mortgage |
| Housing Units | 296 | 1,068 |
| Median Property Value | $381,400 | $458,300 |
| Median Household Income | $97,969 | $411 |
| Monthly Housing Costs | $558 | $287 |
| Real Estate Taxes | $2,055 | $7 |
Property Value by Mortgage Status in Elverta
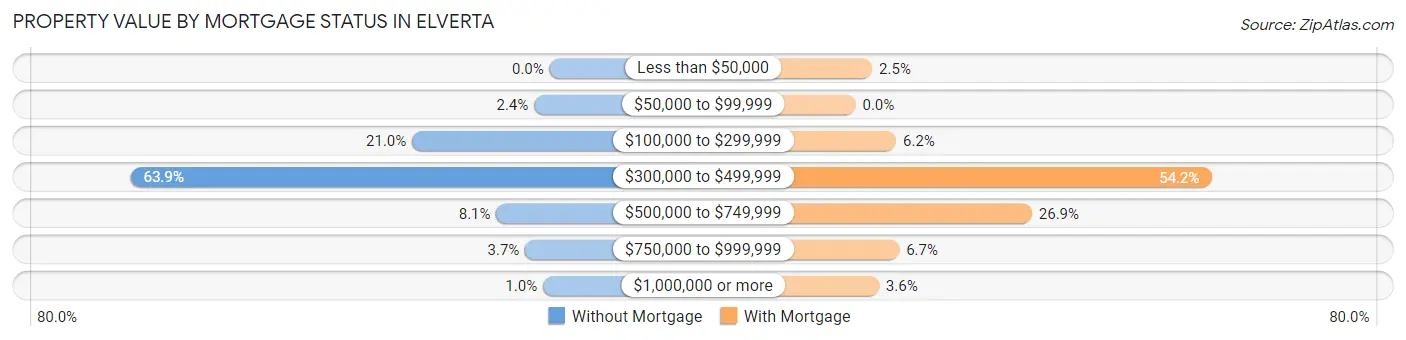
| Property Value | Without Mortgage | With Mortgage |
| Less than $50,000 | 0 (0.0%) | 27 (2.5%) |
| $50,000 to $99,999 | 7 (2.4%) | 0 (0.0%) |
| $100,000 to $299,999 | 62 (20.9%) | 66 (6.2%) |
| $300,000 to $499,999 | 189 (63.8%) | 579 (54.2%) |
| $500,000 to $749,999 | 24 (8.1%) | 287 (26.9%) |
| $750,000 to $999,999 | 11 (3.7%) | 71 (6.7%) |
| $1,000,000 or more | 3 (1.0%) | 38 (3.6%) |
| Total | 296 (100.0%) | 1,068 (100.0%) |
Household Income by Mortgage Status in Elverta
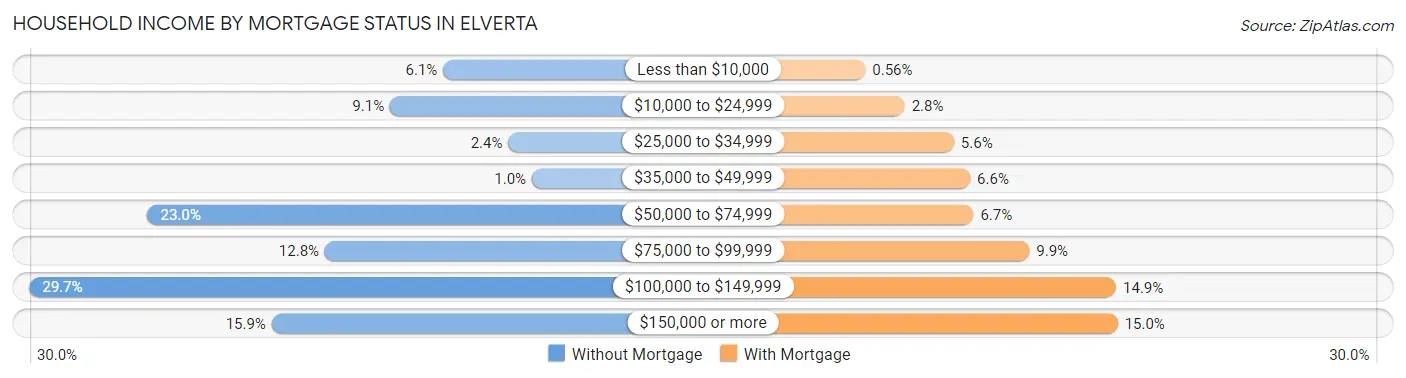
| Household Income | Without Mortgage | With Mortgage |
| Less than $10,000 | 18 (6.1%) | 6 (0.6%) |
| $10,000 to $24,999 | 27 (9.1%) | 30 (2.8%) |
| $25,000 to $34,999 | 7 (2.4%) | 60 (5.6%) |
| $35,000 to $49,999 | 3 (1.0%) | 70 (6.6%) |
| $50,000 to $74,999 | 68 (23.0%) | 72 (6.7%) |
| $75,000 to $99,999 | 38 (12.8%) | 106 (9.9%) |
| $100,000 to $149,999 | 88 (29.7%) | 159 (14.9%) |
| $150,000 or more | 47 (15.9%) | 160 (15.0%) |
| Total | 296 (100.0%) | 1,068 (100.0%) |
Property Value to Household Income Ratio in Elverta
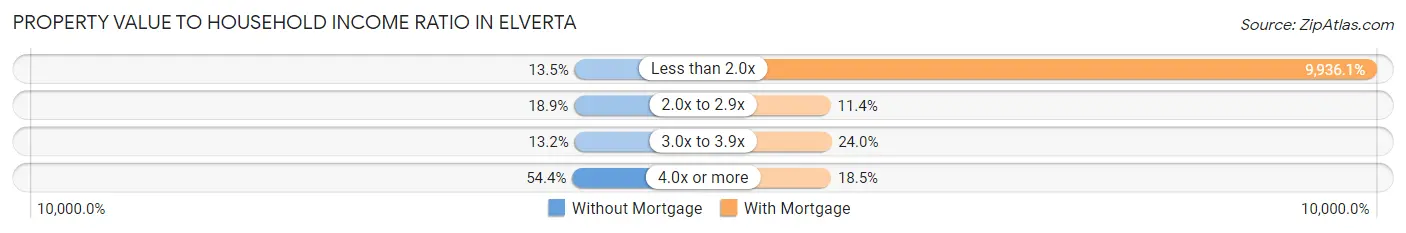
| Value-to-Income Ratio | Without Mortgage | With Mortgage |
| Less than 2.0x | 40 (13.5%) | 106,117 (9,936.1%) |
| 2.0x to 2.9x | 56 (18.9%) | 122 (11.4%) |
| 3.0x to 3.9x | 39 (13.2%) | 256 (24.0%) |
| 4.0x or more | 161 (54.4%) | 198 (18.5%) |
| Total | 296 (100.0%) | 1,068 (100.0%) |
Real Estate Taxes by Mortgage Status in Elverta
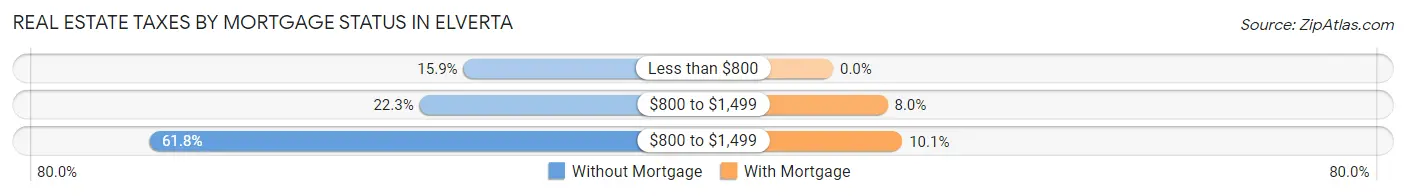
| Property Taxes | Without Mortgage | With Mortgage |
| Less than $800 | 47 (15.9%) | 0 (0.0%) |
| $800 to $1,499 | 66 (22.3%) | 85 (8.0%) |
| $800 to $1,499 | 183 (61.8%) | 108 (10.1%) |
| Total | 296 (100.0%) | 1,068 (100.0%) |
Health & Disability in Elverta
Health Insurance Coverage by Age in Elverta
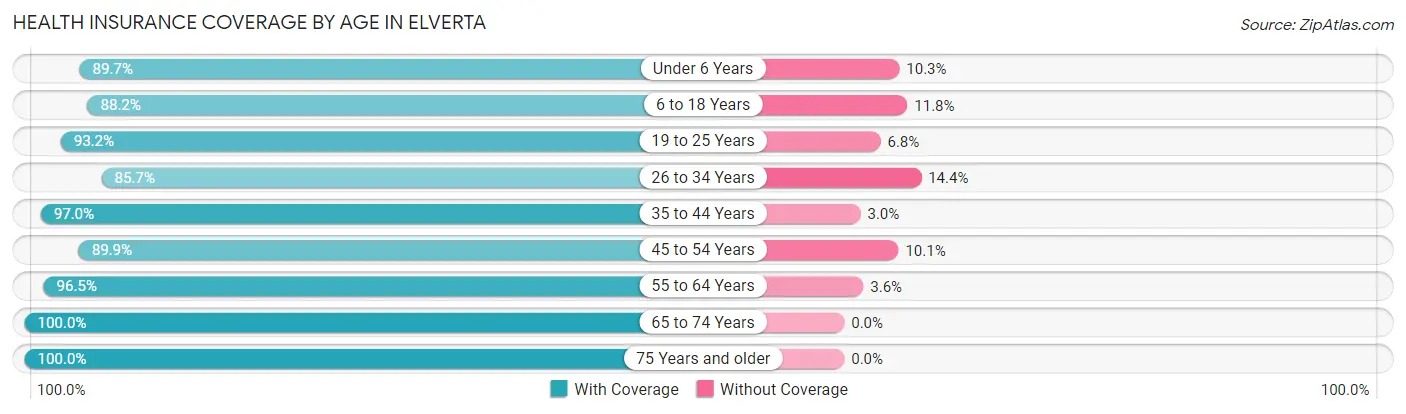
| Age Bracket | With Coverage | Without Coverage |
| Under 6 Years | 201 (89.7%) | 23 (10.3%) |
| 6 to 18 Years | 645 (88.2%) | 86 (11.8%) |
| 19 to 25 Years | 510 (93.2%) | 37 (6.8%) |
| 26 to 34 Years | 370 (85.7%) | 62 (14.3%) |
| 35 to 44 Years | 609 (97.0%) | 19 (3.0%) |
| 45 to 54 Years | 587 (89.9%) | 66 (10.1%) |
| 55 to 64 Years | 1,061 (96.5%) | 39 (3.5%) |
| 65 to 74 Years | 449 (100.0%) | 0 (0.0%) |
| 75 Years and older | 338 (100.0%) | 0 (0.0%) |
| Total | 4,770 (93.5%) | 332 (6.5%) |
Health Insurance Coverage by Citizenship Status in Elverta
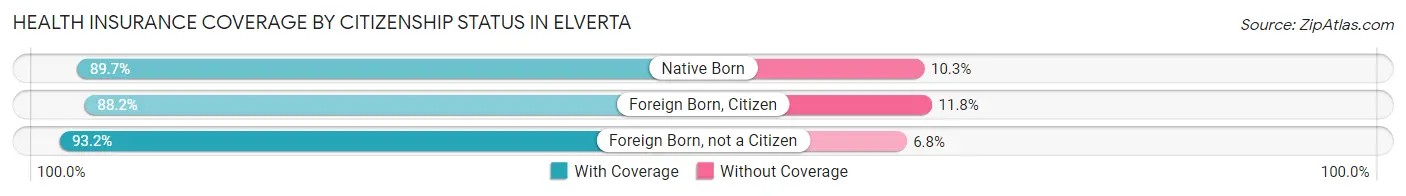
| Citizenship Status | With Coverage | Without Coverage |
| Native Born | 201 (89.7%) | 23 (10.3%) |
| Foreign Born, Citizen | 645 (88.2%) | 86 (11.8%) |
| Foreign Born, not a Citizen | 510 (93.2%) | 37 (6.8%) |
Health Insurance Coverage by Household Income in Elverta
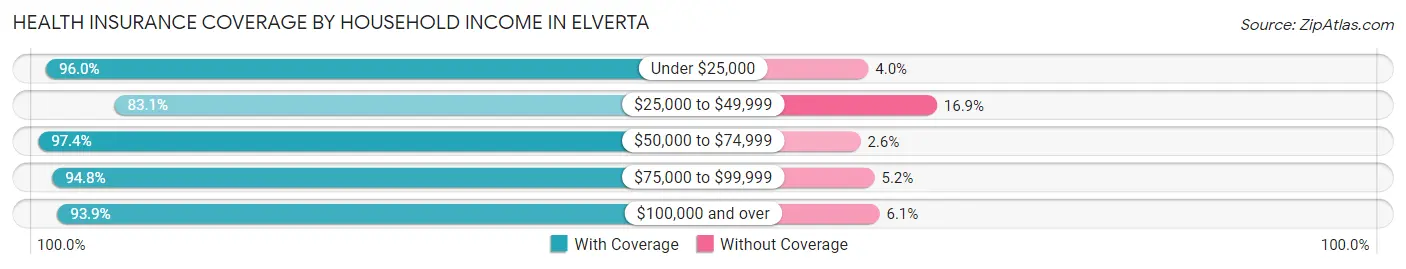
| Household Income | With Coverage | Without Coverage |
| Under $25,000 | 404 (96.0%) | 17 (4.0%) |
| $25,000 to $49,999 | 453 (83.1%) | 92 (16.9%) |
| $50,000 to $74,999 | 572 (97.4%) | 15 (2.6%) |
| $75,000 to $99,999 | 838 (94.8%) | 46 (5.2%) |
| $100,000 and over | 2,482 (93.9%) | 162 (6.1%) |
Public vs Private Health Insurance Coverage by Age in Elverta
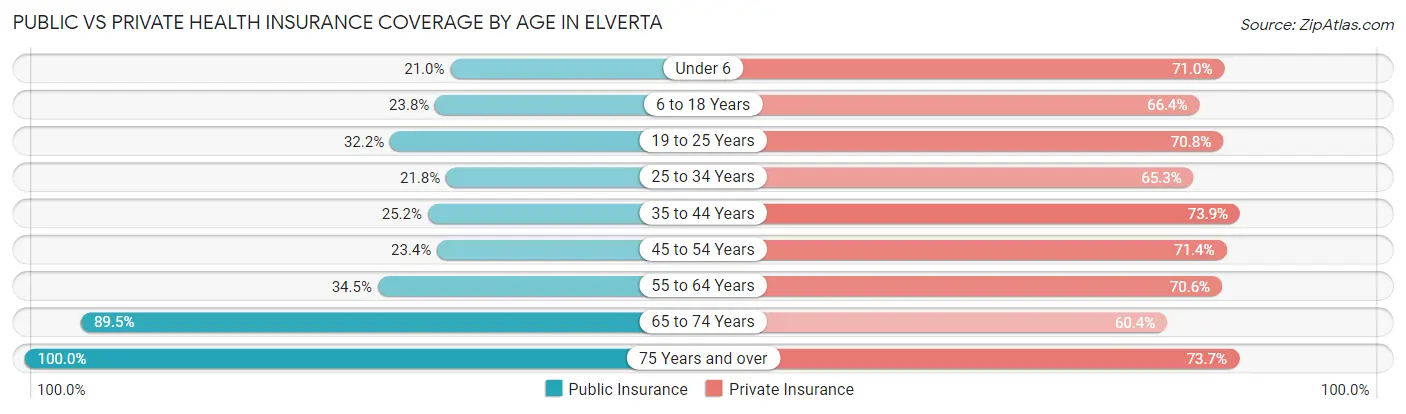
| Age Bracket | Public Insurance | Private Insurance |
| Under 6 | 47 (21.0%) | 159 (71.0%) |
| 6 to 18 Years | 174 (23.8%) | 485 (66.3%) |
| 19 to 25 Years | 176 (32.2%) | 387 (70.8%) |
| 25 to 34 Years | 94 (21.8%) | 282 (65.3%) |
| 35 to 44 Years | 158 (25.2%) | 464 (73.9%) |
| 45 to 54 Years | 153 (23.4%) | 466 (71.4%) |
| 55 to 64 Years | 379 (34.4%) | 776 (70.6%) |
| 65 to 74 Years | 402 (89.5%) | 271 (60.4%) |
| 75 Years and over | 338 (100.0%) | 249 (73.7%) |
| Total | 1,921 (37.7%) | 3,539 (69.4%) |
Disability Status by Sex by Age in Elverta
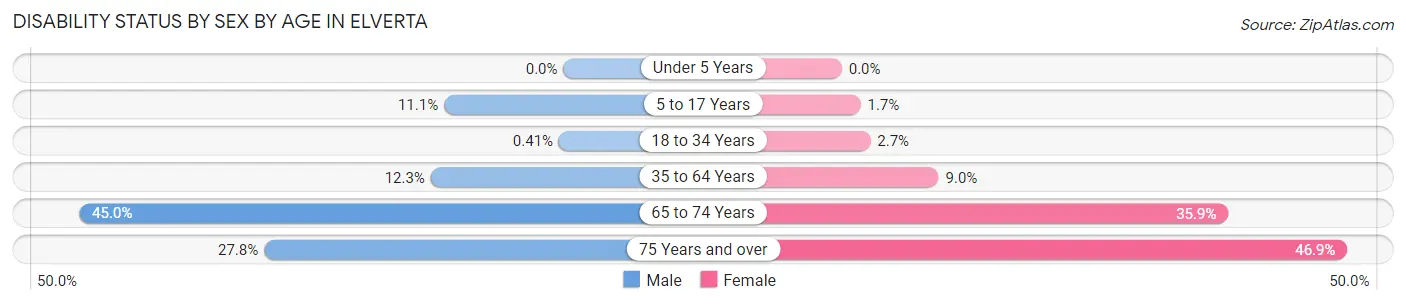
| Age Bracket | Male | Female |
| Under 5 Years | 0 (0.0%) | 0 (0.0%) |
| 5 to 17 Years | 44 (11.1%) | 6 (1.7%) |
| 18 to 34 Years | 2 (0.4%) | 13 (2.6%) |
| 35 to 64 Years | 156 (12.3%) | 100 (9.0%) |
| 65 to 74 Years | 89 (45.0%) | 90 (35.9%) |
| 75 Years and over | 40 (27.8%) | 91 (46.9%) |
Disability Class by Sex by Age in Elverta
Disability Class: Hearing Difficulty
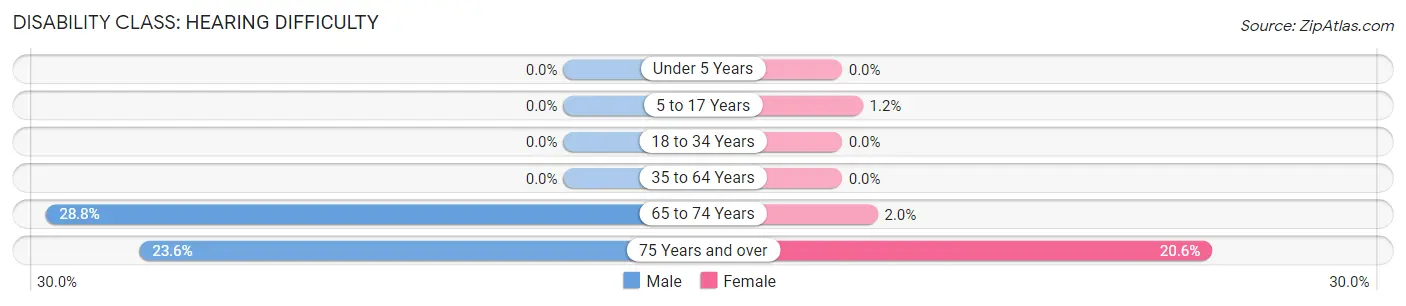
| Age Bracket | Male | Female |
| Under 5 Years | 0 (0.0%) | 0 (0.0%) |
| 5 to 17 Years | 0 (0.0%) | 4 (1.2%) |
| 18 to 34 Years | 0 (0.0%) | 0 (0.0%) |
| 35 to 64 Years | 0 (0.0%) | 0 (0.0%) |
| 65 to 74 Years | 57 (28.8%) | 5 (2.0%) |
| 75 Years and over | 34 (23.6%) | 40 (20.6%) |
Disability Class: Vision Difficulty
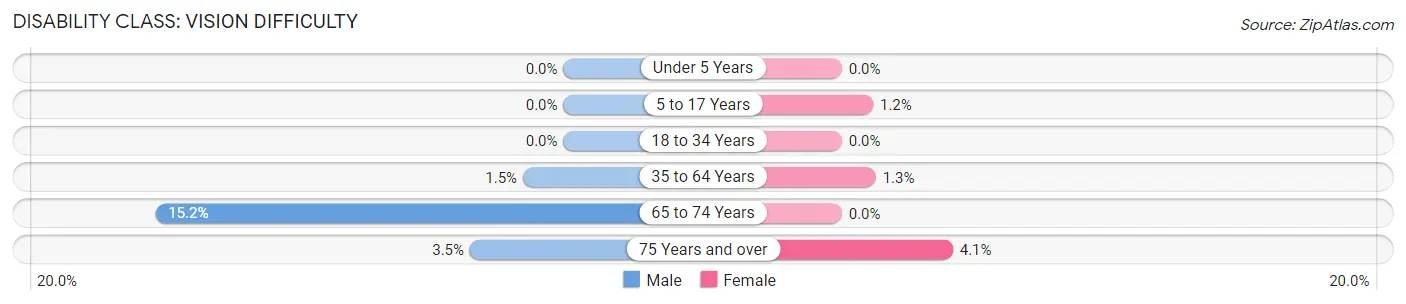
| Age Bracket | Male | Female |
| Under 5 Years | 0 (0.0%) | 0 (0.0%) |
| 5 to 17 Years | 0 (0.0%) | 4 (1.2%) |
| 18 to 34 Years | 0 (0.0%) | 0 (0.0%) |
| 35 to 64 Years | 19 (1.5%) | 14 (1.3%) |
| 65 to 74 Years | 30 (15.1%) | 0 (0.0%) |
| 75 Years and over | 5 (3.5%) | 8 (4.1%) |
Disability Class: Cognitive Difficulty
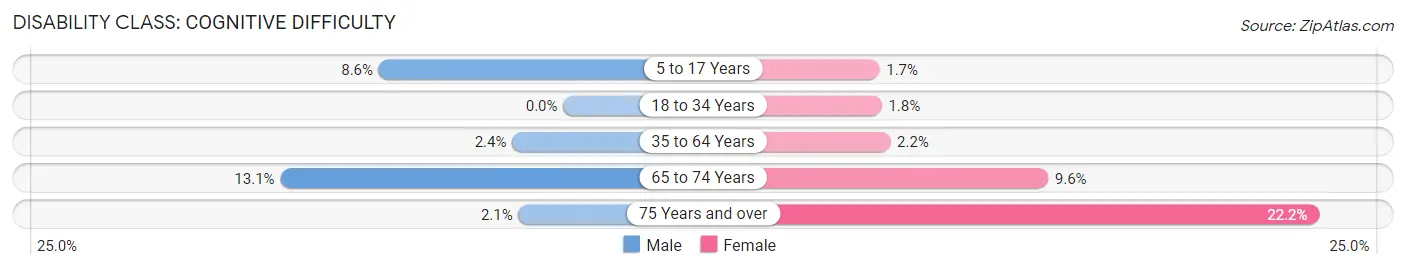
| Age Bracket | Male | Female |
| 5 to 17 Years | 34 (8.6%) | 6 (1.7%) |
| 18 to 34 Years | 0 (0.0%) | 9 (1.8%) |
| 35 to 64 Years | 30 (2.4%) | 25 (2.2%) |
| 65 to 74 Years | 26 (13.1%) | 24 (9.6%) |
| 75 Years and over | 3 (2.1%) | 43 (22.2%) |
Disability Class: Ambulatory Difficulty
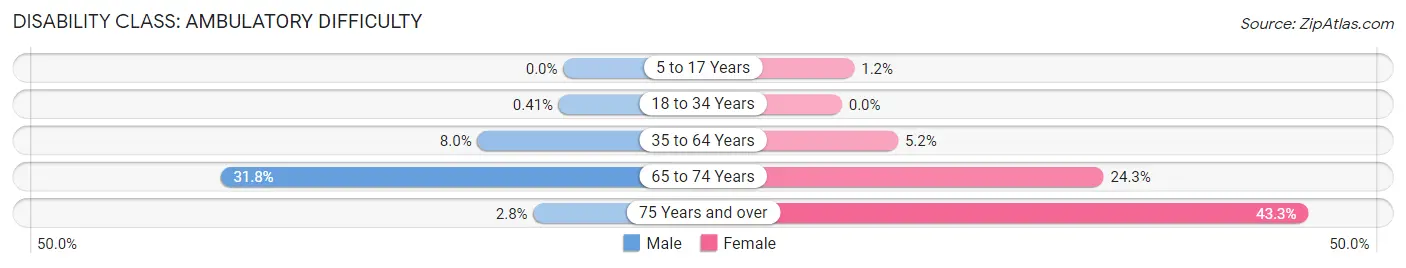
| Age Bracket | Male | Female |
| 5 to 17 Years | 0 (0.0%) | 4 (1.2%) |
| 18 to 34 Years | 2 (0.4%) | 0 (0.0%) |
| 35 to 64 Years | 101 (8.0%) | 58 (5.2%) |
| 65 to 74 Years | 63 (31.8%) | 61 (24.3%) |
| 75 Years and over | 4 (2.8%) | 84 (43.3%) |
Disability Class: Self-Care Difficulty
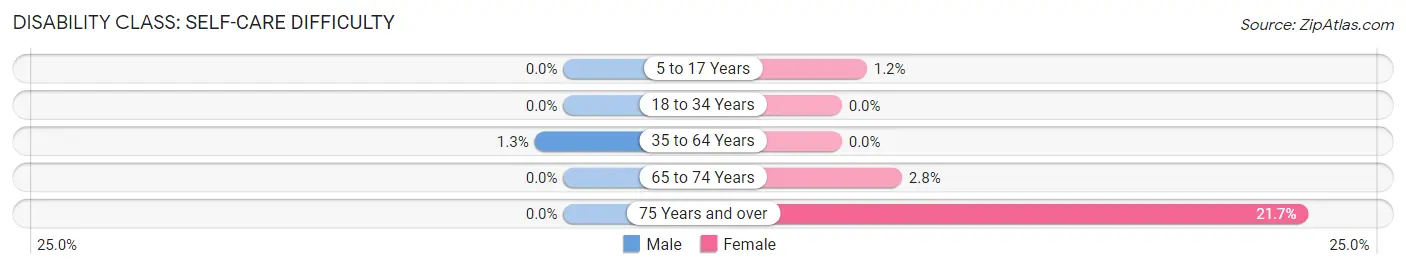
| Age Bracket | Male | Female |
| 5 to 17 Years | 0 (0.0%) | 4 (1.2%) |
| 18 to 34 Years | 0 (0.0%) | 0 (0.0%) |
| 35 to 64 Years | 17 (1.3%) | 0 (0.0%) |
| 65 to 74 Years | 0 (0.0%) | 7 (2.8%) |
| 75 Years and over | 0 (0.0%) | 42 (21.6%) |
Technology Access in Elverta
Computing Device Access in Elverta
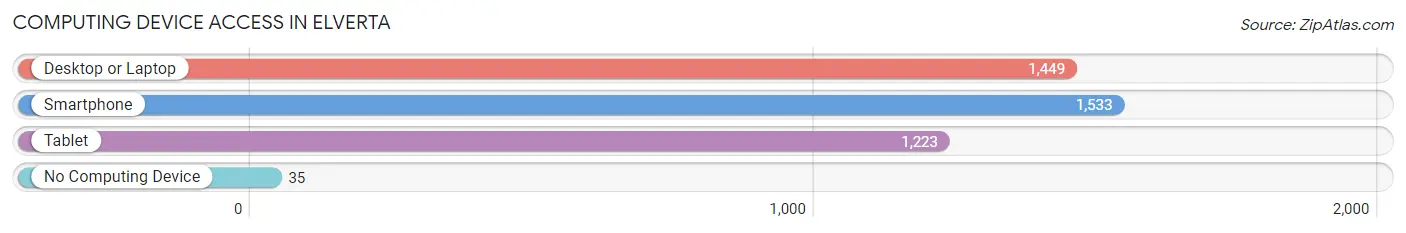
| Device Type | # Households | % Households |
| Desktop or Laptop | 1,449 | 87.5% |
| Smartphone | 1,533 | 92.6% |
| Tablet | 1,223 | 73.9% |
| No Computing Device | 35 | 2.1% |
| Total | 1,655 | 100.0% |
Internet Access in Elverta
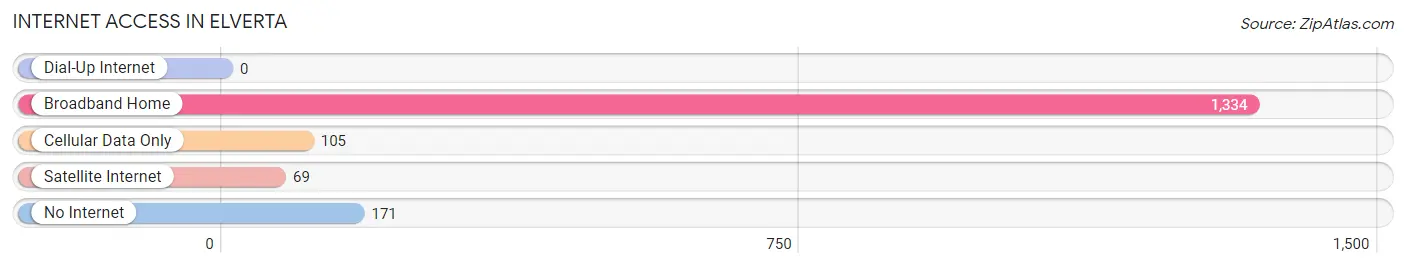
| Internet Type | # Households | % Households |
| Dial-Up Internet | 0 | 0.0% |
| Broadband Home | 1,334 | 80.6% |
| Cellular Data Only | 105 | 6.3% |
| Satellite Internet | 69 | 4.2% |
| No Internet | 171 | 10.3% |
| Total | 1,655 | 100.0% |
Elverta Summary
Elverta is a small unincorporated community located in Sacramento County, California. It is situated about 15 miles northeast of downtown Sacramento and is part of the greater Sacramento metropolitan area. The population of Elverta was estimated to be 2,845 in 2019.
History
Elverta was founded in the late 1800s by a group of settlers from the Midwest. The town was originally called “Elverta Station” after the nearby Elverta Railroad Station. The station was built in 1876 and served as a stop for the Central Pacific Railroad. The town was officially incorporated in 1910 and the name was changed to Elverta.
Geography
Elverta is located in the Sacramento Valley, at an elevation of about 30 feet above sea level. The town is situated on the banks of the Dry Creek, which flows through the area. The climate in Elverta is generally mild, with hot summers and cool winters.
The town is surrounded by agricultural land, with many farms and ranches in the area. The nearby cities of Rio Linda and Antelope are also located in the Sacramento Valley.
Economy
The economy of Elverta is largely based on agriculture. The town is home to several farms and ranches, which produce a variety of crops, including tomatoes, corn, and wheat. The town is also home to several small businesses, including a grocery store, a gas station, and a few restaurants.
Demographics
As of 2019, the population of Elverta was estimated to be 2,845. The racial makeup of the town was 79.3% White, 8.2% Hispanic or Latino, 6.2% Asian, and 4.3% African American. The median household income in Elverta was $63,917, and the median home value was $346,000.
Elverta is a small, rural community with a strong sense of community and a close-knit population. The town is home to several churches, a library, and a community center. The town also hosts several annual events, including a Fourth of July parade and a Christmas tree lighting ceremony.
Elverta is a small, rural community with a strong sense of community and a close-knit population. The town is home to several churches, a library, and a community center. The town also hosts several annual events, including a Fourth of July parade and a Christmas tree lighting ceremony. The town is also home to several small businesses, including a grocery store, a gas station, and a few restaurants. The economy of Elverta is largely based on agriculture, with many farms and ranches in the area. The population of Elverta was estimated to be 2,845 in 2019.
Common Questions
What is Per Capita Income in Elverta?
Per Capita income in Elverta is $38,431.
What is the Median Family Income in Elverta?
Median Family Income in Elverta is $96,359.
What is the Median Household income in Elverta?
Median Household Income in Elverta is $89,745.
What is Income or Wage Gap in Elverta?
Income or Wage Gap in Elverta is 20.6%.
Women in Elverta earn 79.4 cents for every dollar earned by a man.
What is Inequality or Gini Index in Elverta?
Inequality or Gini Index in Elverta is 0.40.
What is the Total Population of Elverta?
Total Population of Elverta is 5,102.
What is the Total Male Population of Elverta?
Total Male Population of Elverta is 2,584.
What is the Total Female Population of Elverta?
Total Female Population of Elverta is 2,518.
What is the Ratio of Males per 100 Females in Elverta?
There are 102.62 Males per 100 Females in Elverta.
What is the Ratio of Females per 100 Males in Elverta?
There are 97.45 Females per 100 Males in Elverta.
What is the Median Population Age in Elverta?
Median Population Age in Elverta is 44.9 Years.
What is the Average Family Size in Elverta
Average Family Size in Elverta is 3.4 People.
What is the Average Household Size in Elverta
Average Household Size in Elverta is 3.1 People.
How Large is the Labor Force in Elverta?
There are 2,603 People in the Labor Forcein in Elverta.
What is the Percentage of People in the Labor Force in Elverta?
60.4% of People are in the Labor Force in Elverta.
What is the Unemployment Rate in Elverta?
Unemployment Rate in Elverta is 4.2%.