Woodbridge, CA Map & Demographics
Woodbridge Map
Woodbridge Overview
$53,120
PER CAPITA INCOME
$126,327
AVG FAMILY INCOME
$116,190
AVG HOUSEHOLD INCOME
10.6%
WAGE / INCOME GAP [ % ]
89.4¢/ $1
WAGE / INCOME GAP [ $ ]
0.43
INEQUALITY / GINI INDEX
3,870
TOTAL POPULATION
1,857
MALE POPULATION
2,013
FEMALE POPULATION
92.25
MALES / 100 FEMALES
108.40
FEMALES / 100 MALES
46.6
MEDIAN AGE
3.1
AVG FAMILY SIZE
2.6
AVG HOUSEHOLD SIZE
1,965
LABOR FORCE [ PEOPLE ]
61.0%
PERCENT IN LABOR FORCE
4.0%
UNEMPLOYMENT RATE
Woodbridge Zip Codes
Woodbridge Area Codes
Income in Woodbridge
Income Overview in Woodbridge
Per Capita Income in Woodbridge is $53,120, while median incomes of families and households are $126,327 and $116,190 respectively.
| Characteristic | Number | Measure |
| Per Capita Income | 3,870 | $53,120 |
| Median Family Income | 1,099 | $126,327 |
| Mean Family Income | 1,099 | $154,756 |
| Median Household Income | 1,496 | $116,190 |
| Mean Household Income | 1,496 | $134,654 |
| Income Deficit | 1,099 | $0 |
| Wage / Income Gap (%) | 3,870 | 10.61% |
| Wage / Income Gap ($) | 3,870 | 89.39¢ per $1 |
| Gini / Inequality Index | 3,870 | 0.43 |
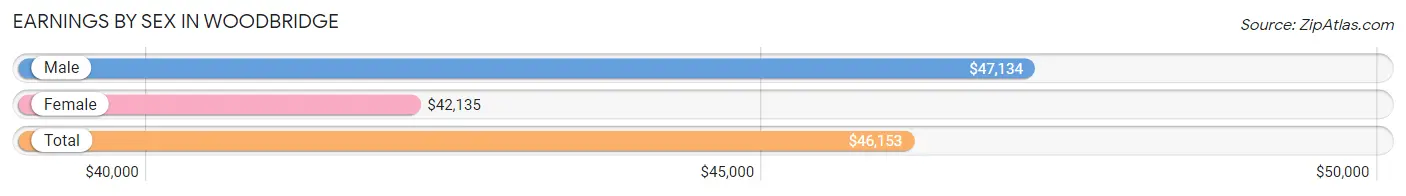
Earnings by Sex in Woodbridge
Average Earnings in Woodbridge are $46,153, $47,134 for men and $42,135 for women, a difference of 10.6%.
| Sex | Number | Average Earnings |
| Male | 1,082 (52.1%) | $47,134 |
| Female | 995 (47.9%) | $42,135 |
| Total | 2,077 (100.0%) | $46,153 |
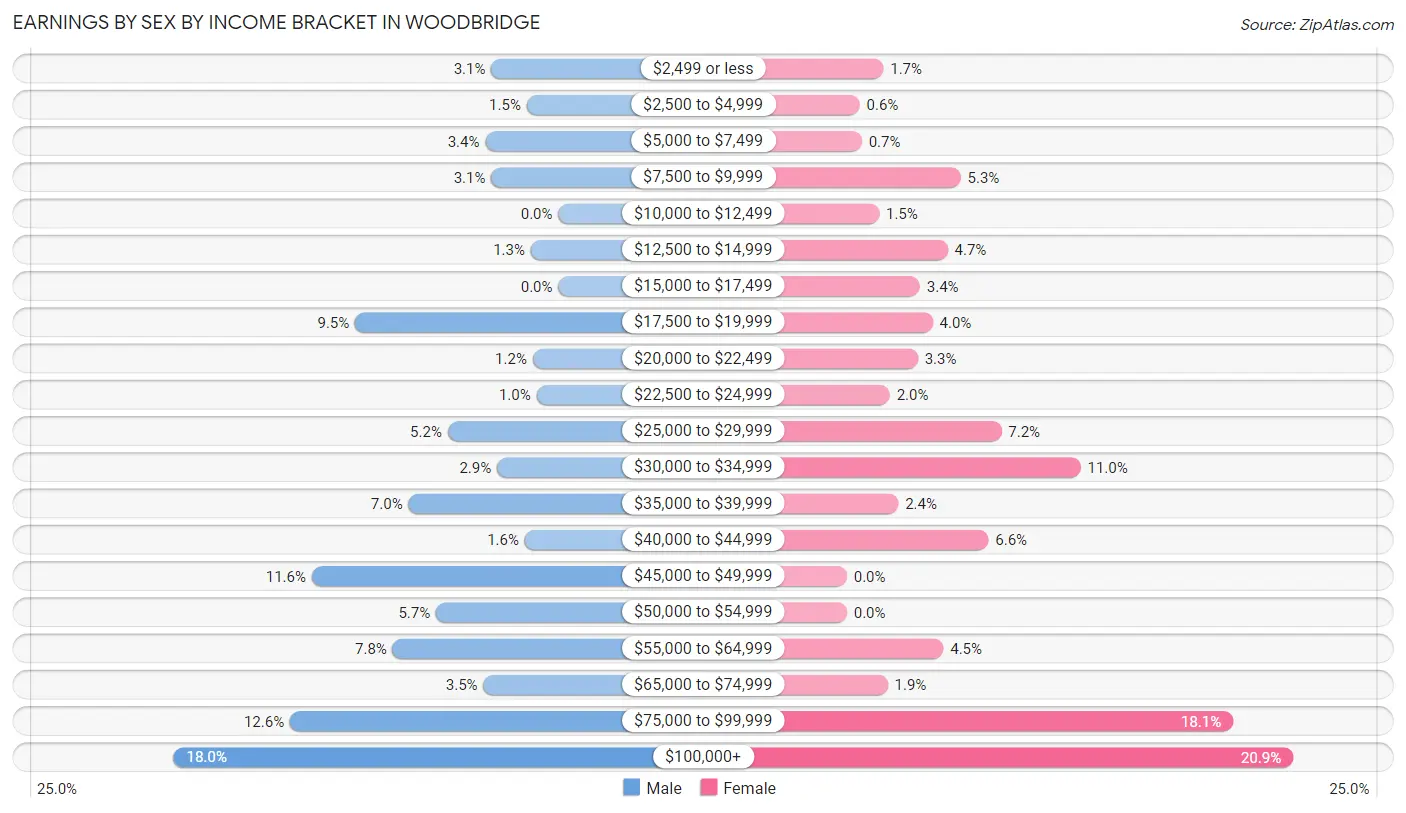
Earnings by Sex by Income Bracket in Woodbridge
The most common earnings brackets in Woodbridge are $100,000+ for men (195 | 18.0%) and $100,000+ for women (208 | 20.9%).
| Income | Male | Female |
| $2,499 or less | 34 (3.1%) | 17 (1.7%) |
| $2,500 to $4,999 | 16 (1.5%) | 6 (0.6%) |
| $5,000 to $7,499 | 37 (3.4%) | 7 (0.7%) |
| $7,500 to $9,999 | 34 (3.1%) | 53 (5.3%) |
| $10,000 to $12,499 | 0 (0.0%) | 15 (1.5%) |
| $12,500 to $14,999 | 14 (1.3%) | 47 (4.7%) |
| $15,000 to $17,499 | 0 (0.0%) | 34 (3.4%) |
| $17,500 to $19,999 | 103 (9.5%) | 40 (4.0%) |
| $20,000 to $22,499 | 13 (1.2%) | 33 (3.3%) |
| $22,500 to $24,999 | 11 (1.0%) | 20 (2.0%) |
| $25,000 to $29,999 | 56 (5.2%) | 72 (7.2%) |
| $30,000 to $34,999 | 31 (2.9%) | 109 (11.0%) |
| $35,000 to $39,999 | 76 (7.0%) | 24 (2.4%) |
| $40,000 to $44,999 | 17 (1.6%) | 66 (6.6%) |
| $45,000 to $49,999 | 125 (11.6%) | 0 (0.0%) |
| $50,000 to $54,999 | 62 (5.7%) | 0 (0.0%) |
| $55,000 to $64,999 | 84 (7.8%) | 45 (4.5%) |
| $65,000 to $74,999 | 38 (3.5%) | 19 (1.9%) |
| $75,000 to $99,999 | 136 (12.6%) | 180 (18.1%) |
| $100,000+ | 195 (18.0%) | 208 (20.9%) |
| Total | 1,082 (100.0%) | 995 (100.0%) |
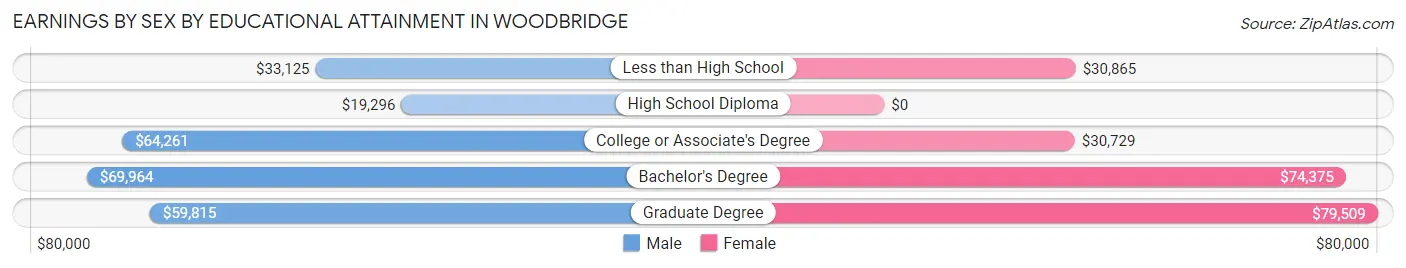
Earnings by Sex by Educational Attainment in Woodbridge
Average earnings in Woodbridge are $50,978 for men and $43,929 for women, a difference of 13.8%. Men with an educational attainment of bachelor's degree enjoy the highest average annual earnings of $69,964, while those with high school diploma education earn the least with $19,296. Women with an educational attainment of graduate degree earn the most with the average annual earnings of $79,509, while those with college or associate's degree education have the smallest earnings of $30,729.
| Educational Attainment | Male Income | Female Income |
| Less than High School | $33,125 | $30,865 |
| High School Diploma | $19,296 | $0 |
| College or Associate's Degree | $64,261 | $30,729 |
| Bachelor's Degree | $69,964 | $74,375 |
| Graduate Degree | $59,815 | $79,509 |
| Total | $50,978 | $43,929 |
Family Income in Woodbridge
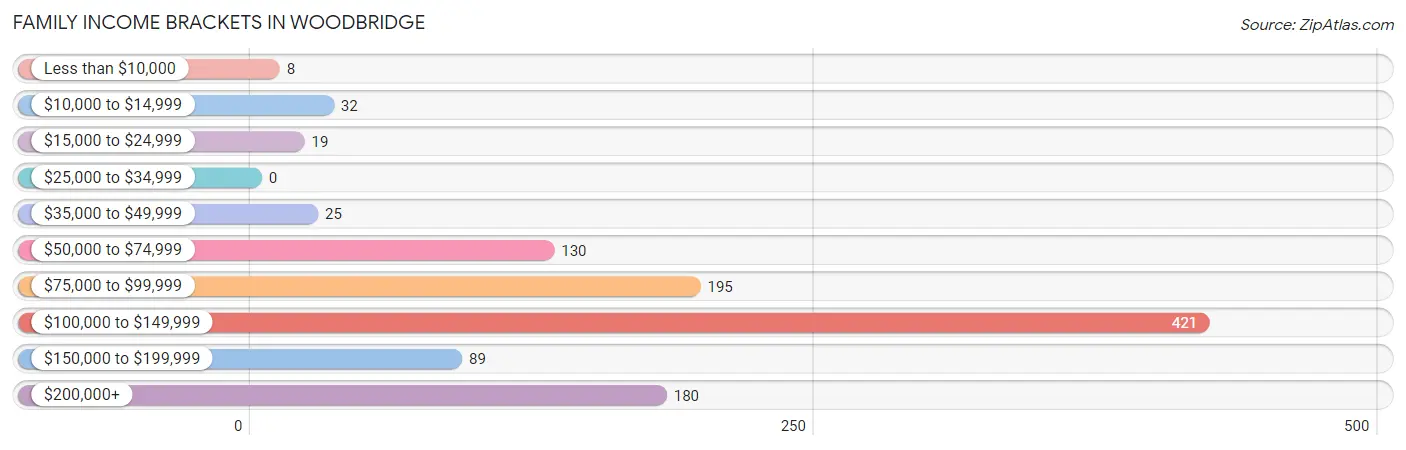
Family Income Brackets in Woodbridge
According to the Woodbridge family income data, there are 421 families falling into the $100,000 to $149,999 income range, which is the most common income bracket and makes up 38.3% of all families.
| Income Bracket | # Families | % Families |
| Less than $10,000 | 8 | 0.7% |
| $10,000 to $14,999 | 32 | 2.9% |
| $15,000 to $24,999 | 19 | 1.7% |
| $25,000 to $34,999 | 0 | 0.0% |
| $35,000 to $49,999 | 25 | 2.3% |
| $50,000 to $74,999 | 130 | 11.8% |
| $75,000 to $99,999 | 195 | 17.7% |
| $100,000 to $149,999 | 421 | 38.3% |
| $150,000 to $199,999 | 89 | 8.1% |
| $200,000+ | 180 | 16.4% |
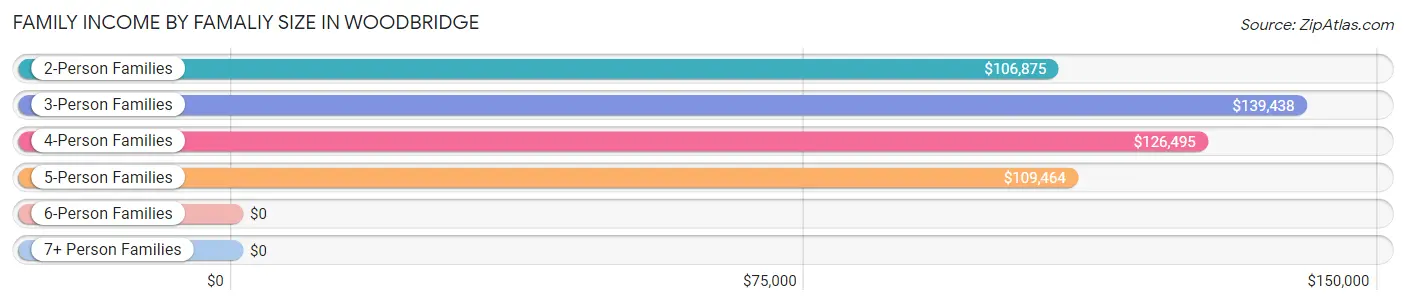
Family Income by Famaliy Size in Woodbridge
3-person families (131 | 11.9%) account for the highest median family income in Woodbridge with $139,438 per family, while 2-person families (581 | 52.9%) have the highest median income of $53,438 per family member.
| Income Bracket | # Families | Median Income |
| 2-Person Families | 581 (52.9%) | $106,875 |
| 3-Person Families | 131 (11.9%) | $139,438 |
| 4-Person Families | 258 (23.5%) | $126,495 |
| 5-Person Families | 93 (8.5%) | $109,464 |
| 6-Person Families | 36 (3.3%) | $0 |
| 7+ Person Families | 0 (0.0%) | $0 |
| Total | 1,099 (100.0%) | $126,327 |
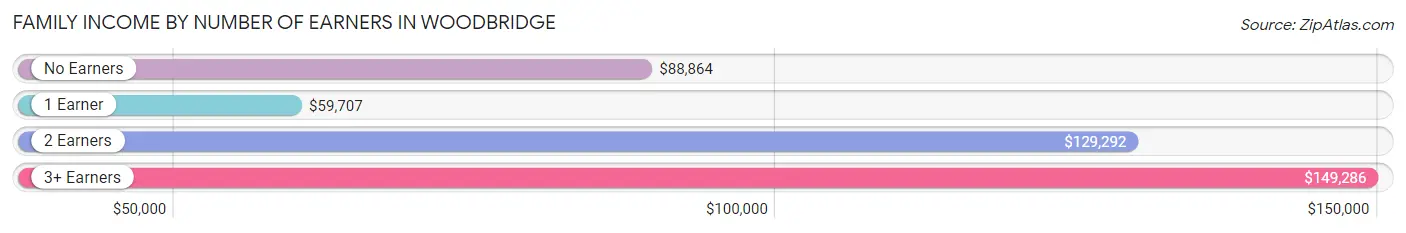
Family Income by Number of Earners in Woodbridge
The median family income in Woodbridge is $126,327, with families comprising 3+ earners (140) having the highest median family income of $149,286, while families with 1 earner (207) have the lowest median family income of $59,707, accounting for 12.7% and 18.8% of families, respectively.
| Number of Earners | # Families | Median Income |
| No Earners | 194 (17.6%) | $88,864 |
| 1 Earner | 207 (18.8%) | $59,707 |
| 2 Earners | 558 (50.8%) | $129,292 |
| 3+ Earners | 140 (12.7%) | $149,286 |
| Total | 1,099 (100.0%) | $126,327 |
Household Income in Woodbridge
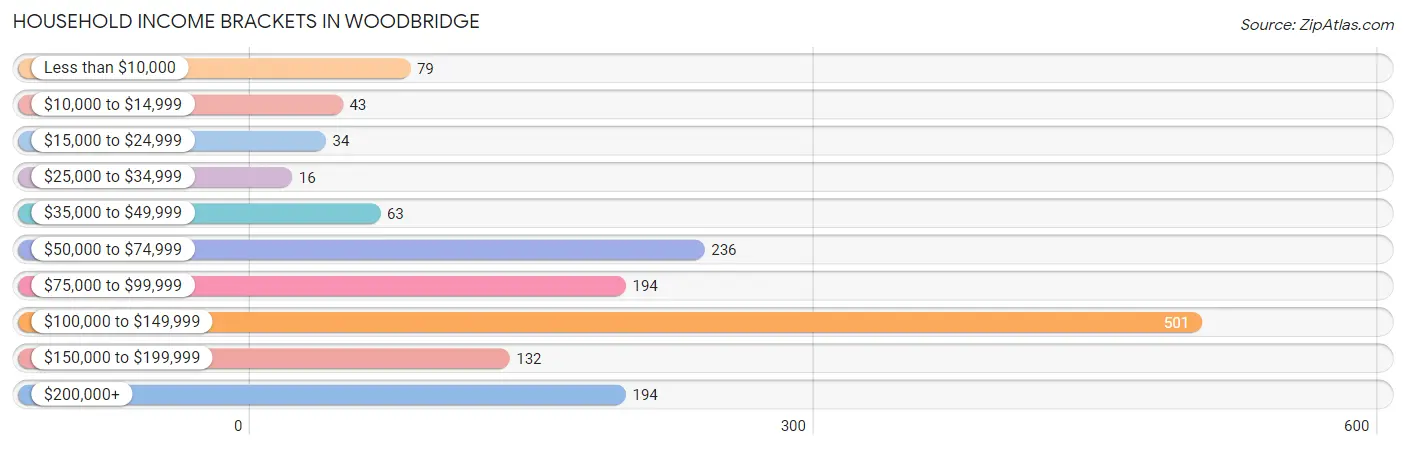
Household Income Brackets in Woodbridge
With 501 households falling in the category, the $100,000 to $149,999 income range is the most frequent in Woodbridge, accounting for 33.5% of all households. In contrast, only 16 households (1.1%) fall into the $25,000 to $34,999 income bracket, making it the least populous group.
| Income Bracket | # Households | % Households |
| Less than $10,000 | 79 | 5.3% |
| $10,000 to $14,999 | 43 | 2.9% |
| $15,000 to $24,999 | 34 | 2.3% |
| $25,000 to $34,999 | 16 | 1.1% |
| $35,000 to $49,999 | 63 | 4.2% |
| $50,000 to $74,999 | 236 | 15.8% |
| $75,000 to $99,999 | 194 | 13.0% |
| $100,000 to $149,999 | 501 | 33.5% |
| $150,000 to $199,999 | 132 | 8.8% |
| $200,000+ | 194 | 13.0% |
Household Income by Householder Age in Woodbridge
The median household income in Woodbridge is $116,190, with the highest median household income of $138,042 found in the 45 to 64 years age bracket for the primary householder. A total of 531 households (35.5%) fall into this category.
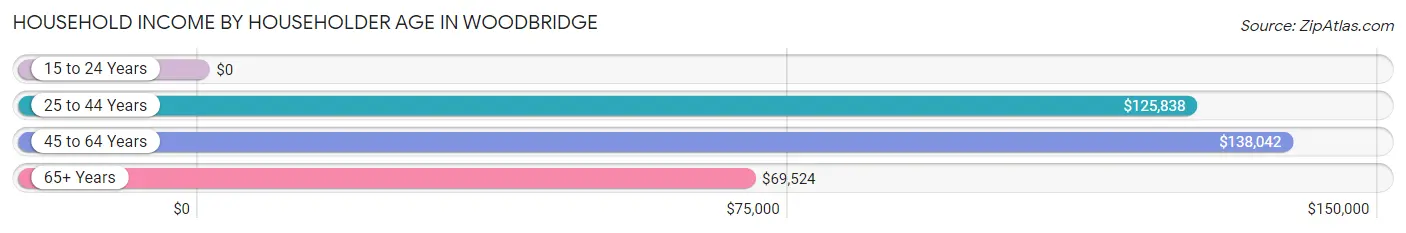
| Income Bracket | # Households | Median Income |
| 15 to 24 Years | 0 (0.0%) | $0 |
| 25 to 44 Years | 383 (25.6%) | $125,838 |
| 45 to 64 Years | 531 (35.5%) | $138,042 |
| 65+ Years | 582 (38.9%) | $69,524 |
| Total | 1,496 (100.0%) | $116,190 |
Poverty in Woodbridge
Income Below Poverty by Sex and Age in Woodbridge
With 6.6% poverty level for males and 6.8% for females among the residents of Woodbridge, 6 to 11 year old males and 75 year old and over females are the most vulnerable to poverty, with 10 males (15.6%) and 71 females (30.6%) in their respective age groups living below the poverty level.
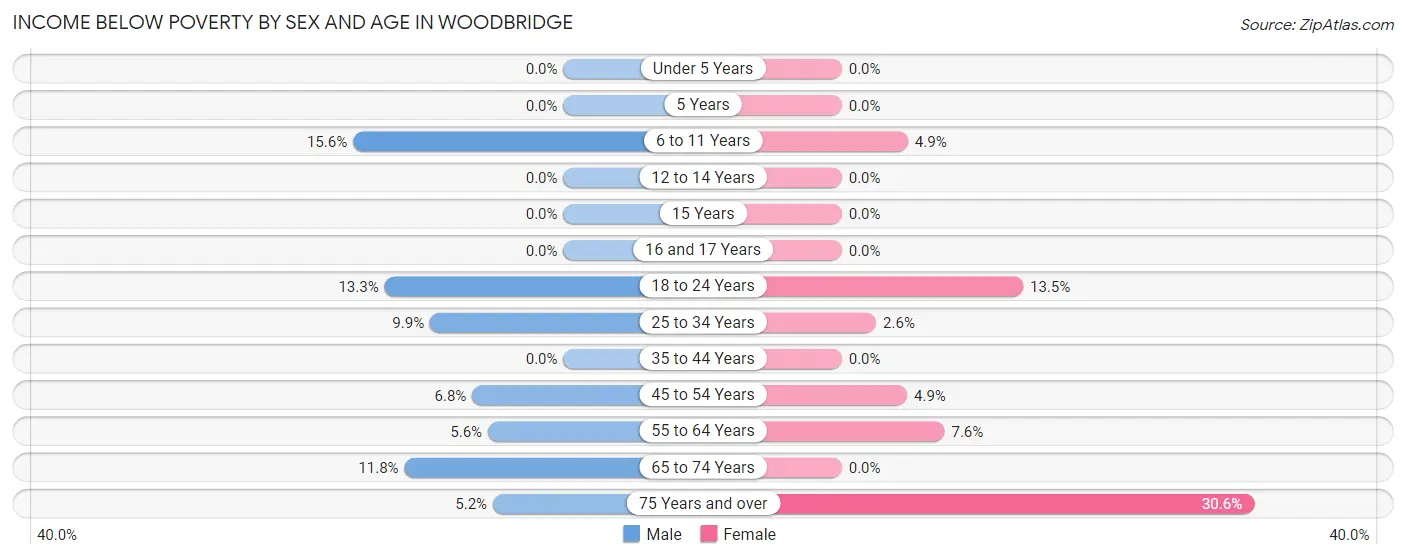
| Age Bracket | Male | Female |
| Under 5 Years | 0 (0.0%) | 0 (0.0%) |
| 5 Years | 0 (0.0%) | 0 (0.0%) |
| 6 to 11 Years | 10 (15.6%) | 11 (4.9%) |
| 12 to 14 Years | 0 (0.0%) | 0 (0.0%) |
| 15 Years | 0 (0.0%) | 0 (0.0%) |
| 16 and 17 Years | 0 (0.0%) | 0 (0.0%) |
| 18 to 24 Years | 17 (13.3%) | 7 (13.5%) |
| 25 to 34 Years | 20 (9.9%) | 10 (2.5%) |
| 35 to 44 Years | 0 (0.0%) | 0 (0.0%) |
| 45 to 54 Years | 9 (6.8%) | 11 (4.9%) |
| 55 to 64 Years | 20 (5.6%) | 27 (7.6%) |
| 65 to 74 Years | 36 (11.8%) | 0 (0.0%) |
| 75 Years and over | 9 (5.2%) | 71 (30.6%) |
| Total | 121 (6.6%) | 137 (6.8%) |
Income Above Poverty by Sex and Age in Woodbridge
According to the poverty statistics in Woodbridge, males aged 5 years and females aged under 5 years are the age groups that are most secure financially, with 100.0% of males and 100.0% of females in these age groups living above the poverty line.
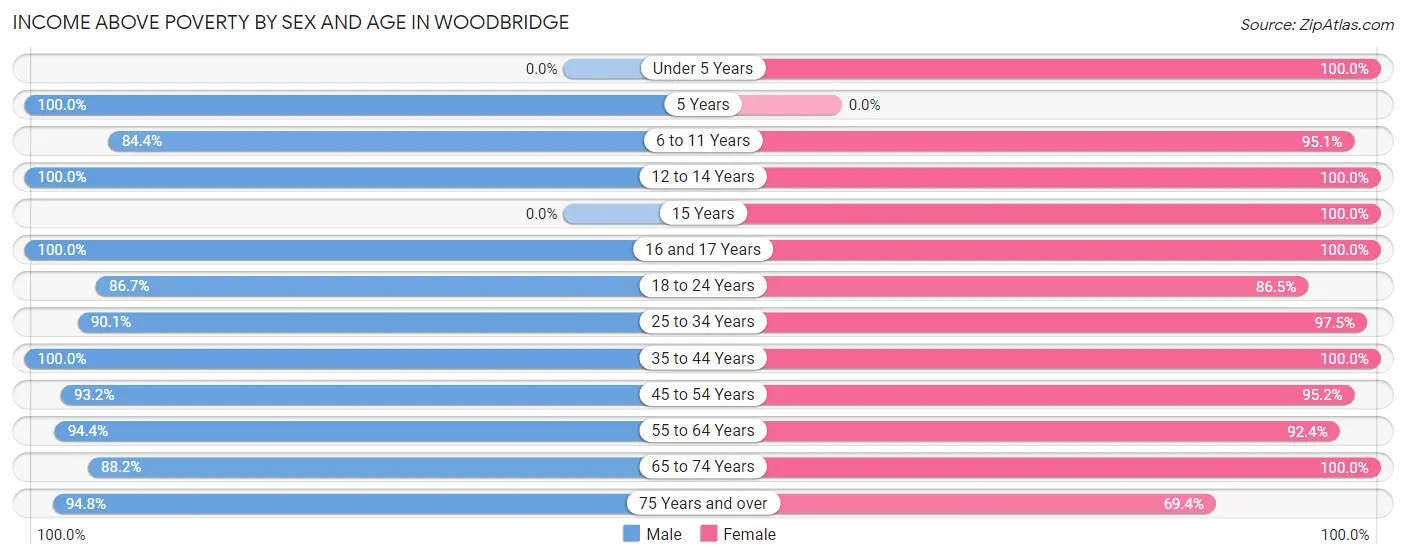
| Age Bracket | Male | Female |
| Under 5 Years | 0 (0.0%) | 110 (100.0%) |
| 5 Years | 86 (100.0%) | 0 (0.0%) |
| 6 to 11 Years | 54 (84.4%) | 213 (95.1%) |
| 12 to 14 Years | 70 (100.0%) | 68 (100.0%) |
| 15 Years | 0 (0.0%) | 17 (100.0%) |
| 16 and 17 Years | 22 (100.0%) | 33 (100.0%) |
| 18 to 24 Years | 111 (86.7%) | 45 (86.5%) |
| 25 to 34 Years | 182 (90.1%) | 382 (97.5%) |
| 35 to 44 Years | 308 (100.0%) | 127 (100.0%) |
| 45 to 54 Years | 124 (93.2%) | 216 (95.2%) |
| 55 to 64 Years | 337 (94.4%) | 327 (92.4%) |
| 65 to 74 Years | 269 (88.2%) | 177 (100.0%) |
| 75 Years and over | 163 (94.8%) | 161 (69.4%) |
| Total | 1,726 (93.4%) | 1,876 (93.2%) |
Income Below Poverty Among Married-Couple Families in Woodbridge
The poverty statistics for married-couple families in Woodbridge show that 4.4% or 44 of the total 1,004 families live below the poverty line. Families with no children have the highest poverty rate of 5.0%, comprising of 33 families. On the other hand, families with 3 or 4 children have the lowest poverty rate of 0.0%, which includes 0 families.
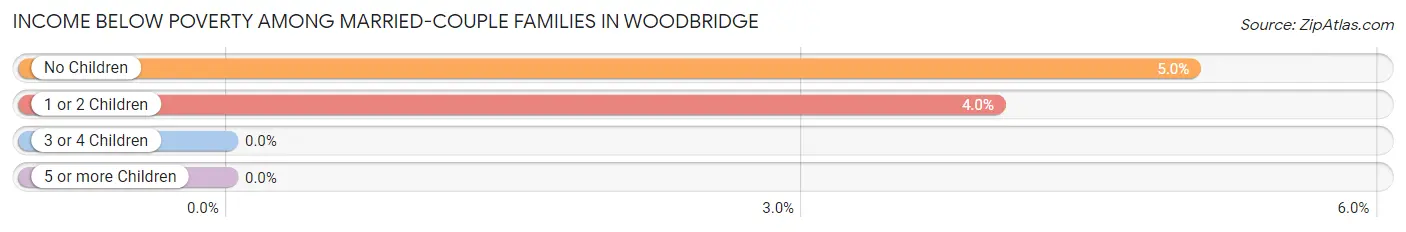
| Children | Above Poverty | Below Poverty |
| No Children | 623 (95.0%) | 33 (5.0%) |
| 1 or 2 Children | 263 (96.0%) | 11 (4.0%) |
| 3 or 4 Children | 74 (100.0%) | 0 (0.0%) |
| 5 or more Children | 0 (0.0%) | 0 (0.0%) |
| Total | 960 (95.6%) | 44 (4.4%) |
Income Below Poverty Among Single-Parent Households in Woodbridge
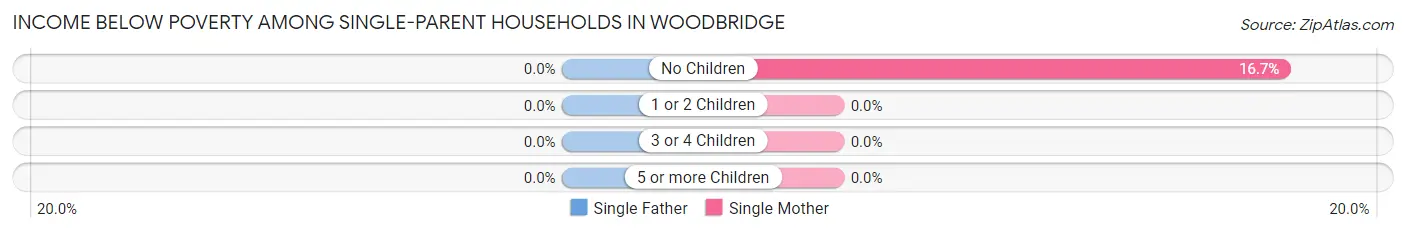
| Children | Single Father | Single Mother |
| No Children | 0 (0.0%) | 7 (16.7%) |
| 1 or 2 Children | 0 (0.0%) | 0 (0.0%) |
| 3 or 4 Children | 0 (0.0%) | 0 (0.0%) |
| 5 or more Children | 0 (0.0%) | 0 (0.0%) |
| Total | 0 (0.0%) | 7 (8.0%) |
Income Below Poverty Among Married-Couple vs Single-Parent Households in Woodbridge
The poverty data for Woodbridge shows that 44 of the married-couple family households (4.4%) and 7 of the single-parent households (7.4%) are living below the poverty level. Within the married-couple family households, those with no children have the highest poverty rate, with 33 households (5.0%) falling below the poverty line. Among the single-parent households, those with no children have the highest poverty rate, with 7 household (14.3%) living below poverty.
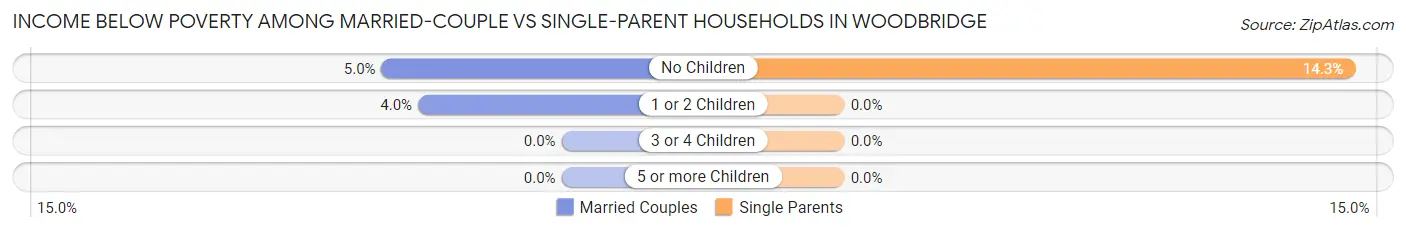
| Children | Married-Couple Families | Single-Parent Households |
| No Children | 33 (5.0%) | 7 (14.3%) |
| 1 or 2 Children | 11 (4.0%) | 0 (0.0%) |
| 3 or 4 Children | 0 (0.0%) | 0 (0.0%) |
| 5 or more Children | 0 (0.0%) | 0 (0.0%) |
| Total | 44 (4.4%) | 7 (7.4%) |
Race in Woodbridge
The most populous races in Woodbridge are White / Caucasian (2,843 | 73.5%), Hispanic or Latino (909 | 23.5%), and Two or more Races (683 | 17.6%).
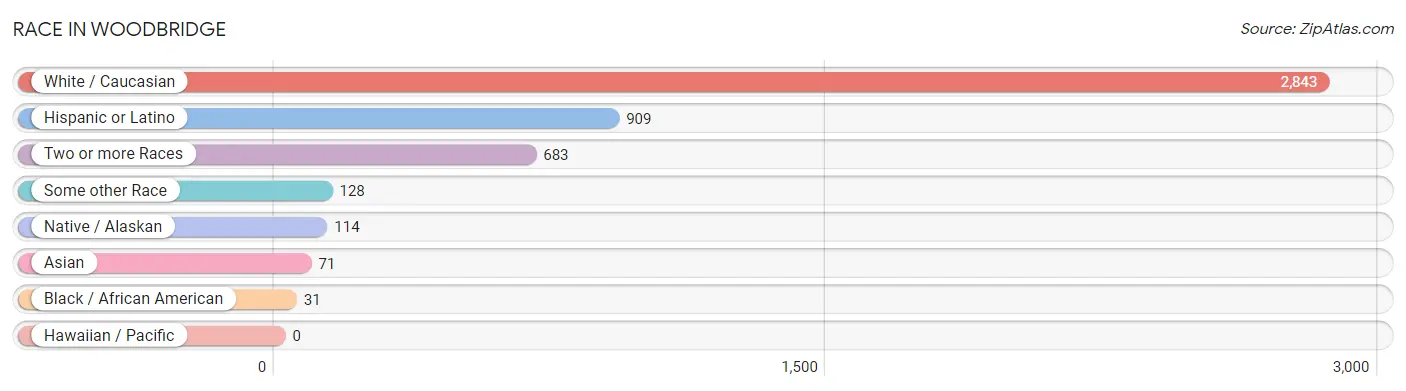
| Race | # Population | % Population |
| Asian | 71 | 1.8% |
| Black / African American | 31 | 0.8% |
| Hawaiian / Pacific | 0 | 0.0% |
| Hispanic or Latino | 909 | 23.5% |
| Native / Alaskan | 114 | 2.9% |
| White / Caucasian | 2,843 | 73.5% |
| Two or more Races | 683 | 17.6% |
| Some other Race | 128 | 3.3% |
| Total | 3,870 | 100.0% |
Ancestry in Woodbridge
The most populous ancestries reported in Woodbridge are German (973 | 25.1%), Mexican (778 | 20.1%), Irish (492 | 12.7%), English (441 | 11.4%), and Czech (217 | 5.6%), together accounting for 75.0% of all Woodbridge residents.
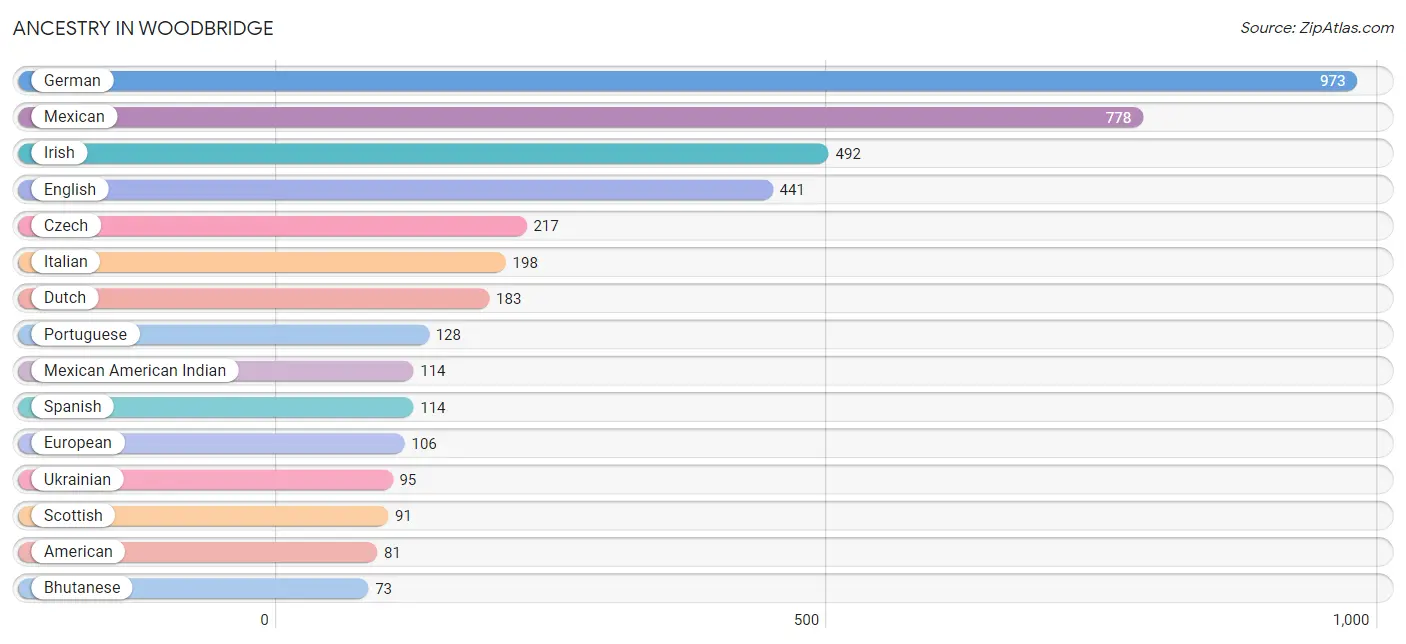
| Ancestry | # Population | % Population |
| American | 81 | 2.1% |
| Arab | 17 | 0.4% |
| Basque | 8 | 0.2% |
| Bhutanese | 73 | 1.9% |
| British | 13 | 0.3% |
| Canadian | 8 | 0.2% |
| Central American | 8 | 0.2% |
| Cherokee | 5 | 0.1% |
| Croatian | 44 | 1.1% |
| Czech | 217 | 5.6% |
| Danish | 21 | 0.5% |
| Dutch | 183 | 4.7% |
| English | 441 | 11.4% |
| European | 106 | 2.7% |
| French | 31 | 0.8% |
| French Canadian | 34 | 0.9% |
| German | 973 | 25.1% |
| Greek | 33 | 0.9% |
| Hungarian | 35 | 0.9% |
| Indian (Asian) | 23 | 0.6% |
| Irish | 492 | 12.7% |
| Italian | 198 | 5.1% |
| Japanese | 57 | 1.5% |
| Korean | 51 | 1.3% |
| Maltese | 14 | 0.4% |
| Mexican | 778 | 20.1% |
| Mexican American Indian | 114 | 2.9% |
| Northern European | 8 | 0.2% |
| Norwegian | 31 | 0.8% |
| Polish | 24 | 0.6% |
| Portuguese | 128 | 3.3% |
| Romanian | 6 | 0.2% |
| Russian | 30 | 0.8% |
| Salvadoran | 8 | 0.2% |
| Samoan | 40 | 1.0% |
| Scandinavian | 73 | 1.9% |
| Scotch-Irish | 50 | 1.3% |
| Scottish | 91 | 2.4% |
| Sioux | 6 | 0.2% |
| Spaniard | 9 | 0.2% |
| Spanish | 114 | 2.9% |
| Swedish | 66 | 1.7% |
| Swiss | 7 | 0.2% |
| Syrian | 17 | 0.4% |
| Ukrainian | 95 | 2.5% |
| Welsh | 24 | 0.6% | View All 46 Rows |
Immigrants in Woodbridge
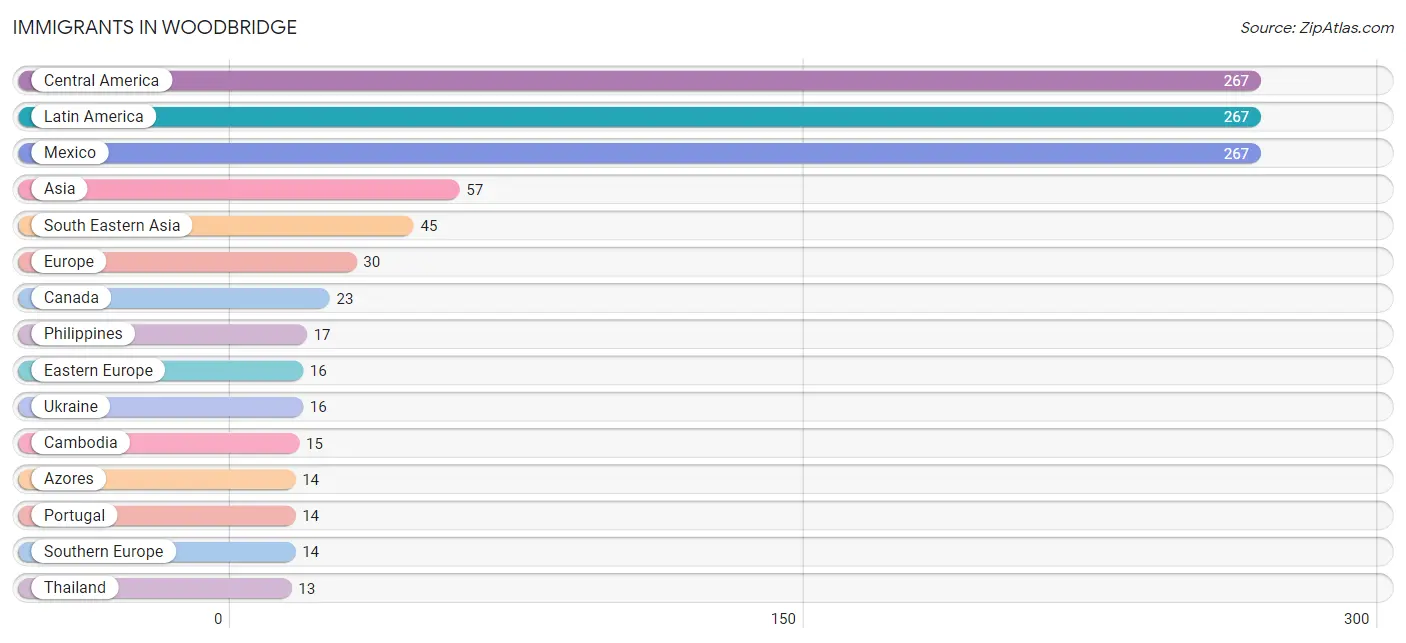
The most numerous immigrant groups reported in Woodbridge came from Central America (267 | 6.9%), Latin America (267 | 6.9%), Mexico (267 | 6.9%), Asia (57 | 1.5%), and South Eastern Asia (45 | 1.2%), together accounting for 23.3% of all Woodbridge residents.
| Immigration Origin | # Population | % Population |
| Asia | 57 | 1.5% |
| Azores | 14 | 0.4% |
| Cambodia | 15 | 0.4% |
| Canada | 23 | 0.6% |
| Central America | 267 | 6.9% |
| Eastern Asia | 12 | 0.3% |
| Eastern Europe | 16 | 0.4% |
| Europe | 30 | 0.8% |
| Japan | 12 | 0.3% |
| Latin America | 267 | 6.9% |
| Mexico | 267 | 6.9% |
| Philippines | 17 | 0.4% |
| Portugal | 14 | 0.4% |
| South Eastern Asia | 45 | 1.2% |
| Southern Europe | 14 | 0.4% |
| Thailand | 13 | 0.3% |
| Ukraine | 16 | 0.4% | View All 17 Rows |
Sex and Age in Woodbridge
Sex and Age in Woodbridge
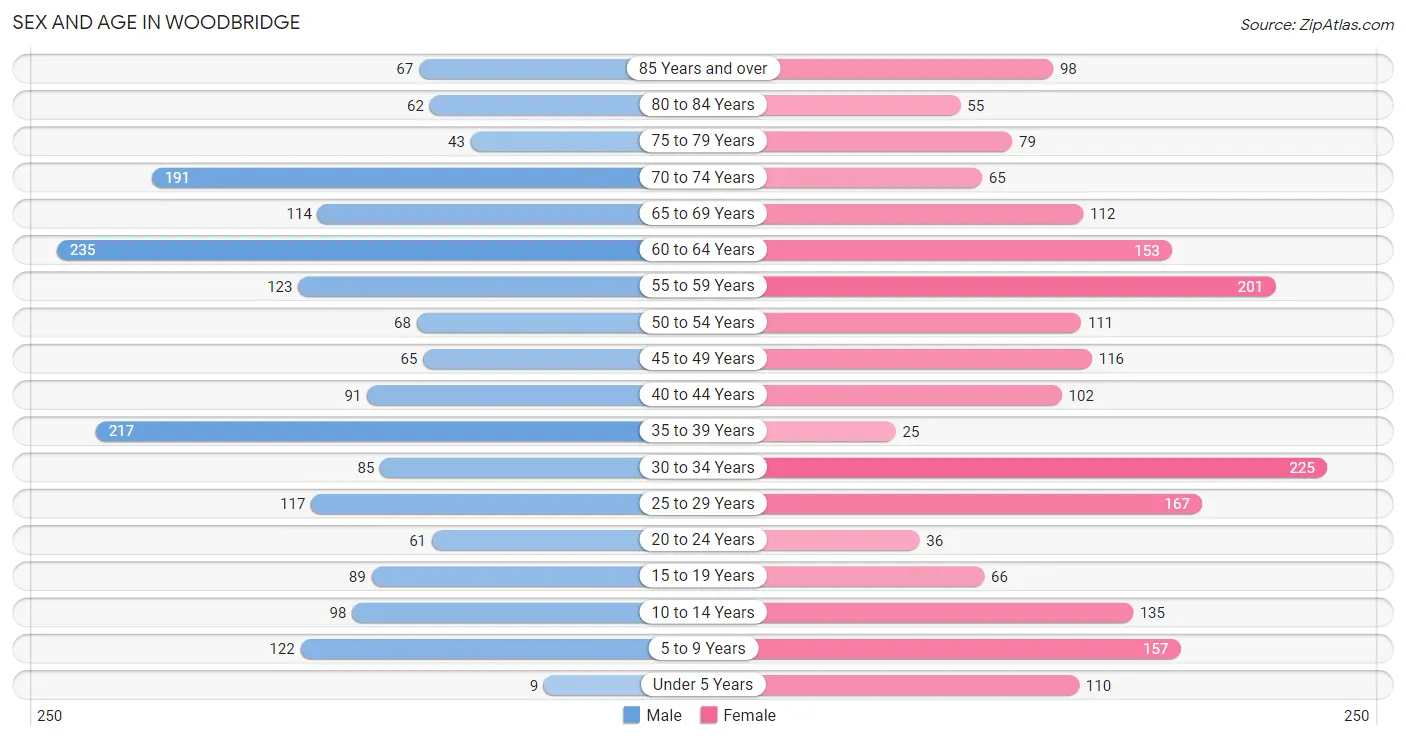
The most populous age groups in Woodbridge are 60 to 64 Years (235 | 12.7%) for men and 30 to 34 Years (225 | 11.2%) for women.
| Age Bracket | Male | Female |
| Under 5 Years | 9 (0.5%) | 110 (5.5%) |
| 5 to 9 Years | 122 (6.6%) | 157 (7.8%) |
| 10 to 14 Years | 98 (5.3%) | 135 (6.7%) |
| 15 to 19 Years | 89 (4.8%) | 66 (3.3%) |
| 20 to 24 Years | 61 (3.3%) | 36 (1.8%) |
| 25 to 29 Years | 117 (6.3%) | 167 (8.3%) |
| 30 to 34 Years | 85 (4.6%) | 225 (11.2%) |
| 35 to 39 Years | 217 (11.7%) | 25 (1.2%) |
| 40 to 44 Years | 91 (4.9%) | 102 (5.1%) |
| 45 to 49 Years | 65 (3.5%) | 116 (5.8%) |
| 50 to 54 Years | 68 (3.7%) | 111 (5.5%) |
| 55 to 59 Years | 123 (6.6%) | 201 (10.0%) |
| 60 to 64 Years | 235 (12.7%) | 153 (7.6%) |
| 65 to 69 Years | 114 (6.1%) | 112 (5.6%) |
| 70 to 74 Years | 191 (10.3%) | 65 (3.2%) |
| 75 to 79 Years | 43 (2.3%) | 79 (3.9%) |
| 80 to 84 Years | 62 (3.3%) | 55 (2.7%) |
| 85 Years and over | 67 (3.6%) | 98 (4.9%) |
| Total | 1,857 (100.0%) | 2,013 (100.0%) |
Families and Households in Woodbridge
Median Family Size in Woodbridge
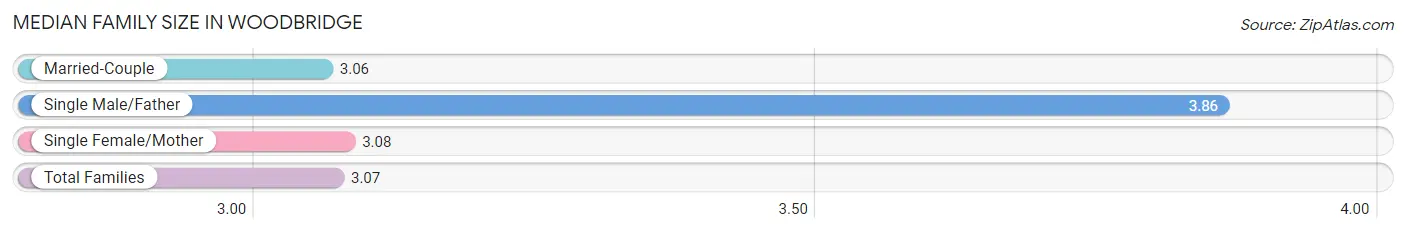
The median family size in Woodbridge is 3.07 persons per family, with single male/father families (7 | 0.6%) accounting for the largest median family size of 3.86 persons per family. On the other hand, married-couple families (1,004 | 91.4%) represent the smallest median family size with 3.06 persons per family.
| Family Type | # Families | Family Size |
| Married-Couple | 1,004 (91.4%) | 3.06 |
| Single Male/Father | 7 (0.6%) | 3.86 |
| Single Female/Mother | 88 (8.0%) | 3.08 |
| Total Families | 1,099 (100.0%) | 3.07 |
Median Household Size in Woodbridge
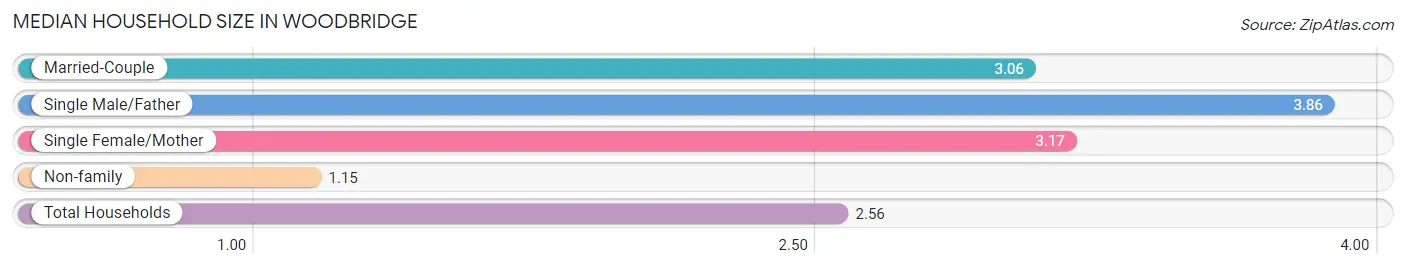
The median household size in Woodbridge is 2.56 persons per household, with single male/father households (7 | 0.5%) accounting for the largest median household size of 3.86 persons per household. non-family households (397 | 26.5%) represent the smallest median household size with 1.15 persons per household.
| Household Type | # Households | Household Size |
| Married-Couple | 1,004 (67.1%) | 3.06 |
| Single Male/Father | 7 (0.5%) | 3.86 |
| Single Female/Mother | 88 (5.9%) | 3.17 |
| Non-family | 397 (26.5%) | 1.15 |
| Total Households | 1,496 (100.0%) | 2.56 |
Household Size by Marriage Status in Woodbridge
Out of a total of 1,496 households in Woodbridge, 1,099 (73.5%) are family households, while 397 (26.5%) are nonfamily households. The most numerous type of family households are 2-person households, comprising 581, and the most common type of nonfamily households are 1-person households, comprising 347.
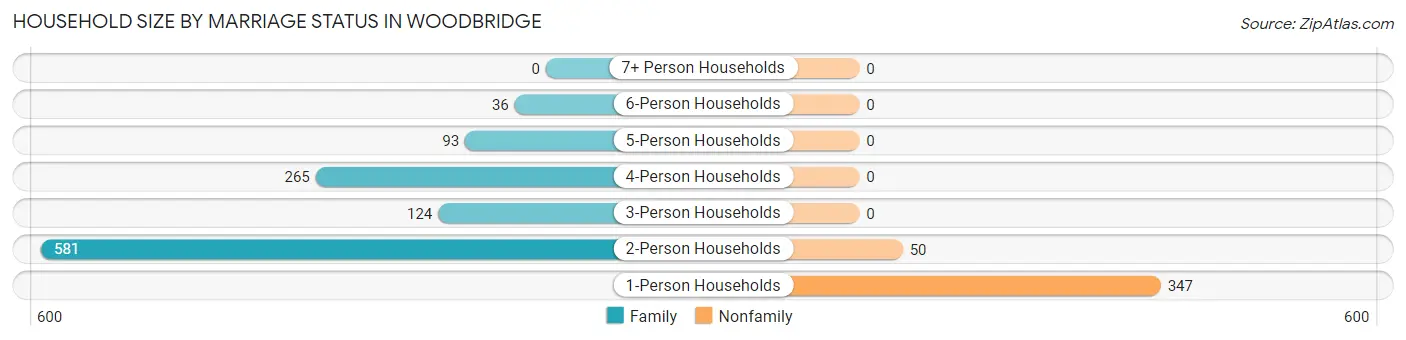
| Household Size | Family Households | Nonfamily Households |
| 1-Person Households | - | 347 (23.2%) |
| 2-Person Households | 581 (38.8%) | 50 (3.3%) |
| 3-Person Households | 124 (8.3%) | 0 (0.0%) |
| 4-Person Households | 265 (17.7%) | 0 (0.0%) |
| 5-Person Households | 93 (6.2%) | 0 (0.0%) |
| 6-Person Households | 36 (2.4%) | 0 (0.0%) |
| 7+ Person Households | 0 (0.0%) | 0 (0.0%) |
| Total | 1,099 (73.5%) | 397 (26.5%) |
Female Fertility in Woodbridge
Fertility by Age in Woodbridge
| Age Bracket | Women with Births | Births / 1,000 Women |
| 15 to 19 years | 0 (0.0%) | 0.0 |
| 20 to 34 years | 0 (0.0%) | 0.0 |
| 35 to 50 years | 0 (0.0%) | 0.0 |
| Total | 0 (0.0%) | 0.0 |
Fertility by Age by Marriage Status in Woodbridge
| Age Bracket | Married | Unmarried |
| 15 to 19 years | 0 (0.0%) | 0 (0.0%) |
| 20 to 34 years | 0 (0.0%) | 0 (0.0%) |
| 35 to 50 years | 0 (0.0%) | 0 (0.0%) |
| Total | 0 (0.0%) | 0 (0.0%) |
Fertility by Education in Woodbridge
| Educational Attainment | Women with Births | Births / 1,000 Women |
| Less than High School | 0 (0.0%) | 0.0 |
| High School Diploma | 0 (0.0%) | 0.0 |
| College or Associate's Degree | 0 (0.0%) | 0.0 |
| Bachelor's Degree | 0 (0.0%) | 0.0 |
| Graduate Degree | 0 (0.0%) | 0.0 |
| Total | 0 (0.0%) | 0.0 |
Fertility by Education by Marriage Status in Woodbridge
| Educational Attainment | Married | Unmarried |
| Less than High School | 0 (0.0%) | 0 (0.0%) |
| High School Diploma | 0 (0.0%) | 0 (0.0%) |
| College or Associate's Degree | 0 (0.0%) | 0 (0.0%) |
| Bachelor's Degree | 0 (0.0%) | 0 (0.0%) |
| Graduate Degree | 0 (0.0%) | 0 (0.0%) |
| Total | 0 (0.0%) | 0 (0.0%) |
Employment Characteristics in Woodbridge
Employment by Class of Employer in Woodbridge
Among the 1,768 employed individuals in Woodbridge, private company employees (1,068 | 60.4%), state government employees (200 | 11.3%), and not-for-profit organizations (193 | 10.9%) make up the most common classes of employment.
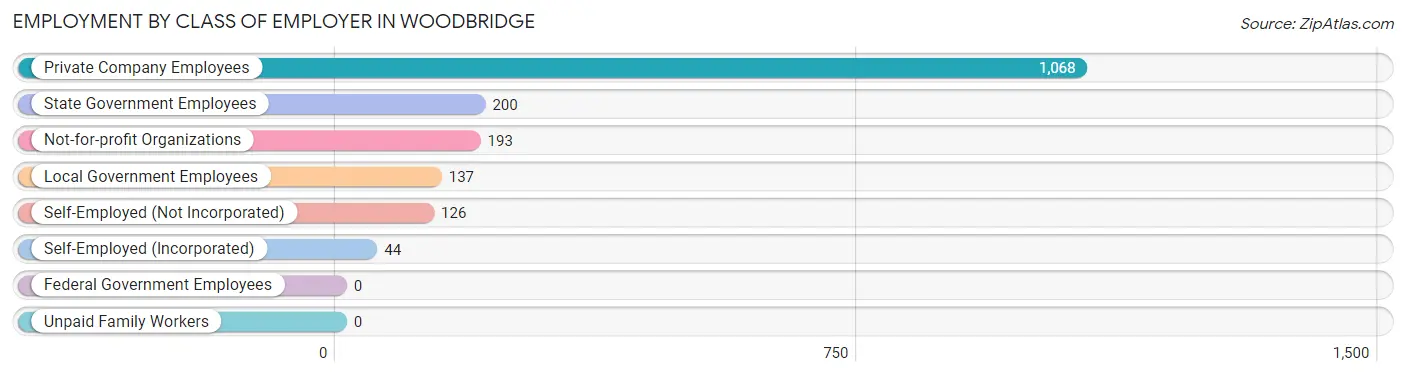
| Employer Class | # Employees | % Employees |
| Private Company Employees | 1,068 | 60.4% |
| Self-Employed (Incorporated) | 44 | 2.5% |
| Self-Employed (Not Incorporated) | 126 | 7.1% |
| Not-for-profit Organizations | 193 | 10.9% |
| Local Government Employees | 137 | 7.7% |
| State Government Employees | 200 | 11.3% |
| Federal Government Employees | 0 | 0.0% |
| Unpaid Family Workers | 0 | 0.0% |
| Total | 1,768 | 100.0% |
Employment Status by Age in Woodbridge
According to the labor force statistics for Woodbridge, out of the total population over 16 years of age (3,222), 61.0% or 1,965 individuals are in the labor force, with 4.0% or 79 of them unemployed. The age group with the highest labor force participation rate is 35 to 44 years, with 97.7% or 425 individuals in the labor force. Within the labor force, the 16 to 19 years age range has the highest percentage of unemployed individuals, with 35.8% or 24 of them being unemployed.
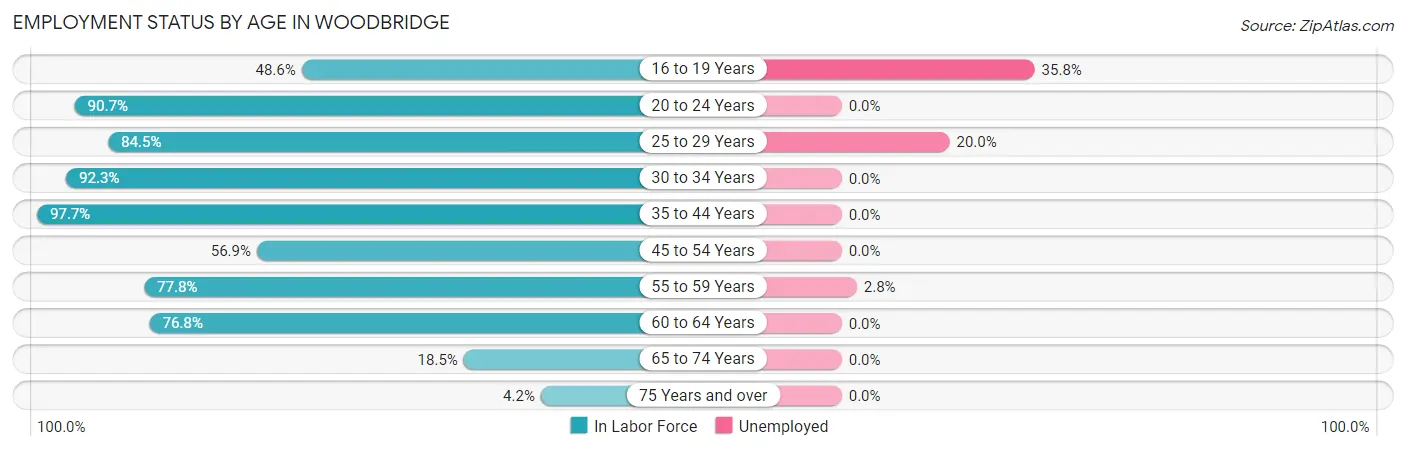
| Age Bracket | In Labor Force | Unemployed |
| 16 to 19 Years | 67 (48.6%) | 24 (35.8%) |
| 20 to 24 Years | 88 (90.7%) | 0 (0.0%) |
| 25 to 29 Years | 240 (84.5%) | 48 (20.0%) |
| 30 to 34 Years | 286 (92.3%) | 0 (0.0%) |
| 35 to 44 Years | 425 (97.7%) | 0 (0.0%) |
| 45 to 54 Years | 205 (56.9%) | 0 (0.0%) |
| 55 to 59 Years | 252 (77.8%) | 7 (2.8%) |
| 60 to 64 Years | 298 (76.8%) | 0 (0.0%) |
| 65 to 74 Years | 89 (18.5%) | 0 (0.0%) |
| 75 Years and over | 17 (4.2%) | 0 (0.0%) |
| Total | 1,965 (61.0%) | 79 (4.0%) |
Employment Status by Educational Attainment in Woodbridge
According to labor force statistics for Woodbridge, 81.2% of individuals (1,706) out of the total population between 25 and 64 years of age (2,101) are in the labor force, with 3.2% or 55 of them being unemployed. The group with the highest labor force participation rate are those with the educational attainment of college / associate degree, with 89.9% or 751 individuals in the labor force. Within the labor force, individuals with less than high school education have the highest percentage of unemployment, with 3.9% or 7 of them being unemployed.
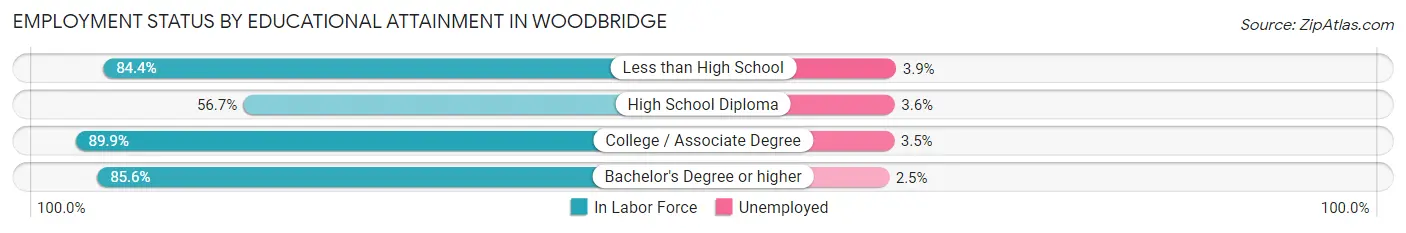
| Educational Attainment | In Labor Force | Unemployed |
| Less than High School | 178 (84.4%) | 8 (3.9%) |
| High School Diploma | 247 (56.7%) | 16 (3.6%) |
| College / Associate Degree | 751 (89.9%) | 29 (3.5%) |
| Bachelor's Degree or higher | 530 (85.6%) | 15 (2.5%) |
| Total | 1,706 (81.2%) | 67 (3.2%) |
Employment Occupations by Sex in Woodbridge
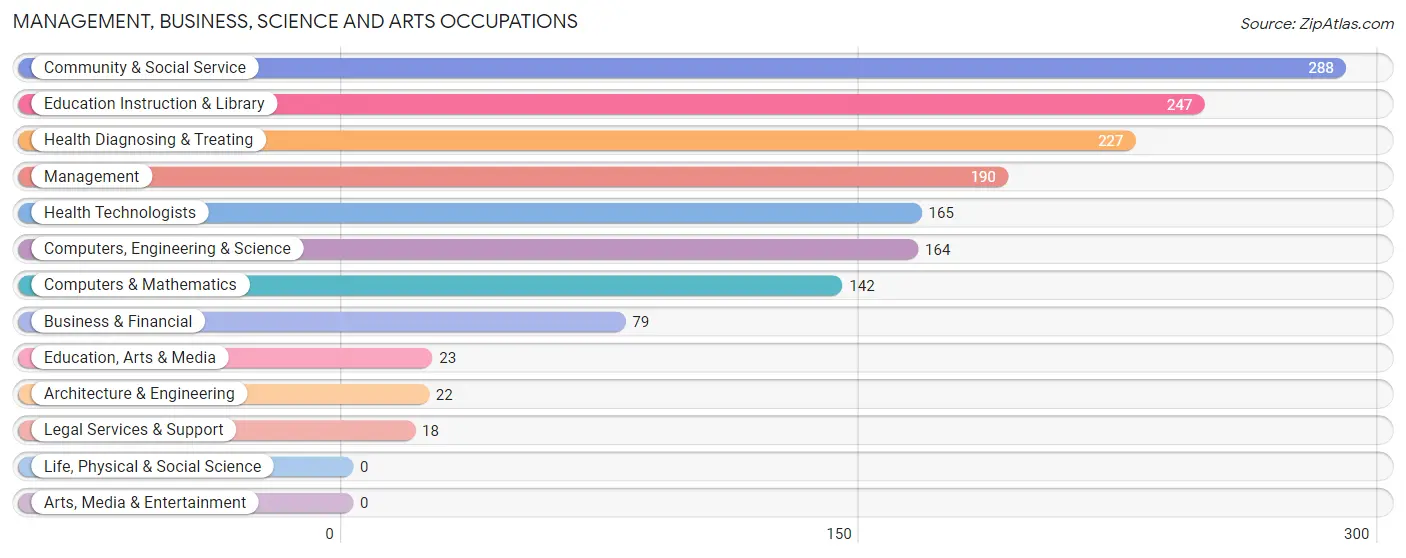
Management, Business, Science and Arts Occupations
The most common Management, Business, Science and Arts occupations in Woodbridge are Community & Social Service (288 | 15.2%), Education Instruction & Library (247 | 13.1%), Health Diagnosing & Treating (227 | 12.0%), Management (190 | 10.1%), and Health Technologists (165 | 8.7%).
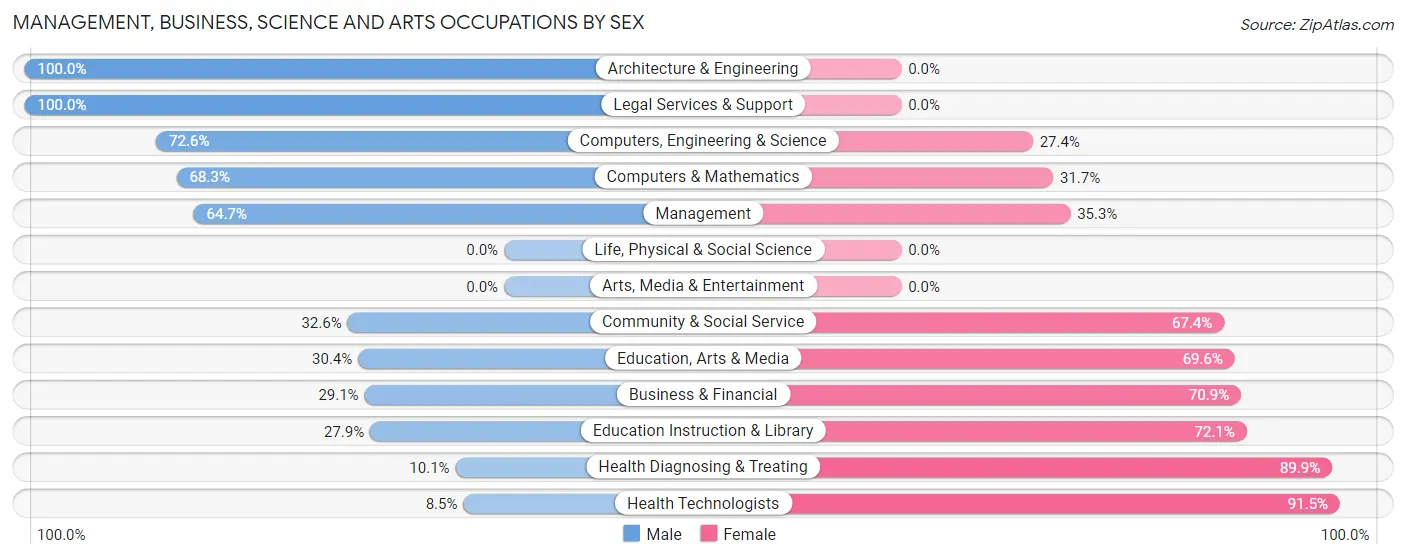
Management, Business, Science and Arts Occupations by Sex
Within the Management, Business, Science and Arts occupations in Woodbridge, the most male-oriented occupations are Architecture & Engineering (100.0%), Legal Services & Support (100.0%), and Computers, Engineering & Science (72.6%), while the most female-oriented occupations are Health Technologists (91.5%), Health Diagnosing & Treating (89.9%), and Education Instruction & Library (72.1%).
| Occupation | Male | Female |
| Management | 123 (64.7%) | 67 (35.3%) |
| Business & Financial | 23 (29.1%) | 56 (70.9%) |
| Computers, Engineering & Science | 119 (72.6%) | 45 (27.4%) |
| Computers & Mathematics | 97 (68.3%) | 45 (31.7%) |
| Architecture & Engineering | 22 (100.0%) | 0 (0.0%) |
| Life, Physical & Social Science | 0 (0.0%) | 0 (0.0%) |
| Community & Social Service | 94 (32.6%) | 194 (67.4%) |
| Education, Arts & Media | 7 (30.4%) | 16 (69.6%) |
| Legal Services & Support | 18 (100.0%) | 0 (0.0%) |
| Education Instruction & Library | 69 (27.9%) | 178 (72.1%) |
| Arts, Media & Entertainment | 0 (0.0%) | 0 (0.0%) |
| Health Diagnosing & Treating | 23 (10.1%) | 204 (89.9%) |
| Health Technologists | 14 (8.5%) | 151 (91.5%) |
| Total (Category) | 382 (40.3%) | 566 (59.7%) |
| Total (Overall) | 986 (52.2%) | 902 (47.8%) |
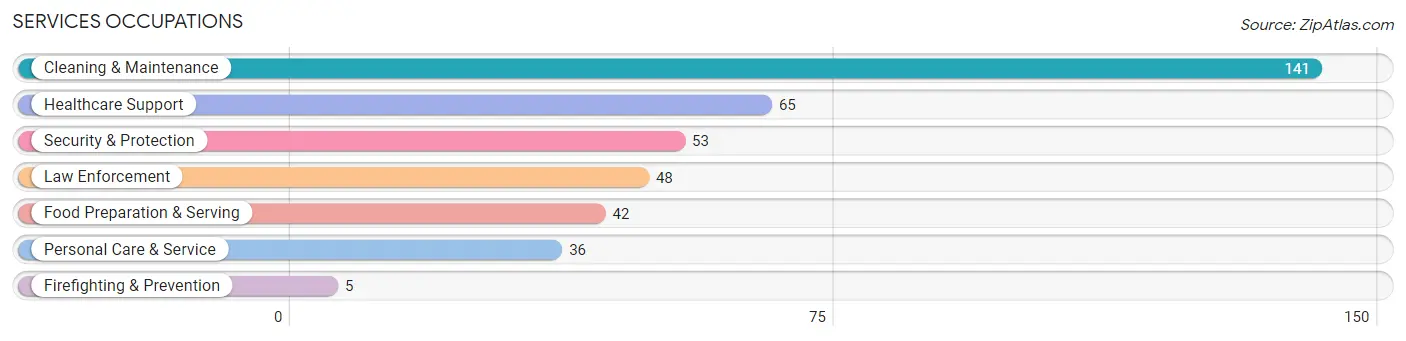
Services Occupations
The most common Services occupations in Woodbridge are Cleaning & Maintenance (141 | 7.5%), Healthcare Support (65 | 3.4%), Security & Protection (53 | 2.8%), Law Enforcement (48 | 2.5%), and Food Preparation & Serving (42 | 2.2%).
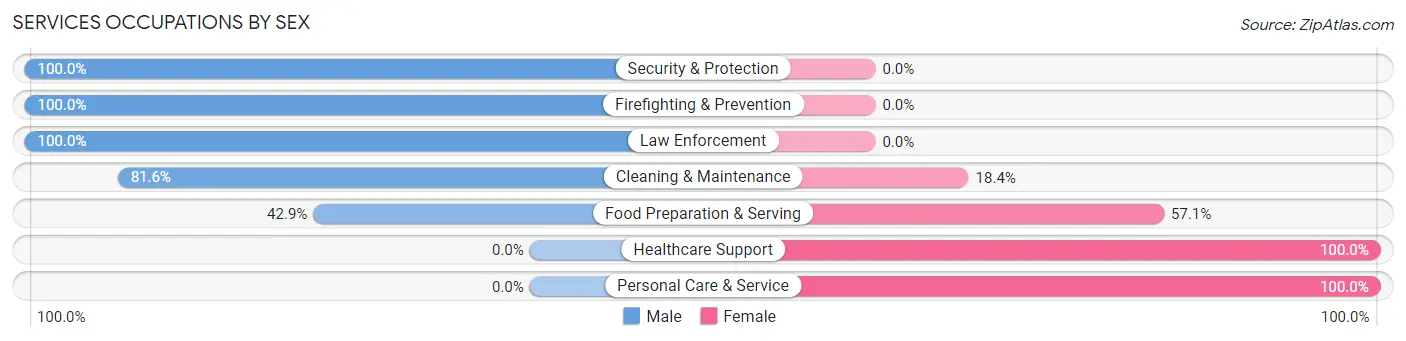
Services Occupations by Sex
Within the Services occupations in Woodbridge, the most male-oriented occupations are Security & Protection (100.0%), Firefighting & Prevention (100.0%), and Law Enforcement (100.0%), while the most female-oriented occupations are Healthcare Support (100.0%), Personal Care & Service (100.0%), and Food Preparation & Serving (57.1%).
| Occupation | Male | Female |
| Healthcare Support | 0 (0.0%) | 65 (100.0%) |
| Security & Protection | 53 (100.0%) | 0 (0.0%) |
| Firefighting & Prevention | 5 (100.0%) | 0 (0.0%) |
| Law Enforcement | 48 (100.0%) | 0 (0.0%) |
| Food Preparation & Serving | 18 (42.9%) | 24 (57.1%) |
| Cleaning & Maintenance | 115 (81.6%) | 26 (18.4%) |
| Personal Care & Service | 0 (0.0%) | 36 (100.0%) |
| Total (Category) | 186 (55.2%) | 151 (44.8%) |
| Total (Overall) | 986 (52.2%) | 902 (47.8%) |
Sales and Office Occupations
The most common Sales and Office occupations in Woodbridge are Sales & Related (176 | 9.3%), and Office & Administration (109 | 5.8%).
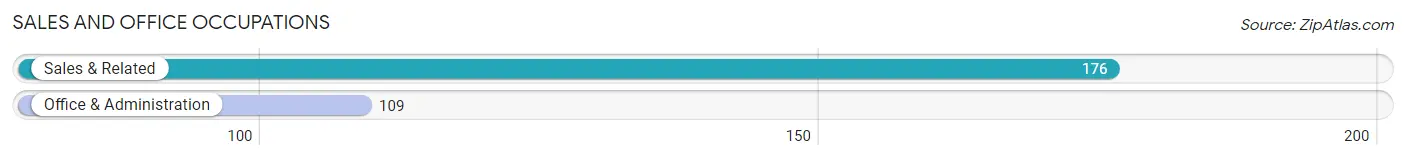
Sales and Office Occupations by Sex

| Occupation | Male | Female |
| Sales & Related | 146 (83.0%) | 30 (17.1%) |
| Office & Administration | 25 (22.9%) | 84 (77.1%) |
| Total (Category) | 171 (60.0%) | 114 (40.0%) |
| Total (Overall) | 986 (52.2%) | 902 (47.8%) |
Natural Resources, Construction and Maintenance Occupations
The most common Natural Resources, Construction and Maintenance occupations in Woodbridge are Construction & Extraction (60 | 3.2%), Installation, Maintenance & Repair (42 | 2.2%), and Farming, Fishing & Forestry (24 | 1.3%).
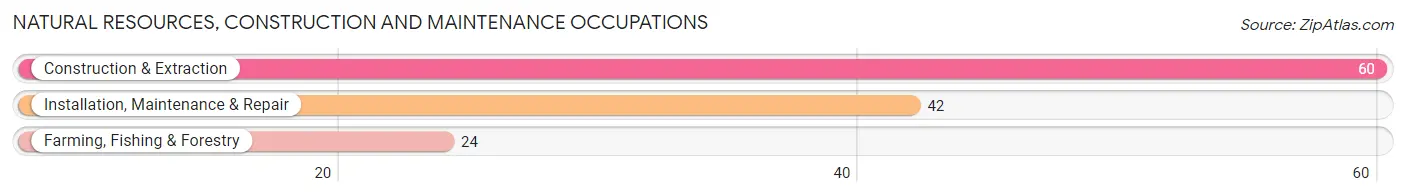
Natural Resources, Construction and Maintenance Occupations by Sex
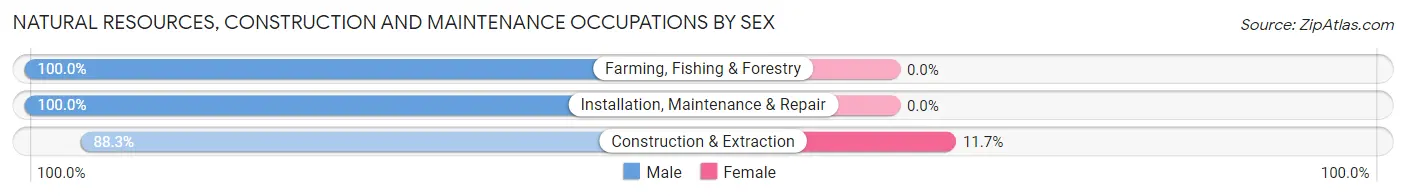
| Occupation | Male | Female |
| Farming, Fishing & Forestry | 24 (100.0%) | 0 (0.0%) |
| Construction & Extraction | 53 (88.3%) | 7 (11.7%) |
| Installation, Maintenance & Repair | 42 (100.0%) | 0 (0.0%) |
| Total (Category) | 119 (94.4%) | 7 (5.6%) |
| Total (Overall) | 986 (52.2%) | 902 (47.8%) |
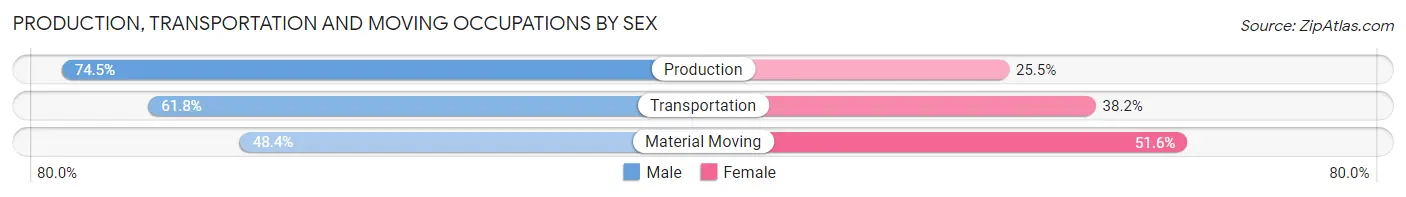
Production, Transportation and Moving Occupations
The most common Production, Transportation and Moving occupations in Woodbridge are Production (106 | 5.6%), Transportation (55 | 2.9%), and Material Moving (31 | 1.6%).
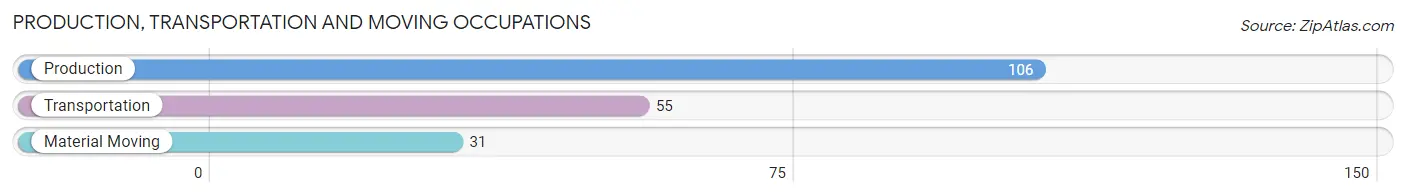
Production, Transportation and Moving Occupations by Sex
| Occupation | Male | Female |
| Production | 79 (74.5%) | 27 (25.5%) |
| Transportation | 34 (61.8%) | 21 (38.2%) |
| Material Moving | 15 (48.4%) | 16 (51.6%) |
| Total (Category) | 128 (66.7%) | 64 (33.3%) |
| Total (Overall) | 986 (52.2%) | 902 (47.8%) |
Employment Industries by Sex in Woodbridge
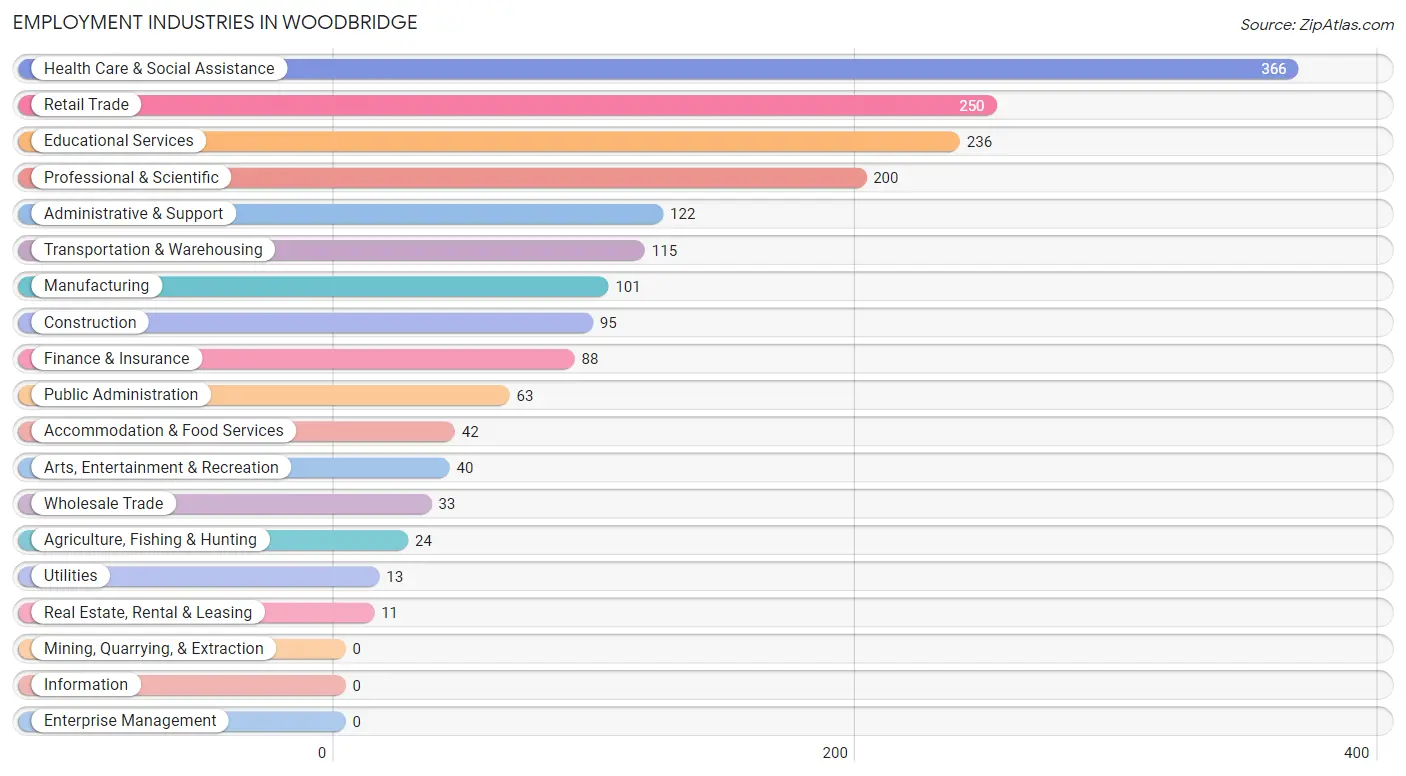
Employment Industries in Woodbridge
The major employment industries in Woodbridge include Health Care & Social Assistance (366 | 19.4%), Retail Trade (250 | 13.2%), Educational Services (236 | 12.5%), Professional & Scientific (200 | 10.6%), and Administrative & Support (122 | 6.5%).
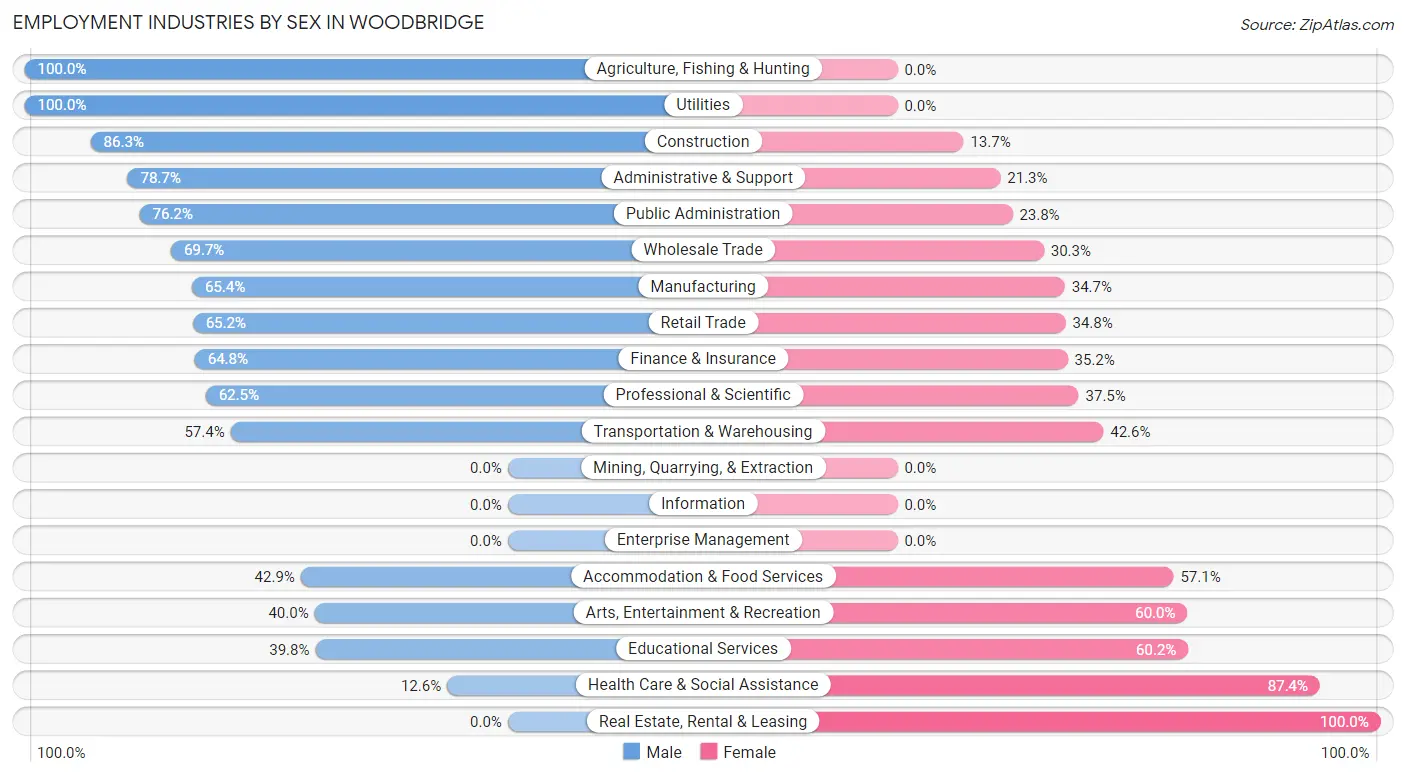
Employment Industries by Sex in Woodbridge
The Woodbridge industries that see more men than women are Agriculture, Fishing & Hunting (100.0%), Utilities (100.0%), and Construction (86.3%), whereas the industries that tend to have a higher number of women are Real Estate, Rental & Leasing (100.0%), Health Care & Social Assistance (87.4%), and Educational Services (60.2%).
| Industry | Male | Female |
| Agriculture, Fishing & Hunting | 24 (100.0%) | 0 (0.0%) |
| Mining, Quarrying, & Extraction | 0 (0.0%) | 0 (0.0%) |
| Construction | 82 (86.3%) | 13 (13.7%) |
| Manufacturing | 66 (65.3%) | 35 (34.6%) |
| Wholesale Trade | 23 (69.7%) | 10 (30.3%) |
| Retail Trade | 163 (65.2%) | 87 (34.8%) |
| Transportation & Warehousing | 66 (57.4%) | 49 (42.6%) |
| Utilities | 13 (100.0%) | 0 (0.0%) |
| Information | 0 (0.0%) | 0 (0.0%) |
| Finance & Insurance | 57 (64.8%) | 31 (35.2%) |
| Real Estate, Rental & Leasing | 0 (0.0%) | 11 (100.0%) |
| Professional & Scientific | 125 (62.5%) | 75 (37.5%) |
| Enterprise Management | 0 (0.0%) | 0 (0.0%) |
| Administrative & Support | 96 (78.7%) | 26 (21.3%) |
| Educational Services | 94 (39.8%) | 142 (60.2%) |
| Health Care & Social Assistance | 46 (12.6%) | 320 (87.4%) |
| Arts, Entertainment & Recreation | 16 (40.0%) | 24 (60.0%) |
| Accommodation & Food Services | 18 (42.9%) | 24 (57.1%) |
| Public Administration | 48 (76.2%) | 15 (23.8%) |
| Total | 986 (52.2%) | 902 (47.8%) |
Education in Woodbridge
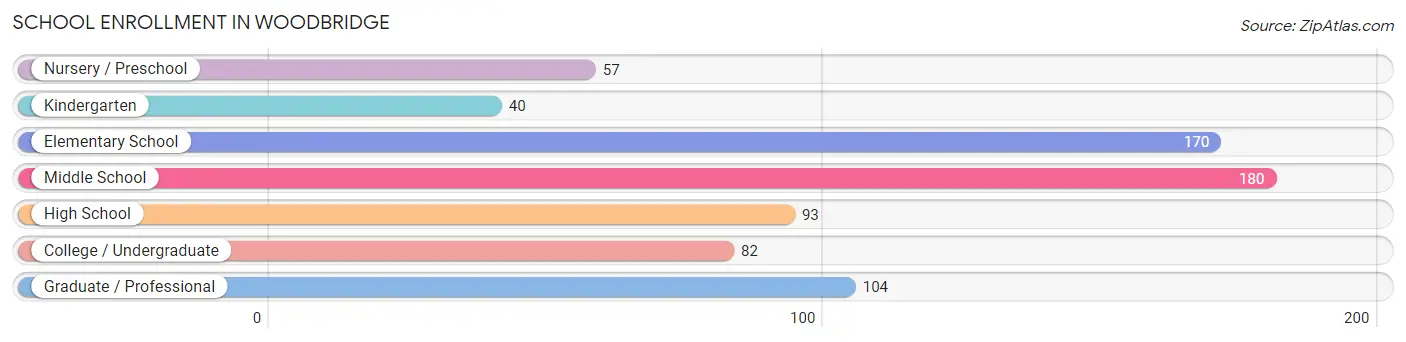
School Enrollment in Woodbridge
The most common levels of schooling among the 726 students in Woodbridge are middle school (180 | 24.8%), elementary school (170 | 23.4%), and graduate / professional (104 | 14.3%).
| School Level | # Students | % Students |
| Nursery / Preschool | 57 | 7.9% |
| Kindergarten | 40 | 5.5% |
| Elementary School | 170 | 23.4% |
| Middle School | 180 | 24.8% |
| High School | 93 | 12.8% |
| College / Undergraduate | 82 | 11.3% |
| Graduate / Professional | 104 | 14.3% |
| Total | 726 | 100.0% |
School Enrollment by Age by Funding Source in Woodbridge
Out of a total of 726 students who are enrolled in schools in Woodbridge, 231 (31.8%) attend a private institution, while the remaining 495 (68.2%) are enrolled in public schools. The age group of 35 years and over has the highest likelihood of being enrolled in private schools, with 7 (100.0% in the age bracket) enrolled. Conversely, the age group of 15 to 17 year olds has the lowest likelihood of being enrolled in a private school, with 67 (100.0% in the age bracket) attending a public institution.
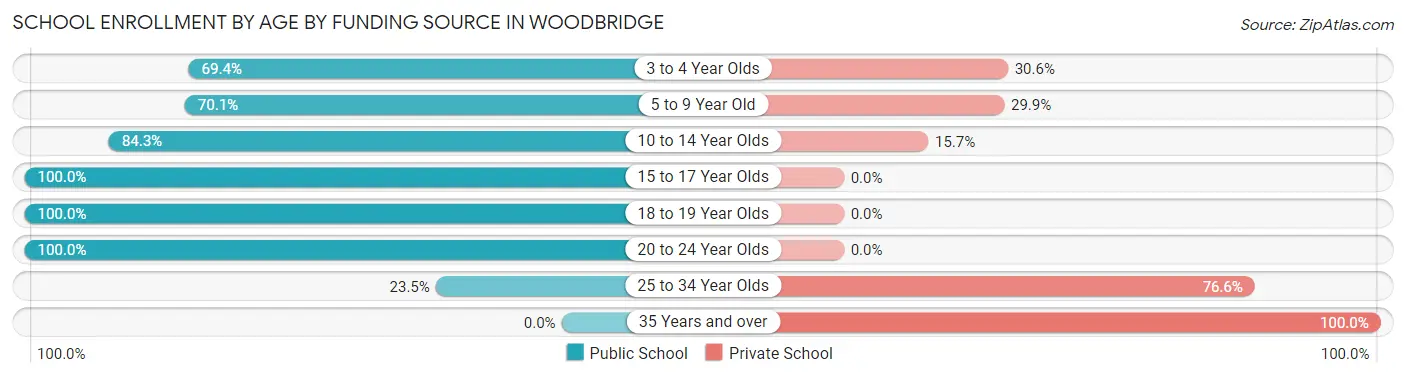
| Age Bracket | Public School | Private School |
| 3 to 4 Year Olds | 25 (69.4%) | 11 (30.6%) |
| 5 to 9 Year Old | 162 (70.1%) | 69 (29.9%) |
| 10 to 14 Year Olds | 177 (84.3%) | 33 (15.7%) |
| 15 to 17 Year Olds | 67 (100.0%) | 0 (0.0%) |
| 18 to 19 Year Olds | 13 (100.0%) | 0 (0.0%) |
| 20 to 24 Year Olds | 17 (100.0%) | 0 (0.0%) |
| 25 to 34 Year Olds | 34 (23.4%) | 111 (76.5%) |
| 35 Years and over | 0 (0.0%) | 7 (100.0%) |
| Total | 495 (68.2%) | 231 (31.8%) |
Educational Attainment by Field of Study in Woodbridge
Business (203 | 24.0%), liberal arts & history (162 | 19.2%), science & technology (110 | 13.0%), education (98 | 11.6%), and social sciences (89 | 10.5%) are the most common fields of study among 846 individuals in Woodbridge who have obtained a bachelor's degree or higher.
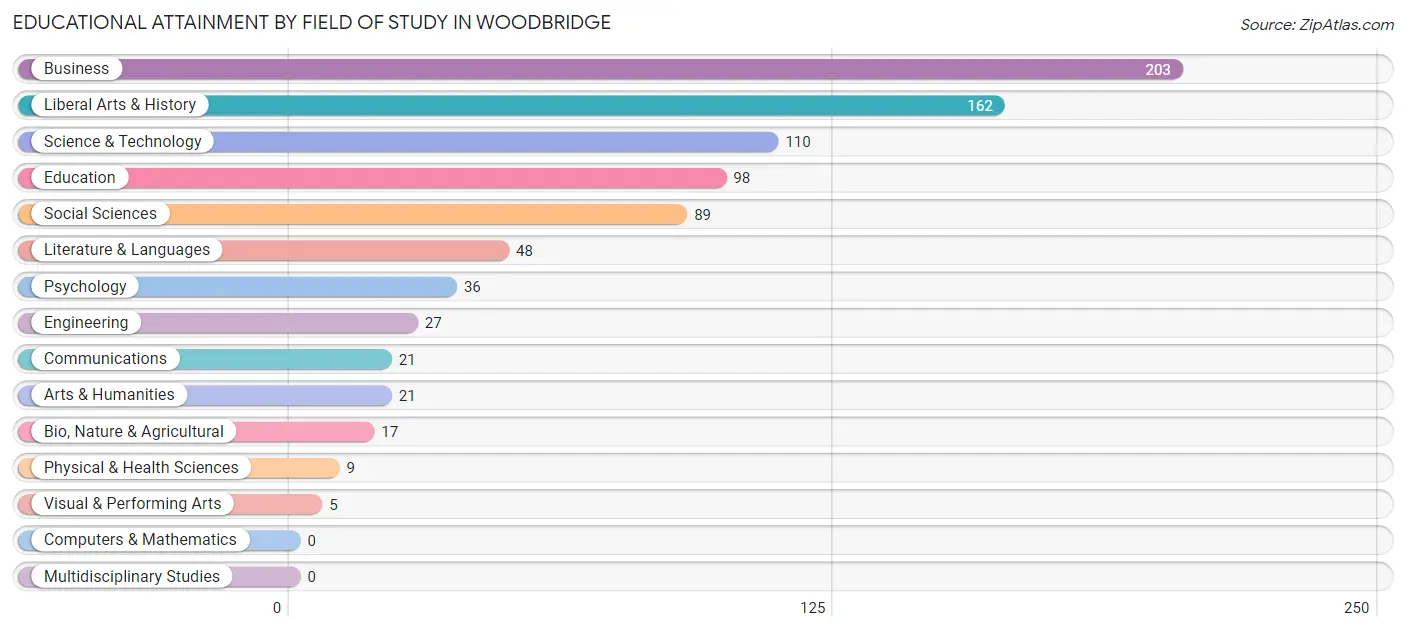
| Field of Study | # Graduates | % Graduates |
| Computers & Mathematics | 0 | 0.0% |
| Bio, Nature & Agricultural | 17 | 2.0% |
| Physical & Health Sciences | 9 | 1.1% |
| Psychology | 36 | 4.3% |
| Social Sciences | 89 | 10.5% |
| Engineering | 27 | 3.2% |
| Multidisciplinary Studies | 0 | 0.0% |
| Science & Technology | 110 | 13.0% |
| Business | 203 | 24.0% |
| Education | 98 | 11.6% |
| Literature & Languages | 48 | 5.7% |
| Liberal Arts & History | 162 | 19.2% |
| Visual & Performing Arts | 5 | 0.6% |
| Communications | 21 | 2.5% |
| Arts & Humanities | 21 | 2.5% |
| Total | 846 | 100.0% |
Transportation & Commute in Woodbridge
Vehicle Availability by Sex in Woodbridge
The most prevalent vehicle ownership categories in Woodbridge are males with 2 vehicles (291, accounting for 33.0%) and females with 2 vehicles (359, making up 33.2%).
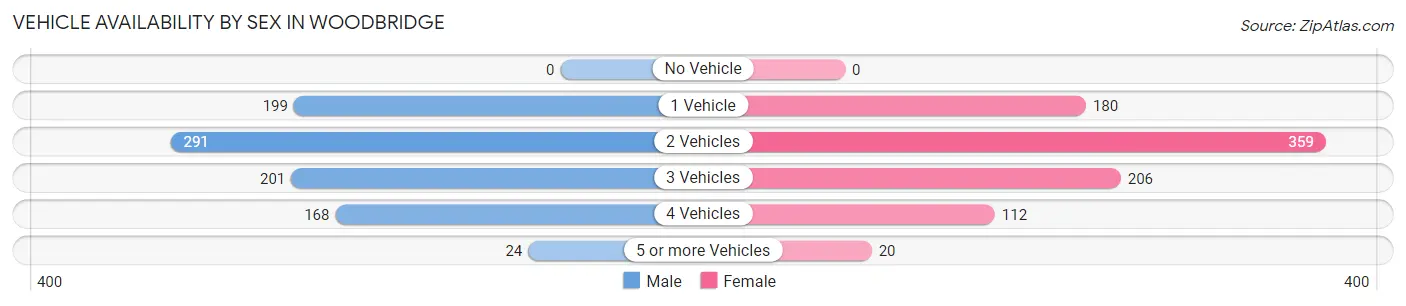
| Vehicles Available | Male | Female |
| No Vehicle | 0 (0.0%) | 0 (0.0%) |
| 1 Vehicle | 199 (22.5%) | 180 (20.5%) |
| 2 Vehicles | 291 (33.0%) | 359 (40.9%) |
| 3 Vehicles | 201 (22.8%) | 206 (23.5%) |
| 4 Vehicles | 168 (19.0%) | 112 (12.8%) |
| 5 or more Vehicles | 24 (2.7%) | 20 (2.3%) |
| Total | 883 (100.0%) | 877 (100.0%) |
Commute Time in Woodbridge
The most frequently occuring commute durations in Woodbridge are 15 to 19 minutes (303 commuters, 21.4%), 10 to 14 minutes (289 commuters, 20.4%), and 30 to 34 minutes (211 commuters, 14.9%).
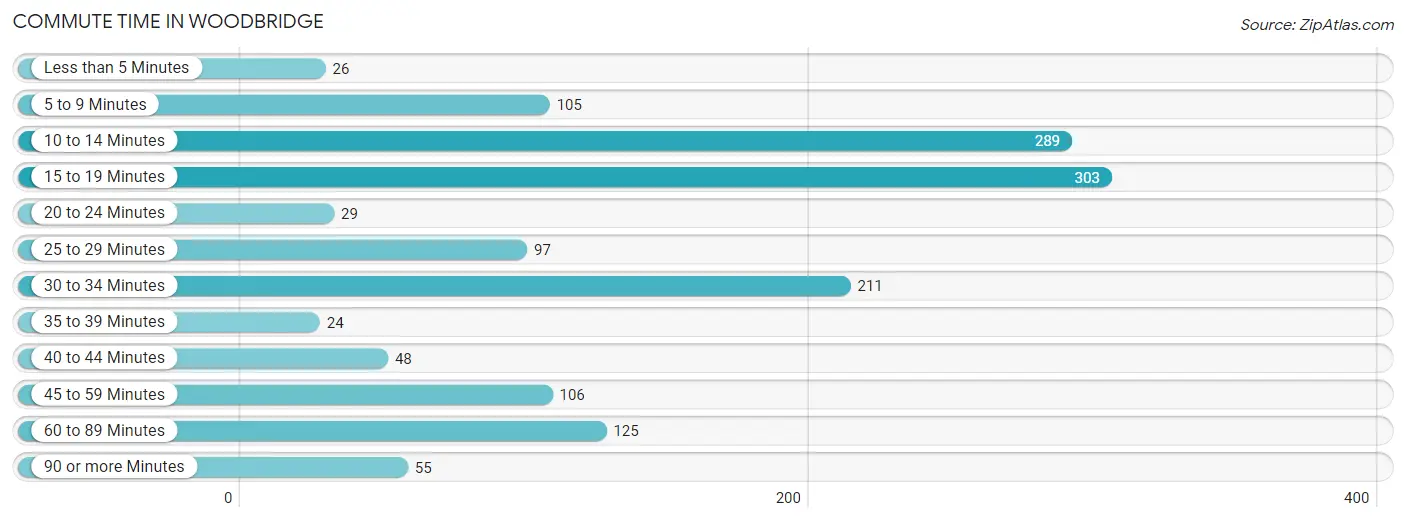
| Commute Time | # Commuters | % Commuters |
| Less than 5 Minutes | 26 | 1.8% |
| 5 to 9 Minutes | 105 | 7.4% |
| 10 to 14 Minutes | 289 | 20.4% |
| 15 to 19 Minutes | 303 | 21.4% |
| 20 to 24 Minutes | 29 | 2.1% |
| 25 to 29 Minutes | 97 | 6.8% |
| 30 to 34 Minutes | 211 | 14.9% |
| 35 to 39 Minutes | 24 | 1.7% |
| 40 to 44 Minutes | 48 | 3.4% |
| 45 to 59 Minutes | 106 | 7.5% |
| 60 to 89 Minutes | 125 | 8.8% |
| 90 or more Minutes | 55 | 3.9% |
Commute Time by Sex in Woodbridge
The most common commute times in Woodbridge are 30 to 34 minutes (136 commuters, 19.7%) for males and 15 to 19 minutes (180 commuters, 24.8%) for females.
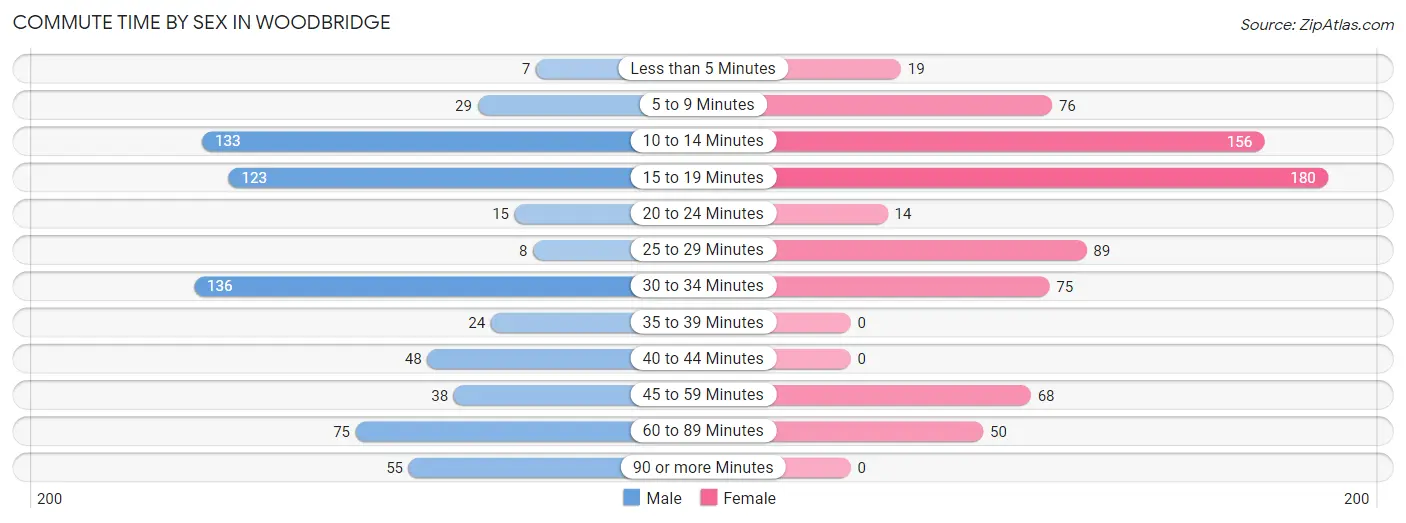
| Commute Time | Male | Female |
| Less than 5 Minutes | 7 (1.0%) | 19 (2.6%) |
| 5 to 9 Minutes | 29 (4.2%) | 76 (10.4%) |
| 10 to 14 Minutes | 133 (19.3%) | 156 (21.5%) |
| 15 to 19 Minutes | 123 (17.8%) | 180 (24.8%) |
| 20 to 24 Minutes | 15 (2.2%) | 14 (1.9%) |
| 25 to 29 Minutes | 8 (1.2%) | 89 (12.2%) |
| 30 to 34 Minutes | 136 (19.7%) | 75 (10.3%) |
| 35 to 39 Minutes | 24 (3.5%) | 0 (0.0%) |
| 40 to 44 Minutes | 48 (7.0%) | 0 (0.0%) |
| 45 to 59 Minutes | 38 (5.5%) | 68 (9.3%) |
| 60 to 89 Minutes | 75 (10.8%) | 50 (6.9%) |
| 90 or more Minutes | 55 (8.0%) | 0 (0.0%) |
Time of Departure to Work by Sex in Woodbridge
The most frequent times of departure to work in Woodbridge are 6:30 AM to 6:59 AM (115, 16.6%) for males and 6:30 AM to 6:59 AM (160, 22.0%) for females.
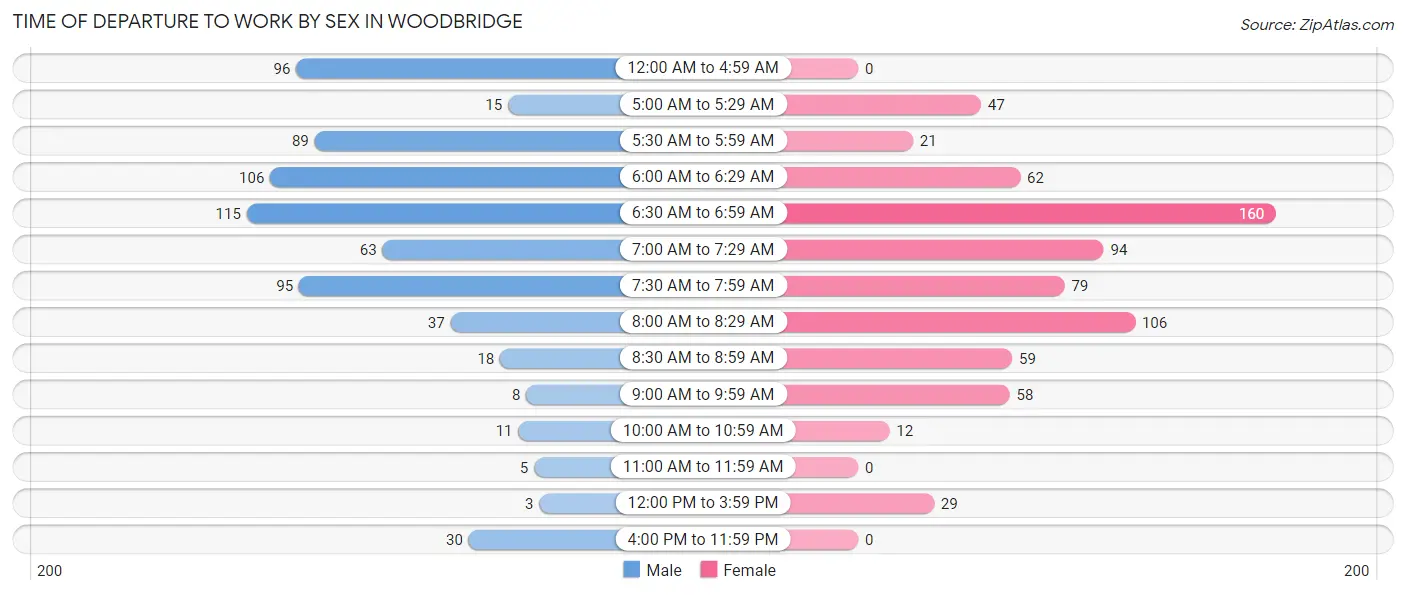
| Time of Departure | Male | Female |
| 12:00 AM to 4:59 AM | 96 (13.9%) | 0 (0.0%) |
| 5:00 AM to 5:29 AM | 15 (2.2%) | 47 (6.5%) |
| 5:30 AM to 5:59 AM | 89 (12.9%) | 21 (2.9%) |
| 6:00 AM to 6:29 AM | 106 (15.3%) | 62 (8.5%) |
| 6:30 AM to 6:59 AM | 115 (16.6%) | 160 (22.0%) |
| 7:00 AM to 7:29 AM | 63 (9.1%) | 94 (12.9%) |
| 7:30 AM to 7:59 AM | 95 (13.8%) | 79 (10.9%) |
| 8:00 AM to 8:29 AM | 37 (5.3%) | 106 (14.6%) |
| 8:30 AM to 8:59 AM | 18 (2.6%) | 59 (8.1%) |
| 9:00 AM to 9:59 AM | 8 (1.2%) | 58 (8.0%) |
| 10:00 AM to 10:59 AM | 11 (1.6%) | 12 (1.7%) |
| 11:00 AM to 11:59 AM | 5 (0.7%) | 0 (0.0%) |
| 12:00 PM to 3:59 PM | 3 (0.4%) | 29 (4.0%) |
| 4:00 PM to 11:59 PM | 30 (4.3%) | 0 (0.0%) |
| Total | 691 (100.0%) | 727 (100.0%) |
Housing Occupancy in Woodbridge
Occupancy by Ownership in Woodbridge
Of the total 1,496 dwellings in Woodbridge, owner-occupied units account for 1,212 (81.0%), while renter-occupied units make up 284 (19.0%).
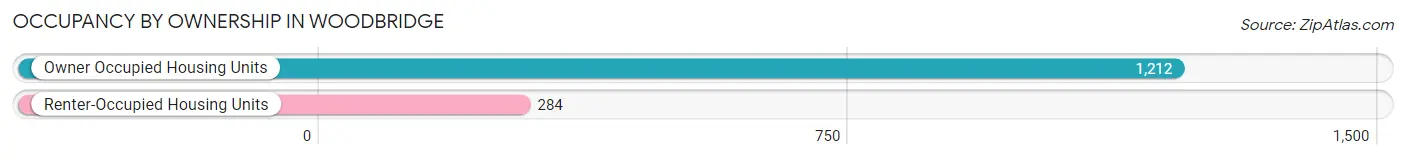
| Occupancy | # Housing Units | % Housing Units |
| Owner Occupied Housing Units | 1,212 | 81.0% |
| Renter-Occupied Housing Units | 284 | 19.0% |
| Total Occupied Housing Units | 1,496 | 100.0% |
Occupancy by Household Size in Woodbridge
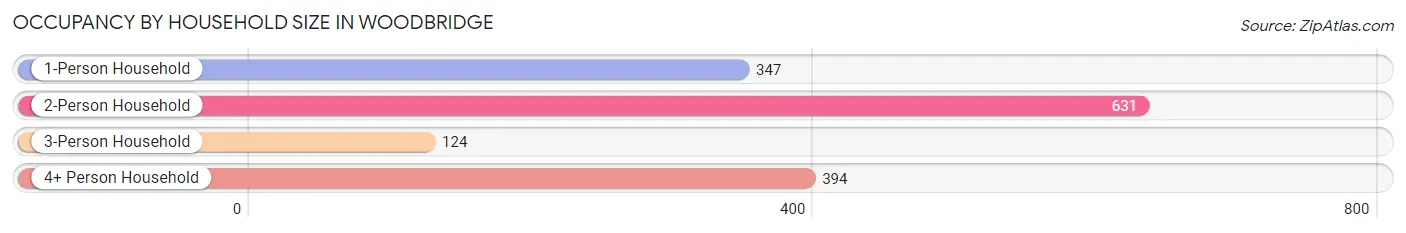
| Household Size | # Housing Units | % Housing Units |
| 1-Person Household | 347 | 23.2% |
| 2-Person Household | 631 | 42.2% |
| 3-Person Household | 124 | 8.3% |
| 4+ Person Household | 394 | 26.3% |
| Total Housing Units | 1,496 | 100.0% |
Occupancy by Ownership by Household Size in Woodbridge
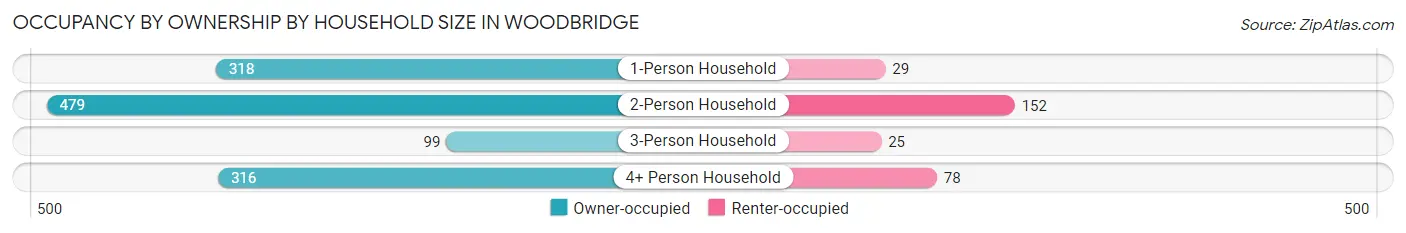
| Household Size | Owner-occupied | Renter-occupied |
| 1-Person Household | 318 (91.6%) | 29 (8.4%) |
| 2-Person Household | 479 (75.9%) | 152 (24.1%) |
| 3-Person Household | 99 (79.8%) | 25 (20.2%) |
| 4+ Person Household | 316 (80.2%) | 78 (19.8%) |
| Total Housing Units | 1,212 (81.0%) | 284 (19.0%) |
Occupancy by Educational Attainment in Woodbridge
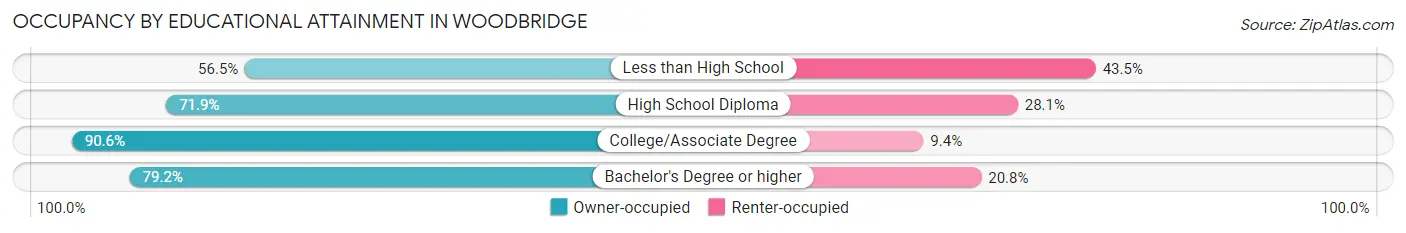
| Household Size | Owner-occupied | Renter-occupied |
| Less than High School | 48 (56.5%) | 37 (43.5%) |
| High School Diploma | 274 (71.9%) | 107 (28.1%) |
| College/Associate Degree | 590 (90.6%) | 61 (9.4%) |
| Bachelor's Degree or higher | 300 (79.2%) | 79 (20.8%) |
Occupancy by Age of Householder in Woodbridge
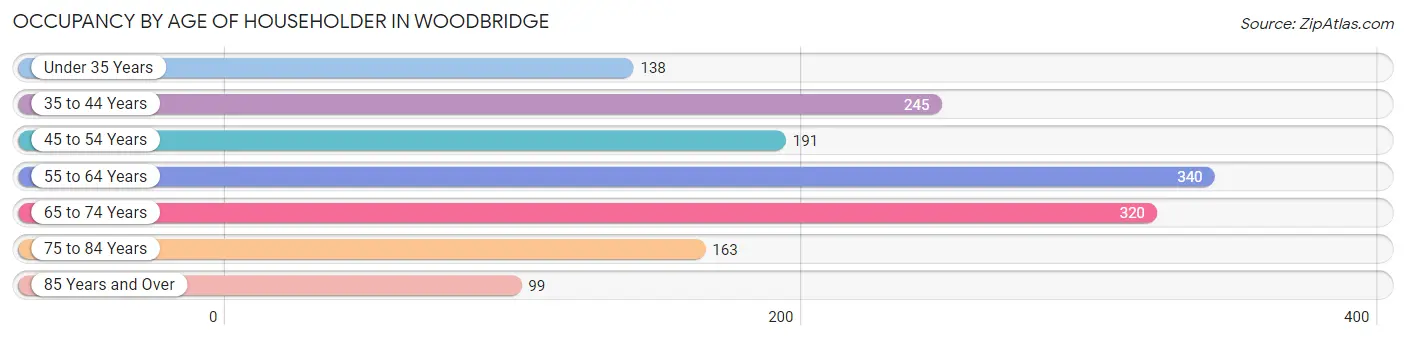
| Age Bracket | # Households | % Households |
| Under 35 Years | 138 | 9.2% |
| 35 to 44 Years | 245 | 16.4% |
| 45 to 54 Years | 191 | 12.8% |
| 55 to 64 Years | 340 | 22.7% |
| 65 to 74 Years | 320 | 21.4% |
| 75 to 84 Years | 163 | 10.9% |
| 85 Years and Over | 99 | 6.6% |
| Total | 1,496 | 100.0% |
Housing Finances in Woodbridge
Median Income by Occupancy in Woodbridge
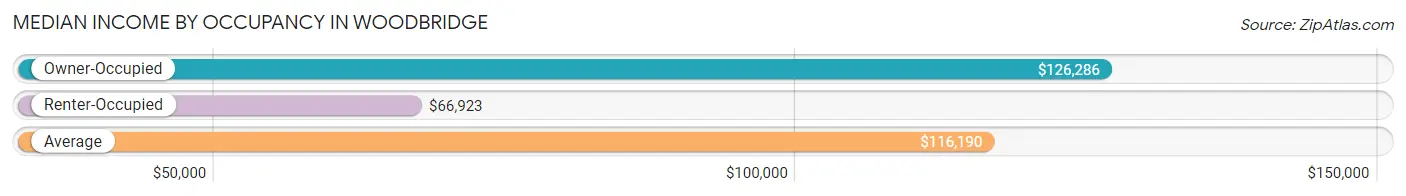
| Occupancy Type | # Households | Median Income |
| Owner-Occupied | 1,212 (81.0%) | $126,286 |
| Renter-Occupied | 284 (19.0%) | $66,923 |
| Average | 1,496 (100.0%) | $116,190 |
Occupancy by Householder Income Bracket in Woodbridge
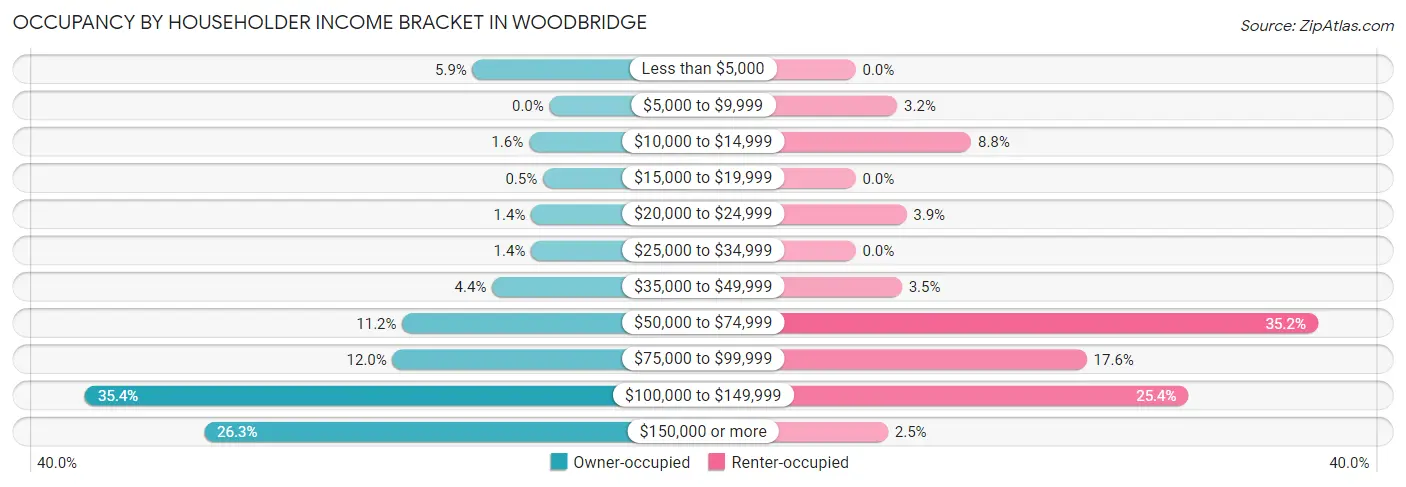
| Income Bracket | Owner-occupied | Renter-occupied |
| Less than $5,000 | 71 (5.9%) | 0 (0.0%) |
| $5,000 to $9,999 | 0 (0.0%) | 9 (3.2%) |
| $10,000 to $14,999 | 19 (1.6%) | 25 (8.8%) |
| $15,000 to $19,999 | 6 (0.5%) | 0 (0.0%) |
| $20,000 to $24,999 | 17 (1.4%) | 11 (3.9%) |
| $25,000 to $34,999 | 17 (1.4%) | 0 (0.0%) |
| $35,000 to $49,999 | 53 (4.4%) | 10 (3.5%) |
| $50,000 to $74,999 | 136 (11.2%) | 100 (35.2%) |
| $75,000 to $99,999 | 145 (12.0%) | 50 (17.6%) |
| $100,000 to $149,999 | 429 (35.4%) | 72 (25.4%) |
| $150,000 or more | 319 (26.3%) | 7 (2.5%) |
| Total | 1,212 (100.0%) | 284 (100.0%) |
Monthly Housing Cost Tiers in Woodbridge
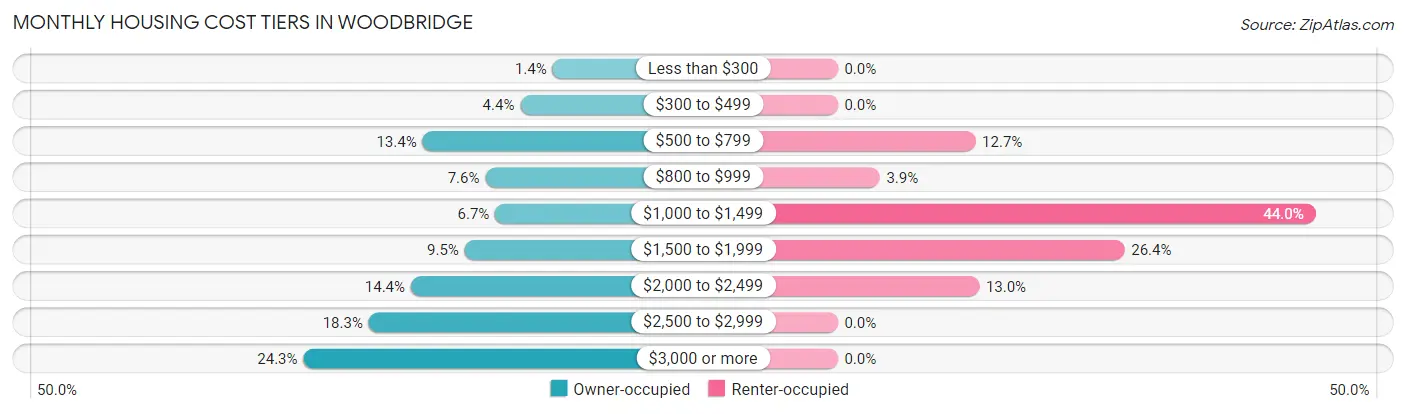
| Monthly Cost | Owner-occupied | Renter-occupied |
| Less than $300 | 17 (1.4%) | 0 (0.0%) |
| $300 to $499 | 53 (4.4%) | 0 (0.0%) |
| $500 to $799 | 162 (13.4%) | 36 (12.7%) |
| $800 to $999 | 92 (7.6%) | 11 (3.9%) |
| $1,000 to $1,499 | 81 (6.7%) | 125 (44.0%) |
| $1,500 to $1,999 | 115 (9.5%) | 75 (26.4%) |
| $2,000 to $2,499 | 175 (14.4%) | 37 (13.0%) |
| $2,500 to $2,999 | 222 (18.3%) | 0 (0.0%) |
| $3,000 or more | 295 (24.3%) | 0 (0.0%) |
| Total | 1,212 (100.0%) | 284 (100.0%) |
Physical Housing Characteristics in Woodbridge
Housing Structures in Woodbridge
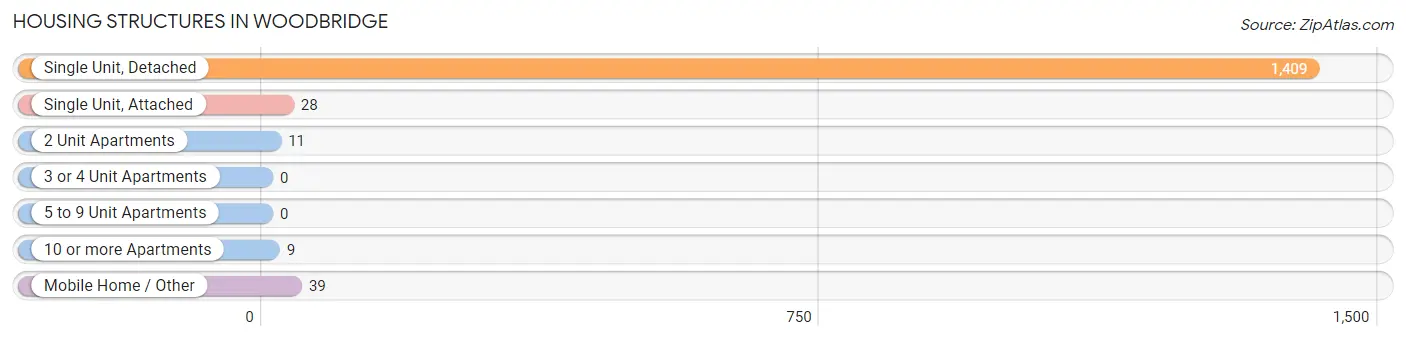
| Structure Type | # Housing Units | % Housing Units |
| Single Unit, Detached | 1,409 | 94.2% |
| Single Unit, Attached | 28 | 1.9% |
| 2 Unit Apartments | 11 | 0.7% |
| 3 or 4 Unit Apartments | 0 | 0.0% |
| 5 to 9 Unit Apartments | 0 | 0.0% |
| 10 or more Apartments | 9 | 0.6% |
| Mobile Home / Other | 39 | 2.6% |
| Total | 1,496 | 100.0% |
Housing Structures by Occupancy in Woodbridge
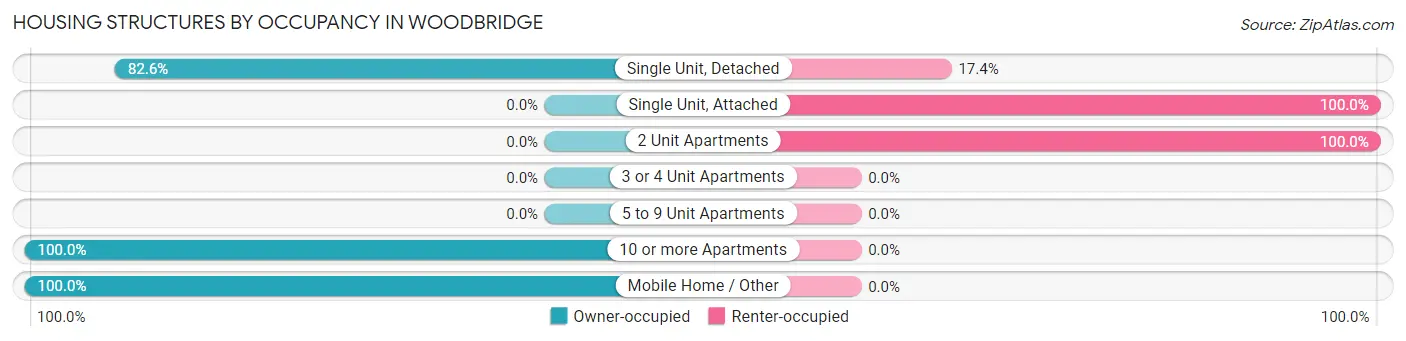
| Structure Type | Owner-occupied | Renter-occupied |
| Single Unit, Detached | 1,164 (82.6%) | 245 (17.4%) |
| Single Unit, Attached | 0 (0.0%) | 28 (100.0%) |
| 2 Unit Apartments | 0 (0.0%) | 11 (100.0%) |
| 3 or 4 Unit Apartments | 0 (0.0%) | 0 (0.0%) |
| 5 to 9 Unit Apartments | 0 (0.0%) | 0 (0.0%) |
| 10 or more Apartments | 9 (100.0%) | 0 (0.0%) |
| Mobile Home / Other | 39 (100.0%) | 0 (0.0%) |
| Total | 1,212 (81.0%) | 284 (19.0%) |
Housing Structures by Number of Rooms in Woodbridge
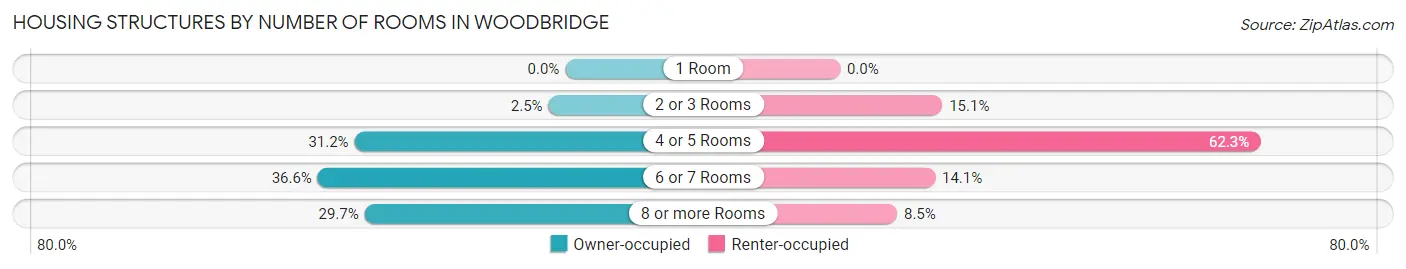
| Number of Rooms | Owner-occupied | Renter-occupied |
| 1 Room | 0 (0.0%) | 0 (0.0%) |
| 2 or 3 Rooms | 30 (2.5%) | 43 (15.1%) |
| 4 or 5 Rooms | 378 (31.2%) | 177 (62.3%) |
| 6 or 7 Rooms | 444 (36.6%) | 40 (14.1%) |
| 8 or more Rooms | 360 (29.7%) | 24 (8.5%) |
| Total | 1,212 (100.0%) | 284 (100.0%) |
Housing Structure by Heating Type in Woodbridge
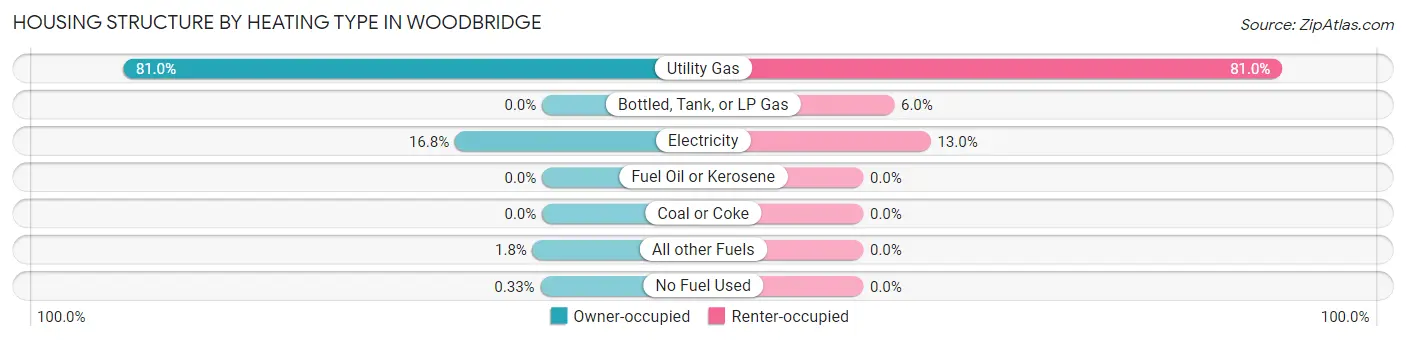
| Heating Type | Owner-occupied | Renter-occupied |
| Utility Gas | 982 (81.0%) | 230 (81.0%) |
| Bottled, Tank, or LP Gas | 0 (0.0%) | 17 (6.0%) |
| Electricity | 204 (16.8%) | 37 (13.0%) |
| Fuel Oil or Kerosene | 0 (0.0%) | 0 (0.0%) |
| Coal or Coke | 0 (0.0%) | 0 (0.0%) |
| All other Fuels | 22 (1.8%) | 0 (0.0%) |
| No Fuel Used | 4 (0.3%) | 0 (0.0%) |
| Total | 1,212 (100.0%) | 284 (100.0%) |
Household Vehicle Usage in Woodbridge
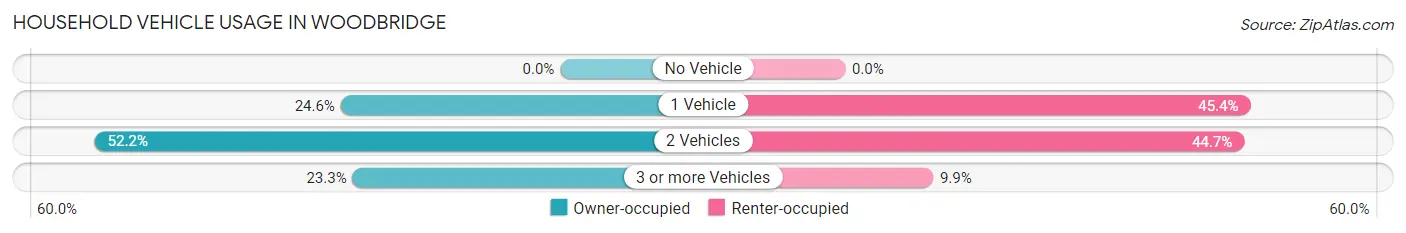
| Vehicles per Household | Owner-occupied | Renter-occupied |
| No Vehicle | 0 (0.0%) | 0 (0.0%) |
| 1 Vehicle | 298 (24.6%) | 129 (45.4%) |
| 2 Vehicles | 632 (52.1%) | 127 (44.7%) |
| 3 or more Vehicles | 282 (23.3%) | 28 (9.9%) |
| Total | 1,212 (100.0%) | 284 (100.0%) |
Real Estate & Mortgages in Woodbridge
Real Estate and Mortgage Overview in Woodbridge
| Characteristic | Without Mortgage | With Mortgage |
| Housing Units | 425 | 787 |
| Median Property Value | $608,600 | $561,300 |
| Median Household Income | $67,969 | $268 |
| Monthly Housing Costs | $744 | $295 |
| Real Estate Taxes | $4,188 | $6 |
Property Value by Mortgage Status in Woodbridge
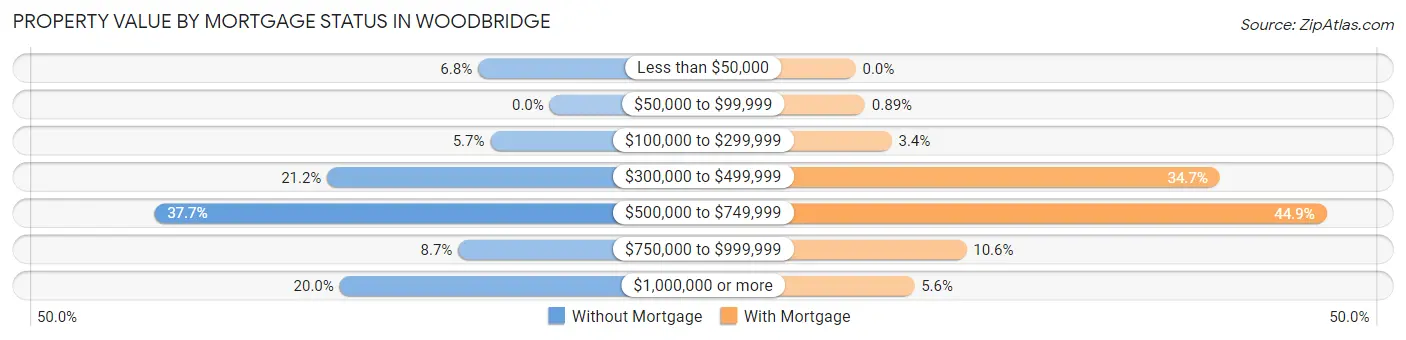
| Property Value | Without Mortgage | With Mortgage |
| Less than $50,000 | 29 (6.8%) | 0 (0.0%) |
| $50,000 to $99,999 | 0 (0.0%) | 7 (0.9%) |
| $100,000 to $299,999 | 24 (5.7%) | 27 (3.4%) |
| $300,000 to $499,999 | 90 (21.2%) | 273 (34.7%) |
| $500,000 to $749,999 | 160 (37.7%) | 353 (44.9%) |
| $750,000 to $999,999 | 37 (8.7%) | 83 (10.5%) |
| $1,000,000 or more | 85 (20.0%) | 44 (5.6%) |
| Total | 425 (100.0%) | 787 (100.0%) |
Household Income by Mortgage Status in Woodbridge
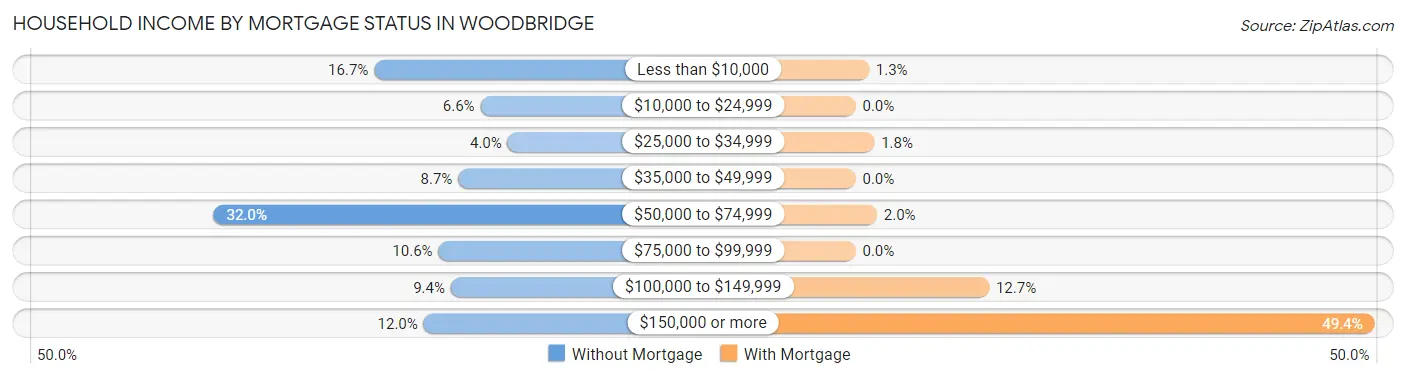
| Household Income | Without Mortgage | With Mortgage |
| Less than $10,000 | 71 (16.7%) | 10 (1.3%) |
| $10,000 to $24,999 | 28 (6.6%) | 0 (0.0%) |
| $25,000 to $34,999 | 17 (4.0%) | 14 (1.8%) |
| $35,000 to $49,999 | 37 (8.7%) | 0 (0.0%) |
| $50,000 to $74,999 | 136 (32.0%) | 16 (2.0%) |
| $75,000 to $99,999 | 45 (10.6%) | 0 (0.0%) |
| $100,000 to $149,999 | 40 (9.4%) | 100 (12.7%) |
| $150,000 or more | 51 (12.0%) | 389 (49.4%) |
| Total | 425 (100.0%) | 787 (100.0%) |
Property Value to Household Income Ratio in Woodbridge
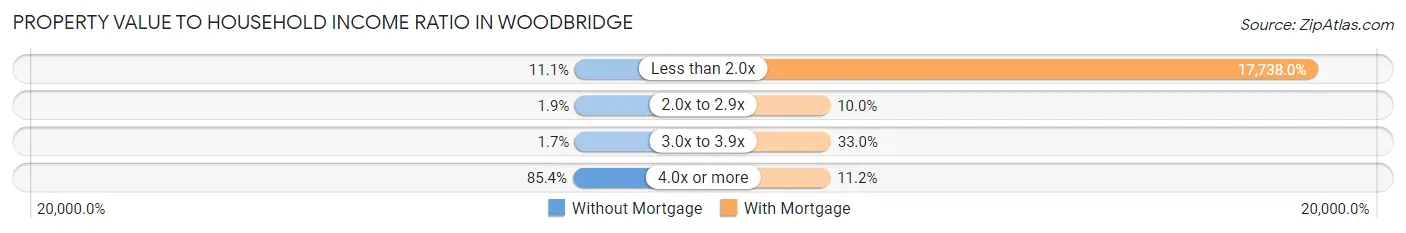
| Value-to-Income Ratio | Without Mortgage | With Mortgage |
| Less than 2.0x | 47 (11.1%) | 139,598 (17,738.0%) |
| 2.0x to 2.9x | 8 (1.9%) | 79 (10.0%) |
| 3.0x to 3.9x | 7 (1.7%) | 260 (33.0%) |
| 4.0x or more | 363 (85.4%) | 88 (11.2%) |
| Total | 425 (100.0%) | 787 (100.0%) |
Real Estate Taxes by Mortgage Status in Woodbridge
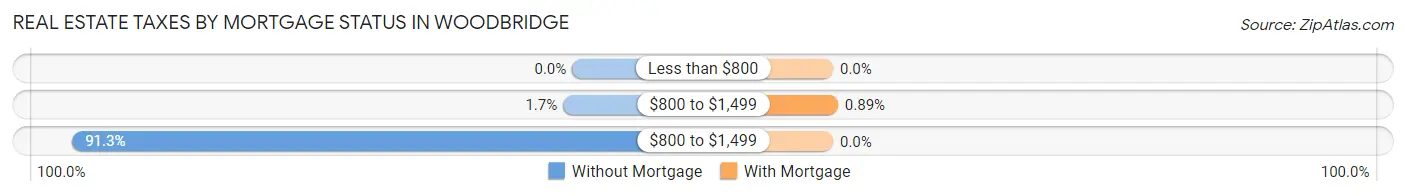
| Property Taxes | Without Mortgage | With Mortgage |
| Less than $800 | 0 (0.0%) | 0 (0.0%) |
| $800 to $1,499 | 7 (1.7%) | 7 (0.9%) |
| $800 to $1,499 | 388 (91.3%) | 0 (0.0%) |
| Total | 425 (100.0%) | 787 (100.0%) |
Health & Disability in Woodbridge
Health Insurance Coverage by Age in Woodbridge
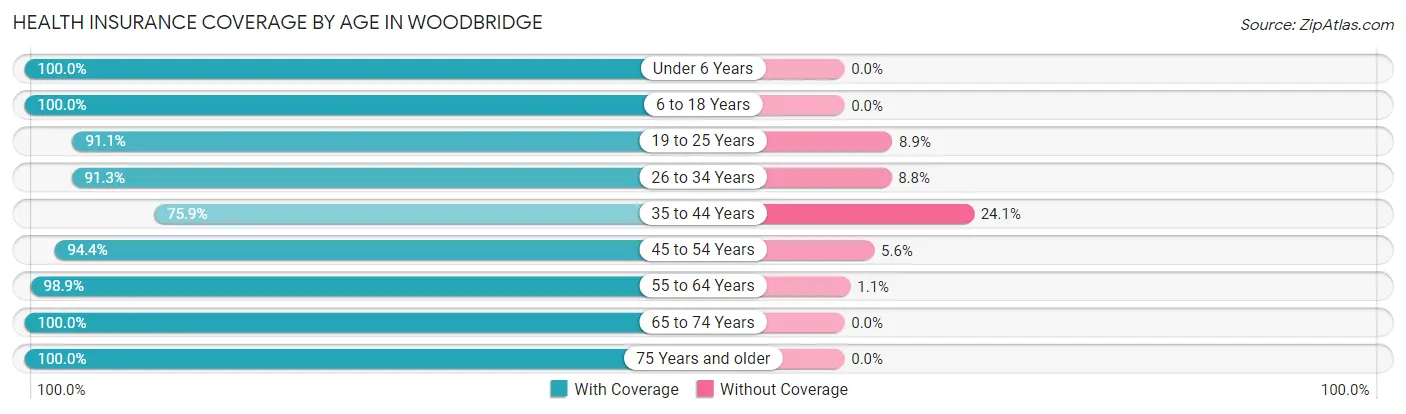
| Age Bracket | With Coverage | Without Coverage |
| Under 6 Years | 205 (100.0%) | 0 (0.0%) |
| 6 to 18 Years | 511 (100.0%) | 0 (0.0%) |
| 19 to 25 Years | 204 (91.1%) | 20 (8.9%) |
| 26 to 34 Years | 490 (91.2%) | 47 (8.7%) |
| 35 to 44 Years | 330 (75.9%) | 105 (24.1%) |
| 45 to 54 Years | 340 (94.4%) | 20 (5.6%) |
| 55 to 64 Years | 703 (98.9%) | 8 (1.1%) |
| 65 to 74 Years | 482 (100.0%) | 0 (0.0%) |
| 75 Years and older | 404 (100.0%) | 0 (0.0%) |
| Total | 3,669 (94.8%) | 200 (5.2%) |
Health Insurance Coverage by Citizenship Status in Woodbridge
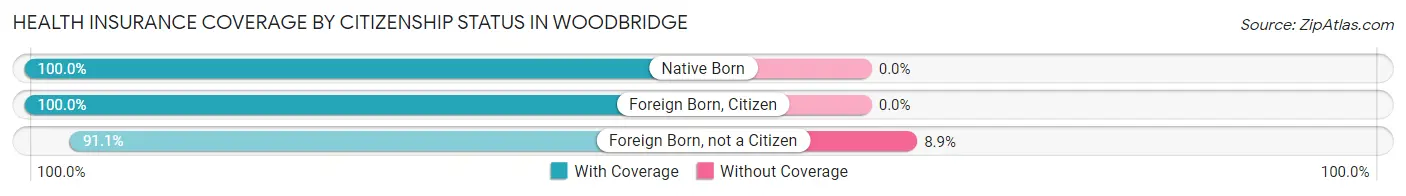
| Citizenship Status | With Coverage | Without Coverage |
| Native Born | 205 (100.0%) | 0 (0.0%) |
| Foreign Born, Citizen | 511 (100.0%) | 0 (0.0%) |
| Foreign Born, not a Citizen | 204 (91.1%) | 20 (8.9%) |
Health Insurance Coverage by Household Income in Woodbridge
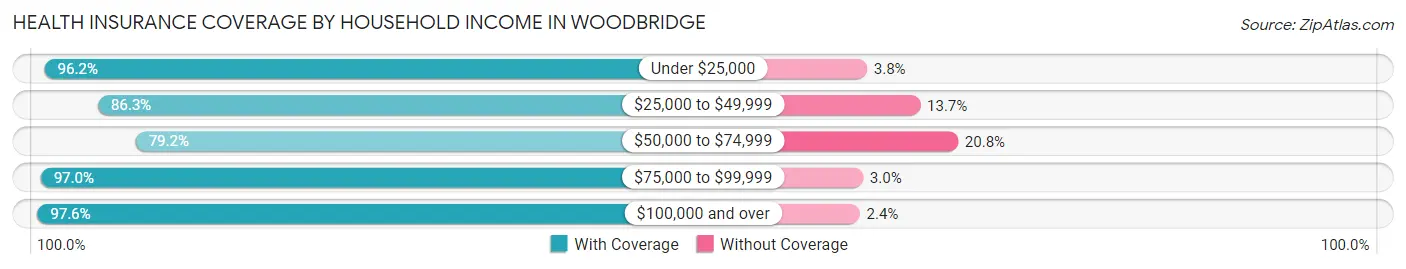
| Household Income | With Coverage | Without Coverage |
| Under $25,000 | 256 (96.2%) | 10 (3.8%) |
| $25,000 to $49,999 | 113 (86.3%) | 18 (13.7%) |
| $50,000 to $74,999 | 369 (79.2%) | 97 (20.8%) |
| $75,000 to $99,999 | 579 (97.0%) | 18 (3.0%) |
| $100,000 and over | 2,319 (97.6%) | 57 (2.4%) |
Public vs Private Health Insurance Coverage by Age in Woodbridge
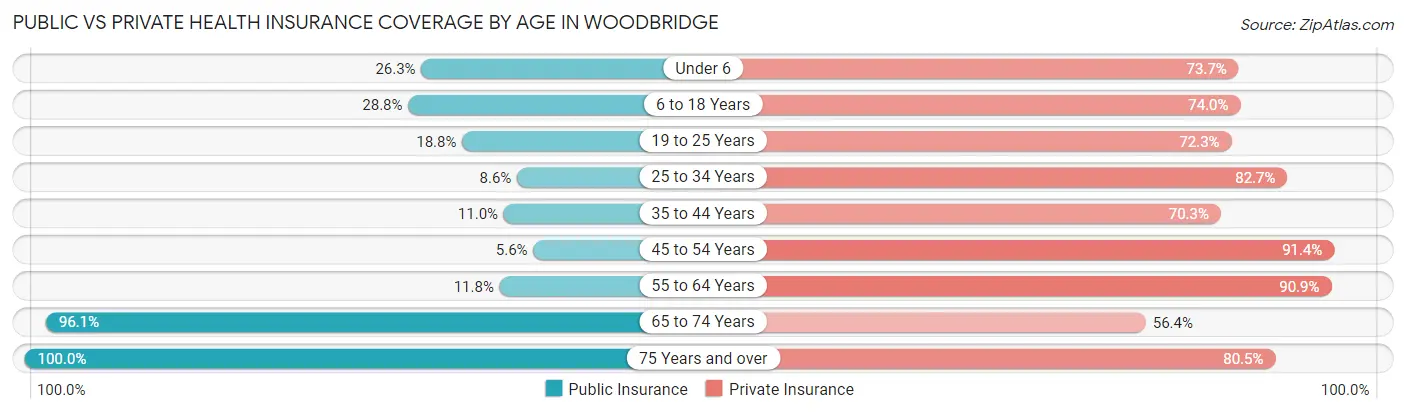
| Age Bracket | Public Insurance | Private Insurance |
| Under 6 | 54 (26.3%) | 151 (73.7%) |
| 6 to 18 Years | 147 (28.8%) | 378 (74.0%) |
| 19 to 25 Years | 42 (18.8%) | 162 (72.3%) |
| 25 to 34 Years | 46 (8.6%) | 444 (82.7%) |
| 35 to 44 Years | 48 (11.0%) | 306 (70.3%) |
| 45 to 54 Years | 20 (5.6%) | 329 (91.4%) |
| 55 to 64 Years | 84 (11.8%) | 646 (90.9%) |
| 65 to 74 Years | 463 (96.1%) | 272 (56.4%) |
| 75 Years and over | 404 (100.0%) | 325 (80.4%) |
| Total | 1,308 (33.8%) | 3,013 (77.9%) |
Disability Status by Sex by Age in Woodbridge
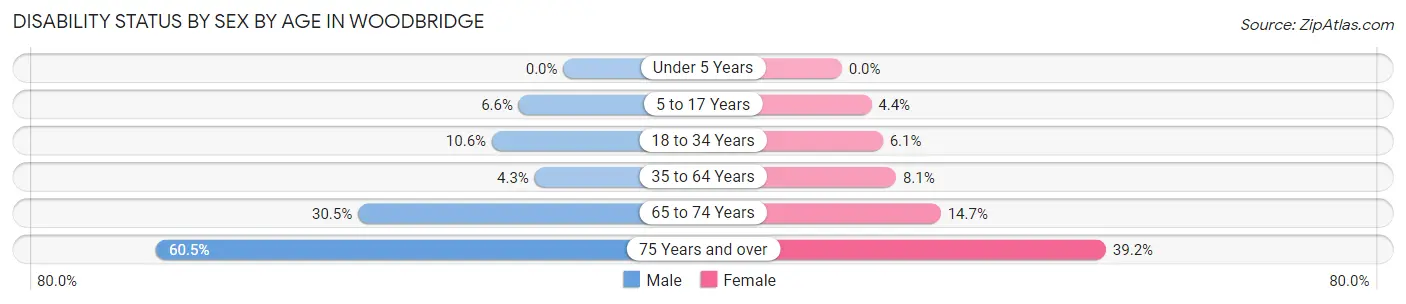
| Age Bracket | Male | Female |
| Under 5 Years | 0 (0.0%) | 0 (0.0%) |
| 5 to 17 Years | 16 (6.6%) | 15 (4.4%) |
| 18 to 34 Years | 35 (10.6%) | 27 (6.1%) |
| 35 to 64 Years | 34 (4.3%) | 57 (8.1%) |
| 65 to 74 Years | 93 (30.5%) | 26 (14.7%) |
| 75 Years and over | 104 (60.5%) | 91 (39.2%) |
Disability Class by Sex by Age in Woodbridge
Disability Class: Hearing Difficulty
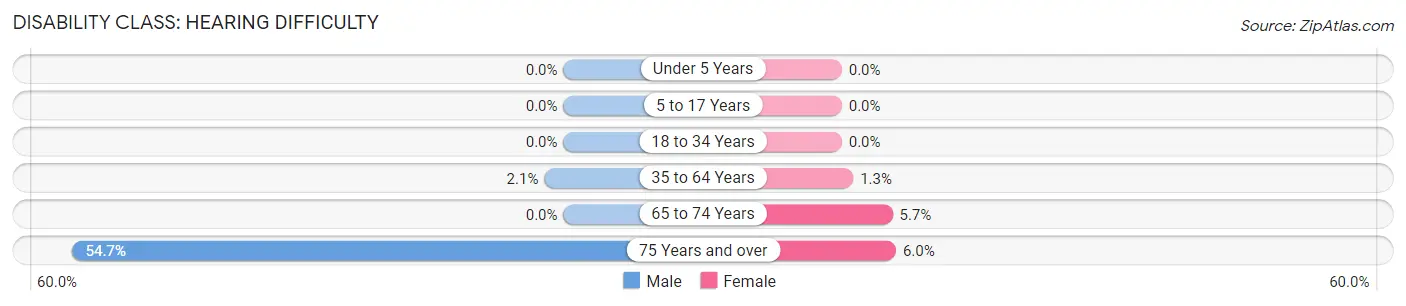
| Age Bracket | Male | Female |
| Under 5 Years | 0 (0.0%) | 0 (0.0%) |
| 5 to 17 Years | 0 (0.0%) | 0 (0.0%) |
| 18 to 34 Years | 0 (0.0%) | 0 (0.0%) |
| 35 to 64 Years | 17 (2.1%) | 9 (1.3%) |
| 65 to 74 Years | 0 (0.0%) | 10 (5.7%) |
| 75 Years and over | 94 (54.6%) | 14 (6.0%) |
Disability Class: Vision Difficulty
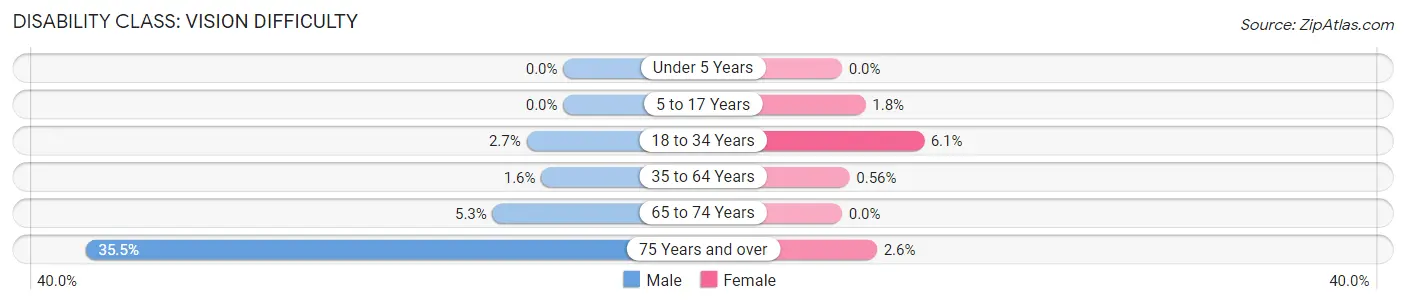
| Age Bracket | Male | Female |
| Under 5 Years | 0 (0.0%) | 0 (0.0%) |
| 5 to 17 Years | 0 (0.0%) | 6 (1.8%) |
| 18 to 34 Years | 9 (2.7%) | 27 (6.1%) |
| 35 to 64 Years | 13 (1.6%) | 4 (0.6%) |
| 65 to 74 Years | 16 (5.2%) | 0 (0.0%) |
| 75 Years and over | 61 (35.5%) | 6 (2.6%) |
Disability Class: Cognitive Difficulty
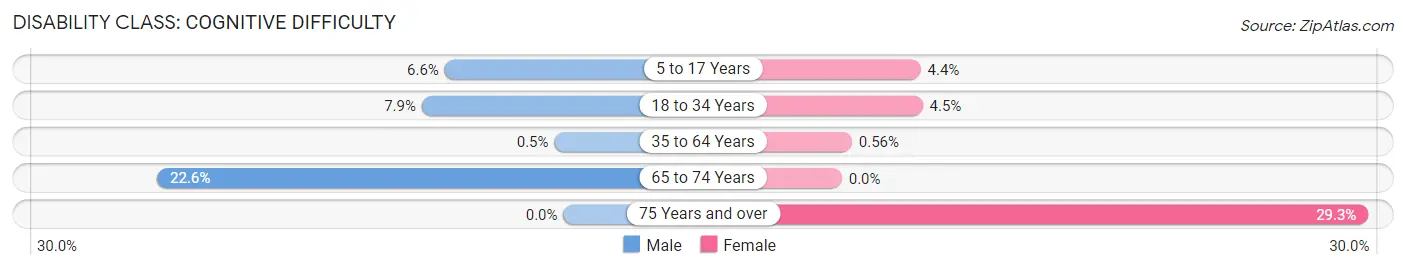
| Age Bracket | Male | Female |
| 5 to 17 Years | 16 (6.6%) | 15 (4.4%) |
| 18 to 34 Years | 26 (7.9%) | 20 (4.5%) |
| 35 to 64 Years | 4 (0.5%) | 4 (0.6%) |
| 65 to 74 Years | 69 (22.6%) | 0 (0.0%) |
| 75 Years and over | 0 (0.0%) | 68 (29.3%) |
Disability Class: Ambulatory Difficulty
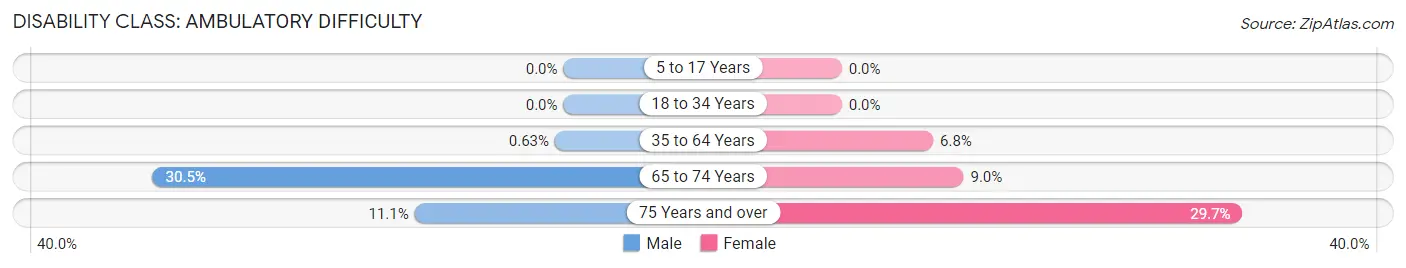
| Age Bracket | Male | Female |
| 5 to 17 Years | 0 (0.0%) | 0 (0.0%) |
| 18 to 34 Years | 0 (0.0%) | 0 (0.0%) |
| 35 to 64 Years | 5 (0.6%) | 48 (6.8%) |
| 65 to 74 Years | 93 (30.5%) | 16 (9.0%) |
| 75 Years and over | 19 (11.1%) | 69 (29.7%) |
Disability Class: Self-Care Difficulty
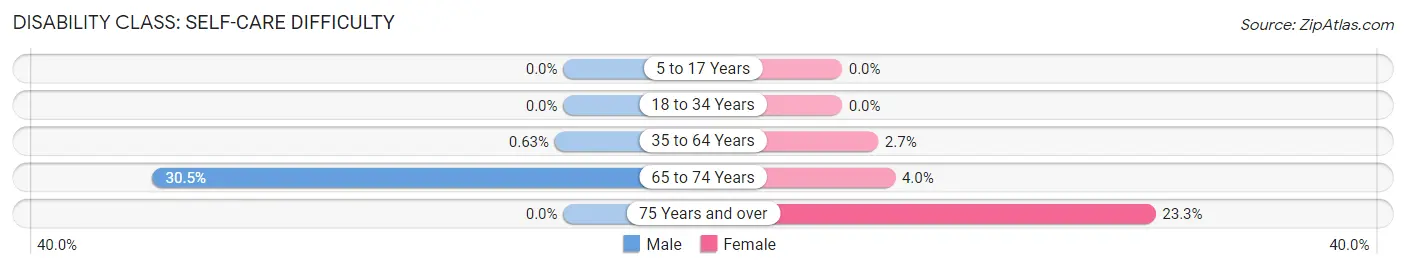
| Age Bracket | Male | Female |
| 5 to 17 Years | 0 (0.0%) | 0 (0.0%) |
| 18 to 34 Years | 0 (0.0%) | 0 (0.0%) |
| 35 to 64 Years | 5 (0.6%) | 19 (2.7%) |
| 65 to 74 Years | 93 (30.5%) | 7 (4.0%) |
| 75 Years and over | 0 (0.0%) | 54 (23.3%) |
Technology Access in Woodbridge
Computing Device Access in Woodbridge
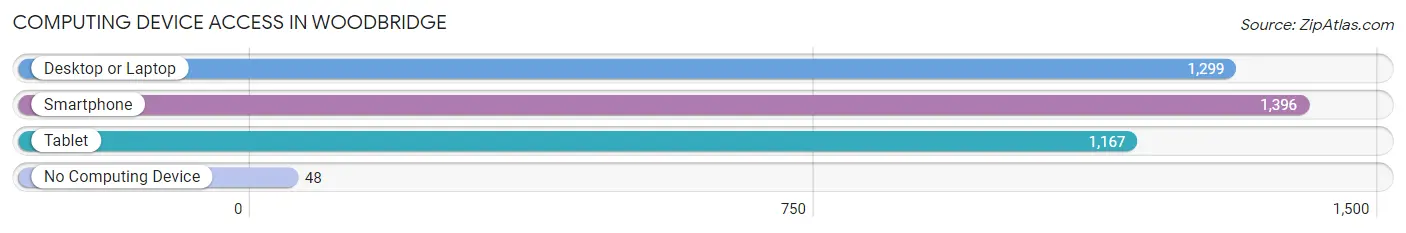
| Device Type | # Households | % Households |
| Desktop or Laptop | 1,299 | 86.8% |
| Smartphone | 1,396 | 93.3% |
| Tablet | 1,167 | 78.0% |
| No Computing Device | 48 | 3.2% |
| Total | 1,496 | 100.0% |
Internet Access in Woodbridge
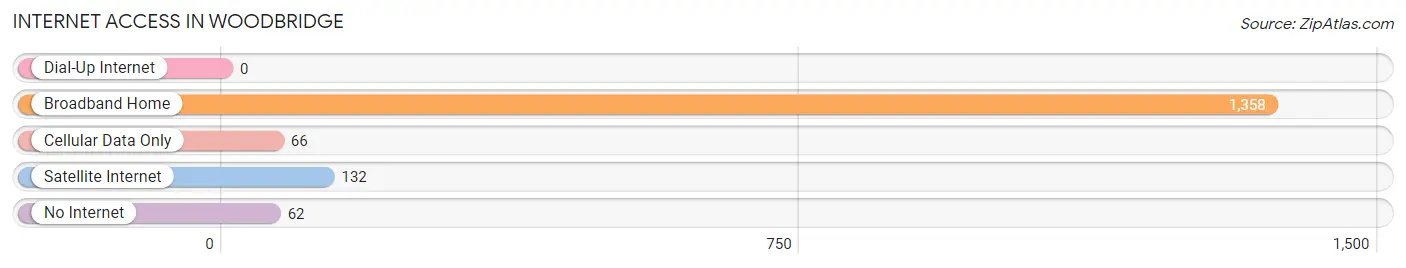
| Internet Type | # Households | % Households |
| Dial-Up Internet | 0 | 0.0% |
| Broadband Home | 1,358 | 90.8% |
| Cellular Data Only | 66 | 4.4% |
| Satellite Internet | 132 | 8.8% |
| No Internet | 62 | 4.1% |
| Total | 1,496 | 100.0% |
Woodbridge Summary
Woodbridge is a small unincorporated community located in San Joaquin County, California. It is situated in the San Joaquin Valley, approximately 20 miles south of Stockton and 40 miles north of Modesto. The population of Woodbridge was estimated to be 1,845 in 2019.
History
Woodbridge was founded in 1867 by William and Mary Woodbridge, who were among the first settlers in the area. The Woodbridges were originally from New York and had moved to California in search of a better life. They purchased a large tract of land and began to farm it. The town was named after the Woodbridges and was incorporated in 1872.
The town grew slowly but steadily over the years, and by the early 1900s, it had become a thriving agricultural community. The main crops grown in the area were wheat, barley, and alfalfa. The town also had a few small businesses, including a general store, a blacksmith shop, and a post office.
In the 1950s, the town began to experience a decline in population as many of its residents moved away in search of better job opportunities. By the 1970s, the town had become a virtual ghost town, with only a few hundred people living there.
Geography
Woodbridge is located in the San Joaquin Valley, approximately 20 miles south of Stockton and 40 miles north of Modesto. The town is situated on the banks of the San Joaquin River, which flows through the valley. The town is surrounded by rolling hills and farmland.
The climate in Woodbridge is generally mild, with hot summers and cool winters. The average annual temperature is around 60 degrees Fahrenheit. The area receives an average of 18 inches of rain per year.
Economy
The economy of Woodbridge is largely based on agriculture. The main crops grown in the area are wheat, barley, and alfalfa. The town also has a few small businesses, including a general store, a blacksmith shop, and a post office.
Demographics
As of 2019, the population of Woodbridge was estimated to be 1,845. The racial makeup of the town is predominantly white (90.2%), with small percentages of Hispanic (4.2%), Asian (2.2%), and African American (1.2%) residents. The median household income in Woodbridge is $50,000, and the median age is 37.
Conclusion
Woodbridge is a small unincorporated community located in San Joaquin County, California. It was founded in 1867 by William and Mary Woodbridge and has since grown into a thriving agricultural community. The town is situated on the banks of the San Joaquin River and is surrounded by rolling hills and farmland. The economy of Woodbridge is largely based on agriculture, and the town has a population of 1,845 as of 2019.
Common Questions
What is Per Capita Income in Woodbridge?
Per Capita income in Woodbridge is $53,120.
What is the Median Family Income in Woodbridge?
Median Family Income in Woodbridge is $126,327.
What is the Median Household income in Woodbridge?
Median Household Income in Woodbridge is $116,190.
What is Income or Wage Gap in Woodbridge?
Income or Wage Gap in Woodbridge is 10.6%.
Women in Woodbridge earn 89.4 cents for every dollar earned by a man.
What is Inequality or Gini Index in Woodbridge?
Inequality or Gini Index in Woodbridge is 0.43.
What is the Total Population of Woodbridge?
Total Population of Woodbridge is 3,870.
What is the Total Male Population of Woodbridge?
Total Male Population of Woodbridge is 1,857.
What is the Total Female Population of Woodbridge?
Total Female Population of Woodbridge is 2,013.
What is the Ratio of Males per 100 Females in Woodbridge?
There are 92.25 Males per 100 Females in Woodbridge.
What is the Ratio of Females per 100 Males in Woodbridge?
There are 108.40 Females per 100 Males in Woodbridge.
What is the Median Population Age in Woodbridge?
Median Population Age in Woodbridge is 46.6 Years.
What is the Average Family Size in Woodbridge
Average Family Size in Woodbridge is 3.1 People.
What is the Average Household Size in Woodbridge
Average Household Size in Woodbridge is 2.6 People.
How Large is the Labor Force in Woodbridge?
There are 1,965 People in the Labor Forcein in Woodbridge.
What is the Percentage of People in the Labor Force in Woodbridge?
61.0% of People are in the Labor Force in Woodbridge.
What is the Unemployment Rate in Woodbridge?
Unemployment Rate in Woodbridge is 4.0%.