Orangevale, CA Map & Demographics
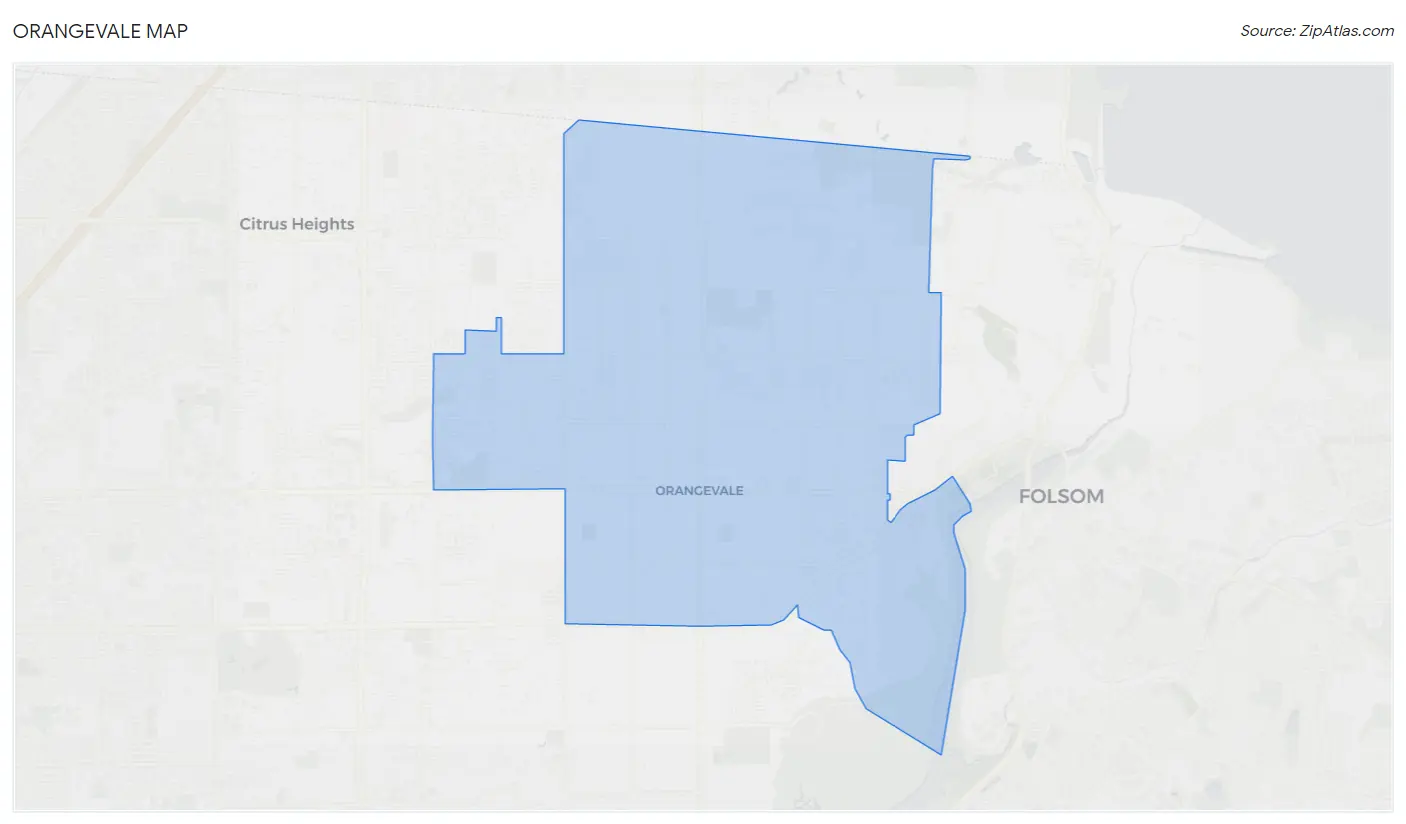
Orangevale Map
Orangevale Overview
$43,370
PER CAPITA INCOME
$106,665
AVG FAMILY INCOME
$95,212
AVG HOUSEHOLD INCOME
19.8%
WAGE / INCOME GAP [ % ]
80.2¢/ $1
WAGE / INCOME GAP [ $ ]
$12,581
FAMILY INCOME DEFICIT
0.39
INEQUALITY / GINI INDEX
35,852
TOTAL POPULATION
17,600
MALE POPULATION
18,252
FEMALE POPULATION
96.43
MALES / 100 FEMALES
103.70
FEMALES / 100 MALES
41.5
MEDIAN AGE
3.1
AVG FAMILY SIZE
2.6
AVG HOUSEHOLD SIZE
18,128
LABOR FORCE [ PEOPLE ]
61.9%
PERCENT IN LABOR FORCE
5.2%
UNEMPLOYMENT RATE
Orangevale Zip Codes
Orangevale Area Codes
Income in Orangevale
Income Overview in Orangevale
Per Capita Income in Orangevale is $43,370, while median incomes of families and households are $106,665 and $95,212 respectively.
| Characteristic | Number | Measure |
| Per Capita Income | 35,852 | $43,370 |
| Median Family Income | 9,387 | $106,665 |
| Mean Family Income | 9,387 | $122,351 |
| Median Household Income | 13,576 | $95,212 |
| Mean Household Income | 13,576 | $112,591 |
| Income Deficit | 9,387 | $12,581 |
| Wage / Income Gap (%) | 35,852 | 19.83% |
| Wage / Income Gap ($) | 35,852 | 80.17¢ per $1 |
| Gini / Inequality Index | 35,852 | 0.39 |
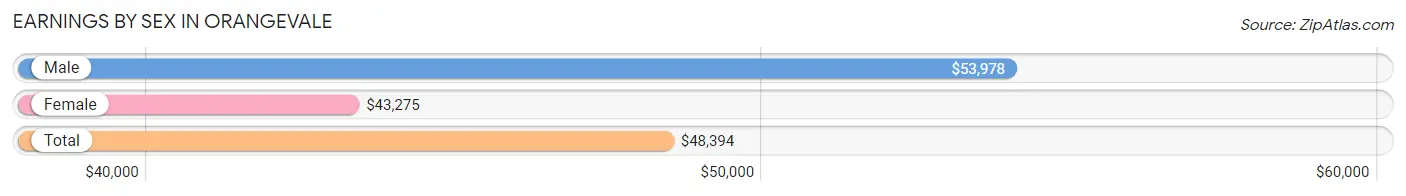
Earnings by Sex in Orangevale
Average Earnings in Orangevale are $48,394, $53,978 for men and $43,275 for women, a difference of 19.8%.
| Sex | Number | Average Earnings |
| Male | 9,949 (53.4%) | $53,978 |
| Female | 8,669 (46.6%) | $43,275 |
| Total | 18,618 (100.0%) | $48,394 |
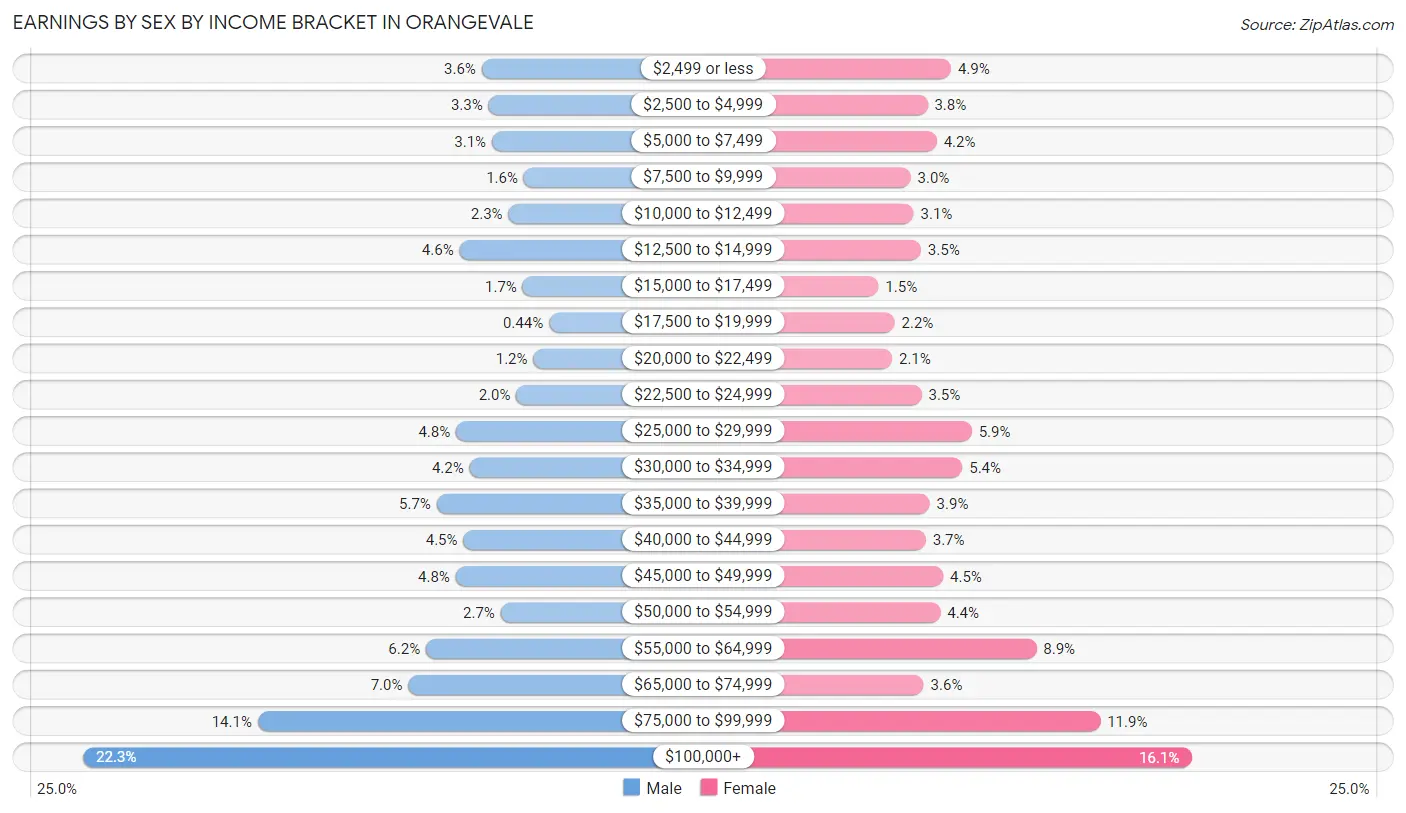
Earnings by Sex by Income Bracket in Orangevale
The most common earnings brackets in Orangevale are $100,000+ for men (2,215 | 22.3%) and $100,000+ for women (1,398 | 16.1%).
| Income | Male | Female |
| $2,499 or less | 357 (3.6%) | 423 (4.9%) |
| $2,500 to $4,999 | 325 (3.3%) | 328 (3.8%) |
| $5,000 to $7,499 | 309 (3.1%) | 365 (4.2%) |
| $7,500 to $9,999 | 161 (1.6%) | 259 (3.0%) |
| $10,000 to $12,499 | 233 (2.3%) | 271 (3.1%) |
| $12,500 to $14,999 | 461 (4.6%) | 301 (3.5%) |
| $15,000 to $17,499 | 166 (1.7%) | 128 (1.5%) |
| $17,500 to $19,999 | 44 (0.4%) | 194 (2.2%) |
| $20,000 to $22,499 | 116 (1.2%) | 184 (2.1%) |
| $22,500 to $24,999 | 196 (2.0%) | 303 (3.5%) |
| $25,000 to $29,999 | 477 (4.8%) | 507 (5.9%) |
| $30,000 to $34,999 | 414 (4.2%) | 469 (5.4%) |
| $35,000 to $39,999 | 567 (5.7%) | 336 (3.9%) |
| $40,000 to $44,999 | 443 (4.4%) | 321 (3.7%) |
| $45,000 to $49,999 | 479 (4.8%) | 391 (4.5%) |
| $50,000 to $54,999 | 269 (2.7%) | 380 (4.4%) |
| $55,000 to $64,999 | 617 (6.2%) | 770 (8.9%) |
| $65,000 to $74,999 | 699 (7.0%) | 312 (3.6%) |
| $75,000 to $99,999 | 1,401 (14.1%) | 1,029 (11.9%) |
| $100,000+ | 2,215 (22.3%) | 1,398 (16.1%) |
| Total | 9,949 (100.0%) | 8,669 (100.0%) |
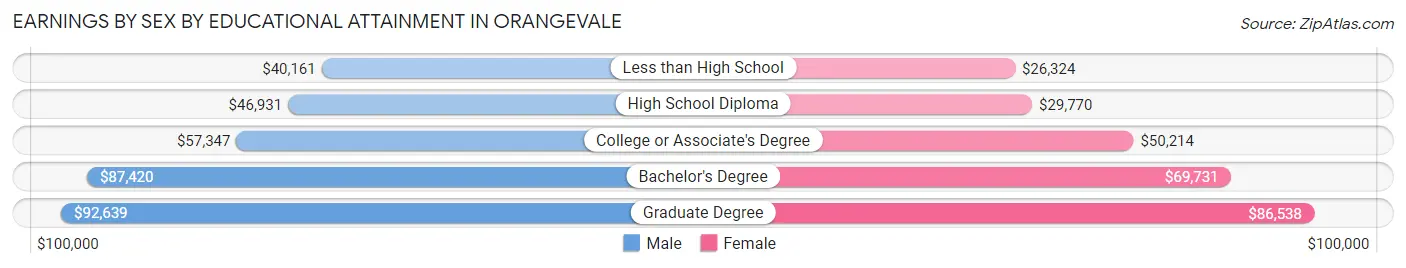
Earnings by Sex by Educational Attainment in Orangevale
Average earnings in Orangevale are $62,481 for men and $52,578 for women, a difference of 15.9%. Men with an educational attainment of graduate degree enjoy the highest average annual earnings of $92,639, while those with less than high school education earn the least with $40,161. Women with an educational attainment of graduate degree earn the most with the average annual earnings of $86,538, while those with less than high school education have the smallest earnings of $26,324.
| Educational Attainment | Male Income | Female Income |
| Less than High School | $40,161 | $26,324 |
| High School Diploma | $46,931 | $29,770 |
| College or Associate's Degree | $57,347 | $50,214 |
| Bachelor's Degree | $87,420 | $69,731 |
| Graduate Degree | $92,639 | $86,538 |
| Total | $62,481 | $52,578 |
Family Income in Orangevale
Family Income Brackets in Orangevale
According to the Orangevale family income data, there are 2,309 families falling into the $100,000 to $149,999 income range, which is the most common income bracket and makes up 24.6% of all families. Conversely, the $10,000 to $14,999 income bracket is the least frequent group with only 47 families (0.5%) belonging to this category.
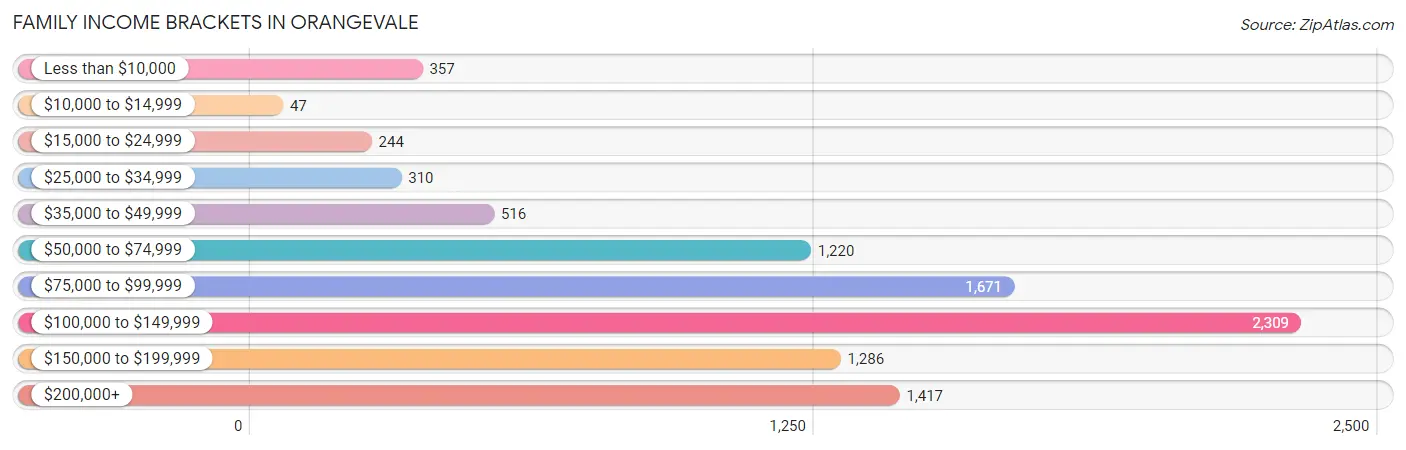
| Income Bracket | # Families | % Families |
| Less than $10,000 | 357 | 3.8% |
| $10,000 to $14,999 | 47 | 0.5% |
| $15,000 to $24,999 | 244 | 2.6% |
| $25,000 to $34,999 | 310 | 3.3% |
| $35,000 to $49,999 | 516 | 5.5% |
| $50,000 to $74,999 | 1,220 | 13.0% |
| $75,000 to $99,999 | 1,671 | 17.8% |
| $100,000 to $149,999 | 2,309 | 24.6% |
| $150,000 to $199,999 | 1,286 | 13.7% |
| $200,000+ | 1,417 | 15.1% |
Family Income by Famaliy Size in Orangevale
4-person families (1,821 | 19.4%) account for the highest median family income in Orangevale with $126,016 per family, while 2-person families (4,456 | 47.5%) have the highest median income of $48,008 per family member.
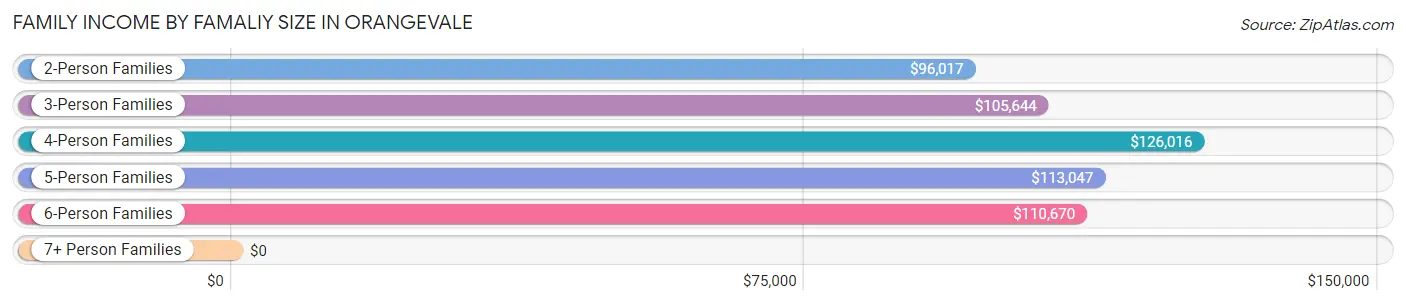
| Income Bracket | # Families | Median Income |
| 2-Person Families | 4,456 (47.5%) | $96,017 |
| 3-Person Families | 2,005 (21.4%) | $105,644 |
| 4-Person Families | 1,821 (19.4%) | $126,016 |
| 5-Person Families | 824 (8.8%) | $113,047 |
| 6-Person Families | 231 (2.5%) | $110,670 |
| 7+ Person Families | 50 (0.5%) | $0 |
| Total | 9,387 (100.0%) | $106,665 |
Family Income by Number of Earners in Orangevale
The median family income in Orangevale is $106,665, with families comprising 3+ earners (1,089) having the highest median family income of $147,471, while families with no earners (1,698) have the lowest median family income of $68,387, accounting for 11.6% and 18.1% of families, respectively.
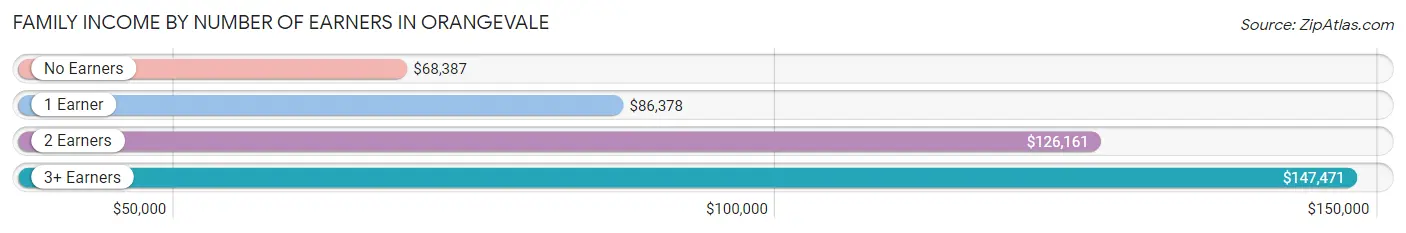
| Number of Earners | # Families | Median Income |
| No Earners | 1,698 (18.1%) | $68,387 |
| 1 Earner | 3,072 (32.7%) | $86,378 |
| 2 Earners | 3,528 (37.6%) | $126,161 |
| 3+ Earners | 1,089 (11.6%) | $147,471 |
| Total | 9,387 (100.0%) | $106,665 |
Household Income in Orangevale
Household Income Brackets in Orangevale
With 2,905 households falling in the category, the $100,000 to $149,999 income range is the most frequent in Orangevale, accounting for 21.4% of all households. In contrast, only 258 households (1.9%) fall into the $10,000 to $14,999 income bracket, making it the least populous group.
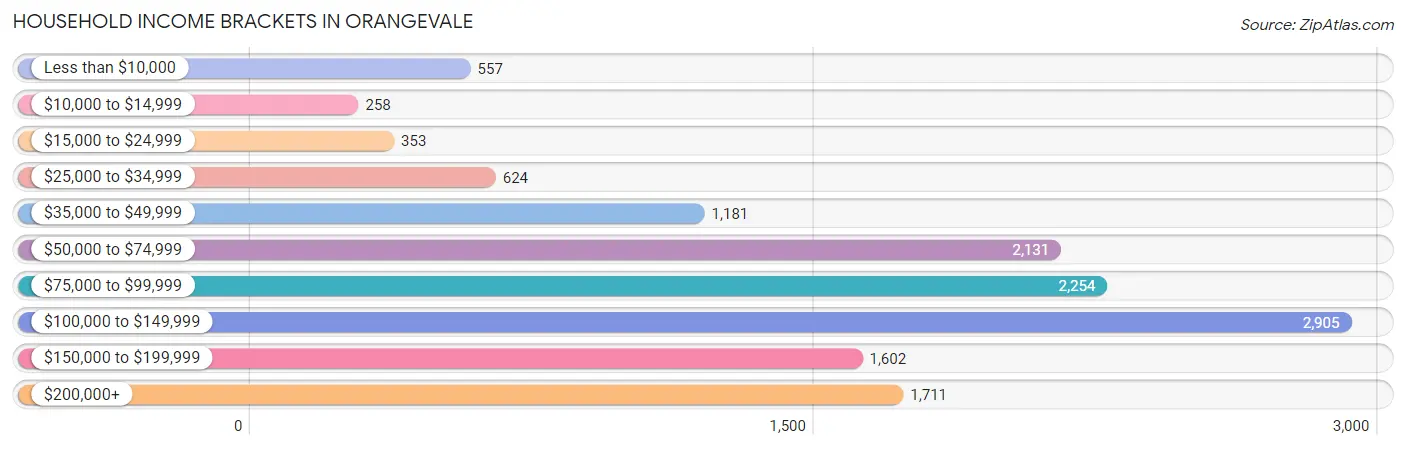
| Income Bracket | # Households | % Households |
| Less than $10,000 | 557 | 4.1% |
| $10,000 to $14,999 | 258 | 1.9% |
| $15,000 to $24,999 | 353 | 2.6% |
| $25,000 to $34,999 | 624 | 4.6% |
| $35,000 to $49,999 | 1,181 | 8.7% |
| $50,000 to $74,999 | 2,131 | 15.7% |
| $75,000 to $99,999 | 2,254 | 16.6% |
| $100,000 to $149,999 | 2,905 | 21.4% |
| $150,000 to $199,999 | 1,602 | 11.8% |
| $200,000+ | 1,711 | 12.6% |
Household Income by Householder Age in Orangevale
The median household income in Orangevale is $95,212, with the highest median household income of $106,396 found in the 45 to 64 years age bracket for the primary householder. A total of 4,943 households (36.4%) fall into this category. Meanwhile, the 65+ years age bracket for the primary householder has the lowest median household income of $71,720, with 4,312 households (31.8%) in this group.
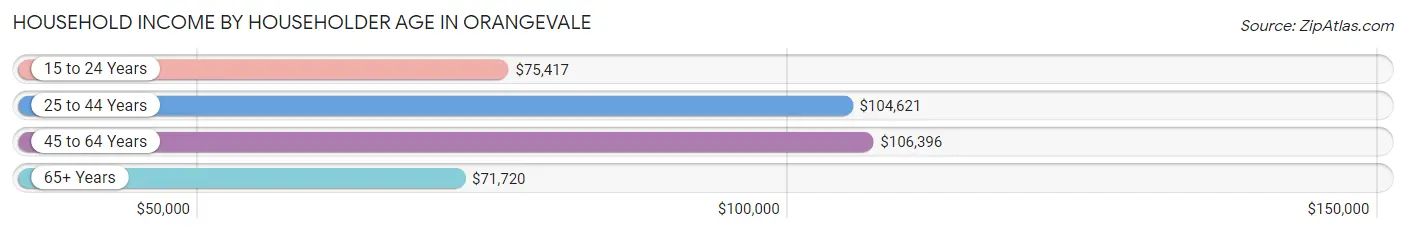
| Income Bracket | # Households | Median Income |
| 15 to 24 Years | 165 (1.2%) | $75,417 |
| 25 to 44 Years | 4,156 (30.6%) | $104,621 |
| 45 to 64 Years | 4,943 (36.4%) | $106,396 |
| 65+ Years | 4,312 (31.8%) | $71,720 |
| Total | 13,576 (100.0%) | $95,212 |
Poverty in Orangevale
Income Below Poverty by Sex and Age in Orangevale
With 8.5% poverty level for males and 10.1% for females among the residents of Orangevale, 15 year old males and 25 to 34 year old females are the most vulnerable to poverty, with 52 males (30.9%) and 524 females (23.9%) in their respective age groups living below the poverty level.
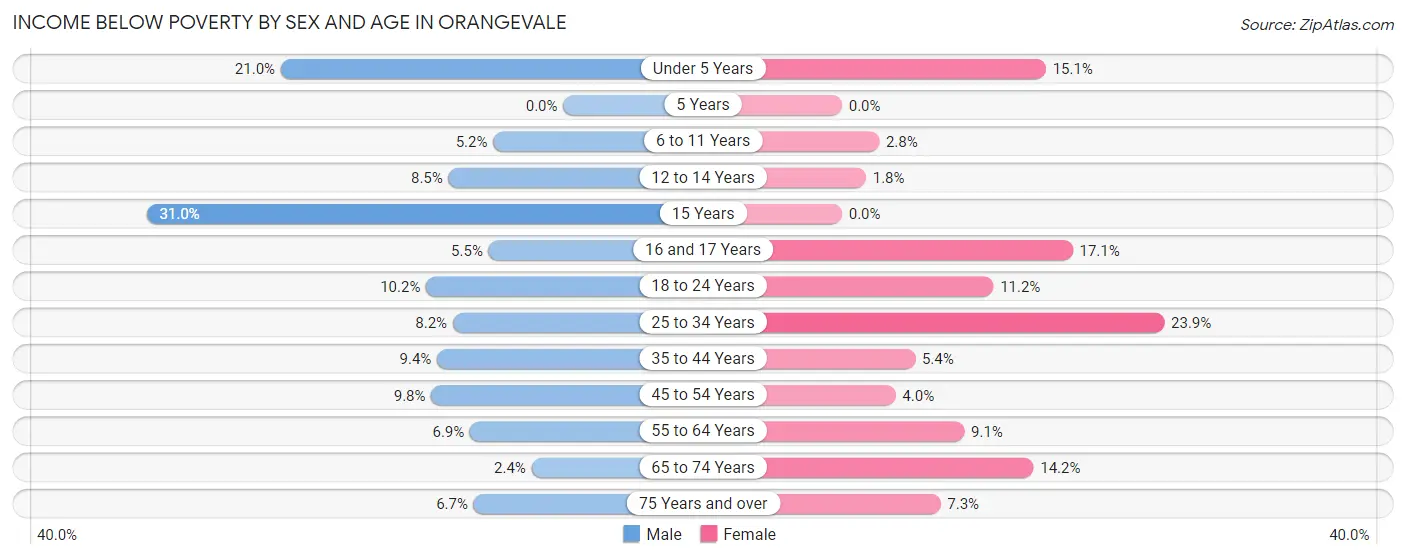
| Age Bracket | Male | Female |
| Under 5 Years | 255 (21.0%) | 129 (15.1%) |
| 5 Years | 0 (0.0%) | 0 (0.0%) |
| 6 to 11 Years | 64 (5.2%) | 37 (2.8%) |
| 12 to 14 Years | 45 (8.5%) | 12 (1.8%) |
| 15 Years | 52 (30.9%) | 0 (0.0%) |
| 16 and 17 Years | 32 (5.5%) | 80 (17.1%) |
| 18 to 24 Years | 134 (10.2%) | 138 (11.2%) |
| 25 to 34 Years | 166 (8.2%) | 524 (23.9%) |
| 35 to 44 Years | 267 (9.4%) | 130 (5.4%) |
| 45 to 54 Years | 219 (9.8%) | 80 (4.0%) |
| 55 to 64 Years | 156 (6.9%) | 233 (9.1%) |
| 65 to 74 Years | 50 (2.4%) | 353 (14.2%) |
| 75 Years and over | 55 (6.7%) | 123 (7.3%) |
| Total | 1,495 (8.5%) | 1,839 (10.1%) |
Income Above Poverty by Sex and Age in Orangevale
According to the poverty statistics in Orangevale, males aged 5 years and females aged 5 years are the age groups that are most secure financially, with 100.0% of males and 100.0% of females in these age groups living above the poverty line.
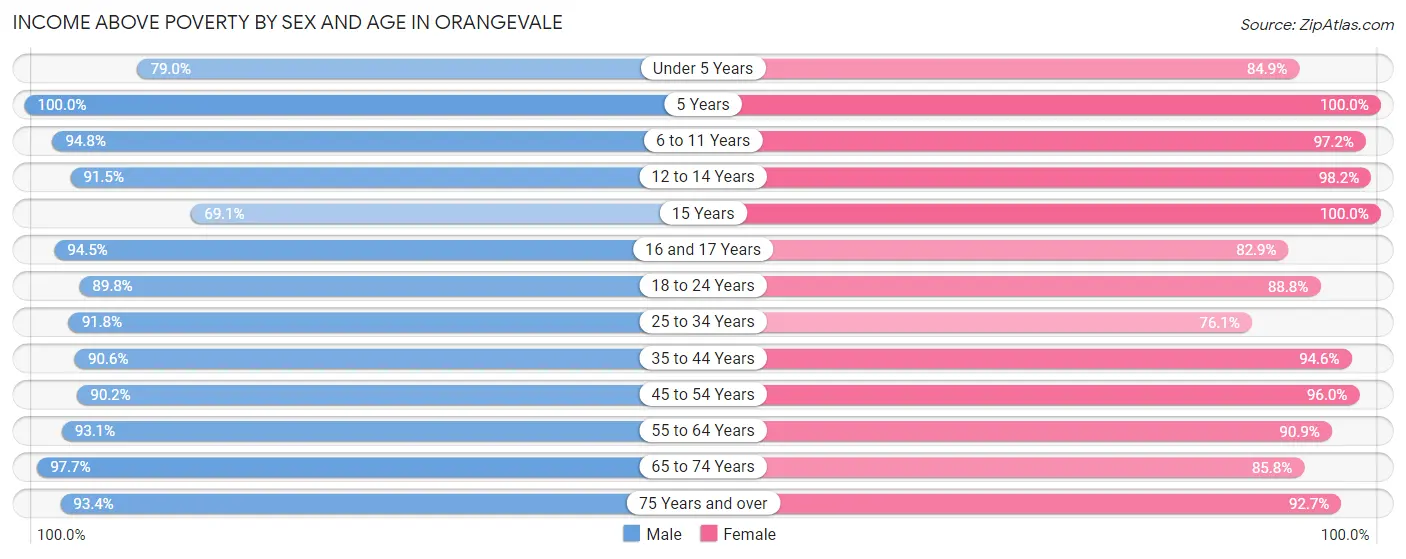
| Age Bracket | Male | Female |
| Under 5 Years | 961 (79.0%) | 723 (84.9%) |
| 5 Years | 173 (100.0%) | 164 (100.0%) |
| 6 to 11 Years | 1,166 (94.8%) | 1,303 (97.2%) |
| 12 to 14 Years | 483 (91.5%) | 663 (98.2%) |
| 15 Years | 116 (69.1%) | 124 (100.0%) |
| 16 and 17 Years | 546 (94.5%) | 387 (82.9%) |
| 18 to 24 Years | 1,182 (89.8%) | 1,090 (88.8%) |
| 25 to 34 Years | 1,858 (91.8%) | 1,666 (76.1%) |
| 35 to 44 Years | 2,583 (90.6%) | 2,265 (94.6%) |
| 45 to 54 Years | 2,015 (90.2%) | 1,929 (96.0%) |
| 55 to 64 Years | 2,098 (93.1%) | 2,333 (90.9%) |
| 65 to 74 Years | 2,078 (97.7%) | 2,130 (85.8%) |
| 75 Years and over | 772 (93.3%) | 1,557 (92.7%) |
| Total | 16,031 (91.5%) | 16,334 (89.9%) |
Income Below Poverty Among Married-Couple Families in Orangevale
The poverty statistics for married-couple families in Orangevale show that 2.0% or 135 of the total 6,707 families live below the poverty line. Families with 1 or 2 children have the highest poverty rate of 2.6%, comprising of 65 families. On the other hand, families with 3 or 4 children have the lowest poverty rate of 0.0%, which includes 0 families.
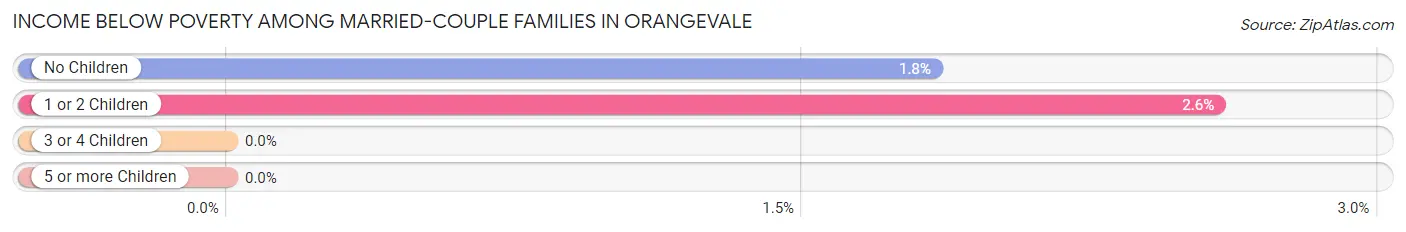
| Children | Above Poverty | Below Poverty |
| No Children | 3,735 (98.2%) | 70 (1.8%) |
| 1 or 2 Children | 2,454 (97.4%) | 65 (2.6%) |
| 3 or 4 Children | 383 (100.0%) | 0 (0.0%) |
| 5 or more Children | 0 (0.0%) | 0 (0.0%) |
| Total | 6,572 (98.0%) | 135 (2.0%) |
Income Below Poverty Among Single-Parent Households in Orangevale
According to the poverty data in Orangevale, 13.8% or 121 single-father households and 19.9% or 359 single-mother households are living below the poverty line. Among single-father households, those with 1 or 2 children have the highest poverty rate, with 97 households (21.9%) experiencing poverty. Likewise, among single-mother households, those with 1 or 2 children have the highest poverty rate, with 297 households (33.8%) falling below the poverty line.
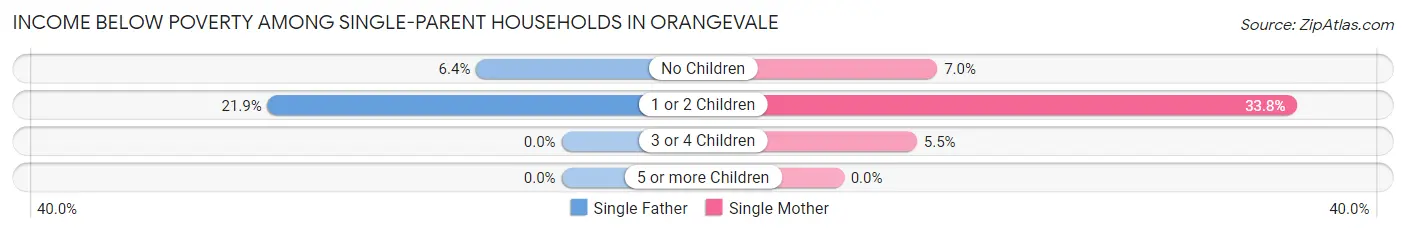
| Children | Single Father | Single Mother |
| No Children | 24 (6.4%) | 53 (7.0%) |
| 1 or 2 Children | 97 (21.9%) | 297 (33.8%) |
| 3 or 4 Children | 0 (0.0%) | 9 (5.4%) |
| 5 or more Children | 0 (0.0%) | 0 (0.0%) |
| Total | 121 (13.8%) | 359 (19.9%) |
Income Below Poverty Among Married-Couple vs Single-Parent Households in Orangevale
The poverty data for Orangevale shows that 135 of the married-couple family households (2.0%) and 480 of the single-parent households (17.9%) are living below the poverty level. Within the married-couple family households, those with 1 or 2 children have the highest poverty rate, with 65 households (2.6%) falling below the poverty line. Among the single-parent households, those with 1 or 2 children have the highest poverty rate, with 394 household (29.8%) living below poverty.
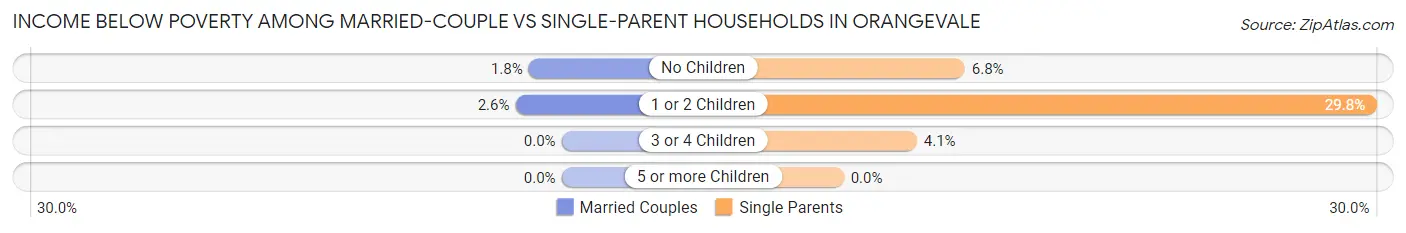
| Children | Married-Couple Families | Single-Parent Households |
| No Children | 70 (1.8%) | 77 (6.8%) |
| 1 or 2 Children | 65 (2.6%) | 394 (29.8%) |
| 3 or 4 Children | 0 (0.0%) | 9 (4.1%) |
| 5 or more Children | 0 (0.0%) | 0 (0.0%) |
| Total | 135 (2.0%) | 480 (17.9%) |
Race in Orangevale
The most populous races in Orangevale are White / Caucasian (28,691 | 80.0%), Hispanic or Latino (4,858 | 13.6%), and Two or more Races (3,989 | 11.1%).
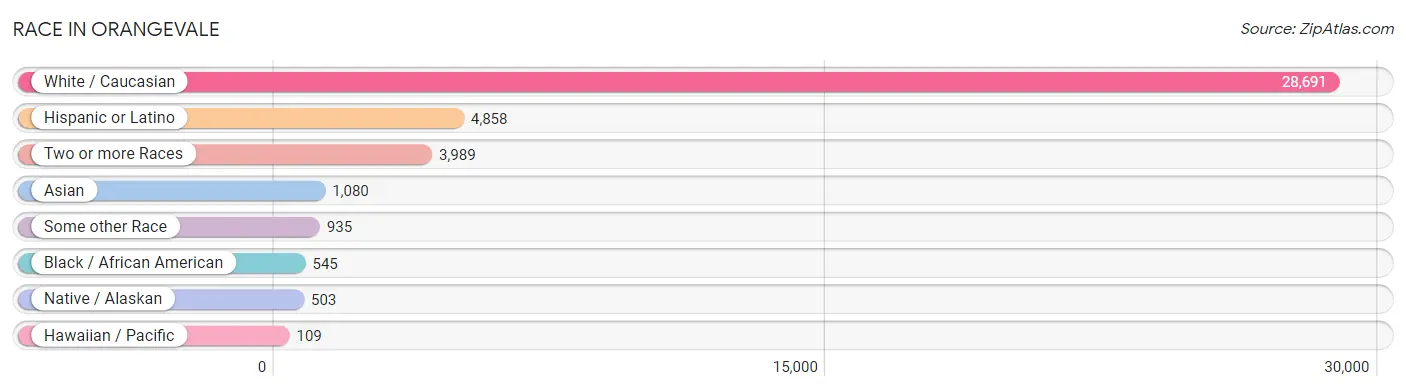
| Race | # Population | % Population |
| Asian | 1,080 | 3.0% |
| Black / African American | 545 | 1.5% |
| Hawaiian / Pacific | 109 | 0.3% |
| Hispanic or Latino | 4,858 | 13.6% |
| Native / Alaskan | 503 | 1.4% |
| White / Caucasian | 28,691 | 80.0% |
| Two or more Races | 3,989 | 11.1% |
| Some other Race | 935 | 2.6% |
| Total | 35,852 | 100.0% |
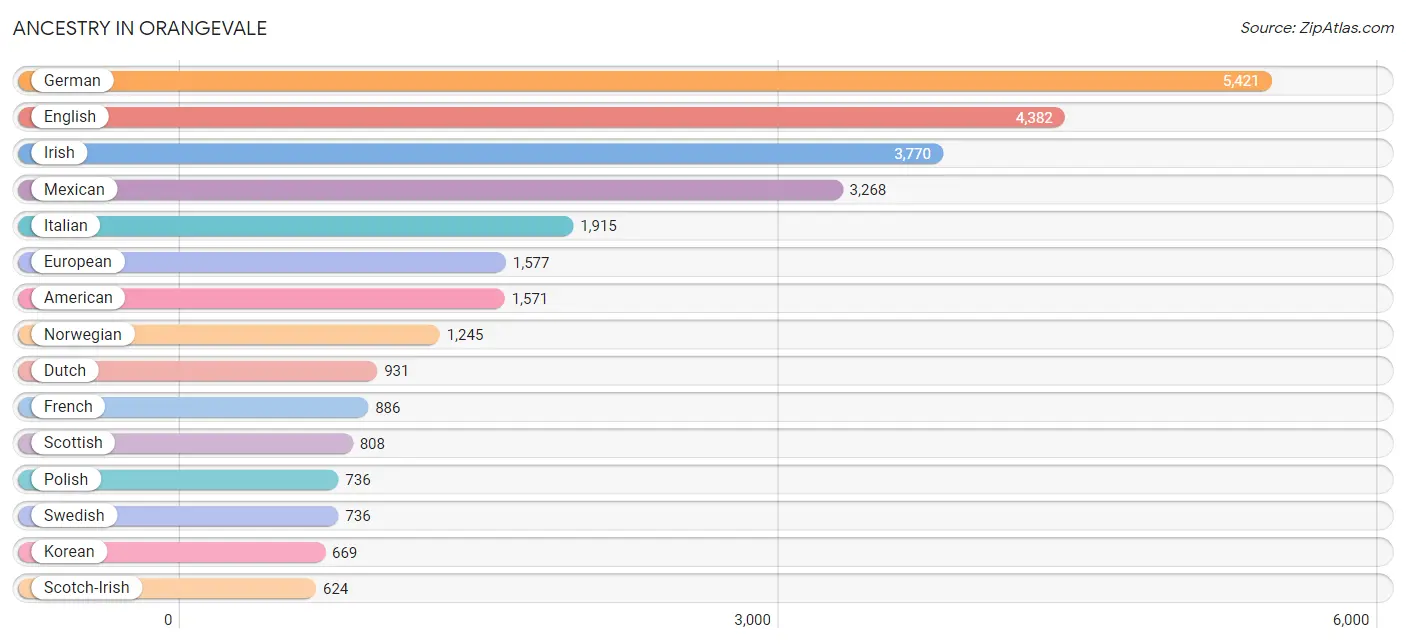
Ancestry in Orangevale
The most populous ancestries reported in Orangevale are German (5,421 | 15.1%), English (4,382 | 12.2%), Irish (3,770 | 10.5%), Mexican (3,268 | 9.1%), and Italian (1,915 | 5.3%), together accounting for 52.3% of all Orangevale residents.
| Ancestry | # Population | % Population |
| Afghan | 17 | 0.1% |
| African | 86 | 0.2% |
| Alaska Native | 19 | 0.1% |
| Albanian | 20 | 0.1% |
| American | 1,571 | 4.4% |
| Apache | 31 | 0.1% |
| Arab | 352 | 1.0% |
| Australian | 19 | 0.1% |
| Austrian | 8 | 0.0% |
| Basque | 18 | 0.1% |
| Belgian | 4 | 0.0% |
| Belizean | 1 | 0.0% |
| Bhutanese | 462 | 1.3% |
| Bolivian | 26 | 0.1% |
| British | 183 | 0.5% |
| Burmese | 172 | 0.5% |
| Canadian | 108 | 0.3% |
| Central American | 362 | 1.0% |
| Cherokee | 404 | 1.1% |
| Chickasaw | 7 | 0.0% |
| Chilean | 57 | 0.2% |
| Choctaw | 60 | 0.2% |
| Colombian | 19 | 0.1% |
| Costa Rican | 7 | 0.0% |
| Croatian | 53 | 0.2% |
| Cuban | 59 | 0.2% |
| Czech | 116 | 0.3% |
| Czechoslovakian | 28 | 0.1% |
| Danish | 291 | 0.8% |
| Dominican | 63 | 0.2% |
| Dutch | 931 | 2.6% |
| Eastern European | 59 | 0.2% |
| English | 4,382 | 12.2% |
| Estonian | 8 | 0.0% |
| Ethiopian | 14 | 0.0% |
| European | 1,577 | 4.4% |
| Finnish | 113 | 0.3% |
| French | 886 | 2.5% |
| French Canadian | 44 | 0.1% |
| German | 5,421 | 15.1% |
| Greek | 114 | 0.3% |
| Guamanian / Chamorro | 17 | 0.1% |
| Guatemalan | 16 | 0.0% |
| Honduran | 61 | 0.2% |
| Hungarian | 212 | 0.6% |
| Icelander | 10 | 0.0% |
| Indian (Asian) | 285 | 0.8% |
| Iranian | 184 | 0.5% |
| Iraqi | 7 | 0.0% |
| Irish | 3,770 | 10.5% |
| Italian | 1,915 | 5.3% |
| Jamaican | 28 | 0.1% |
| Kenyan | 76 | 0.2% |
| Korean | 669 | 1.9% |
| Latvian | 6 | 0.0% |
| Lebanese | 7 | 0.0% |
| Lithuanian | 80 | 0.2% |
| Macedonian | 14 | 0.0% |
| Maltese | 19 | 0.1% |
| Mexican | 3,268 | 9.1% |
| Mexican American Indian | 53 | 0.2% |
| Native Hawaiian | 243 | 0.7% |
| Navajo | 25 | 0.1% |
| Nepalese | 20 | 0.1% |
| Nicaraguan | 53 | 0.2% |
| Northern European | 128 | 0.4% |
| Norwegian | 1,245 | 3.5% |
| Osage | 50 | 0.1% |
| Paiute | 41 | 0.1% |
| Pakistani | 41 | 0.1% |
| Panamanian | 101 | 0.3% |
| Pennsylvania German | 15 | 0.0% |
| Peruvian | 118 | 0.3% |
| Pima | 19 | 0.1% |
| Polish | 736 | 2.1% |
| Portuguese | 620 | 1.7% |
| Potawatomi | 78 | 0.2% |
| Puerto Rican | 356 | 1.0% |
| Romanian | 329 | 0.9% |
| Russian | 436 | 1.2% |
| Salvadoran | 107 | 0.3% |
| Samoan | 37 | 0.1% |
| Scandinavian | 69 | 0.2% |
| Scotch-Irish | 624 | 1.7% |
| Scottish | 808 | 2.2% |
| Serbian | 11 | 0.0% |
| Shoshone | 10 | 0.0% |
| Sioux | 46 | 0.1% |
| Slavic | 53 | 0.2% |
| Slovak | 9 | 0.0% |
| South American | 220 | 0.6% |
| Spaniard | 141 | 0.4% |
| Spanish | 177 | 0.5% |
| Sri Lankan | 232 | 0.6% |
| Subsaharan African | 178 | 0.5% |
| Swedish | 736 | 2.1% |
| Swiss | 79 | 0.2% |
| Thai | 199 | 0.6% |
| Turkish | 50 | 0.1% |
| Ukrainian | 440 | 1.2% |
| Welsh | 206 | 0.6% |
| Yugoslavian | 35 | 0.1% | View All 102 Rows |
Immigrants in Orangevale
The most numerous immigrant groups reported in Orangevale came from Europe (1,456 | 4.1%), Eastern Europe (971 | 2.7%), Asia (915 | 2.5%), Latin America (658 | 1.8%), and Central America (571 | 1.6%), together accounting for 12.8% of all Orangevale residents.
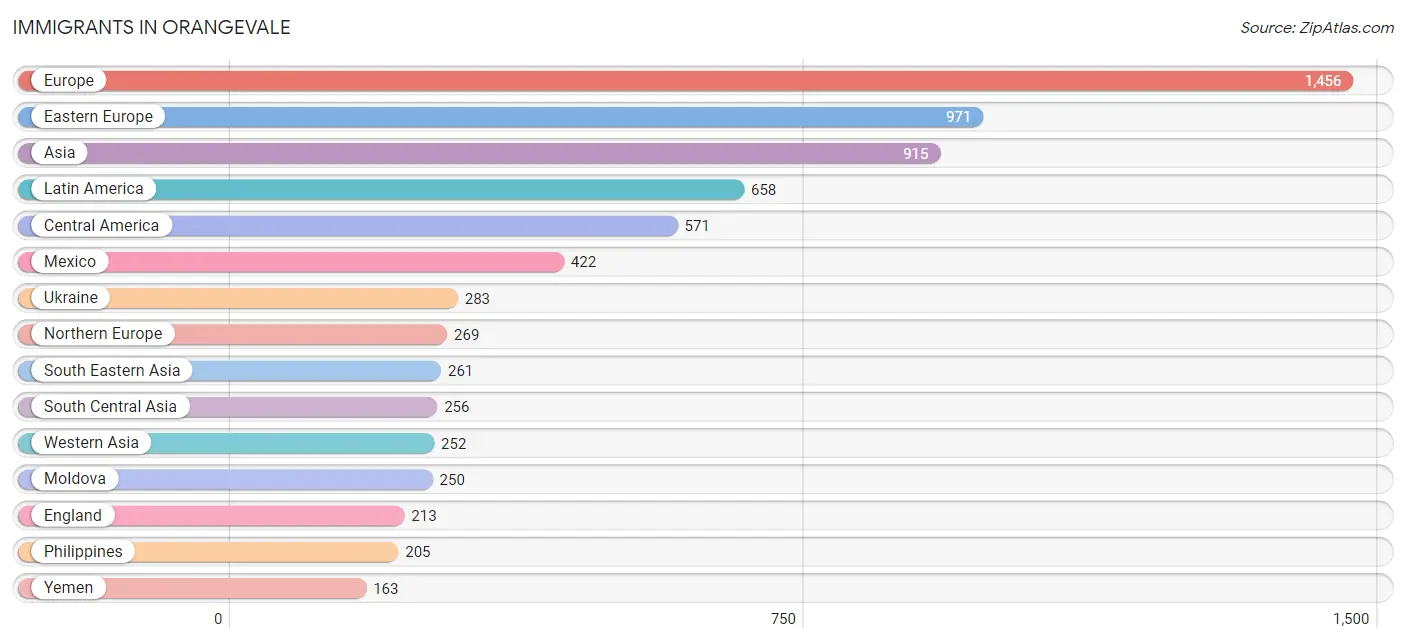
| Immigration Origin | # Population | % Population |
| Afghanistan | 17 | 0.1% |
| Africa | 26 | 0.1% |
| Asia | 915 | 2.5% |
| Azores | 60 | 0.2% |
| Bangladesh | 33 | 0.1% |
| Belarus | 28 | 0.1% |
| Belize | 1 | 0.0% |
| Bolivia | 13 | 0.0% |
| Bosnia and Herzegovina | 12 | 0.0% |
| Canada | 130 | 0.4% |
| Caribbean | 9 | 0.0% |
| Central America | 571 | 1.6% |
| Chile | 39 | 0.1% |
| China | 78 | 0.2% |
| Colombia | 9 | 0.0% |
| Croatia | 19 | 0.1% |
| Cuba | 9 | 0.0% |
| Denmark | 11 | 0.0% |
| Eastern Africa | 2 | 0.0% |
| Eastern Asia | 141 | 0.4% |
| Eastern Europe | 971 | 2.7% |
| El Salvador | 34 | 0.1% |
| England | 213 | 0.6% |
| Europe | 1,456 | 4.1% |
| Fiji | 17 | 0.1% |
| France | 21 | 0.1% |
| Germany | 37 | 0.1% |
| Guatemala | 8 | 0.0% |
| Honduras | 53 | 0.2% |
| Hong Kong | 16 | 0.0% |
| Hungary | 40 | 0.1% |
| India | 82 | 0.2% |
| Indonesia | 9 | 0.0% |
| Iran | 119 | 0.3% |
| Iraq | 7 | 0.0% |
| Italy | 7 | 0.0% |
| Japan | 30 | 0.1% |
| Korea | 33 | 0.1% |
| Latin America | 658 | 1.8% |
| Mexico | 422 | 1.2% |
| Moldova | 250 | 0.7% |
| Netherlands | 63 | 0.2% |
| Nicaragua | 17 | 0.1% |
| Northern Africa | 24 | 0.1% |
| Northern Europe | 269 | 0.7% |
| Oceania | 17 | 0.1% |
| Panama | 36 | 0.1% |
| Peru | 17 | 0.1% |
| Philippines | 205 | 0.6% |
| Poland | 104 | 0.3% |
| Portugal | 75 | 0.2% |
| Romania | 78 | 0.2% |
| Russia | 115 | 0.3% |
| South America | 78 | 0.2% |
| South Central Asia | 256 | 0.7% |
| South Eastern Asia | 261 | 0.7% |
| Southern Europe | 95 | 0.3% |
| Spain | 13 | 0.0% |
| Taiwan | 33 | 0.1% |
| Turkey | 77 | 0.2% |
| Ukraine | 283 | 0.8% |
| Uzbekistan | 5 | 0.0% |
| Vietnam | 47 | 0.1% |
| Western Asia | 252 | 0.7% |
| Western Europe | 121 | 0.3% |
| Yemen | 163 | 0.4% | View All 66 Rows |
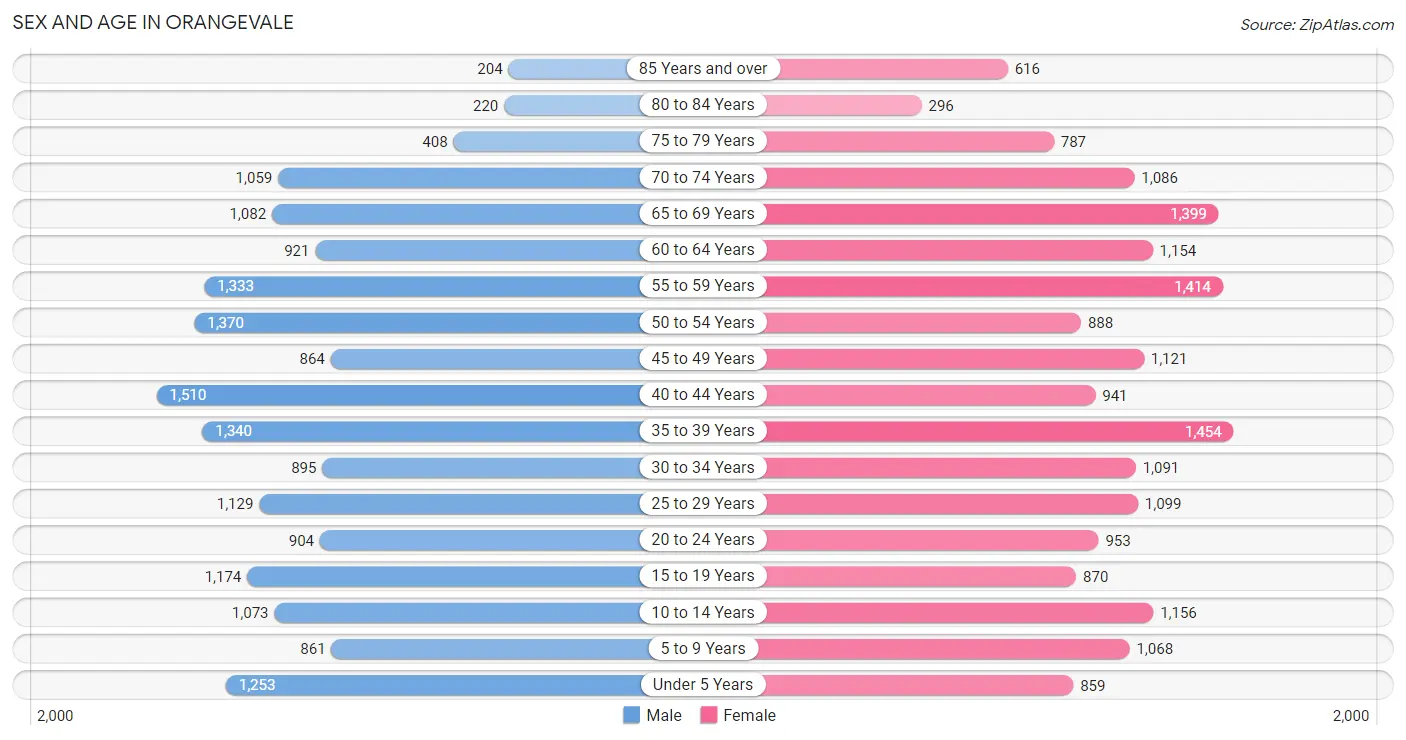
Sex and Age in Orangevale
Sex and Age in Orangevale
The most populous age groups in Orangevale are 40 to 44 Years (1,510 | 8.6%) for men and 35 to 39 Years (1,454 | 8.0%) for women.
| Age Bracket | Male | Female |
| Under 5 Years | 1,253 (7.1%) | 859 (4.7%) |
| 5 to 9 Years | 861 (4.9%) | 1,068 (5.9%) |
| 10 to 14 Years | 1,073 (6.1%) | 1,156 (6.3%) |
| 15 to 19 Years | 1,174 (6.7%) | 870 (4.8%) |
| 20 to 24 Years | 904 (5.1%) | 953 (5.2%) |
| 25 to 29 Years | 1,129 (6.4%) | 1,099 (6.0%) |
| 30 to 34 Years | 895 (5.1%) | 1,091 (6.0%) |
| 35 to 39 Years | 1,340 (7.6%) | 1,454 (8.0%) |
| 40 to 44 Years | 1,510 (8.6%) | 941 (5.2%) |
| 45 to 49 Years | 864 (4.9%) | 1,121 (6.1%) |
| 50 to 54 Years | 1,370 (7.8%) | 888 (4.9%) |
| 55 to 59 Years | 1,333 (7.6%) | 1,414 (7.7%) |
| 60 to 64 Years | 921 (5.2%) | 1,154 (6.3%) |
| 65 to 69 Years | 1,082 (6.1%) | 1,399 (7.7%) |
| 70 to 74 Years | 1,059 (6.0%) | 1,086 (5.9%) |
| 75 to 79 Years | 408 (2.3%) | 787 (4.3%) |
| 80 to 84 Years | 220 (1.3%) | 296 (1.6%) |
| 85 Years and over | 204 (1.2%) | 616 (3.4%) |
| Total | 17,600 (100.0%) | 18,252 (100.0%) |
Families and Households in Orangevale
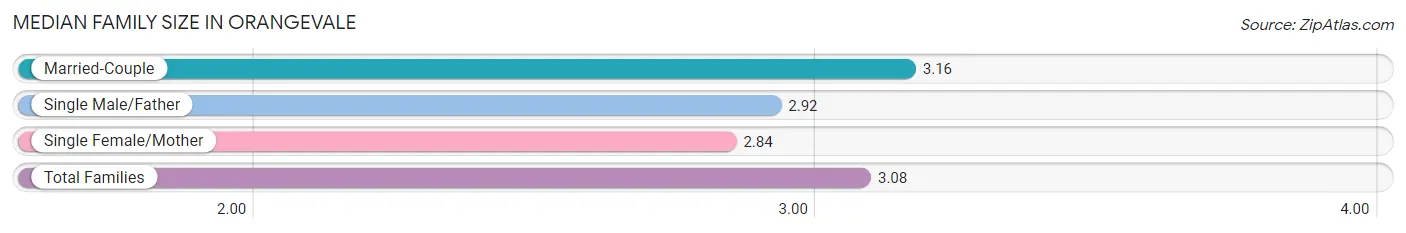
Median Family Size in Orangevale
The median family size in Orangevale is 3.08 persons per family, with married-couple families (6,707 | 71.5%) accounting for the largest median family size of 3.16 persons per family. On the other hand, single female/mother families (1,804 | 19.2%) represent the smallest median family size with 2.84 persons per family.
| Family Type | # Families | Family Size |
| Married-Couple | 6,707 (71.5%) | 3.16 |
| Single Male/Father | 876 (9.3%) | 2.92 |
| Single Female/Mother | 1,804 (19.2%) | 2.84 |
| Total Families | 9,387 (100.0%) | 3.08 |
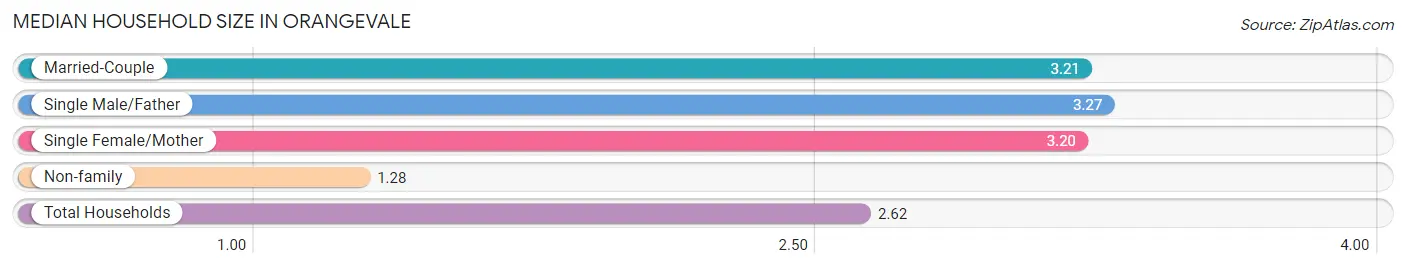
Median Household Size in Orangevale
The median household size in Orangevale is 2.62 persons per household, with single male/father households (876 | 6.5%) accounting for the largest median household size of 3.27 persons per household. non-family households (4,189 | 30.9%) represent the smallest median household size with 1.28 persons per household.
| Household Type | # Households | Household Size |
| Married-Couple | 6,707 (49.4%) | 3.21 |
| Single Male/Father | 876 (6.5%) | 3.27 |
| Single Female/Mother | 1,804 (13.3%) | 3.20 |
| Non-family | 4,189 (30.9%) | 1.28 |
| Total Households | 13,576 (100.0%) | 2.62 |
Household Size by Marriage Status in Orangevale
Out of a total of 13,576 households in Orangevale, 9,387 (69.1%) are family households, while 4,189 (30.9%) are nonfamily households. The most numerous type of family households are 2-person households, comprising 3,961, and the most common type of nonfamily households are 1-person households, comprising 3,313.
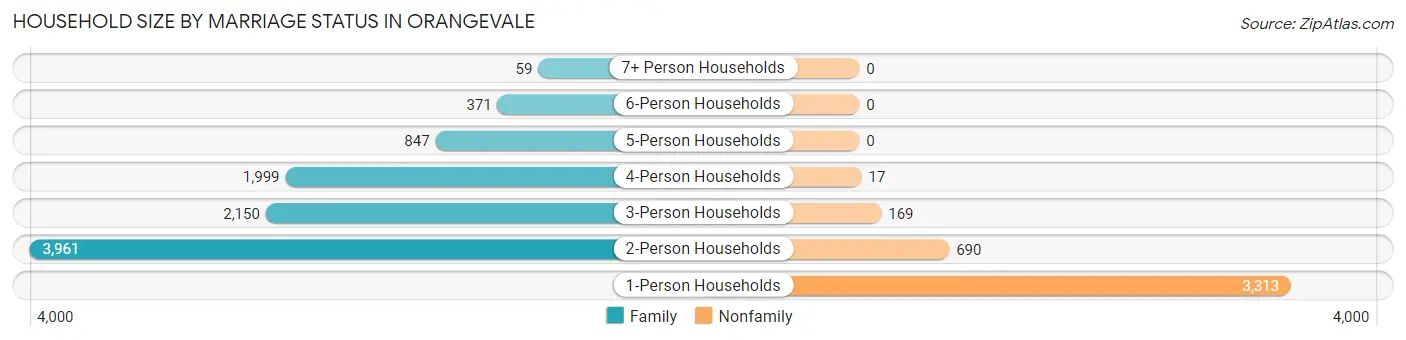
| Household Size | Family Households | Nonfamily Households |
| 1-Person Households | - | 3,313 (24.4%) |
| 2-Person Households | 3,961 (29.2%) | 690 (5.1%) |
| 3-Person Households | 2,150 (15.8%) | 169 (1.2%) |
| 4-Person Households | 1,999 (14.7%) | 17 (0.1%) |
| 5-Person Households | 847 (6.2%) | 0 (0.0%) |
| 6-Person Households | 371 (2.7%) | 0 (0.0%) |
| 7+ Person Households | 59 (0.4%) | 0 (0.0%) |
| Total | 9,387 (69.1%) | 4,189 (30.9%) |
Female Fertility in Orangevale
Fertility by Age in Orangevale
Average fertility rate in Orangevale is 34.0 births per 1,000 women. Women in the age bracket of 20 to 34 years have the highest fertility rate with 73.0 births per 1,000 women. Women in the age bracket of 20 to 34 years acount for 87.7% of all women with births.
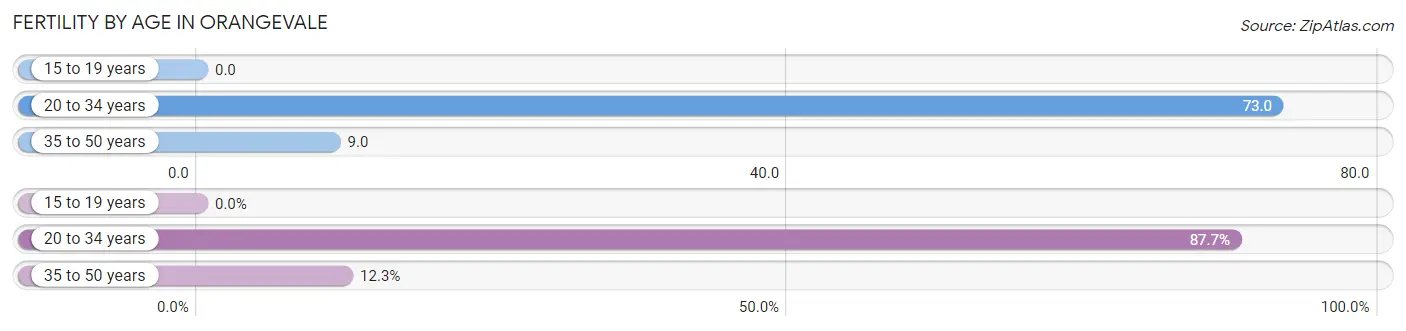
| Age Bracket | Women with Births | Births / 1,000 Women |
| 15 to 19 years | 0 (0.0%) | 0.0 |
| 20 to 34 years | 228 (87.7%) | 73.0 |
| 35 to 50 years | 32 (12.3%) | 9.0 |
| Total | 260 (100.0%) | 34.0 |
Fertility by Age by Marriage Status in Orangevale
81.2% of women with births (260) in Orangevale are married. The highest percentage of unmarried women with births falls into 20 to 34 years age bracket with 21.5% of them unmarried at the time of birth, while the lowest percentage of unmarried women with births belong to 35 to 50 years age bracket with 0.0% of them unmarried.
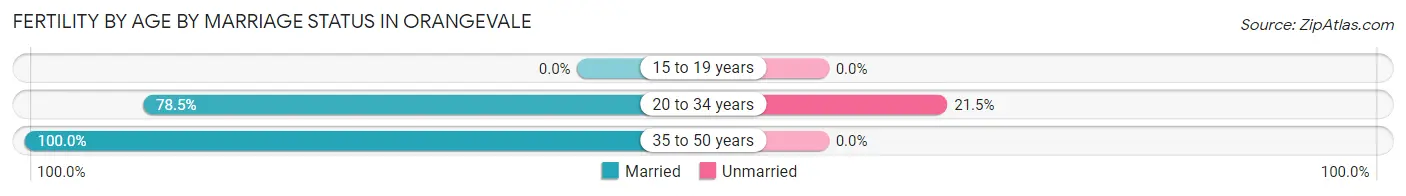
| Age Bracket | Married | Unmarried |
| 15 to 19 years | 0 (0.0%) | 0 (0.0%) |
| 20 to 34 years | 179 (78.5%) | 49 (21.5%) |
| 35 to 50 years | 32 (100.0%) | 0 (0.0%) |
| Total | 211 (81.1%) | 49 (18.9%) |
Fertility by Education in Orangevale
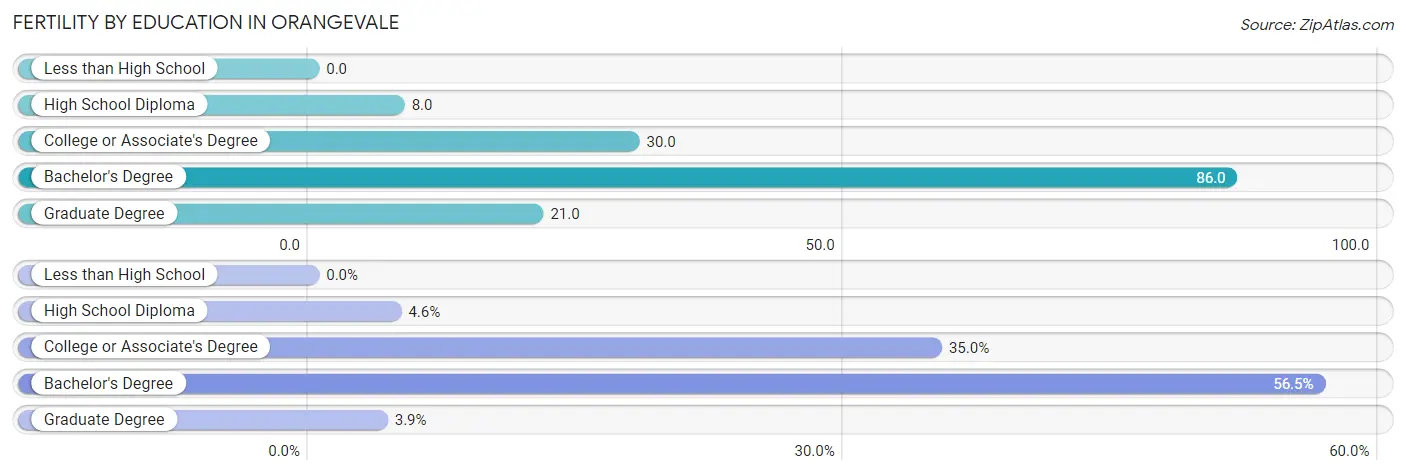
| Educational Attainment | Women with Births | Births / 1,000 Women |
| Less than High School | 0 (0.0%) | 0.0 |
| High School Diploma | 12 (4.6%) | 8.0 |
| College or Associate's Degree | 91 (35.0%) | 30.0 |
| Bachelor's Degree | 147 (56.5%) | 86.0 |
| Graduate Degree | 10 (3.8%) | 21.0 |
| Total | 260 (100.0%) | 34.0 |
Fertility by Education by Marriage Status in Orangevale
18.9% of women with births in Orangevale are unmarried. Women with the educational attainment of high school diploma are most likely to be married with 100.0% of them married at childbirth, while women with the educational attainment of college or associate's degree are least likely to be married with 53.8% of them unmarried at childbirth.
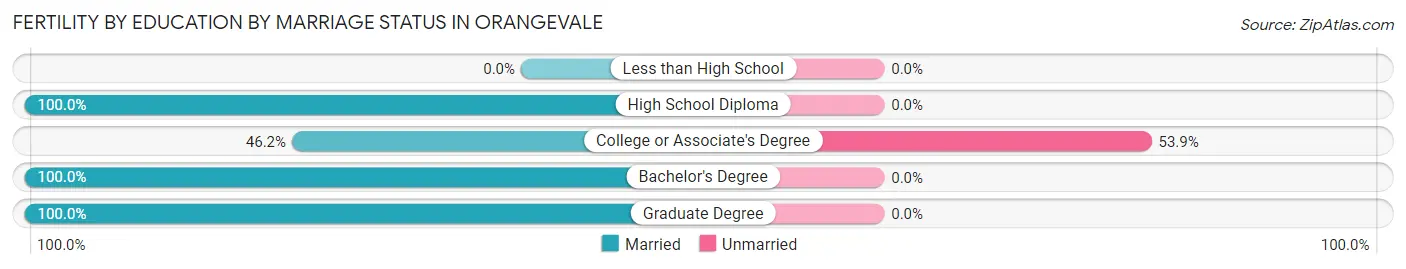
| Educational Attainment | Married | Unmarried |
| Less than High School | 0 (0.0%) | 0 (0.0%) |
| High School Diploma | 12 (100.0%) | 0 (0.0%) |
| College or Associate's Degree | 42 (46.2%) | 49 (53.8%) |
| Bachelor's Degree | 147 (100.0%) | 0 (0.0%) |
| Graduate Degree | 10 (100.0%) | 0 (0.0%) |
| Total | 211 (81.1%) | 49 (18.9%) |
Employment Characteristics in Orangevale
Employment by Class of Employer in Orangevale
Among the 16,744 employed individuals in Orangevale, private company employees (10,277 | 61.4%), state government employees (1,619 | 9.7%), and not-for-profit organizations (1,589 | 9.5%) make up the most common classes of employment.
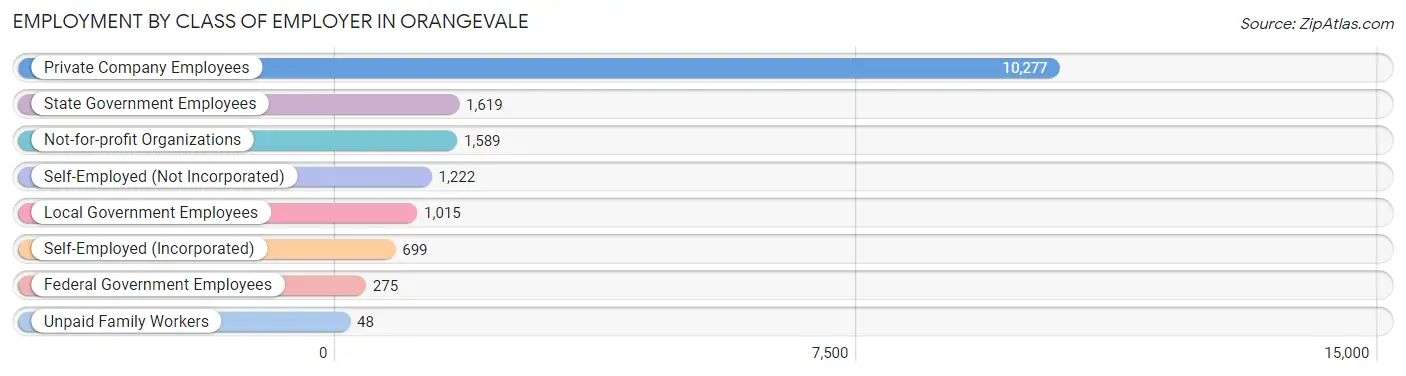
| Employer Class | # Employees | % Employees |
| Private Company Employees | 10,277 | 61.4% |
| Self-Employed (Incorporated) | 699 | 4.2% |
| Self-Employed (Not Incorporated) | 1,222 | 7.3% |
| Not-for-profit Organizations | 1,589 | 9.5% |
| Local Government Employees | 1,015 | 6.1% |
| State Government Employees | 1,619 | 9.7% |
| Federal Government Employees | 275 | 1.6% |
| Unpaid Family Workers | 48 | 0.3% |
| Total | 16,744 | 100.0% |
Employment Status by Age in Orangevale
According to the labor force statistics for Orangevale, out of the total population over 16 years of age (29,286), 61.9% or 18,128 individuals are in the labor force, with 5.2% or 943 of them unemployed. The age group with the highest labor force participation rate is 35 to 44 years, with 89.1% or 4,673 individuals in the labor force. Within the labor force, the 75 years and over age range has the highest percentage of unemployed individuals, with 24.1% or 20 of them being unemployed.
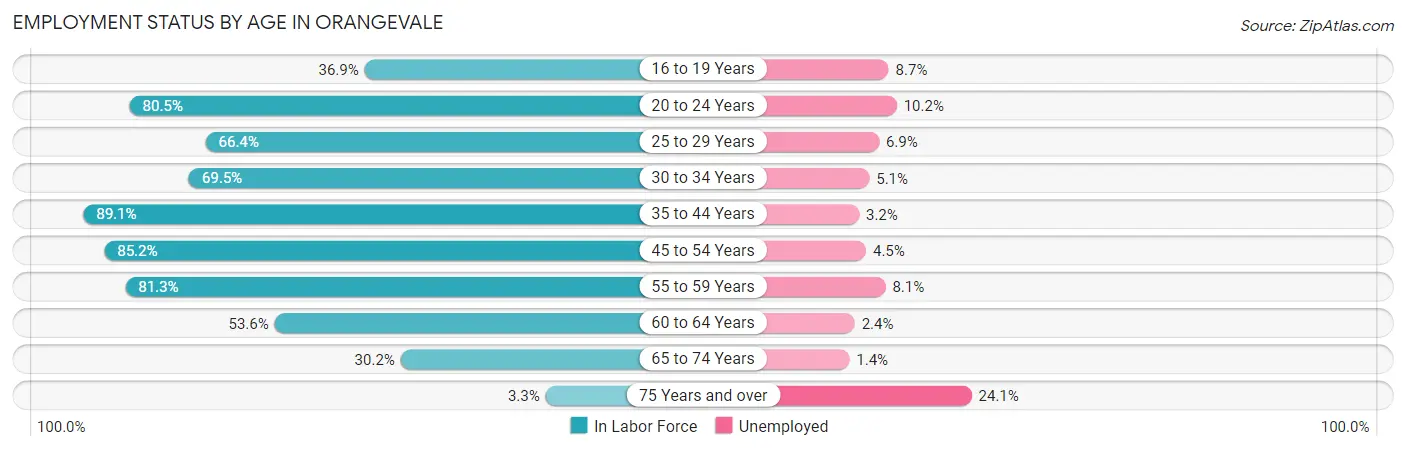
| Age Bracket | In Labor Force | Unemployed |
| 16 to 19 Years | 645 (36.9%) | 56 (8.7%) |
| 20 to 24 Years | 1,495 (80.5%) | 152 (10.2%) |
| 25 to 29 Years | 1,479 (66.4%) | 102 (6.9%) |
| 30 to 34 Years | 1,380 (69.5%) | 70 (5.1%) |
| 35 to 44 Years | 4,673 (89.1%) | 150 (3.2%) |
| 45 to 54 Years | 3,615 (85.2%) | 163 (4.5%) |
| 55 to 59 Years | 2,233 (81.3%) | 181 (8.1%) |
| 60 to 64 Years | 1,112 (53.6%) | 27 (2.4%) |
| 65 to 74 Years | 1,397 (30.2%) | 20 (1.4%) |
| 75 Years and over | 84 (3.3%) | 20 (24.1%) |
| Total | 18,128 (61.9%) | 943 (5.2%) |
Employment Status by Educational Attainment in Orangevale
According to labor force statistics for Orangevale, 78.3% of individuals (14,504) out of the total population between 25 and 64 years of age (18,524) are in the labor force, with 4.8% or 696 of them being unemployed. The group with the highest labor force participation rate are those with the educational attainment of bachelor's degree or higher, with 85.6% or 4,903 individuals in the labor force. Within the labor force, individuals with high school diploma education have the highest percentage of unemployment, with 6.6% or 210 of them being unemployed.
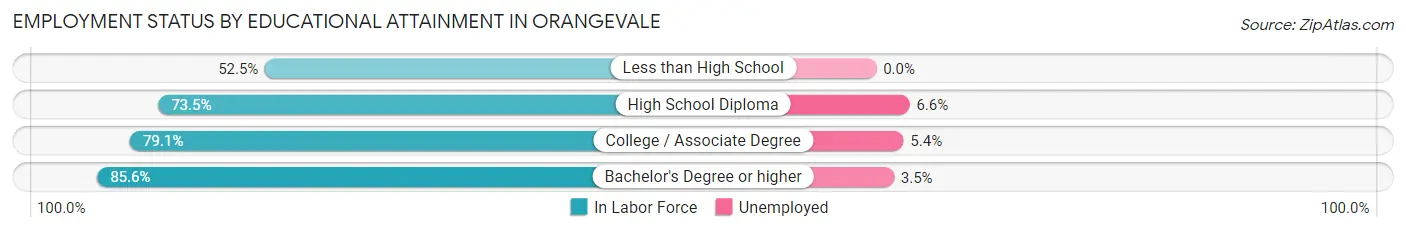
| Educational Attainment | In Labor Force | Unemployed |
| Less than High School | 570 (52.5%) | 0 (0.0%) |
| High School Diploma | 3,177 (73.5%) | 285 (6.6%) |
| College / Associate Degree | 5,843 (79.1%) | 399 (5.4%) |
| Bachelor's Degree or higher | 4,903 (85.6%) | 200 (3.5%) |
| Total | 14,504 (78.3%) | 889 (4.8%) |
Employment Occupations by Sex in Orangevale
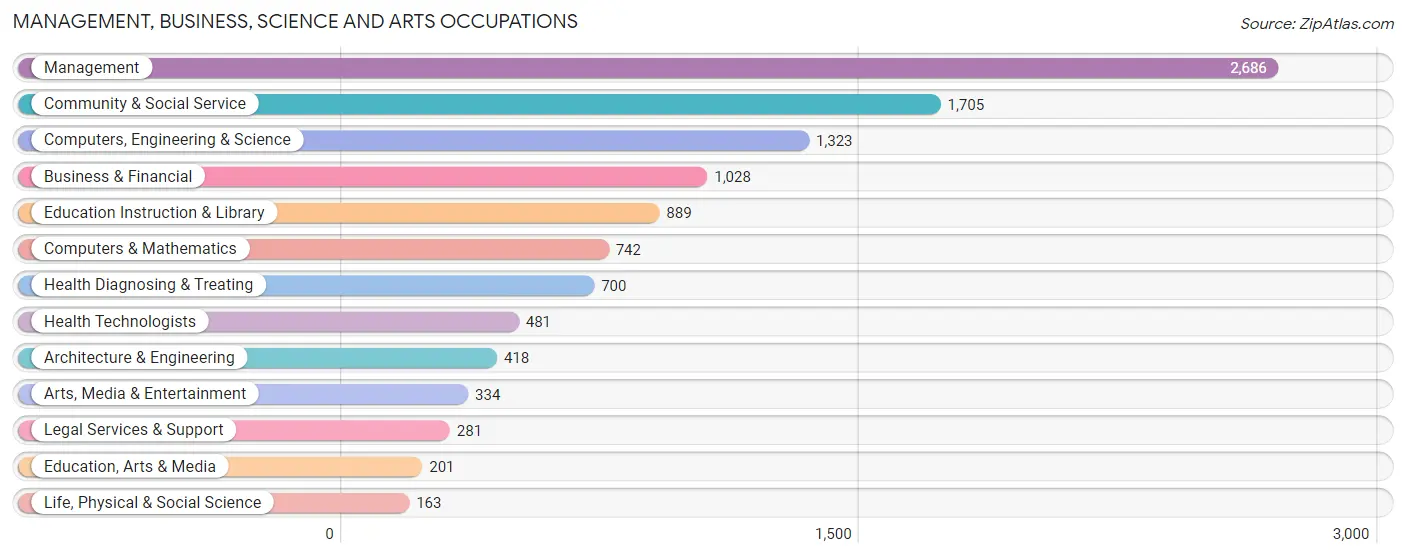
Management, Business, Science and Arts Occupations
The most common Management, Business, Science and Arts occupations in Orangevale are Management (2,686 | 15.7%), Community & Social Service (1,705 | 9.9%), Computers, Engineering & Science (1,323 | 7.7%), Business & Financial (1,028 | 6.0%), and Education Instruction & Library (889 | 5.2%).
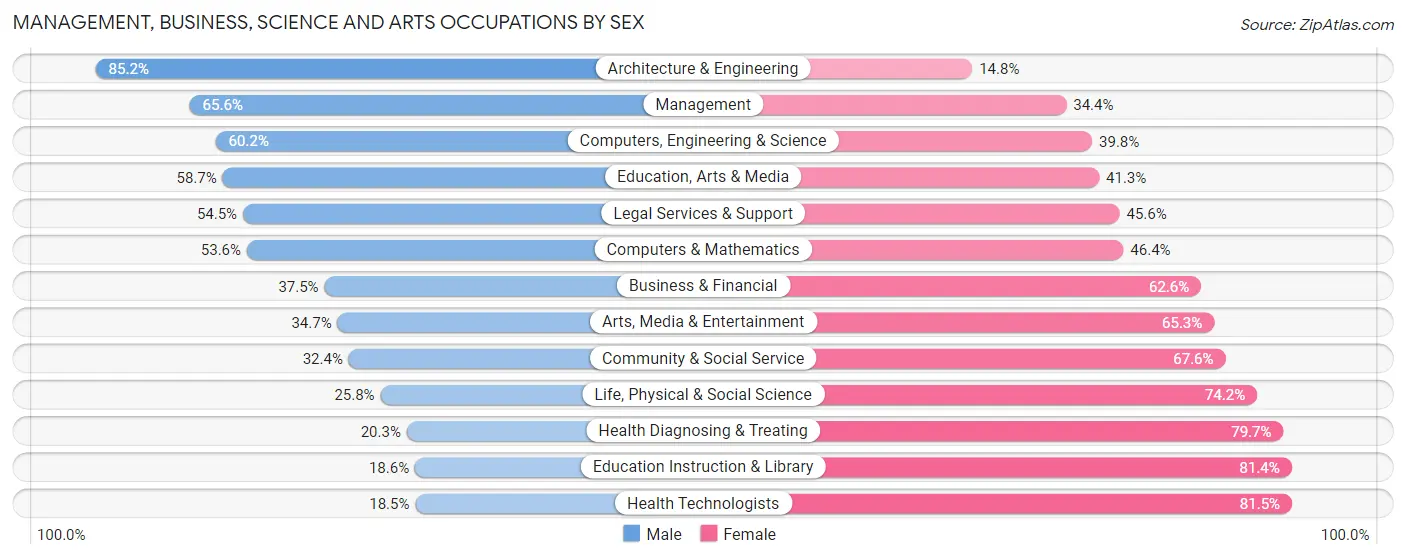
Management, Business, Science and Arts Occupations by Sex
Within the Management, Business, Science and Arts occupations in Orangevale, the most male-oriented occupations are Architecture & Engineering (85.2%), Management (65.6%), and Computers, Engineering & Science (60.2%), while the most female-oriented occupations are Health Technologists (81.5%), Education Instruction & Library (81.4%), and Health Diagnosing & Treating (79.7%).
| Occupation | Male | Female |
| Management | 1,761 (65.6%) | 925 (34.4%) |
| Business & Financial | 385 (37.4%) | 643 (62.5%) |
| Computers, Engineering & Science | 796 (60.2%) | 527 (39.8%) |
| Computers & Mathematics | 398 (53.6%) | 344 (46.4%) |
| Architecture & Engineering | 356 (85.2%) | 62 (14.8%) |
| Life, Physical & Social Science | 42 (25.8%) | 121 (74.2%) |
| Community & Social Service | 552 (32.4%) | 1,153 (67.6%) |
| Education, Arts & Media | 118 (58.7%) | 83 (41.3%) |
| Legal Services & Support | 153 (54.4%) | 128 (45.6%) |
| Education Instruction & Library | 165 (18.6%) | 724 (81.4%) |
| Arts, Media & Entertainment | 116 (34.7%) | 218 (65.3%) |
| Health Diagnosing & Treating | 142 (20.3%) | 558 (79.7%) |
| Health Technologists | 89 (18.5%) | 392 (81.5%) |
| Total (Category) | 3,636 (48.9%) | 3,806 (51.1%) |
| Total (Overall) | 9,280 (54.1%) | 7,877 (45.9%) |
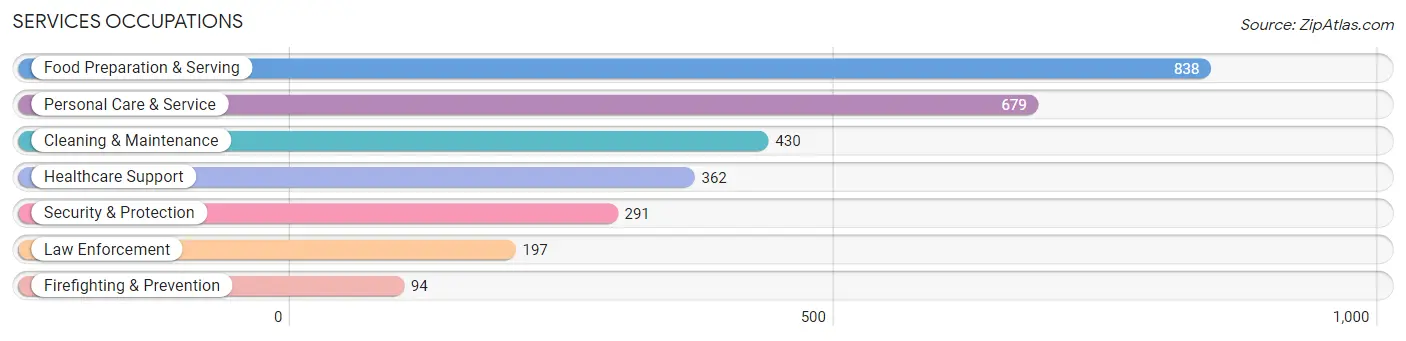
Services Occupations
The most common Services occupations in Orangevale are Food Preparation & Serving (838 | 4.9%), Personal Care & Service (679 | 4.0%), Cleaning & Maintenance (430 | 2.5%), Healthcare Support (362 | 2.1%), and Security & Protection (291 | 1.7%).
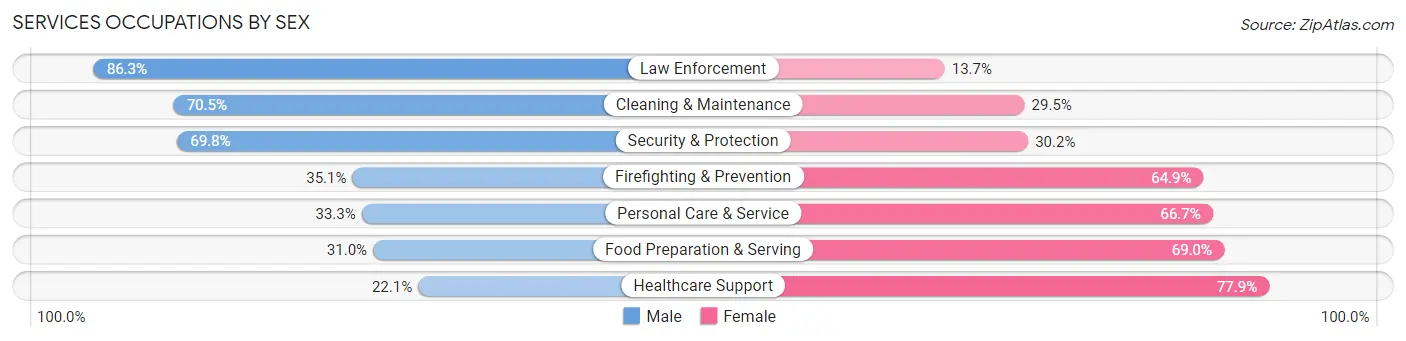
Services Occupations by Sex
Within the Services occupations in Orangevale, the most male-oriented occupations are Law Enforcement (86.3%), Cleaning & Maintenance (70.5%), and Security & Protection (69.8%), while the most female-oriented occupations are Healthcare Support (77.9%), Food Preparation & Serving (69.0%), and Personal Care & Service (66.7%).
| Occupation | Male | Female |
| Healthcare Support | 80 (22.1%) | 282 (77.9%) |
| Security & Protection | 203 (69.8%) | 88 (30.2%) |
| Firefighting & Prevention | 33 (35.1%) | 61 (64.9%) |
| Law Enforcement | 170 (86.3%) | 27 (13.7%) |
| Food Preparation & Serving | 260 (31.0%) | 578 (69.0%) |
| Cleaning & Maintenance | 303 (70.5%) | 127 (29.5%) |
| Personal Care & Service | 226 (33.3%) | 453 (66.7%) |
| Total (Category) | 1,072 (41.2%) | 1,528 (58.8%) |
| Total (Overall) | 9,280 (54.1%) | 7,877 (45.9%) |
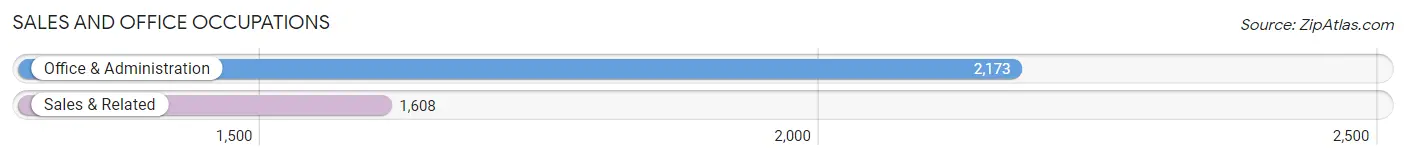
Sales and Office Occupations
The most common Sales and Office occupations in Orangevale are Office & Administration (2,173 | 12.7%), and Sales & Related (1,608 | 9.4%).
Sales and Office Occupations by Sex
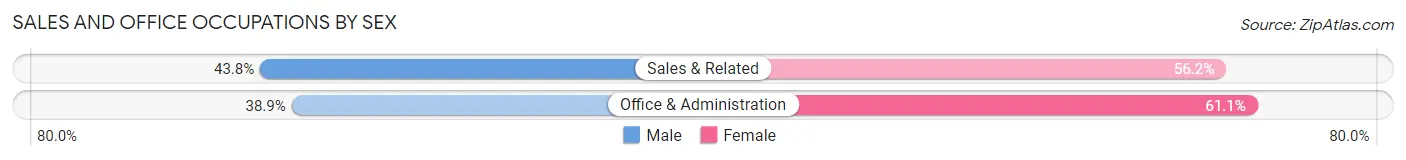
| Occupation | Male | Female |
| Sales & Related | 704 (43.8%) | 904 (56.2%) |
| Office & Administration | 846 (38.9%) | 1,327 (61.1%) |
| Total (Category) | 1,550 (41.0%) | 2,231 (59.0%) |
| Total (Overall) | 9,280 (54.1%) | 7,877 (45.9%) |
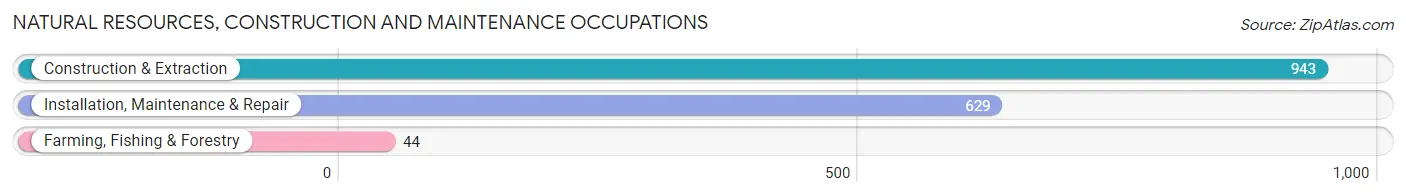
Natural Resources, Construction and Maintenance Occupations
The most common Natural Resources, Construction and Maintenance occupations in Orangevale are Construction & Extraction (943 | 5.5%), Installation, Maintenance & Repair (629 | 3.7%), and Farming, Fishing & Forestry (44 | 0.3%).
Natural Resources, Construction and Maintenance Occupations by Sex
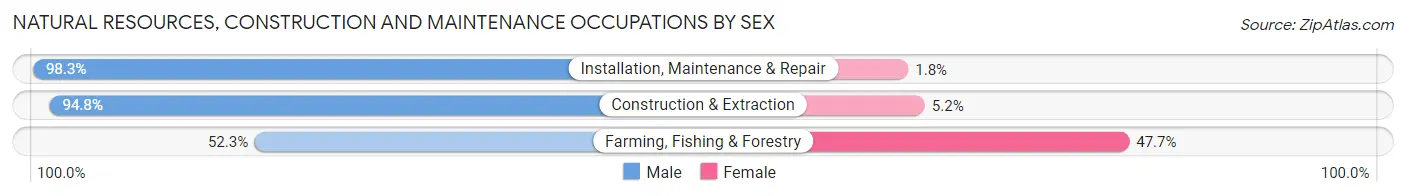
| Occupation | Male | Female |
| Farming, Fishing & Forestry | 23 (52.3%) | 21 (47.7%) |
| Construction & Extraction | 894 (94.8%) | 49 (5.2%) |
| Installation, Maintenance & Repair | 618 (98.3%) | 11 (1.8%) |
| Total (Category) | 1,535 (95.0%) | 81 (5.0%) |
| Total (Overall) | 9,280 (54.1%) | 7,877 (45.9%) |
Production, Transportation and Moving Occupations
The most common Production, Transportation and Moving occupations in Orangevale are Transportation (672 | 3.9%), Production (611 | 3.6%), and Material Moving (435 | 2.5%).
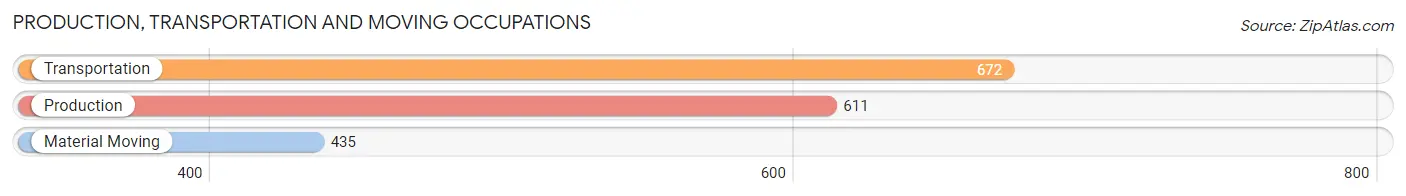
Production, Transportation and Moving Occupations by Sex
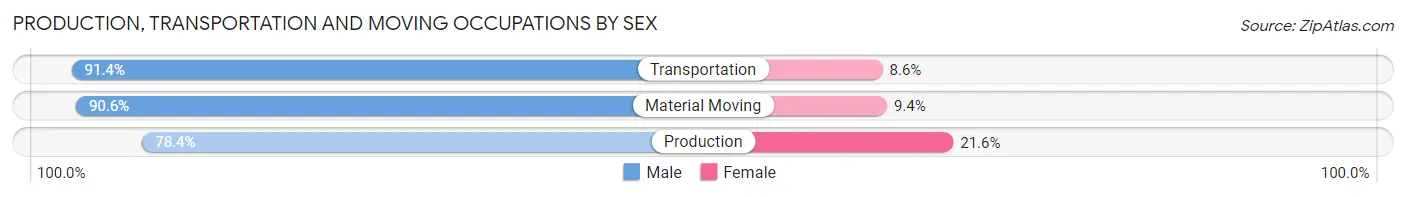
| Occupation | Male | Female |
| Production | 479 (78.4%) | 132 (21.6%) |
| Transportation | 614 (91.4%) | 58 (8.6%) |
| Material Moving | 394 (90.6%) | 41 (9.4%) |
| Total (Category) | 1,487 (86.6%) | 231 (13.5%) |
| Total (Overall) | 9,280 (54.1%) | 7,877 (45.9%) |
Employment Industries by Sex in Orangevale
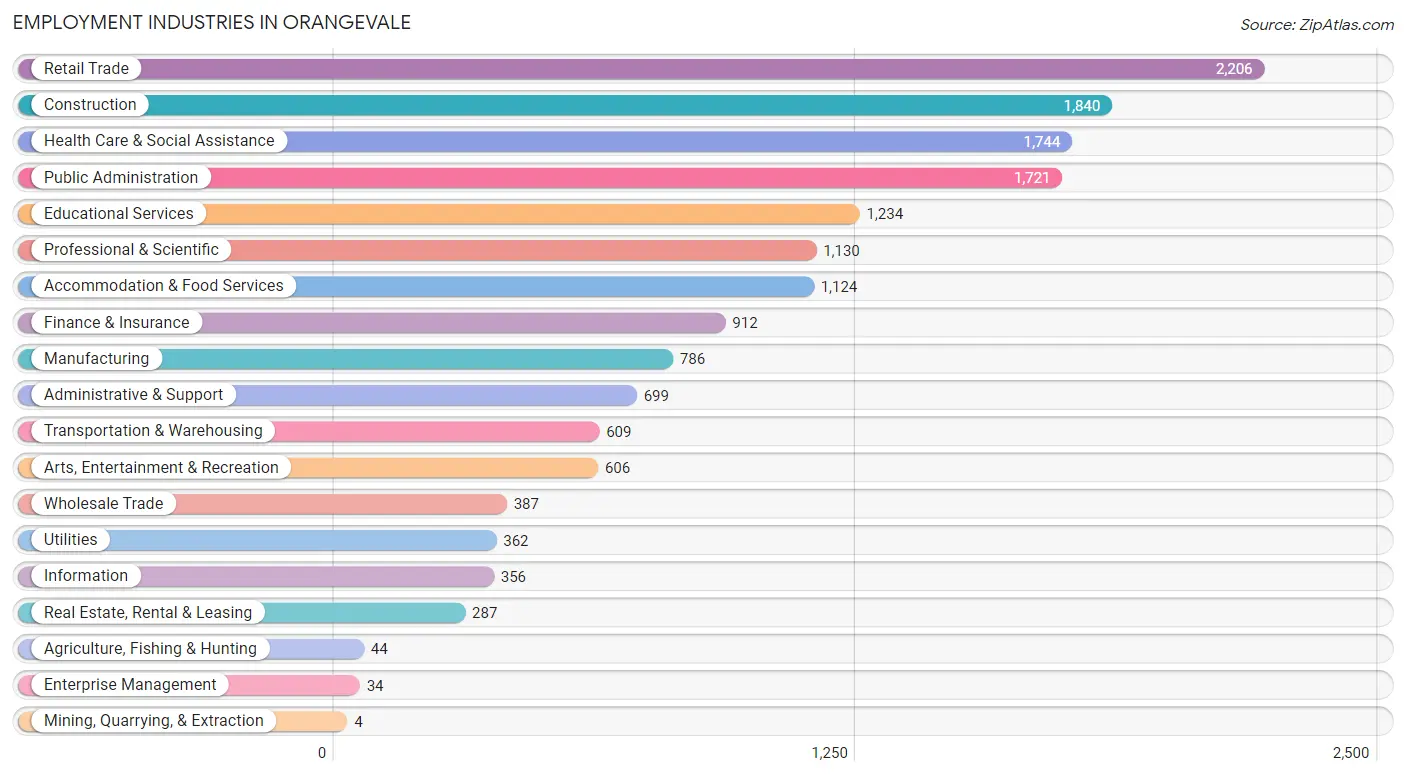
Employment Industries in Orangevale
The major employment industries in Orangevale include Retail Trade (2,206 | 12.9%), Construction (1,840 | 10.7%), Health Care & Social Assistance (1,744 | 10.2%), Public Administration (1,721 | 10.0%), and Educational Services (1,234 | 7.2%).
Employment Industries by Sex in Orangevale
The Orangevale industries that see more men than women are Mining, Quarrying, & Extraction (100.0%), Information (83.4%), and Construction (82.0%), whereas the industries that tend to have a higher number of women are Educational Services (78.2%), Health Care & Social Assistance (73.1%), and Real Estate, Rental & Leasing (64.5%).
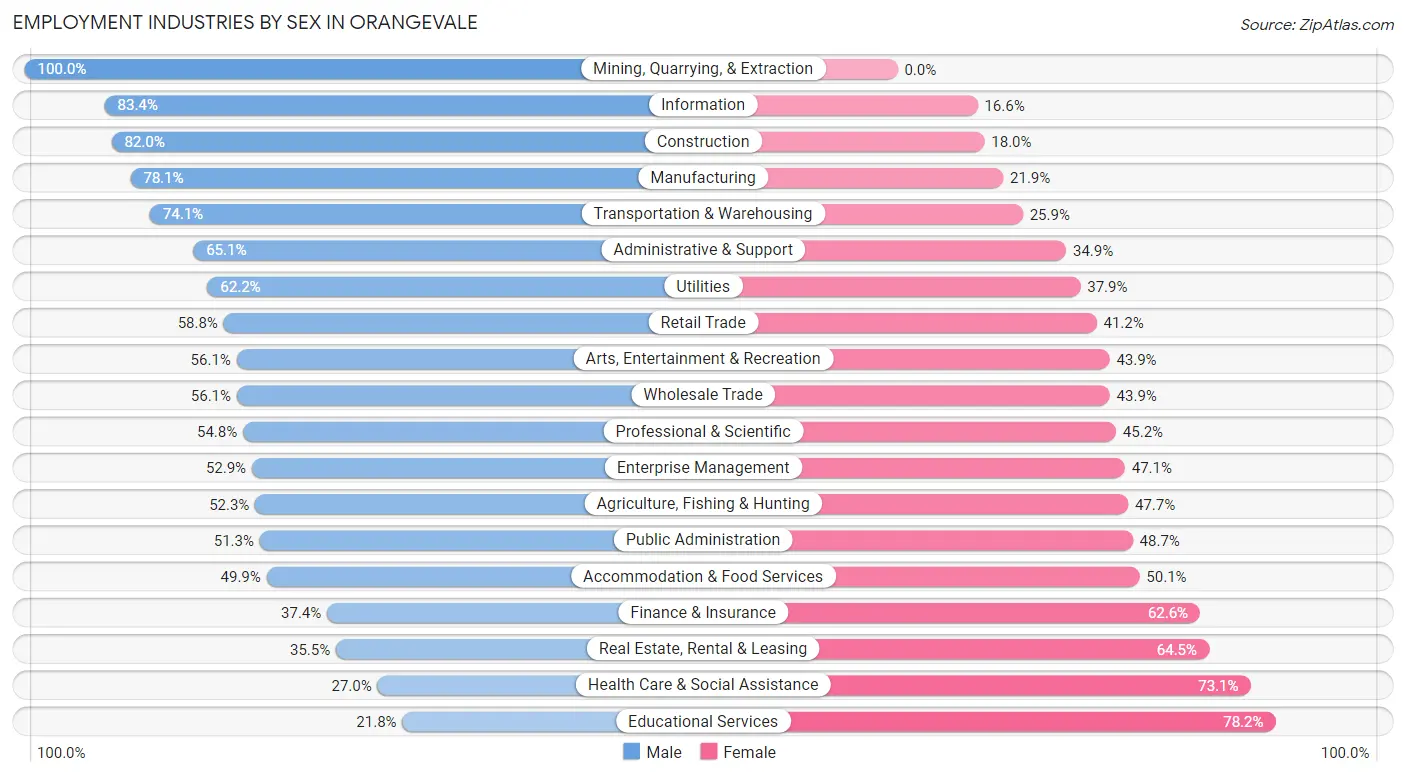
| Industry | Male | Female |
| Agriculture, Fishing & Hunting | 23 (52.3%) | 21 (47.7%) |
| Mining, Quarrying, & Extraction | 4 (100.0%) | 0 (0.0%) |
| Construction | 1,509 (82.0%) | 331 (18.0%) |
| Manufacturing | 614 (78.1%) | 172 (21.9%) |
| Wholesale Trade | 217 (56.1%) | 170 (43.9%) |
| Retail Trade | 1,297 (58.8%) | 909 (41.2%) |
| Transportation & Warehousing | 451 (74.1%) | 158 (25.9%) |
| Utilities | 225 (62.2%) | 137 (37.9%) |
| Information | 297 (83.4%) | 59 (16.6%) |
| Finance & Insurance | 341 (37.4%) | 571 (62.6%) |
| Real Estate, Rental & Leasing | 102 (35.5%) | 185 (64.5%) |
| Professional & Scientific | 619 (54.8%) | 511 (45.2%) |
| Enterprise Management | 18 (52.9%) | 16 (47.1%) |
| Administrative & Support | 455 (65.1%) | 244 (34.9%) |
| Educational Services | 269 (21.8%) | 965 (78.2%) |
| Health Care & Social Assistance | 470 (27.0%) | 1,274 (73.1%) |
| Arts, Entertainment & Recreation | 340 (56.1%) | 266 (43.9%) |
| Accommodation & Food Services | 561 (49.9%) | 563 (50.1%) |
| Public Administration | 883 (51.3%) | 838 (48.7%) |
| Total | 9,280 (54.1%) | 7,877 (45.9%) |
Education in Orangevale
School Enrollment in Orangevale
The most common levels of schooling among the 8,498 students in Orangevale are college / undergraduate (2,376 | 28.0%), high school (1,767 | 20.8%), and middle school (1,691 | 19.9%).
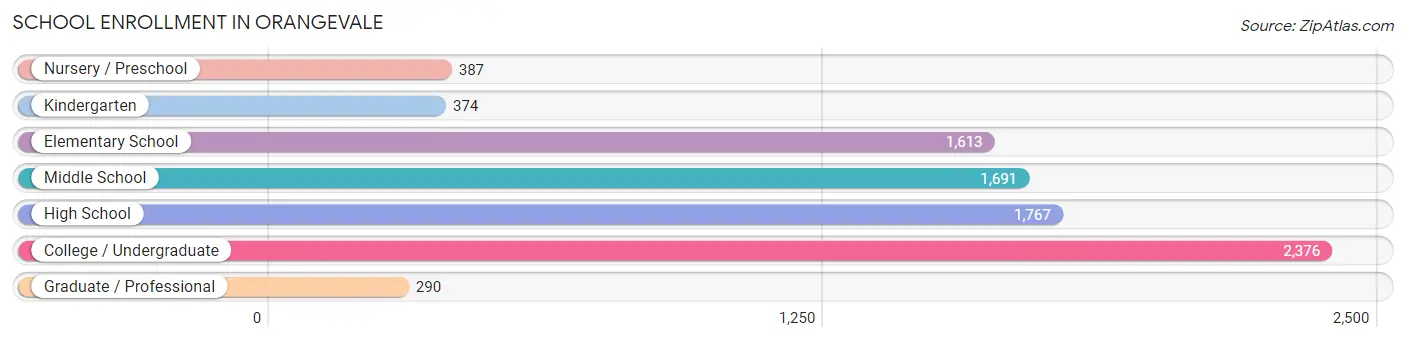
| School Level | # Students | % Students |
| Nursery / Preschool | 387 | 4.5% |
| Kindergarten | 374 | 4.4% |
| Elementary School | 1,613 | 19.0% |
| Middle School | 1,691 | 19.9% |
| High School | 1,767 | 20.8% |
| College / Undergraduate | 2,376 | 28.0% |
| Graduate / Professional | 290 | 3.4% |
| Total | 8,498 | 100.0% |
School Enrollment by Age by Funding Source in Orangevale
Out of a total of 8,498 students who are enrolled in schools in Orangevale, 926 (10.9%) attend a private institution, while the remaining 7,572 (89.1%) are enrolled in public schools. The age group of 3 to 4 year olds has the highest likelihood of being enrolled in private schools, with 167 (63.5% in the age bracket) enrolled. Conversely, the age group of 18 to 19 year olds has the lowest likelihood of being enrolled in a private school, with 473 (99.8% in the age bracket) attending a public institution.
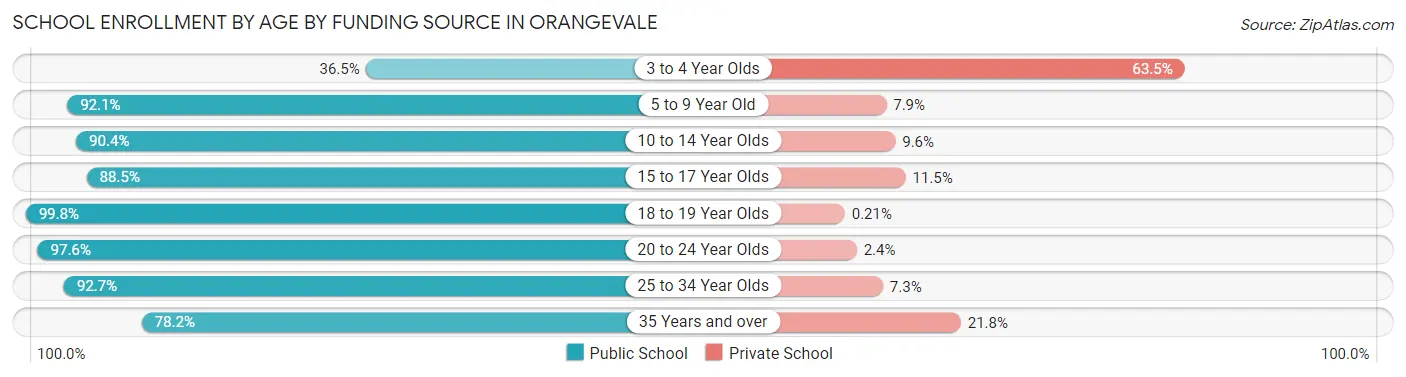
| Age Bracket | Public School | Private School |
| 3 to 4 Year Olds | 96 (36.5%) | 167 (63.5%) |
| 5 to 9 Year Old | 1,692 (92.1%) | 146 (7.9%) |
| 10 to 14 Year Olds | 1,975 (90.4%) | 210 (9.6%) |
| 15 to 17 Year Olds | 1,166 (88.5%) | 152 (11.5%) |
| 18 to 19 Year Olds | 473 (99.8%) | 1 (0.2%) |
| 20 to 24 Year Olds | 924 (97.6%) | 23 (2.4%) |
| 25 to 34 Year Olds | 609 (92.7%) | 48 (7.3%) |
| 35 Years and over | 638 (78.2%) | 178 (21.8%) |
| Total | 7,572 (89.1%) | 926 (10.9%) |
Educational Attainment by Field of Study in Orangevale
Business (1,540 | 17.9%), science & technology (975 | 11.3%), arts & humanities (799 | 9.3%), liberal arts & history (703 | 8.2%), and social sciences (688 | 8.0%) are the most common fields of study among 8,615 individuals in Orangevale who have obtained a bachelor's degree or higher.
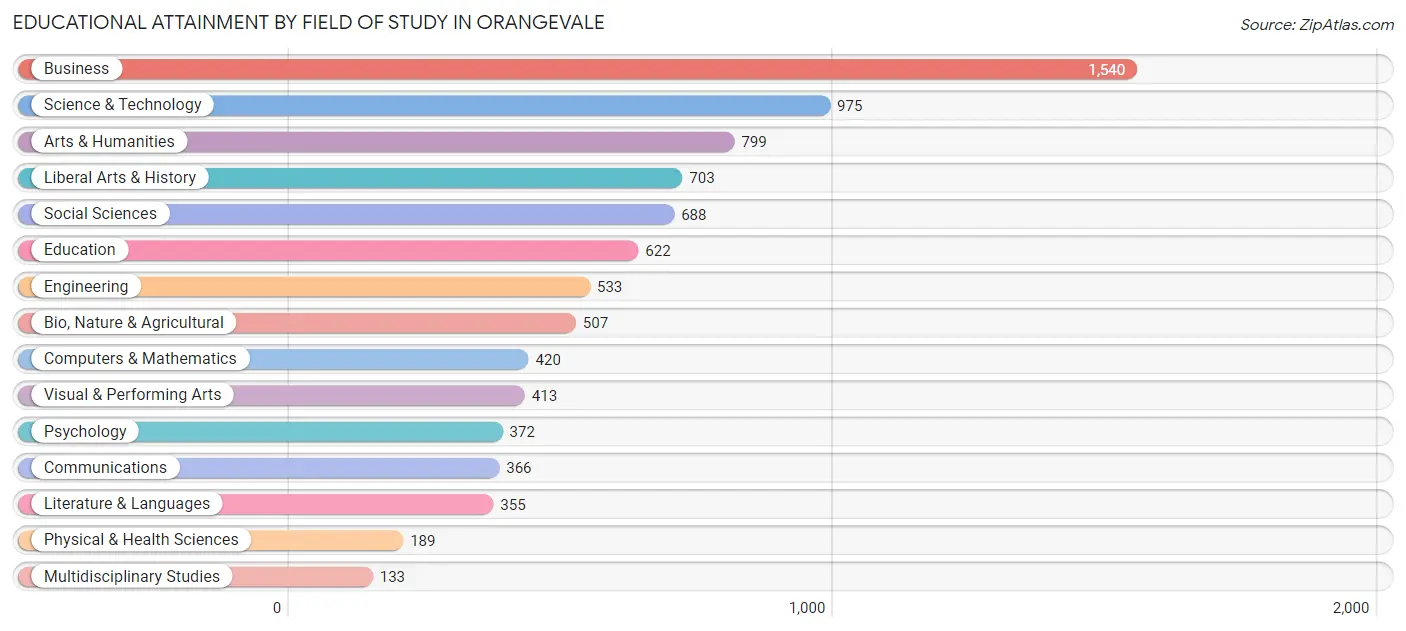
| Field of Study | # Graduates | % Graduates |
| Computers & Mathematics | 420 | 4.9% |
| Bio, Nature & Agricultural | 507 | 5.9% |
| Physical & Health Sciences | 189 | 2.2% |
| Psychology | 372 | 4.3% |
| Social Sciences | 688 | 8.0% |
| Engineering | 533 | 6.2% |
| Multidisciplinary Studies | 133 | 1.5% |
| Science & Technology | 975 | 11.3% |
| Business | 1,540 | 17.9% |
| Education | 622 | 7.2% |
| Literature & Languages | 355 | 4.1% |
| Liberal Arts & History | 703 | 8.2% |
| Visual & Performing Arts | 413 | 4.8% |
| Communications | 366 | 4.3% |
| Arts & Humanities | 799 | 9.3% |
| Total | 8,615 | 100.0% |
Transportation & Commute in Orangevale
Vehicle Availability by Sex in Orangevale
The most prevalent vehicle ownership categories in Orangevale are males with 2 vehicles (3,169, accounting for 34.7%) and females with 2 vehicles (2,755, making up 41.7%).
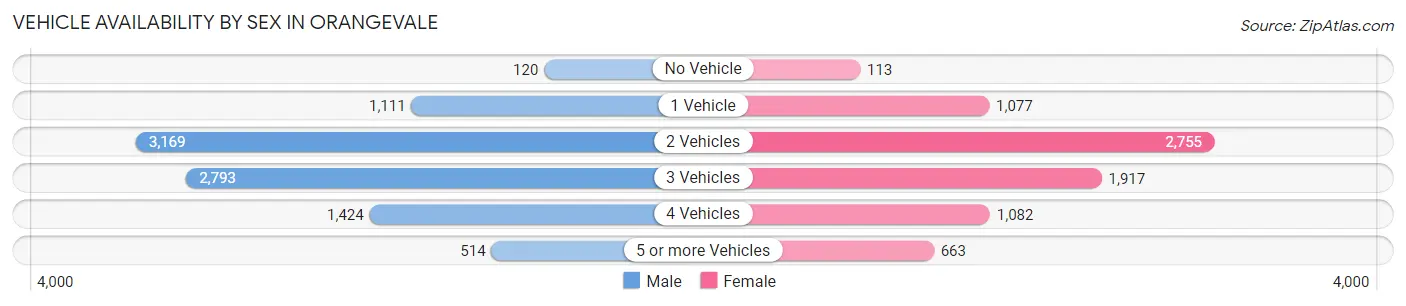
| Vehicles Available | Male | Female |
| No Vehicle | 120 (1.3%) | 113 (1.5%) |
| 1 Vehicle | 1,111 (12.2%) | 1,077 (14.2%) |
| 2 Vehicles | 3,169 (34.7%) | 2,755 (36.2%) |
| 3 Vehicles | 2,793 (30.6%) | 1,917 (25.2%) |
| 4 Vehicles | 1,424 (15.6%) | 1,082 (14.2%) |
| 5 or more Vehicles | 514 (5.6%) | 663 (8.7%) |
| Total | 9,131 (100.0%) | 7,607 (100.0%) |
Commute Time in Orangevale
The most frequently occuring commute durations in Orangevale are 30 to 34 minutes (2,808 commuters, 19.9%), 20 to 24 minutes (2,473 commuters, 17.5%), and 15 to 19 minutes (2,205 commuters, 15.6%).
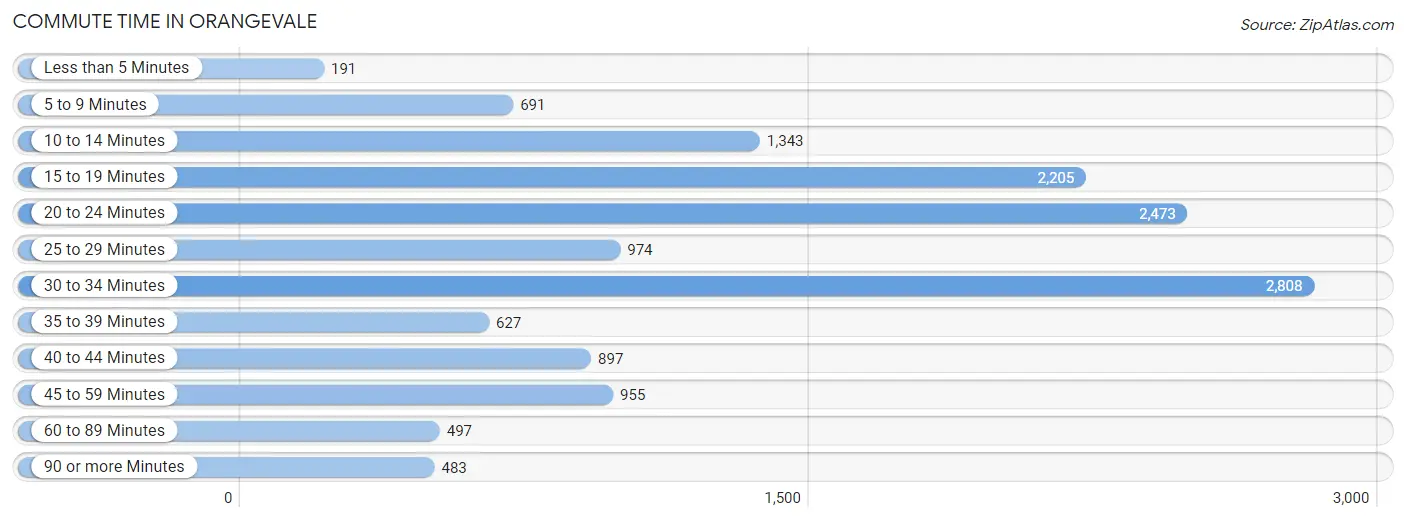
| Commute Time | # Commuters | % Commuters |
| Less than 5 Minutes | 191 | 1.3% |
| 5 to 9 Minutes | 691 | 4.9% |
| 10 to 14 Minutes | 1,343 | 9.5% |
| 15 to 19 Minutes | 2,205 | 15.6% |
| 20 to 24 Minutes | 2,473 | 17.5% |
| 25 to 29 Minutes | 974 | 6.9% |
| 30 to 34 Minutes | 2,808 | 19.9% |
| 35 to 39 Minutes | 627 | 4.4% |
| 40 to 44 Minutes | 897 | 6.3% |
| 45 to 59 Minutes | 955 | 6.8% |
| 60 to 89 Minutes | 497 | 3.5% |
| 90 or more Minutes | 483 | 3.4% |
Commute Time by Sex in Orangevale
The most common commute times in Orangevale are 30 to 34 minutes (1,833 commuters, 23.5%) for males and 20 to 24 minutes (1,436 commuters, 22.6%) for females.
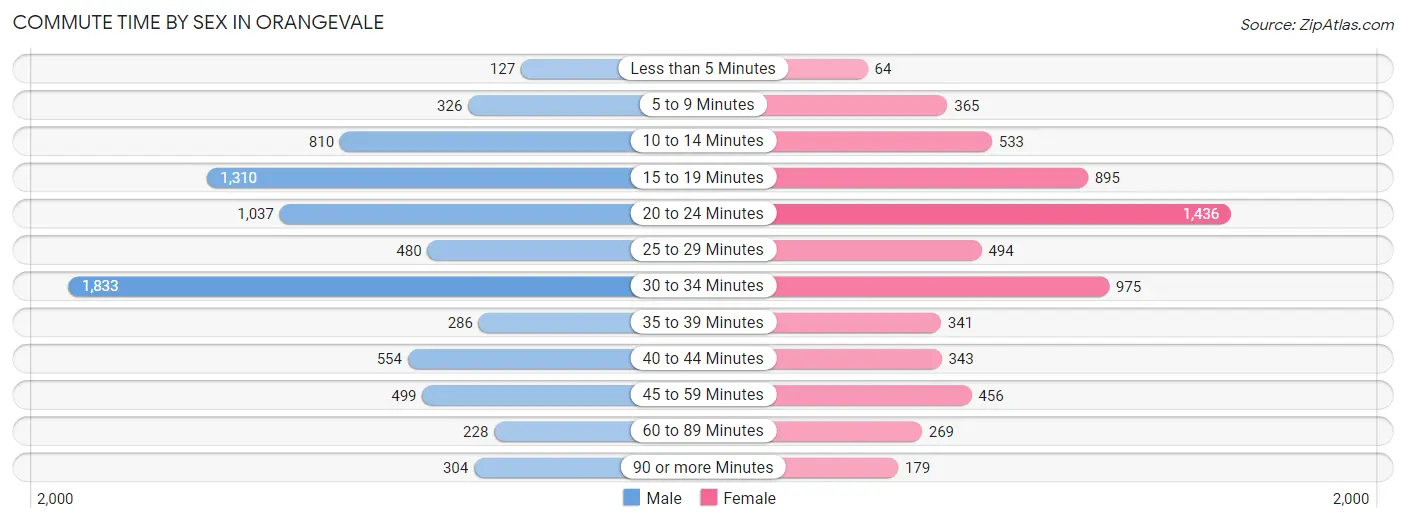
| Commute Time | Male | Female |
| Less than 5 Minutes | 127 (1.6%) | 64 (1.0%) |
| 5 to 9 Minutes | 326 (4.2%) | 365 (5.8%) |
| 10 to 14 Minutes | 810 (10.4%) | 533 (8.4%) |
| 15 to 19 Minutes | 1,310 (16.8%) | 895 (14.1%) |
| 20 to 24 Minutes | 1,037 (13.3%) | 1,436 (22.6%) |
| 25 to 29 Minutes | 480 (6.2%) | 494 (7.8%) |
| 30 to 34 Minutes | 1,833 (23.5%) | 975 (15.3%) |
| 35 to 39 Minutes | 286 (3.7%) | 341 (5.4%) |
| 40 to 44 Minutes | 554 (7.1%) | 343 (5.4%) |
| 45 to 59 Minutes | 499 (6.4%) | 456 (7.2%) |
| 60 to 89 Minutes | 228 (2.9%) | 269 (4.2%) |
| 90 or more Minutes | 304 (3.9%) | 179 (2.8%) |
Time of Departure to Work by Sex in Orangevale
The most frequent times of departure to work in Orangevale are 6:00 AM to 6:29 AM (1,159, 14.9%) for males and 7:00 AM to 7:29 AM (955, 15.0%) for females.
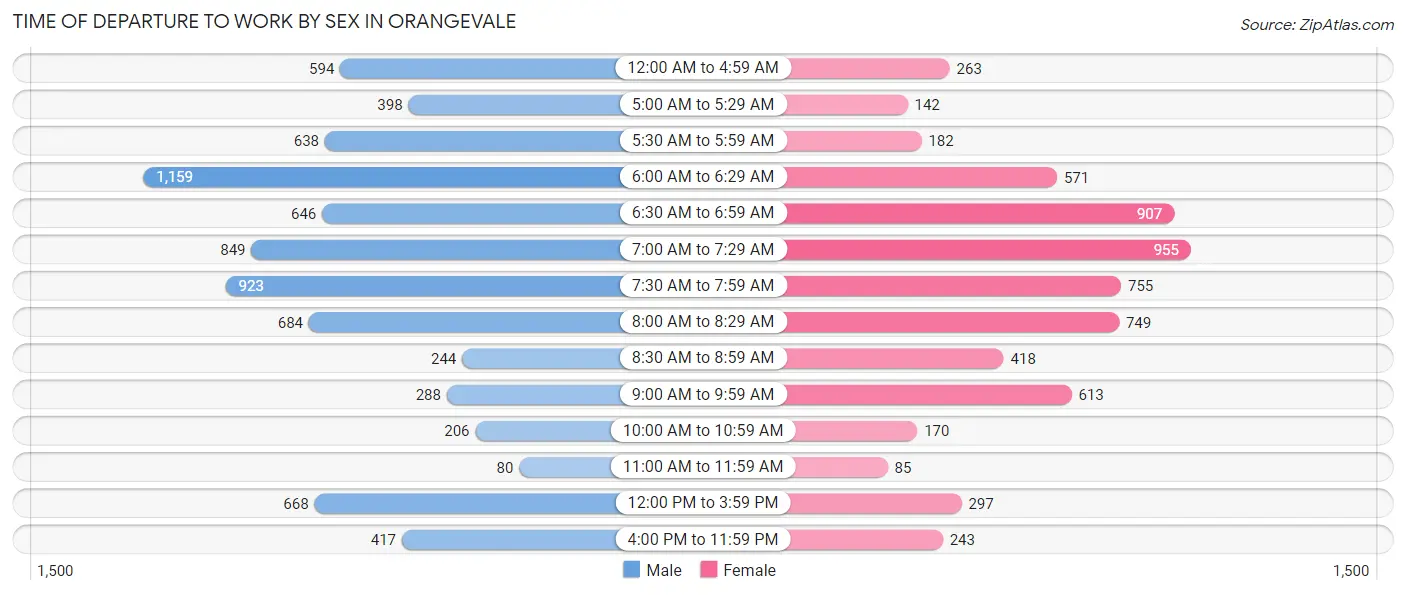
| Time of Departure | Male | Female |
| 12:00 AM to 4:59 AM | 594 (7.6%) | 263 (4.1%) |
| 5:00 AM to 5:29 AM | 398 (5.1%) | 142 (2.2%) |
| 5:30 AM to 5:59 AM | 638 (8.2%) | 182 (2.9%) |
| 6:00 AM to 6:29 AM | 1,159 (14.9%) | 571 (9.0%) |
| 6:30 AM to 6:59 AM | 646 (8.3%) | 907 (14.3%) |
| 7:00 AM to 7:29 AM | 849 (10.9%) | 955 (15.0%) |
| 7:30 AM to 7:59 AM | 923 (11.8%) | 755 (11.9%) |
| 8:00 AM to 8:29 AM | 684 (8.8%) | 749 (11.8%) |
| 8:30 AM to 8:59 AM | 244 (3.1%) | 418 (6.6%) |
| 9:00 AM to 9:59 AM | 288 (3.7%) | 613 (9.7%) |
| 10:00 AM to 10:59 AM | 206 (2.6%) | 170 (2.7%) |
| 11:00 AM to 11:59 AM | 80 (1.0%) | 85 (1.3%) |
| 12:00 PM to 3:59 PM | 668 (8.6%) | 297 (4.7%) |
| 4:00 PM to 11:59 PM | 417 (5.3%) | 243 (3.8%) |
| Total | 7,794 (100.0%) | 6,350 (100.0%) |
Housing Occupancy in Orangevale
Occupancy by Ownership in Orangevale
Of the total 13,576 dwellings in Orangevale, owner-occupied units account for 10,201 (75.1%), while renter-occupied units make up 3,375 (24.9%).
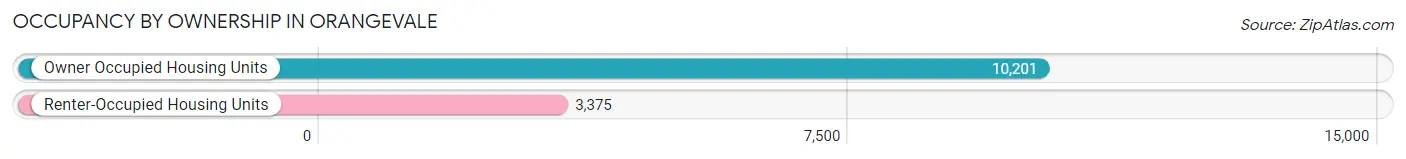
| Occupancy | # Housing Units | % Housing Units |
| Owner Occupied Housing Units | 10,201 | 75.1% |
| Renter-Occupied Housing Units | 3,375 | 24.9% |
| Total Occupied Housing Units | 13,576 | 100.0% |
Occupancy by Household Size in Orangevale
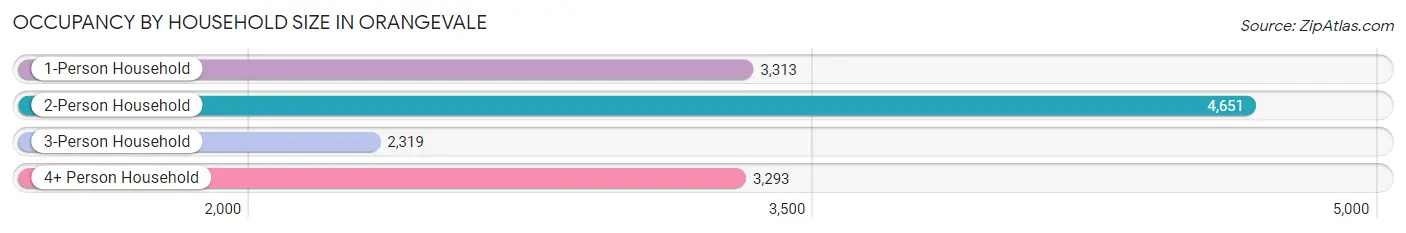
| Household Size | # Housing Units | % Housing Units |
| 1-Person Household | 3,313 | 24.4% |
| 2-Person Household | 4,651 | 34.3% |
| 3-Person Household | 2,319 | 17.1% |
| 4+ Person Household | 3,293 | 24.3% |
| Total Housing Units | 13,576 | 100.0% |
Occupancy by Ownership by Household Size in Orangevale
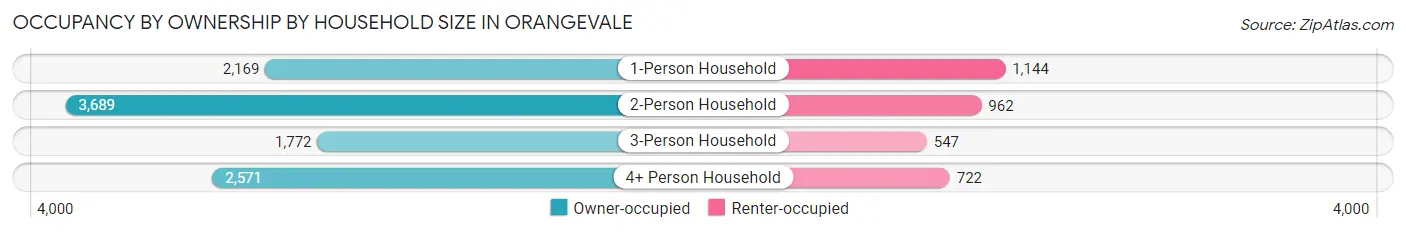
| Household Size | Owner-occupied | Renter-occupied |
| 1-Person Household | 2,169 (65.5%) | 1,144 (34.5%) |
| 2-Person Household | 3,689 (79.3%) | 962 (20.7%) |
| 3-Person Household | 1,772 (76.4%) | 547 (23.6%) |
| 4+ Person Household | 2,571 (78.1%) | 722 (21.9%) |
| Total Housing Units | 10,201 (75.1%) | 3,375 (24.9%) |
Occupancy by Educational Attainment in Orangevale
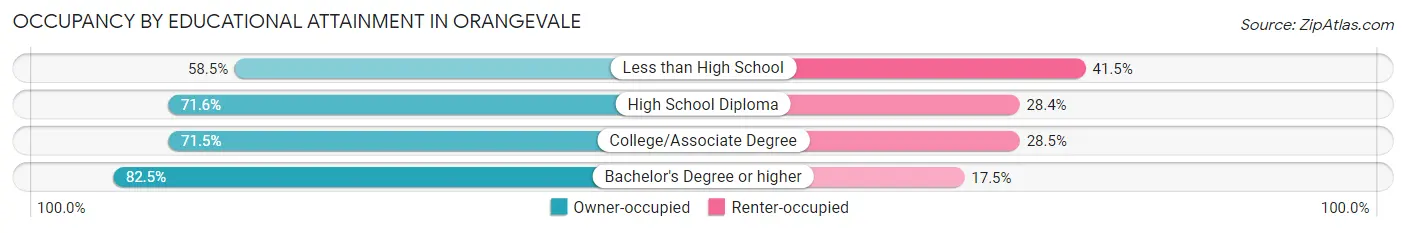
| Household Size | Owner-occupied | Renter-occupied |
| Less than High School | 286 (58.5%) | 203 (41.5%) |
| High School Diploma | 1,789 (71.6%) | 710 (28.4%) |
| College/Associate Degree | 3,980 (71.5%) | 1,583 (28.5%) |
| Bachelor's Degree or higher | 4,146 (82.5%) | 879 (17.5%) |
Occupancy by Age of Householder in Orangevale
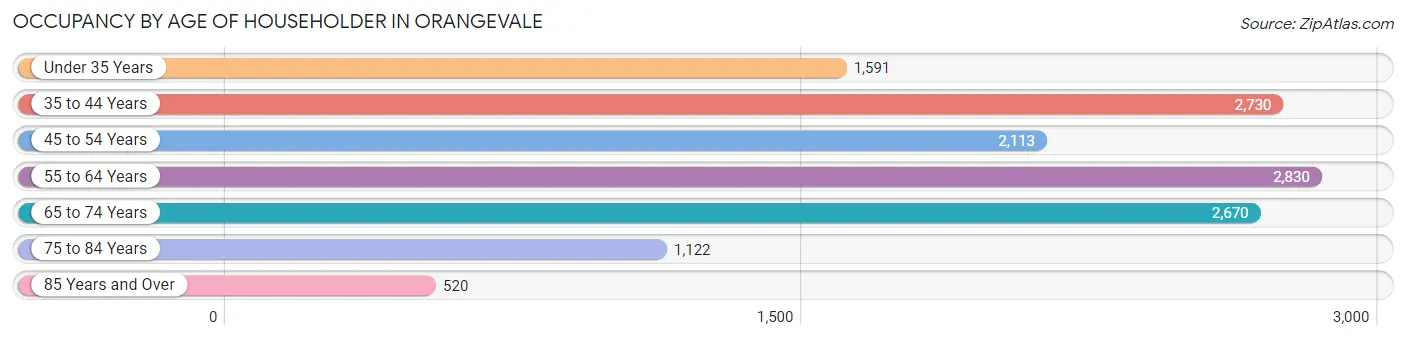
| Age Bracket | # Households | % Households |
| Under 35 Years | 1,591 | 11.7% |
| 35 to 44 Years | 2,730 | 20.1% |
| 45 to 54 Years | 2,113 | 15.6% |
| 55 to 64 Years | 2,830 | 20.8% |
| 65 to 74 Years | 2,670 | 19.7% |
| 75 to 84 Years | 1,122 | 8.3% |
| 85 Years and Over | 520 | 3.8% |
| Total | 13,576 | 100.0% |
Housing Finances in Orangevale
Median Income by Occupancy in Orangevale
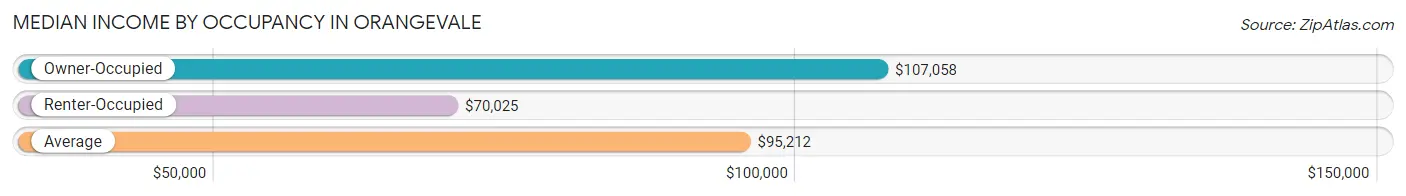
| Occupancy Type | # Households | Median Income |
| Owner-Occupied | 10,201 (75.1%) | $107,058 |
| Renter-Occupied | 3,375 (24.9%) | $70,025 |
| Average | 13,576 (100.0%) | $95,212 |
Occupancy by Householder Income Bracket in Orangevale
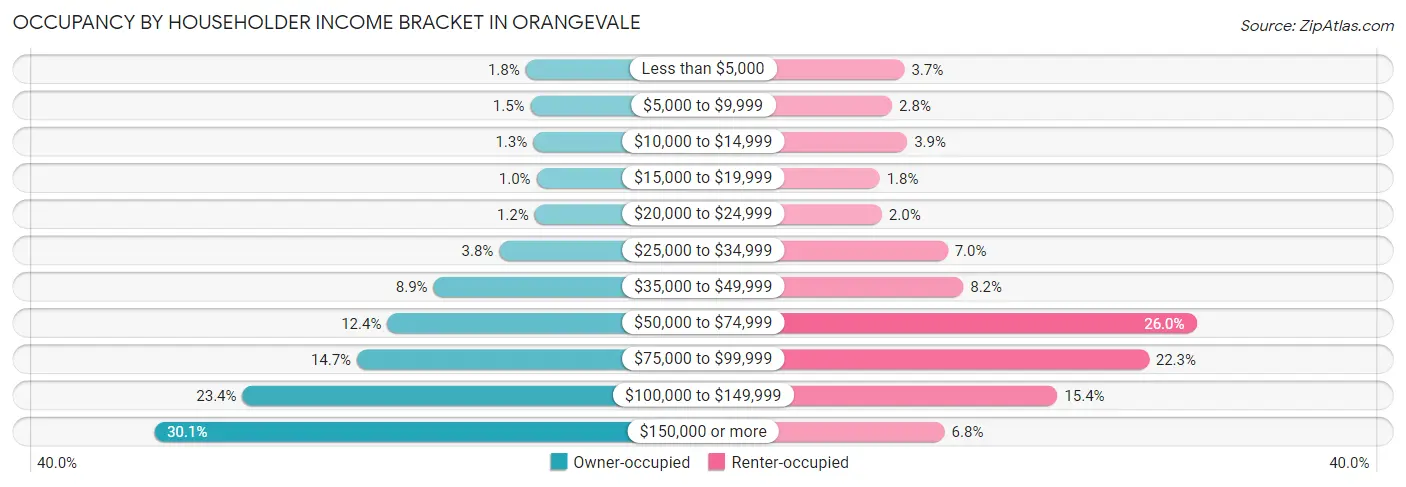
| Income Bracket | Owner-occupied | Renter-occupied |
| Less than $5,000 | 187 (1.8%) | 126 (3.7%) |
| $5,000 to $9,999 | 149 (1.5%) | 94 (2.8%) |
| $10,000 to $14,999 | 129 (1.3%) | 133 (3.9%) |
| $15,000 to $19,999 | 102 (1.0%) | 62 (1.8%) |
| $20,000 to $24,999 | 117 (1.1%) | 68 (2.0%) |
| $25,000 to $34,999 | 392 (3.8%) | 237 (7.0%) |
| $35,000 to $49,999 | 903 (8.8%) | 277 (8.2%) |
| $50,000 to $74,999 | 1,262 (12.4%) | 876 (26.0%) |
| $75,000 to $99,999 | 1,497 (14.7%) | 754 (22.3%) |
| $100,000 to $149,999 | 2,388 (23.4%) | 519 (15.4%) |
| $150,000 or more | 3,075 (30.1%) | 229 (6.8%) |
| Total | 10,201 (100.0%) | 3,375 (100.0%) |
Monthly Housing Cost Tiers in Orangevale
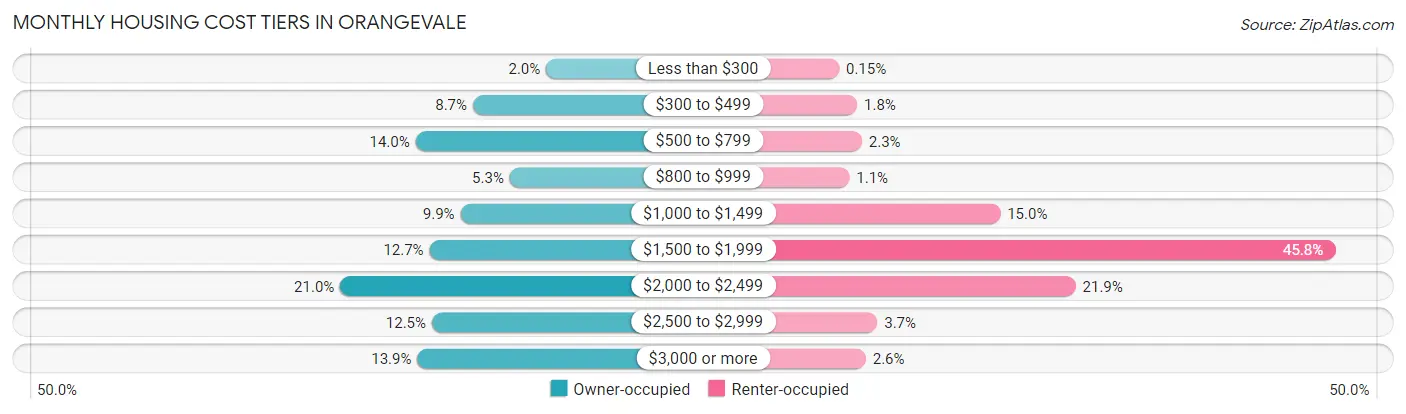
| Monthly Cost | Owner-occupied | Renter-occupied |
| Less than $300 | 203 (2.0%) | 5 (0.2%) |
| $300 to $499 | 891 (8.7%) | 61 (1.8%) |
| $500 to $799 | 1,429 (14.0%) | 76 (2.2%) |
| $800 to $999 | 545 (5.3%) | 37 (1.1%) |
| $1,000 to $1,499 | 1,008 (9.9%) | 506 (15.0%) |
| $1,500 to $1,999 | 1,299 (12.7%) | 1,546 (45.8%) |
| $2,000 to $2,499 | 2,137 (20.9%) | 740 (21.9%) |
| $2,500 to $2,999 | 1,276 (12.5%) | 124 (3.7%) |
| $3,000 or more | 1,413 (13.9%) | 88 (2.6%) |
| Total | 10,201 (100.0%) | 3,375 (100.0%) |
Physical Housing Characteristics in Orangevale
Housing Structures in Orangevale
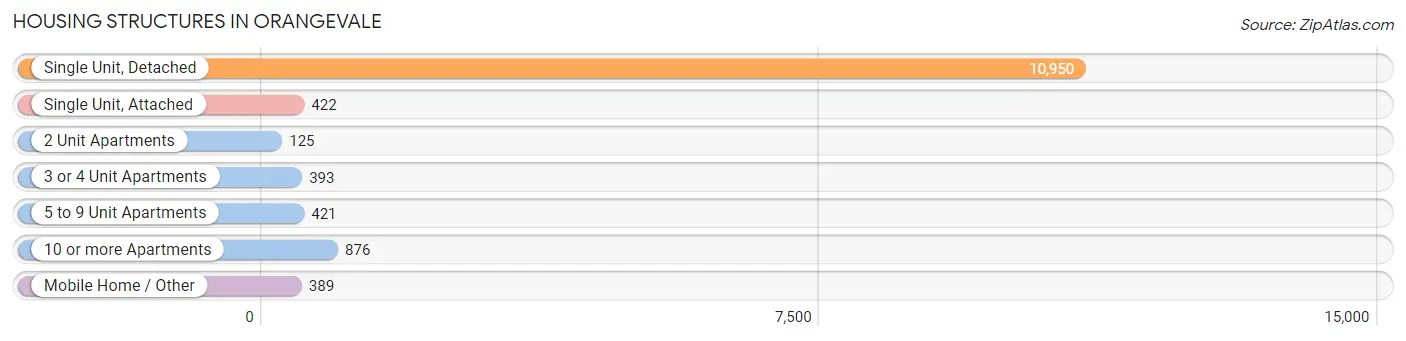
| Structure Type | # Housing Units | % Housing Units |
| Single Unit, Detached | 10,950 | 80.7% |
| Single Unit, Attached | 422 | 3.1% |
| 2 Unit Apartments | 125 | 0.9% |
| 3 or 4 Unit Apartments | 393 | 2.9% |
| 5 to 9 Unit Apartments | 421 | 3.1% |
| 10 or more Apartments | 876 | 6.5% |
| Mobile Home / Other | 389 | 2.9% |
| Total | 13,576 | 100.0% |
Housing Structures by Occupancy in Orangevale
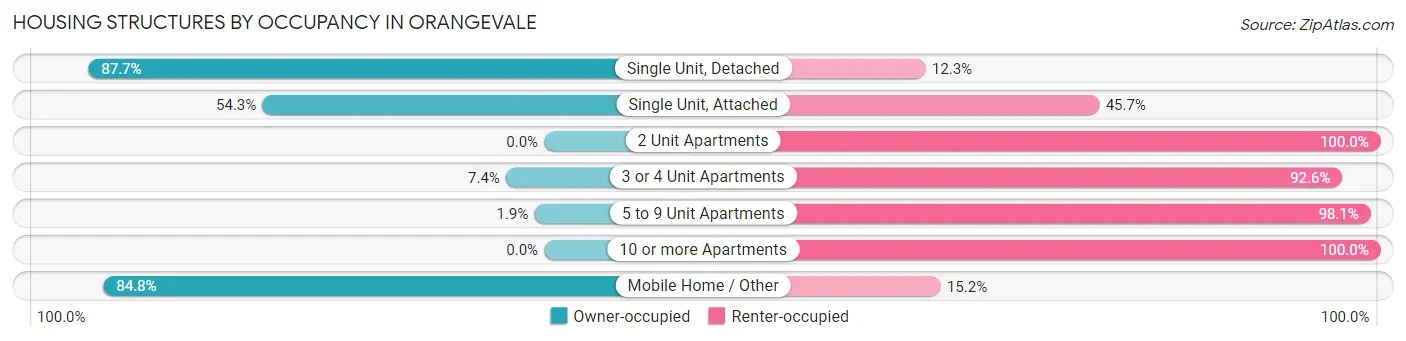
| Structure Type | Owner-occupied | Renter-occupied |
| Single Unit, Detached | 9,605 (87.7%) | 1,345 (12.3%) |
| Single Unit, Attached | 229 (54.3%) | 193 (45.7%) |
| 2 Unit Apartments | 0 (0.0%) | 125 (100.0%) |
| 3 or 4 Unit Apartments | 29 (7.4%) | 364 (92.6%) |
| 5 to 9 Unit Apartments | 8 (1.9%) | 413 (98.1%) |
| 10 or more Apartments | 0 (0.0%) | 876 (100.0%) |
| Mobile Home / Other | 330 (84.8%) | 59 (15.2%) |
| Total | 10,201 (75.1%) | 3,375 (24.9%) |
Housing Structures by Number of Rooms in Orangevale
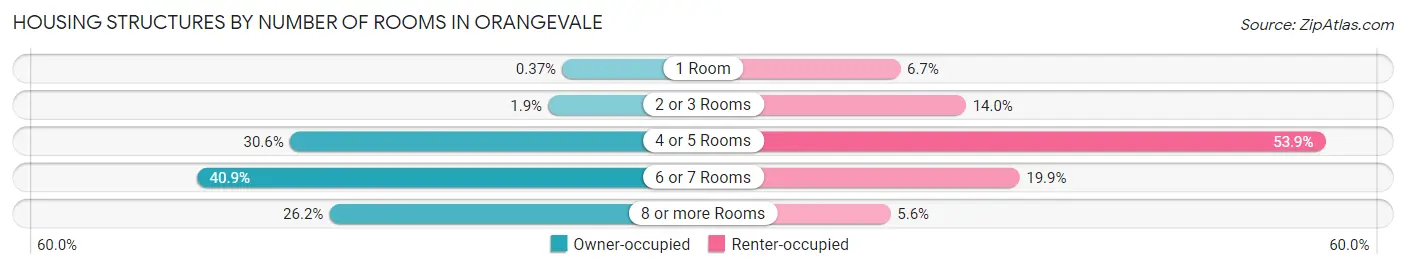
| Number of Rooms | Owner-occupied | Renter-occupied |
| 1 Room | 38 (0.4%) | 225 (6.7%) |
| 2 or 3 Rooms | 196 (1.9%) | 471 (14.0%) |
| 4 or 5 Rooms | 3,122 (30.6%) | 1,818 (53.9%) |
| 6 or 7 Rooms | 4,172 (40.9%) | 672 (19.9%) |
| 8 or more Rooms | 2,673 (26.2%) | 189 (5.6%) |
| Total | 10,201 (100.0%) | 3,375 (100.0%) |
Housing Structure by Heating Type in Orangevale
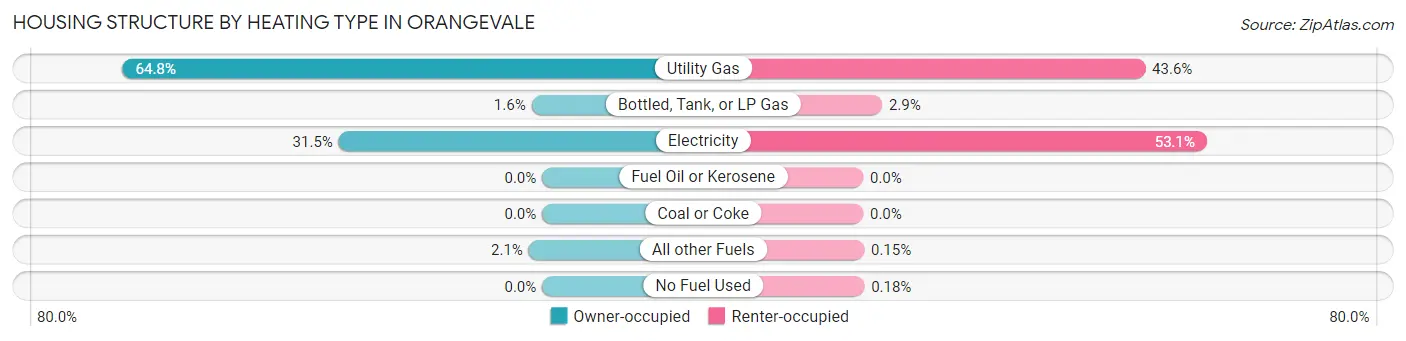
| Heating Type | Owner-occupied | Renter-occupied |
| Utility Gas | 6,614 (64.8%) | 1,472 (43.6%) |
| Bottled, Tank, or LP Gas | 167 (1.6%) | 99 (2.9%) |
| Electricity | 3,208 (31.5%) | 1,793 (53.1%) |
| Fuel Oil or Kerosene | 0 (0.0%) | 0 (0.0%) |
| Coal or Coke | 0 (0.0%) | 0 (0.0%) |
| All other Fuels | 212 (2.1%) | 5 (0.2%) |
| No Fuel Used | 0 (0.0%) | 6 (0.2%) |
| Total | 10,201 (100.0%) | 3,375 (100.0%) |
Household Vehicle Usage in Orangevale
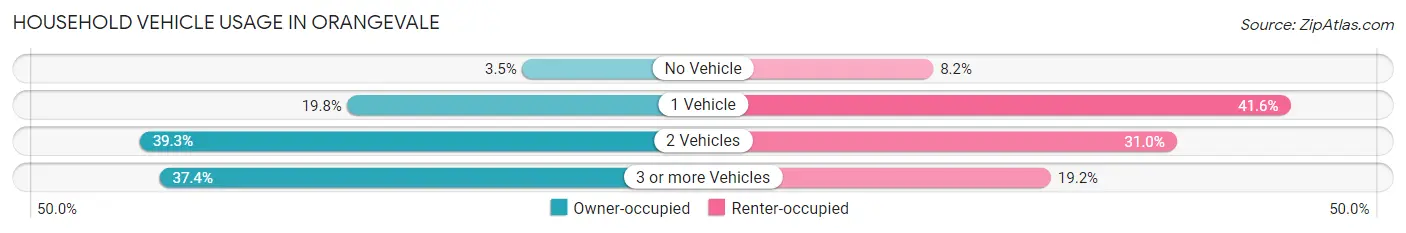
| Vehicles per Household | Owner-occupied | Renter-occupied |
| No Vehicle | 358 (3.5%) | 278 (8.2%) |
| 1 Vehicle | 2,024 (19.8%) | 1,403 (41.6%) |
| 2 Vehicles | 4,004 (39.3%) | 1,045 (31.0%) |
| 3 or more Vehicles | 3,815 (37.4%) | 649 (19.2%) |
| Total | 10,201 (100.0%) | 3,375 (100.0%) |
Real Estate & Mortgages in Orangevale
Real Estate and Mortgage Overview in Orangevale
| Characteristic | Without Mortgage | With Mortgage |
| Housing Units | 3,347 | 6,854 |
| Median Property Value | $453,600 | $482,400 |
| Median Household Income | $79,018 | $2,415 |
| Monthly Housing Costs | $646 | $1,384 |
| Real Estate Taxes | $2,703 | $97 |
Property Value by Mortgage Status in Orangevale
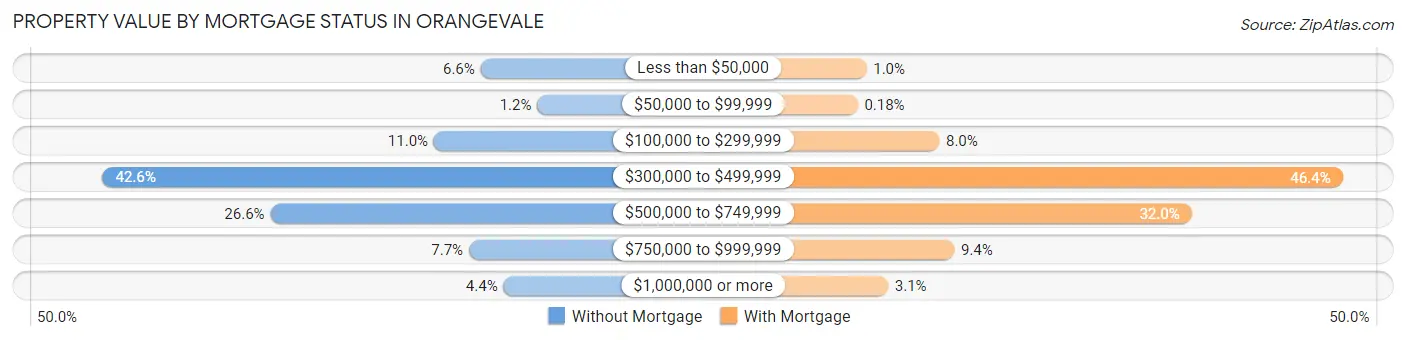
| Property Value | Without Mortgage | With Mortgage |
| Less than $50,000 | 220 (6.6%) | 70 (1.0%) |
| $50,000 to $99,999 | 39 (1.2%) | 12 (0.2%) |
| $100,000 to $299,999 | 369 (11.0%) | 545 (8.0%) |
| $300,000 to $499,999 | 1,425 (42.6%) | 3,179 (46.4%) |
| $500,000 to $749,999 | 890 (26.6%) | 2,194 (32.0%) |
| $750,000 to $999,999 | 257 (7.7%) | 643 (9.4%) |
| $1,000,000 or more | 147 (4.4%) | 211 (3.1%) |
| Total | 3,347 (100.0%) | 6,854 (100.0%) |
Household Income by Mortgage Status in Orangevale
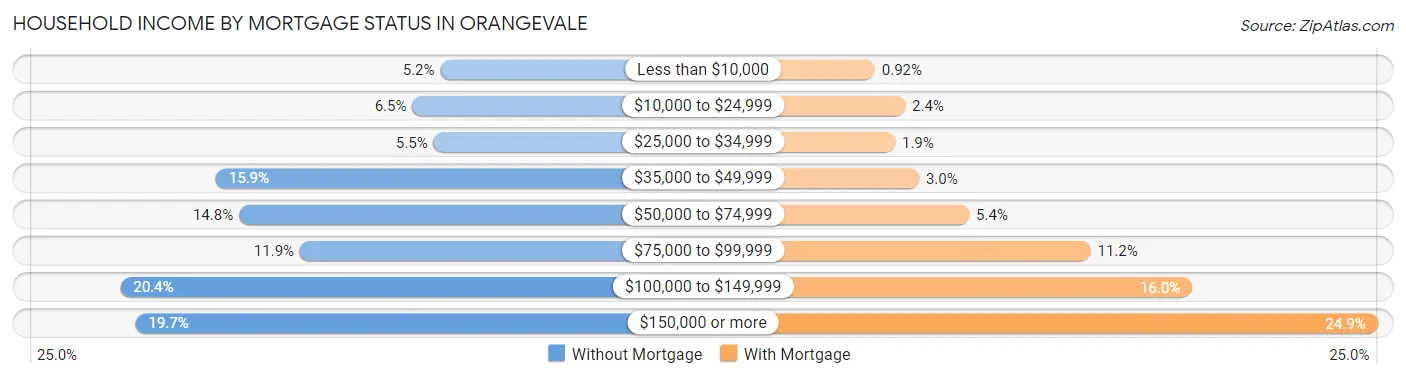
| Household Income | Without Mortgage | With Mortgage |
| Less than $10,000 | 174 (5.2%) | 63 (0.9%) |
| $10,000 to $24,999 | 219 (6.5%) | 162 (2.4%) |
| $25,000 to $34,999 | 185 (5.5%) | 129 (1.9%) |
| $35,000 to $49,999 | 532 (15.9%) | 207 (3.0%) |
| $50,000 to $74,999 | 495 (14.8%) | 371 (5.4%) |
| $75,000 to $99,999 | 398 (11.9%) | 767 (11.2%) |
| $100,000 to $149,999 | 684 (20.4%) | 1,099 (16.0%) |
| $150,000 or more | 660 (19.7%) | 1,704 (24.9%) |
| Total | 3,347 (100.0%) | 6,854 (100.0%) |
Property Value to Household Income Ratio in Orangevale
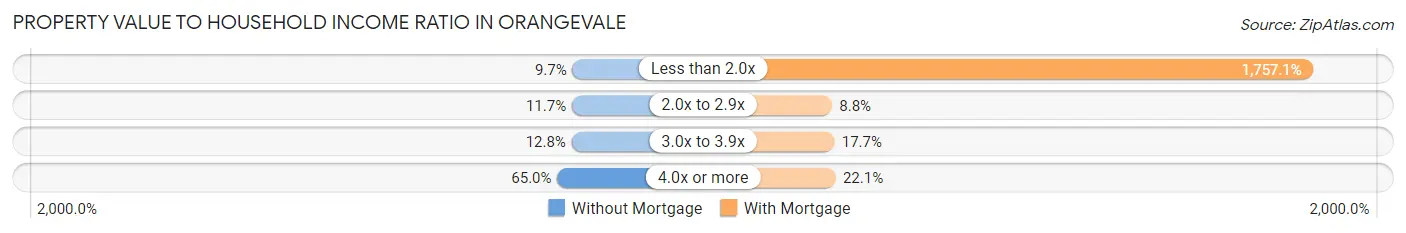
| Value-to-Income Ratio | Without Mortgage | With Mortgage |
| Less than 2.0x | 326 (9.7%) | 120,429 (1,757.1%) |
| 2.0x to 2.9x | 393 (11.7%) | 606 (8.8%) |
| 3.0x to 3.9x | 428 (12.8%) | 1,216 (17.7%) |
| 4.0x or more | 2,174 (64.9%) | 1,512 (22.1%) |
| Total | 3,347 (100.0%) | 6,854 (100.0%) |
Real Estate Taxes by Mortgage Status in Orangevale
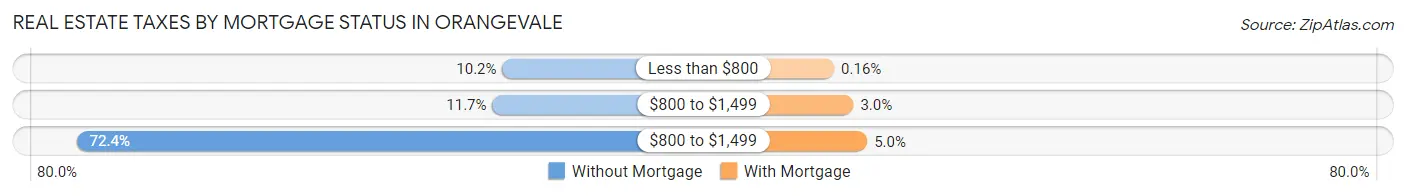
| Property Taxes | Without Mortgage | With Mortgage |
| Less than $800 | 341 (10.2%) | 11 (0.2%) |
| $800 to $1,499 | 390 (11.7%) | 205 (3.0%) |
| $800 to $1,499 | 2,423 (72.4%) | 342 (5.0%) |
| Total | 3,347 (100.0%) | 6,854 (100.0%) |
Health & Disability in Orangevale
Health Insurance Coverage by Age in Orangevale
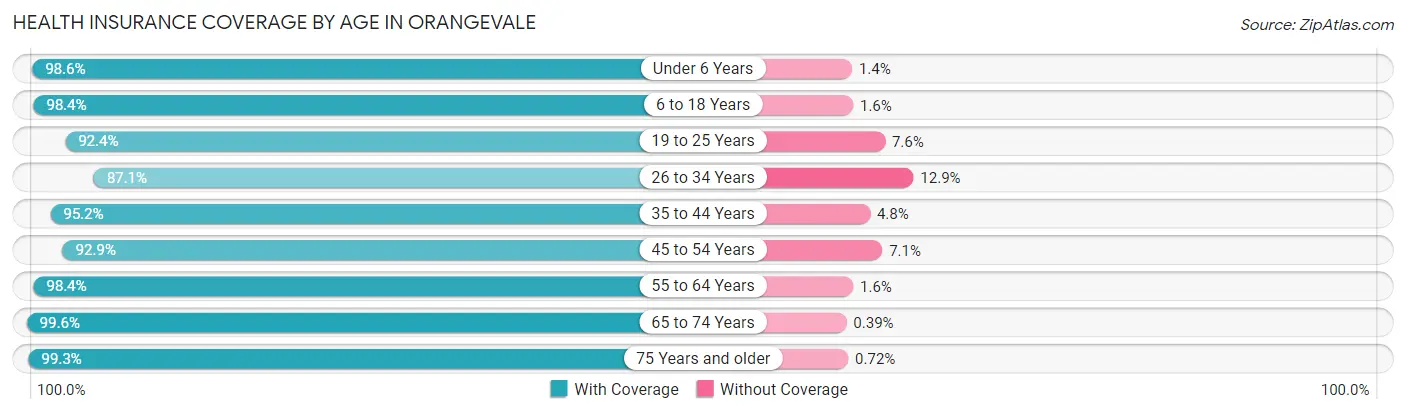
| Age Bracket | With Coverage | Without Coverage |
| Under 6 Years | 2,414 (98.6%) | 35 (1.4%) |
| 6 to 18 Years | 5,488 (98.4%) | 91 (1.6%) |
| 19 to 25 Years | 2,474 (92.4%) | 203 (7.6%) |
| 26 to 34 Years | 3,175 (87.1%) | 470 (12.9%) |
| 35 to 44 Years | 4,984 (95.2%) | 251 (4.8%) |
| 45 to 54 Years | 3,943 (92.9%) | 300 (7.1%) |
| 55 to 64 Years | 4,741 (98.4%) | 79 (1.6%) |
| 65 to 74 Years | 4,593 (99.6%) | 18 (0.4%) |
| 75 Years and older | 2,489 (99.3%) | 18 (0.7%) |
| Total | 34,301 (95.9%) | 1,465 (4.1%) |
Health Insurance Coverage by Citizenship Status in Orangevale
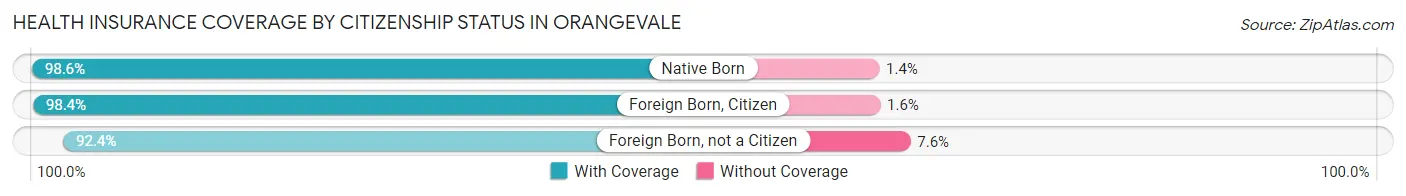
| Citizenship Status | With Coverage | Without Coverage |
| Native Born | 2,414 (98.6%) | 35 (1.4%) |
| Foreign Born, Citizen | 5,488 (98.4%) | 91 (1.6%) |
| Foreign Born, not a Citizen | 2,474 (92.4%) | 203 (7.6%) |
Health Insurance Coverage by Household Income in Orangevale
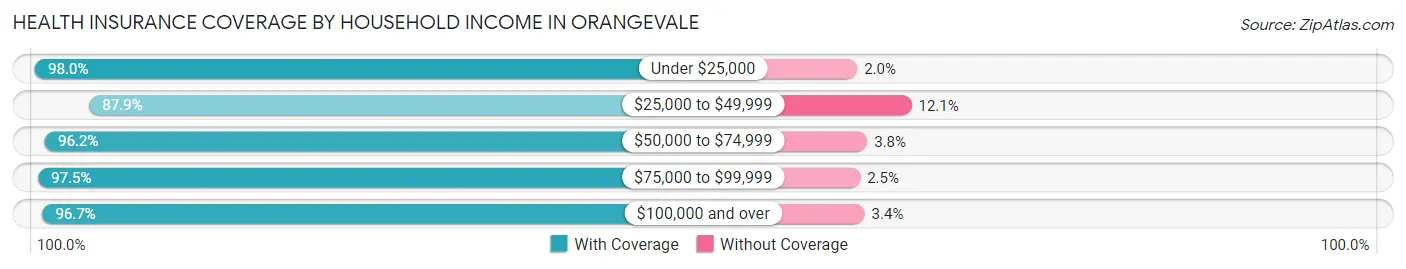
| Household Income | With Coverage | Without Coverage |
| Under $25,000 | 1,603 (98.0%) | 32 (2.0%) |
| $25,000 to $49,999 | 3,232 (87.9%) | 446 (12.1%) |
| $50,000 to $74,999 | 4,782 (96.2%) | 191 (3.8%) |
| $75,000 to $99,999 | 5,695 (97.5%) | 147 (2.5%) |
| $100,000 and over | 18,733 (96.7%) | 649 (3.4%) |
Public vs Private Health Insurance Coverage by Age in Orangevale
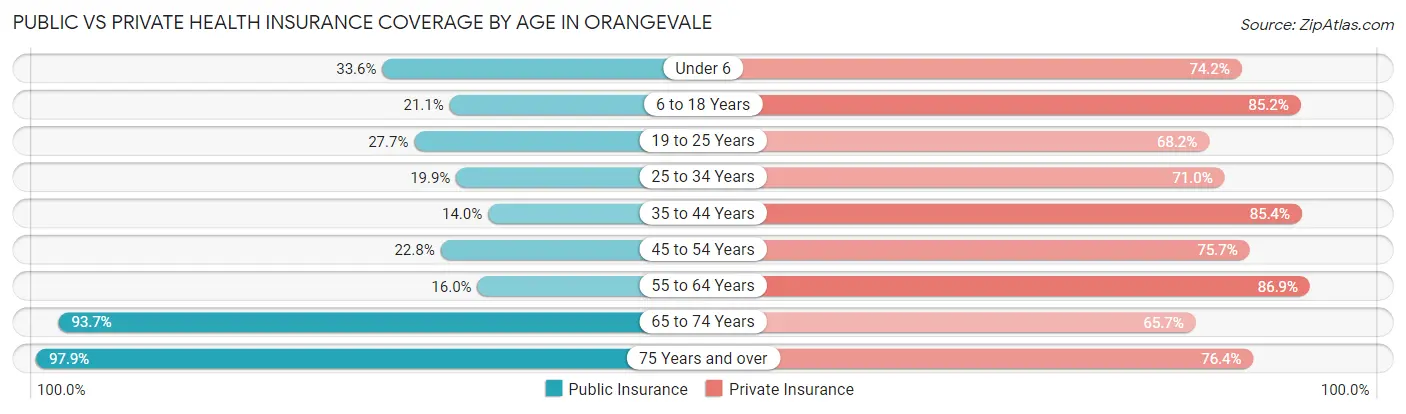
| Age Bracket | Public Insurance | Private Insurance |
| Under 6 | 823 (33.6%) | 1,817 (74.2%) |
| 6 to 18 Years | 1,179 (21.1%) | 4,751 (85.2%) |
| 19 to 25 Years | 741 (27.7%) | 1,825 (68.2%) |
| 25 to 34 Years | 725 (19.9%) | 2,589 (71.0%) |
| 35 to 44 Years | 732 (14.0%) | 4,470 (85.4%) |
| 45 to 54 Years | 968 (22.8%) | 3,211 (75.7%) |
| 55 to 64 Years | 769 (16.0%) | 4,187 (86.9%) |
| 65 to 74 Years | 4,321 (93.7%) | 3,028 (65.7%) |
| 75 Years and over | 2,454 (97.9%) | 1,915 (76.4%) |
| Total | 12,712 (35.5%) | 27,793 (77.7%) |
Disability Status by Sex by Age in Orangevale
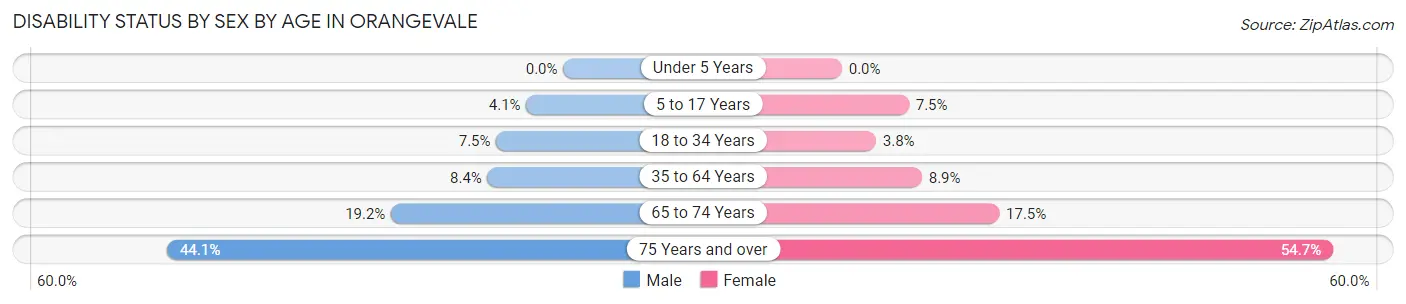
| Age Bracket | Male | Female |
| Under 5 Years | 0 (0.0%) | 0 (0.0%) |
| 5 to 17 Years | 110 (4.1%) | 210 (7.5%) |
| 18 to 34 Years | 249 (7.5%) | 129 (3.8%) |
| 35 to 64 Years | 618 (8.4%) | 621 (8.9%) |
| 65 to 74 Years | 408 (19.2%) | 435 (17.5%) |
| 75 Years and over | 365 (44.1%) | 919 (54.7%) |
Disability Class by Sex by Age in Orangevale
Disability Class: Hearing Difficulty
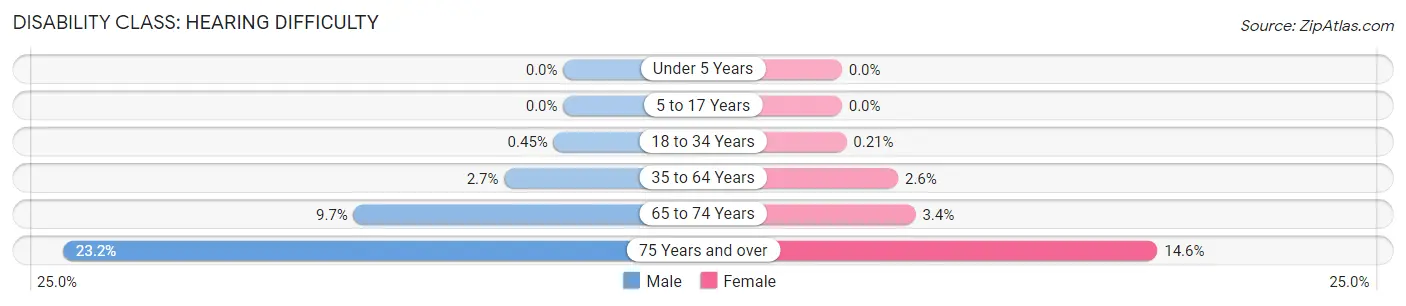
| Age Bracket | Male | Female |
| Under 5 Years | 0 (0.0%) | 0 (0.0%) |
| 5 to 17 Years | 0 (0.0%) | 0 (0.0%) |
| 18 to 34 Years | 15 (0.4%) | 7 (0.2%) |
| 35 to 64 Years | 201 (2.7%) | 182 (2.6%) |
| 65 to 74 Years | 207 (9.7%) | 85 (3.4%) |
| 75 Years and over | 192 (23.2%) | 246 (14.6%) |
Disability Class: Vision Difficulty
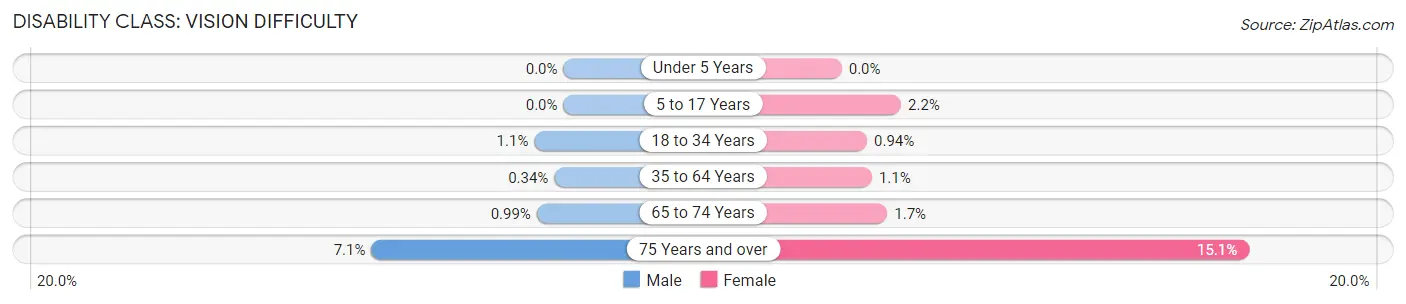
| Age Bracket | Male | Female |
| Under 5 Years | 0 (0.0%) | 0 (0.0%) |
| 5 to 17 Years | 0 (0.0%) | 62 (2.2%) |
| 18 to 34 Years | 36 (1.1%) | 32 (0.9%) |
| 35 to 64 Years | 25 (0.3%) | 78 (1.1%) |
| 65 to 74 Years | 21 (1.0%) | 42 (1.7%) |
| 75 Years and over | 59 (7.1%) | 254 (15.1%) |
Disability Class: Cognitive Difficulty
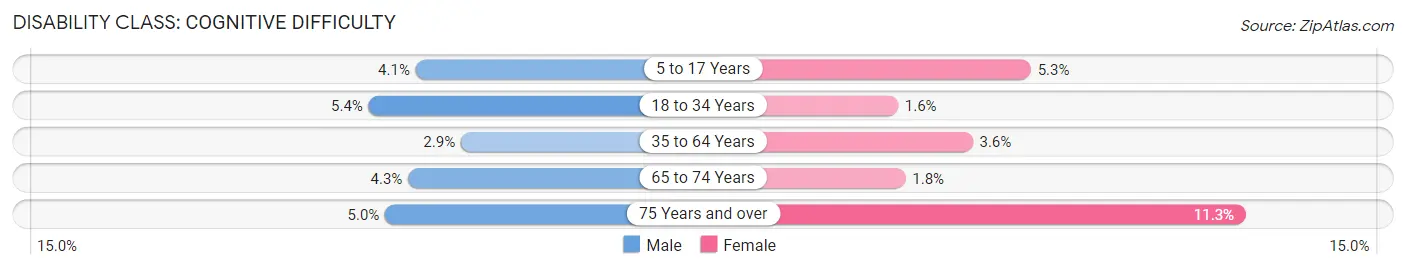
| Age Bracket | Male | Female |
| 5 to 17 Years | 110 (4.1%) | 148 (5.3%) |
| 18 to 34 Years | 181 (5.4%) | 53 (1.6%) |
| 35 to 64 Years | 209 (2.9%) | 254 (3.6%) |
| 65 to 74 Years | 92 (4.3%) | 44 (1.8%) |
| 75 Years and over | 41 (5.0%) | 189 (11.3%) |
Disability Class: Ambulatory Difficulty
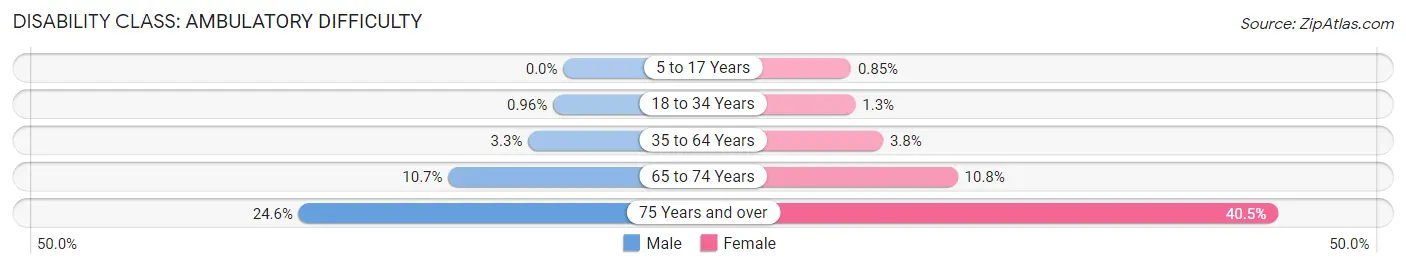
| Age Bracket | Male | Female |
| 5 to 17 Years | 0 (0.0%) | 24 (0.9%) |
| 18 to 34 Years | 32 (1.0%) | 43 (1.3%) |
| 35 to 64 Years | 239 (3.3%) | 266 (3.8%) |
| 65 to 74 Years | 227 (10.7%) | 267 (10.7%) |
| 75 Years and over | 203 (24.5%) | 680 (40.5%) |
Disability Class: Self-Care Difficulty
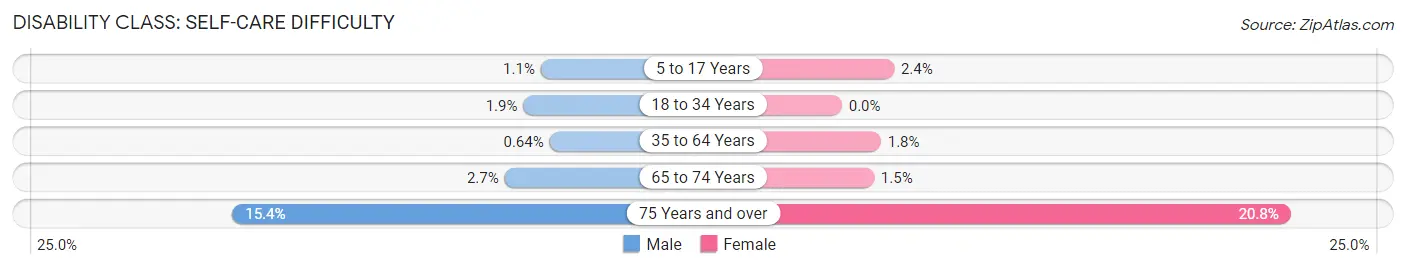
| Age Bracket | Male | Female |
| 5 to 17 Years | 28 (1.1%) | 68 (2.4%) |
| 18 to 34 Years | 62 (1.9%) | 0 (0.0%) |
| 35 to 64 Years | 47 (0.6%) | 126 (1.8%) |
| 65 to 74 Years | 58 (2.7%) | 37 (1.5%) |
| 75 Years and over | 127 (15.4%) | 350 (20.8%) |
Technology Access in Orangevale
Computing Device Access in Orangevale
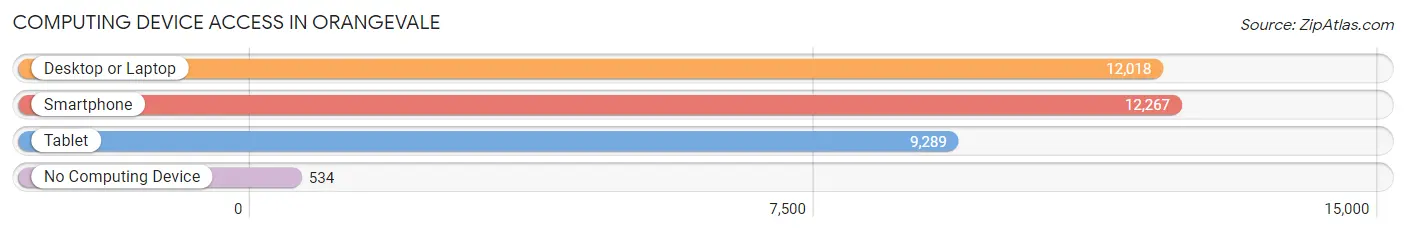
| Device Type | # Households | % Households |
| Desktop or Laptop | 12,018 | 88.5% |
| Smartphone | 12,267 | 90.4% |
| Tablet | 9,289 | 68.4% |
| No Computing Device | 534 | 3.9% |
| Total | 13,576 | 100.0% |
Internet Access in Orangevale
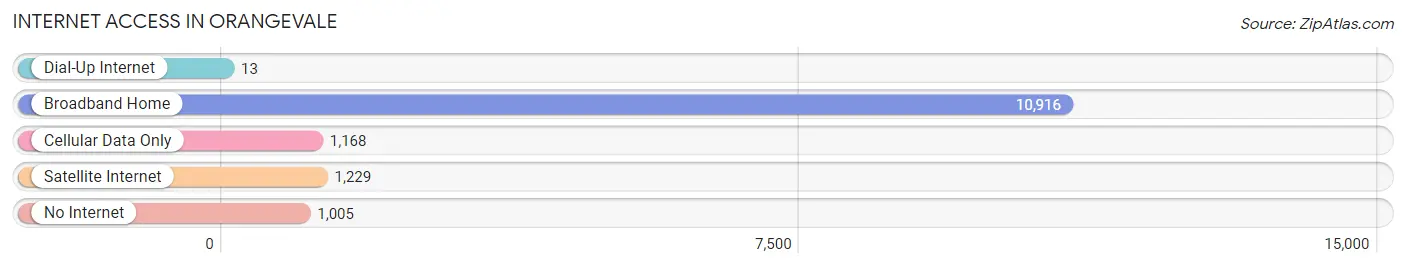
| Internet Type | # Households | % Households |
| Dial-Up Internet | 13 | 0.1% |
| Broadband Home | 10,916 | 80.4% |
| Cellular Data Only | 1,168 | 8.6% |
| Satellite Internet | 1,229 | 9.0% |
| No Internet | 1,005 | 7.4% |
| Total | 13,576 | 100.0% |
Orangevale Summary
History
Orangevale is a census-designated place located in Sacramento County, California. It is located in the foothills of the Sierra Nevada Mountains, about 25 miles northeast of Sacramento. The area was originally inhabited by the Maidu Indians, who lived in the area for thousands of years before the arrival of European settlers. The first recorded European settler in the area was John Rose, who arrived in 1844. He established a trading post and a ferry service across the American River.
In the late 1800s, the area was known as Orangevale, named after the orange groves that were planted in the area. The area was primarily used for farming and ranching, and the population remained small until the 1950s. In the 1950s, the area began to experience rapid growth due to the development of the nearby cities of Sacramento and Roseville. By the 1970s, Orangevale had become a bedroom community for the larger cities.
Geography
Orangevale is located in the foothills of the Sierra Nevada Mountains, about 25 miles northeast of Sacramento. The area is characterized by rolling hills and valleys, with the American River running through the center of the community. The climate is mild, with hot summers and cool winters. The average annual precipitation is about 20 inches.
The area is home to several parks and recreational areas, including Folsom Lake State Recreation Area, which offers camping, fishing, and boating. The area is also home to several golf courses, including the Orangevale Country Club.
Economy
The economy of Orangevale is largely based on the service industry. The area is home to several retail stores, restaurants, and other businesses. The area is also home to several technology companies, including Intel and Oracle.
The area is also home to several educational institutions, including the University of California, Davis, and California State University, Sacramento.
Demographics
As of the 2010 census, the population of Orangevale was 33,960. The racial makeup of the area was 75.3% White, 8.2% African American, 0.7% Native American, 8.2% Asian, 0.3% Pacific Islander, and 6.5% from other races. The median household income was $68,845, and the median family income was $76,945. The per capita income was $30,945.
Conclusion
Orangevale is a census-designated place located in Sacramento County, California. It is located in the foothills of the Sierra Nevada Mountains, about 25 miles northeast of Sacramento. The area was originally inhabited by the Maidu Indians, and was later used for farming and ranching. In the 1950s, the area began to experience rapid growth due to the development of the nearby cities of Sacramento and Roseville. The economy of Orangevale is largely based on the service industry, and the area is home to several retail stores, restaurants, and other businesses. As of the 2010 census, the population of Orangevale was 33,960, with a median household income of $68,845.
Common Questions
What is Per Capita Income in Orangevale?
Per Capita income in Orangevale is $43,370.
What is the Median Family Income in Orangevale?
Median Family Income in Orangevale is $106,665.
What is the Median Household income in Orangevale?
Median Household Income in Orangevale is $95,212.
What is Income or Wage Gap in Orangevale?
Income or Wage Gap in Orangevale is 19.8%.
Women in Orangevale earn 80.2 cents for every dollar earned by a man.
What is Family Income Deficit in Orangevale?
Family Income Deficit in Orangevale is $12,581.
Families that are below poverty line in Orangevale earn $12,581 less on average than the poverty threshold level.
What is Inequality or Gini Index in Orangevale?
Inequality or Gini Index in Orangevale is 0.39.
What is the Total Population of Orangevale?
Total Population of Orangevale is 35,852.
What is the Total Male Population of Orangevale?
Total Male Population of Orangevale is 17,600.
What is the Total Female Population of Orangevale?
Total Female Population of Orangevale is 18,252.
What is the Ratio of Males per 100 Females in Orangevale?
There are 96.43 Males per 100 Females in Orangevale.
What is the Ratio of Females per 100 Males in Orangevale?
There are 103.70 Females per 100 Males in Orangevale.
What is the Median Population Age in Orangevale?
Median Population Age in Orangevale is 41.5 Years.
What is the Average Family Size in Orangevale
Average Family Size in Orangevale is 3.1 People.
What is the Average Household Size in Orangevale
Average Household Size in Orangevale is 2.6 People.
How Large is the Labor Force in Orangevale?
There are 18,128 People in the Labor Forcein in Orangevale.
What is the Percentage of People in the Labor Force in Orangevale?
61.9% of People are in the Labor Force in Orangevale.
What is the Unemployment Rate in Orangevale?
Unemployment Rate in Orangevale is 5.2%.