Pawtucket, RI Map & Demographics
Pawtucket Map
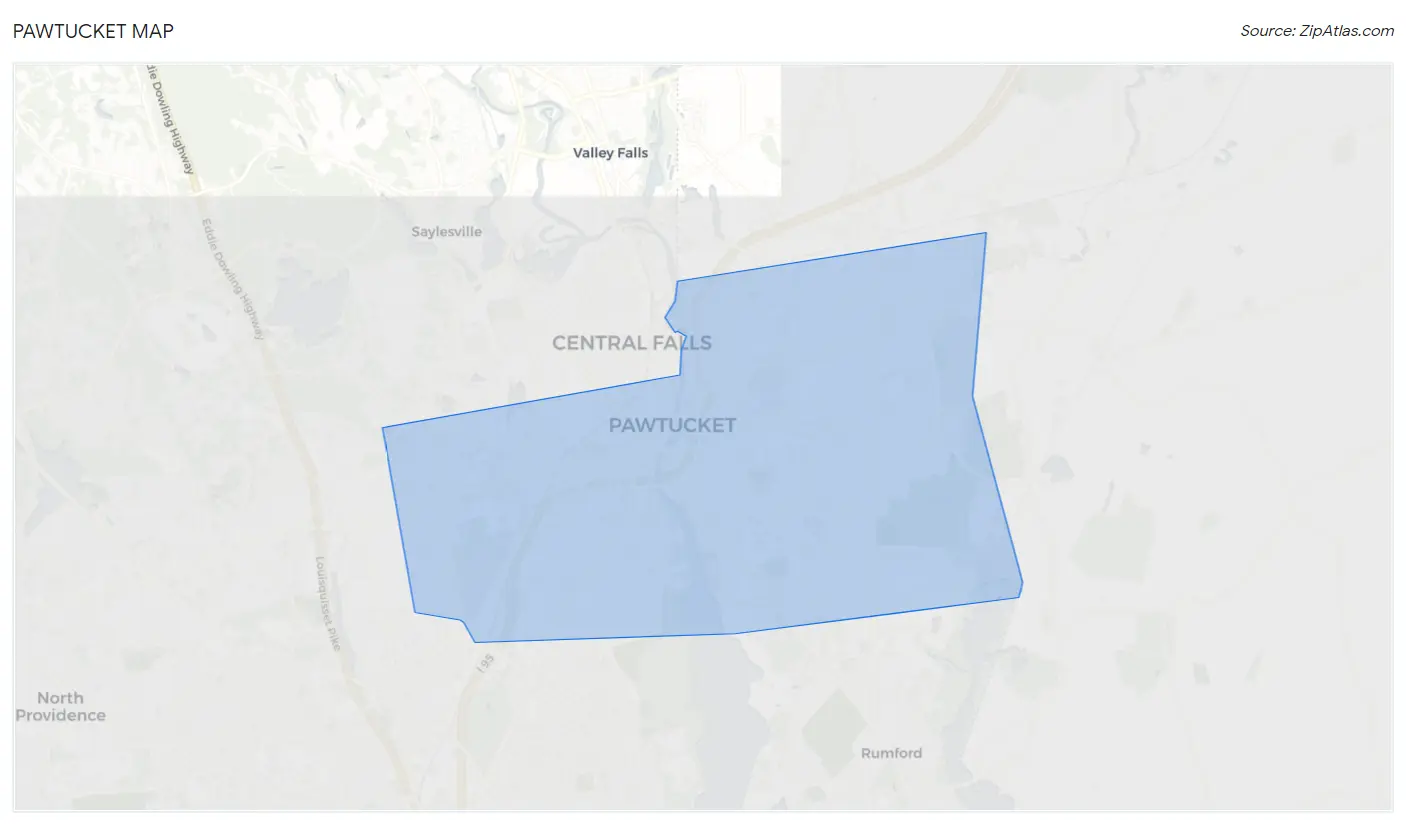
Pawtucket Overview
$33,541
PER CAPITA INCOME
$80,544
AVG FAMILY INCOME
$62,799
AVG HOUSEHOLD INCOME
19.6%
WAGE / INCOME GAP [ % ]
80.4¢/ $1
WAGE / INCOME GAP [ $ ]
$11,504
FAMILY INCOME DEFICIT
0.44
INEQUALITY / GINI INDEX
75,176
TOTAL POPULATION
38,163
MALE POPULATION
37,013
FEMALE POPULATION
103.11
MALES / 100 FEMALES
96.99
FEMALES / 100 MALES
37.1
MEDIAN AGE
3.1
AVG FAMILY SIZE
2.4
AVG HOUSEHOLD SIZE
43,204
LABOR FORCE [ PEOPLE ]
70.9%
PERCENT IN LABOR FORCE
6.7%
UNEMPLOYMENT RATE
Pawtucket Area Codes
Income in Pawtucket
Income Overview in Pawtucket
Per Capita Income in Pawtucket is $33,541, while median incomes of families and households are $80,544 and $62,799 respectively.
| Characteristic | Number | Measure |
| Per Capita Income | 75,176 | $33,541 |
| Median Family Income | 18,087 | $80,544 |
| Mean Family Income | 18,087 | $94,144 |
| Median Household Income | 30,582 | $62,799 |
| Mean Household Income | 30,582 | $79,635 |
| Income Deficit | 18,087 | $11,504 |
| Wage / Income Gap (%) | 75,176 | 19.57% |
| Wage / Income Gap ($) | 75,176 | 80.43¢ per $1 |
| Gini / Inequality Index | 75,176 | 0.44 |
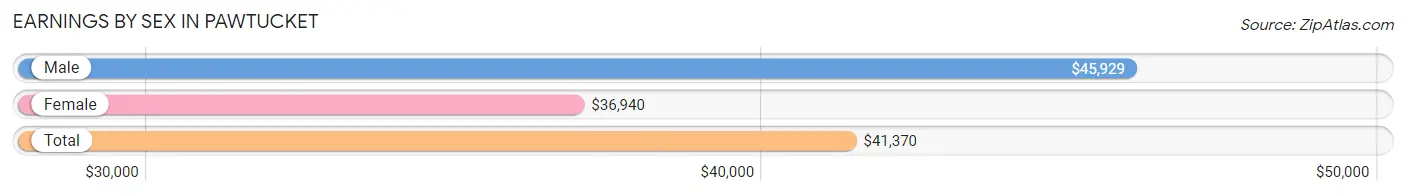
Earnings by Sex in Pawtucket
Average Earnings in Pawtucket are $41,370, $45,929 for men and $36,940 for women, a difference of 19.6%.
| Sex | Number | Average Earnings |
| Male | 22,612 (51.5%) | $45,929 |
| Female | 21,275 (48.5%) | $36,940 |
| Total | 43,887 (100.0%) | $41,370 |
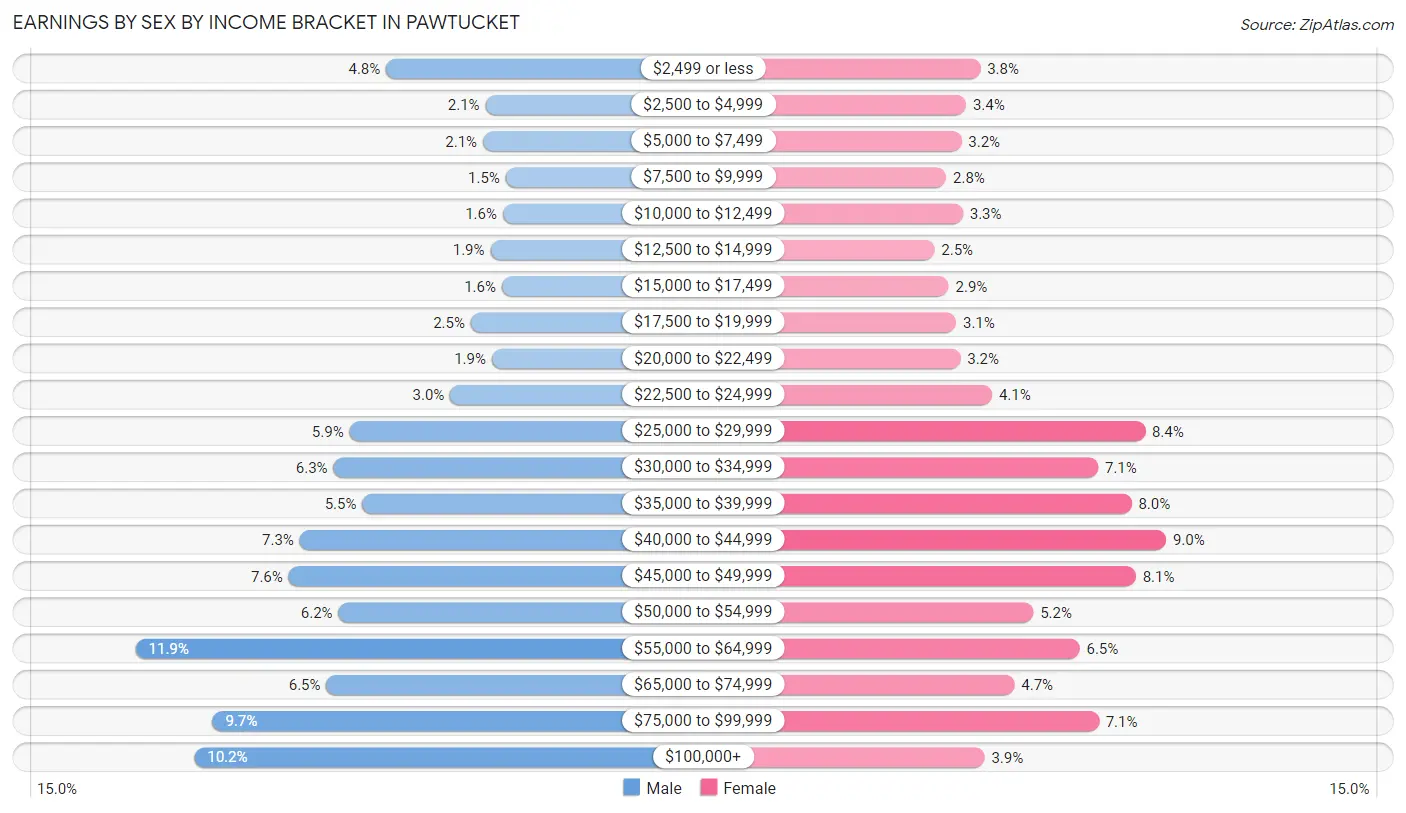
Earnings by Sex by Income Bracket in Pawtucket
The most common earnings brackets in Pawtucket are $55,000 to $64,999 for men (2,687 | 11.9%) and $40,000 to $44,999 for women (1,909 | 9.0%).
| Income | Male | Female |
| $2,499 or less | 1,095 (4.8%) | 797 (3.7%) |
| $2,500 to $4,999 | 464 (2.1%) | 712 (3.4%) |
| $5,000 to $7,499 | 480 (2.1%) | 684 (3.2%) |
| $7,500 to $9,999 | 335 (1.5%) | 594 (2.8%) |
| $10,000 to $12,499 | 353 (1.6%) | 694 (3.3%) |
| $12,500 to $14,999 | 431 (1.9%) | 524 (2.5%) |
| $15,000 to $17,499 | 359 (1.6%) | 608 (2.9%) |
| $17,500 to $19,999 | 557 (2.5%) | 653 (3.1%) |
| $20,000 to $22,499 | 422 (1.9%) | 678 (3.2%) |
| $22,500 to $24,999 | 688 (3.0%) | 869 (4.1%) |
| $25,000 to $29,999 | 1,327 (5.9%) | 1,783 (8.4%) |
| $30,000 to $34,999 | 1,428 (6.3%) | 1,503 (7.1%) |
| $35,000 to $39,999 | 1,247 (5.5%) | 1,702 (8.0%) |
| $40,000 to $44,999 | 1,643 (7.3%) | 1,909 (9.0%) |
| $45,000 to $49,999 | 1,714 (7.6%) | 1,728 (8.1%) |
| $50,000 to $54,999 | 1,397 (6.2%) | 1,115 (5.2%) |
| $55,000 to $64,999 | 2,687 (11.9%) | 1,391 (6.5%) |
| $65,000 to $74,999 | 1,474 (6.5%) | 1,001 (4.7%) |
| $75,000 to $99,999 | 2,198 (9.7%) | 1,506 (7.1%) |
| $100,000+ | 2,313 (10.2%) | 824 (3.9%) |
| Total | 22,612 (100.0%) | 21,275 (100.0%) |
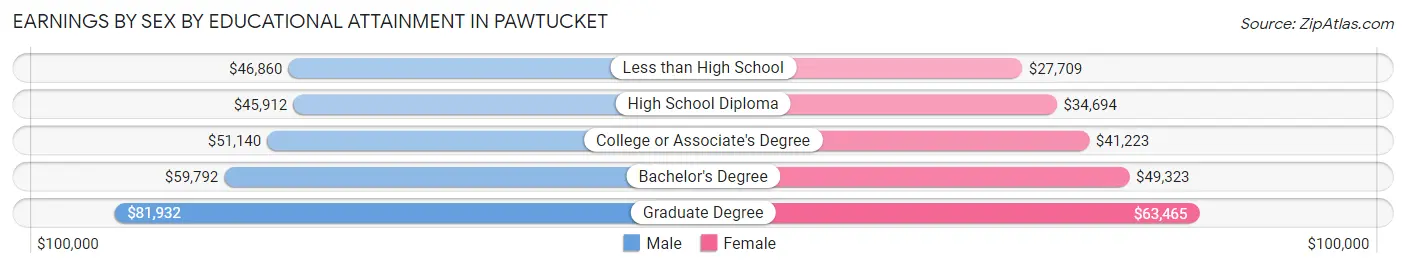
Earnings by Sex by Educational Attainment in Pawtucket
Average earnings in Pawtucket are $50,522 for men and $39,725 for women, a difference of 21.4%. Men with an educational attainment of graduate degree enjoy the highest average annual earnings of $81,932, while those with high school diploma education earn the least with $45,912. Women with an educational attainment of graduate degree earn the most with the average annual earnings of $63,465, while those with less than high school education have the smallest earnings of $27,709.
| Educational Attainment | Male Income | Female Income |
| Less than High School | $46,860 | $27,709 |
| High School Diploma | $45,912 | $34,694 |
| College or Associate's Degree | $51,140 | $41,223 |
| Bachelor's Degree | $59,792 | $49,323 |
| Graduate Degree | $81,932 | $63,465 |
| Total | $50,522 | $39,725 |
Family Income in Pawtucket
Family Income Brackets in Pawtucket
According to the Pawtucket family income data, there are 4,033 families falling into the $100,000 to $149,999 income range, which is the most common income bracket and makes up 22.3% of all families. Conversely, the $10,000 to $14,999 income bracket is the least frequent group with only 561 families (3.1%) belonging to this category.
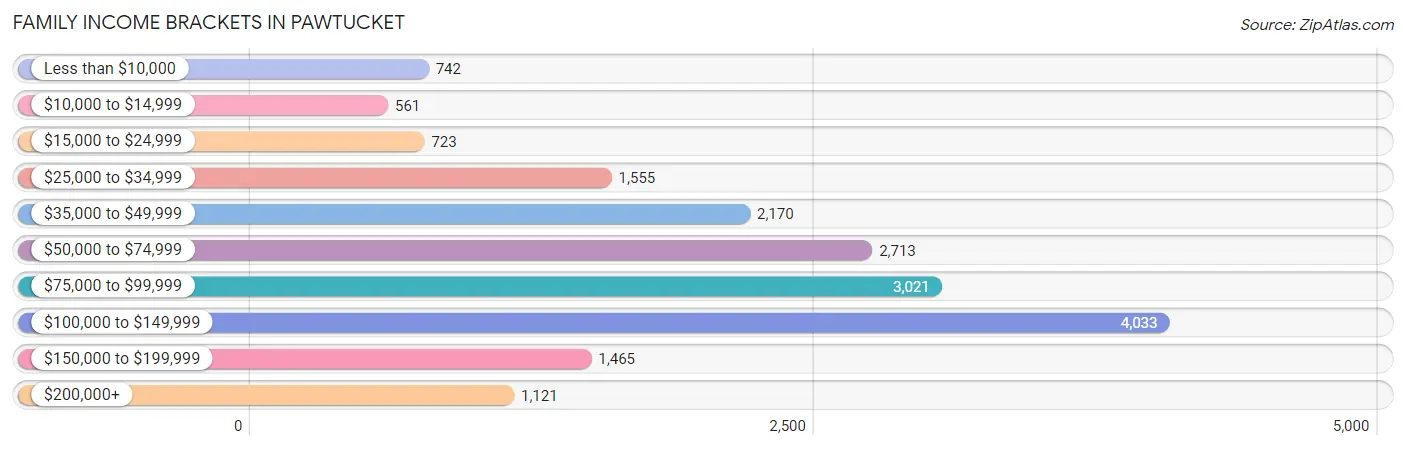
| Income Bracket | # Families | % Families |
| Less than $10,000 | 742 | 4.1% |
| $10,000 to $14,999 | 561 | 3.1% |
| $15,000 to $24,999 | 723 | 4.0% |
| $25,000 to $34,999 | 1,555 | 8.6% |
| $35,000 to $49,999 | 2,170 | 12.0% |
| $50,000 to $74,999 | 2,713 | 15.0% |
| $75,000 to $99,999 | 3,021 | 16.7% |
| $100,000 to $149,999 | 4,033 | 22.3% |
| $150,000 to $199,999 | 1,465 | 8.1% |
| $200,000+ | 1,121 | 6.2% |
Family Income by Famaliy Size in Pawtucket
7+ person families (184 | 1.0%) account for the highest median family income in Pawtucket with $250,001 per family, while 7+ person families (184 | 1.0%) have the highest median income of $35,714 per family member.
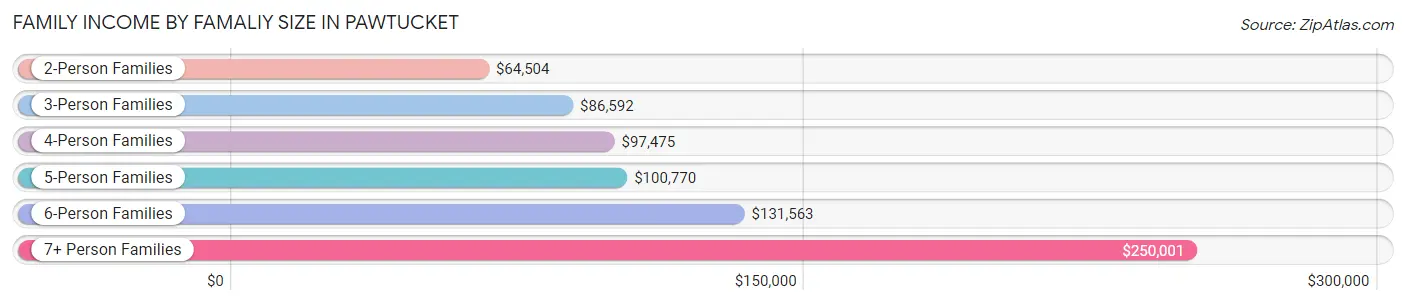
| Income Bracket | # Families | Median Income |
| 2-Person Families | 8,309 (45.9%) | $64,504 |
| 3-Person Families | 4,627 (25.6%) | $86,592 |
| 4-Person Families | 3,236 (17.9%) | $97,475 |
| 5-Person Families | 1,547 (8.6%) | $100,770 |
| 6-Person Families | 184 (1.0%) | $131,563 |
| 7+ Person Families | 184 (1.0%) | $250,001 |
| Total | 18,087 (100.0%) | $80,544 |
Family Income by Number of Earners in Pawtucket
The median family income in Pawtucket is $80,544, with families comprising 3+ earners (2,389) having the highest median family income of $127,141, while families with no earners (1,608) have the lowest median family income of $27,442, accounting for 13.2% and 8.9% of families, respectively.
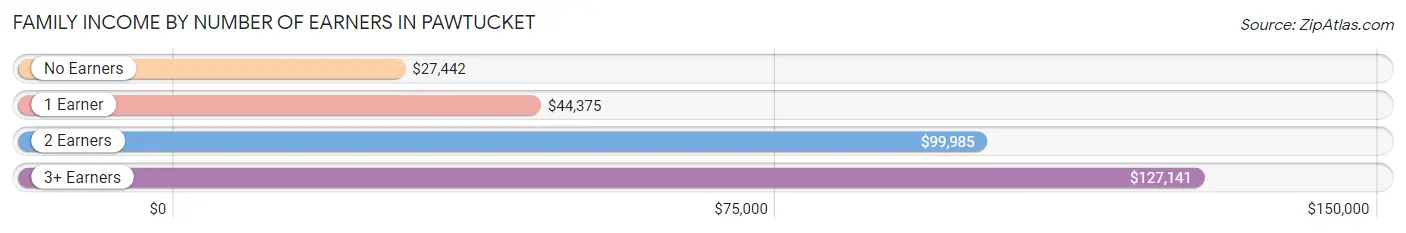
| Number of Earners | # Families | Median Income |
| No Earners | 1,608 (8.9%) | $27,442 |
| 1 Earner | 5,900 (32.6%) | $44,375 |
| 2 Earners | 8,190 (45.3%) | $99,985 |
| 3+ Earners | 2,389 (13.2%) | $127,141 |
| Total | 18,087 (100.0%) | $80,544 |
Household Income in Pawtucket
Household Income Brackets in Pawtucket
With 5,444 households falling in the category, the $100,000 to $149,999 income range is the most frequent in Pawtucket, accounting for 17.8% of all households. In contrast, only 1,346 households (4.4%) fall into the $200,000+ income bracket, making it the least populous group.
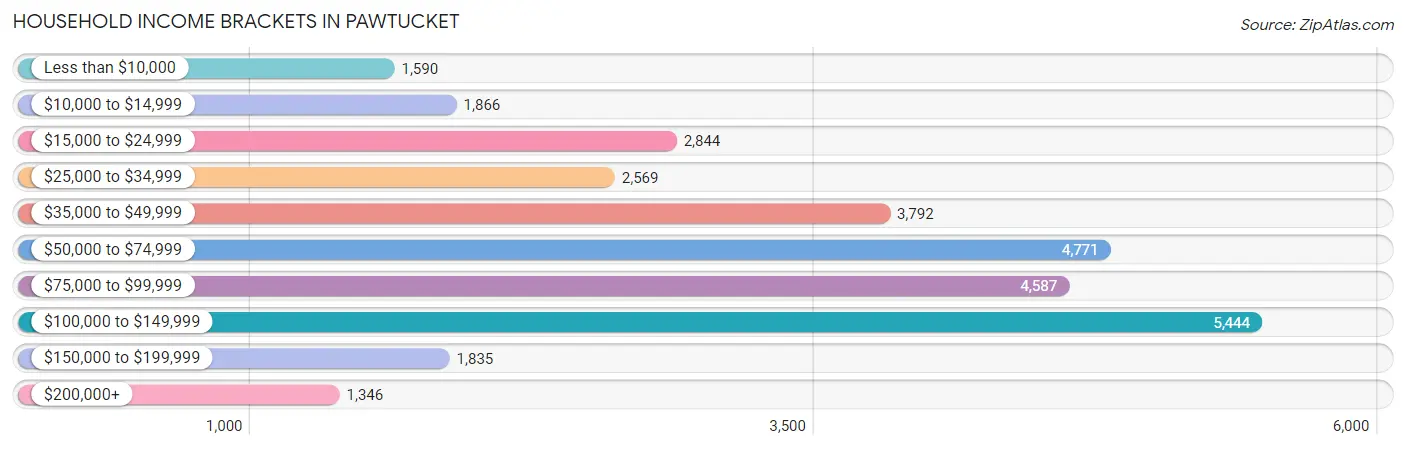
| Income Bracket | # Households | % Households |
| Less than $10,000 | 1,590 | 5.2% |
| $10,000 to $14,999 | 1,866 | 6.1% |
| $15,000 to $24,999 | 2,844 | 9.3% |
| $25,000 to $34,999 | 2,569 | 8.4% |
| $35,000 to $49,999 | 3,792 | 12.4% |
| $50,000 to $74,999 | 4,771 | 15.6% |
| $75,000 to $99,999 | 4,587 | 15.0% |
| $100,000 to $149,999 | 5,444 | 17.8% |
| $150,000 to $199,999 | 1,835 | 6.0% |
| $200,000+ | 1,346 | 4.4% |
Household Income by Householder Age in Pawtucket
The median household income in Pawtucket is $62,799, with the highest median household income of $75,541 found in the 45 to 64 years age bracket for the primary householder. A total of 11,531 households (37.7%) fall into this category. Meanwhile, the 65+ years age bracket for the primary householder has the lowest median household income of $38,248, with 6,470 households (21.2%) in this group.
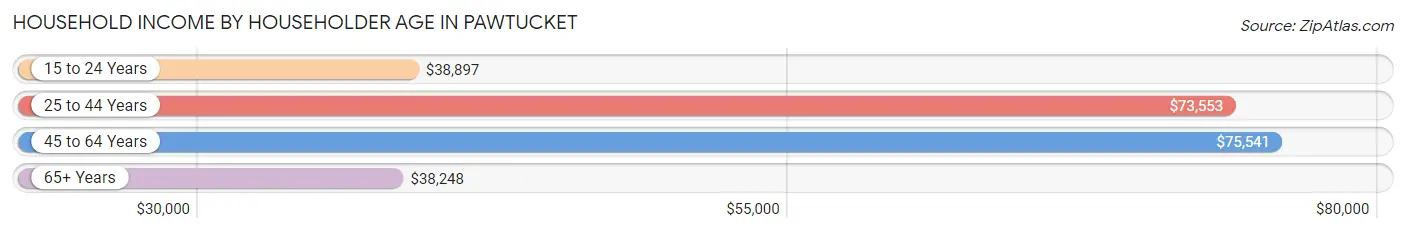
| Income Bracket | # Households | Median Income |
| 15 to 24 Years | 1,109 (3.6%) | $38,897 |
| 25 to 44 Years | 11,472 (37.5%) | $73,553 |
| 45 to 64 Years | 11,531 (37.7%) | $75,541 |
| 65+ Years | 6,470 (21.2%) | $38,248 |
| Total | 30,582 (100.0%) | $62,799 |
Poverty in Pawtucket
Income Below Poverty by Sex and Age in Pawtucket
With 13.2% poverty level for males and 14.3% for females among the residents of Pawtucket, 75 year old and over males and 15 year old females are the most vulnerable to poverty, with 417 males (25.4%) and 101 females (25.1%) in their respective age groups living below the poverty level.
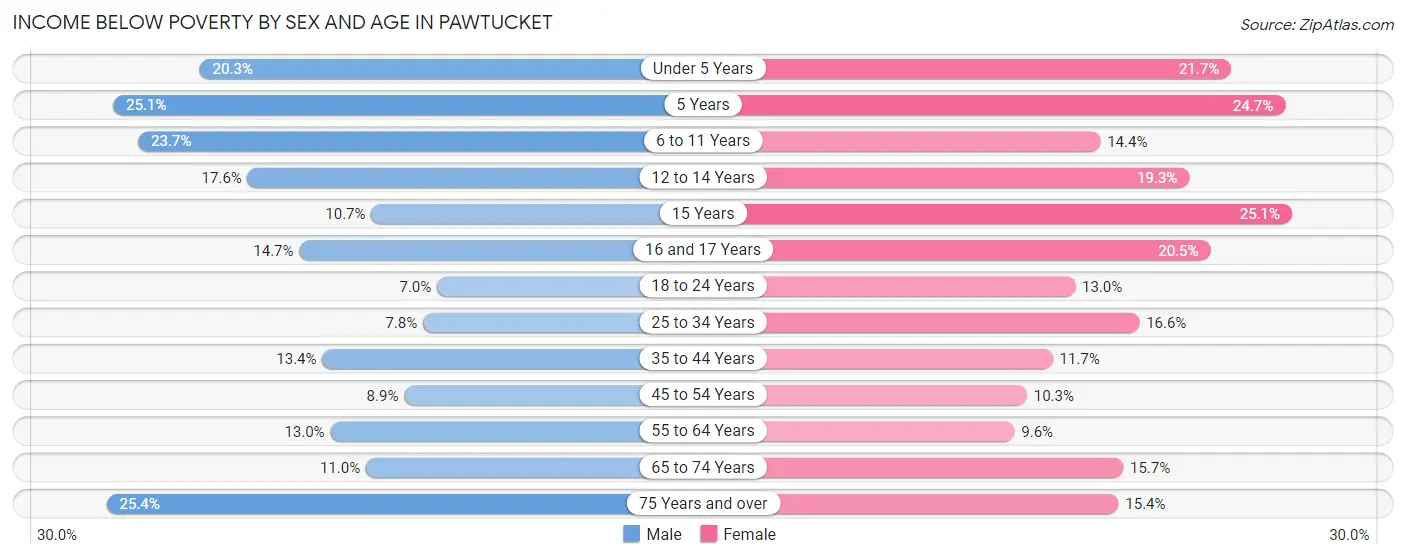
| Age Bracket | Male | Female |
| Under 5 Years | 426 (20.3%) | 447 (21.7%) |
| 5 Years | 86 (25.1%) | 96 (24.7%) |
| 6 to 11 Years | 799 (23.7%) | 276 (14.4%) |
| 12 to 14 Years | 225 (17.6%) | 300 (19.3%) |
| 15 Years | 51 (10.7%) | 101 (25.1%) |
| 16 and 17 Years | 131 (14.7%) | 173 (20.5%) |
| 18 to 24 Years | 251 (7.0%) | 375 (13.0%) |
| 25 to 34 Years | 456 (7.8%) | 1,065 (16.6%) |
| 35 to 44 Years | 796 (13.4%) | 612 (11.7%) |
| 45 to 54 Years | 453 (8.9%) | 482 (10.3%) |
| 55 to 64 Years | 603 (13.0%) | 475 (9.6%) |
| 65 to 74 Years | 304 (11.0%) | 466 (15.7%) |
| 75 Years and over | 417 (25.4%) | 345 (15.4%) |
| Total | 4,998 (13.2%) | 5,213 (14.3%) |
Income Above Poverty by Sex and Age in Pawtucket
According to the poverty statistics in Pawtucket, males aged 18 to 24 years and females aged 55 to 64 years are the age groups that are most secure financially, with 93.0% of males and 90.4% of females in these age groups living above the poverty line.
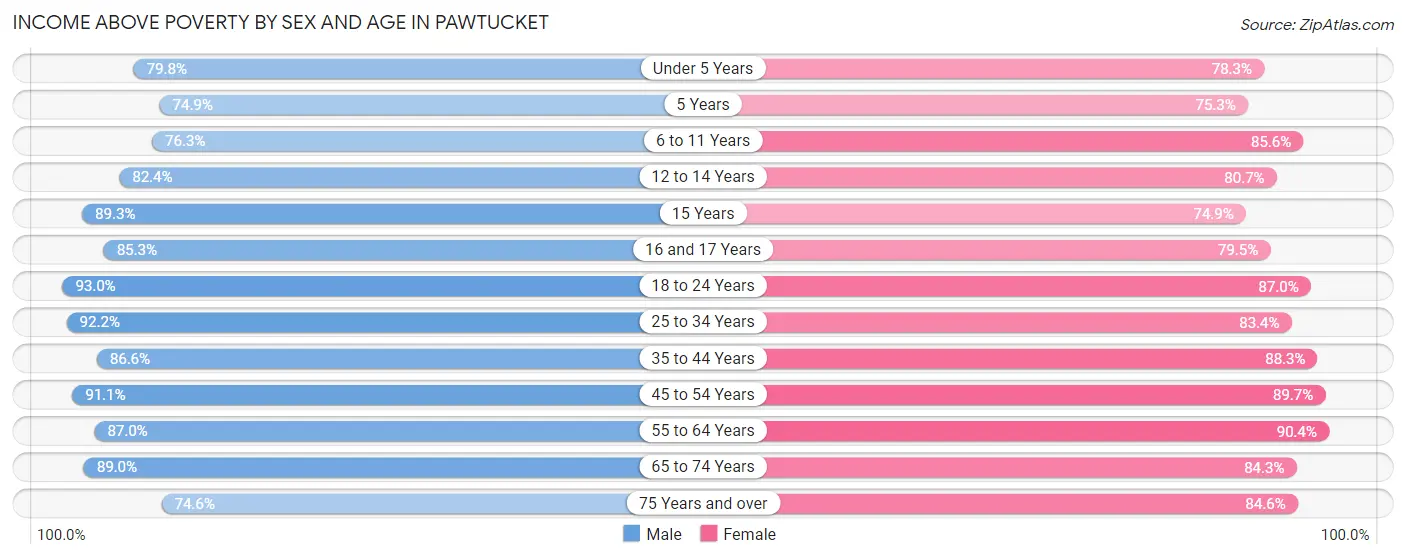
| Age Bracket | Male | Female |
| Under 5 Years | 1,678 (79.7%) | 1,615 (78.3%) |
| 5 Years | 257 (74.9%) | 293 (75.3%) |
| 6 to 11 Years | 2,575 (76.3%) | 1,642 (85.6%) |
| 12 to 14 Years | 1,055 (82.4%) | 1,251 (80.7%) |
| 15 Years | 426 (89.3%) | 302 (74.9%) |
| 16 and 17 Years | 760 (85.3%) | 670 (79.5%) |
| 18 to 24 Years | 3,319 (93.0%) | 2,512 (87.0%) |
| 25 to 34 Years | 5,383 (92.2%) | 5,368 (83.4%) |
| 35 to 44 Years | 5,135 (86.6%) | 4,603 (88.3%) |
| 45 to 54 Years | 4,659 (91.1%) | 4,199 (89.7%) |
| 55 to 64 Years | 4,047 (87.0%) | 4,469 (90.4%) |
| 65 to 74 Years | 2,461 (89.0%) | 2,509 (84.3%) |
| 75 Years and over | 1,223 (74.6%) | 1,895 (84.6%) |
| Total | 32,978 (86.8%) | 31,328 (85.7%) |
Income Below Poverty Among Married-Couple Families in Pawtucket
The poverty statistics for married-couple families in Pawtucket show that 4.6% or 463 of the total 10,012 families live below the poverty line. Families with 3 or 4 children have the highest poverty rate of 14.5%, comprising of 88 families. On the other hand, families with no children have the lowest poverty rate of 3.4%, which includes 183 families.
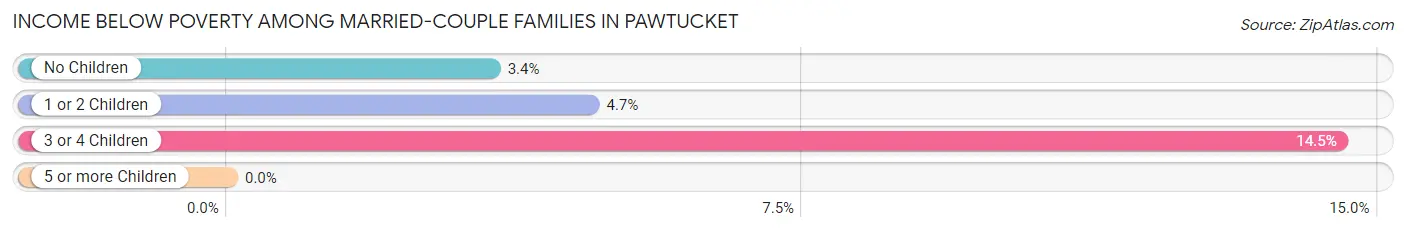
| Children | Above Poverty | Below Poverty |
| No Children | 5,157 (96.6%) | 183 (3.4%) |
| 1 or 2 Children | 3,873 (95.3%) | 192 (4.7%) |
| 3 or 4 Children | 519 (85.5%) | 88 (14.5%) |
| 5 or more Children | 0 (0.0%) | 0 (0.0%) |
| Total | 9,549 (95.4%) | 463 (4.6%) |
Income Below Poverty Among Single-Parent Households in Pawtucket
According to the poverty data in Pawtucket, 14.3% or 347 single-father households and 19.1% or 1,076 single-mother households are living below the poverty line. Among single-father households, those with 3 or 4 children have the highest poverty rate, with 95 households (62.9%) experiencing poverty. Likewise, among single-mother households, those with 3 or 4 children have the highest poverty rate, with 374 households (63.7%) falling below the poverty line.
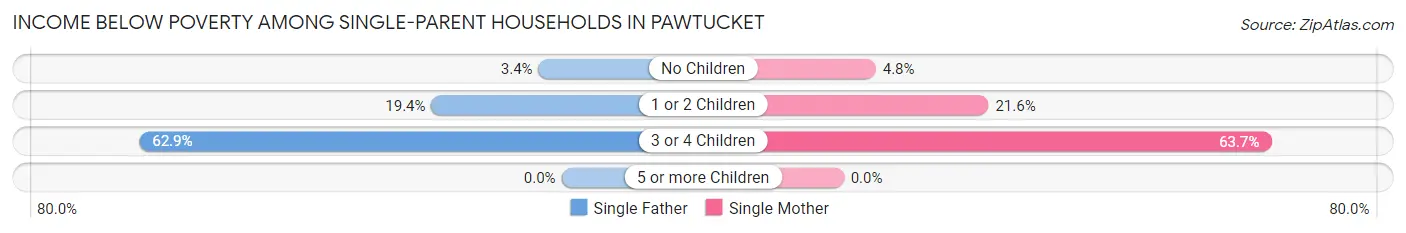
| Children | Single Father | Single Mother |
| No Children | 41 (3.4%) | 111 (4.8%) |
| 1 or 2 Children | 211 (19.4%) | 591 (21.6%) |
| 3 or 4 Children | 95 (62.9%) | 374 (63.7%) |
| 5 or more Children | 0 (0.0%) | 0 (0.0%) |
| Total | 347 (14.3%) | 1,076 (19.1%) |
Income Below Poverty Among Married-Couple vs Single-Parent Households in Pawtucket
The poverty data for Pawtucket shows that 463 of the married-couple family households (4.6%) and 1,423 of the single-parent households (17.6%) are living below the poverty level. Within the married-couple family households, those with 3 or 4 children have the highest poverty rate, with 88 households (14.5%) falling below the poverty line. Among the single-parent households, those with 3 or 4 children have the highest poverty rate, with 469 household (63.5%) living below poverty.
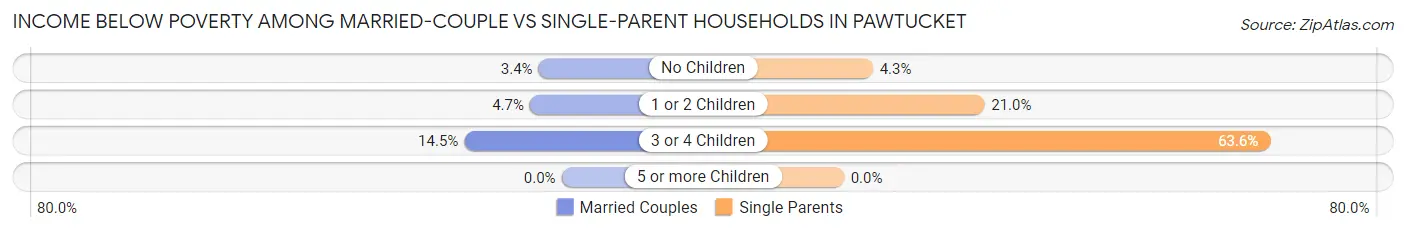
| Children | Married-Couple Families | Single-Parent Households |
| No Children | 183 (3.4%) | 152 (4.3%) |
| 1 or 2 Children | 192 (4.7%) | 802 (21.0%) |
| 3 or 4 Children | 88 (14.5%) | 469 (63.5%) |
| 5 or more Children | 0 (0.0%) | 0 (0.0%) |
| Total | 463 (4.6%) | 1,423 (17.6%) |
Race in Pawtucket
The most populous races in Pawtucket are White / Caucasian (40,138 | 53.4%), Hispanic or Latino (19,412 | 25.8%), and Black / African American (12,586 | 16.7%).
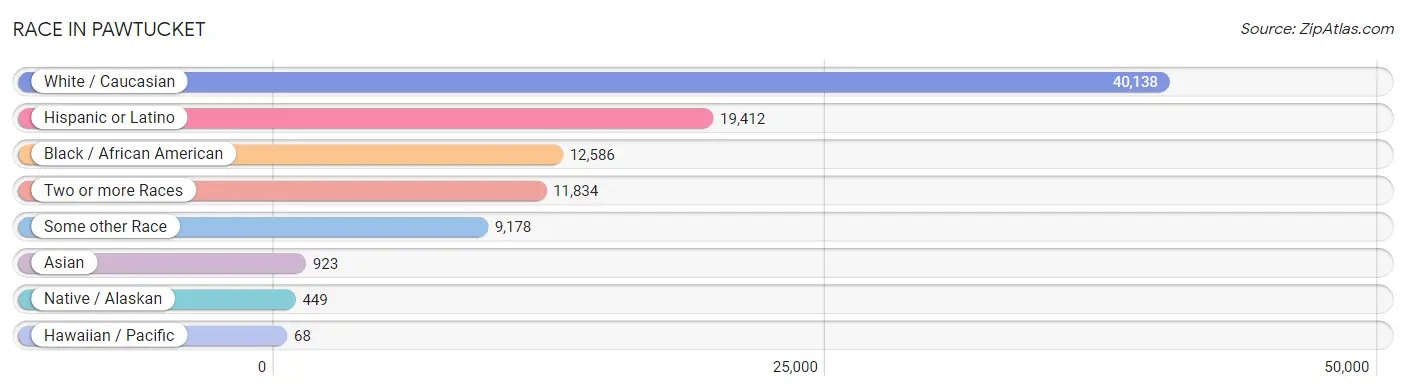
| Race | # Population | % Population |
| Asian | 923 | 1.2% |
| Black / African American | 12,586 | 16.7% |
| Hawaiian / Pacific | 68 | 0.1% |
| Hispanic or Latino | 19,412 | 25.8% |
| Native / Alaskan | 449 | 0.6% |
| White / Caucasian | 40,138 | 53.4% |
| Two or more Races | 11,834 | 15.7% |
| Some other Race | 9,178 | 12.2% |
| Total | 75,176 | 100.0% |
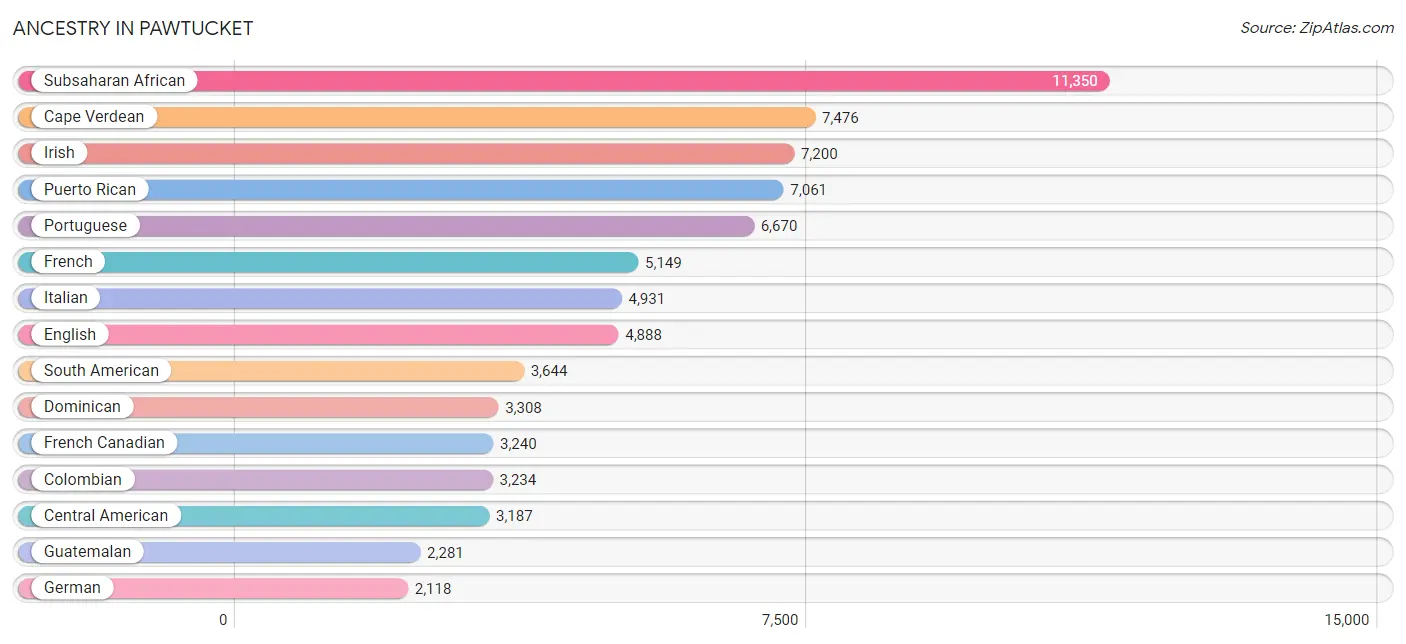
Ancestry in Pawtucket
The most populous ancestries reported in Pawtucket are Subsaharan African (11,350 | 15.1%), Cape Verdean (7,476 | 9.9%), Irish (7,200 | 9.6%), Puerto Rican (7,061 | 9.4%), and Portuguese (6,670 | 8.9%), together accounting for 52.9% of all Pawtucket residents.
| Ancestry | # Population | % Population |
| African | 1,208 | 1.6% |
| Albanian | 6 | 0.0% |
| American | 1,965 | 2.6% |
| Arab | 1,005 | 1.3% |
| Argentinean | 50 | 0.1% |
| Armenian | 70 | 0.1% |
| Austrian | 103 | 0.1% |
| Barbadian | 33 | 0.0% |
| Basque | 7 | 0.0% |
| Belgian | 22 | 0.0% |
| Belizean | 21 | 0.0% |
| Bhutanese | 83 | 0.1% |
| Blackfeet | 39 | 0.1% |
| Bolivian | 80 | 0.1% |
| Brazilian | 64 | 0.1% |
| British | 198 | 0.3% |
| British West Indian | 34 | 0.1% |
| Burmese | 80 | 0.1% |
| Cajun | 62 | 0.1% |
| Canadian | 172 | 0.2% |
| Cape Verdean | 7,476 | 9.9% |
| Central American | 3,187 | 4.2% |
| Central American Indian | 392 | 0.5% |
| Cherokee | 171 | 0.2% |
| Chilean | 50 | 0.1% |
| Colombian | 3,234 | 4.3% |
| Costa Rican | 94 | 0.1% |
| Creek | 14 | 0.0% |
| Cuban | 176 | 0.2% |
| Czech | 8 | 0.0% |
| Czechoslovakian | 43 | 0.1% |
| Danish | 6 | 0.0% |
| Dominican | 3,308 | 4.4% |
| Dutch | 166 | 0.2% |
| Eastern European | 156 | 0.2% |
| Ecuadorian | 66 | 0.1% |
| Egyptian | 510 | 0.7% |
| English | 4,888 | 6.5% |
| Estonian | 14 | 0.0% |
| European | 345 | 0.5% |
| Filipino | 86 | 0.1% |
| Finnish | 22 | 0.0% |
| French | 5,149 | 6.9% |
| French American Indian | 5 | 0.0% |
| French Canadian | 3,240 | 4.3% |
| German | 2,118 | 2.8% |
| Ghanaian | 31 | 0.0% |
| Greek | 331 | 0.4% |
| Guatemalan | 2,281 | 3.0% |
| Haitian | 563 | 0.7% |
| Honduran | 169 | 0.2% |
| Hungarian | 153 | 0.2% |
| Indian (Asian) | 186 | 0.3% |
| Iraqi | 30 | 0.0% |
| Irish | 7,200 | 9.6% |
| Israeli | 18 | 0.0% |
| Italian | 4,931 | 6.6% |
| Jamaican | 197 | 0.3% |
| Japanese | 245 | 0.3% |
| Korean | 289 | 0.4% |
| Lebanese | 204 | 0.3% |
| Liberian | 1,095 | 1.5% |
| Lithuanian | 176 | 0.2% |
| Macedonian | 10 | 0.0% |
| Malaysian | 23 | 0.0% |
| Maltese | 36 | 0.1% |
| Mexican | 1,076 | 1.4% |
| Mongolian | 11 | 0.0% |
| Moroccan | 100 | 0.1% |
| Native Hawaiian | 69 | 0.1% |
| Navajo | 5 | 0.0% |
| Nicaraguan | 40 | 0.1% |
| Nigerian | 834 | 1.1% |
| Northern European | 11 | 0.0% |
| Norwegian | 96 | 0.1% |
| Pakistani | 34 | 0.1% |
| Panamanian | 114 | 0.2% |
| Peruvian | 126 | 0.2% |
| Polish | 1,976 | 2.6% |
| Portuguese | 6,670 | 8.9% |
| Puerto Rican | 7,061 | 9.4% |
| Romanian | 10 | 0.0% |
| Russian | 199 | 0.3% |
| Salvadoran | 489 | 0.6% |
| Scandinavian | 84 | 0.1% |
| Scotch-Irish | 143 | 0.2% |
| Scottish | 728 | 1.0% |
| Senegalese | 256 | 0.3% |
| Sierra Leonean | 135 | 0.2% |
| Slavic | 16 | 0.0% |
| Slovak | 20 | 0.0% |
| South American | 3,644 | 4.9% |
| South American Indian | 53 | 0.1% |
| Soviet Union | 7 | 0.0% |
| Spaniard | 123 | 0.2% |
| Spanish | 62 | 0.1% |
| Sri Lankan | 86 | 0.1% |
| Subsaharan African | 11,350 | 15.1% |
| Swedish | 342 | 0.4% |
| Swiss | 50 | 0.1% |
| Syrian | 156 | 0.2% |
| Thai | 396 | 0.5% |
| Trinidadian and Tobagonian | 61 | 0.1% |
| Ukrainian | 151 | 0.2% |
| Venezuelan | 38 | 0.1% |
| Welsh | 104 | 0.1% |
| West Indian | 129 | 0.2% |
| Yugoslavian | 9 | 0.0% | View All 108 Rows |
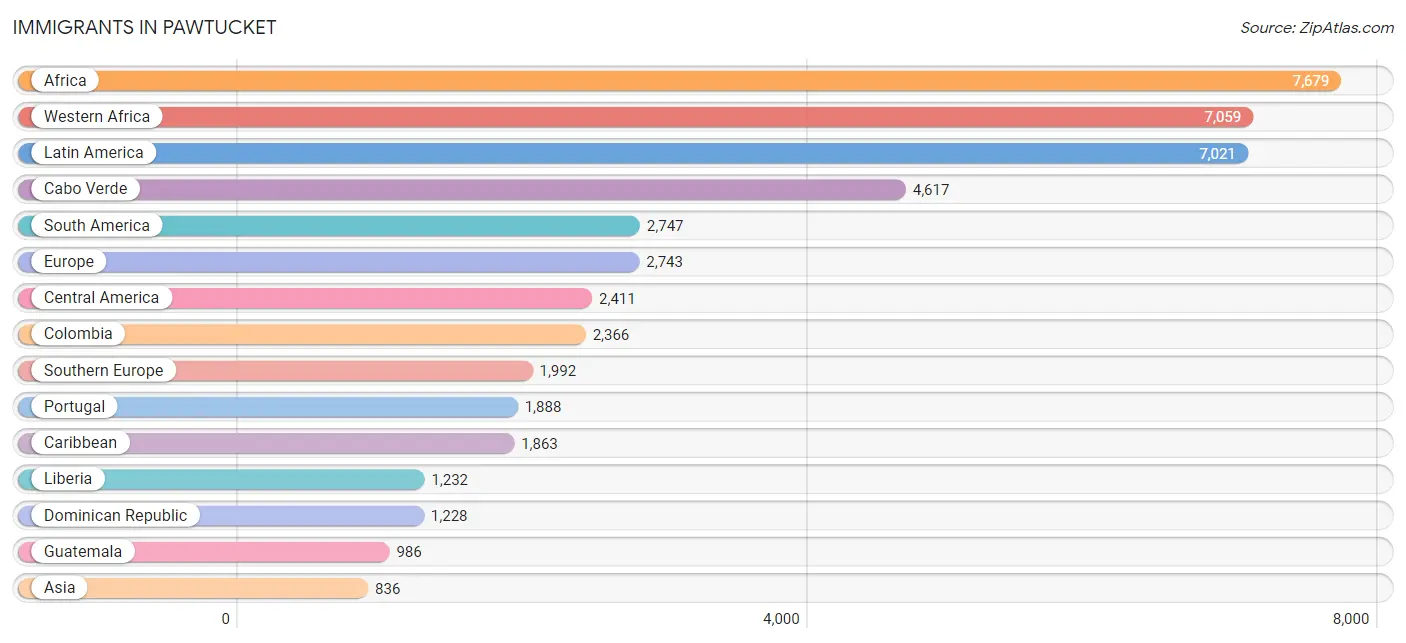
Immigrants in Pawtucket
The most numerous immigrant groups reported in Pawtucket came from Africa (7,679 | 10.2%), Western Africa (7,059 | 9.4%), Latin America (7,021 | 9.3%), Cabo Verde (4,617 | 6.1%), and South America (2,747 | 3.6%), together accounting for 38.7% of all Pawtucket residents.
| Immigration Origin | # Population | % Population |
| Africa | 7,679 | 10.2% |
| Argentina | 15 | 0.0% |
| Asia | 836 | 1.1% |
| Austria | 40 | 0.1% |
| Azores | 381 | 0.5% |
| Barbados | 6 | 0.0% |
| Belarus | 30 | 0.0% |
| Belize | 21 | 0.0% |
| Bolivia | 62 | 0.1% |
| Brazil | 90 | 0.1% |
| Cabo Verde | 4,617 | 6.1% |
| Cambodia | 82 | 0.1% |
| Canada | 43 | 0.1% |
| Caribbean | 1,863 | 2.5% |
| Central America | 2,411 | 3.2% |
| Chile | 11 | 0.0% |
| China | 101 | 0.1% |
| Colombia | 2,366 | 3.2% |
| Costa Rica | 15 | 0.0% |
| Cuba | 6 | 0.0% |
| Dominican Republic | 1,228 | 1.6% |
| Eastern Africa | 15 | 0.0% |
| Eastern Asia | 157 | 0.2% |
| Eastern Europe | 411 | 0.5% |
| Ecuador | 65 | 0.1% |
| Egypt | 188 | 0.3% |
| El Salvador | 528 | 0.7% |
| England | 45 | 0.1% |
| Europe | 2,743 | 3.6% |
| Fiji | 63 | 0.1% |
| France | 5 | 0.0% |
| Germany | 66 | 0.1% |
| Ghana | 128 | 0.2% |
| Greece | 66 | 0.1% |
| Guatemala | 986 | 1.3% |
| Guyana | 8 | 0.0% |
| Haiti | 426 | 0.6% |
| Honduras | 113 | 0.2% |
| India | 191 | 0.3% |
| Ireland | 17 | 0.0% |
| Israel | 20 | 0.0% |
| Italy | 38 | 0.1% |
| Jamaica | 107 | 0.1% |
| Jordan | 11 | 0.0% |
| Korea | 56 | 0.1% |
| Laos | 8 | 0.0% |
| Latin America | 7,021 | 9.3% |
| Latvia | 36 | 0.1% |
| Lebanon | 85 | 0.1% |
| Liberia | 1,232 | 1.6% |
| Malaysia | 9 | 0.0% |
| Mexico | 626 | 0.8% |
| Middle Africa | 151 | 0.2% |
| Morocco | 70 | 0.1% |
| Netherlands | 39 | 0.1% |
| Nicaragua | 40 | 0.1% |
| Nigeria | 678 | 0.9% |
| Northern Africa | 258 | 0.3% |
| Northern Europe | 136 | 0.2% |
| Norway | 10 | 0.0% |
| Oceania | 63 | 0.1% |
| Panama | 82 | 0.1% |
| Peru | 45 | 0.1% |
| Philippines | 59 | 0.1% |
| Poland | 140 | 0.2% |
| Portugal | 1,888 | 2.5% |
| Russia | 76 | 0.1% |
| Scotland | 10 | 0.0% |
| Senegal | 132 | 0.2% |
| Sierra Leone | 160 | 0.2% |
| South America | 2,747 | 3.6% |
| South Central Asia | 191 | 0.3% |
| South Eastern Asia | 258 | 0.3% |
| Southern Europe | 1,992 | 2.6% |
| Syria | 114 | 0.2% |
| Taiwan | 23 | 0.0% |
| Thailand | 37 | 0.1% |
| Trinidad and Tobago | 57 | 0.1% |
| Ukraine | 97 | 0.1% |
| Venezuela | 85 | 0.1% |
| Vietnam | 63 | 0.1% |
| Western Africa | 7,059 | 9.4% |
| Western Asia | 230 | 0.3% |
| Western Europe | 166 | 0.2% | View All 84 Rows |
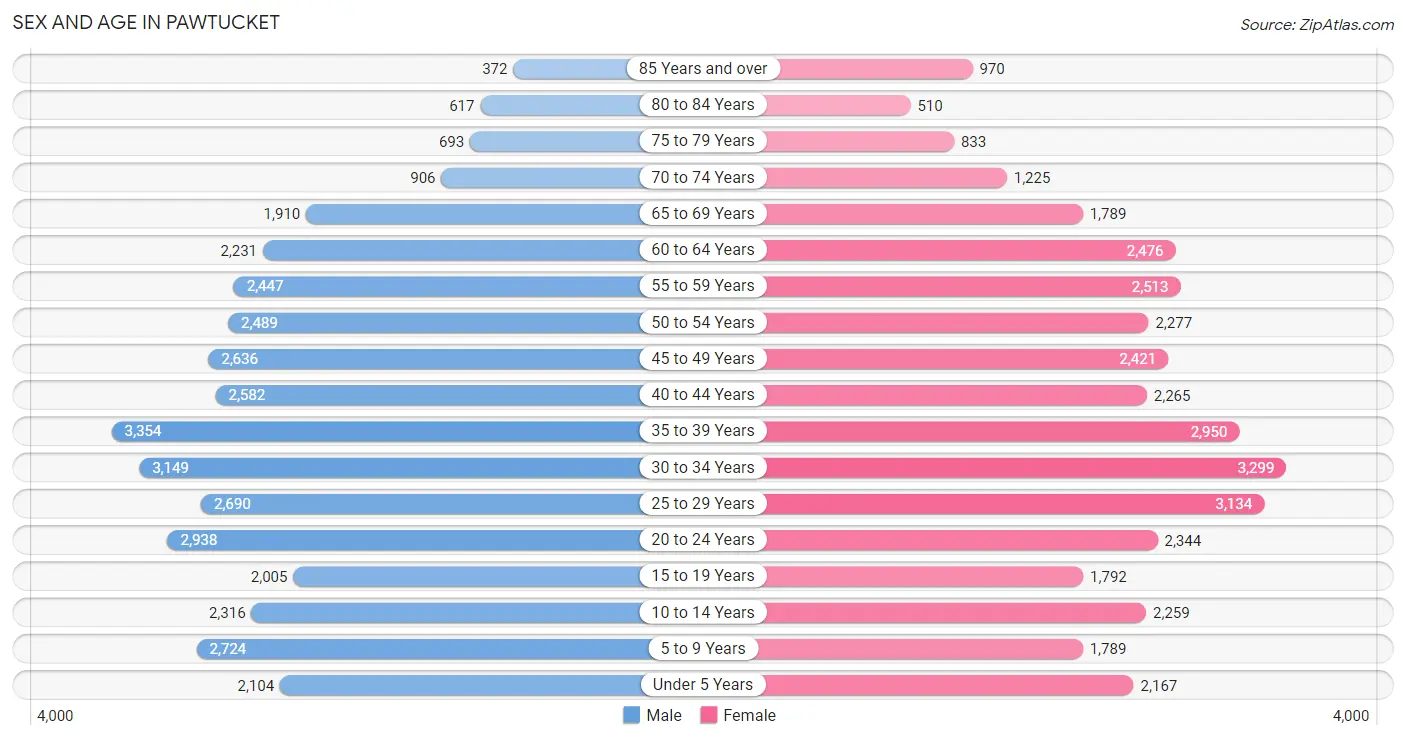
Sex and Age in Pawtucket
Sex and Age in Pawtucket
The most populous age groups in Pawtucket are 35 to 39 Years (3,354 | 8.8%) for men and 30 to 34 Years (3,299 | 8.9%) for women.
| Age Bracket | Male | Female |
| Under 5 Years | 2,104 (5.5%) | 2,167 (5.9%) |
| 5 to 9 Years | 2,724 (7.1%) | 1,789 (4.8%) |
| 10 to 14 Years | 2,316 (6.1%) | 2,259 (6.1%) |
| 15 to 19 Years | 2,005 (5.2%) | 1,792 (4.8%) |
| 20 to 24 Years | 2,938 (7.7%) | 2,344 (6.3%) |
| 25 to 29 Years | 2,690 (7.0%) | 3,134 (8.5%) |
| 30 to 34 Years | 3,149 (8.3%) | 3,299 (8.9%) |
| 35 to 39 Years | 3,354 (8.8%) | 2,950 (8.0%) |
| 40 to 44 Years | 2,582 (6.8%) | 2,265 (6.1%) |
| 45 to 49 Years | 2,636 (6.9%) | 2,421 (6.5%) |
| 50 to 54 Years | 2,489 (6.5%) | 2,277 (6.1%) |
| 55 to 59 Years | 2,447 (6.4%) | 2,513 (6.8%) |
| 60 to 64 Years | 2,231 (5.9%) | 2,476 (6.7%) |
| 65 to 69 Years | 1,910 (5.0%) | 1,789 (4.8%) |
| 70 to 74 Years | 906 (2.4%) | 1,225 (3.3%) |
| 75 to 79 Years | 693 (1.8%) | 833 (2.2%) |
| 80 to 84 Years | 617 (1.6%) | 510 (1.4%) |
| 85 Years and over | 372 (1.0%) | 970 (2.6%) |
| Total | 38,163 (100.0%) | 37,013 (100.0%) |
Families and Households in Pawtucket
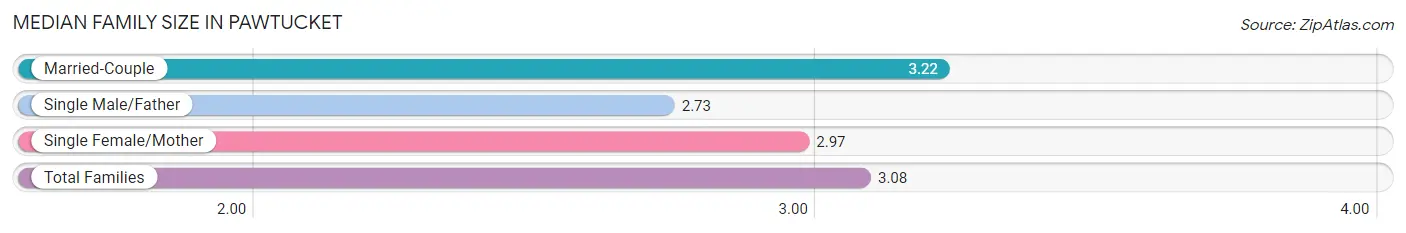
Median Family Size in Pawtucket
The median family size in Pawtucket is 3.08 persons per family, with married-couple families (10,012 | 55.3%) accounting for the largest median family size of 3.22 persons per family. On the other hand, single male/father families (2,430 | 13.4%) represent the smallest median family size with 2.73 persons per family.
| Family Type | # Families | Family Size |
| Married-Couple | 10,012 (55.3%) | 3.22 |
| Single Male/Father | 2,430 (13.4%) | 2.73 |
| Single Female/Mother | 5,645 (31.2%) | 2.97 |
| Total Families | 18,087 (100.0%) | 3.08 |
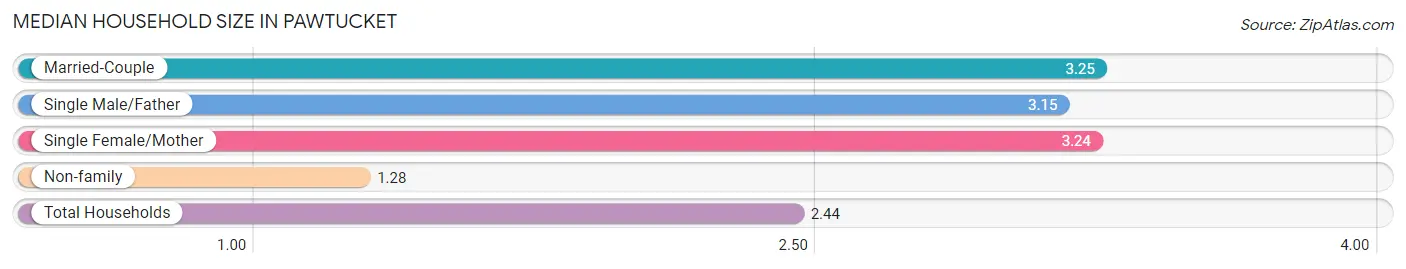
Median Household Size in Pawtucket
The median household size in Pawtucket is 2.44 persons per household, with married-couple households (10,012 | 32.7%) accounting for the largest median household size of 3.25 persons per household. non-family households (12,495 | 40.9%) represent the smallest median household size with 1.28 persons per household.
| Household Type | # Households | Household Size |
| Married-Couple | 10,012 (32.7%) | 3.25 |
| Single Male/Father | 2,430 (8.0%) | 3.15 |
| Single Female/Mother | 5,645 (18.5%) | 3.24 |
| Non-family | 12,495 (40.9%) | 1.28 |
| Total Households | 30,582 (100.0%) | 2.44 |
Household Size by Marriage Status in Pawtucket
Out of a total of 30,582 households in Pawtucket, 18,087 (59.1%) are family households, while 12,495 (40.9%) are nonfamily households. The most numerous type of family households are 2-person households, comprising 7,337, and the most common type of nonfamily households are 1-person households, comprising 9,963.
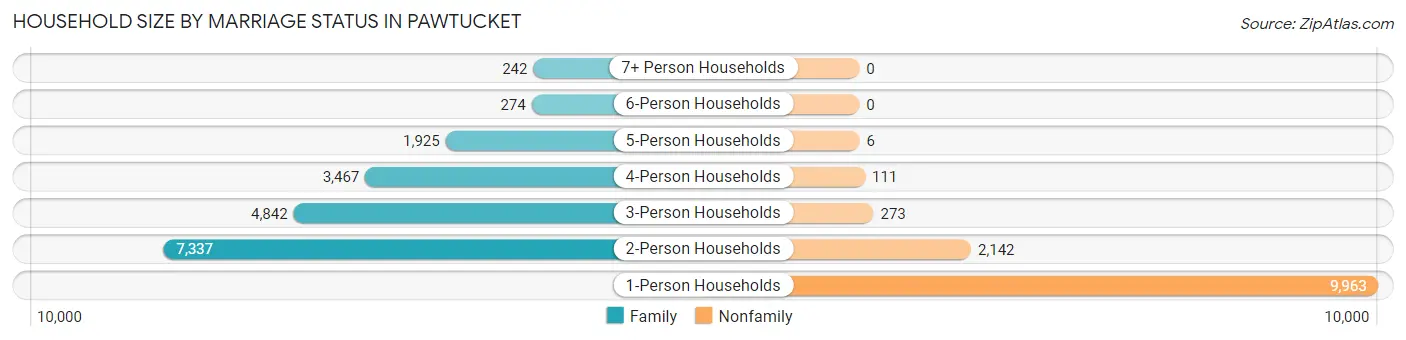
| Household Size | Family Households | Nonfamily Households |
| 1-Person Households | - | 9,963 (32.6%) |
| 2-Person Households | 7,337 (24.0%) | 2,142 (7.0%) |
| 3-Person Households | 4,842 (15.8%) | 273 (0.9%) |
| 4-Person Households | 3,467 (11.3%) | 111 (0.4%) |
| 5-Person Households | 1,925 (6.3%) | 6 (0.0%) |
| 6-Person Households | 274 (0.9%) | 0 (0.0%) |
| 7+ Person Households | 242 (0.8%) | 0 (0.0%) |
| Total | 18,087 (59.1%) | 12,495 (40.9%) |
Female Fertility in Pawtucket
Fertility by Age in Pawtucket
Average fertility rate in Pawtucket is 38.0 births per 1,000 women. Women in the age bracket of 20 to 34 years have the highest fertility rate with 52.0 births per 1,000 women. Women in the age bracket of 20 to 34 years acount for 64.7% of all women with births.
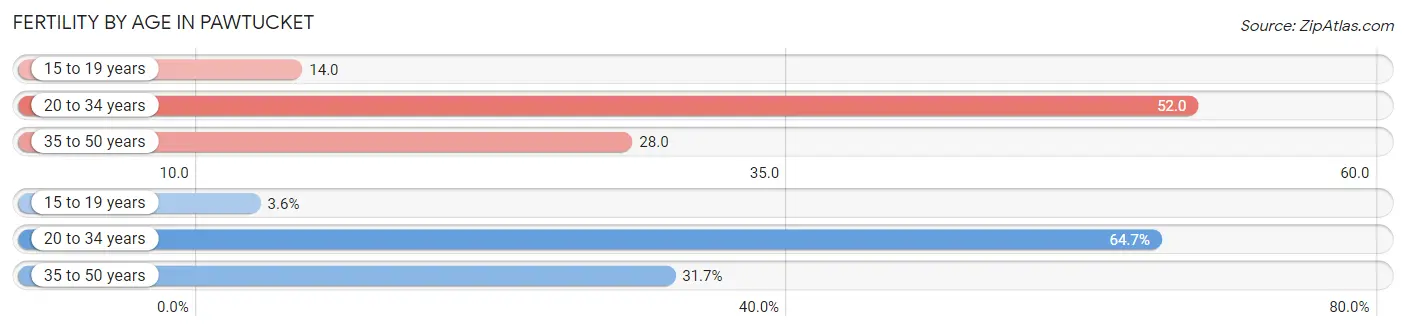
| Age Bracket | Women with Births | Births / 1,000 Women |
| 15 to 19 years | 25 (3.6%) | 14.0 |
| 20 to 34 years | 453 (64.7%) | 52.0 |
| 35 to 50 years | 222 (31.7%) | 28.0 |
| Total | 700 (100.0%) | 38.0 |
Fertility by Age by Marriage Status in Pawtucket
59.6% of women with births (700) in Pawtucket are married. The highest percentage of unmarried women with births falls into 15 to 19 years age bracket with 100.0% of them unmarried at the time of birth, while the lowest percentage of unmarried women with births belong to 35 to 50 years age bracket with 35.1% of them unmarried.
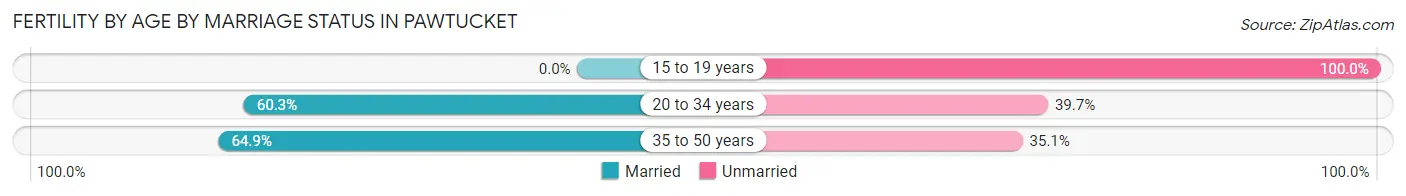
| Age Bracket | Married | Unmarried |
| 15 to 19 years | 0 (0.0%) | 25 (100.0%) |
| 20 to 34 years | 273 (60.3%) | 180 (39.7%) |
| 35 to 50 years | 144 (64.9%) | 78 (35.1%) |
| Total | 417 (59.6%) | 283 (40.4%) |
Fertility by Education in Pawtucket
Average fertility rate in Pawtucket is 38.0 births per 1,000 women. Women with the education attainment of graduate degree have the highest fertility rate of 82.0 births per 1,000 women, while women with the education attainment of less than high school have the lowest fertility at 19.0 births per 1,000 women. Women with the education attainment of college or associate's degree represent 41.9% of all women with births.
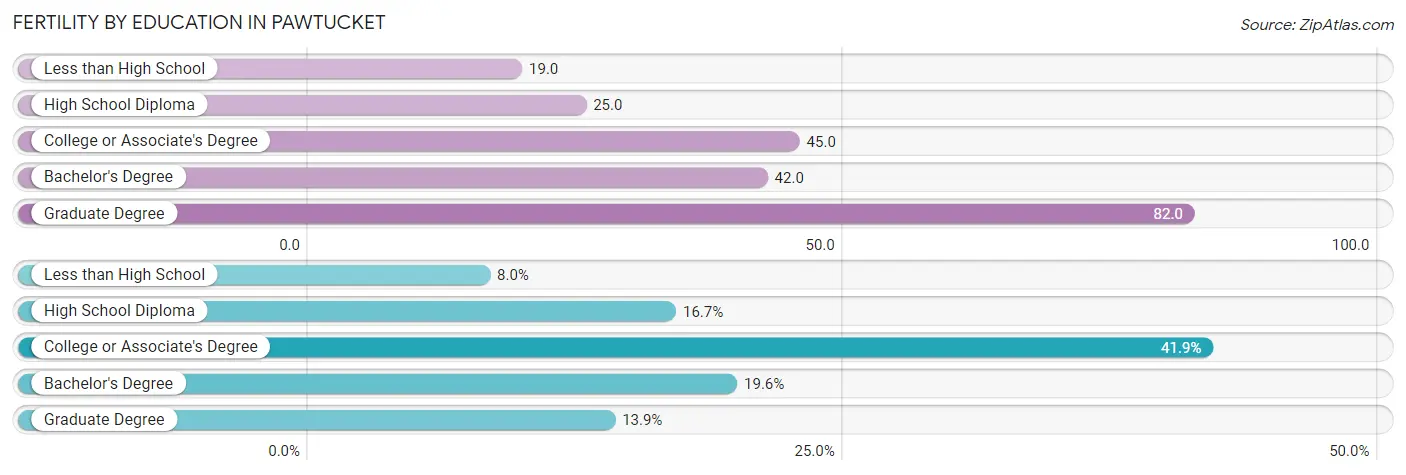
| Educational Attainment | Women with Births | Births / 1,000 Women |
| Less than High School | 56 (8.0%) | 19.0 |
| High School Diploma | 117 (16.7%) | 25.0 |
| College or Associate's Degree | 293 (41.9%) | 45.0 |
| Bachelor's Degree | 137 (19.6%) | 42.0 |
| Graduate Degree | 97 (13.9%) | 82.0 |
| Total | 700 (100.0%) | 38.0 |
Fertility by Education by Marriage Status in Pawtucket
40.4% of women with births in Pawtucket are unmarried. Women with the educational attainment of graduate degree are most likely to be married with 100.0% of them married at childbirth, while women with the educational attainment of less than high school are least likely to be married with 100.0% of them unmarried at childbirth.
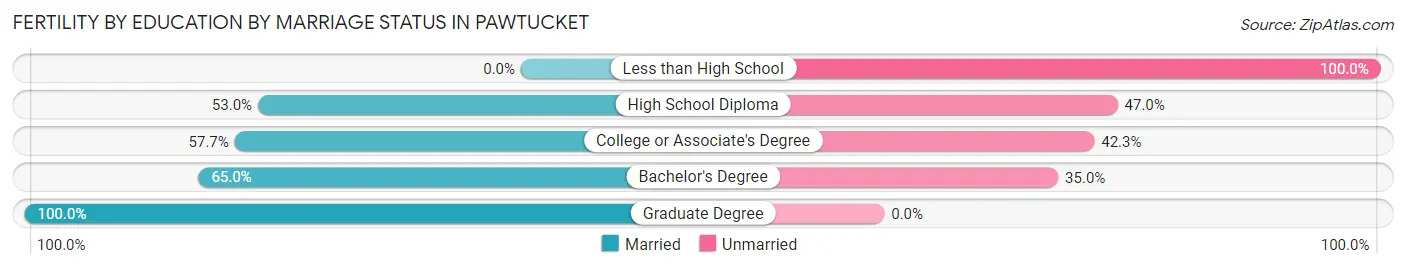
| Educational Attainment | Married | Unmarried |
| Less than High School | 0 (0.0%) | 56 (100.0%) |
| High School Diploma | 62 (53.0%) | 55 (47.0%) |
| College or Associate's Degree | 169 (57.7%) | 124 (42.3%) |
| Bachelor's Degree | 89 (65.0%) | 48 (35.0%) |
| Graduate Degree | 97 (100.0%) | 0 (0.0%) |
| Total | 417 (59.6%) | 283 (40.4%) |
Employment Characteristics in Pawtucket
Employment by Class of Employer in Pawtucket
Among the 38,762 employed individuals in Pawtucket, private company employees (27,686 | 71.4%), not-for-profit organizations (4,467 | 11.5%), and local government employees (2,013 | 5.2%) make up the most common classes of employment.
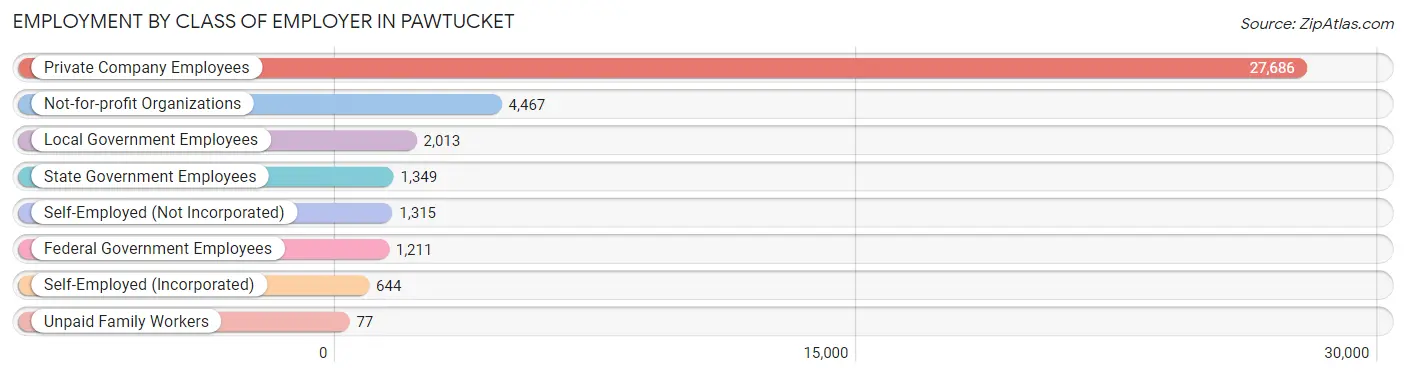
| Employer Class | # Employees | % Employees |
| Private Company Employees | 27,686 | 71.4% |
| Self-Employed (Incorporated) | 644 | 1.7% |
| Self-Employed (Not Incorporated) | 1,315 | 3.4% |
| Not-for-profit Organizations | 4,467 | 11.5% |
| Local Government Employees | 2,013 | 5.2% |
| State Government Employees | 1,349 | 3.5% |
| Federal Government Employees | 1,211 | 3.1% |
| Unpaid Family Workers | 77 | 0.2% |
| Total | 38,762 | 100.0% |
Employment Status by Age in Pawtucket
According to the labor force statistics for Pawtucket, out of the total population over 16 years of age (60,937), 70.9% or 43,204 individuals are in the labor force, with 6.7% or 2,895 of them unemployed. The age group with the highest labor force participation rate is 30 to 34 years, with 88.8% or 5,726 individuals in the labor force. Within the labor force, the 75 years and over age range has the highest percentage of unemployed individuals, with 15.2% or 45 of them being unemployed.
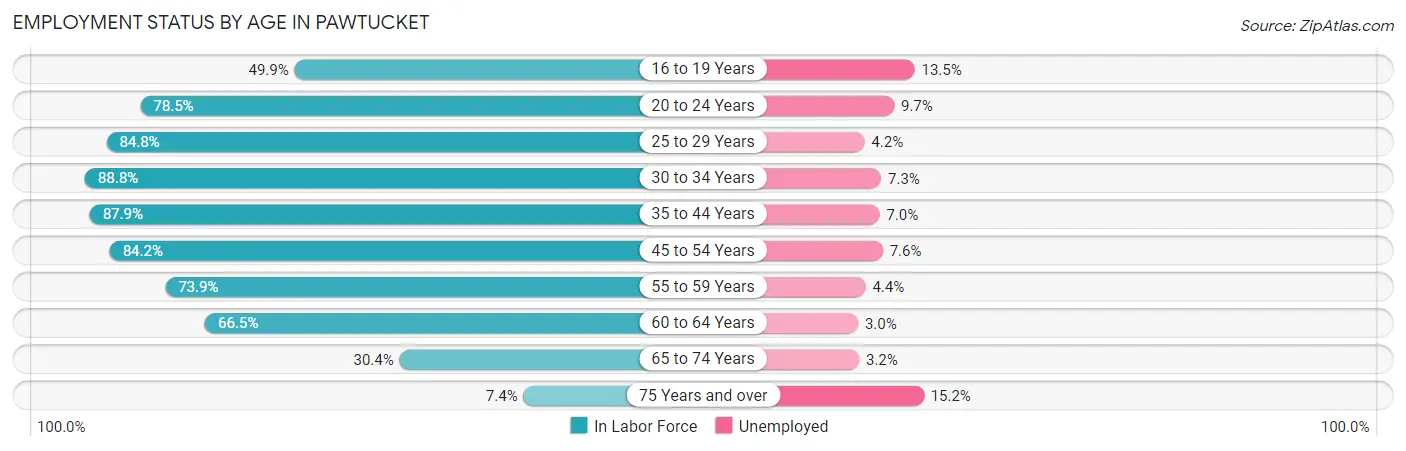
| Age Bracket | In Labor Force | Unemployed |
| 16 to 19 Years | 1,456 (49.9%) | 197 (13.5%) |
| 20 to 24 Years | 4,146 (78.5%) | 402 (9.7%) |
| 25 to 29 Years | 4,939 (84.8%) | 207 (4.2%) |
| 30 to 34 Years | 5,726 (88.8%) | 418 (7.3%) |
| 35 to 44 Years | 9,802 (87.9%) | 686 (7.0%) |
| 45 to 54 Years | 8,271 (84.2%) | 629 (7.6%) |
| 55 to 59 Years | 3,665 (73.9%) | 161 (4.4%) |
| 60 to 64 Years | 3,130 (66.5%) | 94 (3.0%) |
| 65 to 74 Years | 1,772 (30.4%) | 57 (3.2%) |
| 75 Years and over | 296 (7.4%) | 45 (15.2%) |
| Total | 43,204 (70.9%) | 2,895 (6.7%) |
Employment Status by Educational Attainment in Pawtucket
According to labor force statistics for Pawtucket, 82.8% of individuals (35,532) out of the total population between 25 and 64 years of age (42,913) are in the labor force, with 6.2% or 2,203 of them being unemployed. The group with the highest labor force participation rate are those with the educational attainment of bachelor's degree or higher, with 92.3% or 9,206 individuals in the labor force. Within the labor force, individuals with less than high school education have the highest percentage of unemployment, with 9.9% or 446 of them being unemployed.
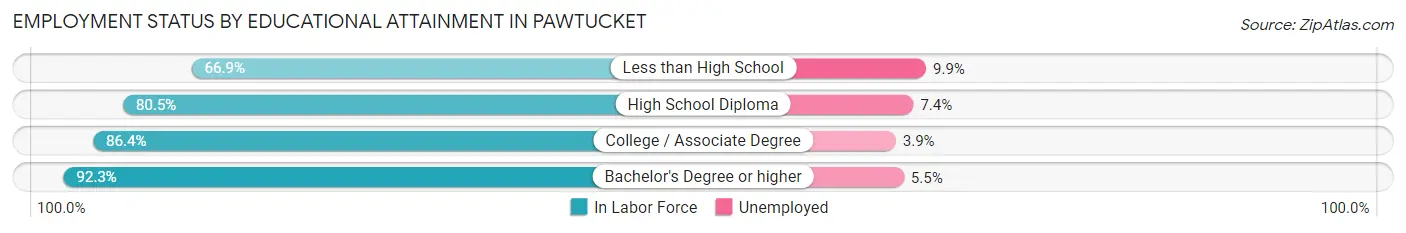
| Educational Attainment | In Labor Force | Unemployed |
| Less than High School | 4,504 (66.9%) | 666 (9.9%) |
| High School Diploma | 11,203 (80.5%) | 1,030 (7.4%) |
| College / Associate Degree | 10,619 (86.4%) | 479 (3.9%) |
| Bachelor's Degree or higher | 9,206 (92.3%) | 549 (5.5%) |
| Total | 35,532 (82.8%) | 2,661 (6.2%) |
Employment Occupations by Sex in Pawtucket
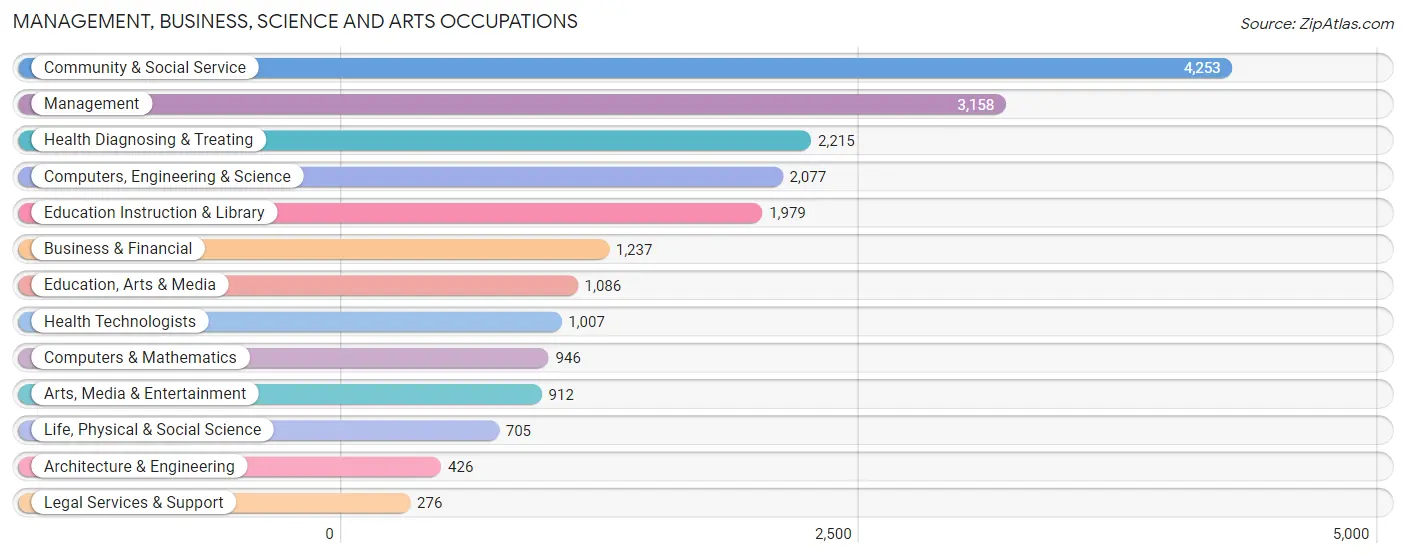
Management, Business, Science and Arts Occupations
The most common Management, Business, Science and Arts occupations in Pawtucket are Community & Social Service (4,253 | 10.6%), Management (3,158 | 7.9%), Health Diagnosing & Treating (2,215 | 5.5%), Computers, Engineering & Science (2,077 | 5.2%), and Education Instruction & Library (1,979 | 4.9%).
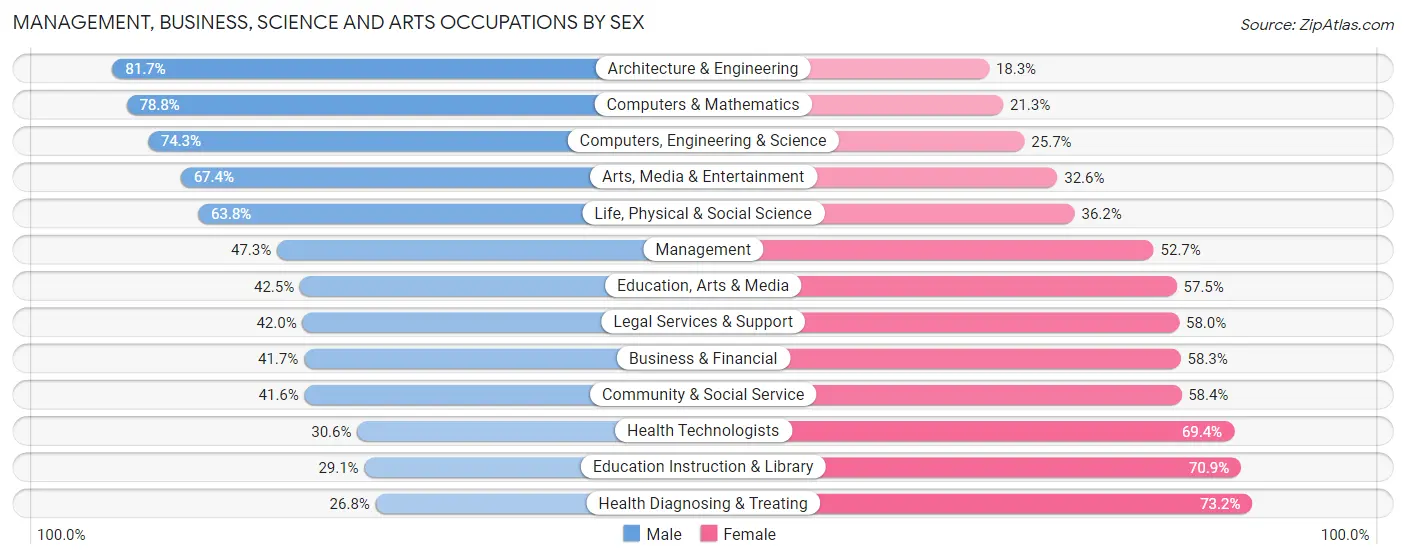
Management, Business, Science and Arts Occupations by Sex
Within the Management, Business, Science and Arts occupations in Pawtucket, the most male-oriented occupations are Architecture & Engineering (81.7%), Computers & Mathematics (78.7%), and Computers, Engineering & Science (74.3%), while the most female-oriented occupations are Health Diagnosing & Treating (73.2%), Education Instruction & Library (70.9%), and Health Technologists (69.4%).
| Occupation | Male | Female |
| Management | 1,495 (47.3%) | 1,663 (52.7%) |
| Business & Financial | 516 (41.7%) | 721 (58.3%) |
| Computers, Engineering & Science | 1,543 (74.3%) | 534 (25.7%) |
| Computers & Mathematics | 745 (78.7%) | 201 (21.2%) |
| Architecture & Engineering | 348 (81.7%) | 78 (18.3%) |
| Life, Physical & Social Science | 450 (63.8%) | 255 (36.2%) |
| Community & Social Service | 1,769 (41.6%) | 2,484 (58.4%) |
| Education, Arts & Media | 462 (42.5%) | 624 (57.5%) |
| Legal Services & Support | 116 (42.0%) | 160 (58.0%) |
| Education Instruction & Library | 576 (29.1%) | 1,403 (70.9%) |
| Arts, Media & Entertainment | 615 (67.4%) | 297 (32.6%) |
| Health Diagnosing & Treating | 593 (26.8%) | 1,622 (73.2%) |
| Health Technologists | 308 (30.6%) | 699 (69.4%) |
| Total (Category) | 5,916 (45.7%) | 7,024 (54.3%) |
| Total (Overall) | 20,575 (51.1%) | 19,660 (48.9%) |
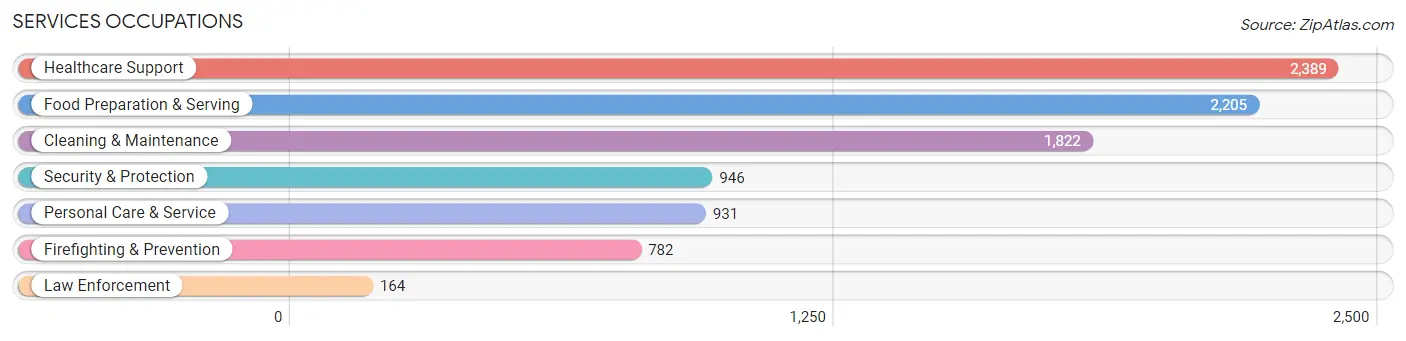
Services Occupations
The most common Services occupations in Pawtucket are Healthcare Support (2,389 | 5.9%), Food Preparation & Serving (2,205 | 5.5%), Cleaning & Maintenance (1,822 | 4.5%), Security & Protection (946 | 2.4%), and Personal Care & Service (931 | 2.3%).
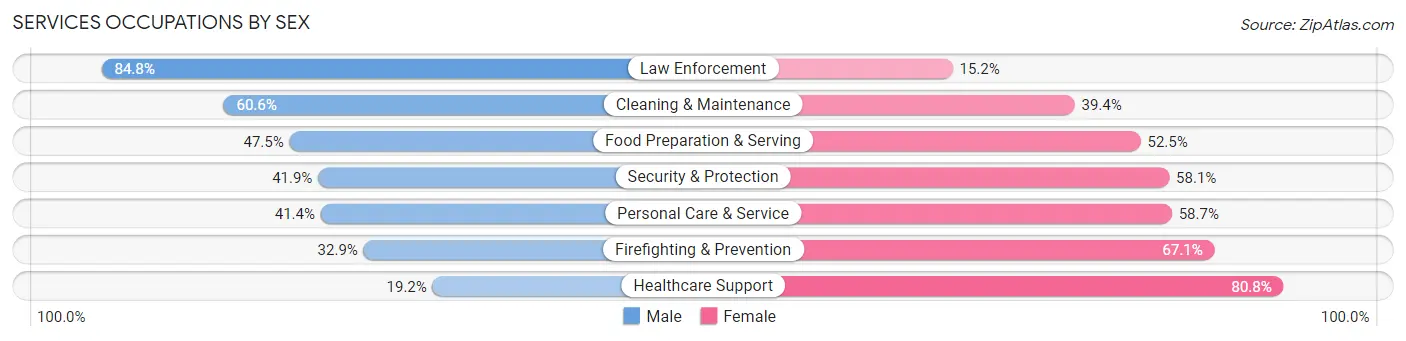
Services Occupations by Sex
Within the Services occupations in Pawtucket, the most male-oriented occupations are Law Enforcement (84.8%), Cleaning & Maintenance (60.6%), and Food Preparation & Serving (47.5%), while the most female-oriented occupations are Healthcare Support (80.8%), Firefighting & Prevention (67.1%), and Personal Care & Service (58.7%).
| Occupation | Male | Female |
| Healthcare Support | 459 (19.2%) | 1,930 (80.8%) |
| Security & Protection | 396 (41.9%) | 550 (58.1%) |
| Firefighting & Prevention | 257 (32.9%) | 525 (67.1%) |
| Law Enforcement | 139 (84.8%) | 25 (15.2%) |
| Food Preparation & Serving | 1,048 (47.5%) | 1,157 (52.5%) |
| Cleaning & Maintenance | 1,104 (60.6%) | 718 (39.4%) |
| Personal Care & Service | 385 (41.3%) | 546 (58.7%) |
| Total (Category) | 3,392 (40.9%) | 4,901 (59.1%) |
| Total (Overall) | 20,575 (51.1%) | 19,660 (48.9%) |
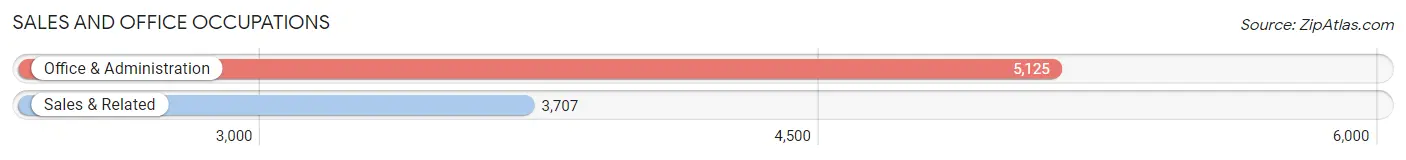
Sales and Office Occupations
The most common Sales and Office occupations in Pawtucket are Office & Administration (5,125 | 12.7%), and Sales & Related (3,707 | 9.2%).
Sales and Office Occupations by Sex
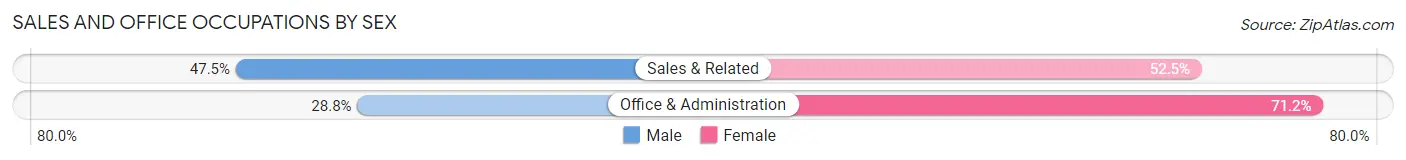
| Occupation | Male | Female |
| Sales & Related | 1,761 (47.5%) | 1,946 (52.5%) |
| Office & Administration | 1,476 (28.8%) | 3,649 (71.2%) |
| Total (Category) | 3,237 (36.6%) | 5,595 (63.3%) |
| Total (Overall) | 20,575 (51.1%) | 19,660 (48.9%) |
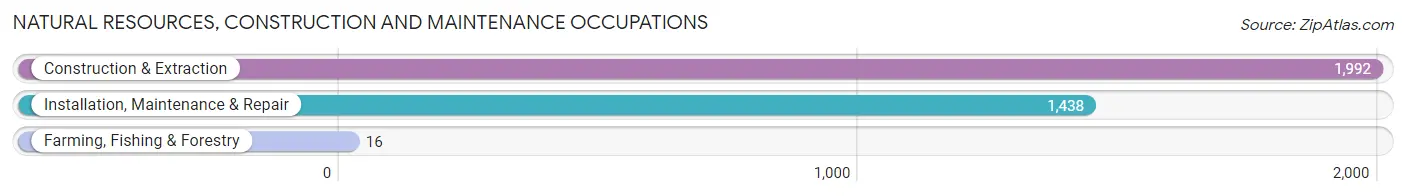
Natural Resources, Construction and Maintenance Occupations
The most common Natural Resources, Construction and Maintenance occupations in Pawtucket are Construction & Extraction (1,992 | 5.0%), Installation, Maintenance & Repair (1,438 | 3.6%), and Farming, Fishing & Forestry (16 | 0.0%).
Natural Resources, Construction and Maintenance Occupations by Sex
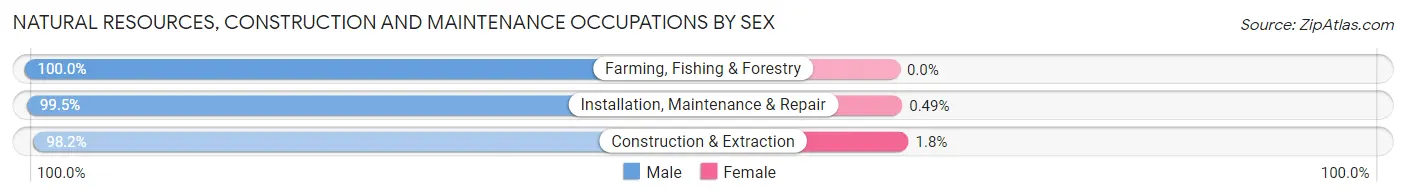
| Occupation | Male | Female |
| Farming, Fishing & Forestry | 16 (100.0%) | 0 (0.0%) |
| Construction & Extraction | 1,956 (98.2%) | 36 (1.8%) |
| Installation, Maintenance & Repair | 1,431 (99.5%) | 7 (0.5%) |
| Total (Category) | 3,403 (98.8%) | 43 (1.3%) |
| Total (Overall) | 20,575 (51.1%) | 19,660 (48.9%) |
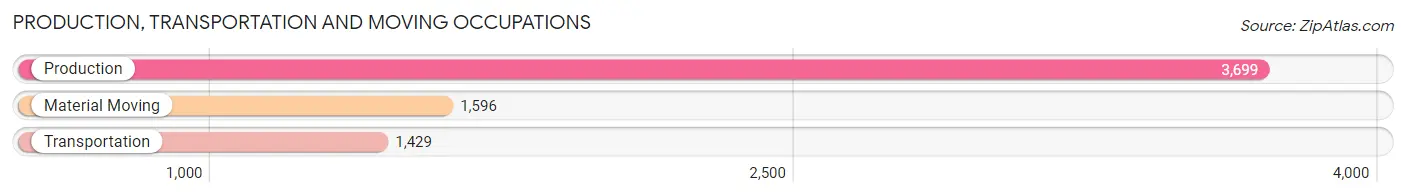
Production, Transportation and Moving Occupations
The most common Production, Transportation and Moving occupations in Pawtucket are Production (3,699 | 9.2%), Material Moving (1,596 | 4.0%), and Transportation (1,429 | 3.5%).
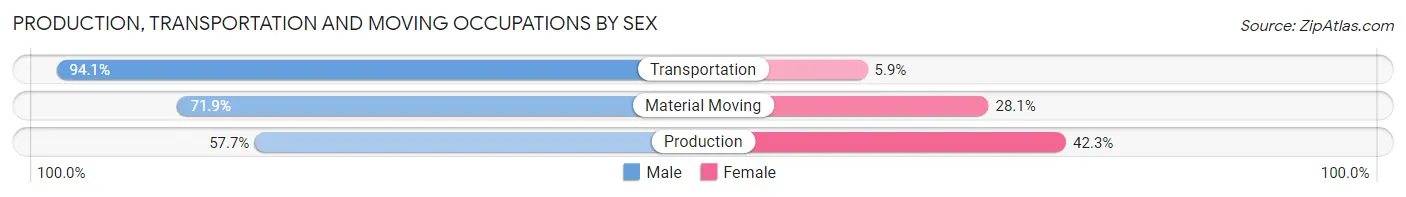
Production, Transportation and Moving Occupations by Sex
| Occupation | Male | Female |
| Production | 2,134 (57.7%) | 1,565 (42.3%) |
| Transportation | 1,345 (94.1%) | 84 (5.9%) |
| Material Moving | 1,148 (71.9%) | 448 (28.1%) |
| Total (Category) | 4,627 (68.8%) | 2,097 (31.2%) |
| Total (Overall) | 20,575 (51.1%) | 19,660 (48.9%) |
Employment Industries by Sex in Pawtucket
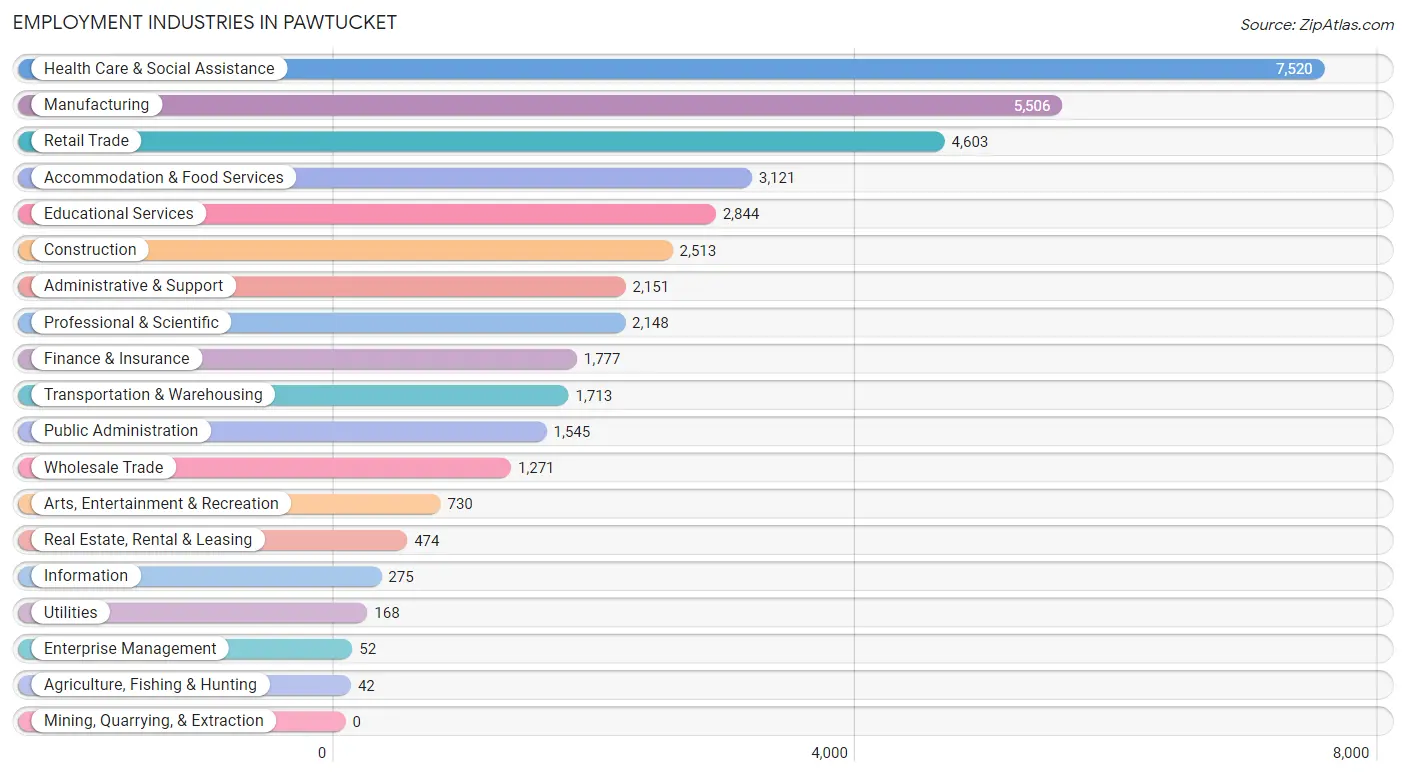
Employment Industries in Pawtucket
The major employment industries in Pawtucket include Health Care & Social Assistance (7,520 | 18.7%), Manufacturing (5,506 | 13.7%), Retail Trade (4,603 | 11.4%), Accommodation & Food Services (3,121 | 7.8%), and Educational Services (2,844 | 7.1%).
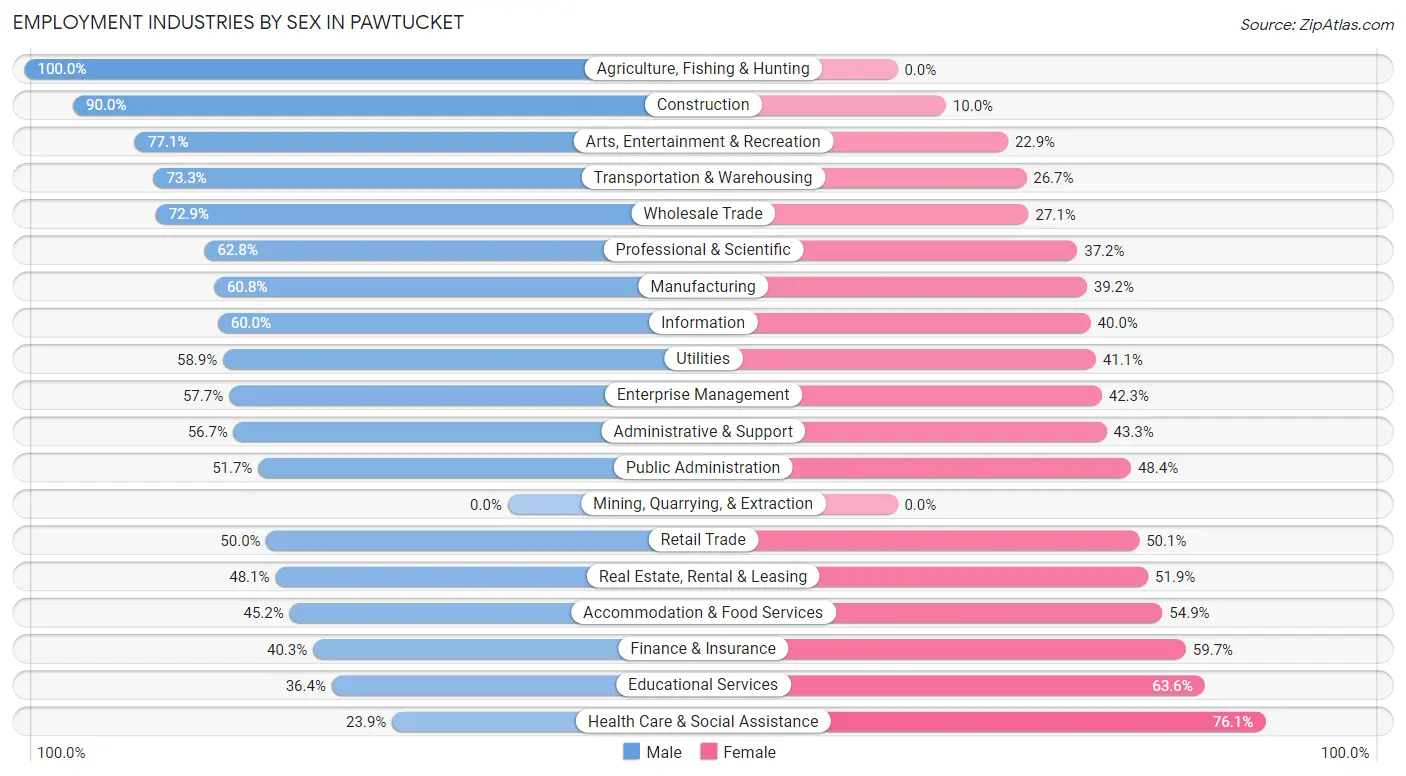
Employment Industries by Sex in Pawtucket
The Pawtucket industries that see more men than women are Agriculture, Fishing & Hunting (100.0%), Construction (90.0%), and Arts, Entertainment & Recreation (77.1%), whereas the industries that tend to have a higher number of women are Health Care & Social Assistance (76.1%), Educational Services (63.6%), and Finance & Insurance (59.7%).
| Industry | Male | Female |
| Agriculture, Fishing & Hunting | 42 (100.0%) | 0 (0.0%) |
| Mining, Quarrying, & Extraction | 0 (0.0%) | 0 (0.0%) |
| Construction | 2,261 (90.0%) | 252 (10.0%) |
| Manufacturing | 3,347 (60.8%) | 2,159 (39.2%) |
| Wholesale Trade | 926 (72.9%) | 345 (27.1%) |
| Retail Trade | 2,299 (49.9%) | 2,304 (50.0%) |
| Transportation & Warehousing | 1,256 (73.3%) | 457 (26.7%) |
| Utilities | 99 (58.9%) | 69 (41.1%) |
| Information | 165 (60.0%) | 110 (40.0%) |
| Finance & Insurance | 716 (40.3%) | 1,061 (59.7%) |
| Real Estate, Rental & Leasing | 228 (48.1%) | 246 (51.9%) |
| Professional & Scientific | 1,348 (62.8%) | 800 (37.2%) |
| Enterprise Management | 30 (57.7%) | 22 (42.3%) |
| Administrative & Support | 1,220 (56.7%) | 931 (43.3%) |
| Educational Services | 1,036 (36.4%) | 1,808 (63.6%) |
| Health Care & Social Assistance | 1,799 (23.9%) | 5,721 (76.1%) |
| Arts, Entertainment & Recreation | 563 (77.1%) | 167 (22.9%) |
| Accommodation & Food Services | 1,409 (45.2%) | 1,712 (54.8%) |
| Public Administration | 798 (51.6%) | 747 (48.3%) |
| Total | 20,575 (51.1%) | 19,660 (48.9%) |
Education in Pawtucket
School Enrollment in Pawtucket
The most common levels of schooling among the 17,460 students in Pawtucket are middle school (3,857 | 22.1%), elementary school (3,645 | 20.9%), and college / undergraduate (3,554 | 20.4%).
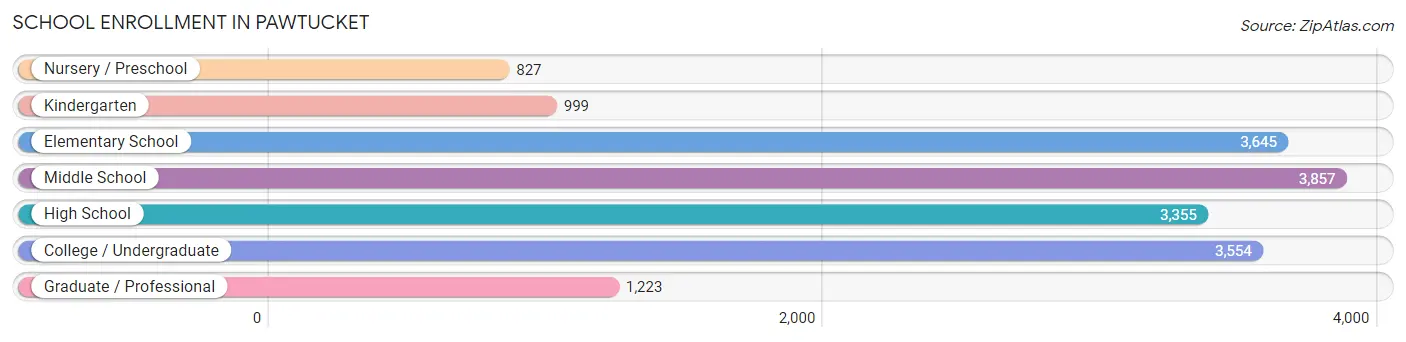
| School Level | # Students | % Students |
| Nursery / Preschool | 827 | 4.7% |
| Kindergarten | 999 | 5.7% |
| Elementary School | 3,645 | 20.9% |
| Middle School | 3,857 | 22.1% |
| High School | 3,355 | 19.2% |
| College / Undergraduate | 3,554 | 20.4% |
| Graduate / Professional | 1,223 | 7.0% |
| Total | 17,460 | 100.0% |
School Enrollment by Age by Funding Source in Pawtucket
Out of a total of 17,460 students who are enrolled in schools in Pawtucket, 3,841 (22.0%) attend a private institution, while the remaining 13,619 (78.0%) are enrolled in public schools. The age group of 3 to 4 year olds has the highest likelihood of being enrolled in private schools, with 403 (56.5% in the age bracket) enrolled. Conversely, the age group of 10 to 14 year olds has the lowest likelihood of being enrolled in a private school, with 3,824 (85.4% in the age bracket) attending a public institution.
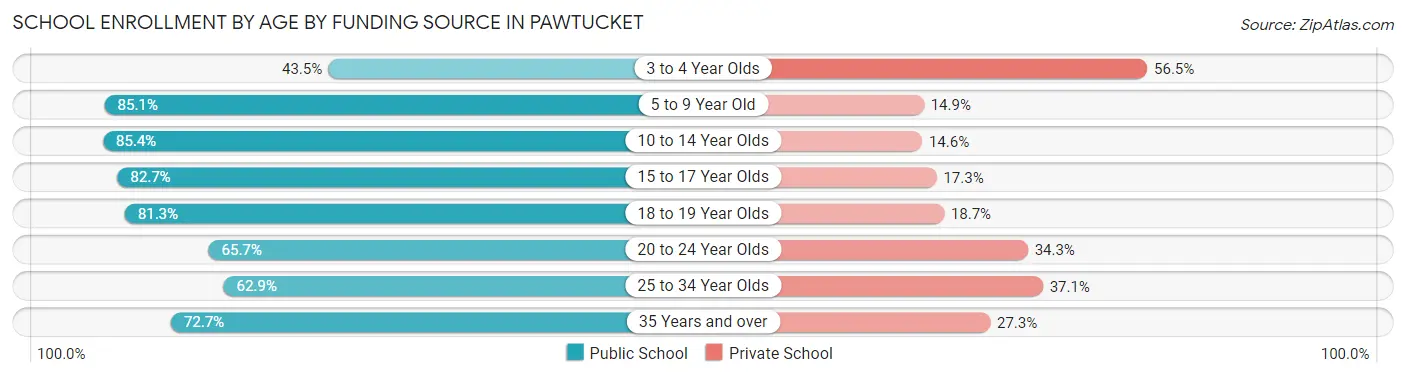
| Age Bracket | Public School | Private School |
| 3 to 4 Year Olds | 310 (43.5%) | 403 (56.5%) |
| 5 to 9 Year Old | 3,744 (85.1%) | 656 (14.9%) |
| 10 to 14 Year Olds | 3,824 (85.4%) | 653 (14.6%) |
| 15 to 17 Year Olds | 2,109 (82.7%) | 441 (17.3%) |
| 18 to 19 Year Olds | 653 (81.3%) | 150 (18.7%) |
| 20 to 24 Year Olds | 1,152 (65.7%) | 601 (34.3%) |
| 25 to 34 Year Olds | 1,144 (62.9%) | 674 (37.1%) |
| 35 Years and over | 688 (72.7%) | 258 (27.3%) |
| Total | 13,619 (78.0%) | 3,841 (22.0%) |
Educational Attainment by Field of Study in Pawtucket
Business (2,068 | 15.9%), education (1,257 | 9.7%), science & technology (1,150 | 8.8%), arts & humanities (1,124 | 8.6%), and visual & performing arts (1,080 | 8.3%) are the most common fields of study among 12,993 individuals in Pawtucket who have obtained a bachelor's degree or higher.
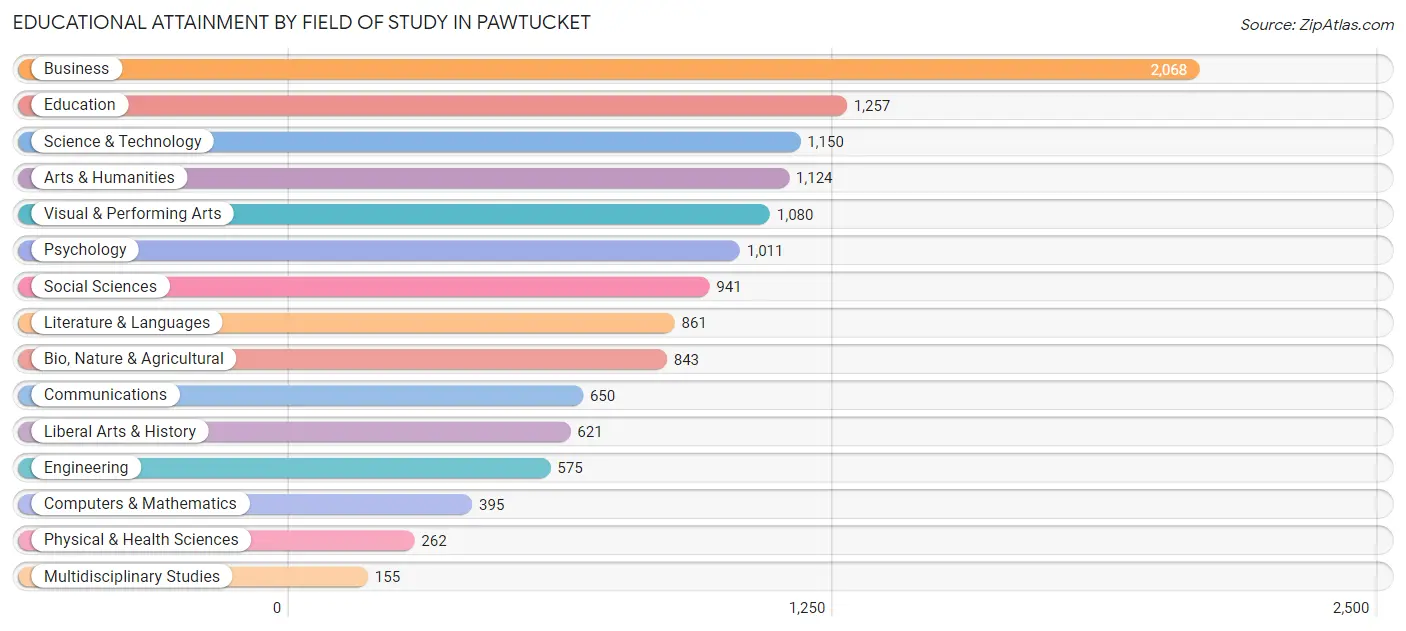
| Field of Study | # Graduates | % Graduates |
| Computers & Mathematics | 395 | 3.0% |
| Bio, Nature & Agricultural | 843 | 6.5% |
| Physical & Health Sciences | 262 | 2.0% |
| Psychology | 1,011 | 7.8% |
| Social Sciences | 941 | 7.2% |
| Engineering | 575 | 4.4% |
| Multidisciplinary Studies | 155 | 1.2% |
| Science & Technology | 1,150 | 8.8% |
| Business | 2,068 | 15.9% |
| Education | 1,257 | 9.7% |
| Literature & Languages | 861 | 6.6% |
| Liberal Arts & History | 621 | 4.8% |
| Visual & Performing Arts | 1,080 | 8.3% |
| Communications | 650 | 5.0% |
| Arts & Humanities | 1,124 | 8.6% |
| Total | 12,993 | 100.0% |
Transportation & Commute in Pawtucket
Vehicle Availability by Sex in Pawtucket
The most prevalent vehicle ownership categories in Pawtucket are males with 2 vehicles (9,131, accounting for 45.5%) and females with 2 vehicles (7,863, making up 48.8%).
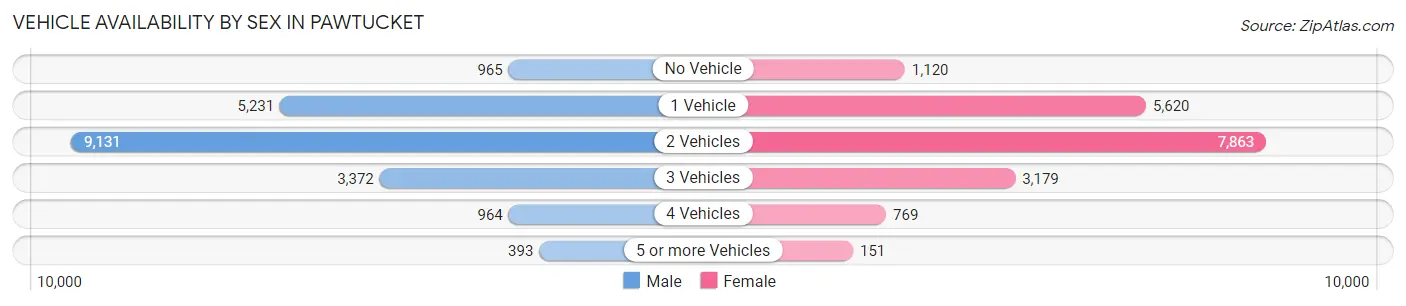
| Vehicles Available | Male | Female |
| No Vehicle | 965 (4.8%) | 1,120 (6.0%) |
| 1 Vehicle | 5,231 (26.1%) | 5,620 (30.0%) |
| 2 Vehicles | 9,131 (45.5%) | 7,863 (42.0%) |
| 3 Vehicles | 3,372 (16.8%) | 3,179 (17.0%) |
| 4 Vehicles | 964 (4.8%) | 769 (4.1%) |
| 5 or more Vehicles | 393 (2.0%) | 151 (0.8%) |
| Total | 20,056 (100.0%) | 18,702 (100.0%) |
Commute Time in Pawtucket
The most frequently occuring commute durations in Pawtucket are 20 to 24 minutes (6,188 commuters, 17.0%), 15 to 19 minutes (5,238 commuters, 14.4%), and 10 to 14 minutes (5,215 commuters, 14.3%).
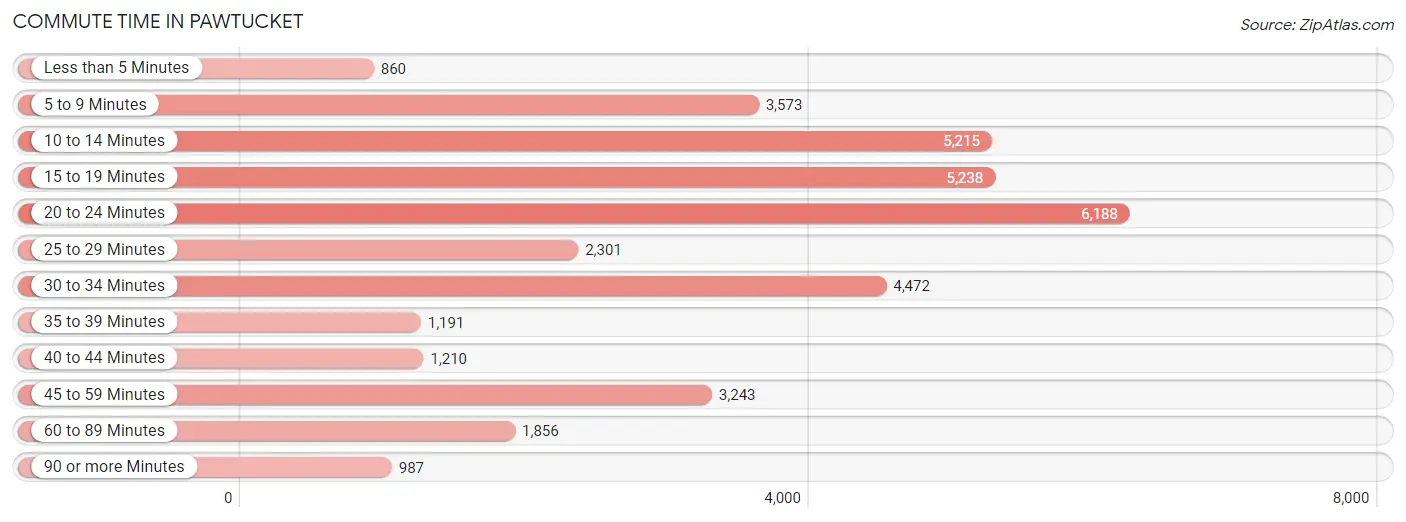
| Commute Time | # Commuters | % Commuters |
| Less than 5 Minutes | 860 | 2.4% |
| 5 to 9 Minutes | 3,573 | 9.8% |
| 10 to 14 Minutes | 5,215 | 14.3% |
| 15 to 19 Minutes | 5,238 | 14.4% |
| 20 to 24 Minutes | 6,188 | 17.0% |
| 25 to 29 Minutes | 2,301 | 6.3% |
| 30 to 34 Minutes | 4,472 | 12.3% |
| 35 to 39 Minutes | 1,191 | 3.3% |
| 40 to 44 Minutes | 1,210 | 3.3% |
| 45 to 59 Minutes | 3,243 | 8.9% |
| 60 to 89 Minutes | 1,856 | 5.1% |
| 90 or more Minutes | 987 | 2.7% |
Commute Time by Sex in Pawtucket
The most common commute times in Pawtucket are 20 to 24 minutes (3,123 commuters, 16.6%) for males and 10 to 14 minutes (3,164 commuters, 18.0%) for females.
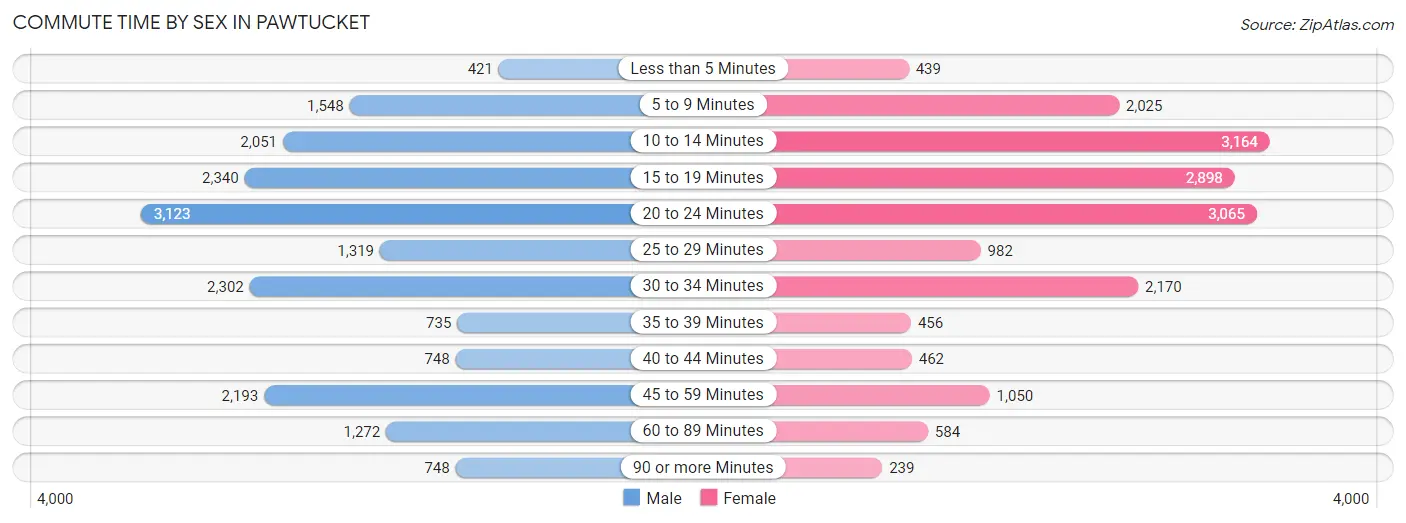
| Commute Time | Male | Female |
| Less than 5 Minutes | 421 (2.2%) | 439 (2.5%) |
| 5 to 9 Minutes | 1,548 (8.2%) | 2,025 (11.6%) |
| 10 to 14 Minutes | 2,051 (10.9%) | 3,164 (18.0%) |
| 15 to 19 Minutes | 2,340 (12.4%) | 2,898 (16.5%) |
| 20 to 24 Minutes | 3,123 (16.6%) | 3,065 (17.5%) |
| 25 to 29 Minutes | 1,319 (7.0%) | 982 (5.6%) |
| 30 to 34 Minutes | 2,302 (12.2%) | 2,170 (12.4%) |
| 35 to 39 Minutes | 735 (3.9%) | 456 (2.6%) |
| 40 to 44 Minutes | 748 (4.0%) | 462 (2.6%) |
| 45 to 59 Minutes | 2,193 (11.7%) | 1,050 (6.0%) |
| 60 to 89 Minutes | 1,272 (6.8%) | 584 (3.3%) |
| 90 or more Minutes | 748 (4.0%) | 239 (1.4%) |
Time of Departure to Work by Sex in Pawtucket
The most frequent times of departure to work in Pawtucket are 7:00 AM to 7:29 AM (2,595, 13.8%) for males and 7:00 AM to 7:29 AM (2,809, 16.0%) for females.
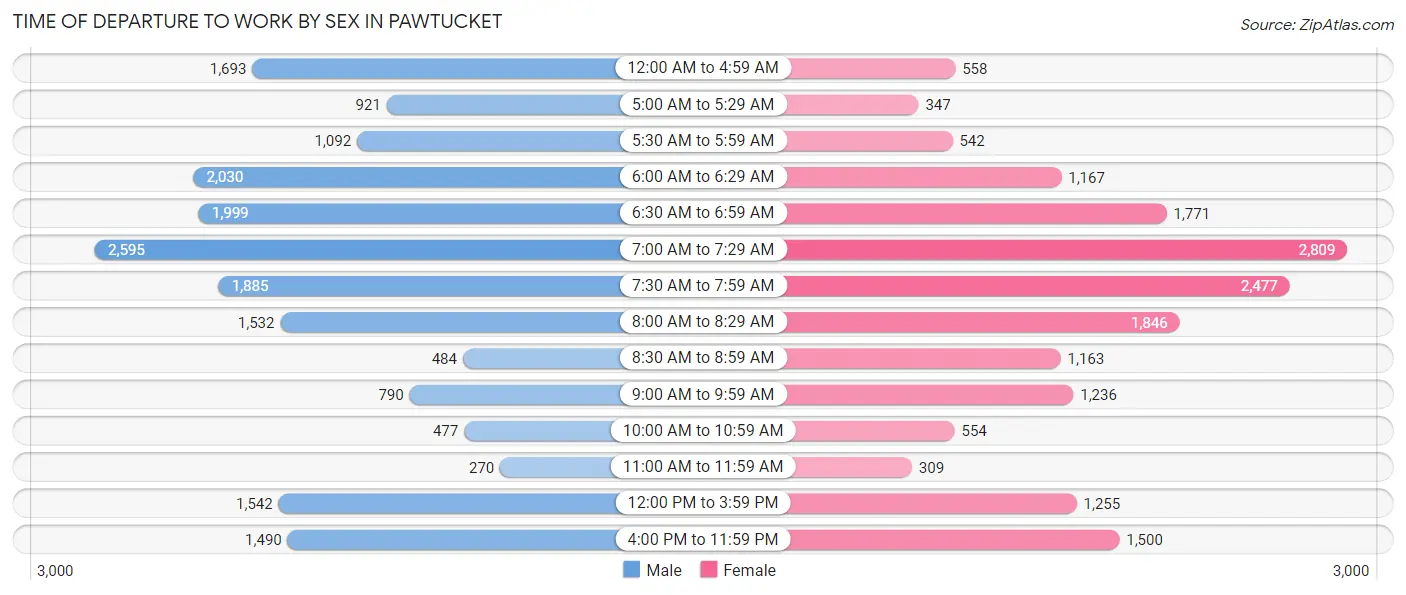
| Time of Departure | Male | Female |
| 12:00 AM to 4:59 AM | 1,693 (9.0%) | 558 (3.2%) |
| 5:00 AM to 5:29 AM | 921 (4.9%) | 347 (2.0%) |
| 5:30 AM to 5:59 AM | 1,092 (5.8%) | 542 (3.1%) |
| 6:00 AM to 6:29 AM | 2,030 (10.8%) | 1,167 (6.7%) |
| 6:30 AM to 6:59 AM | 1,999 (10.6%) | 1,771 (10.1%) |
| 7:00 AM to 7:29 AM | 2,595 (13.8%) | 2,809 (16.0%) |
| 7:30 AM to 7:59 AM | 1,885 (10.0%) | 2,477 (14.1%) |
| 8:00 AM to 8:29 AM | 1,532 (8.2%) | 1,846 (10.5%) |
| 8:30 AM to 8:59 AM | 484 (2.6%) | 1,163 (6.6%) |
| 9:00 AM to 9:59 AM | 790 (4.2%) | 1,236 (7.0%) |
| 10:00 AM to 10:59 AM | 477 (2.5%) | 554 (3.2%) |
| 11:00 AM to 11:59 AM | 270 (1.4%) | 309 (1.8%) |
| 12:00 PM to 3:59 PM | 1,542 (8.2%) | 1,255 (7.2%) |
| 4:00 PM to 11:59 PM | 1,490 (7.9%) | 1,500 (8.6%) |
| Total | 18,800 (100.0%) | 17,534 (100.0%) |
Housing Occupancy in Pawtucket
Occupancy by Ownership in Pawtucket
Of the total 30,582 dwellings in Pawtucket, owner-occupied units account for 14,823 (48.5%), while renter-occupied units make up 15,759 (51.5%).
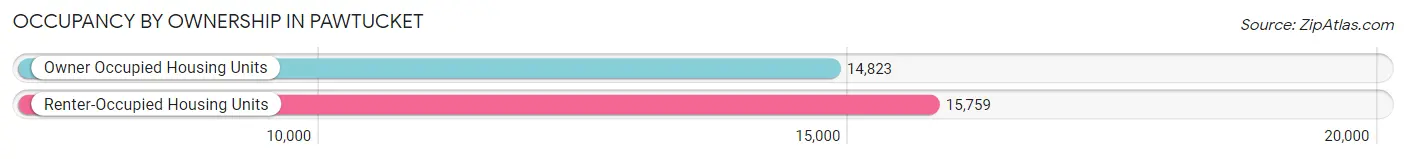
| Occupancy | # Housing Units | % Housing Units |
| Owner Occupied Housing Units | 14,823 | 48.5% |
| Renter-Occupied Housing Units | 15,759 | 51.5% |
| Total Occupied Housing Units | 30,582 | 100.0% |
Occupancy by Household Size in Pawtucket
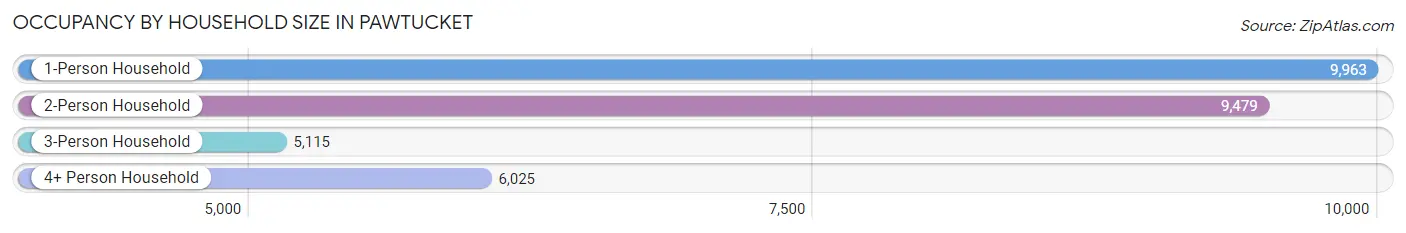
| Household Size | # Housing Units | % Housing Units |
| 1-Person Household | 9,963 | 32.6% |
| 2-Person Household | 9,479 | 31.0% |
| 3-Person Household | 5,115 | 16.7% |
| 4+ Person Household | 6,025 | 19.7% |
| Total Housing Units | 30,582 | 100.0% |
Occupancy by Ownership by Household Size in Pawtucket
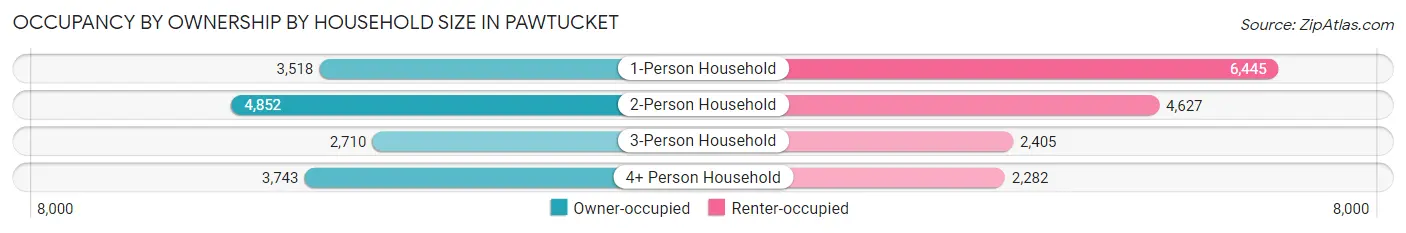
| Household Size | Owner-occupied | Renter-occupied |
| 1-Person Household | 3,518 (35.3%) | 6,445 (64.7%) |
| 2-Person Household | 4,852 (51.2%) | 4,627 (48.8%) |
| 3-Person Household | 2,710 (53.0%) | 2,405 (47.0%) |
| 4+ Person Household | 3,743 (62.1%) | 2,282 (37.9%) |
| Total Housing Units | 14,823 (48.5%) | 15,759 (51.5%) |
Occupancy by Educational Attainment in Pawtucket
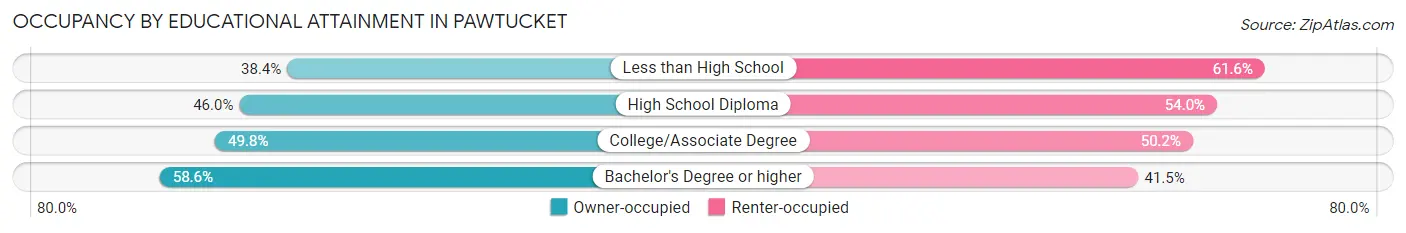
| Household Size | Owner-occupied | Renter-occupied |
| Less than High School | 2,157 (38.4%) | 3,466 (61.6%) |
| High School Diploma | 4,200 (46.0%) | 4,939 (54.0%) |
| College/Associate Degree | 4,527 (49.8%) | 4,565 (50.2%) |
| Bachelor's Degree or higher | 3,939 (58.6%) | 2,789 (41.4%) |
Occupancy by Age of Householder in Pawtucket
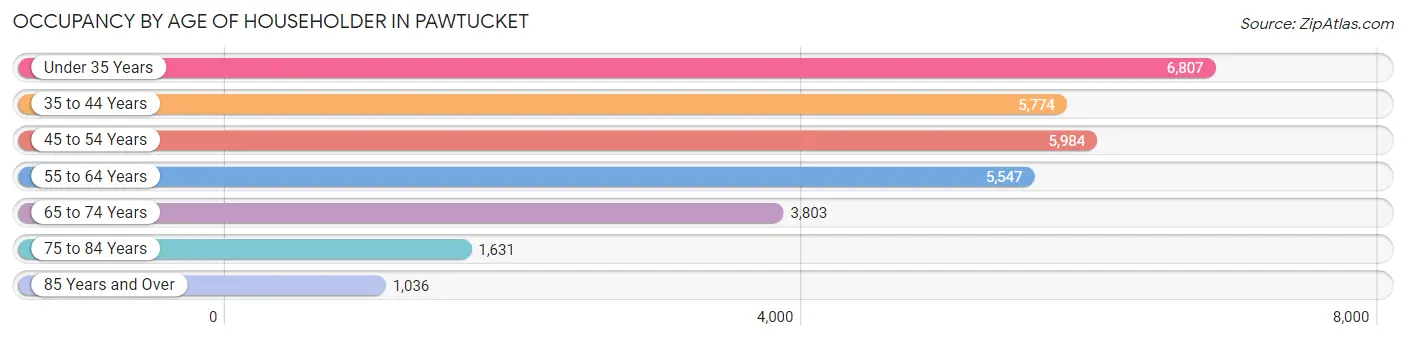
| Age Bracket | # Households | % Households |
| Under 35 Years | 6,807 | 22.3% |
| 35 to 44 Years | 5,774 | 18.9% |
| 45 to 54 Years | 5,984 | 19.6% |
| 55 to 64 Years | 5,547 | 18.1% |
| 65 to 74 Years | 3,803 | 12.4% |
| 75 to 84 Years | 1,631 | 5.3% |
| 85 Years and Over | 1,036 | 3.4% |
| Total | 30,582 | 100.0% |
Housing Finances in Pawtucket
Median Income by Occupancy in Pawtucket
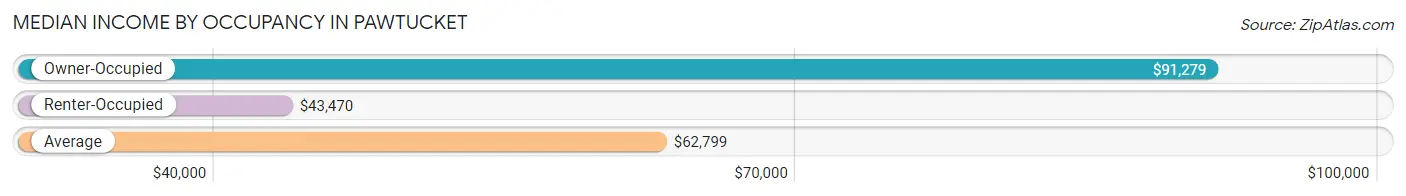
| Occupancy Type | # Households | Median Income |
| Owner-Occupied | 14,823 (48.5%) | $91,279 |
| Renter-Occupied | 15,759 (51.5%) | $43,470 |
| Average | 30,582 (100.0%) | $62,799 |
Occupancy by Householder Income Bracket in Pawtucket
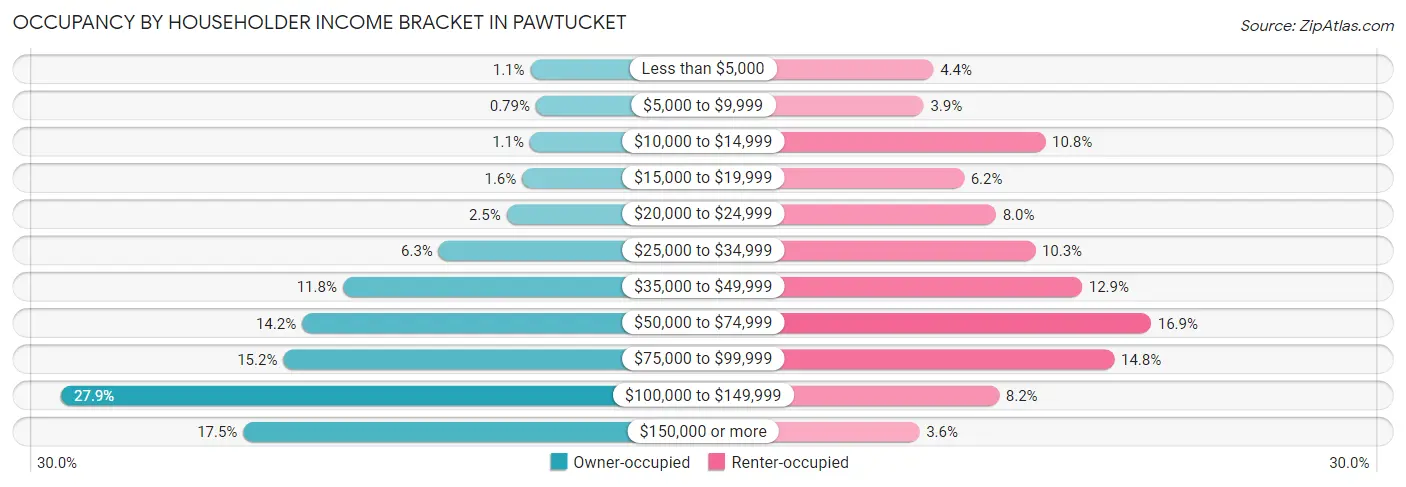
| Income Bracket | Owner-occupied | Renter-occupied |
| Less than $5,000 | 163 (1.1%) | 700 (4.4%) |
| $5,000 to $9,999 | 117 (0.8%) | 612 (3.9%) |
| $10,000 to $14,999 | 167 (1.1%) | 1,706 (10.8%) |
| $15,000 to $19,999 | 232 (1.6%) | 974 (6.2%) |
| $20,000 to $24,999 | 364 (2.5%) | 1,263 (8.0%) |
| $25,000 to $34,999 | 940 (6.3%) | 1,616 (10.2%) |
| $35,000 to $49,999 | 1,752 (11.8%) | 2,037 (12.9%) |
| $50,000 to $74,999 | 2,097 (14.1%) | 2,659 (16.9%) |
| $75,000 to $99,999 | 2,256 (15.2%) | 2,328 (14.8%) |
| $100,000 to $149,999 | 4,139 (27.9%) | 1,290 (8.2%) |
| $150,000 or more | 2,596 (17.5%) | 574 (3.6%) |
| Total | 14,823 (100.0%) | 15,759 (100.0%) |
Monthly Housing Cost Tiers in Pawtucket
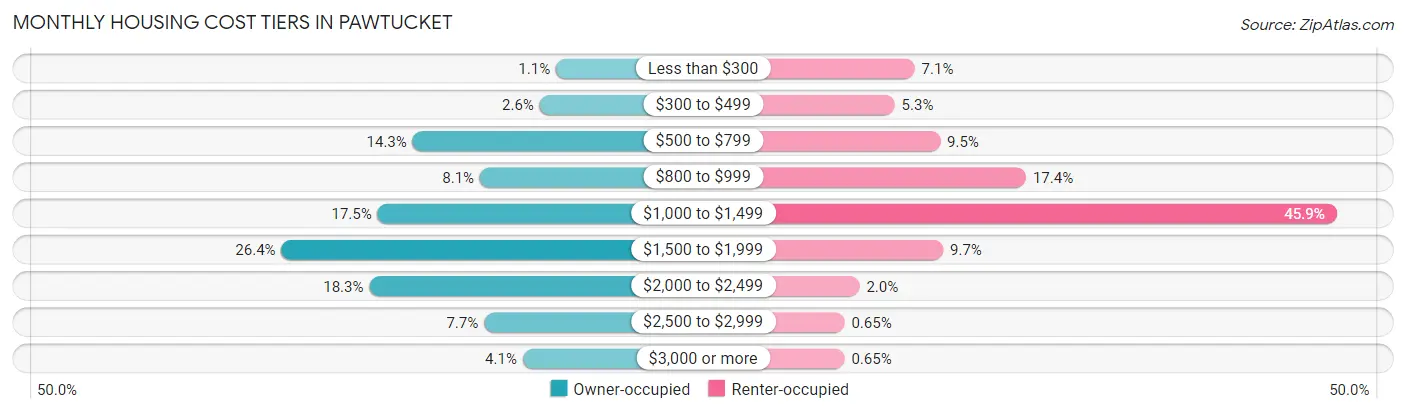
| Monthly Cost | Owner-occupied | Renter-occupied |
| Less than $300 | 160 (1.1%) | 1,121 (7.1%) |
| $300 to $499 | 382 (2.6%) | 830 (5.3%) |
| $500 to $799 | 2,117 (14.3%) | 1,490 (9.5%) |
| $800 to $999 | 1,197 (8.1%) | 2,735 (17.4%) |
| $1,000 to $1,499 | 2,596 (17.5%) | 7,240 (45.9%) |
| $1,500 to $1,999 | 3,908 (26.4%) | 1,534 (9.7%) |
| $2,000 to $2,499 | 2,708 (18.3%) | 320 (2.0%) |
| $2,500 to $2,999 | 1,141 (7.7%) | 103 (0.6%) |
| $3,000 or more | 614 (4.1%) | 103 (0.6%) |
| Total | 14,823 (100.0%) | 15,759 (100.0%) |
Physical Housing Characteristics in Pawtucket
Housing Structures in Pawtucket
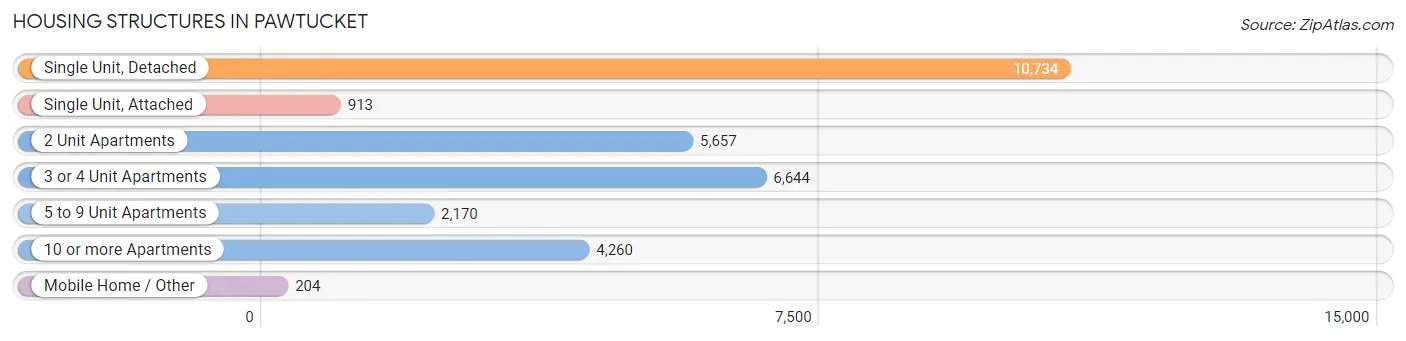
| Structure Type | # Housing Units | % Housing Units |
| Single Unit, Detached | 10,734 | 35.1% |
| Single Unit, Attached | 913 | 3.0% |
| 2 Unit Apartments | 5,657 | 18.5% |
| 3 or 4 Unit Apartments | 6,644 | 21.7% |
| 5 to 9 Unit Apartments | 2,170 | 7.1% |
| 10 or more Apartments | 4,260 | 13.9% |
| Mobile Home / Other | 204 | 0.7% |
| Total | 30,582 | 100.0% |
Housing Structures by Occupancy in Pawtucket
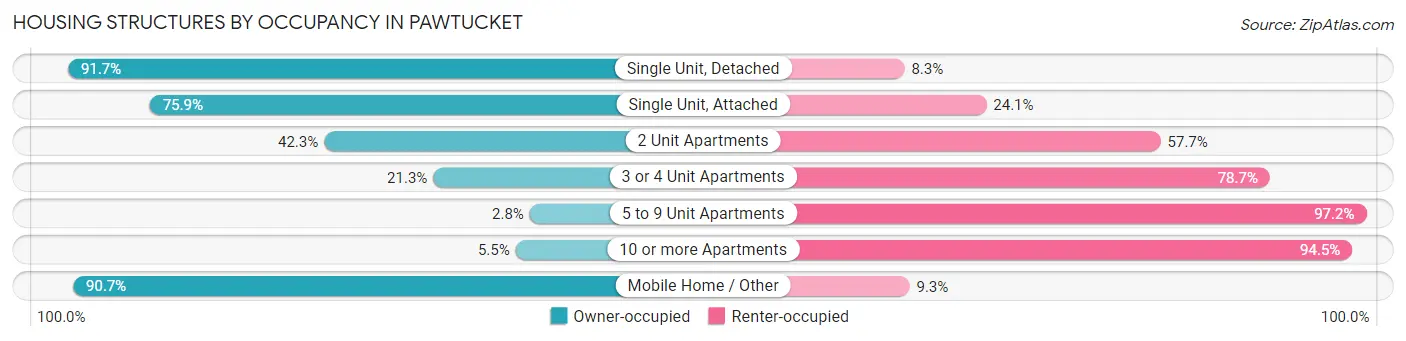
| Structure Type | Owner-occupied | Renter-occupied |
| Single Unit, Detached | 9,839 (91.7%) | 895 (8.3%) |
| Single Unit, Attached | 693 (75.9%) | 220 (24.1%) |
| 2 Unit Apartments | 2,395 (42.3%) | 3,262 (57.7%) |
| 3 or 4 Unit Apartments | 1,418 (21.3%) | 5,226 (78.7%) |
| 5 to 9 Unit Apartments | 60 (2.8%) | 2,110 (97.2%) |
| 10 or more Apartments | 233 (5.5%) | 4,027 (94.5%) |
| Mobile Home / Other | 185 (90.7%) | 19 (9.3%) |
| Total | 14,823 (48.5%) | 15,759 (51.5%) |
Housing Structures by Number of Rooms in Pawtucket
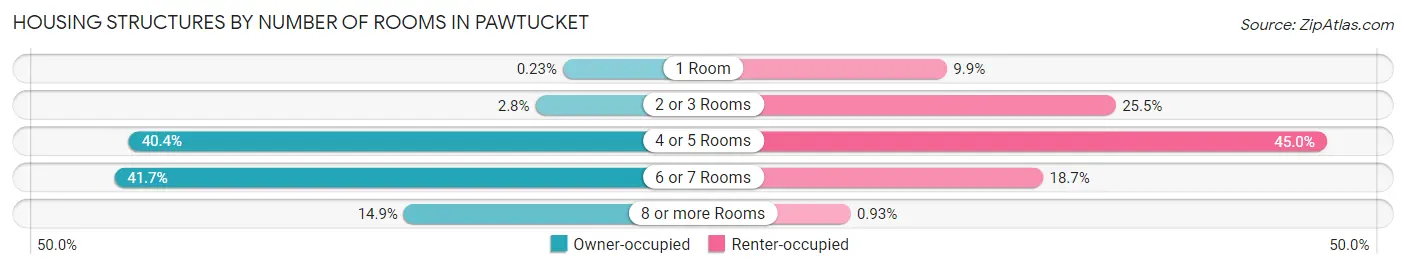
| Number of Rooms | Owner-occupied | Renter-occupied |
| 1 Room | 34 (0.2%) | 1,553 (9.9%) |
| 2 or 3 Rooms | 409 (2.8%) | 4,013 (25.5%) |
| 4 or 5 Rooms | 5,984 (40.4%) | 7,093 (45.0%) |
| 6 or 7 Rooms | 6,181 (41.7%) | 2,954 (18.7%) |
| 8 or more Rooms | 2,215 (14.9%) | 146 (0.9%) |
| Total | 14,823 (100.0%) | 15,759 (100.0%) |
Housing Structure by Heating Type in Pawtucket
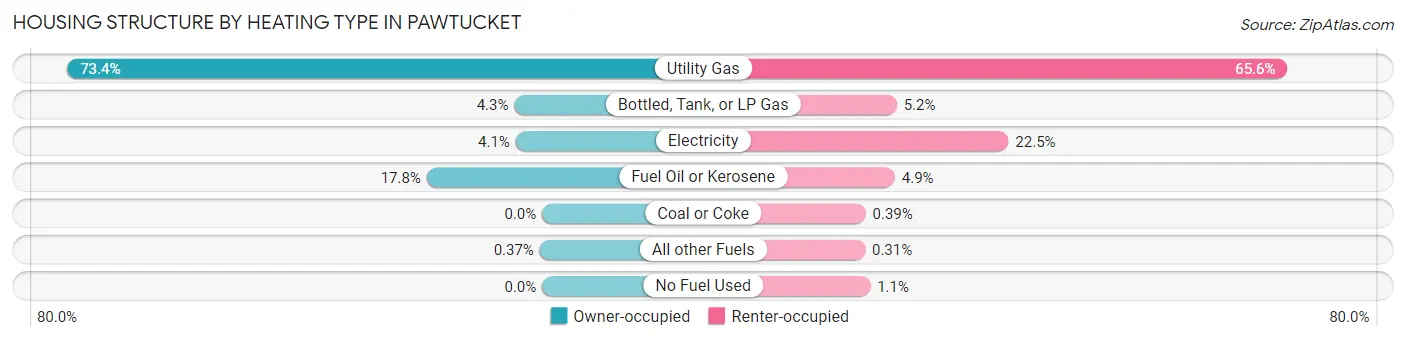
| Heating Type | Owner-occupied | Renter-occupied |
| Utility Gas | 10,880 (73.4%) | 10,336 (65.6%) |
| Bottled, Tank, or LP Gas | 638 (4.3%) | 820 (5.2%) |
| Electricity | 605 (4.1%) | 3,541 (22.5%) |
| Fuel Oil or Kerosene | 2,645 (17.8%) | 776 (4.9%) |
| Coal or Coke | 0 (0.0%) | 62 (0.4%) |
| All other Fuels | 55 (0.4%) | 49 (0.3%) |
| No Fuel Used | 0 (0.0%) | 175 (1.1%) |
| Total | 14,823 (100.0%) | 15,759 (100.0%) |
Household Vehicle Usage in Pawtucket
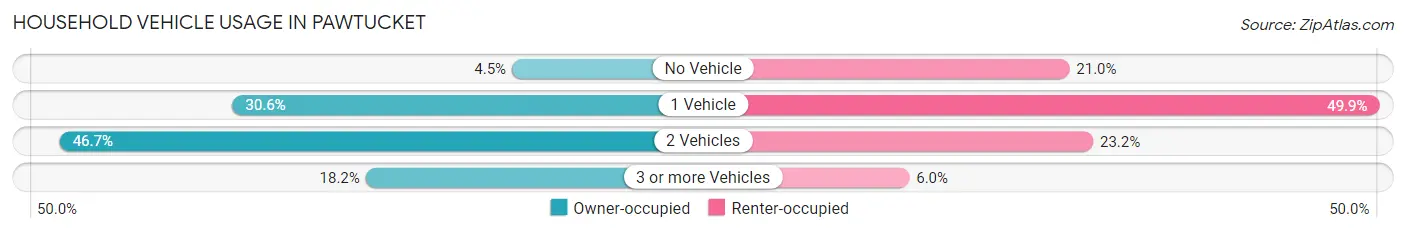
| Vehicles per Household | Owner-occupied | Renter-occupied |
| No Vehicle | 668 (4.5%) | 3,302 (20.9%) |
| 1 Vehicle | 4,536 (30.6%) | 7,861 (49.9%) |
| 2 Vehicles | 6,925 (46.7%) | 3,649 (23.2%) |
| 3 or more Vehicles | 2,694 (18.2%) | 947 (6.0%) |
| Total | 14,823 (100.0%) | 15,759 (100.0%) |
Real Estate & Mortgages in Pawtucket
Real Estate and Mortgage Overview in Pawtucket
| Characteristic | Without Mortgage | With Mortgage |
| Housing Units | 3,987 | 10,836 |
| Median Property Value | $262,200 | $267,400 |
| Median Household Income | $64,424 | $1,961 |
| Monthly Housing Costs | $754 | $614 |
| Real Estate Taxes | $3,981 | $252 |
Property Value by Mortgage Status in Pawtucket
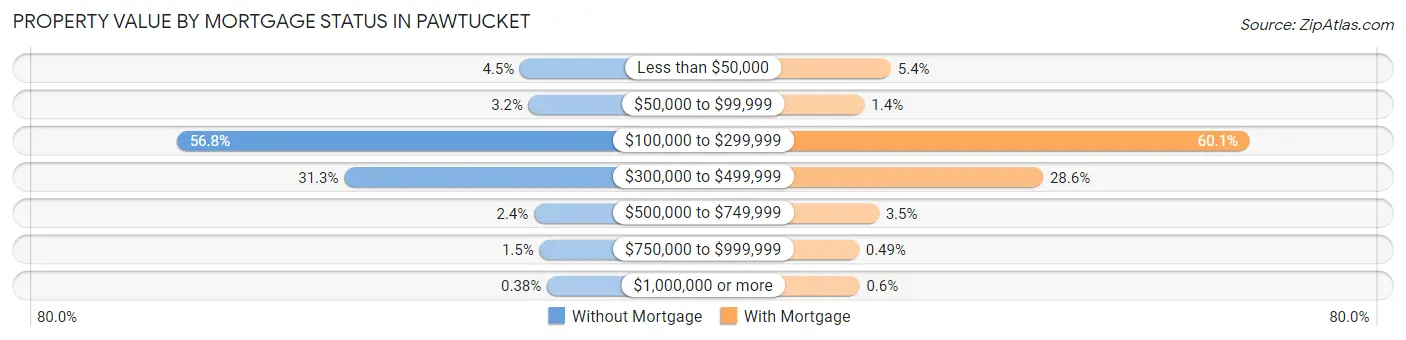
| Property Value | Without Mortgage | With Mortgage |
| Less than $50,000 | 179 (4.5%) | 583 (5.4%) |
| $50,000 to $99,999 | 126 (3.2%) | 146 (1.3%) |
| $100,000 to $299,999 | 2,265 (56.8%) | 6,511 (60.1%) |
| $300,000 to $499,999 | 1,247 (31.3%) | 3,095 (28.6%) |
| $500,000 to $749,999 | 94 (2.4%) | 383 (3.5%) |
| $750,000 to $999,999 | 61 (1.5%) | 53 (0.5%) |
| $1,000,000 or more | 15 (0.4%) | 65 (0.6%) |
| Total | 3,987 (100.0%) | 10,836 (100.0%) |
Household Income by Mortgage Status in Pawtucket
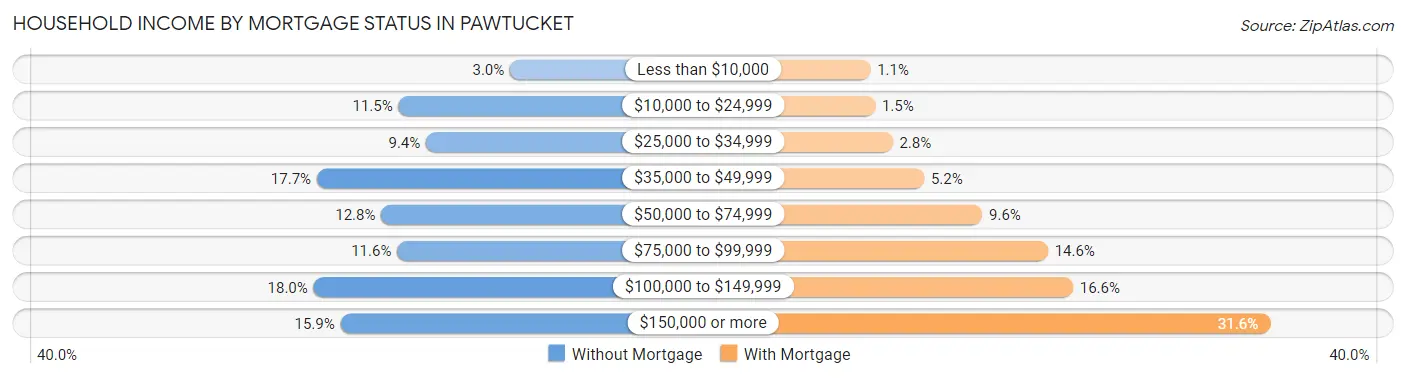
| Household Income | Without Mortgage | With Mortgage |
| Less than $10,000 | 120 (3.0%) | 121 (1.1%) |
| $10,000 to $24,999 | 459 (11.5%) | 160 (1.5%) |
| $25,000 to $34,999 | 375 (9.4%) | 304 (2.8%) |
| $35,000 to $49,999 | 707 (17.7%) | 565 (5.2%) |
| $50,000 to $74,999 | 511 (12.8%) | 1,045 (9.6%) |
| $75,000 to $99,999 | 463 (11.6%) | 1,586 (14.6%) |
| $100,000 to $149,999 | 717 (18.0%) | 1,793 (16.6%) |
| $150,000 or more | 635 (15.9%) | 3,422 (31.6%) |
| Total | 3,987 (100.0%) | 10,836 (100.0%) |
Property Value to Household Income Ratio in Pawtucket
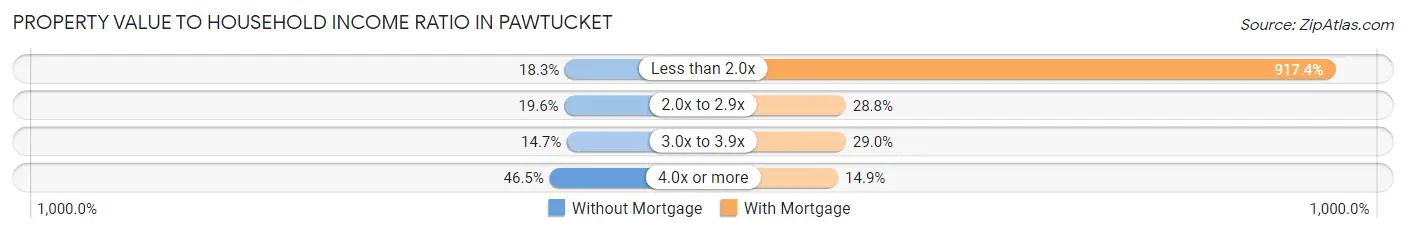
| Value-to-Income Ratio | Without Mortgage | With Mortgage |
| Less than 2.0x | 730 (18.3%) | 99,409 (917.4%) |
| 2.0x to 2.9x | 780 (19.6%) | 3,118 (28.8%) |
| 3.0x to 3.9x | 586 (14.7%) | 3,147 (29.0%) |
| 4.0x or more | 1,853 (46.5%) | 1,619 (14.9%) |
| Total | 3,987 (100.0%) | 10,836 (100.0%) |
Real Estate Taxes by Mortgage Status in Pawtucket
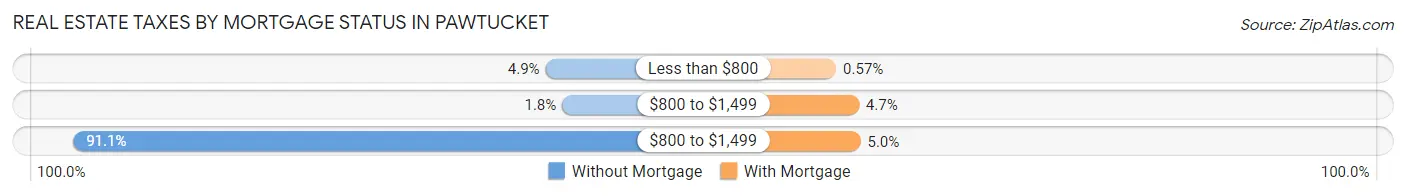
| Property Taxes | Without Mortgage | With Mortgage |
| Less than $800 | 194 (4.9%) | 62 (0.6%) |
| $800 to $1,499 | 73 (1.8%) | 511 (4.7%) |
| $800 to $1,499 | 3,633 (91.1%) | 544 (5.0%) |
| Total | 3,987 (100.0%) | 10,836 (100.0%) |
Health & Disability in Pawtucket
Health Insurance Coverage by Age in Pawtucket
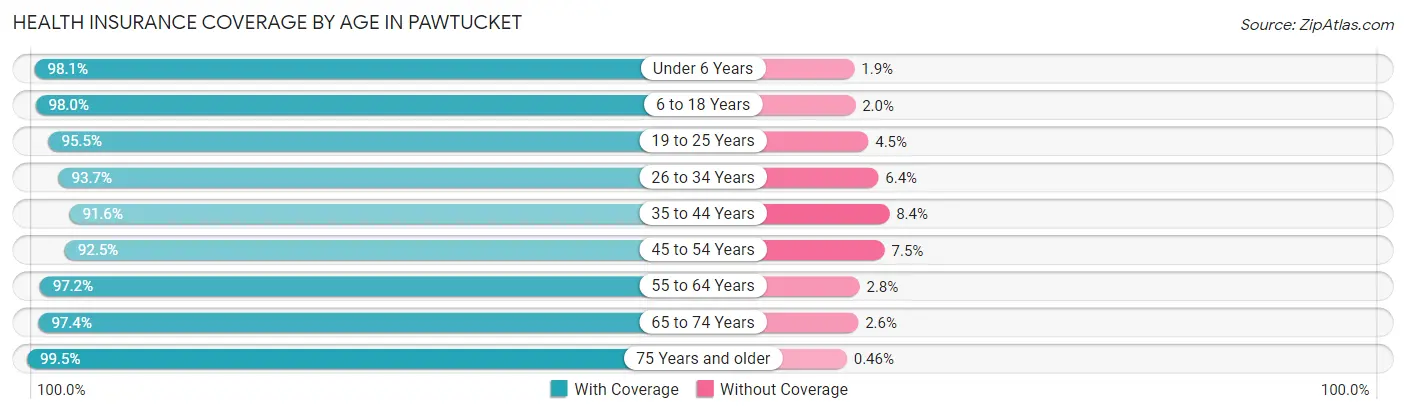
| Age Bracket | With Coverage | Without Coverage |
| Under 6 Years | 4,984 (98.1%) | 95 (1.9%) |
| 6 to 18 Years | 11,207 (98.0%) | 233 (2.0%) |
| 19 to 25 Years | 6,713 (95.5%) | 314 (4.5%) |
| 26 to 34 Years | 10,398 (93.6%) | 705 (6.4%) |
| 35 to 44 Years | 10,189 (91.6%) | 932 (8.4%) |
| 45 to 54 Years | 9,057 (92.5%) | 736 (7.5%) |
| 55 to 64 Years | 9,322 (97.2%) | 272 (2.8%) |
| 65 to 74 Years | 5,591 (97.4%) | 149 (2.6%) |
| 75 Years and older | 3,862 (99.5%) | 18 (0.5%) |
| Total | 71,323 (95.4%) | 3,454 (4.6%) |
Health Insurance Coverage by Citizenship Status in Pawtucket
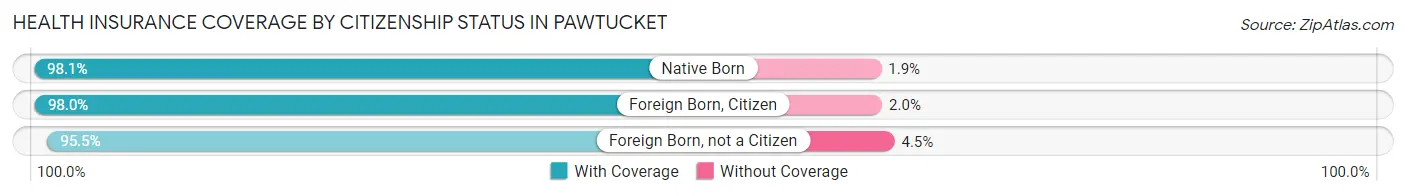
| Citizenship Status | With Coverage | Without Coverage |
| Native Born | 4,984 (98.1%) | 95 (1.9%) |
| Foreign Born, Citizen | 11,207 (98.0%) | 233 (2.0%) |
| Foreign Born, not a Citizen | 6,713 (95.5%) | 314 (4.5%) |
Health Insurance Coverage by Household Income in Pawtucket
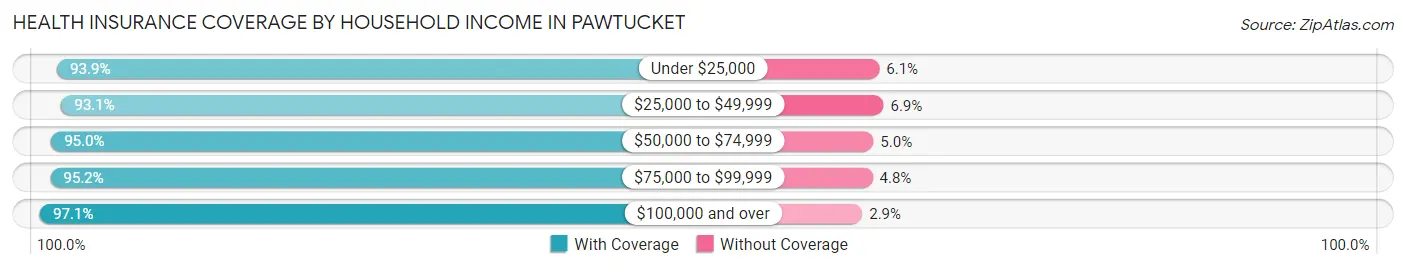
| Household Income | With Coverage | Without Coverage |
| Under $25,000 | 9,201 (93.9%) | 598 (6.1%) |
| $25,000 to $49,999 | 11,892 (93.1%) | 879 (6.9%) |
| $50,000 to $74,999 | 10,881 (95.0%) | 572 (5.0%) |
| $75,000 to $99,999 | 11,391 (95.2%) | 578 (4.8%) |
| $100,000 and over | 27,592 (97.1%) | 825 (2.9%) |
Public vs Private Health Insurance Coverage by Age in Pawtucket
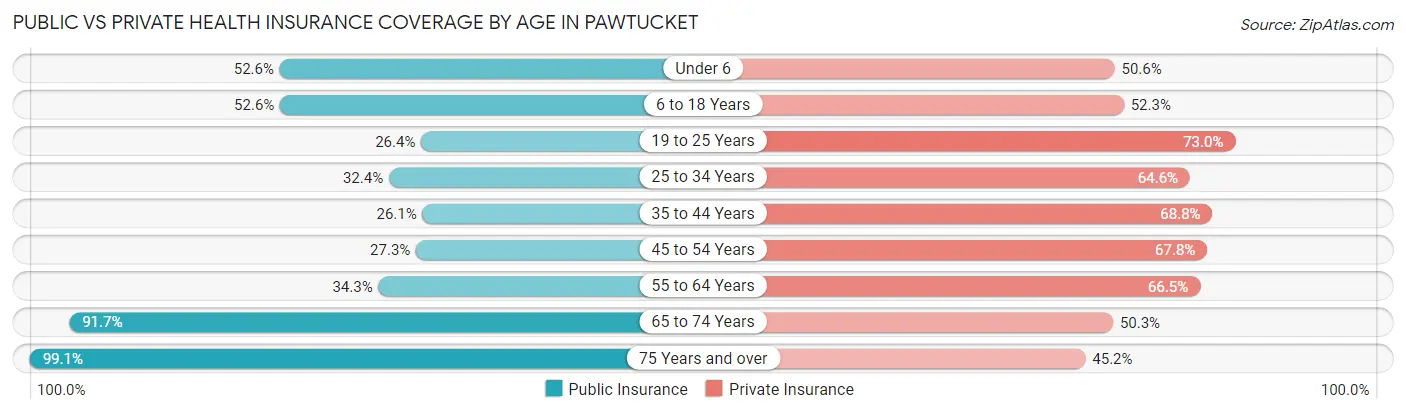
| Age Bracket | Public Insurance | Private Insurance |
| Under 6 | 2,673 (52.6%) | 2,571 (50.6%) |
| 6 to 18 Years | 6,014 (52.6%) | 5,987 (52.3%) |
| 19 to 25 Years | 1,854 (26.4%) | 5,131 (73.0%) |
| 25 to 34 Years | 3,594 (32.4%) | 7,174 (64.6%) |
| 35 to 44 Years | 2,906 (26.1%) | 7,649 (68.8%) |
| 45 to 54 Years | 2,675 (27.3%) | 6,641 (67.8%) |
| 55 to 64 Years | 3,292 (34.3%) | 6,380 (66.5%) |
| 65 to 74 Years | 5,264 (91.7%) | 2,889 (50.3%) |
| 75 Years and over | 3,843 (99.1%) | 1,754 (45.2%) |
| Total | 32,115 (42.9%) | 46,176 (61.8%) |
Disability Status by Sex by Age in Pawtucket
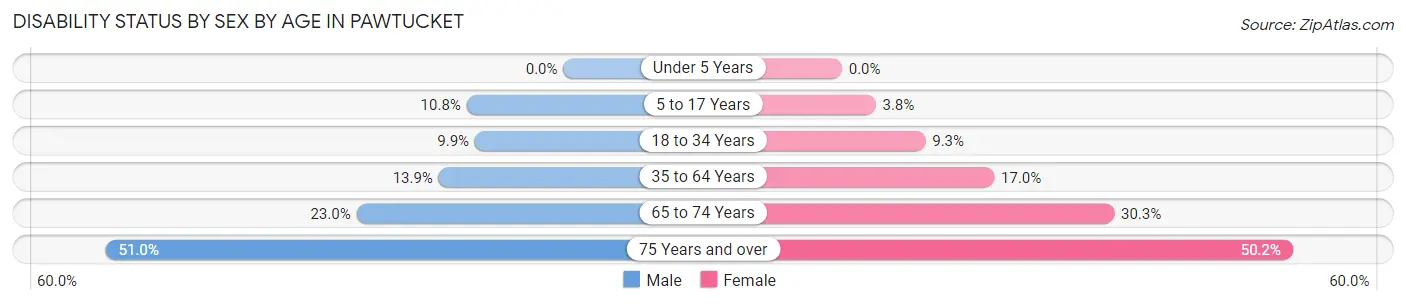
| Age Bracket | Male | Female |
| Under 5 Years | 0 (0.0%) | 0 (0.0%) |
| 5 to 17 Years | 690 (10.8%) | 199 (3.8%) |
| 18 to 34 Years | 922 (9.9%) | 867 (9.3%) |
| 35 to 64 Years | 2,175 (13.9%) | 2,517 (17.0%) |
| 65 to 74 Years | 637 (23.0%) | 902 (30.3%) |
| 75 Years and over | 836 (51.0%) | 1,125 (50.2%) |
Disability Class by Sex by Age in Pawtucket
Disability Class: Hearing Difficulty
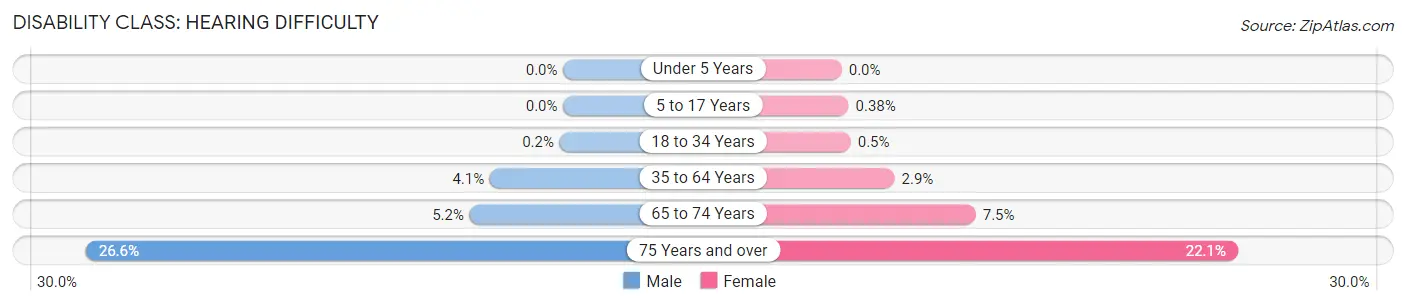
| Age Bracket | Male | Female |
| Under 5 Years | 0 (0.0%) | 0 (0.0%) |
| 5 to 17 Years | 0 (0.0%) | 20 (0.4%) |
| 18 to 34 Years | 19 (0.2%) | 47 (0.5%) |
| 35 to 64 Years | 639 (4.1%) | 437 (2.9%) |
| 65 to 74 Years | 144 (5.2%) | 222 (7.5%) |
| 75 Years and over | 436 (26.6%) | 494 (22.1%) |
Disability Class: Vision Difficulty
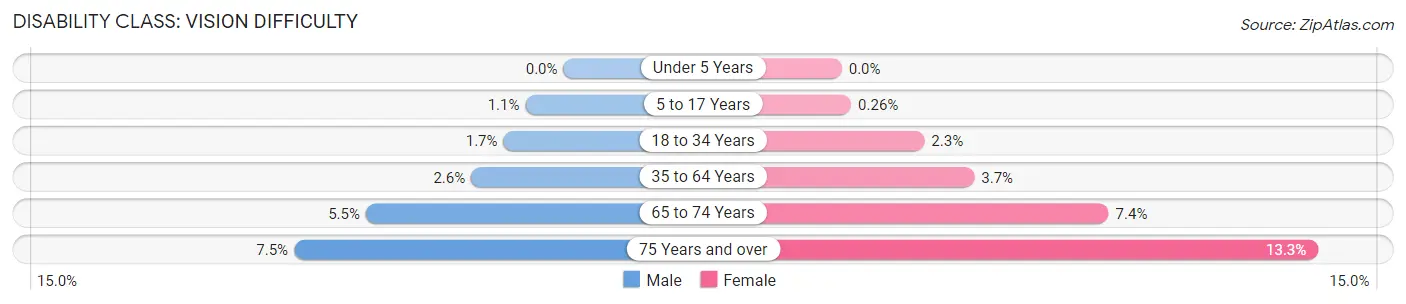
| Age Bracket | Male | Female |
| Under 5 Years | 0 (0.0%) | 0 (0.0%) |
| 5 to 17 Years | 68 (1.1%) | 14 (0.3%) |
| 18 to 34 Years | 156 (1.7%) | 214 (2.3%) |
| 35 to 64 Years | 403 (2.6%) | 548 (3.7%) |
| 65 to 74 Years | 152 (5.5%) | 221 (7.4%) |
| 75 Years and over | 123 (7.5%) | 297 (13.3%) |
Disability Class: Cognitive Difficulty
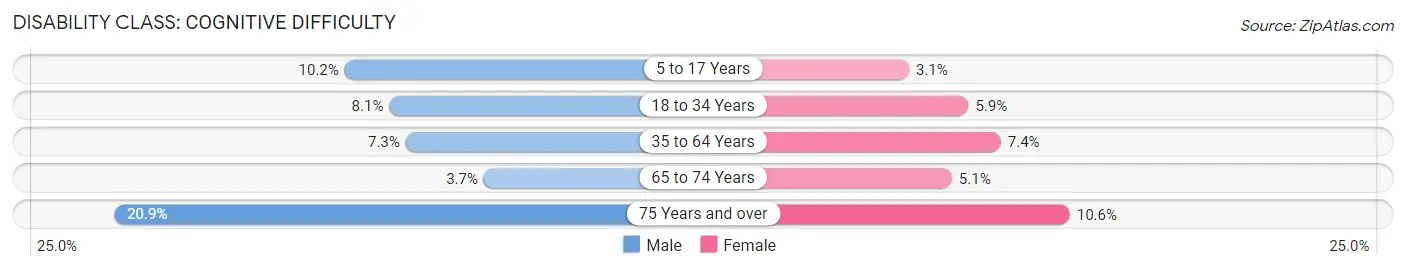
| Age Bracket | Male | Female |
| 5 to 17 Years | 650 (10.2%) | 165 (3.1%) |
| 18 to 34 Years | 756 (8.1%) | 548 (5.9%) |
| 35 to 64 Years | 1,147 (7.3%) | 1,095 (7.4%) |
| 65 to 74 Years | 102 (3.7%) | 152 (5.1%) |
| 75 Years and over | 342 (20.8%) | 237 (10.6%) |
Disability Class: Ambulatory Difficulty
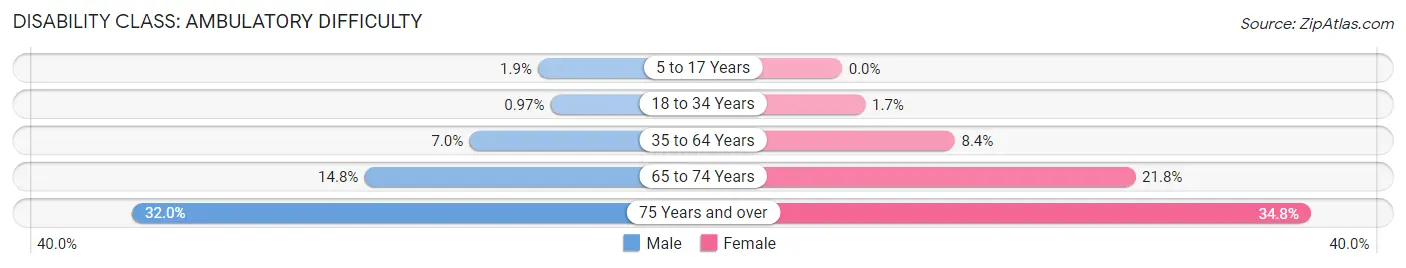
| Age Bracket | Male | Female |
| 5 to 17 Years | 122 (1.9%) | 0 (0.0%) |
| 18 to 34 Years | 91 (1.0%) | 161 (1.7%) |
| 35 to 64 Years | 1,096 (7.0%) | 1,242 (8.4%) |
| 65 to 74 Years | 409 (14.8%) | 648 (21.8%) |
| 75 Years and over | 525 (32.0%) | 780 (34.8%) |
Disability Class: Self-Care Difficulty
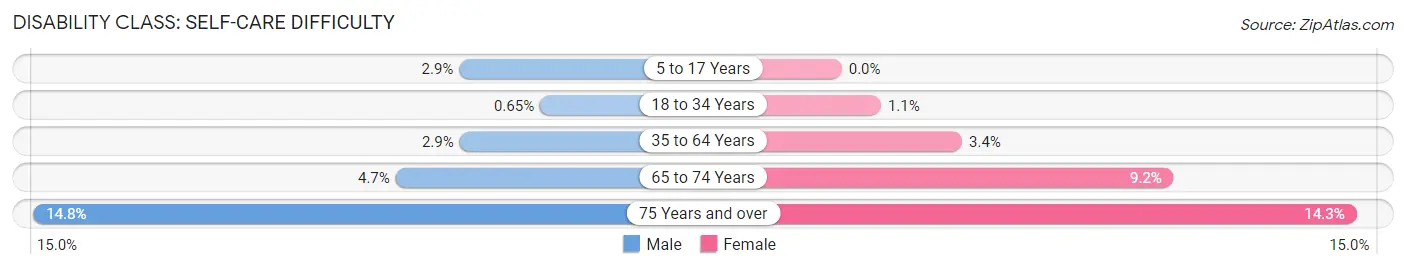
| Age Bracket | Male | Female |
| 5 to 17 Years | 186 (2.9%) | 0 (0.0%) |
| 18 to 34 Years | 61 (0.6%) | 102 (1.1%) |
| 35 to 64 Years | 453 (2.9%) | 497 (3.4%) |
| 65 to 74 Years | 129 (4.7%) | 275 (9.2%) |
| 75 Years and over | 242 (14.8%) | 321 (14.3%) |
Technology Access in Pawtucket
Computing Device Access in Pawtucket
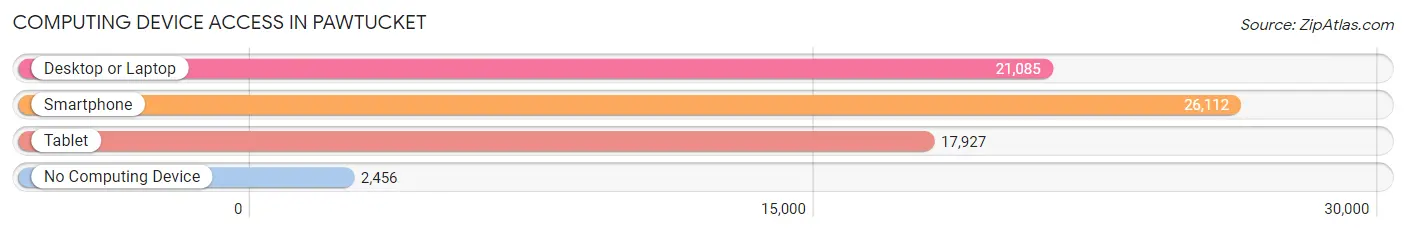
| Device Type | # Households | % Households |
| Desktop or Laptop | 21,085 | 69.0% |
| Smartphone | 26,112 | 85.4% |
| Tablet | 17,927 | 58.6% |
| No Computing Device | 2,456 | 8.0% |
| Total | 30,582 | 100.0% |
Internet Access in Pawtucket
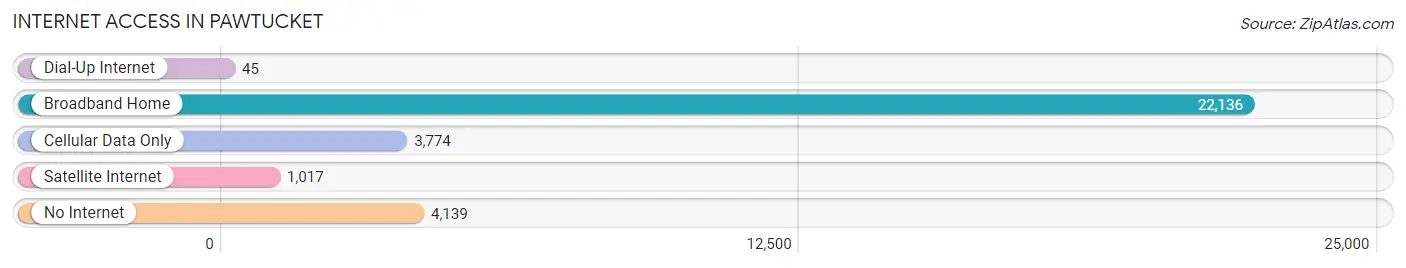
| Internet Type | # Households | % Households |
| Dial-Up Internet | 45 | 0.2% |
| Broadband Home | 22,136 | 72.4% |
| Cellular Data Only | 3,774 | 12.3% |
| Satellite Internet | 1,017 | 3.3% |
| No Internet | 4,139 | 13.5% |
| Total | 30,582 | 100.0% |
Pawtucket Summary
Pawtucket, Rhode Island is a city located in Providence County, Rhode Island. It is the fourth largest city in the state, with a population of 71,148 as of the 2010 census. The city is situated on the banks of the Blackstone River, and is bordered by Central Falls, Lincoln, North Providence, and East Providence. Pawtucket is known for its diverse population, its industrial history, and its vibrant arts and culture scene.
Geography
Pawtucket is located in the Blackstone Valley region of Rhode Island, and is situated on the banks of the Blackstone River. The city is bordered by Central Falls, Lincoln, North Providence, and East Providence. The city covers an area of 8.3 square miles, and has a population density of 8,541 people per square mile.
The city is located in a humid continental climate zone, with hot, humid summers and cold, snowy winters. The average temperature in the summer is around 75 degrees Fahrenheit, and the average temperature in the winter is around 25 degrees Fahrenheit. The city receives an average of 43 inches of precipitation per year, with the majority of it falling in the summer months.
History
Pawtucket was first settled in 1671 by William Blackstone, who established a trading post on the banks of the Blackstone River. The area was incorporated as a town in 1775, and was named after the Pawtucket Native American tribe. The town grew rapidly in the 19th century, and was home to a number of factories and mills. The city was officially incorporated as a city in 1862.
In the late 19th and early 20th centuries, Pawtucket was a major center of the textile industry, and was home to a number of large factories and mills. The city was also home to a number of immigrant communities, including Irish, French-Canadian, and Italian immigrants.
In the late 20th century, the city experienced a period of economic decline, as the textile industry moved overseas and the city's population declined. In recent years, the city has experienced a resurgence, as it has become a center for the arts and culture, and has seen an influx of new businesses and residents.
Economy
Pawtucket's economy is largely based on the service industry, with the largest employers in the city being hospitals, universities, and government agencies. The city is also home to a number of manufacturing companies, including Hasbro, Inc., which is the world's largest toy company.
The city is also home to a number of small businesses, including restaurants, retail stores, and art galleries. The city is also home to a number of cultural institutions, including the Pawtucket Arts Festival, the Pawtucket Armory Arts Center, and the Pawtucket Public Library.
Demographics
As of the 2010 census, the population of Pawtucket was 71,148, with a population density of 8,541 people per square mile. The racial makeup of the city was 79.2% White, 8.3% African American, 0.4% Native American, 2.2% Asian, 0.1% Pacific Islander, 6.7% from other races, and 2.5% from two or more races. Hispanic or Latino of any race were 14.3% of the population.
The median income for a household in the city was $37,837, and the median income for a family was $45,945. The per capita income for the city was $20,845. About 17.2% of the population was below the poverty line.
Conclusion
Pawtucket, Rhode Island is a city with a rich history and a vibrant culture. The city is home to a diverse population, and is a center for the arts and culture. The city's economy is largely based on the service industry, and the city is home to a number of manufacturing companies. The city has a population of 71,148, with a median income of $37,837. The city has experienced a period of economic decline, but has seen a resurgence in recent years.
Common Questions
What is Per Capita Income in Pawtucket?
Per Capita income in Pawtucket is $33,541.
What is the Median Family Income in Pawtucket?
Median Family Income in Pawtucket is $80,544.
What is the Median Household income in Pawtucket?
Median Household Income in Pawtucket is $62,799.
What is Income or Wage Gap in Pawtucket?
Income or Wage Gap in Pawtucket is 19.6%.
Women in Pawtucket earn 80.4 cents for every dollar earned by a man.
What is Family Income Deficit in Pawtucket?
Family Income Deficit in Pawtucket is $11,504.
Families that are below poverty line in Pawtucket earn $11,504 less on average than the poverty threshold level.
What is Inequality or Gini Index in Pawtucket?
Inequality or Gini Index in Pawtucket is 0.44.
What is the Total Population of Pawtucket?
Total Population of Pawtucket is 75,176.
What is the Total Male Population of Pawtucket?
Total Male Population of Pawtucket is 38,163.
What is the Total Female Population of Pawtucket?
Total Female Population of Pawtucket is 37,013.
What is the Ratio of Males per 100 Females in Pawtucket?
There are 103.11 Males per 100 Females in Pawtucket.
What is the Ratio of Females per 100 Males in Pawtucket?
There are 96.99 Females per 100 Males in Pawtucket.
What is the Median Population Age in Pawtucket?
Median Population Age in Pawtucket is 37.1 Years.
What is the Average Family Size in Pawtucket
Average Family Size in Pawtucket is 3.1 People.
What is the Average Household Size in Pawtucket
Average Household Size in Pawtucket is 2.4 People.
How Large is the Labor Force in Pawtucket?
There are 43,204 People in the Labor Forcein in Pawtucket.
What is the Percentage of People in the Labor Force in Pawtucket?
70.9% of People are in the Labor Force in Pawtucket.
What is the Unemployment Rate in Pawtucket?
Unemployment Rate in Pawtucket is 6.7%.