Fall River, MA Map & Demographics
Fall River Map
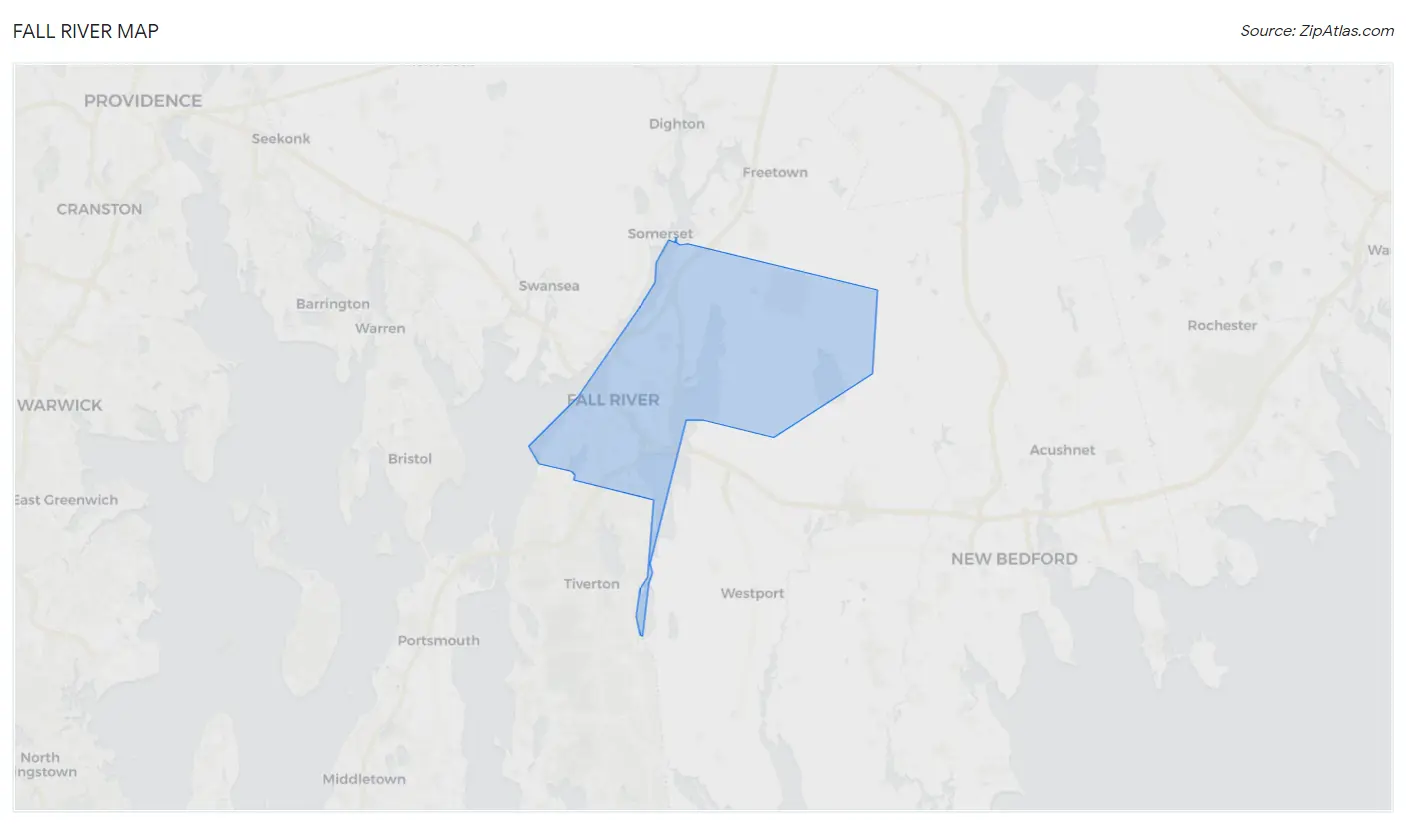
Fall River Overview
$30,591
PER CAPITA INCOME
$63,351
AVG FAMILY INCOME
$52,734
AVG HOUSEHOLD INCOME
28.1%
WAGE / INCOME GAP [ % ]
71.9¢/ $1
WAGE / INCOME GAP [ $ ]
$11,283
FAMILY INCOME DEFICIT
0.46
INEQUALITY / GINI INDEX
93,638
TOTAL POPULATION
45,217
MALE POPULATION
48,421
FEMALE POPULATION
93.38
MALES / 100 FEMALES
107.09
FEMALES / 100 MALES
39.2
MEDIAN AGE
2.9
AVG FAMILY SIZE
2.2
AVG HOUSEHOLD SIZE
46,675
LABOR FORCE [ PEOPLE ]
61.1%
PERCENT IN LABOR FORCE
8.4%
UNEMPLOYMENT RATE
Income in Fall River
Income Overview in Fall River
Per Capita Income in Fall River is $30,591, while median incomes of families and households are $63,351 and $52,734 respectively.
| Characteristic | Number | Measure |
| Per Capita Income | 93,638 | $30,591 |
| Median Family Income | 23,815 | $63,351 |
| Mean Family Income | 23,815 | $81,256 |
| Median Household Income | 41,113 | $52,734 |
| Mean Household Income | 41,113 | $69,619 |
| Income Deficit | 23,815 | $11,283 |
| Wage / Income Gap (%) | 93,638 | 28.05% |
| Wage / Income Gap ($) | 93,638 | 71.95¢ per $1 |
| Gini / Inequality Index | 93,638 | 0.46 |
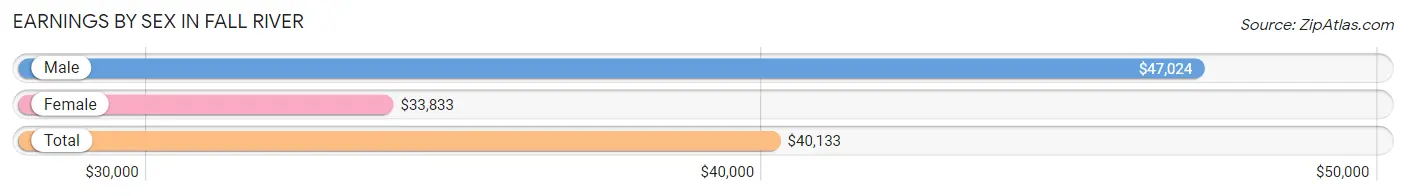
Earnings by Sex in Fall River
Average Earnings in Fall River are $40,133, $47,024 for men and $33,833 for women, a difference of 28.1%.
| Sex | Number | Average Earnings |
| Male | 24,098 (50.9%) | $47,024 |
| Female | 23,239 (49.1%) | $33,833 |
| Total | 47,337 (100.0%) | $40,133 |
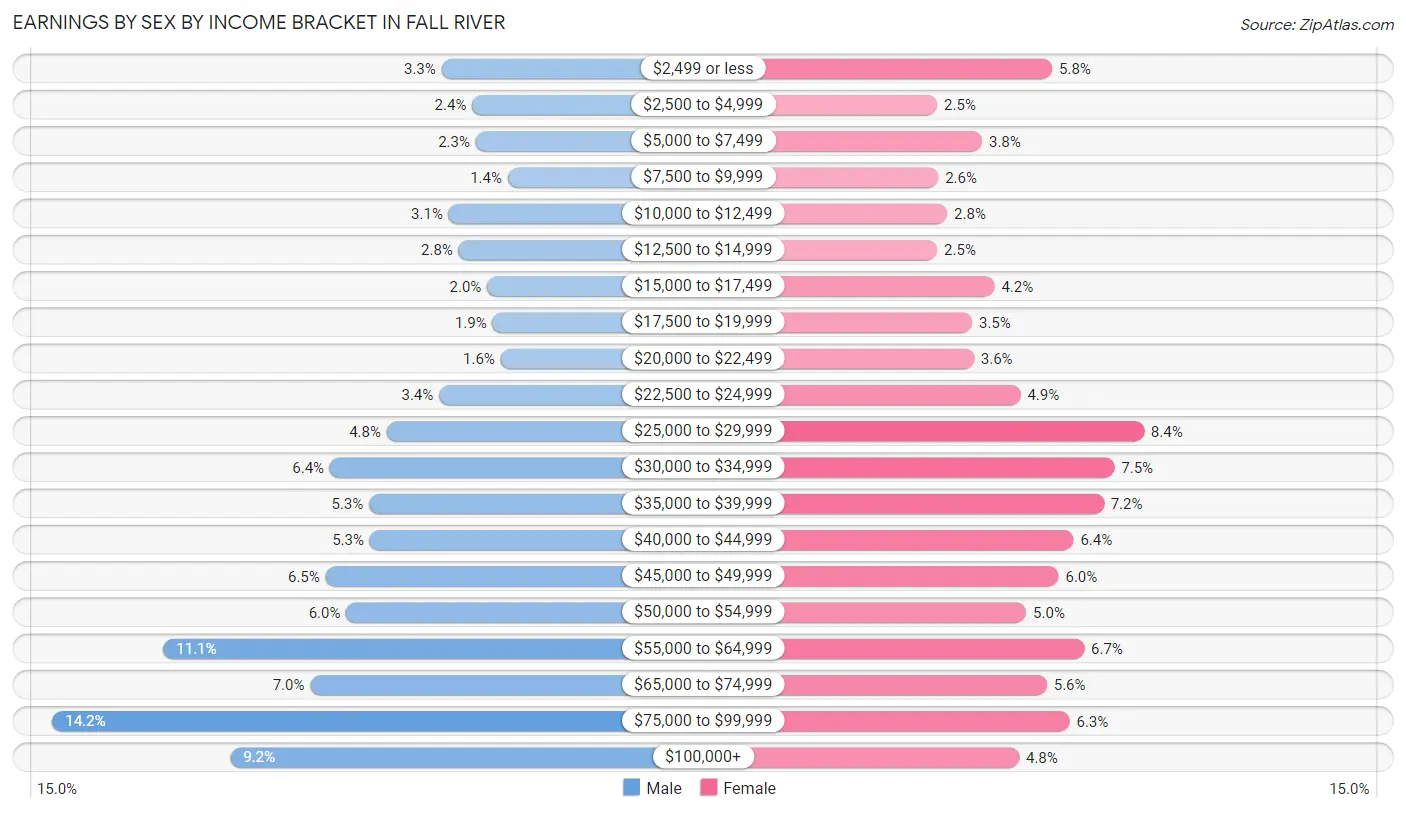
Earnings by Sex by Income Bracket in Fall River
The most common earnings brackets in Fall River are $75,000 to $99,999 for men (3,426 | 14.2%) and $25,000 to $29,999 for women (1,941 | 8.4%).
| Income | Male | Female |
| $2,499 or less | 790 (3.3%) | 1,340 (5.8%) |
| $2,500 to $4,999 | 583 (2.4%) | 590 (2.5%) |
| $5,000 to $7,499 | 558 (2.3%) | 884 (3.8%) |
| $7,500 to $9,999 | 343 (1.4%) | 597 (2.6%) |
| $10,000 to $12,499 | 742 (3.1%) | 655 (2.8%) |
| $12,500 to $14,999 | 675 (2.8%) | 591 (2.5%) |
| $15,000 to $17,499 | 481 (2.0%) | 965 (4.2%) |
| $17,500 to $19,999 | 445 (1.8%) | 818 (3.5%) |
| $20,000 to $22,499 | 390 (1.6%) | 829 (3.6%) |
| $22,500 to $24,999 | 807 (3.4%) | 1,135 (4.9%) |
| $25,000 to $29,999 | 1,161 (4.8%) | 1,941 (8.4%) |
| $30,000 to $34,999 | 1,547 (6.4%) | 1,747 (7.5%) |
| $35,000 to $39,999 | 1,283 (5.3%) | 1,677 (7.2%) |
| $40,000 to $44,999 | 1,278 (5.3%) | 1,481 (6.4%) |
| $45,000 to $49,999 | 1,577 (6.5%) | 1,382 (5.9%) |
| $50,000 to $54,999 | 1,437 (6.0%) | 1,172 (5.0%) |
| $55,000 to $64,999 | 2,675 (11.1%) | 1,551 (6.7%) |
| $65,000 to $74,999 | 1,679 (7.0%) | 1,306 (5.6%) |
| $75,000 to $99,999 | 3,426 (14.2%) | 1,454 (6.3%) |
| $100,000+ | 2,221 (9.2%) | 1,124 (4.8%) |
| Total | 24,098 (100.0%) | 23,239 (100.0%) |
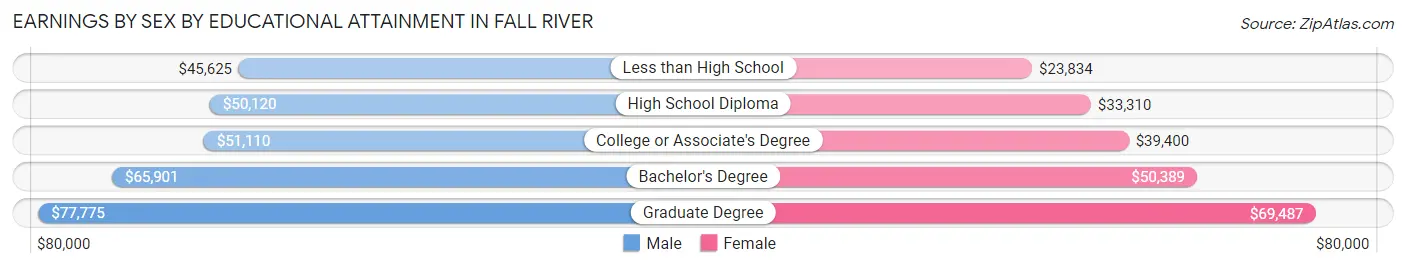
Earnings by Sex by Educational Attainment in Fall River
Average earnings in Fall River are $52,081 for men and $37,385 for women, a difference of 28.2%. Men with an educational attainment of graduate degree enjoy the highest average annual earnings of $77,775, while those with less than high school education earn the least with $45,625. Women with an educational attainment of graduate degree earn the most with the average annual earnings of $69,487, while those with less than high school education have the smallest earnings of $23,834.
| Educational Attainment | Male Income | Female Income |
| Less than High School | $45,625 | $23,834 |
| High School Diploma | $50,120 | $33,310 |
| College or Associate's Degree | $51,110 | $39,400 |
| Bachelor's Degree | $65,901 | $50,389 |
| Graduate Degree | $77,775 | $69,487 |
| Total | $52,081 | $37,385 |
Family Income in Fall River
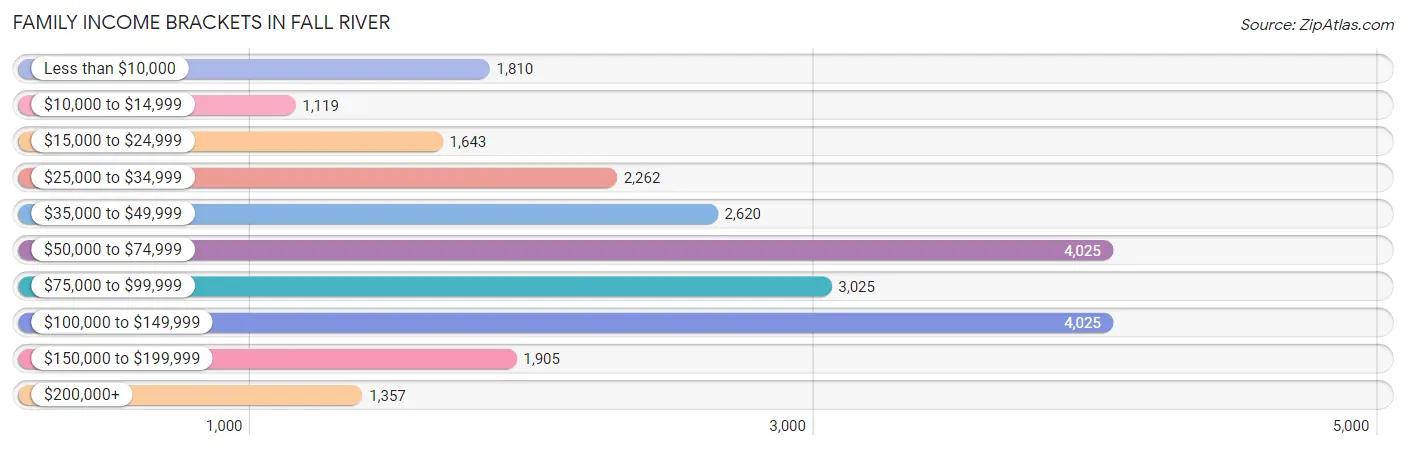
Family Income Brackets in Fall River
According to the Fall River family income data, there are 4,025 families falling into the $50,000 to $74,999 income range, which is the most common income bracket and makes up 16.9% of all families. Conversely, the $10,000 to $14,999 income bracket is the least frequent group with only 1,119 families (4.7%) belonging to this category.
| Income Bracket | # Families | % Families |
| Less than $10,000 | 1,810 | 7.6% |
| $10,000 to $14,999 | 1,119 | 4.7% |
| $15,000 to $24,999 | 1,643 | 6.9% |
| $25,000 to $34,999 | 2,262 | 9.5% |
| $35,000 to $49,999 | 2,620 | 11.0% |
| $50,000 to $74,999 | 4,025 | 16.9% |
| $75,000 to $99,999 | 3,025 | 12.7% |
| $100,000 to $149,999 | 4,025 | 16.9% |
| $150,000 to $199,999 | 1,905 | 8.0% |
| $200,000+ | 1,357 | 5.7% |
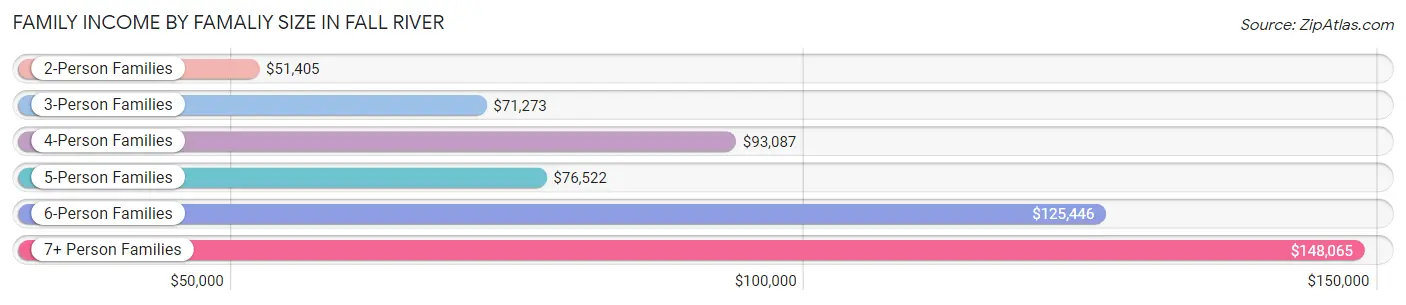
Family Income by Famaliy Size in Fall River
7+ person families (323 | 1.4%) account for the highest median family income in Fall River with $148,065 per family, while 2-person families (11,625 | 48.8%) have the highest median income of $25,702 per family member.
| Income Bracket | # Families | Median Income |
| 2-Person Families | 11,625 (48.8%) | $51,405 |
| 3-Person Families | 6,695 (28.1%) | $71,273 |
| 4-Person Families | 3,345 (14.1%) | $93,087 |
| 5-Person Families | 1,290 (5.4%) | $76,522 |
| 6-Person Families | 537 (2.2%) | $125,446 |
| 7+ Person Families | 323 (1.4%) | $148,065 |
| Total | 23,815 (100.0%) | $63,351 |
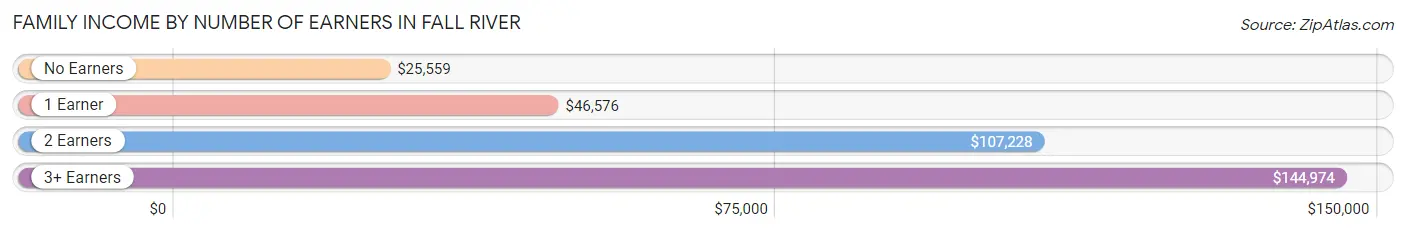
Family Income by Number of Earners in Fall River
The median family income in Fall River is $63,351, with families comprising 3+ earners (2,763) having the highest median family income of $144,974, while families with no earners (4,856) have the lowest median family income of $25,559, accounting for 11.6% and 20.4% of families, respectively.
| Number of Earners | # Families | Median Income |
| No Earners | 4,856 (20.4%) | $25,559 |
| 1 Earner | 8,669 (36.4%) | $46,576 |
| 2 Earners | 7,527 (31.6%) | $107,228 |
| 3+ Earners | 2,763 (11.6%) | $144,974 |
| Total | 23,815 (100.0%) | $63,351 |
Household Income in Fall River
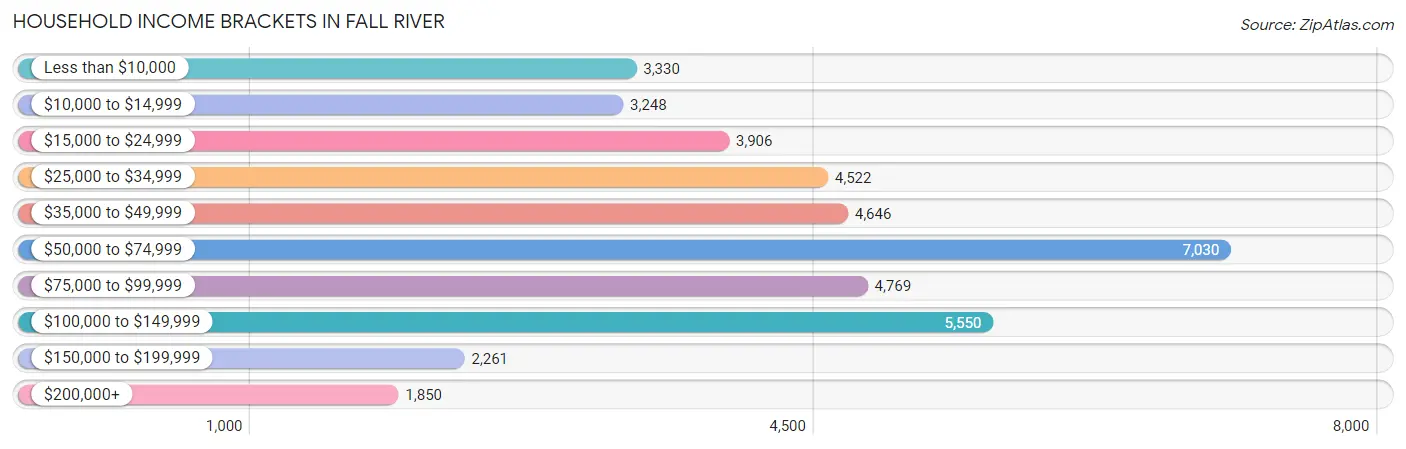
Household Income Brackets in Fall River
With 7,030 households falling in the category, the $50,000 to $74,999 income range is the most frequent in Fall River, accounting for 17.1% of all households. In contrast, only 1,850 households (4.5%) fall into the $200,000+ income bracket, making it the least populous group.
| Income Bracket | # Households | % Households |
| Less than $10,000 | 3,330 | 8.1% |
| $10,000 to $14,999 | 3,248 | 7.9% |
| $15,000 to $24,999 | 3,906 | 9.5% |
| $25,000 to $34,999 | 4,522 | 11.0% |
| $35,000 to $49,999 | 4,646 | 11.3% |
| $50,000 to $74,999 | 7,030 | 17.1% |
| $75,000 to $99,999 | 4,769 | 11.6% |
| $100,000 to $149,999 | 5,550 | 13.5% |
| $150,000 to $199,999 | 2,261 | 5.5% |
| $200,000+ | 1,850 | 4.5% |
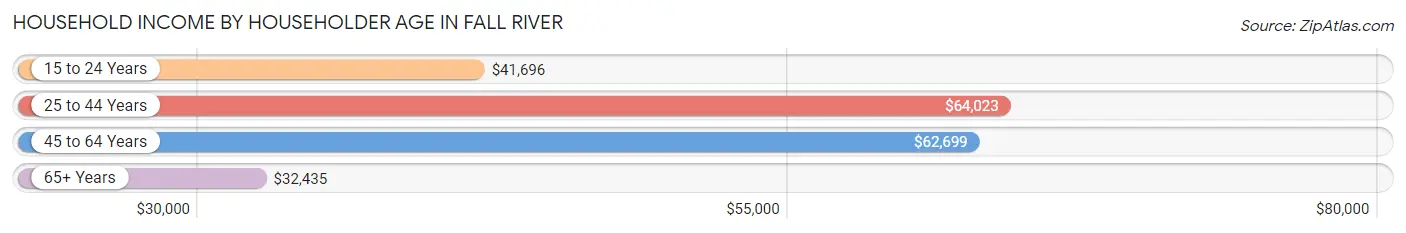
Household Income by Householder Age in Fall River
The median household income in Fall River is $52,734, with the highest median household income of $64,023 found in the 25 to 44 years age bracket for the primary householder. A total of 13,594 households (33.1%) fall into this category. Meanwhile, the 65+ years age bracket for the primary householder has the lowest median household income of $32,435, with 9,638 households (23.4%) in this group.
| Income Bracket | # Households | Median Income |
| 15 to 24 Years | 1,635 (4.0%) | $41,696 |
| 25 to 44 Years | 13,594 (33.1%) | $64,023 |
| 45 to 64 Years | 16,246 (39.5%) | $62,699 |
| 65+ Years | 9,638 (23.4%) | $32,435 |
| Total | 41,113 (100.0%) | $52,734 |
Poverty in Fall River
Income Below Poverty by Sex and Age in Fall River
With 17.9% poverty level for males and 21.4% for females among the residents of Fall River, 5 year old males and 12 to 14 year old females are the most vulnerable to poverty, with 199 males (44.7%) and 456 females (30.5%) in their respective age groups living below the poverty level.
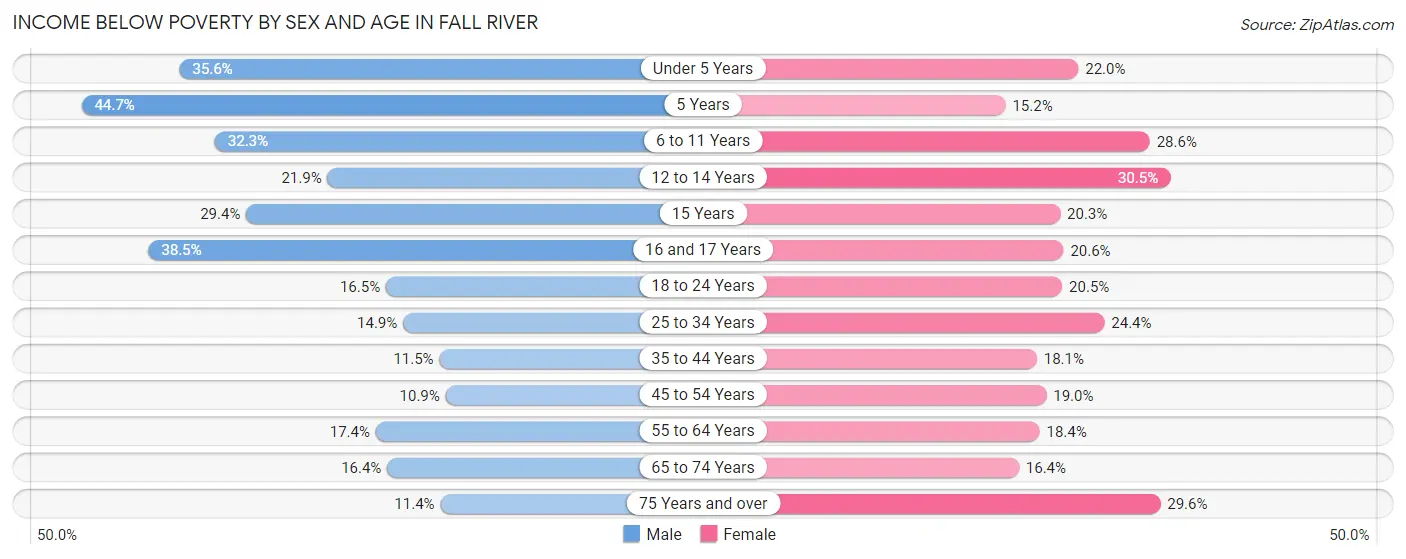
| Age Bracket | Male | Female |
| Under 5 Years | 883 (35.6%) | 627 (22.0%) |
| 5 Years | 199 (44.7%) | 60 (15.2%) |
| 6 to 11 Years | 1,056 (32.3%) | 832 (28.6%) |
| 12 to 14 Years | 420 (21.9%) | 456 (30.5%) |
| 15 Years | 151 (29.4%) | 140 (20.3%) |
| 16 and 17 Years | 342 (38.5%) | 217 (20.6%) |
| 18 to 24 Years | 569 (16.5%) | 823 (20.4%) |
| 25 to 34 Years | 1,090 (14.9%) | 1,734 (24.4%) |
| 35 to 44 Years | 726 (11.5%) | 1,091 (18.1%) |
| 45 to 54 Years | 691 (10.9%) | 1,215 (19.0%) |
| 55 to 64 Years | 1,005 (17.4%) | 1,236 (18.3%) |
| 65 to 74 Years | 624 (16.4%) | 725 (16.4%) |
| 75 Years and over | 253 (11.4%) | 1,051 (29.6%) |
| Total | 8,009 (17.9%) | 10,207 (21.4%) |
Income Above Poverty by Sex and Age in Fall River
According to the poverty statistics in Fall River, males aged 45 to 54 years and females aged 5 years are the age groups that are most secure financially, with 89.1% of males and 84.8% of females in these age groups living above the poverty line.
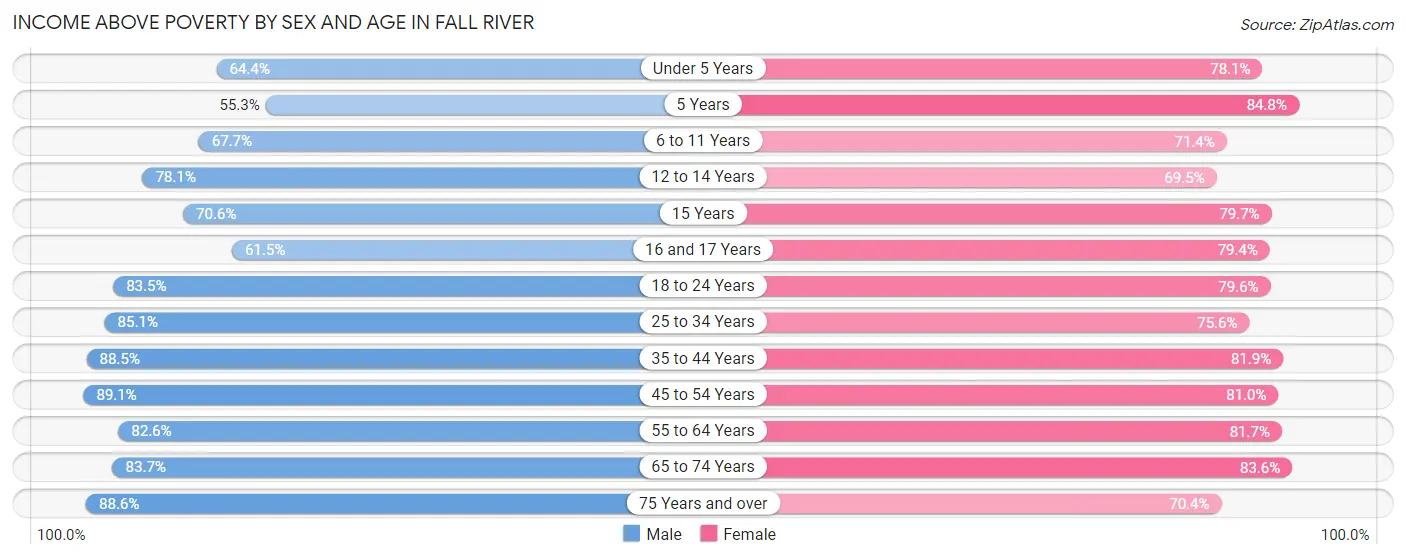
| Age Bracket | Male | Female |
| Under 5 Years | 1,595 (64.4%) | 2,229 (78.0%) |
| 5 Years | 246 (55.3%) | 335 (84.8%) |
| 6 to 11 Years | 2,209 (67.7%) | 2,079 (71.4%) |
| 12 to 14 Years | 1,499 (78.1%) | 1,041 (69.5%) |
| 15 Years | 362 (70.6%) | 551 (79.7%) |
| 16 and 17 Years | 546 (61.5%) | 838 (79.4%) |
| 18 to 24 Years | 2,888 (83.5%) | 3,202 (79.5%) |
| 25 to 34 Years | 6,239 (85.1%) | 5,382 (75.6%) |
| 35 to 44 Years | 5,585 (88.5%) | 4,935 (81.9%) |
| 45 to 54 Years | 5,631 (89.1%) | 5,185 (81.0%) |
| 55 to 64 Years | 4,769 (82.6%) | 5,498 (81.7%) |
| 65 to 74 Years | 3,193 (83.7%) | 3,689 (83.6%) |
| 75 Years and over | 1,965 (88.6%) | 2,505 (70.4%) |
| Total | 36,727 (82.1%) | 37,469 (78.6%) |
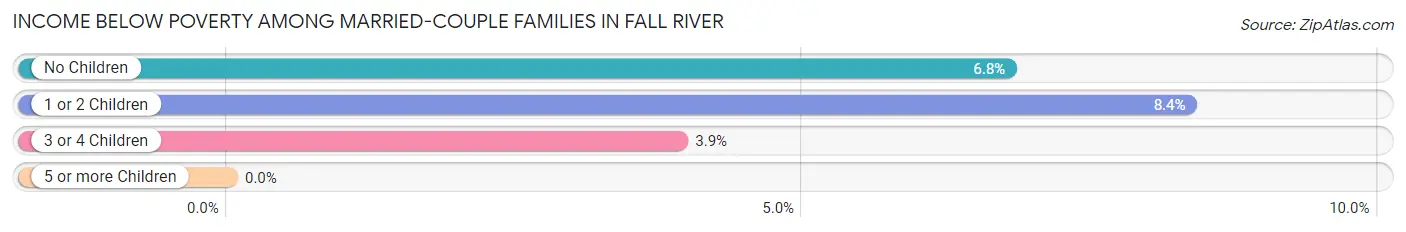
Income Below Poverty Among Married-Couple Families in Fall River
The poverty statistics for married-couple families in Fall River show that 7.1% or 947 of the total 13,340 families live below the poverty line. Families with 1 or 2 children have the highest poverty rate of 8.4%, comprising of 344 families. On the other hand, families with 5 or more children have the lowest poverty rate of 0.0%, which includes 0 families.
| Children | Above Poverty | Below Poverty |
| No Children | 7,930 (93.2%) | 577 (6.8%) |
| 1 or 2 Children | 3,775 (91.6%) | 344 (8.4%) |
| 3 or 4 Children | 638 (96.1%) | 26 (3.9%) |
| 5 or more Children | 50 (100.0%) | 0 (0.0%) |
| Total | 12,393 (92.9%) | 947 (7.1%) |
Income Below Poverty Among Single-Parent Households in Fall River
According to the poverty data in Fall River, 20.1% or 584 single-father households and 35.2% or 2,664 single-mother households are living below the poverty line. Among single-father households, those with 3 or 4 children have the highest poverty rate, with 114 households (46.0%) experiencing poverty. Likewise, among single-mother households, those with 5 or more children have the highest poverty rate, with 33 households (71.7%) falling below the poverty line.
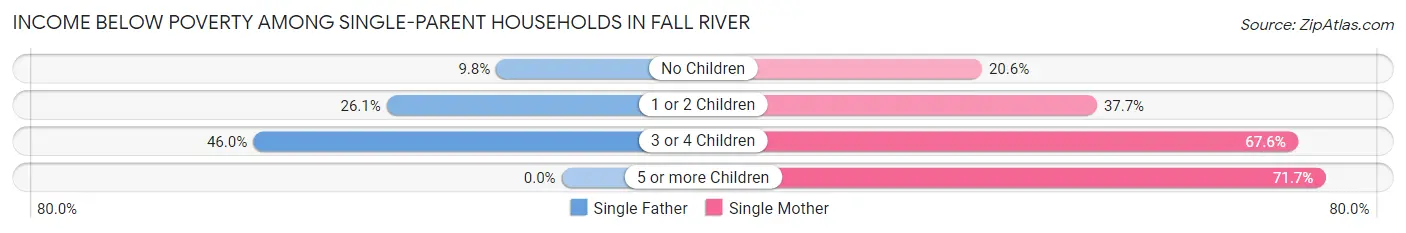
| Children | Single Father | Single Mother |
| No Children | 131 (9.8%) | 483 (20.6%) |
| 1 or 2 Children | 339 (26.1%) | 1,707 (37.7%) |
| 3 or 4 Children | 114 (46.0%) | 441 (67.6%) |
| 5 or more Children | 0 (0.0%) | 33 (71.7%) |
| Total | 584 (20.1%) | 2,664 (35.2%) |
Income Below Poverty Among Married-Couple vs Single-Parent Households in Fall River
The poverty data for Fall River shows that 947 of the married-couple family households (7.1%) and 3,248 of the single-parent households (31.0%) are living below the poverty level. Within the married-couple family households, those with 1 or 2 children have the highest poverty rate, with 344 households (8.4%) falling below the poverty line. Among the single-parent households, those with 3 or 4 children have the highest poverty rate, with 555 household (61.7%) living below poverty.
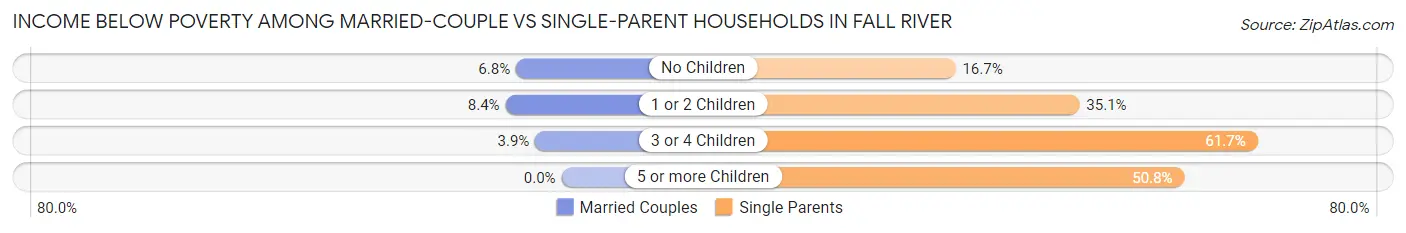
| Children | Married-Couple Families | Single-Parent Households |
| No Children | 577 (6.8%) | 614 (16.7%) |
| 1 or 2 Children | 344 (8.4%) | 2,046 (35.1%) |
| 3 or 4 Children | 26 (3.9%) | 555 (61.7%) |
| 5 or more Children | 0 (0.0%) | 33 (50.8%) |
| Total | 947 (7.1%) | 3,248 (31.0%) |
Race in Fall River
The most populous races in Fall River are White / Caucasian (69,366 | 74.1%), Hispanic or Latino (11,539 | 12.3%), and Two or more Races (9,862 | 10.5%).
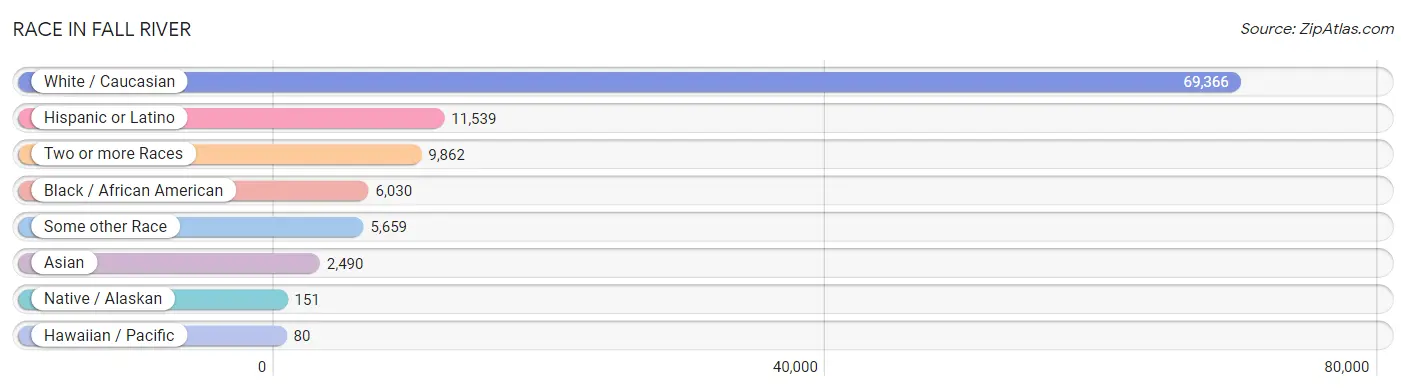
| Race | # Population | % Population |
| Asian | 2,490 | 2.7% |
| Black / African American | 6,030 | 6.4% |
| Hawaiian / Pacific | 80 | 0.1% |
| Hispanic or Latino | 11,539 | 12.3% |
| Native / Alaskan | 151 | 0.2% |
| White / Caucasian | 69,366 | 74.1% |
| Two or more Races | 9,862 | 10.5% |
| Some other Race | 5,659 | 6.0% |
| Total | 93,638 | 100.0% |
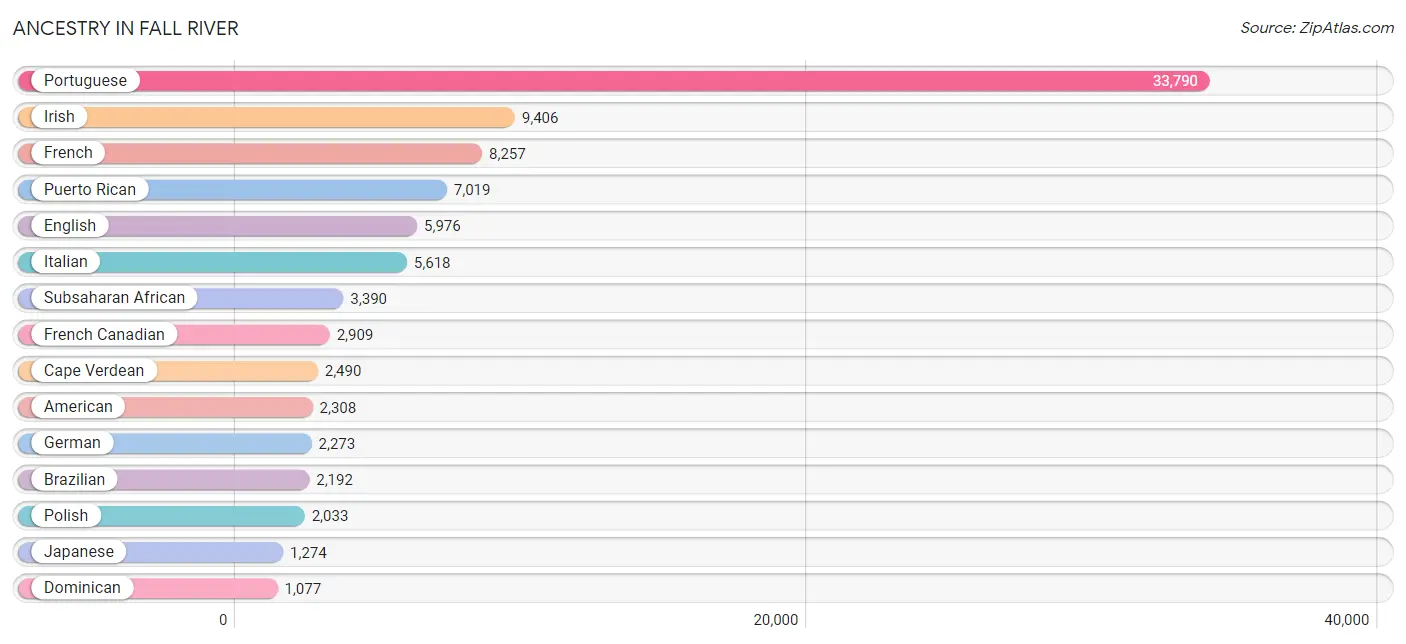
Ancestry in Fall River
The most populous ancestries reported in Fall River are Portuguese (33,790 | 36.1%), Irish (9,406 | 10.1%), French (8,257 | 8.8%), Puerto Rican (7,019 | 7.5%), and English (5,976 | 6.4%), together accounting for 68.8% of all Fall River residents.
| Ancestry | # Population | % Population |
| African | 305 | 0.3% |
| Albanian | 89 | 0.1% |
| American | 2,308 | 2.5% |
| Arab | 465 | 0.5% |
| Argentinean | 45 | 0.1% |
| Armenian | 14 | 0.0% |
| Austrian | 73 | 0.1% |
| Barbadian | 21 | 0.0% |
| Belgian | 292 | 0.3% |
| Belizean | 11 | 0.0% |
| Bhutanese | 45 | 0.1% |
| Blackfeet | 129 | 0.1% |
| Bolivian | 8 | 0.0% |
| Brazilian | 2,192 | 2.3% |
| British | 117 | 0.1% |
| Burmese | 6 | 0.0% |
| Canadian | 273 | 0.3% |
| Cape Verdean | 2,490 | 2.7% |
| Central American | 1,060 | 1.1% |
| Central American Indian | 24 | 0.0% |
| Cherokee | 81 | 0.1% |
| Chilean | 44 | 0.1% |
| Choctaw | 21 | 0.0% |
| Colombian | 173 | 0.2% |
| Cuban | 62 | 0.1% |
| Czech | 6 | 0.0% |
| Czechoslovakian | 31 | 0.0% |
| Danish | 87 | 0.1% |
| Dominican | 1,077 | 1.1% |
| Dutch | 74 | 0.1% |
| Eastern European | 66 | 0.1% |
| Ecuadorian | 491 | 0.5% |
| Egyptian | 21 | 0.0% |
| English | 5,976 | 6.4% |
| European | 237 | 0.3% |
| Finnish | 134 | 0.1% |
| French | 8,257 | 8.8% |
| French American Indian | 25 | 0.0% |
| French Canadian | 2,909 | 3.1% |
| German | 2,273 | 2.4% |
| Ghanaian | 82 | 0.1% |
| Greek | 254 | 0.3% |
| Guatemalan | 73 | 0.1% |
| Guyanese | 15 | 0.0% |
| Haitian | 823 | 0.9% |
| Honduran | 467 | 0.5% |
| Hungarian | 162 | 0.2% |
| Indian (Asian) | 442 | 0.5% |
| Iranian | 46 | 0.1% |
| Irish | 9,406 | 10.1% |
| Iroquois | 28 | 0.0% |
| Italian | 5,618 | 6.0% |
| Jamaican | 535 | 0.6% |
| Japanese | 1,274 | 1.4% |
| Korean | 85 | 0.1% |
| Lebanese | 391 | 0.4% |
| Lithuanian | 220 | 0.2% |
| Malaysian | 27 | 0.0% |
| Menominee | 7 | 0.0% |
| Mexican | 563 | 0.6% |
| Mongolian | 52 | 0.1% |
| Moroccan | 44 | 0.1% |
| Native Hawaiian | 117 | 0.1% |
| Nicaraguan | 8 | 0.0% |
| Nigerian | 339 | 0.4% |
| Northern European | 43 | 0.1% |
| Norwegian | 172 | 0.2% |
| Pakistani | 97 | 0.1% |
| Panamanian | 10 | 0.0% |
| Peruvian | 35 | 0.0% |
| Polish | 2,033 | 2.2% |
| Portuguese | 33,790 | 36.1% |
| Potawatomi | 9 | 0.0% |
| Puerto Rican | 7,019 | 7.5% |
| Romanian | 9 | 0.0% |
| Russian | 356 | 0.4% |
| Salvadoran | 502 | 0.5% |
| Samoan | 63 | 0.1% |
| Scandinavian | 138 | 0.2% |
| Scotch-Irish | 94 | 0.1% |
| Scottish | 565 | 0.6% |
| Seminole | 8 | 0.0% |
| Senegalese | 100 | 0.1% |
| Slovak | 9 | 0.0% |
| South American | 803 | 0.9% |
| South American Indian | 48 | 0.1% |
| Spaniard | 97 | 0.1% |
| Spanish | 121 | 0.1% |
| Sri Lankan | 286 | 0.3% |
| Subsaharan African | 3,390 | 3.6% |
| Swedish | 394 | 0.4% |
| Swiss | 13 | 0.0% |
| Thai | 231 | 0.3% |
| Trinidadian and Tobagonian | 94 | 0.1% |
| Ugandan | 16 | 0.0% |
| Ukrainian | 234 | 0.3% |
| Ute | 4 | 0.0% |
| Vietnamese | 23 | 0.0% |
| Welsh | 12 | 0.0% |
| West Indian | 112 | 0.1% | View All 100 Rows |
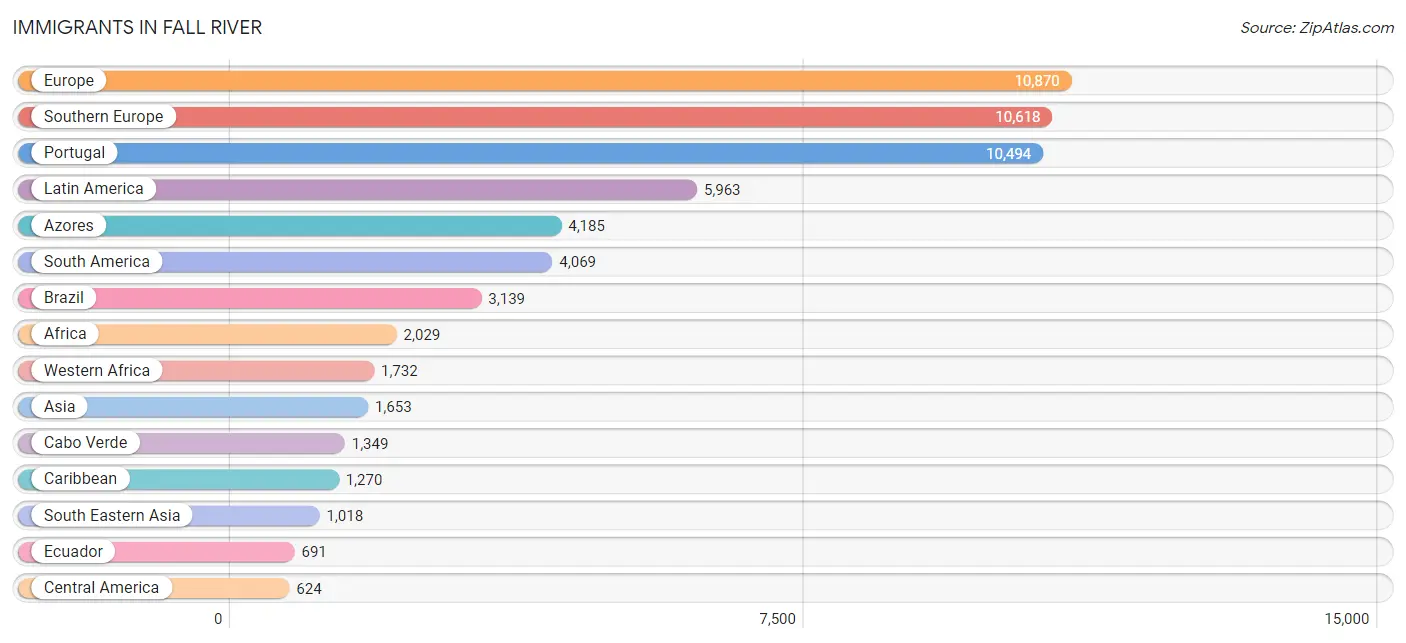
Immigrants in Fall River
The most numerous immigrant groups reported in Fall River came from Europe (10,870 | 11.6%), Southern Europe (10,618 | 11.3%), Portugal (10,494 | 11.2%), Latin America (5,963 | 6.4%), and Azores (4,185 | 4.5%), together accounting for 45.0% of all Fall River residents.
| Immigration Origin | # Population | % Population |
| Africa | 2,029 | 2.2% |
| Albania | 16 | 0.0% |
| Argentina | 45 | 0.1% |
| Asia | 1,653 | 1.8% |
| Austria | 7 | 0.0% |
| Azores | 4,185 | 4.5% |
| Bangladesh | 23 | 0.0% |
| Barbados | 14 | 0.0% |
| Belize | 11 | 0.0% |
| Bolivia | 18 | 0.0% |
| Brazil | 3,139 | 3.4% |
| Cabo Verde | 1,349 | 1.4% |
| Cambodia | 526 | 0.6% |
| Canada | 132 | 0.1% |
| Caribbean | 1,270 | 1.4% |
| Central America | 624 | 0.7% |
| China | 257 | 0.3% |
| Colombia | 126 | 0.1% |
| Congo | 32 | 0.0% |
| Cuba | 19 | 0.0% |
| Dominica | 81 | 0.1% |
| Dominican Republic | 532 | 0.6% |
| Eastern Africa | 90 | 0.1% |
| Eastern Asia | 294 | 0.3% |
| Eastern Europe | 64 | 0.1% |
| Ecuador | 691 | 0.7% |
| Egypt | 105 | 0.1% |
| El Salvador | 191 | 0.2% |
| England | 85 | 0.1% |
| Ethiopia | 19 | 0.0% |
| Europe | 10,870 | 11.6% |
| Germany | 45 | 0.1% |
| Ghana | 86 | 0.1% |
| Guatemala | 67 | 0.1% |
| Haiti | 536 | 0.6% |
| Honduras | 255 | 0.3% |
| India | 243 | 0.3% |
| Iran | 46 | 0.1% |
| Ireland | 17 | 0.0% |
| Israel | 18 | 0.0% |
| Italy | 124 | 0.1% |
| Jamaica | 27 | 0.0% |
| Japan | 31 | 0.0% |
| Korea | 6 | 0.0% |
| Laos | 27 | 0.0% |
| Latin America | 5,963 | 6.4% |
| Lebanon | 11 | 0.0% |
| Liberia | 6 | 0.0% |
| Malaysia | 102 | 0.1% |
| Mexico | 69 | 0.1% |
| Middle Africa | 89 | 0.1% |
| Netherlands | 4 | 0.0% |
| Nigeria | 191 | 0.2% |
| Northern Africa | 105 | 0.1% |
| Northern Europe | 132 | 0.1% |
| Peru | 25 | 0.0% |
| Philippines | 12 | 0.0% |
| Portugal | 10,494 | 11.2% |
| Russia | 40 | 0.0% |
| Scotland | 5 | 0.0% |
| Senegal | 100 | 0.1% |
| Singapore | 20 | 0.0% |
| South Africa | 13 | 0.0% |
| South America | 4,069 | 4.3% |
| South Central Asia | 312 | 0.3% |
| South Eastern Asia | 1,018 | 1.1% |
| Southern Europe | 10,618 | 11.3% |
| Taiwan | 12 | 0.0% |
| Thailand | 149 | 0.2% |
| Trinidad and Tobago | 33 | 0.0% |
| Uganda | 23 | 0.0% |
| Ukraine | 8 | 0.0% |
| Venezuela | 25 | 0.0% |
| Vietnam | 182 | 0.2% |
| Western Africa | 1,732 | 1.8% |
| Western Asia | 29 | 0.0% |
| Western Europe | 56 | 0.1% |
| Zaire | 3 | 0.0% |
| Zimbabwe | 12 | 0.0% | View All 79 Rows |
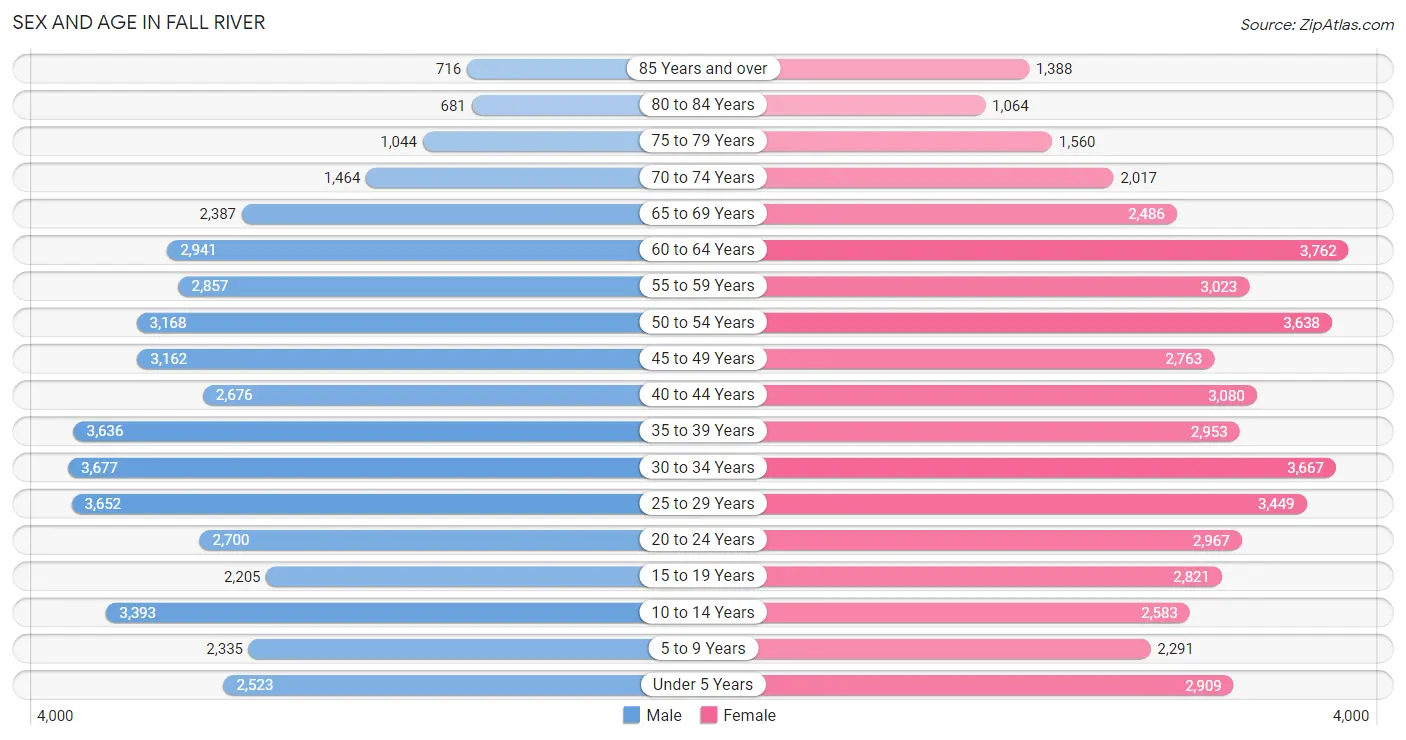
Sex and Age in Fall River
Sex and Age in Fall River
The most populous age groups in Fall River are 30 to 34 Years (3,677 | 8.1%) for men and 60 to 64 Years (3,762 | 7.8%) for women.
| Age Bracket | Male | Female |
| Under 5 Years | 2,523 (5.6%) | 2,909 (6.0%) |
| 5 to 9 Years | 2,335 (5.2%) | 2,291 (4.7%) |
| 10 to 14 Years | 3,393 (7.5%) | 2,583 (5.3%) |
| 15 to 19 Years | 2,205 (4.9%) | 2,821 (5.8%) |
| 20 to 24 Years | 2,700 (6.0%) | 2,967 (6.1%) |
| 25 to 29 Years | 3,652 (8.1%) | 3,449 (7.1%) |
| 30 to 34 Years | 3,677 (8.1%) | 3,667 (7.6%) |
| 35 to 39 Years | 3,636 (8.0%) | 2,953 (6.1%) |
| 40 to 44 Years | 2,676 (5.9%) | 3,080 (6.4%) |
| 45 to 49 Years | 3,162 (7.0%) | 2,763 (5.7%) |
| 50 to 54 Years | 3,168 (7.0%) | 3,638 (7.5%) |
| 55 to 59 Years | 2,857 (6.3%) | 3,023 (6.2%) |
| 60 to 64 Years | 2,941 (6.5%) | 3,762 (7.8%) |
| 65 to 69 Years | 2,387 (5.3%) | 2,486 (5.1%) |
| 70 to 74 Years | 1,464 (3.2%) | 2,017 (4.2%) |
| 75 to 79 Years | 1,044 (2.3%) | 1,560 (3.2%) |
| 80 to 84 Years | 681 (1.5%) | 1,064 (2.2%) |
| 85 Years and over | 716 (1.6%) | 1,388 (2.9%) |
| Total | 45,217 (100.0%) | 48,421 (100.0%) |
Families and Households in Fall River
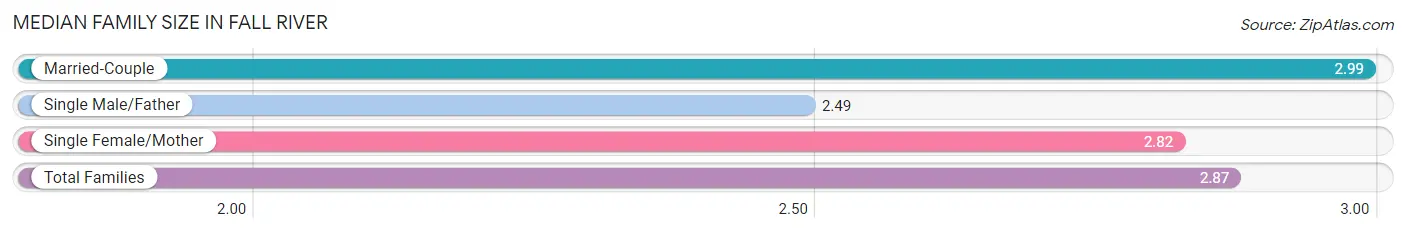
Median Family Size in Fall River
The median family size in Fall River is 2.87 persons per family, with married-couple families (13,340 | 56.0%) accounting for the largest median family size of 2.99 persons per family. On the other hand, single male/father families (2,911 | 12.2%) represent the smallest median family size with 2.49 persons per family.
| Family Type | # Families | Family Size |
| Married-Couple | 13,340 (56.0%) | 2.99 |
| Single Male/Father | 2,911 (12.2%) | 2.49 |
| Single Female/Mother | 7,564 (31.8%) | 2.82 |
| Total Families | 23,815 (100.0%) | 2.87 |
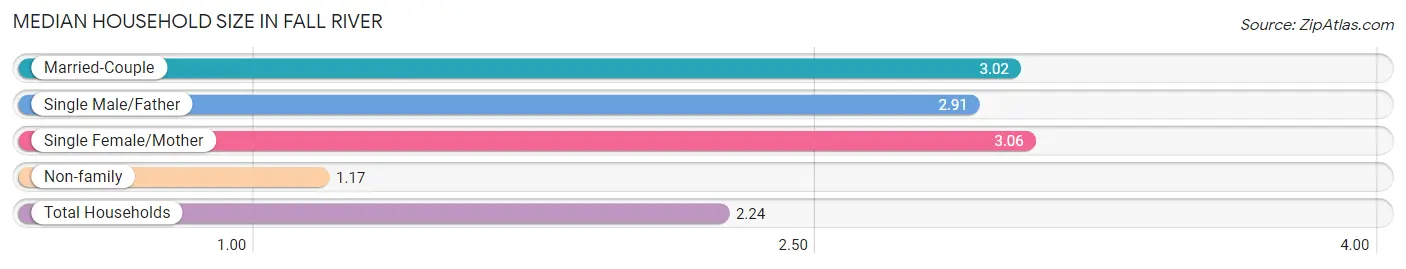
Median Household Size in Fall River
The median household size in Fall River is 2.24 persons per household, with single female/mother households (7,564 | 18.4%) accounting for the largest median household size of 3.06 persons per household. non-family households (17,298 | 42.1%) represent the smallest median household size with 1.17 persons per household.
| Household Type | # Households | Household Size |
| Married-Couple | 13,340 (32.5%) | 3.02 |
| Single Male/Father | 2,911 (7.1%) | 2.91 |
| Single Female/Mother | 7,564 (18.4%) | 3.06 |
| Non-family | 17,298 (42.1%) | 1.17 |
| Total Households | 41,113 (100.0%) | 2.24 |
Household Size by Marriage Status in Fall River
Out of a total of 41,113 households in Fall River, 23,815 (57.9%) are family households, while 17,298 (42.1%) are nonfamily households. The most numerous type of family households are 2-person households, comprising 10,150, and the most common type of nonfamily households are 1-person households, comprising 14,528.
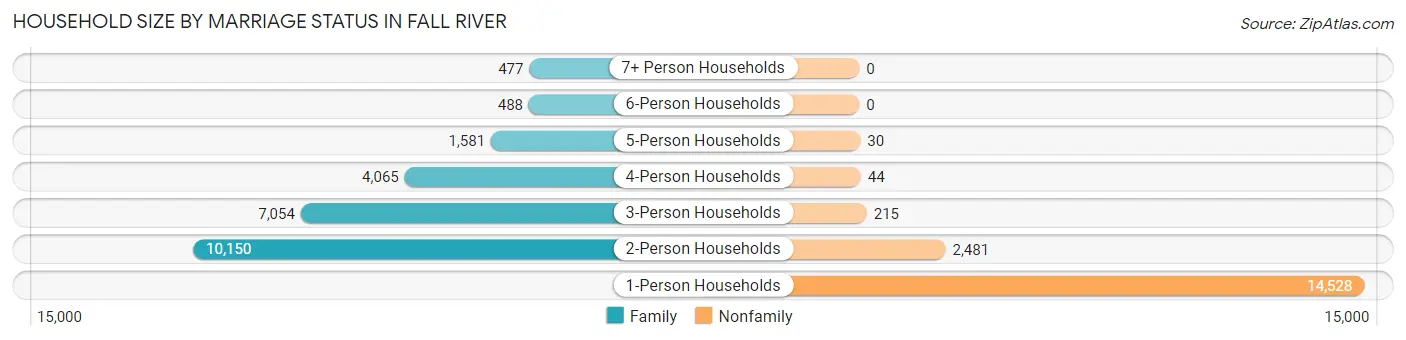
| Household Size | Family Households | Nonfamily Households |
| 1-Person Households | - | 14,528 (35.3%) |
| 2-Person Households | 10,150 (24.7%) | 2,481 (6.0%) |
| 3-Person Households | 7,054 (17.2%) | 215 (0.5%) |
| 4-Person Households | 4,065 (9.9%) | 44 (0.1%) |
| 5-Person Households | 1,581 (3.8%) | 30 (0.1%) |
| 6-Person Households | 488 (1.2%) | 0 (0.0%) |
| 7+ Person Households | 477 (1.2%) | 0 (0.0%) |
| Total | 23,815 (57.9%) | 17,298 (42.1%) |
Female Fertility in Fall River
Fertility by Age in Fall River
Average fertility rate in Fall River is 60.0 births per 1,000 women. Women in the age bracket of 20 to 34 years have the highest fertility rate with 111.0 births per 1,000 women. Women in the age bracket of 20 to 34 years acount for 83.8% of all women with births.
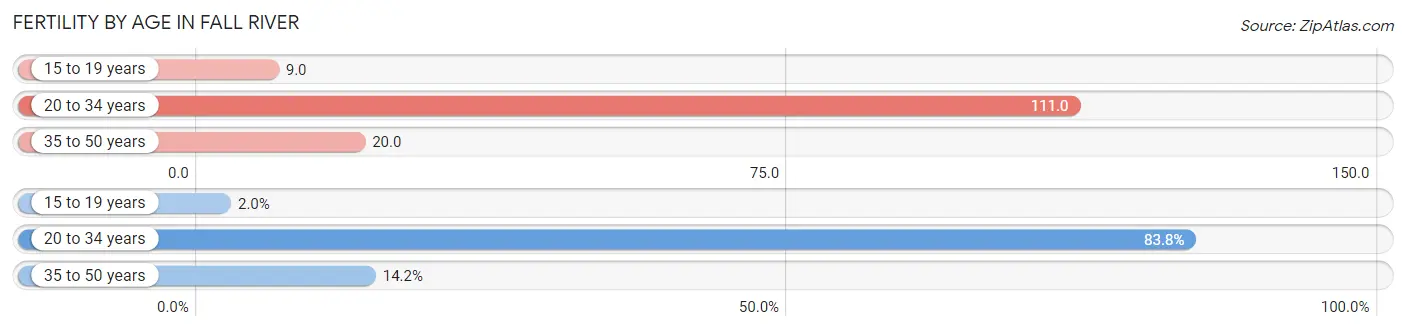
| Age Bracket | Women with Births | Births / 1,000 Women |
| 15 to 19 years | 26 (1.9%) | 9.0 |
| 20 to 34 years | 1,119 (83.8%) | 111.0 |
| 35 to 50 years | 190 (14.2%) | 20.0 |
| Total | 1,335 (100.0%) | 60.0 |
Fertility by Age by Marriage Status in Fall River
41.1% of women with births (1,335) in Fall River are married. The highest percentage of unmarried women with births falls into 15 to 19 years age bracket with 100.0% of them unmarried at the time of birth, while the lowest percentage of unmarried women with births belong to 35 to 50 years age bracket with 9.5% of them unmarried.
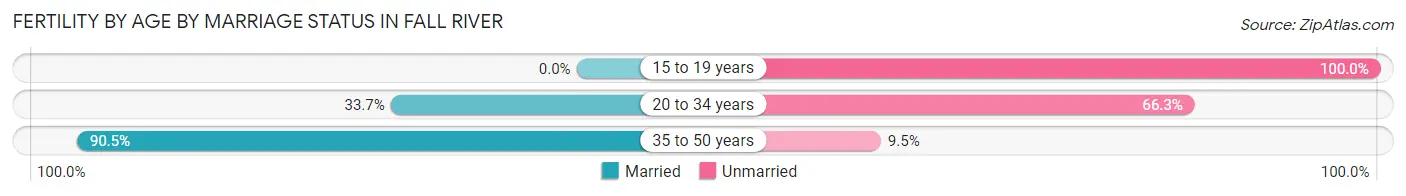
| Age Bracket | Married | Unmarried |
| 15 to 19 years | 0 (0.0%) | 26 (100.0%) |
| 20 to 34 years | 377 (33.7%) | 742 (66.3%) |
| 35 to 50 years | 172 (90.5%) | 18 (9.5%) |
| Total | 549 (41.1%) | 786 (58.9%) |
Fertility by Education in Fall River
Average fertility rate in Fall River is 60.0 births per 1,000 women. Women with the education attainment of bachelor's degree have the highest fertility rate of 93.0 births per 1,000 women, while women with the education attainment of less than high school have the lowest fertility at 33.0 births per 1,000 women. Women with the education attainment of high school diploma represent 33.5% of all women with births.
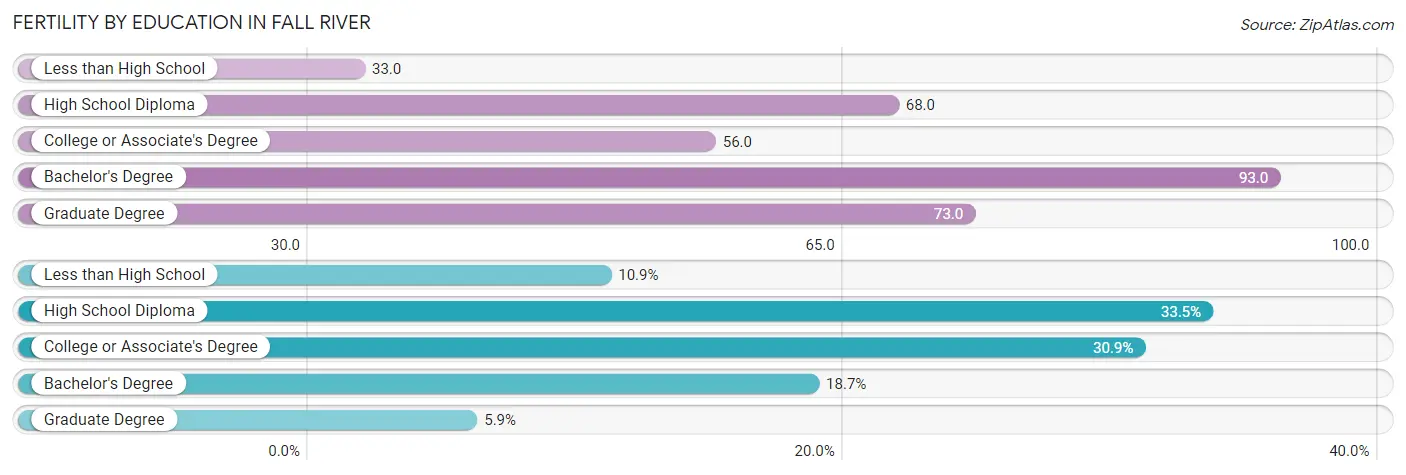
| Educational Attainment | Women with Births | Births / 1,000 Women |
| Less than High School | 146 (10.9%) | 33.0 |
| High School Diploma | 447 (33.5%) | 68.0 |
| College or Associate's Degree | 413 (30.9%) | 56.0 |
| Bachelor's Degree | 250 (18.7%) | 93.0 |
| Graduate Degree | 79 (5.9%) | 73.0 |
| Total | 1,335 (100.0%) | 60.0 |
Fertility by Education by Marriage Status in Fall River
58.9% of women with births in Fall River are unmarried. Women with the educational attainment of graduate degree are most likely to be married with 100.0% of them married at childbirth, while women with the educational attainment of less than high school are least likely to be married with 89.0% of them unmarried at childbirth.
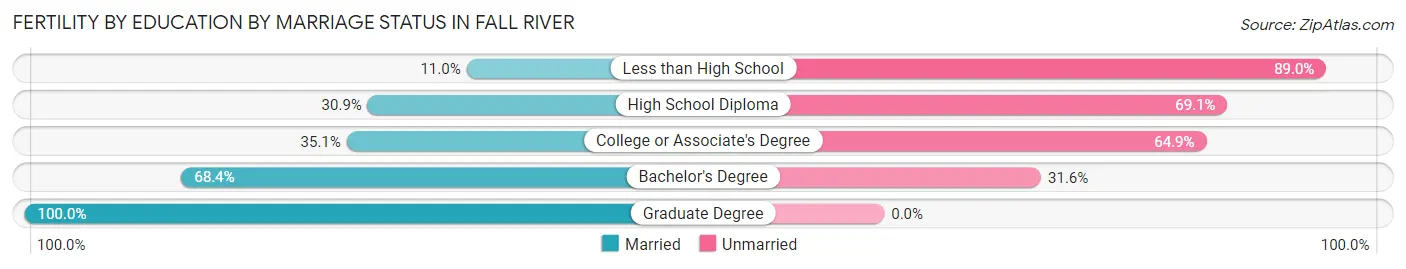
| Educational Attainment | Married | Unmarried |
| Less than High School | 16 (11.0%) | 130 (89.0%) |
| High School Diploma | 138 (30.9%) | 309 (69.1%) |
| College or Associate's Degree | 145 (35.1%) | 268 (64.9%) |
| Bachelor's Degree | 171 (68.4%) | 79 (31.6%) |
| Graduate Degree | 79 (100.0%) | 0 (0.0%) |
| Total | 549 (41.1%) | 786 (58.9%) |
Employment Characteristics in Fall River
Employment by Class of Employer in Fall River
Among the 41,649 employed individuals in Fall River, private company employees (29,483 | 70.8%), not-for-profit organizations (4,177 | 10.0%), and local government employees (2,752 | 6.6%) make up the most common classes of employment.
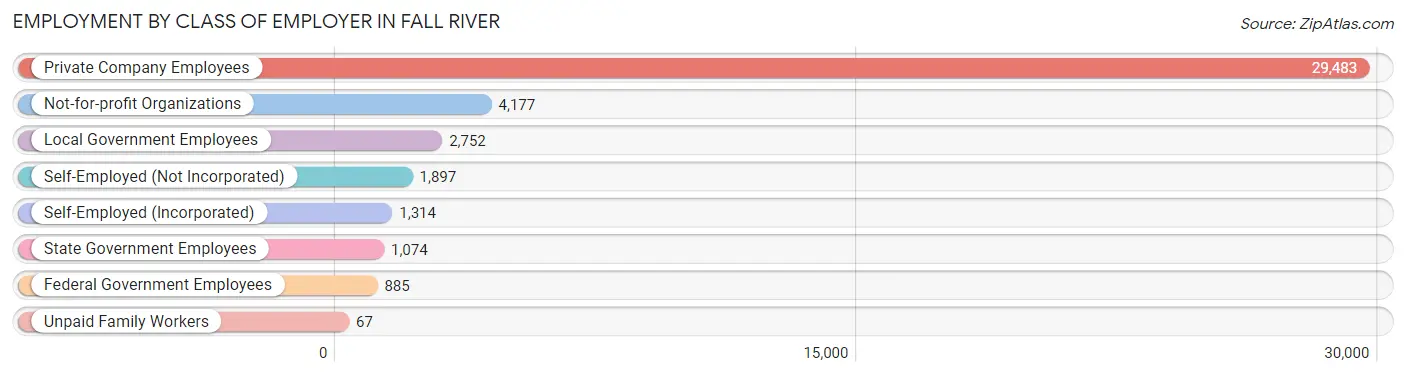
| Employer Class | # Employees | % Employees |
| Private Company Employees | 29,483 | 70.8% |
| Self-Employed (Incorporated) | 1,314 | 3.2% |
| Self-Employed (Not Incorporated) | 1,897 | 4.5% |
| Not-for-profit Organizations | 4,177 | 10.0% |
| Local Government Employees | 2,752 | 6.6% |
| State Government Employees | 1,074 | 2.6% |
| Federal Government Employees | 885 | 2.1% |
| Unpaid Family Workers | 67 | 0.2% |
| Total | 41,649 | 100.0% |
Employment Status by Age in Fall River
According to the labor force statistics for Fall River, out of the total population over 16 years of age (76,391), 61.1% or 46,675 individuals are in the labor force, with 8.4% or 3,921 of them unemployed. The age group with the highest labor force participation rate is 20 to 24 years, with 84.8% or 4,806 individuals in the labor force. Within the labor force, the 16 to 19 years age range has the highest percentage of unemployed individuals, with 29.3% or 551 of them being unemployed.
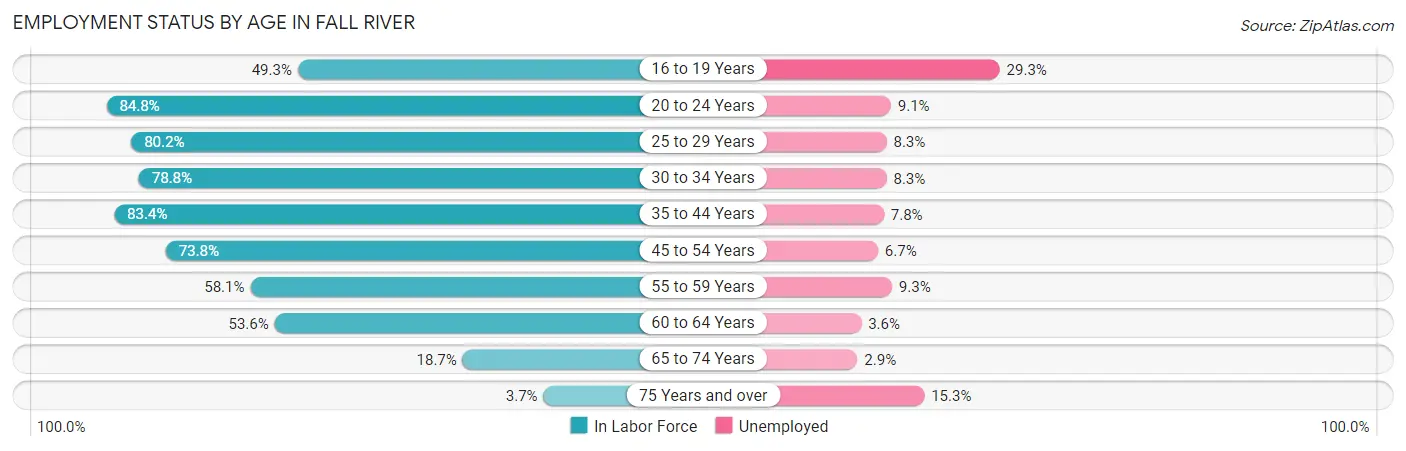
| Age Bracket | In Labor Force | Unemployed |
| 16 to 19 Years | 1,880 (49.3%) | 551 (29.3%) |
| 20 to 24 Years | 4,806 (84.8%) | 437 (9.1%) |
| 25 to 29 Years | 5,695 (80.2%) | 473 (8.3%) |
| 30 to 34 Years | 5,787 (78.8%) | 480 (8.3%) |
| 35 to 44 Years | 10,296 (83.4%) | 803 (7.8%) |
| 45 to 54 Years | 9,395 (73.8%) | 629 (6.7%) |
| 55 to 59 Years | 3,416 (58.1%) | 318 (9.3%) |
| 60 to 64 Years | 3,593 (53.6%) | 129 (3.6%) |
| 65 to 74 Years | 1,562 (18.7%) | 45 (2.9%) |
| 75 Years and over | 239 (3.7%) | 37 (15.3%) |
| Total | 46,675 (61.1%) | 3,921 (8.4%) |
Employment Status by Educational Attainment in Fall River
According to labor force statistics for Fall River, 73.3% of individuals (38,192) out of the total population between 25 and 64 years of age (52,104) are in the labor force, with 7.4% or 2,826 of them being unemployed. The group with the highest labor force participation rate are those with the educational attainment of bachelor's degree or higher, with 88.0% or 7,699 individuals in the labor force. Within the labor force, individuals with high school diploma education have the highest percentage of unemployment, with 10.6% or 1,328 of them being unemployed.
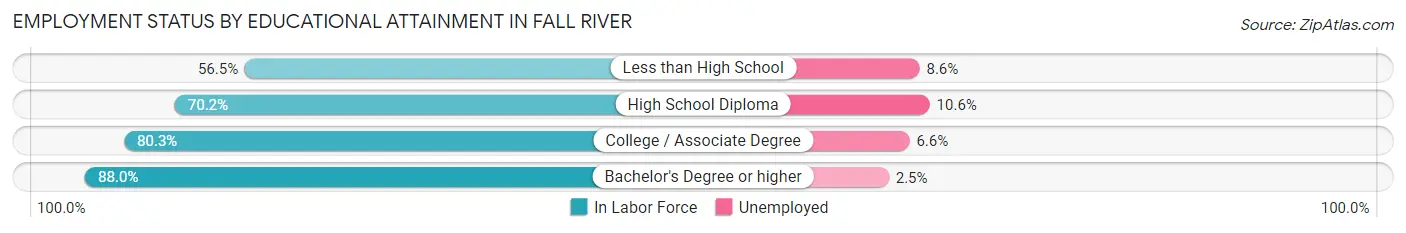
| Educational Attainment | In Labor Force | Unemployed |
| Less than High School | 6,003 (56.5%) | 914 (8.6%) |
| High School Diploma | 12,532 (70.2%) | 1,892 (10.6%) |
| College / Associate Degree | 11,947 (80.3%) | 982 (6.6%) |
| Bachelor's Degree or higher | 7,699 (88.0%) | 219 (2.5%) |
| Total | 38,192 (73.3%) | 3,856 (7.4%) |
Employment Occupations by Sex in Fall River
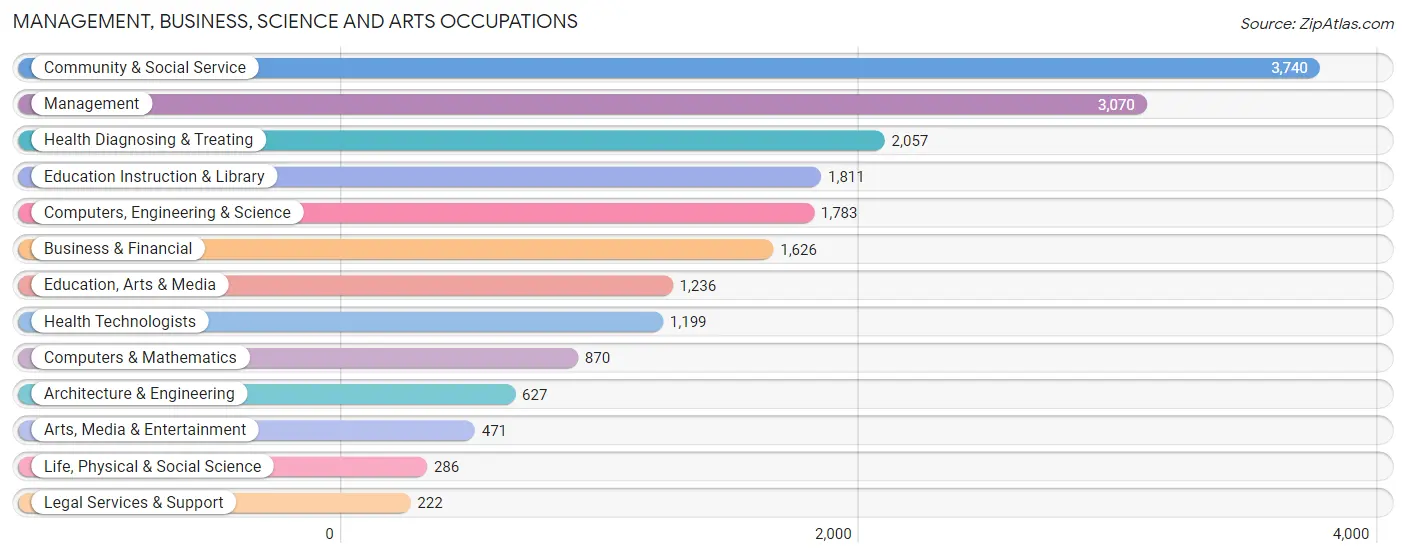
Management, Business, Science and Arts Occupations
The most common Management, Business, Science and Arts occupations in Fall River are Community & Social Service (3,740 | 8.7%), Management (3,070 | 7.2%), Health Diagnosing & Treating (2,057 | 4.8%), Education Instruction & Library (1,811 | 4.2%), and Computers, Engineering & Science (1,783 | 4.2%).
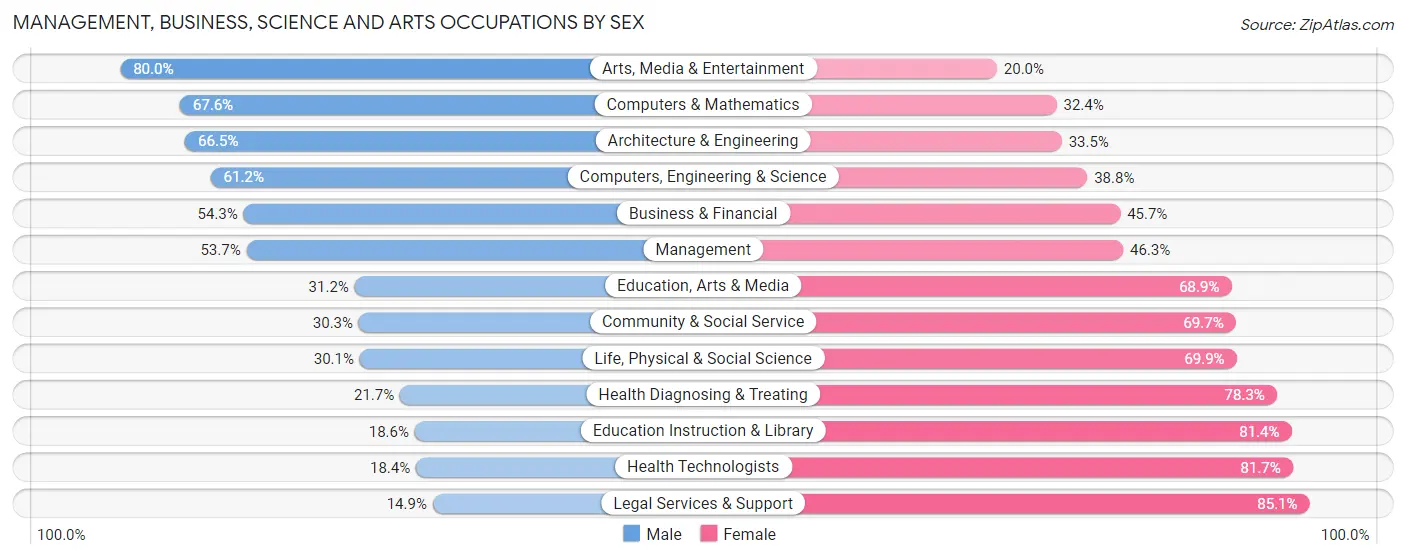
Management, Business, Science and Arts Occupations by Sex
Within the Management, Business, Science and Arts occupations in Fall River, the most male-oriented occupations are Arts, Media & Entertainment (80.0%), Computers & Mathematics (67.6%), and Architecture & Engineering (66.5%), while the most female-oriented occupations are Legal Services & Support (85.1%), Health Technologists (81.7%), and Education Instruction & Library (81.4%).
| Occupation | Male | Female |
| Management | 1,649 (53.7%) | 1,421 (46.3%) |
| Business & Financial | 883 (54.3%) | 743 (45.7%) |
| Computers, Engineering & Science | 1,091 (61.2%) | 692 (38.8%) |
| Computers & Mathematics | 588 (67.6%) | 282 (32.4%) |
| Architecture & Engineering | 417 (66.5%) | 210 (33.5%) |
| Life, Physical & Social Science | 86 (30.1%) | 200 (69.9%) |
| Community & Social Service | 1,132 (30.3%) | 2,608 (69.7%) |
| Education, Arts & Media | 385 (31.1%) | 851 (68.9%) |
| Legal Services & Support | 33 (14.9%) | 189 (85.1%) |
| Education Instruction & Library | 337 (18.6%) | 1,474 (81.4%) |
| Arts, Media & Entertainment | 377 (80.0%) | 94 (20.0%) |
| Health Diagnosing & Treating | 446 (21.7%) | 1,611 (78.3%) |
| Health Technologists | 220 (18.3%) | 979 (81.7%) |
| Total (Category) | 5,201 (42.4%) | 7,075 (57.6%) |
| Total (Overall) | 21,910 (51.3%) | 20,810 (48.7%) |
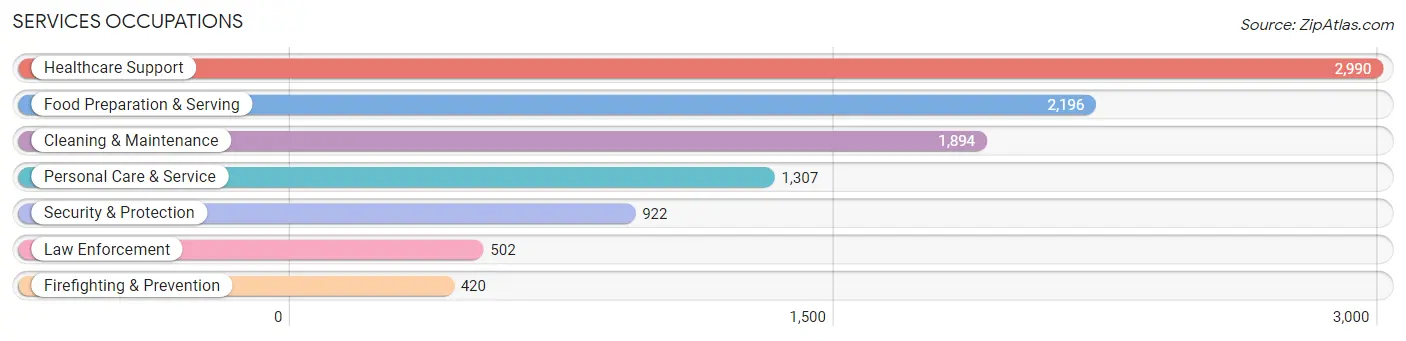
Services Occupations
The most common Services occupations in Fall River are Healthcare Support (2,990 | 7.0%), Food Preparation & Serving (2,196 | 5.1%), Cleaning & Maintenance (1,894 | 4.4%), Personal Care & Service (1,307 | 3.1%), and Security & Protection (922 | 2.2%).
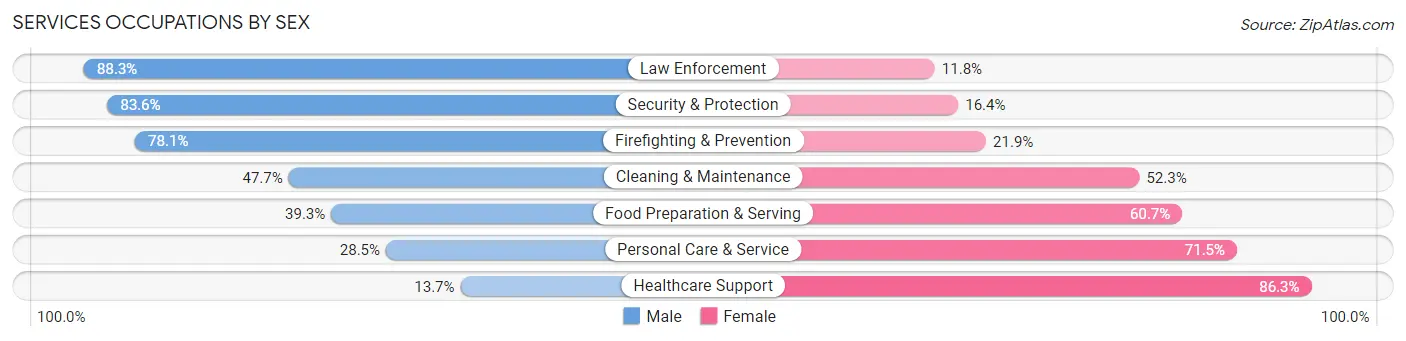
Services Occupations by Sex
Within the Services occupations in Fall River, the most male-oriented occupations are Law Enforcement (88.2%), Security & Protection (83.6%), and Firefighting & Prevention (78.1%), while the most female-oriented occupations are Healthcare Support (86.3%), Personal Care & Service (71.5%), and Food Preparation & Serving (60.7%).
| Occupation | Male | Female |
| Healthcare Support | 410 (13.7%) | 2,580 (86.3%) |
| Security & Protection | 771 (83.6%) | 151 (16.4%) |
| Firefighting & Prevention | 328 (78.1%) | 92 (21.9%) |
| Law Enforcement | 443 (88.2%) | 59 (11.7%) |
| Food Preparation & Serving | 863 (39.3%) | 1,333 (60.7%) |
| Cleaning & Maintenance | 904 (47.7%) | 990 (52.3%) |
| Personal Care & Service | 372 (28.5%) | 935 (71.5%) |
| Total (Category) | 3,320 (35.7%) | 5,989 (64.3%) |
| Total (Overall) | 21,910 (51.3%) | 20,810 (48.7%) |
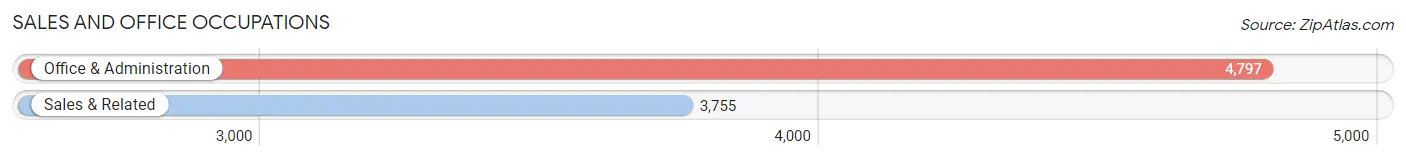
Sales and Office Occupations
The most common Sales and Office occupations in Fall River are Office & Administration (4,797 | 11.2%), and Sales & Related (3,755 | 8.8%).
Sales and Office Occupations by Sex
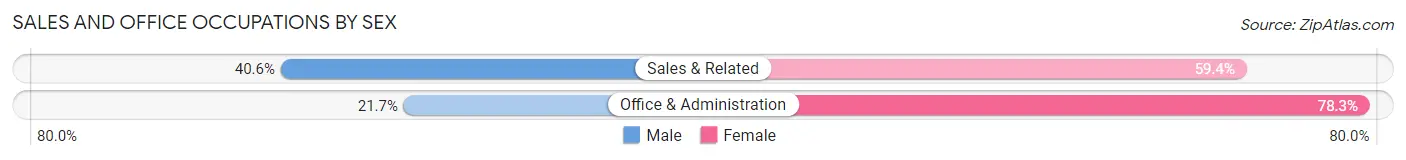
| Occupation | Male | Female |
| Sales & Related | 1,524 (40.6%) | 2,231 (59.4%) |
| Office & Administration | 1,039 (21.7%) | 3,758 (78.3%) |
| Total (Category) | 2,563 (30.0%) | 5,989 (70.0%) |
| Total (Overall) | 21,910 (51.3%) | 20,810 (48.7%) |
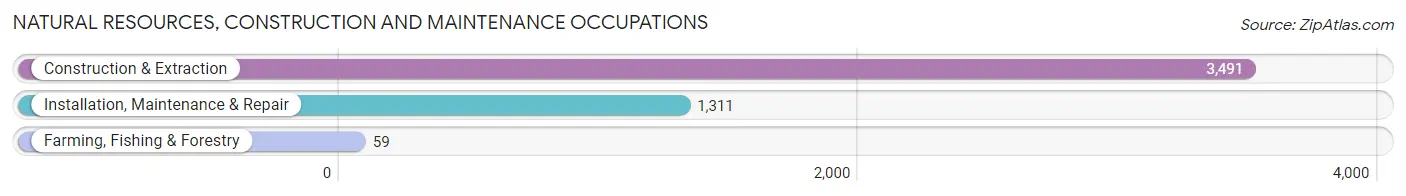
Natural Resources, Construction and Maintenance Occupations
The most common Natural Resources, Construction and Maintenance occupations in Fall River are Construction & Extraction (3,491 | 8.2%), Installation, Maintenance & Repair (1,311 | 3.1%), and Farming, Fishing & Forestry (59 | 0.1%).
Natural Resources, Construction and Maintenance Occupations by Sex
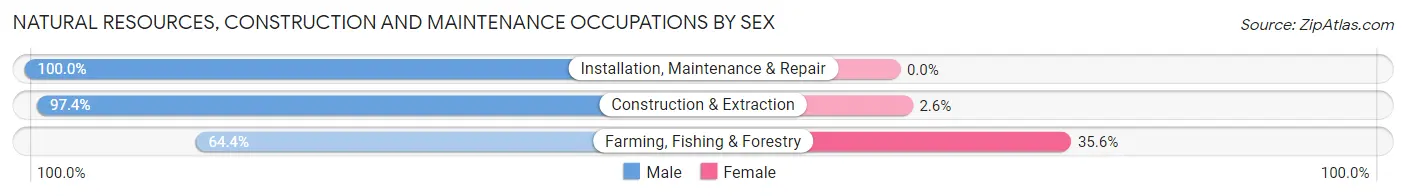
| Occupation | Male | Female |
| Farming, Fishing & Forestry | 38 (64.4%) | 21 (35.6%) |
| Construction & Extraction | 3,400 (97.4%) | 91 (2.6%) |
| Installation, Maintenance & Repair | 1,311 (100.0%) | 0 (0.0%) |
| Total (Category) | 4,749 (97.7%) | 112 (2.3%) |
| Total (Overall) | 21,910 (51.3%) | 20,810 (48.7%) |
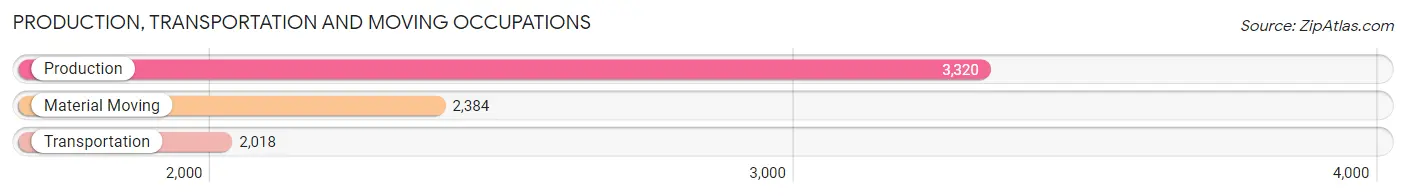
Production, Transportation and Moving Occupations
The most common Production, Transportation and Moving occupations in Fall River are Production (3,320 | 7.8%), Material Moving (2,384 | 5.6%), and Transportation (2,018 | 4.7%).
Production, Transportation and Moving Occupations by Sex
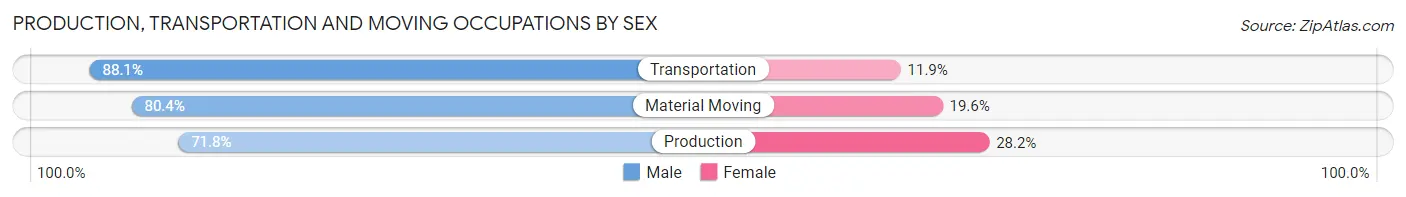
| Occupation | Male | Female |
| Production | 2,384 (71.8%) | 936 (28.2%) |
| Transportation | 1,777 (88.1%) | 241 (11.9%) |
| Material Moving | 1,916 (80.4%) | 468 (19.6%) |
| Total (Category) | 6,077 (78.7%) | 1,645 (21.3%) |
| Total (Overall) | 21,910 (51.3%) | 20,810 (48.7%) |
Employment Industries by Sex in Fall River
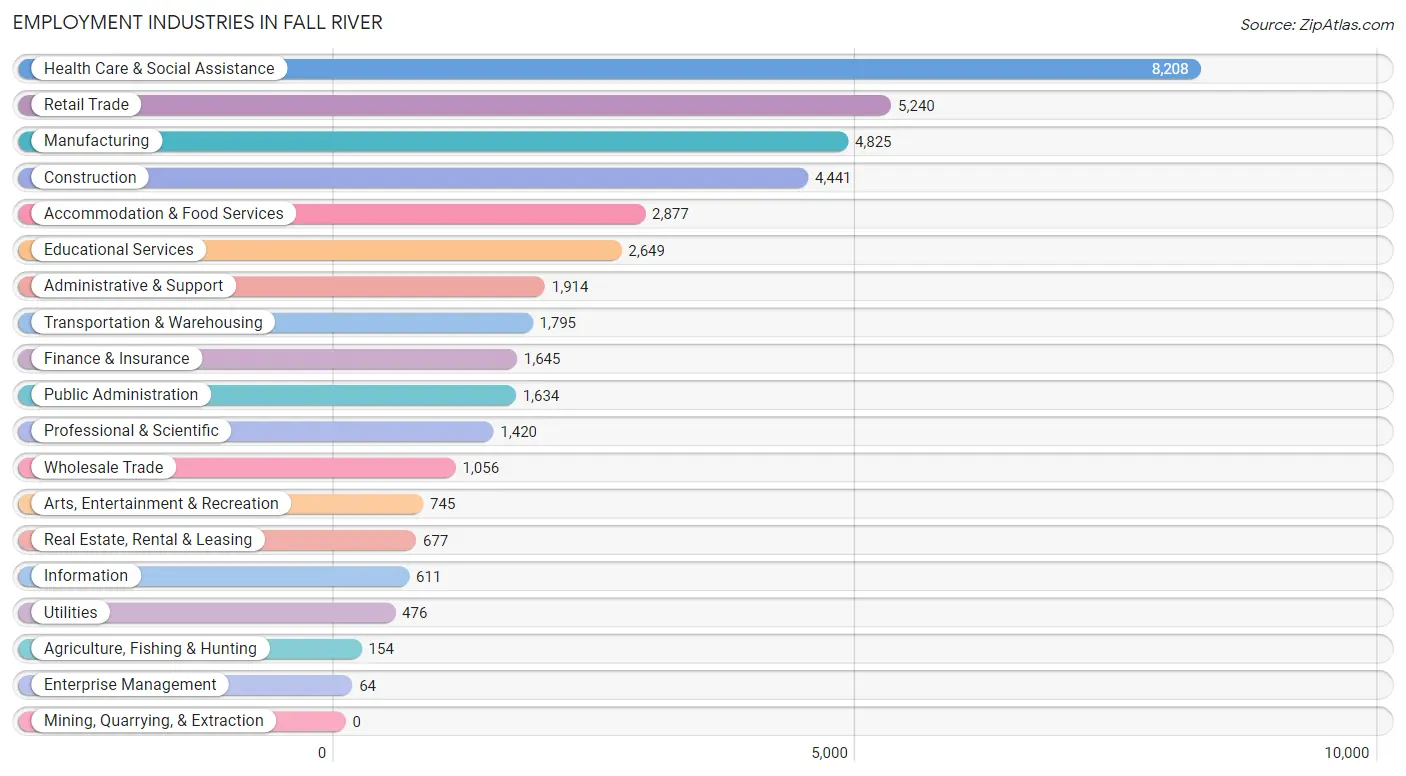
Employment Industries in Fall River
The major employment industries in Fall River include Health Care & Social Assistance (8,208 | 19.2%), Retail Trade (5,240 | 12.3%), Manufacturing (4,825 | 11.3%), Construction (4,441 | 10.4%), and Accommodation & Food Services (2,877 | 6.7%).
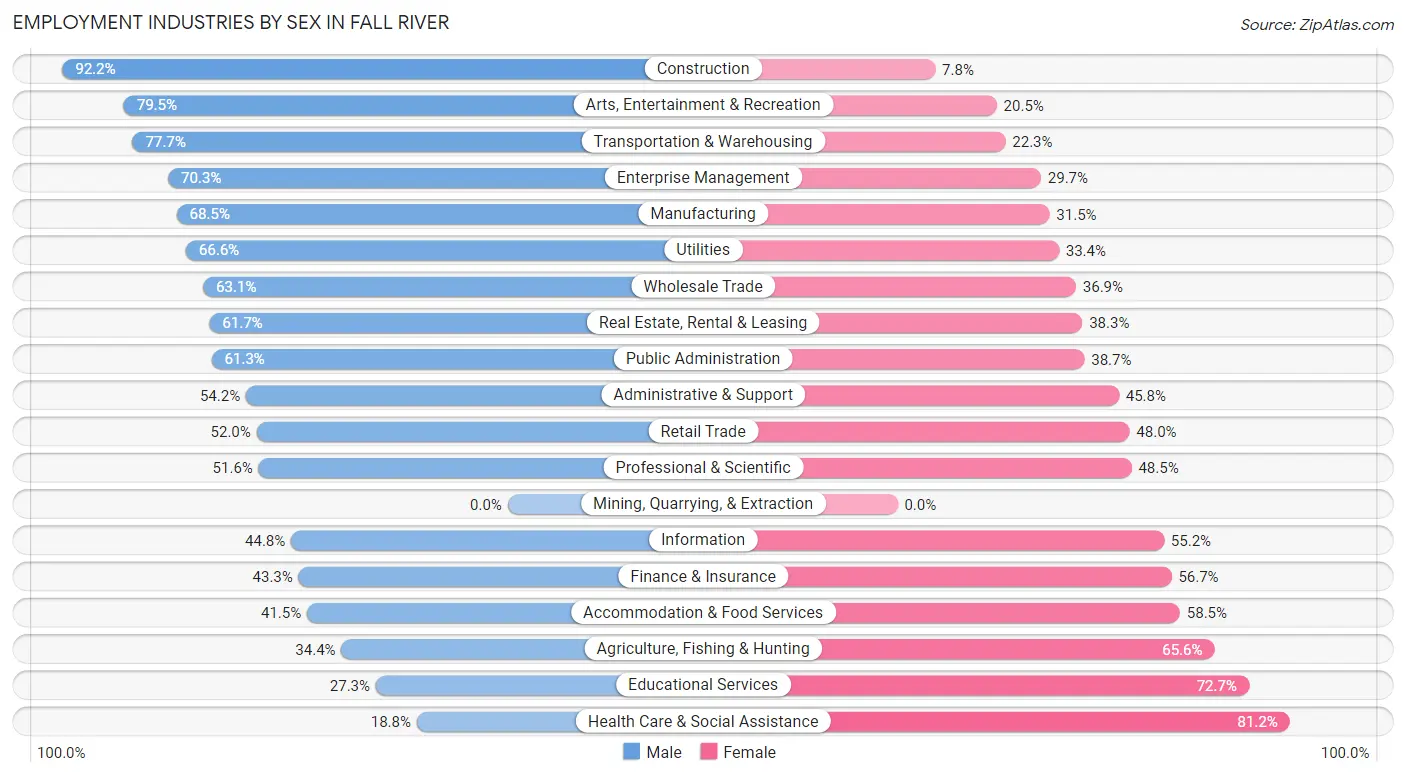
Employment Industries by Sex in Fall River
The Fall River industries that see more men than women are Construction (92.2%), Arts, Entertainment & Recreation (79.5%), and Transportation & Warehousing (77.7%), whereas the industries that tend to have a higher number of women are Health Care & Social Assistance (81.2%), Educational Services (72.7%), and Agriculture, Fishing & Hunting (65.6%).
| Industry | Male | Female |
| Agriculture, Fishing & Hunting | 53 (34.4%) | 101 (65.6%) |
| Mining, Quarrying, & Extraction | 0 (0.0%) | 0 (0.0%) |
| Construction | 4,094 (92.2%) | 347 (7.8%) |
| Manufacturing | 3,307 (68.5%) | 1,518 (31.5%) |
| Wholesale Trade | 666 (63.1%) | 390 (36.9%) |
| Retail Trade | 2,724 (52.0%) | 2,516 (48.0%) |
| Transportation & Warehousing | 1,394 (77.7%) | 401 (22.3%) |
| Utilities | 317 (66.6%) | 159 (33.4%) |
| Information | 274 (44.8%) | 337 (55.2%) |
| Finance & Insurance | 712 (43.3%) | 933 (56.7%) |
| Real Estate, Rental & Leasing | 418 (61.7%) | 259 (38.3%) |
| Professional & Scientific | 732 (51.5%) | 688 (48.4%) |
| Enterprise Management | 45 (70.3%) | 19 (29.7%) |
| Administrative & Support | 1,037 (54.2%) | 877 (45.8%) |
| Educational Services | 723 (27.3%) | 1,926 (72.7%) |
| Health Care & Social Assistance | 1,545 (18.8%) | 6,663 (81.2%) |
| Arts, Entertainment & Recreation | 592 (79.5%) | 153 (20.5%) |
| Accommodation & Food Services | 1,195 (41.5%) | 1,682 (58.5%) |
| Public Administration | 1,002 (61.3%) | 632 (38.7%) |
| Total | 21,910 (51.3%) | 20,810 (48.7%) |
Education in Fall River
School Enrollment in Fall River
The most common levels of schooling among the 19,339 students in Fall River are middle school (4,933 | 25.5%), high school (4,553 | 23.5%), and elementary school (3,721 | 19.2%).
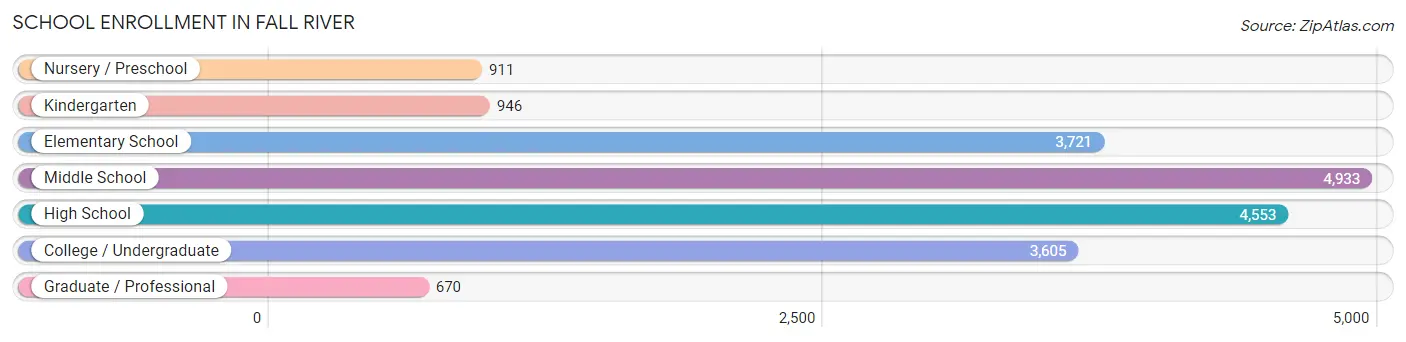
| School Level | # Students | % Students |
| Nursery / Preschool | 911 | 4.7% |
| Kindergarten | 946 | 4.9% |
| Elementary School | 3,721 | 19.2% |
| Middle School | 4,933 | 25.5% |
| High School | 4,553 | 23.5% |
| College / Undergraduate | 3,605 | 18.6% |
| Graduate / Professional | 670 | 3.5% |
| Total | 19,339 | 100.0% |
School Enrollment by Age by Funding Source in Fall River
Out of a total of 19,339 students who are enrolled in schools in Fall River, 2,456 (12.7%) attend a private institution, while the remaining 16,883 (87.3%) are enrolled in public schools. The age group of 3 to 4 year olds has the highest likelihood of being enrolled in private schools, with 247 (38.2% in the age bracket) enrolled. Conversely, the age group of 10 to 14 year olds has the lowest likelihood of being enrolled in a private school, with 5,513 (94.1% in the age bracket) attending a public institution.
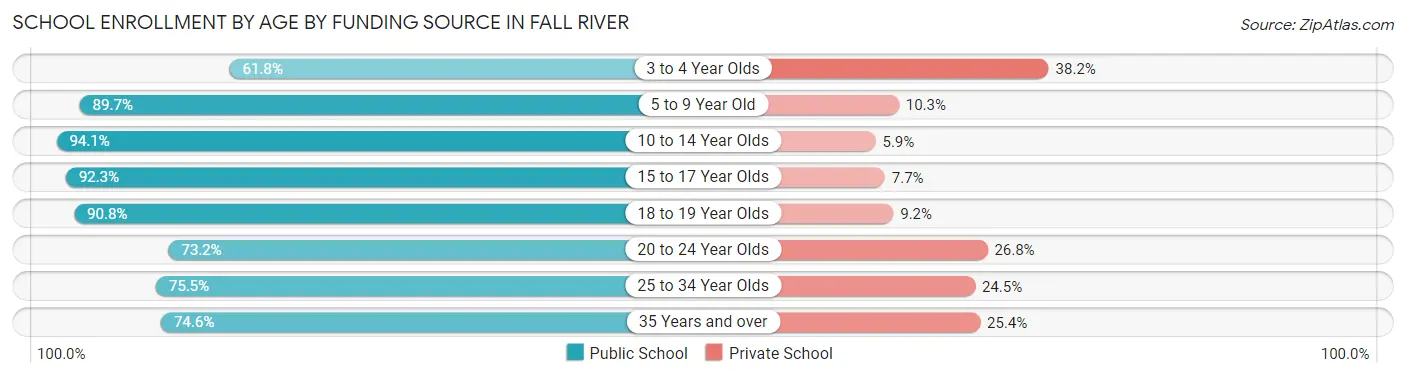
| Age Bracket | Public School | Private School |
| 3 to 4 Year Olds | 400 (61.8%) | 247 (38.2%) |
| 5 to 9 Year Old | 3,961 (89.7%) | 453 (10.3%) |
| 10 to 14 Year Olds | 5,513 (94.1%) | 348 (5.9%) |
| 15 to 17 Year Olds | 2,828 (92.3%) | 235 (7.7%) |
| 18 to 19 Year Olds | 1,080 (90.8%) | 110 (9.2%) |
| 20 to 24 Year Olds | 1,050 (73.2%) | 384 (26.8%) |
| 25 to 34 Year Olds | 1,319 (75.5%) | 427 (24.5%) |
| 35 Years and over | 734 (74.6%) | 250 (25.4%) |
| Total | 16,883 (87.3%) | 2,456 (12.7%) |
Educational Attainment by Field of Study in Fall River
Business (2,208 | 19.2%), psychology (1,303 | 11.3%), education (1,187 | 10.3%), science & technology (1,141 | 9.9%), and arts & humanities (1,018 | 8.8%) are the most common fields of study among 11,509 individuals in Fall River who have obtained a bachelor's degree or higher.
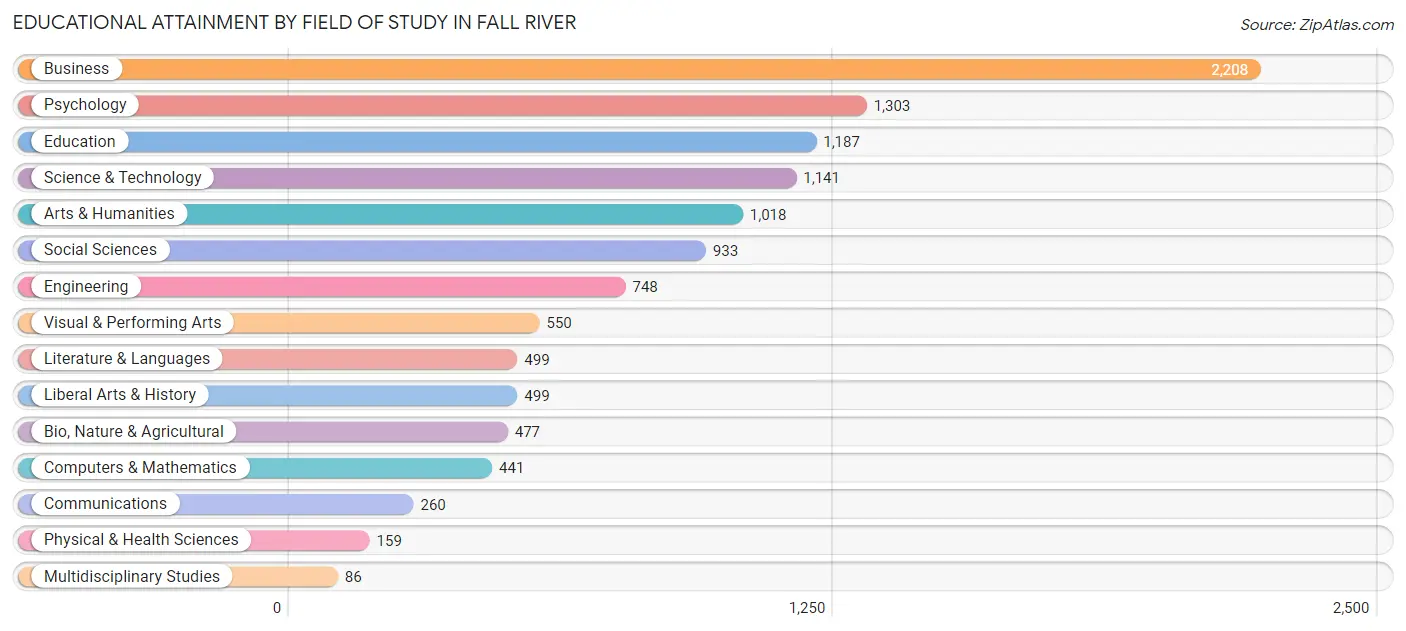
| Field of Study | # Graduates | % Graduates |
| Computers & Mathematics | 441 | 3.8% |
| Bio, Nature & Agricultural | 477 | 4.1% |
| Physical & Health Sciences | 159 | 1.4% |
| Psychology | 1,303 | 11.3% |
| Social Sciences | 933 | 8.1% |
| Engineering | 748 | 6.5% |
| Multidisciplinary Studies | 86 | 0.7% |
| Science & Technology | 1,141 | 9.9% |
| Business | 2,208 | 19.2% |
| Education | 1,187 | 10.3% |
| Literature & Languages | 499 | 4.3% |
| Liberal Arts & History | 499 | 4.3% |
| Visual & Performing Arts | 550 | 4.8% |
| Communications | 260 | 2.3% |
| Arts & Humanities | 1,018 | 8.8% |
| Total | 11,509 | 100.0% |
Transportation & Commute in Fall River
Vehicle Availability by Sex in Fall River
The most prevalent vehicle ownership categories in Fall River are males with 2 vehicles (7,965, accounting for 37.3%) and females with 2 vehicles (7,897, making up 39.5%).
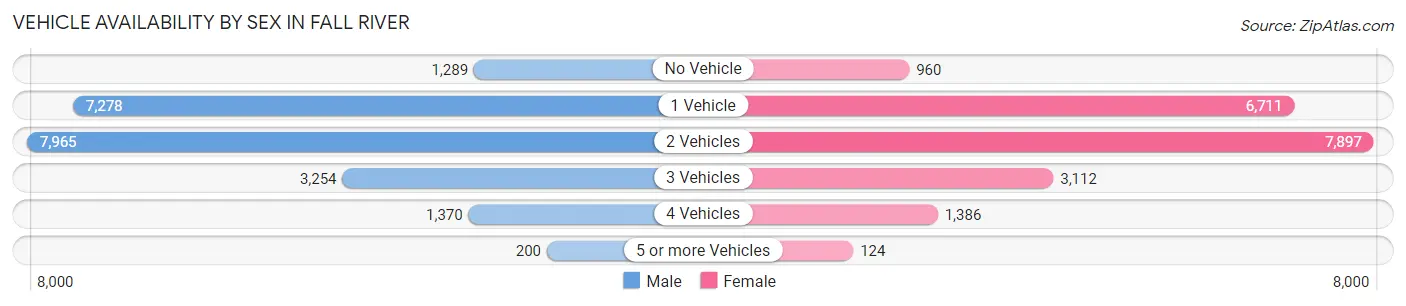
| Vehicles Available | Male | Female |
| No Vehicle | 1,289 (6.0%) | 960 (4.8%) |
| 1 Vehicle | 7,278 (34.1%) | 6,711 (33.2%) |
| 2 Vehicles | 7,965 (37.3%) | 7,897 (39.1%) |
| 3 Vehicles | 3,254 (15.2%) | 3,112 (15.4%) |
| 4 Vehicles | 1,370 (6.4%) | 1,386 (6.9%) |
| 5 or more Vehicles | 200 (0.9%) | 124 (0.6%) |
| Total | 21,356 (100.0%) | 20,190 (100.0%) |
Commute Time in Fall River
The most frequently occuring commute durations in Fall River are 10 to 14 minutes (7,524 commuters, 19.2%), 15 to 19 minutes (6,200 commuters, 15.8%), and 5 to 9 minutes (4,316 commuters, 11.0%).
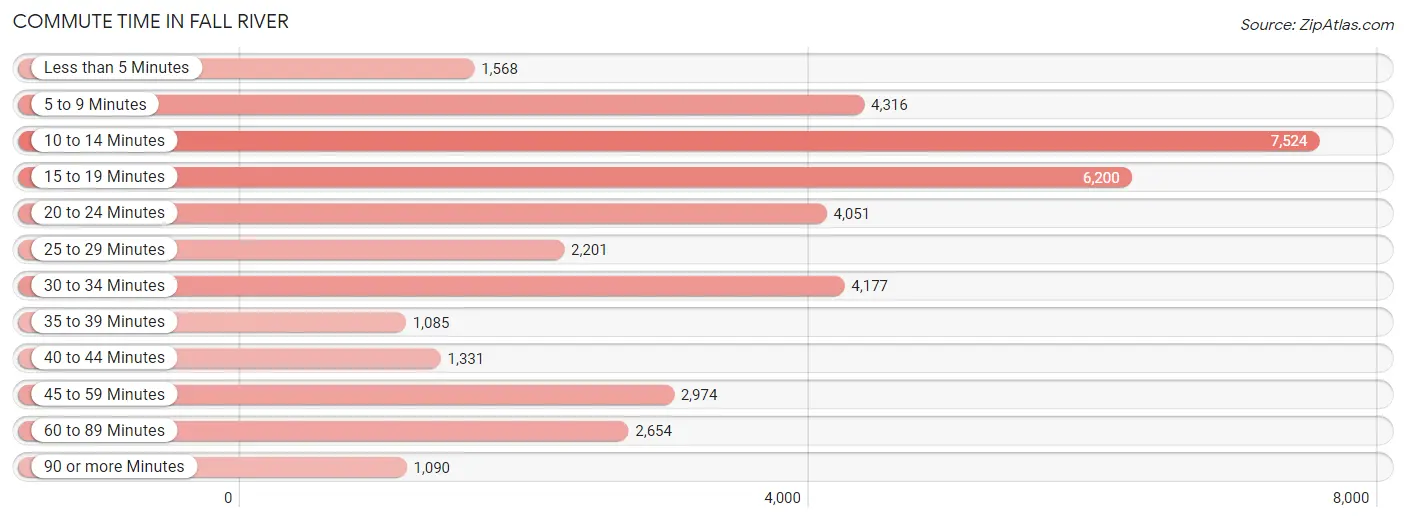
| Commute Time | # Commuters | % Commuters |
| Less than 5 Minutes | 1,568 | 4.0% |
| 5 to 9 Minutes | 4,316 | 11.0% |
| 10 to 14 Minutes | 7,524 | 19.2% |
| 15 to 19 Minutes | 6,200 | 15.8% |
| 20 to 24 Minutes | 4,051 | 10.3% |
| 25 to 29 Minutes | 2,201 | 5.6% |
| 30 to 34 Minutes | 4,177 | 10.7% |
| 35 to 39 Minutes | 1,085 | 2.8% |
| 40 to 44 Minutes | 1,331 | 3.4% |
| 45 to 59 Minutes | 2,974 | 7.6% |
| 60 to 89 Minutes | 2,654 | 6.8% |
| 90 or more Minutes | 1,090 | 2.8% |
Commute Time by Sex in Fall River
The most common commute times in Fall River are 10 to 14 minutes (3,018 commuters, 14.9%) for males and 10 to 14 minutes (4,506 commuters, 23.8%) for females.
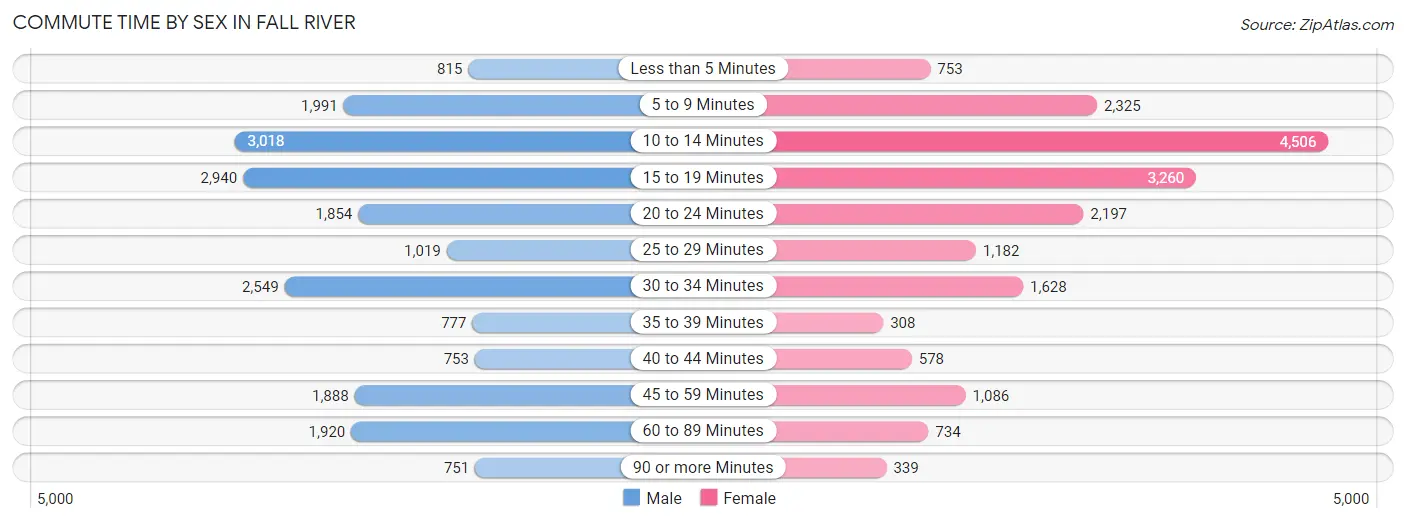
| Commute Time | Male | Female |
| Less than 5 Minutes | 815 (4.0%) | 753 (4.0%) |
| 5 to 9 Minutes | 1,991 (9.8%) | 2,325 (12.3%) |
| 10 to 14 Minutes | 3,018 (14.9%) | 4,506 (23.8%) |
| 15 to 19 Minutes | 2,940 (14.5%) | 3,260 (17.2%) |
| 20 to 24 Minutes | 1,854 (9.1%) | 2,197 (11.6%) |
| 25 to 29 Minutes | 1,019 (5.0%) | 1,182 (6.3%) |
| 30 to 34 Minutes | 2,549 (12.6%) | 1,628 (8.6%) |
| 35 to 39 Minutes | 777 (3.8%) | 308 (1.6%) |
| 40 to 44 Minutes | 753 (3.7%) | 578 (3.1%) |
| 45 to 59 Minutes | 1,888 (9.3%) | 1,086 (5.8%) |
| 60 to 89 Minutes | 1,920 (9.5%) | 734 (3.9%) |
| 90 or more Minutes | 751 (3.7%) | 339 (1.8%) |
Time of Departure to Work by Sex in Fall River
The most frequent times of departure to work in Fall River are 7:00 AM to 7:29 AM (2,283, 11.3%) for males and 7:00 AM to 7:29 AM (2,566, 13.6%) for females.
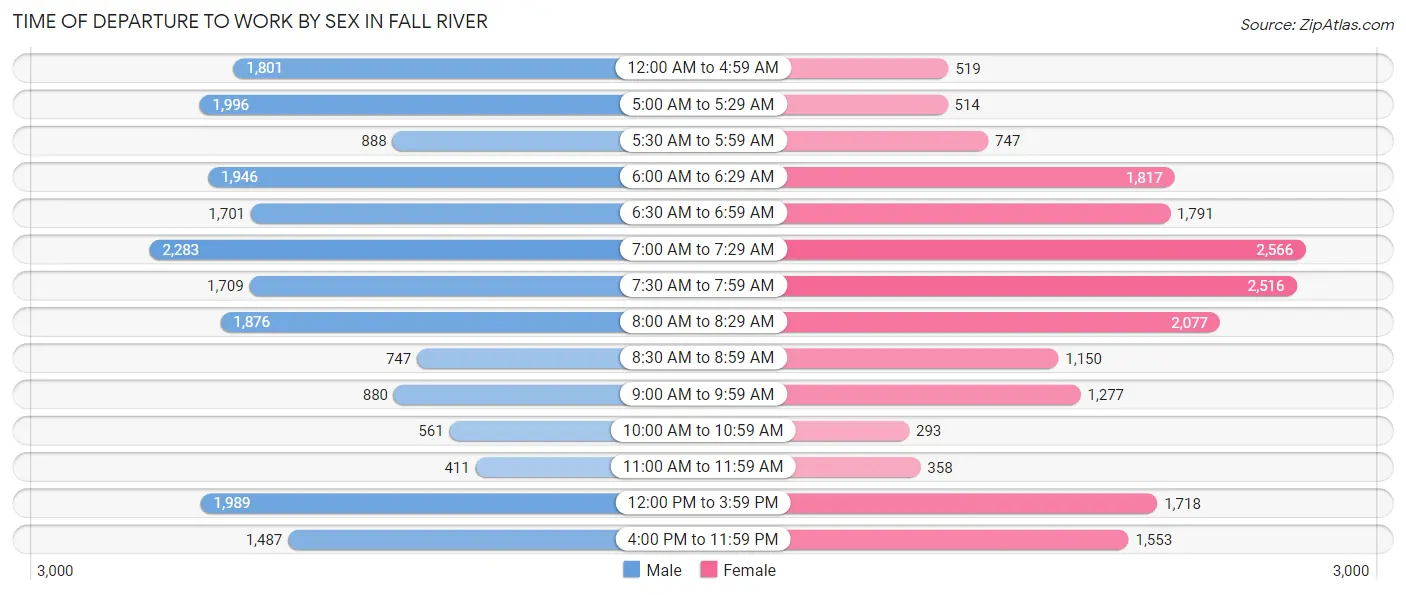
| Time of Departure | Male | Female |
| 12:00 AM to 4:59 AM | 1,801 (8.9%) | 519 (2.8%) |
| 5:00 AM to 5:29 AM | 1,996 (9.8%) | 514 (2.7%) |
| 5:30 AM to 5:59 AM | 888 (4.4%) | 747 (4.0%) |
| 6:00 AM to 6:29 AM | 1,946 (9.6%) | 1,817 (9.6%) |
| 6:30 AM to 6:59 AM | 1,701 (8.4%) | 1,791 (9.5%) |
| 7:00 AM to 7:29 AM | 2,283 (11.3%) | 2,566 (13.6%) |
| 7:30 AM to 7:59 AM | 1,709 (8.4%) | 2,516 (13.3%) |
| 8:00 AM to 8:29 AM | 1,876 (9.2%) | 2,077 (11.0%) |
| 8:30 AM to 8:59 AM | 747 (3.7%) | 1,150 (6.1%) |
| 9:00 AM to 9:59 AM | 880 (4.3%) | 1,277 (6.8%) |
| 10:00 AM to 10:59 AM | 561 (2.8%) | 293 (1.5%) |
| 11:00 AM to 11:59 AM | 411 (2.0%) | 358 (1.9%) |
| 12:00 PM to 3:59 PM | 1,989 (9.8%) | 1,718 (9.1%) |
| 4:00 PM to 11:59 PM | 1,487 (7.3%) | 1,553 (8.2%) |
| Total | 20,275 (100.0%) | 18,896 (100.0%) |
Housing Occupancy in Fall River
Occupancy by Ownership in Fall River
Of the total 41,113 dwellings in Fall River, owner-occupied units account for 14,755 (35.9%), while renter-occupied units make up 26,358 (64.1%).
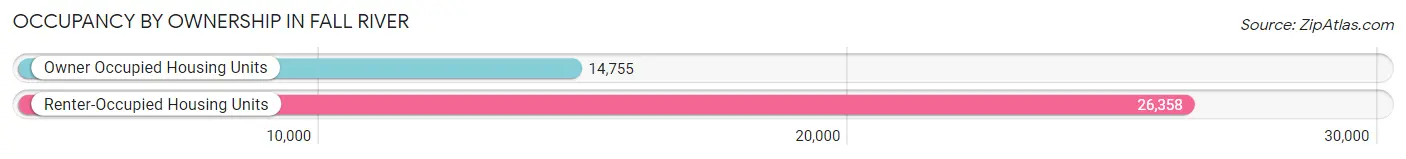
| Occupancy | # Housing Units | % Housing Units |
| Owner Occupied Housing Units | 14,755 | 35.9% |
| Renter-Occupied Housing Units | 26,358 | 64.1% |
| Total Occupied Housing Units | 41,113 | 100.0% |
Occupancy by Household Size in Fall River
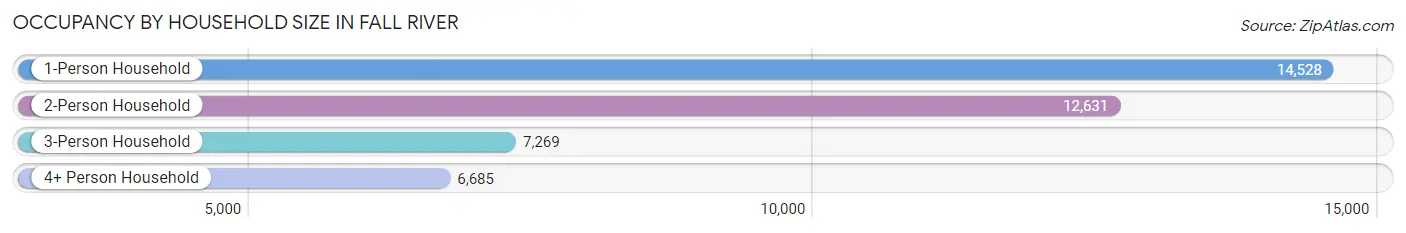
| Household Size | # Housing Units | % Housing Units |
| 1-Person Household | 14,528 | 35.3% |
| 2-Person Household | 12,631 | 30.7% |
| 3-Person Household | 7,269 | 17.7% |
| 4+ Person Household | 6,685 | 16.3% |
| Total Housing Units | 41,113 | 100.0% |
Occupancy by Ownership by Household Size in Fall River
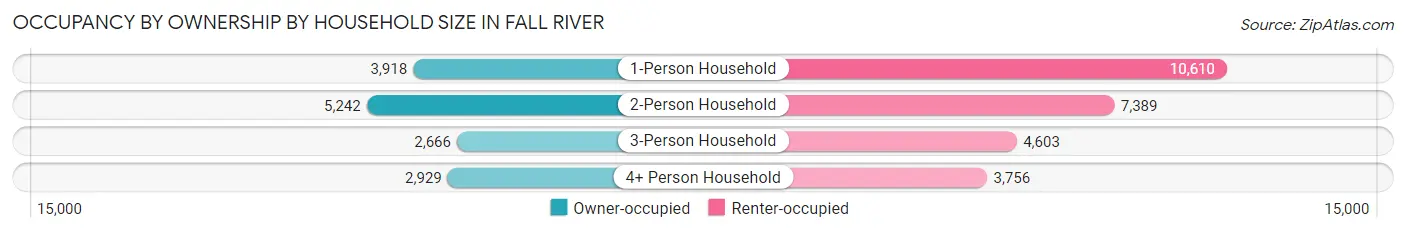
| Household Size | Owner-occupied | Renter-occupied |
| 1-Person Household | 3,918 (27.0%) | 10,610 (73.0%) |
| 2-Person Household | 5,242 (41.5%) | 7,389 (58.5%) |
| 3-Person Household | 2,666 (36.7%) | 4,603 (63.3%) |
| 4+ Person Household | 2,929 (43.8%) | 3,756 (56.2%) |
| Total Housing Units | 14,755 (35.9%) | 26,358 (64.1%) |
Occupancy by Educational Attainment in Fall River
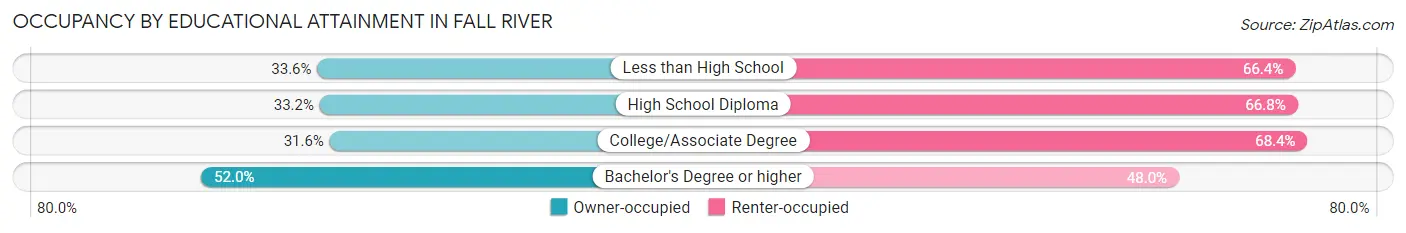
| Household Size | Owner-occupied | Renter-occupied |
| Less than High School | 3,167 (33.6%) | 6,269 (66.4%) |
| High School Diploma | 4,229 (33.2%) | 8,518 (66.8%) |
| College/Associate Degree | 3,850 (31.6%) | 8,331 (68.4%) |
| Bachelor's Degree or higher | 3,509 (52.0%) | 3,240 (48.0%) |
Occupancy by Age of Householder in Fall River
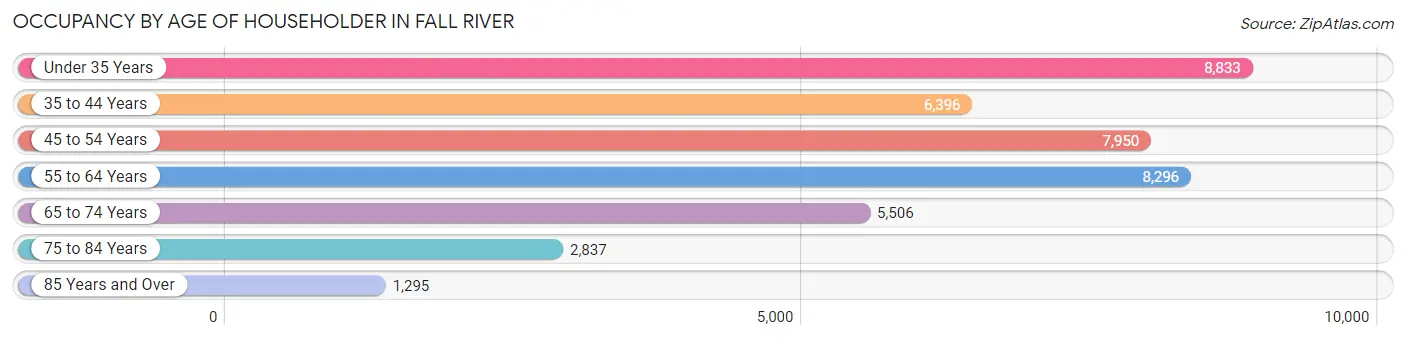
| Age Bracket | # Households | % Households |
| Under 35 Years | 8,833 | 21.5% |
| 35 to 44 Years | 6,396 | 15.6% |
| 45 to 54 Years | 7,950 | 19.3% |
| 55 to 64 Years | 8,296 | 20.2% |
| 65 to 74 Years | 5,506 | 13.4% |
| 75 to 84 Years | 2,837 | 6.9% |
| 85 Years and Over | 1,295 | 3.2% |
| Total | 41,113 | 100.0% |
Housing Finances in Fall River
Median Income by Occupancy in Fall River
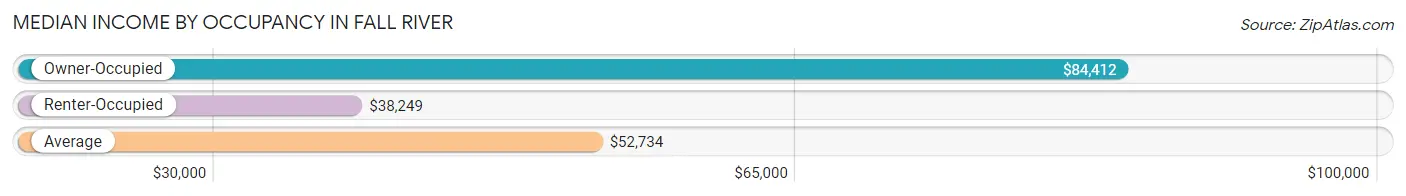
| Occupancy Type | # Households | Median Income |
| Owner-Occupied | 14,755 (35.9%) | $84,412 |
| Renter-Occupied | 26,358 (64.1%) | $38,249 |
| Average | 41,113 (100.0%) | $52,734 |
Occupancy by Householder Income Bracket in Fall River
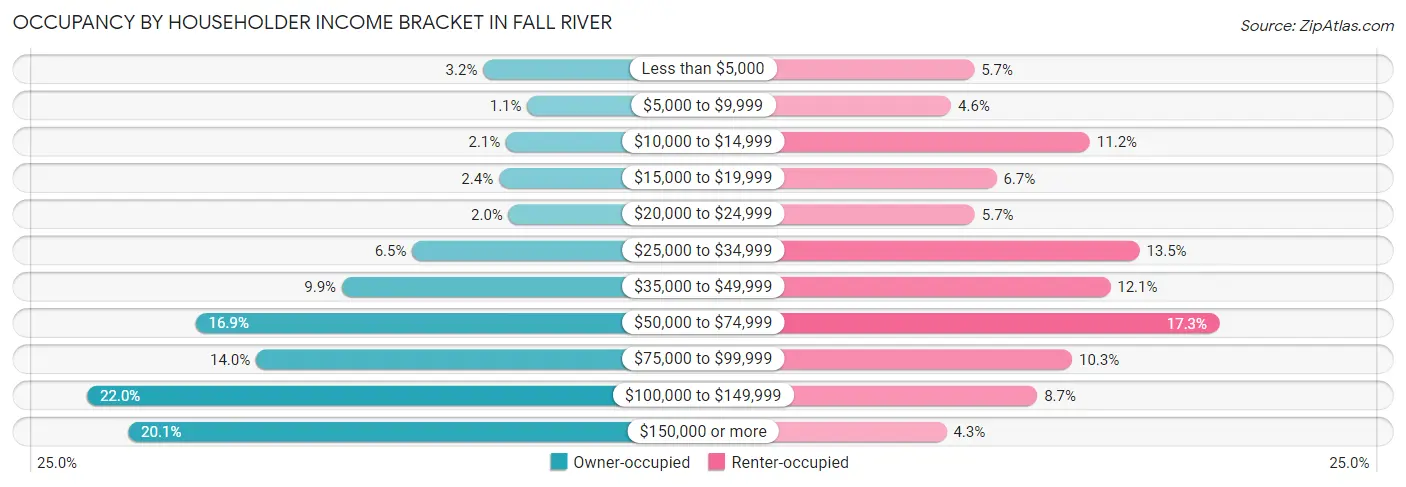
| Income Bracket | Owner-occupied | Renter-occupied |
| Less than $5,000 | 466 (3.2%) | 1,489 (5.7%) |
| $5,000 to $9,999 | 156 (1.1%) | 1,199 (4.5%) |
| $10,000 to $14,999 | 306 (2.1%) | 2,942 (11.2%) |
| $15,000 to $19,999 | 355 (2.4%) | 1,769 (6.7%) |
| $20,000 to $24,999 | 287 (1.9%) | 1,498 (5.7%) |
| $25,000 to $34,999 | 965 (6.5%) | 3,564 (13.5%) |
| $35,000 to $49,999 | 1,459 (9.9%) | 3,198 (12.1%) |
| $50,000 to $74,999 | 2,487 (16.9%) | 4,560 (17.3%) |
| $75,000 to $99,999 | 2,063 (14.0%) | 2,717 (10.3%) |
| $100,000 to $149,999 | 3,250 (22.0%) | 2,281 (8.6%) |
| $150,000 or more | 2,961 (20.1%) | 1,141 (4.3%) |
| Total | 14,755 (100.0%) | 26,358 (100.0%) |
Monthly Housing Cost Tiers in Fall River
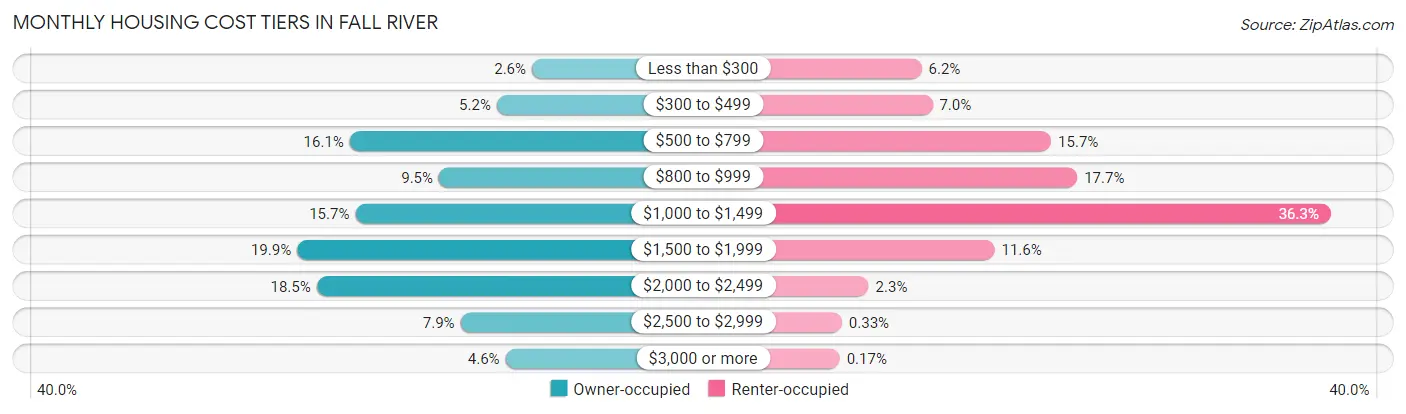
| Monthly Cost | Owner-occupied | Renter-occupied |
| Less than $300 | 389 (2.6%) | 1,634 (6.2%) |
| $300 to $499 | 772 (5.2%) | 1,844 (7.0%) |
| $500 to $799 | 2,370 (16.1%) | 4,148 (15.7%) |
| $800 to $999 | 1,400 (9.5%) | 4,655 (17.7%) |
| $1,000 to $1,499 | 2,309 (15.7%) | 9,577 (36.3%) |
| $1,500 to $1,999 | 2,942 (19.9%) | 3,050 (11.6%) |
| $2,000 to $2,499 | 2,730 (18.5%) | 605 (2.3%) |
| $2,500 to $2,999 | 1,166 (7.9%) | 86 (0.3%) |
| $3,000 or more | 677 (4.6%) | 45 (0.2%) |
| Total | 14,755 (100.0%) | 26,358 (100.0%) |
Physical Housing Characteristics in Fall River
Housing Structures in Fall River
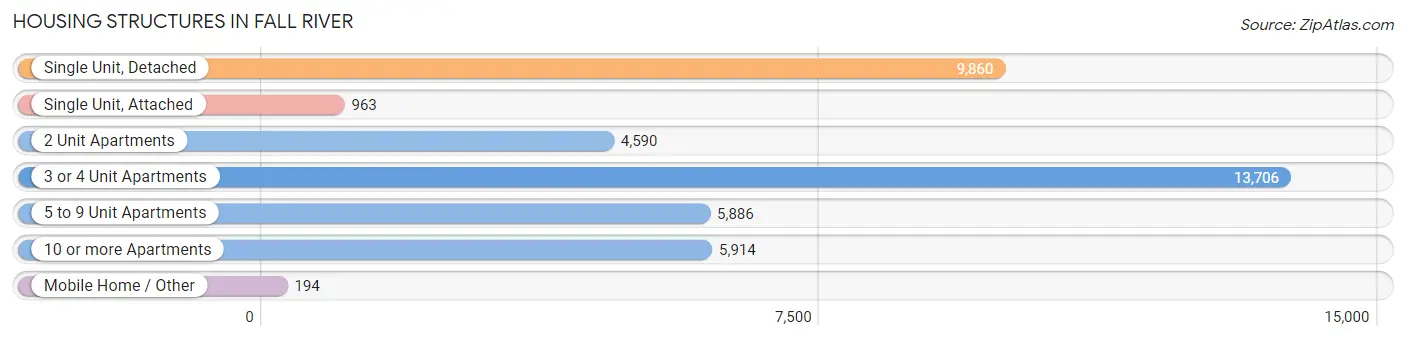
| Structure Type | # Housing Units | % Housing Units |
| Single Unit, Detached | 9,860 | 24.0% |
| Single Unit, Attached | 963 | 2.3% |
| 2 Unit Apartments | 4,590 | 11.2% |
| 3 or 4 Unit Apartments | 13,706 | 33.3% |
| 5 to 9 Unit Apartments | 5,886 | 14.3% |
| 10 or more Apartments | 5,914 | 14.4% |
| Mobile Home / Other | 194 | 0.5% |
| Total | 41,113 | 100.0% |
Housing Structures by Occupancy in Fall River
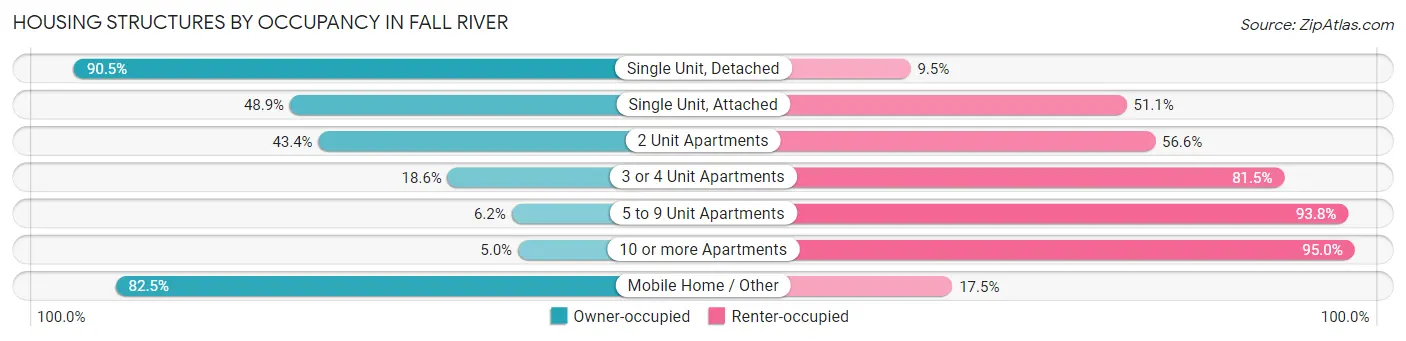
| Structure Type | Owner-occupied | Renter-occupied |
| Single Unit, Detached | 8,924 (90.5%) | 936 (9.5%) |
| Single Unit, Attached | 471 (48.9%) | 492 (51.1%) |
| 2 Unit Apartments | 1,993 (43.4%) | 2,597 (56.6%) |
| 3 or 4 Unit Apartments | 2,543 (18.5%) | 11,163 (81.5%) |
| 5 to 9 Unit Apartments | 367 (6.2%) | 5,519 (93.8%) |
| 10 or more Apartments | 297 (5.0%) | 5,617 (95.0%) |
| Mobile Home / Other | 160 (82.5%) | 34 (17.5%) |
| Total | 14,755 (35.9%) | 26,358 (64.1%) |
Housing Structures by Number of Rooms in Fall River
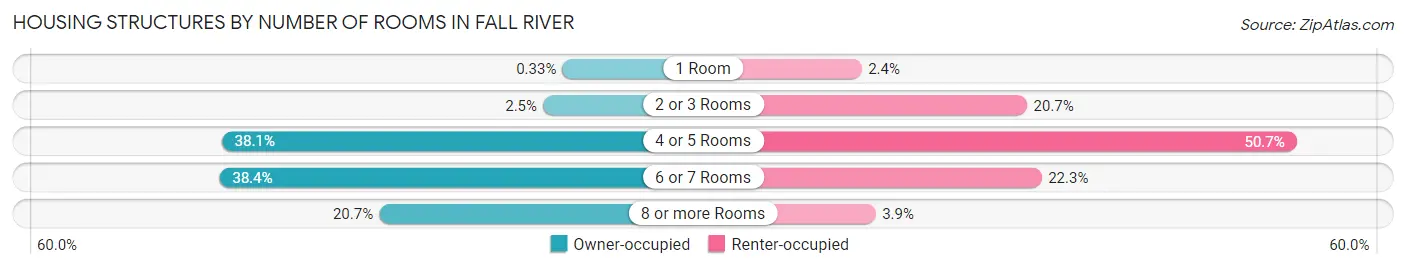
| Number of Rooms | Owner-occupied | Renter-occupied |
| 1 Room | 48 (0.3%) | 621 (2.4%) |
| 2 or 3 Rooms | 366 (2.5%) | 5,459 (20.7%) |
| 4 or 5 Rooms | 5,626 (38.1%) | 13,355 (50.7%) |
| 6 or 7 Rooms | 5,665 (38.4%) | 5,889 (22.3%) |
| 8 or more Rooms | 3,050 (20.7%) | 1,034 (3.9%) |
| Total | 14,755 (100.0%) | 26,358 (100.0%) |
Housing Structure by Heating Type in Fall River
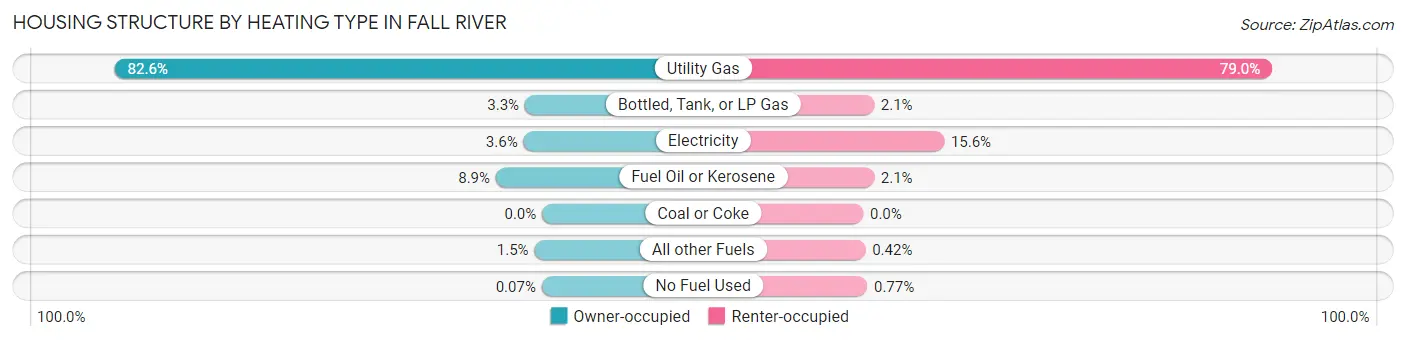
| Heating Type | Owner-occupied | Renter-occupied |
| Utility Gas | 12,186 (82.6%) | 20,832 (79.0%) |
| Bottled, Tank, or LP Gas | 490 (3.3%) | 548 (2.1%) |
| Electricity | 531 (3.6%) | 4,119 (15.6%) |
| Fuel Oil or Kerosene | 1,317 (8.9%) | 547 (2.1%) |
| Coal or Coke | 0 (0.0%) | 0 (0.0%) |
| All other Fuels | 220 (1.5%) | 110 (0.4%) |
| No Fuel Used | 11 (0.1%) | 202 (0.8%) |
| Total | 14,755 (100.0%) | 26,358 (100.0%) |
Household Vehicle Usage in Fall River
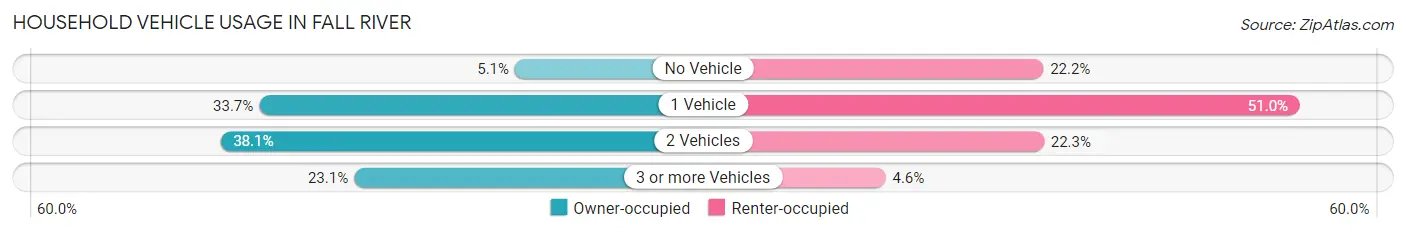
| Vehicles per Household | Owner-occupied | Renter-occupied |
| No Vehicle | 750 (5.1%) | 5,854 (22.2%) |
| 1 Vehicle | 4,977 (33.7%) | 13,431 (51.0%) |
| 2 Vehicles | 5,619 (38.1%) | 5,873 (22.3%) |
| 3 or more Vehicles | 3,409 (23.1%) | 1,200 (4.5%) |
| Total | 14,755 (100.0%) | 26,358 (100.0%) |
Real Estate & Mortgages in Fall River
Real Estate and Mortgage Overview in Fall River
| Characteristic | Without Mortgage | With Mortgage |
| Housing Units | 5,322 | 9,433 |
| Median Property Value | $316,700 | $333,300 |
| Median Household Income | $59,968 | $2,292 |
| Monthly Housing Costs | $738 | $677 |
| Real Estate Taxes | $3,595 | $229 |
Property Value by Mortgage Status in Fall River
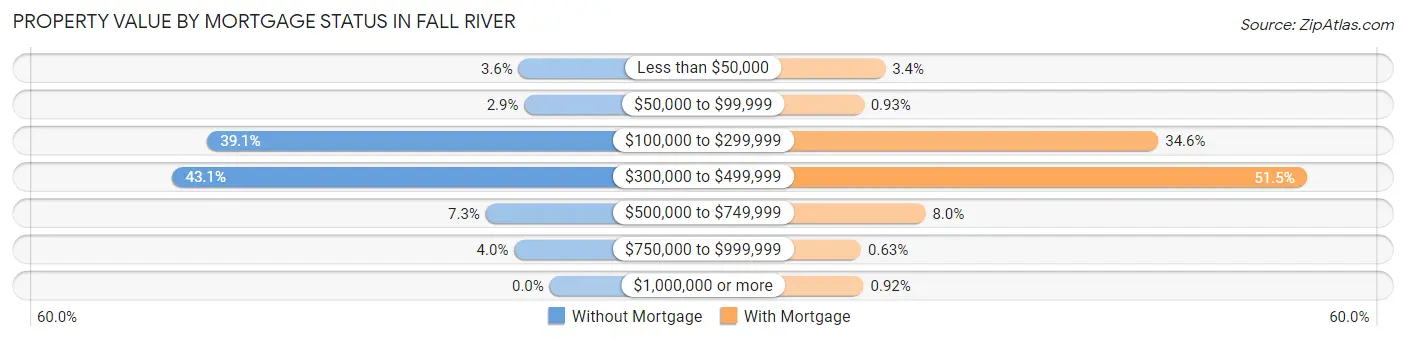
| Property Value | Without Mortgage | With Mortgage |
| Less than $50,000 | 189 (3.5%) | 320 (3.4%) |
| $50,000 to $99,999 | 154 (2.9%) | 88 (0.9%) |
| $100,000 to $299,999 | 2,082 (39.1%) | 3,264 (34.6%) |
| $300,000 to $499,999 | 2,293 (43.1%) | 4,861 (51.5%) |
| $500,000 to $749,999 | 389 (7.3%) | 754 (8.0%) |
| $750,000 to $999,999 | 215 (4.0%) | 59 (0.6%) |
| $1,000,000 or more | 0 (0.0%) | 87 (0.9%) |
| Total | 5,322 (100.0%) | 9,433 (100.0%) |
Household Income by Mortgage Status in Fall River
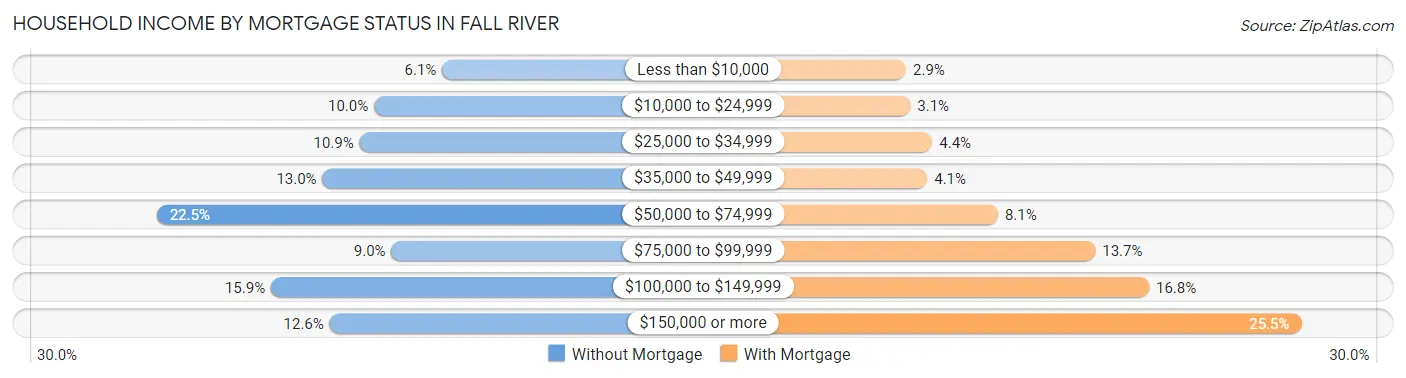
| Household Income | Without Mortgage | With Mortgage |
| Less than $10,000 | 327 (6.1%) | 273 (2.9%) |
| $10,000 to $24,999 | 534 (10.0%) | 295 (3.1%) |
| $25,000 to $34,999 | 578 (10.9%) | 414 (4.4%) |
| $35,000 to $49,999 | 691 (13.0%) | 387 (4.1%) |
| $50,000 to $74,999 | 1,195 (22.5%) | 768 (8.1%) |
| $75,000 to $99,999 | 481 (9.0%) | 1,292 (13.7%) |
| $100,000 to $149,999 | 847 (15.9%) | 1,582 (16.8%) |
| $150,000 or more | 669 (12.6%) | 2,403 (25.5%) |
| Total | 5,322 (100.0%) | 9,433 (100.0%) |
Property Value to Household Income Ratio in Fall River
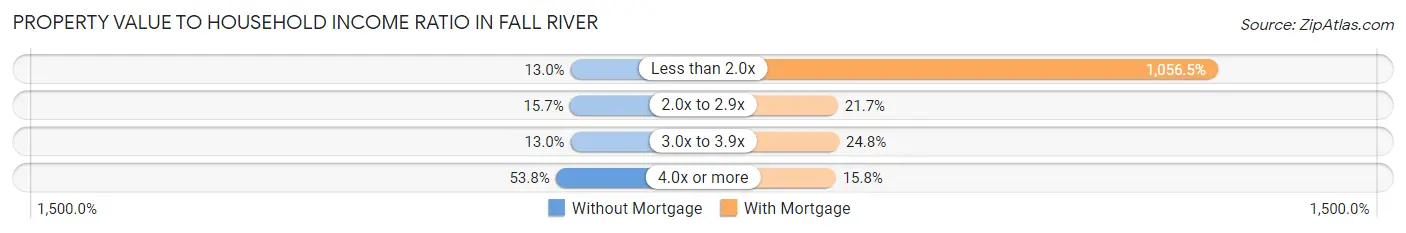
| Value-to-Income Ratio | Without Mortgage | With Mortgage |
| Less than 2.0x | 693 (13.0%) | 99,658 (1,056.5%) |
| 2.0x to 2.9x | 835 (15.7%) | 2,050 (21.7%) |
| 3.0x to 3.9x | 694 (13.0%) | 2,336 (24.8%) |
| 4.0x or more | 2,862 (53.8%) | 1,490 (15.8%) |
| Total | 5,322 (100.0%) | 9,433 (100.0%) |
Real Estate Taxes by Mortgage Status in Fall River
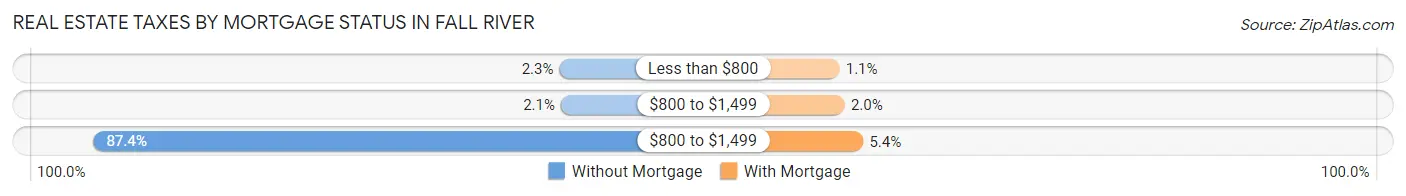
| Property Taxes | Without Mortgage | With Mortgage |
| Less than $800 | 124 (2.3%) | 99 (1.1%) |
| $800 to $1,499 | 110 (2.1%) | 188 (2.0%) |
| $800 to $1,499 | 4,652 (87.4%) | 507 (5.4%) |
| Total | 5,322 (100.0%) | 9,433 (100.0%) |
Health & Disability in Fall River
Health Insurance Coverage by Age in Fall River
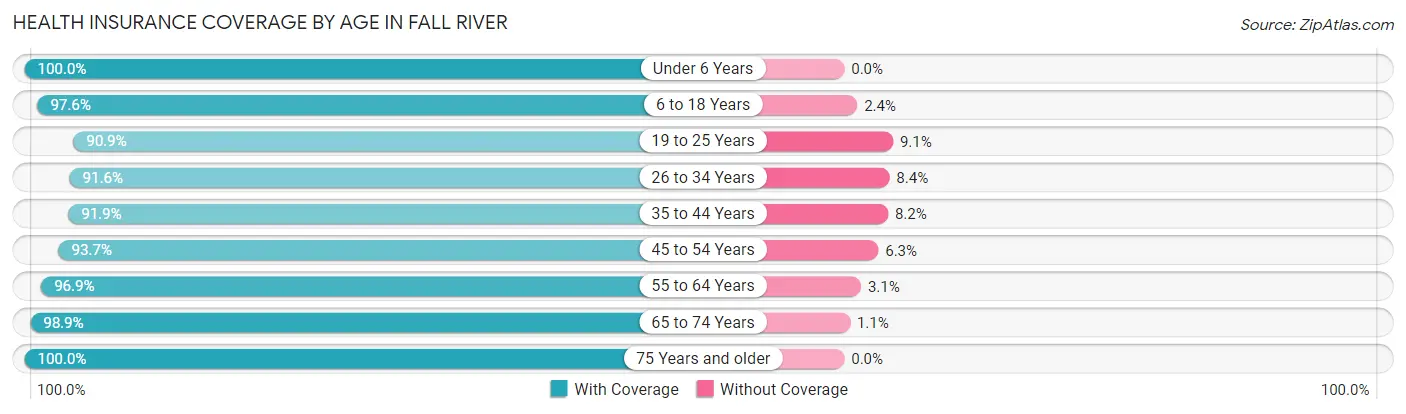
| Age Bracket | With Coverage | Without Coverage |
| Under 6 Years | 6,276 (100.0%) | 0 (0.0%) |
| 6 to 18 Years | 13,536 (97.6%) | 334 (2.4%) |
| 19 to 25 Years | 6,779 (90.9%) | 677 (9.1%) |
| 26 to 34 Years | 12,295 (91.6%) | 1,129 (8.4%) |
| 35 to 44 Years | 11,332 (91.8%) | 1,005 (8.2%) |
| 45 to 54 Years | 11,916 (93.7%) | 806 (6.3%) |
| 55 to 64 Years | 12,119 (96.9%) | 389 (3.1%) |
| 65 to 74 Years | 8,144 (98.9%) | 87 (1.1%) |
| 75 Years and older | 5,774 (100.0%) | 0 (0.0%) |
| Total | 88,171 (95.2%) | 4,427 (4.8%) |
Health Insurance Coverage by Citizenship Status in Fall River
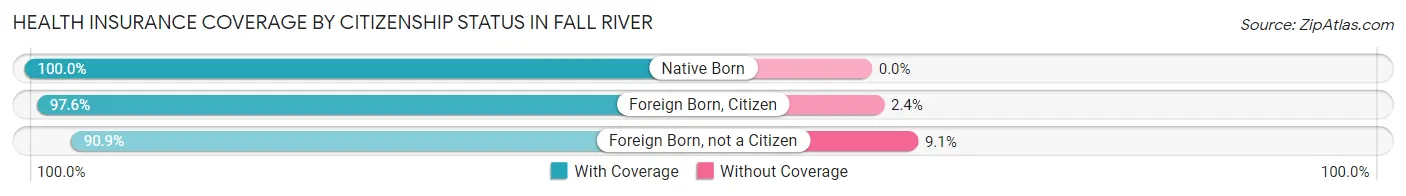
| Citizenship Status | With Coverage | Without Coverage |
| Native Born | 6,276 (100.0%) | 0 (0.0%) |
| Foreign Born, Citizen | 13,536 (97.6%) | 334 (2.4%) |
| Foreign Born, not a Citizen | 6,779 (90.9%) | 677 (9.1%) |
Health Insurance Coverage by Household Income in Fall River

| Household Income | With Coverage | Without Coverage |
| Under $25,000 | 15,976 (96.4%) | 594 (3.6%) |
| $25,000 to $49,999 | 17,348 (93.5%) | 1,211 (6.5%) |
| $50,000 to $74,999 | 14,718 (93.6%) | 1,007 (6.4%) |
| $75,000 to $99,999 | 11,113 (95.8%) | 486 (4.2%) |
| $100,000 and over | 28,542 (96.3%) | 1,105 (3.7%) |
Public vs Private Health Insurance Coverage by Age in Fall River
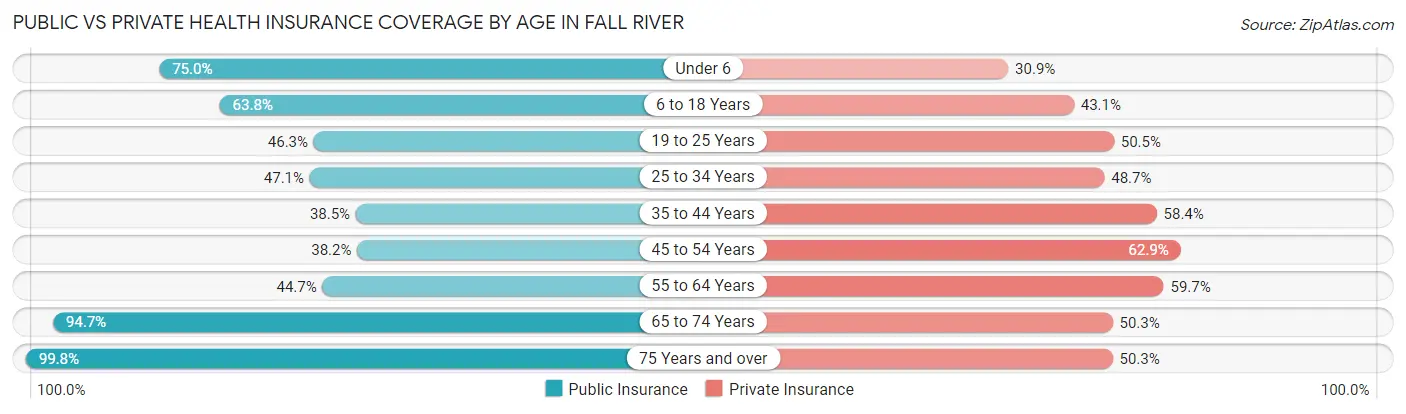
| Age Bracket | Public Insurance | Private Insurance |
| Under 6 | 4,707 (75.0%) | 1,938 (30.9%) |
| 6 to 18 Years | 8,848 (63.8%) | 5,972 (43.1%) |
| 19 to 25 Years | 3,453 (46.3%) | 3,764 (50.5%) |
| 25 to 34 Years | 6,316 (47.0%) | 6,542 (48.7%) |
| 35 to 44 Years | 4,750 (38.5%) | 7,209 (58.4%) |
| 45 to 54 Years | 4,865 (38.2%) | 8,001 (62.9%) |
| 55 to 64 Years | 5,590 (44.7%) | 7,470 (59.7%) |
| 65 to 74 Years | 7,798 (94.7%) | 4,136 (50.2%) |
| 75 Years and over | 5,761 (99.8%) | 2,902 (50.3%) |
| Total | 52,088 (56.2%) | 47,934 (51.8%) |
Disability Status by Sex by Age in Fall River
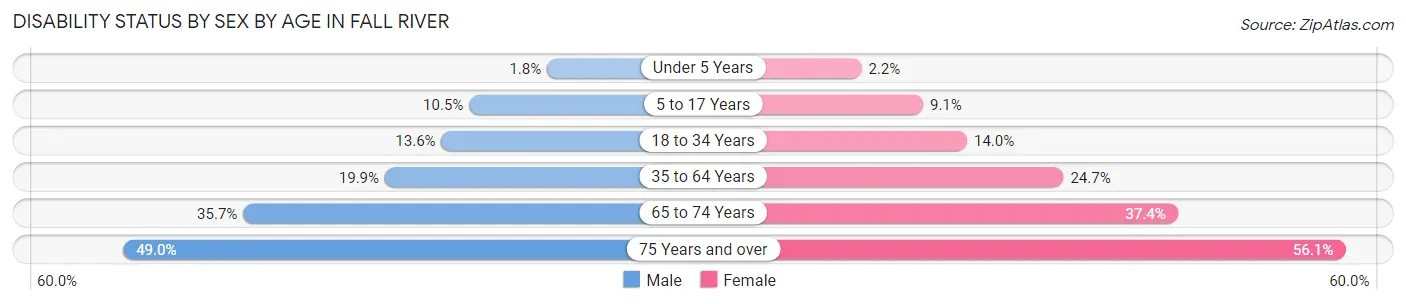
| Age Bracket | Male | Female |
| Under 5 Years | 46 (1.8%) | 64 (2.2%) |
| 5 to 17 Years | 744 (10.5%) | 599 (9.0%) |
| 18 to 34 Years | 1,460 (13.6%) | 1,553 (14.0%) |
| 35 to 64 Years | 3,660 (19.9%) | 4,731 (24.7%) |
| 65 to 74 Years | 1,361 (35.7%) | 1,651 (37.4%) |
| 75 Years and over | 1,087 (49.0%) | 1,993 (56.0%) |
Disability Class by Sex by Age in Fall River
Disability Class: Hearing Difficulty
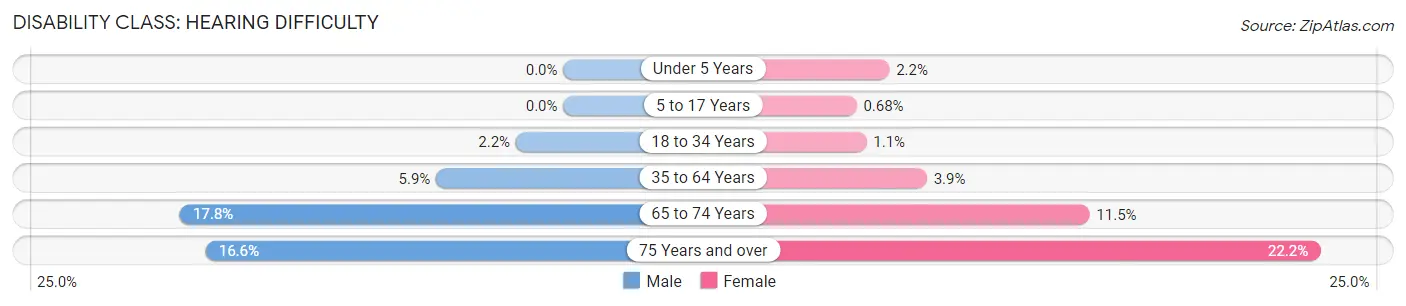
| Age Bracket | Male | Female |
| Under 5 Years | 0 (0.0%) | 64 (2.2%) |
| 5 to 17 Years | 0 (0.0%) | 45 (0.7%) |
| 18 to 34 Years | 237 (2.2%) | 127 (1.1%) |
| 35 to 64 Years | 1,086 (5.9%) | 755 (3.9%) |
| 65 to 74 Years | 679 (17.8%) | 507 (11.5%) |
| 75 Years and over | 368 (16.6%) | 789 (22.2%) |
Disability Class: Vision Difficulty
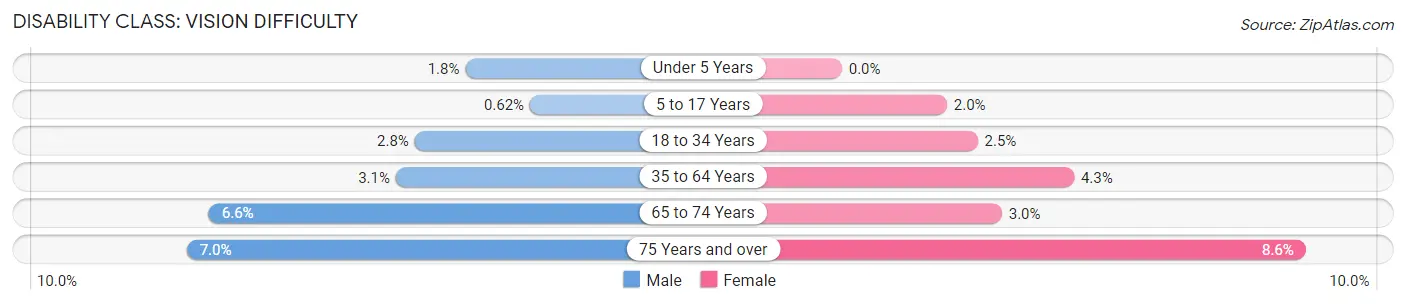
| Age Bracket | Male | Female |
| Under 5 Years | 46 (1.8%) | 0 (0.0%) |
| 5 to 17 Years | 44 (0.6%) | 129 (1.9%) |
| 18 to 34 Years | 297 (2.8%) | 280 (2.5%) |
| 35 to 64 Years | 573 (3.1%) | 825 (4.3%) |
| 65 to 74 Years | 251 (6.6%) | 131 (3.0%) |
| 75 Years and over | 155 (7.0%) | 306 (8.6%) |
Disability Class: Cognitive Difficulty
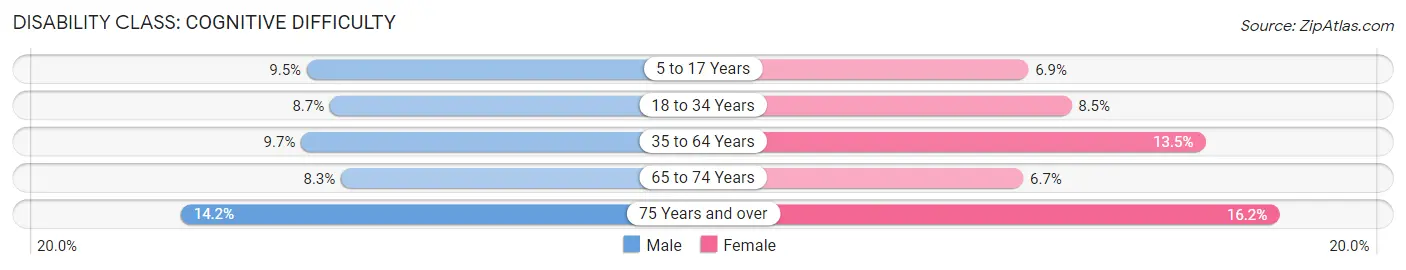
| Age Bracket | Male | Female |
| 5 to 17 Years | 675 (9.5%) | 458 (6.9%) |
| 18 to 34 Years | 931 (8.7%) | 948 (8.5%) |
| 35 to 64 Years | 1,791 (9.7%) | 2,584 (13.5%) |
| 65 to 74 Years | 315 (8.3%) | 297 (6.7%) |
| 75 Years and over | 315 (14.2%) | 577 (16.2%) |
Disability Class: Ambulatory Difficulty
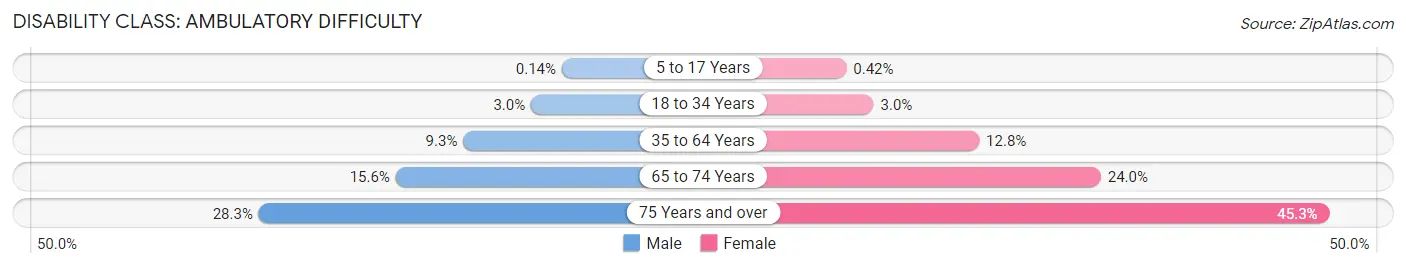
| Age Bracket | Male | Female |
| 5 to 17 Years | 10 (0.1%) | 28 (0.4%) |
| 18 to 34 Years | 323 (3.0%) | 328 (2.9%) |
| 35 to 64 Years | 1,710 (9.3%) | 2,443 (12.8%) |
| 65 to 74 Years | 594 (15.6%) | 1,061 (24.0%) |
| 75 Years and over | 627 (28.3%) | 1,609 (45.3%) |
Disability Class: Self-Care Difficulty
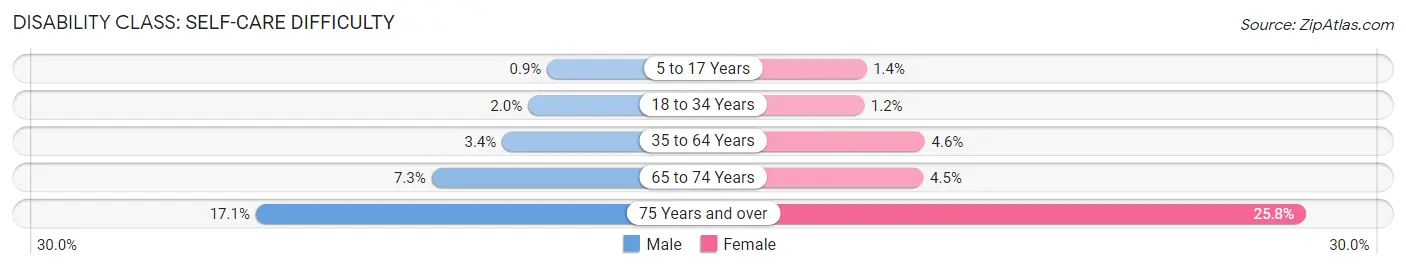
| Age Bracket | Male | Female |
| 5 to 17 Years | 64 (0.9%) | 90 (1.4%) |
| 18 to 34 Years | 212 (2.0%) | 137 (1.2%) |
| 35 to 64 Years | 628 (3.4%) | 883 (4.6%) |
| 65 to 74 Years | 280 (7.3%) | 200 (4.5%) |
| 75 Years and over | 380 (17.1%) | 919 (25.8%) |
Technology Access in Fall River
Computing Device Access in Fall River
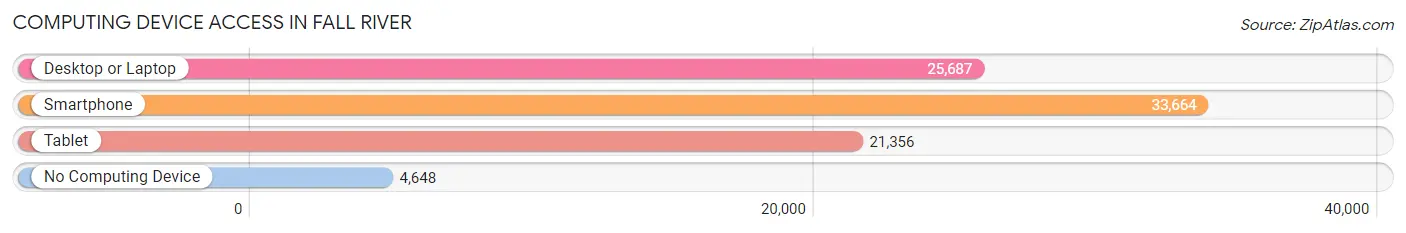
| Device Type | # Households | % Households |
| Desktop or Laptop | 25,687 | 62.5% |
| Smartphone | 33,664 | 81.9% |
| Tablet | 21,356 | 51.9% |
| No Computing Device | 4,648 | 11.3% |
| Total | 41,113 | 100.0% |
Internet Access in Fall River
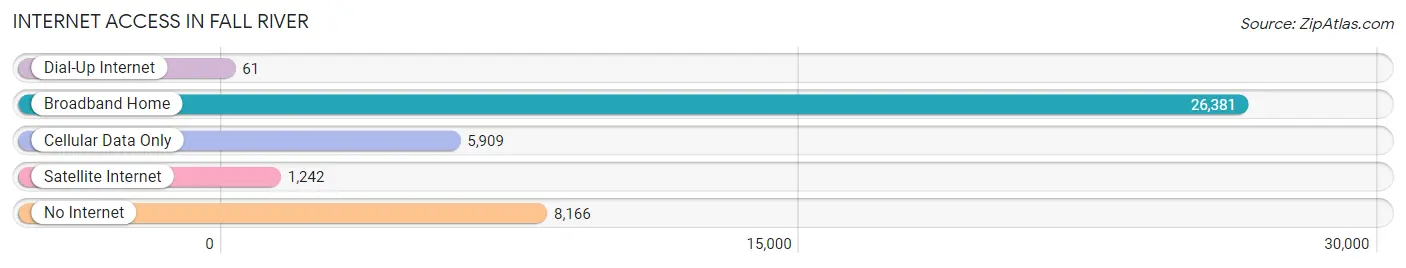
| Internet Type | # Households | % Households |
| Dial-Up Internet | 61 | 0.2% |
| Broadband Home | 26,381 | 64.2% |
| Cellular Data Only | 5,909 | 14.4% |
| Satellite Internet | 1,242 | 3.0% |
| No Internet | 8,166 | 19.9% |
| Total | 41,113 | 100.0% |
Fall River Summary
Introduction
Fall River, Massachusetts is a city located in Bristol County, Massachusetts, United States. It is located on the eastern shore of Mount Hope Bay, at the mouth of the Taunton River. The city has a population of 88,857 as of the 2010 census, making it the tenth-largest city in Massachusetts. Fall River is known for its textile industry, which began in the late 19th century and was once the leading producer of cotton textiles in the United States. The city is also home to a number of historic sites, including the Lizzie Borden House and the Battleship Massachusetts.
History
The area that is now Fall River was originally inhabited by the Wampanoag people, who had lived in the area for thousands of years. The first European settlers arrived in the area in 1620, when the Plymouth Colony was established. The area was known as "Pocasset" until 1640, when it was renamed "Fall River" after the river that runs through it.
In the late 18th century, the area began to develop as an industrial center, with the construction of a number of mills and factories. The city was officially incorporated in 1854, and by the late 19th century, it had become one of the leading producers of cotton textiles in the United States.
Geography
Fall River is located in southeastern Massachusetts, on the eastern shore of Mount Hope Bay, at the mouth of the Taunton River. The city is bordered by the towns of Somerset to the north, Swansea to the east, and Westport to the south. The city has a total area of 24.3 square miles, of which 22.7 square miles is land and 1.6 square miles is water.
The city is located in a hilly region, with elevations ranging from sea level to over 200 feet. The highest point in the city is the summit of Mount Hope, which has an elevation of 441 feet. The city is located in a temperate climate zone, with hot, humid summers and cold, wet winters.
Economy
Fall River has a diverse economy, with a number of industries represented in the city. The city is home to a number of manufacturing companies, including a number of textile mills, as well as a number of technology companies. The city is also home to a number of healthcare providers, including Charlton Memorial Hospital and St. Anne's Hospital.
The city is also home to a number of educational institutions, including Bristol Community College, the University of Massachusetts Dartmouth, and the Massachusetts Maritime Academy. The city is also home to a number of tourist attractions, including the Battleship Massachusetts and the Lizzie Borden House.
Demographics
As of the 2010 census, Fall River had a population of 88,857. The racial makeup of the city was 79.2% White, 8.3% African American, 0.4% Native American, 1.2% Asian, 0.1% Pacific Islander, 7.2% from other races, and 3.6% from two or more races. Hispanic or Latino of any race were 16.2% of the population.
The median income for a household in the city was $35,945, and the median income for a family was $43,813. The per capita income for the city was $19,845. About 17.2% of families and 20.7% of the population were below the poverty line, including 28.3% of those under age 18 and 14.2% of those age 65 or over.
Conclusion
Fall River, Massachusetts is a city located in Bristol County, Massachusetts, United States. It is located on the eastern shore of Mount Hope Bay, at the mouth of the Taunton River. The city has a population of 88,857 as of the 2010 census, making it the tenth-largest city in Massachusetts. Fall River is known for its textile industry, which began in the late 19th century and was once the leading producer of cotton textiles in the United States. The city is also home to a number of historic sites, including the Lizzie Borden House and the Battleship Massachusetts. Fall River has a diverse economy, with a number of industries represented in the city. The city is home to a number of manufacturing companies, healthcare providers, educational institutions, and tourist attractions. The racial makeup of the city was 79.2% White, 8.3% African American, 0.4% Native American, 1.2% Asian, 0.1% Pacific Islander, 7.2% from other races, and 3.6% from two or more races. Hispanic or Latino of any race were 16.2% of the population. The median income for a household in the city was $35,945, and the median income for a family was $43,813. The per capita income for the city was $19,845. About 17.2% of families and 20.7% of the population were below the poverty line. Fall River is a vibrant city with a rich history and a diverse economy.
Common Questions
What is Per Capita Income in Fall River?
Per Capita income in Fall River is $30,591.
What is the Median Family Income in Fall River?
Median Family Income in Fall River is $63,351.
What is the Median Household income in Fall River?
Median Household Income in Fall River is $52,734.
What is Income or Wage Gap in Fall River?
Income or Wage Gap in Fall River is 28.1%.
Women in Fall River earn 71.9 cents for every dollar earned by a man.
What is Family Income Deficit in Fall River?
Family Income Deficit in Fall River is $11,283.
Families that are below poverty line in Fall River earn $11,283 less on average than the poverty threshold level.
What is Inequality or Gini Index in Fall River?
Inequality or Gini Index in Fall River is 0.46.
What is the Total Population of Fall River?
Total Population of Fall River is 93,638.
What is the Total Male Population of Fall River?
Total Male Population of Fall River is 45,217.
What is the Total Female Population of Fall River?
Total Female Population of Fall River is 48,421.
What is the Ratio of Males per 100 Females in Fall River?
There are 93.38 Males per 100 Females in Fall River.
What is the Ratio of Females per 100 Males in Fall River?
There are 107.09 Females per 100 Males in Fall River.
What is the Median Population Age in Fall River?
Median Population Age in Fall River is 39.2 Years.
What is the Average Family Size in Fall River
Average Family Size in Fall River is 2.9 People.
What is the Average Household Size in Fall River
Average Household Size in Fall River is 2.2 People.
How Large is the Labor Force in Fall River?
There are 46,675 People in the Labor Forcein in Fall River.
What is the Percentage of People in the Labor Force in Fall River?
61.1% of People are in the Labor Force in Fall River.
What is the Unemployment Rate in Fall River?
Unemployment Rate in Fall River is 8.4%.