Saratoga Springs, UT Map & Demographics
Saratoga Springs Map
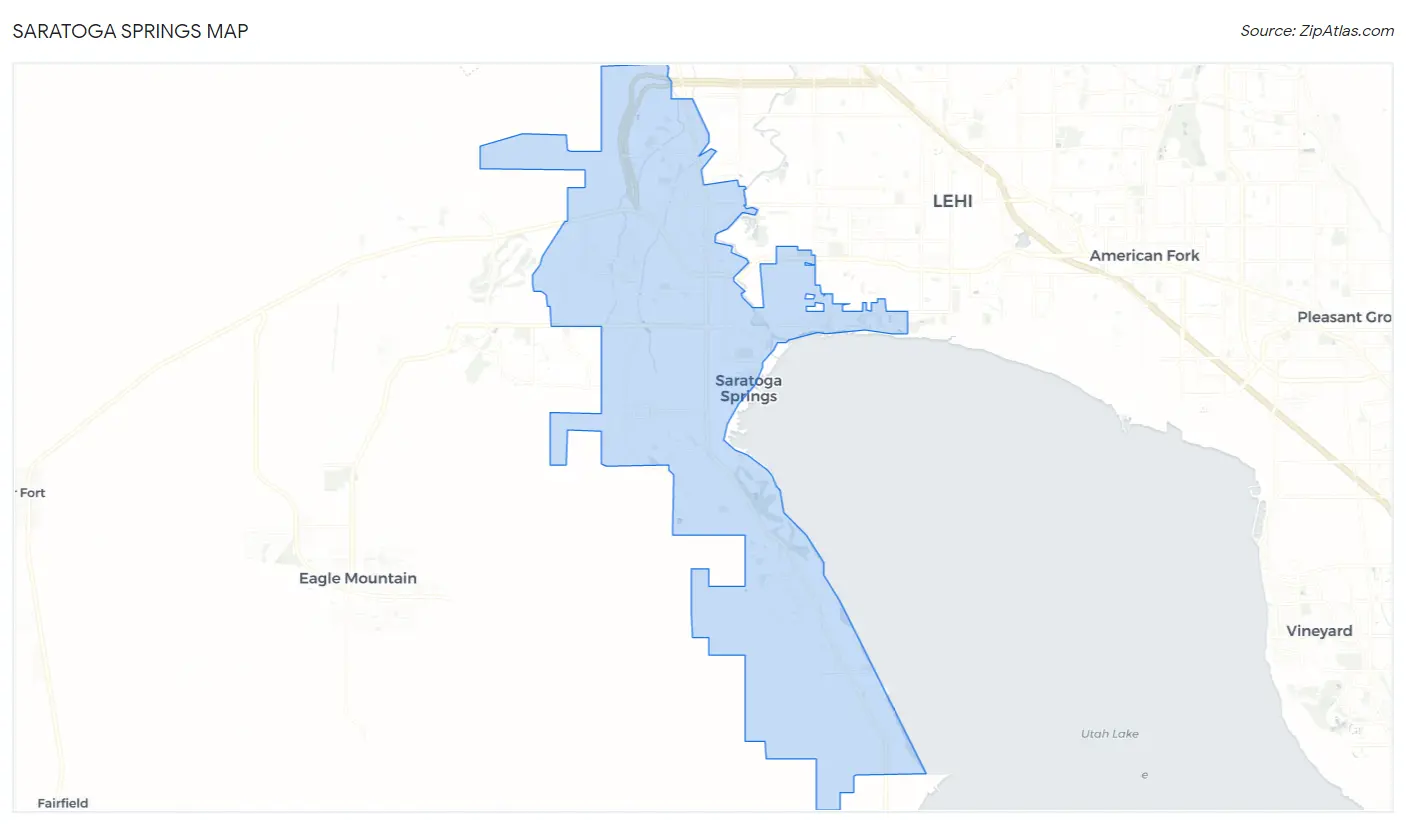
Saratoga Springs Overview
$32,100
PER CAPITA INCOME
$118,217
AVG FAMILY INCOME
$117,005
AVG HOUSEHOLD INCOME
67.9%
WAGE / INCOME GAP [ % ]
32.1¢/ $1
WAGE / INCOME GAP [ $ ]
0.32
INEQUALITY / GINI INDEX
40,391
TOTAL POPULATION
21,350
MALE POPULATION
19,041
FEMALE POPULATION
112.13
MALES / 100 FEMALES
89.19
FEMALES / 100 MALES
22.4
MEDIAN AGE
4.4
AVG FAMILY SIZE
4.2
AVG HOUSEHOLD SIZE
17,306
LABOR FORCE [ PEOPLE ]
70.6%
PERCENT IN LABOR FORCE
2.2%
UNEMPLOYMENT RATE
Saratoga Springs Zip Codes
Income in Saratoga Springs
Income Overview in Saratoga Springs
Per Capita Income in Saratoga Springs is $32,100, while median incomes of families and households are $118,217 and $117,005 respectively.
| Characteristic | Number | Measure |
| Per Capita Income | 40,391 | $32,100 |
| Median Family Income | 8,795 | $118,217 |
| Mean Family Income | 8,795 | $134,104 |
| Median Household Income | 9,716 | $117,005 |
| Mean Household Income | 9,716 | $131,912 |
| Income Deficit | 8,795 | $0 |
| Wage / Income Gap (%) | 40,391 | 67.89% |
| Wage / Income Gap ($) | 40,391 | 32.11¢ per $1 |
| Gini / Inequality Index | 40,391 | 0.32 |
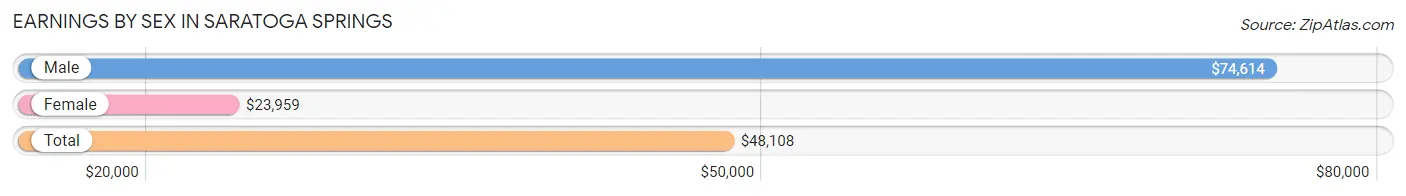
Earnings by Sex in Saratoga Springs
Average Earnings in Saratoga Springs are $48,108, $74,614 for men and $23,959 for women, a difference of 67.9%.
| Sex | Number | Average Earnings |
| Male | 11,391 (61.7%) | $74,614 |
| Female | 7,068 (38.3%) | $23,959 |
| Total | 18,459 (100.0%) | $48,108 |
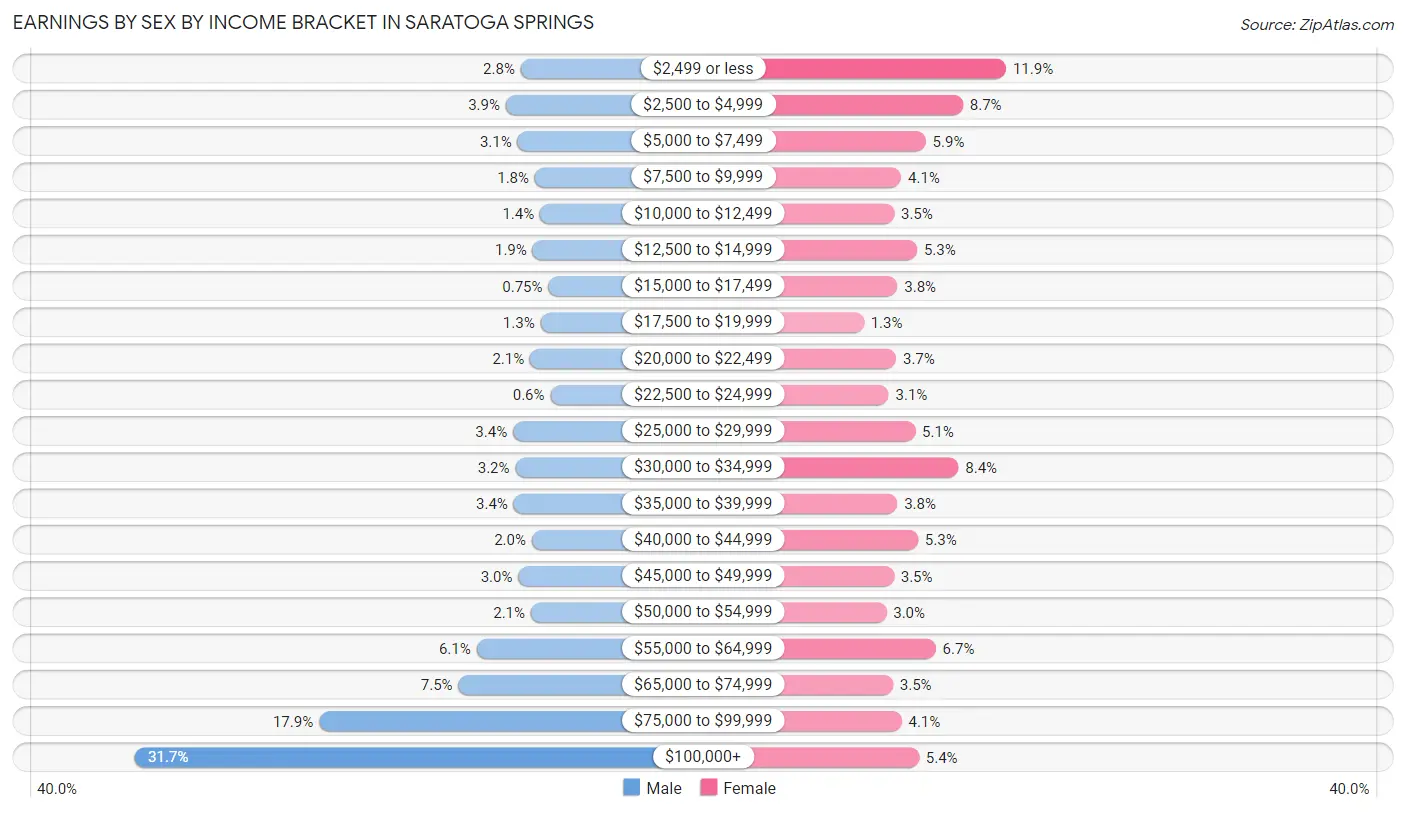
Earnings by Sex by Income Bracket in Saratoga Springs
The most common earnings brackets in Saratoga Springs are $100,000+ for men (3,613 | 31.7%) and $2,499 or less for women (843 | 11.9%).
| Income | Male | Female |
| $2,499 or less | 321 (2.8%) | 843 (11.9%) |
| $2,500 to $4,999 | 449 (3.9%) | 615 (8.7%) |
| $5,000 to $7,499 | 349 (3.1%) | 418 (5.9%) |
| $7,500 to $9,999 | 200 (1.8%) | 288 (4.1%) |
| $10,000 to $12,499 | 156 (1.4%) | 250 (3.5%) |
| $12,500 to $14,999 | 220 (1.9%) | 372 (5.3%) |
| $15,000 to $17,499 | 86 (0.7%) | 268 (3.8%) |
| $17,500 to $19,999 | 153 (1.3%) | 90 (1.3%) |
| $20,000 to $22,499 | 242 (2.1%) | 261 (3.7%) |
| $22,500 to $24,999 | 68 (0.6%) | 221 (3.1%) |
| $25,000 to $29,999 | 387 (3.4%) | 362 (5.1%) |
| $30,000 to $34,999 | 367 (3.2%) | 591 (8.4%) |
| $35,000 to $39,999 | 382 (3.4%) | 267 (3.8%) |
| $40,000 to $44,999 | 227 (2.0%) | 377 (5.3%) |
| $45,000 to $49,999 | 342 (3.0%) | 249 (3.5%) |
| $50,000 to $54,999 | 235 (2.1%) | 209 (3.0%) |
| $55,000 to $64,999 | 698 (6.1%) | 471 (6.7%) |
| $65,000 to $74,999 | 853 (7.5%) | 244 (3.5%) |
| $75,000 to $99,999 | 2,043 (17.9%) | 290 (4.1%) |
| $100,000+ | 3,613 (31.7%) | 382 (5.4%) |
| Total | 11,391 (100.0%) | 7,068 (100.0%) |
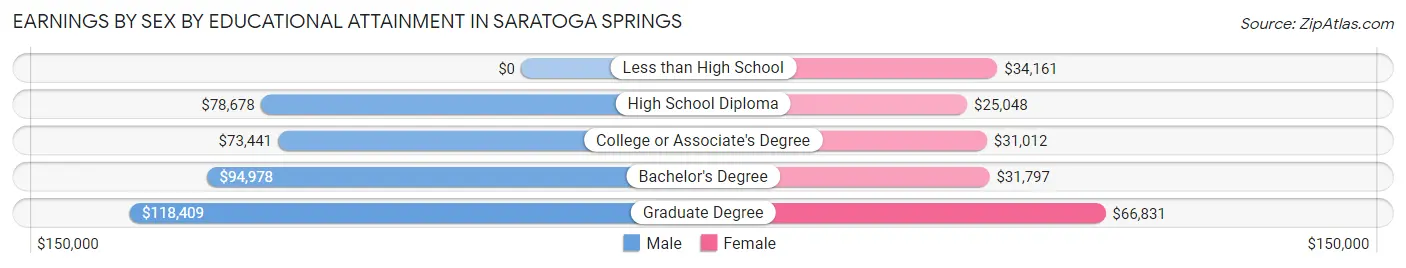
Earnings by Sex by Educational Attainment in Saratoga Springs
Average earnings in Saratoga Springs are $87,879 for men and $32,209 for women, a difference of 63.3%. Men with an educational attainment of graduate degree enjoy the highest average annual earnings of $118,409, while those with college or associate's degree education earn the least with $73,441. Women with an educational attainment of graduate degree earn the most with the average annual earnings of $66,831, while those with high school diploma education have the smallest earnings of $25,048.
| Educational Attainment | Male Income | Female Income |
| Less than High School | - | - |
| High School Diploma | $78,678 | $25,048 |
| College or Associate's Degree | $73,441 | $31,012 |
| Bachelor's Degree | $94,978 | $31,797 |
| Graduate Degree | $118,409 | $66,831 |
| Total | $87,879 | $32,209 |
Family Income in Saratoga Springs
Family Income Brackets in Saratoga Springs
According to the Saratoga Springs family income data, there are 3,043 families falling into the $100,000 to $149,999 income range, which is the most common income bracket and makes up 34.6% of all families. Conversely, the $10,000 to $14,999 income bracket is the least frequent group with only 70 families (0.8%) belonging to this category.
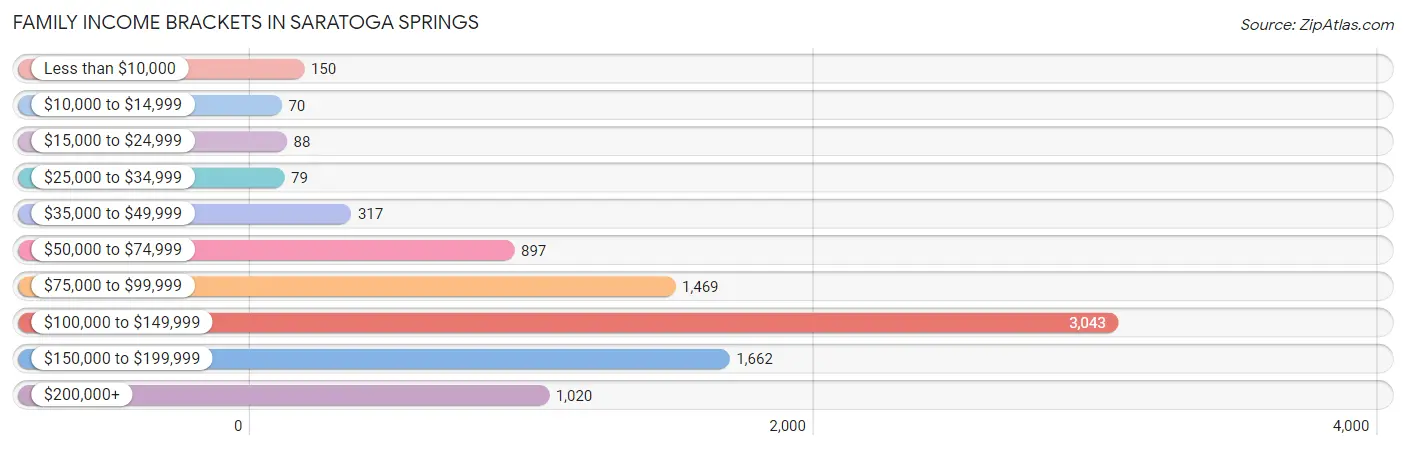
| Income Bracket | # Families | % Families |
| Less than $10,000 | 150 | 1.7% |
| $10,000 to $14,999 | 70 | 0.8% |
| $15,000 to $24,999 | 88 | 1.0% |
| $25,000 to $34,999 | 79 | 0.9% |
| $35,000 to $49,999 | 317 | 3.6% |
| $50,000 to $74,999 | 897 | 10.2% |
| $75,000 to $99,999 | 1,469 | 16.7% |
| $100,000 to $149,999 | 3,043 | 34.6% |
| $150,000 to $199,999 | 1,662 | 18.9% |
| $200,000+ | 1,020 | 11.6% |
Family Income by Famaliy Size in Saratoga Springs
7+ person families (585 | 6.7%) account for the highest median family income in Saratoga Springs with $167,361 per family, while 2-person families (1,562 | 17.8%) have the highest median income of $57,872 per family member.
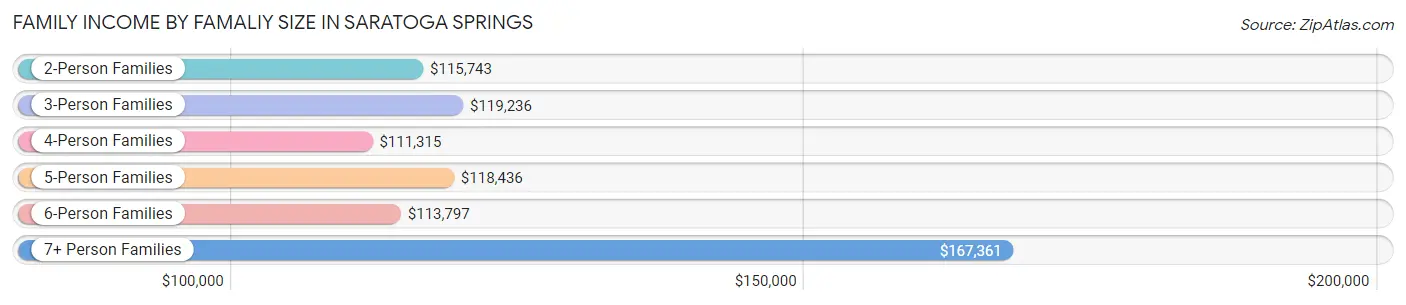
| Income Bracket | # Families | Median Income |
| 2-Person Families | 1,562 (17.8%) | $115,743 |
| 3-Person Families | 1,342 (15.3%) | $119,236 |
| 4-Person Families | 1,753 (19.9%) | $111,315 |
| 5-Person Families | 2,115 (24.0%) | $118,436 |
| 6-Person Families | 1,438 (16.4%) | $113,797 |
| 7+ Person Families | 585 (6.7%) | $167,361 |
| Total | 8,795 (100.0%) | $118,217 |
Family Income by Number of Earners in Saratoga Springs
The median family income in Saratoga Springs is $118,217, with families comprising 3+ earners (1,886) having the highest median family income of $146,214, while families with no earners (279) have the lowest median family income of $83,438, accounting for 21.4% and 3.2% of families, respectively.
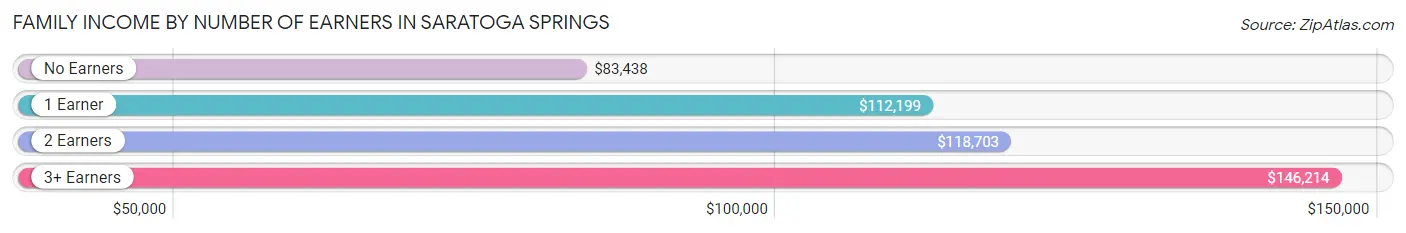
| Number of Earners | # Families | Median Income |
| No Earners | 279 (3.2%) | $83,438 |
| 1 Earner | 3,163 (36.0%) | $112,199 |
| 2 Earners | 3,467 (39.4%) | $118,703 |
| 3+ Earners | 1,886 (21.4%) | $146,214 |
| Total | 8,795 (100.0%) | $118,217 |
Household Income in Saratoga Springs
Household Income Brackets in Saratoga Springs
With 3,274 households falling in the category, the $100,000 to $149,999 income range is the most frequent in Saratoga Springs, accounting for 33.7% of all households. In contrast, only 68 households (0.7%) fall into the $10,000 to $14,999 income bracket, making it the least populous group.
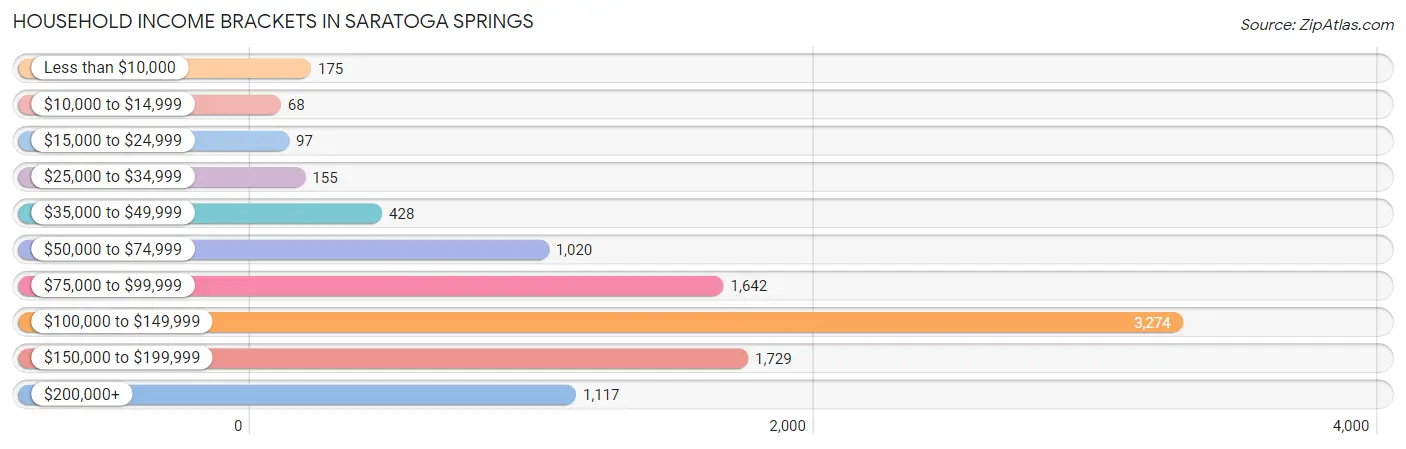
| Income Bracket | # Households | % Households |
| Less than $10,000 | 175 | 1.8% |
| $10,000 to $14,999 | 68 | 0.7% |
| $15,000 to $24,999 | 97 | 1.0% |
| $25,000 to $34,999 | 155 | 1.6% |
| $35,000 to $49,999 | 428 | 4.4% |
| $50,000 to $74,999 | 1,020 | 10.5% |
| $75,000 to $99,999 | 1,642 | 16.9% |
| $100,000 to $149,999 | 3,274 | 33.7% |
| $150,000 to $199,999 | 1,729 | 17.8% |
| $200,000+ | 1,117 | 11.5% |
Household Income by Householder Age in Saratoga Springs
The median household income in Saratoga Springs is $117,005, with the highest median household income of $135,313 found in the 45 to 64 years age bracket for the primary householder. A total of 2,550 households (26.3%) fall into this category. Meanwhile, the 15 to 24 years age bracket for the primary householder has the lowest median household income of $76,094, with 415 households (4.3%) in this group.
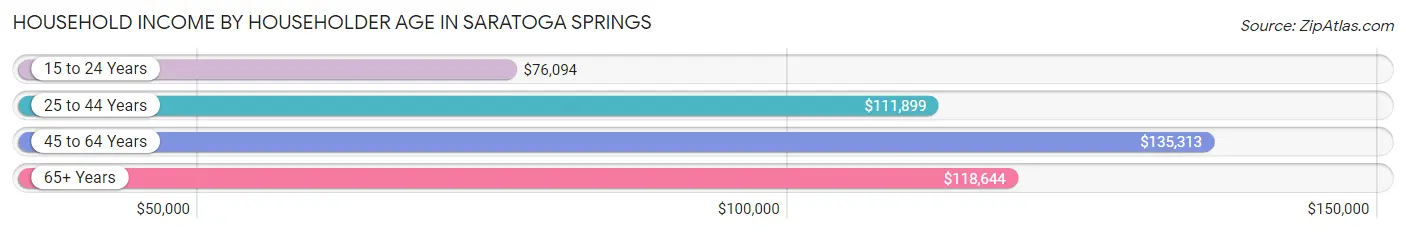
| Income Bracket | # Households | Median Income |
| 15 to 24 Years | 415 (4.3%) | $76,094 |
| 25 to 44 Years | 5,805 (59.8%) | $111,899 |
| 45 to 64 Years | 2,550 (26.3%) | $135,313 |
| 65+ Years | 946 (9.7%) | $118,644 |
| Total | 9,716 (100.0%) | $117,005 |
Poverty in Saratoga Springs
Income Below Poverty by Sex and Age in Saratoga Springs
With 4.3% poverty level for males and 4.4% for females among the residents of Saratoga Springs, 18 to 24 year old males and under 5 year old females are the most vulnerable to poverty, with 183 males (8.0%) and 165 females (7.8%) in their respective age groups living below the poverty level.
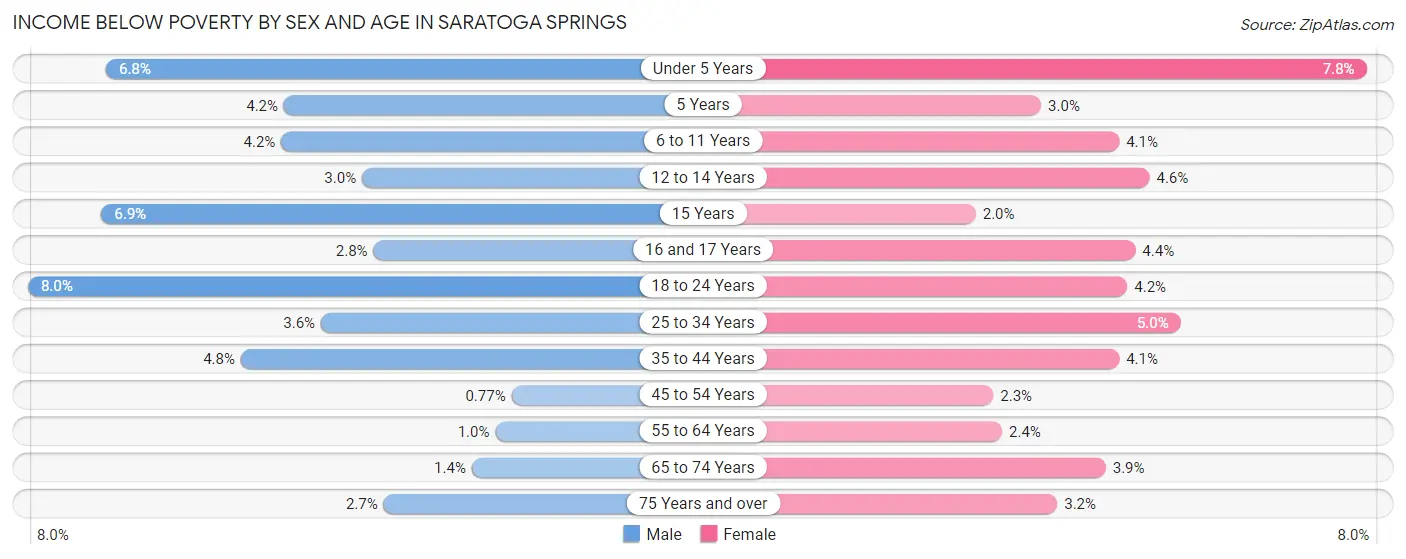
| Age Bracket | Male | Female |
| Under 5 Years | 179 (6.8%) | 165 (7.8%) |
| 5 Years | 19 (4.2%) | 22 (3.0%) |
| 6 to 11 Years | 137 (4.2%) | 111 (4.1%) |
| 12 to 14 Years | 50 (3.0%) | 61 (4.6%) |
| 15 Years | 30 (6.9%) | 10 (2.0%) |
| 16 and 17 Years | 25 (2.8%) | 37 (4.4%) |
| 18 to 24 Years | 183 (8.0%) | 60 (4.2%) |
| 25 to 34 Years | 95 (3.6%) | 150 (5.0%) |
| 35 to 44 Years | 153 (4.8%) | 125 (4.1%) |
| 45 to 54 Years | 16 (0.8%) | 30 (2.2%) |
| 55 to 64 Years | 8 (1.0%) | 23 (2.4%) |
| 65 to 74 Years | 10 (1.4%) | 25 (3.9%) |
| 75 Years and over | 7 (2.7%) | 13 (3.2%) |
| Total | 912 (4.3%) | 832 (4.4%) |
Income Above Poverty by Sex and Age in Saratoga Springs
According to the poverty statistics in Saratoga Springs, males aged 45 to 54 years and females aged 15 years are the age groups that are most secure financially, with 99.2% of males and 98.0% of females in these age groups living above the poverty line.
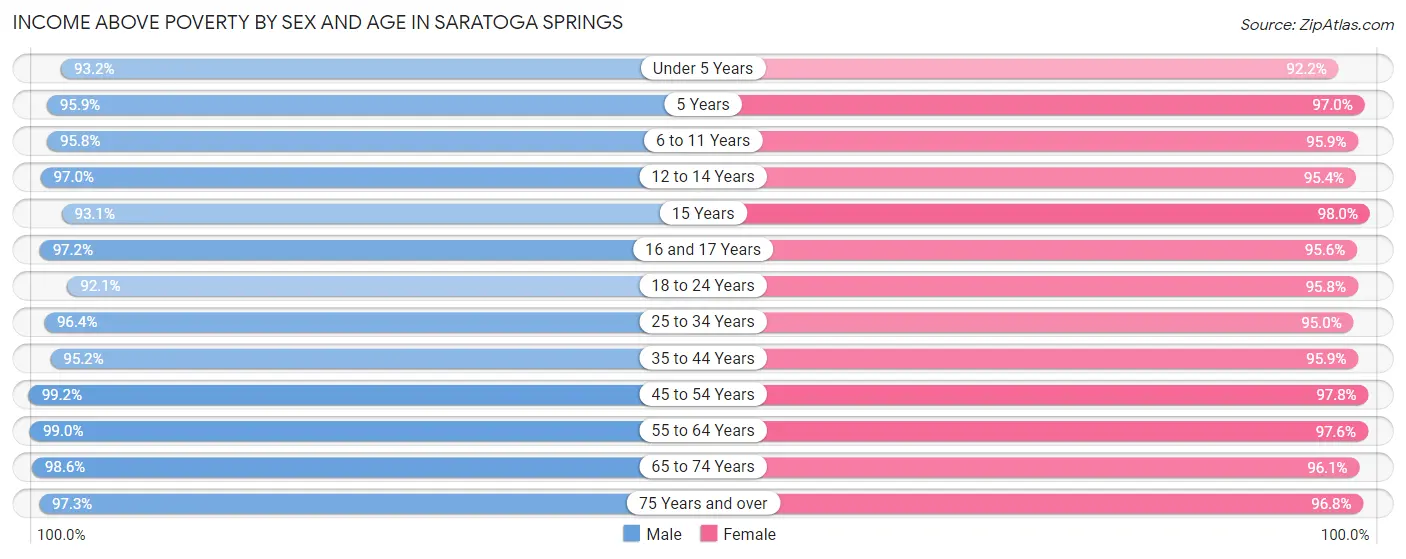
| Age Bracket | Male | Female |
| Under 5 Years | 2,459 (93.2%) | 1,954 (92.2%) |
| 5 Years | 439 (95.9%) | 722 (97.0%) |
| 6 to 11 Years | 3,129 (95.8%) | 2,585 (95.9%) |
| 12 to 14 Years | 1,620 (97.0%) | 1,275 (95.4%) |
| 15 Years | 407 (93.1%) | 493 (98.0%) |
| 16 and 17 Years | 860 (97.2%) | 812 (95.6%) |
| 18 to 24 Years | 2,119 (92.0%) | 1,356 (95.8%) |
| 25 to 34 Years | 2,542 (96.4%) | 2,830 (95.0%) |
| 35 to 44 Years | 3,039 (95.2%) | 2,911 (95.9%) |
| 45 to 54 Years | 2,061 (99.2%) | 1,302 (97.8%) |
| 55 to 64 Years | 784 (99.0%) | 944 (97.6%) |
| 65 to 74 Years | 724 (98.6%) | 613 (96.1%) |
| 75 Years and over | 255 (97.3%) | 393 (96.8%) |
| Total | 20,438 (95.7%) | 18,190 (95.6%) |
Income Below Poverty Among Married-Couple Families in Saratoga Springs
The poverty statistics for married-couple families in Saratoga Springs show that 3.0% or 243 of the total 7,960 families live below the poverty line. Families with 3 or 4 children have the highest poverty rate of 5.1%, comprising of 139 families. On the other hand, families with 5 or more children have the lowest poverty rate of 0.0%, which includes 0 families.
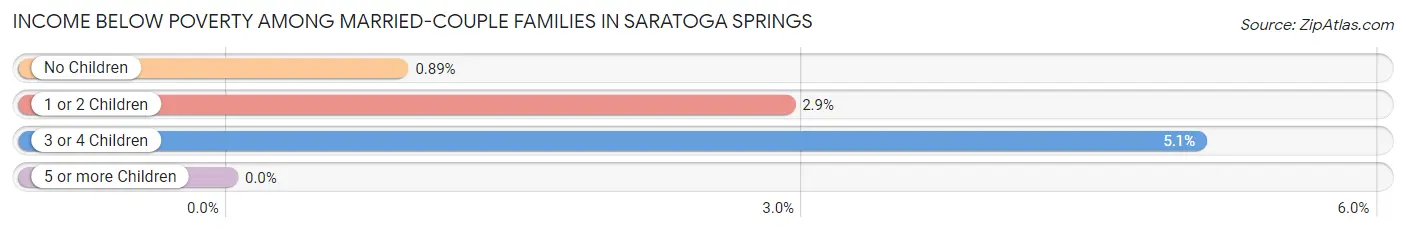
| Children | Above Poverty | Below Poverty |
| No Children | 1,894 (99.1%) | 17 (0.9%) |
| 1 or 2 Children | 2,904 (97.1%) | 87 (2.9%) |
| 3 or 4 Children | 2,607 (94.9%) | 139 (5.1%) |
| 5 or more Children | 312 (100.0%) | 0 (0.0%) |
| Total | 7,717 (97.0%) | 243 (3.0%) |
Income Below Poverty Among Single-Parent Households in Saratoga Springs
According to the poverty data in Saratoga Springs, 5.6% or 20 single-father households and 11.5% or 55 single-mother households are living below the poverty line. Among single-father households, those with 3 or 4 children have the highest poverty rate, with 20 households (25.6%) experiencing poverty. Likewise, among single-mother households, those with 3 or 4 children have the highest poverty rate, with 26 households (23.6%) falling below the poverty line.
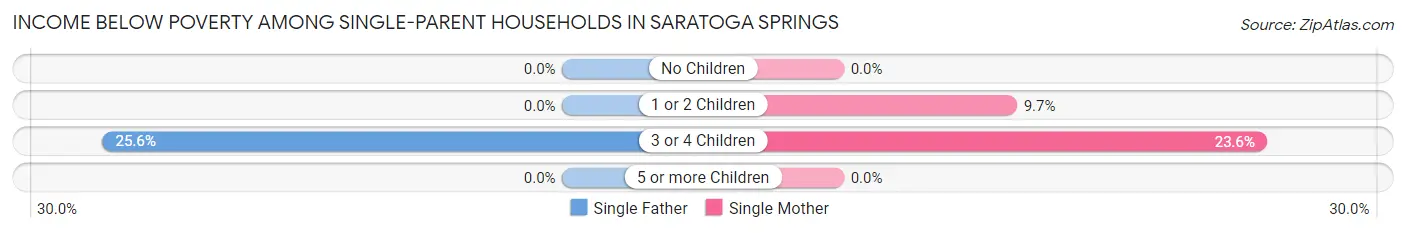
| Children | Single Father | Single Mother |
| No Children | 0 (0.0%) | 0 (0.0%) |
| 1 or 2 Children | 0 (0.0%) | 29 (9.7%) |
| 3 or 4 Children | 20 (25.6%) | 26 (23.6%) |
| 5 or more Children | 0 (0.0%) | 0 (0.0%) |
| Total | 20 (5.6%) | 55 (11.5%) |
Income Below Poverty Among Married-Couple vs Single-Parent Households in Saratoga Springs
The poverty data for Saratoga Springs shows that 243 of the married-couple family households (3.0%) and 75 of the single-parent households (9.0%) are living below the poverty level. Within the married-couple family households, those with 3 or 4 children have the highest poverty rate, with 139 households (5.1%) falling below the poverty line. Among the single-parent households, those with 3 or 4 children have the highest poverty rate, with 46 household (24.5%) living below poverty.
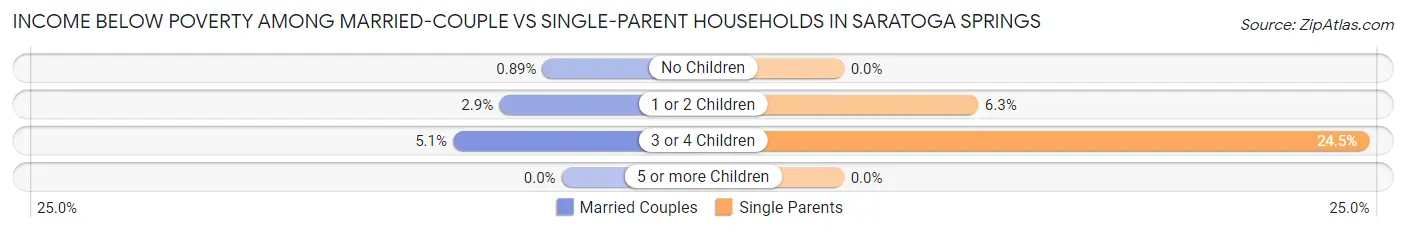
| Children | Married-Couple Families | Single-Parent Households |
| No Children | 17 (0.9%) | 0 (0.0%) |
| 1 or 2 Children | 87 (2.9%) | 29 (6.2%) |
| 3 or 4 Children | 139 (5.1%) | 46 (24.5%) |
| 5 or more Children | 0 (0.0%) | 0 (0.0%) |
| Total | 243 (3.0%) | 75 (9.0%) |
Race in Saratoga Springs
The most populous races in Saratoga Springs are White / Caucasian (35,402 | 87.6%), Hispanic or Latino (4,083 | 10.1%), and Two or more Races (3,222 | 8.0%).
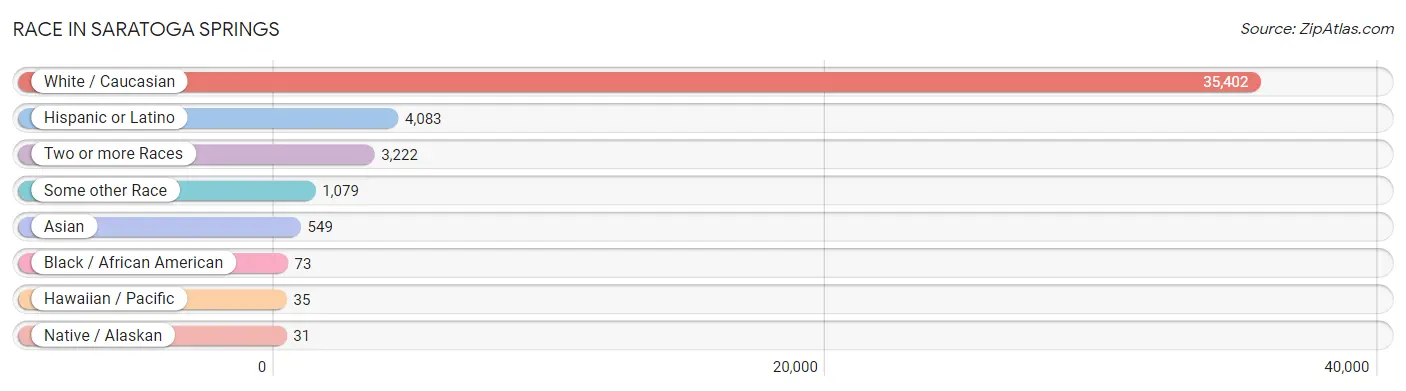
| Race | # Population | % Population |
| Asian | 549 | 1.4% |
| Black / African American | 73 | 0.2% |
| Hawaiian / Pacific | 35 | 0.1% |
| Hispanic or Latino | 4,083 | 10.1% |
| Native / Alaskan | 31 | 0.1% |
| White / Caucasian | 35,402 | 87.6% |
| Two or more Races | 3,222 | 8.0% |
| Some other Race | 1,079 | 2.7% |
| Total | 40,391 | 100.0% |
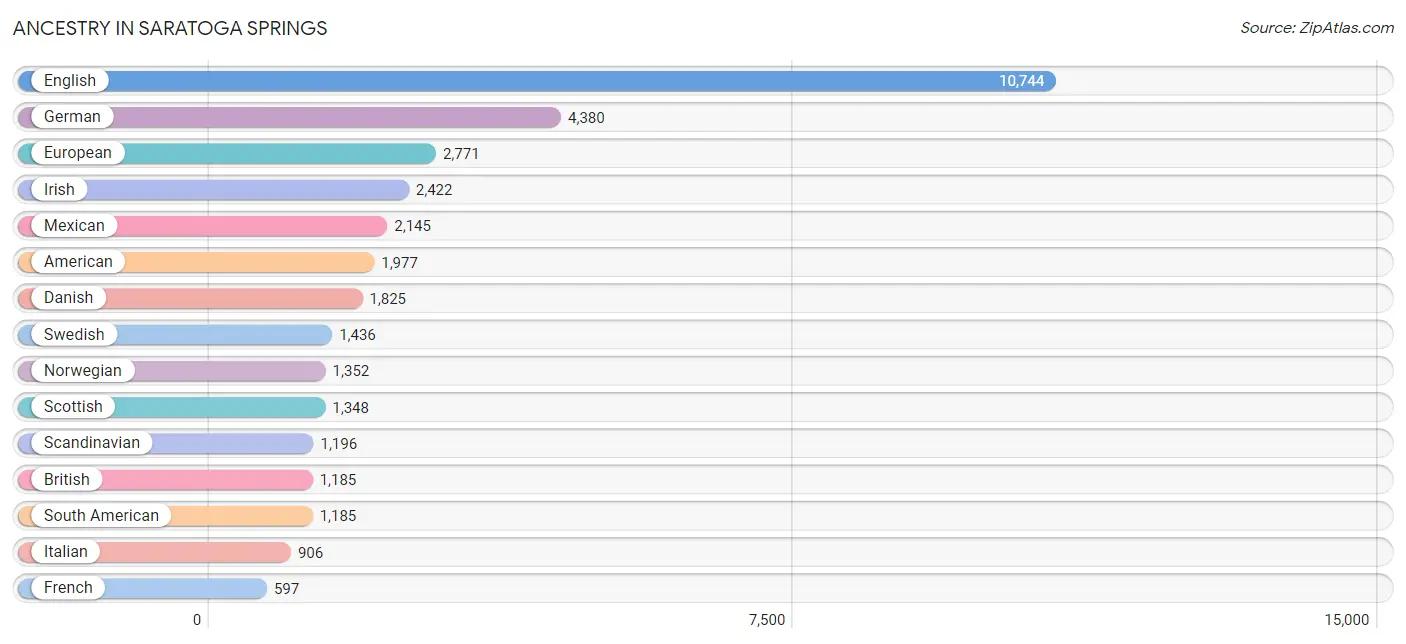
Ancestry in Saratoga Springs
The most populous ancestries reported in Saratoga Springs are English (10,744 | 26.6%), German (4,380 | 10.8%), European (2,771 | 6.9%), Irish (2,422 | 6.0%), and Mexican (2,145 | 5.3%), together accounting for 55.6% of all Saratoga Springs residents.
| Ancestry | # Population | % Population |
| African | 13 | 0.0% |
| American | 1,977 | 4.9% |
| Arab | 121 | 0.3% |
| Argentinean | 77 | 0.2% |
| Armenian | 23 | 0.1% |
| Australian | 26 | 0.1% |
| Bhutanese | 449 | 1.1% |
| Bolivian | 154 | 0.4% |
| Brazilian | 53 | 0.1% |
| British | 1,185 | 2.9% |
| Burmese | 164 | 0.4% |
| Cambodian | 105 | 0.3% |
| Canadian | 142 | 0.4% |
| Central American | 362 | 0.9% |
| Central American Indian | 123 | 0.3% |
| Cherokee | 31 | 0.1% |
| Chilean | 156 | 0.4% |
| Colombian | 223 | 0.5% |
| Costa Rican | 113 | 0.3% |
| Croatian | 13 | 0.0% |
| Czech | 76 | 0.2% |
| Czechoslovakian | 33 | 0.1% |
| Danish | 1,825 | 4.5% |
| Dominican | 35 | 0.1% |
| Dutch | 535 | 1.3% |
| Eastern European | 16 | 0.0% |
| English | 10,744 | 26.6% |
| European | 2,771 | 6.9% |
| Fijian | 1 | 0.0% |
| Filipino | 15 | 0.0% |
| Finnish | 36 | 0.1% |
| French | 597 | 1.5% |
| French Canadian | 331 | 0.8% |
| German | 4,380 | 10.8% |
| Greek | 45 | 0.1% |
| Guatemalan | 115 | 0.3% |
| Honduran | 33 | 0.1% |
| Hungarian | 53 | 0.1% |
| Icelander | 204 | 0.5% |
| Indian (Asian) | 318 | 0.8% |
| Irish | 2,422 | 6.0% |
| Italian | 906 | 2.2% |
| Jamaican | 13 | 0.0% |
| Japanese | 1 | 0.0% |
| Korean | 332 | 0.8% |
| Lebanese | 66 | 0.2% |
| Lithuanian | 46 | 0.1% |
| Malaysian | 9 | 0.0% |
| Mexican | 2,145 | 5.3% |
| Mexican American Indian | 16 | 0.0% |
| Native Hawaiian | 12 | 0.0% |
| New Zealander | 35 | 0.1% |
| Northern European | 253 | 0.6% |
| Norwegian | 1,352 | 3.4% |
| Panamanian | 65 | 0.2% |
| Peruvian | 171 | 0.4% |
| Polish | 155 | 0.4% |
| Portuguese | 356 | 0.9% |
| Puerto Rican | 75 | 0.2% |
| Romanian | 25 | 0.1% |
| Russian | 202 | 0.5% |
| Salvadoran | 36 | 0.1% |
| Samoan | 16 | 0.0% |
| Scandinavian | 1,196 | 3.0% |
| Scotch-Irish | 221 | 0.5% |
| Scottish | 1,348 | 3.3% |
| South African | 24 | 0.1% |
| South American | 1,185 | 2.9% |
| Spaniard | 95 | 0.2% |
| Spanish | 126 | 0.3% |
| Sri Lankan | 69 | 0.2% |
| Subsaharan African | 37 | 0.1% |
| Swedish | 1,436 | 3.6% |
| Swiss | 220 | 0.5% |
| Syrian | 25 | 0.1% |
| Thai | 53 | 0.1% |
| Tongan | 23 | 0.1% |
| Uruguayan | 306 | 0.8% |
| Ute | 8 | 0.0% |
| Venezuelan | 98 | 0.2% |
| Welsh | 285 | 0.7% |
| Yugoslavian | 188 | 0.5% | View All 82 Rows |
Immigrants in Saratoga Springs
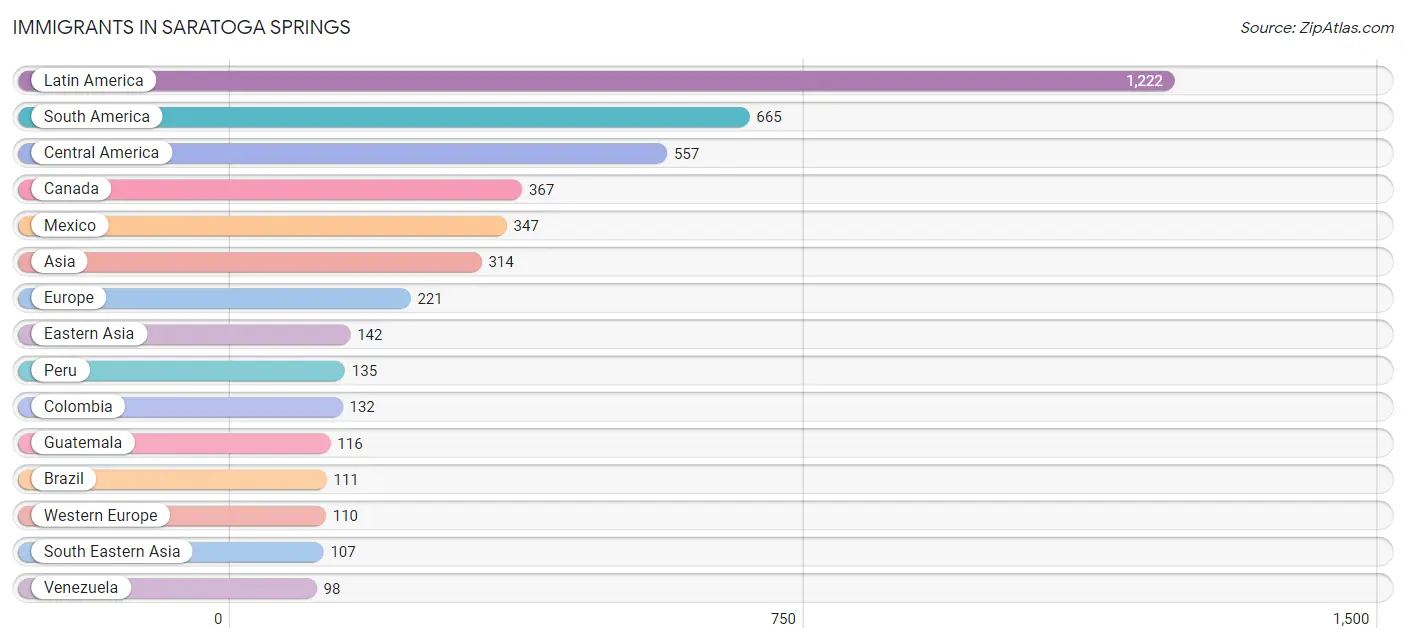
The most numerous immigrant groups reported in Saratoga Springs came from Latin America (1,222 | 3.0%), South America (665 | 1.7%), Central America (557 | 1.4%), Canada (367 | 0.9%), and Mexico (347 | 0.9%), together accounting for 7.8% of all Saratoga Springs residents.
| Immigration Origin | # Population | % Population |
| Argentina | 16 | 0.0% |
| Asia | 314 | 0.8% |
| Bolivia | 13 | 0.0% |
| Bosnia and Herzegovina | 40 | 0.1% |
| Brazil | 111 | 0.3% |
| Canada | 367 | 0.9% |
| Central America | 557 | 1.4% |
| Chile | 93 | 0.2% |
| China | 63 | 0.2% |
| Colombia | 132 | 0.3% |
| Costa Rica | 40 | 0.1% |
| Eastern Asia | 142 | 0.4% |
| Eastern Europe | 65 | 0.2% |
| England | 18 | 0.0% |
| Europe | 221 | 0.5% |
| France | 67 | 0.2% |
| Germany | 43 | 0.1% |
| Guatemala | 116 | 0.3% |
| Honduras | 16 | 0.0% |
| India | 46 | 0.1% |
| Israel | 19 | 0.1% |
| Korea | 10 | 0.0% |
| Latin America | 1,222 | 3.0% |
| Mexico | 347 | 0.9% |
| Northern Europe | 18 | 0.0% |
| Oceania | 7 | 0.0% |
| Panama | 38 | 0.1% |
| Peru | 135 | 0.3% |
| Philippines | 60 | 0.2% |
| Romania | 25 | 0.1% |
| Singapore | 7 | 0.0% |
| South America | 665 | 1.7% |
| South Central Asia | 46 | 0.1% |
| South Eastern Asia | 107 | 0.3% |
| Taiwan | 15 | 0.0% |
| Thailand | 9 | 0.0% |
| Uruguay | 67 | 0.2% |
| Venezuela | 98 | 0.2% |
| Vietnam | 31 | 0.1% |
| Western Asia | 19 | 0.1% |
| Western Europe | 110 | 0.3% | View All 41 Rows |
Sex and Age in Saratoga Springs
Sex and Age in Saratoga Springs
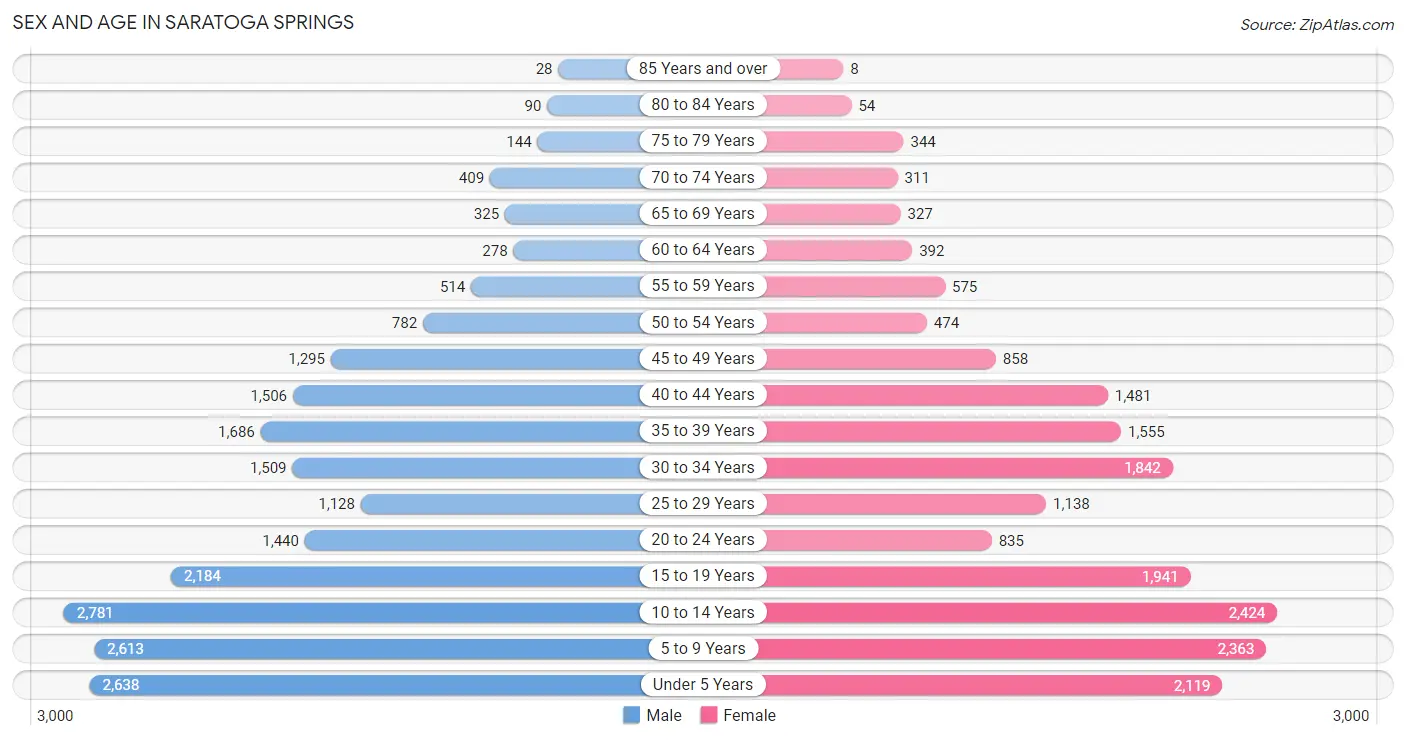
The most populous age groups in Saratoga Springs are 10 to 14 Years (2,781 | 13.0%) for men and 10 to 14 Years (2,424 | 12.7%) for women.
| Age Bracket | Male | Female |
| Under 5 Years | 2,638 (12.4%) | 2,119 (11.1%) |
| 5 to 9 Years | 2,613 (12.2%) | 2,363 (12.4%) |
| 10 to 14 Years | 2,781 (13.0%) | 2,424 (12.7%) |
| 15 to 19 Years | 2,184 (10.2%) | 1,941 (10.2%) |
| 20 to 24 Years | 1,440 (6.7%) | 835 (4.4%) |
| 25 to 29 Years | 1,128 (5.3%) | 1,138 (6.0%) |
| 30 to 34 Years | 1,509 (7.1%) | 1,842 (9.7%) |
| 35 to 39 Years | 1,686 (7.9%) | 1,555 (8.2%) |
| 40 to 44 Years | 1,506 (7.0%) | 1,481 (7.8%) |
| 45 to 49 Years | 1,295 (6.1%) | 858 (4.5%) |
| 50 to 54 Years | 782 (3.7%) | 474 (2.5%) |
| 55 to 59 Years | 514 (2.4%) | 575 (3.0%) |
| 60 to 64 Years | 278 (1.3%) | 392 (2.1%) |
| 65 to 69 Years | 325 (1.5%) | 327 (1.7%) |
| 70 to 74 Years | 409 (1.9%) | 311 (1.6%) |
| 75 to 79 Years | 144 (0.7%) | 344 (1.8%) |
| 80 to 84 Years | 90 (0.4%) | 54 (0.3%) |
| 85 Years and over | 28 (0.1%) | 8 (0.0%) |
| Total | 21,350 (100.0%) | 19,041 (100.0%) |
Families and Households in Saratoga Springs
Median Family Size in Saratoga Springs
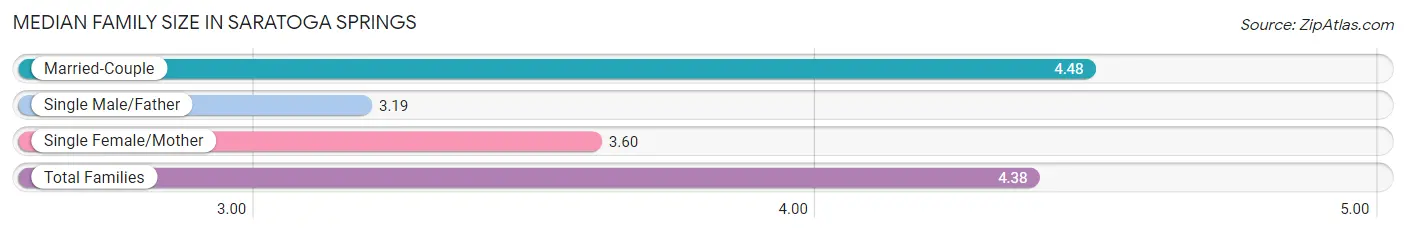
The median family size in Saratoga Springs is 4.38 persons per family, with married-couple families (7,960 | 90.5%) accounting for the largest median family size of 4.48 persons per family. On the other hand, single male/father families (357 | 4.1%) represent the smallest median family size with 3.19 persons per family.
| Family Type | # Families | Family Size |
| Married-Couple | 7,960 (90.5%) | 4.48 |
| Single Male/Father | 357 (4.1%) | 3.19 |
| Single Female/Mother | 478 (5.4%) | 3.60 |
| Total Families | 8,795 (100.0%) | 4.38 |
Median Household Size in Saratoga Springs
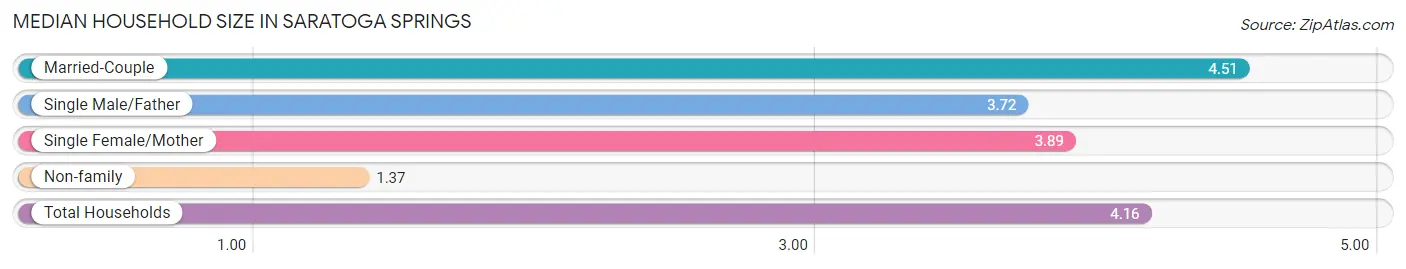
The median household size in Saratoga Springs is 4.16 persons per household, with married-couple households (7,960 | 81.9%) accounting for the largest median household size of 4.51 persons per household. non-family households (921 | 9.5%) represent the smallest median household size with 1.37 persons per household.
| Household Type | # Households | Household Size |
| Married-Couple | 7,960 (81.9%) | 4.51 |
| Single Male/Father | 357 (3.7%) | 3.72 |
| Single Female/Mother | 478 (4.9%) | 3.89 |
| Non-family | 921 (9.5%) | 1.37 |
| Total Households | 9,716 (100.0%) | 4.16 |
Household Size by Marriage Status in Saratoga Springs
Out of a total of 9,716 households in Saratoga Springs, 8,795 (90.5%) are family households, while 921 (9.5%) are nonfamily households. The most numerous type of family households are 5-person households, comprising 2,035, and the most common type of nonfamily households are 1-person households, comprising 723.
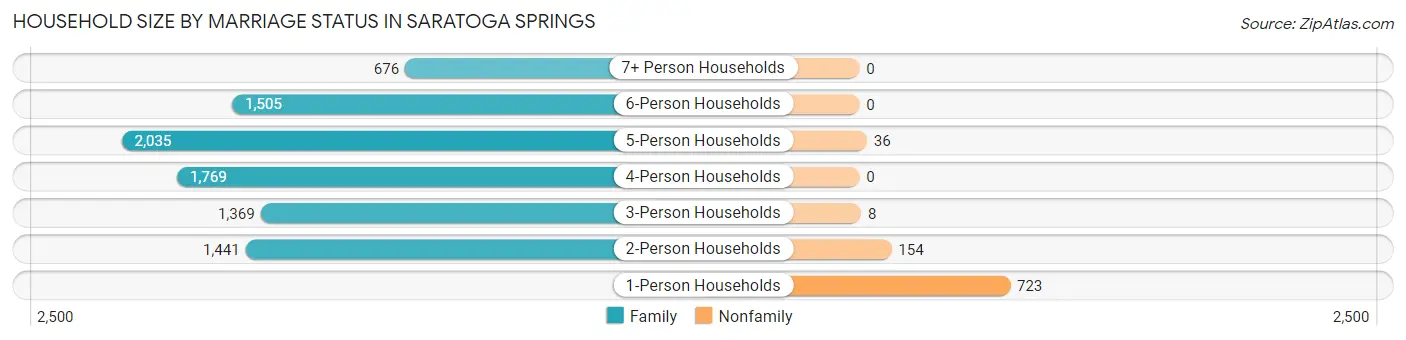
| Household Size | Family Households | Nonfamily Households |
| 1-Person Households | - | 723 (7.4%) |
| 2-Person Households | 1,441 (14.8%) | 154 (1.6%) |
| 3-Person Households | 1,369 (14.1%) | 8 (0.1%) |
| 4-Person Households | 1,769 (18.2%) | 0 (0.0%) |
| 5-Person Households | 2,035 (20.9%) | 36 (0.4%) |
| 6-Person Households | 1,505 (15.5%) | 0 (0.0%) |
| 7+ Person Households | 676 (7.0%) | 0 (0.0%) |
| Total | 8,795 (90.5%) | 921 (9.5%) |
Female Fertility in Saratoga Springs
Fertility by Age in Saratoga Springs
Average fertility rate in Saratoga Springs is 63.0 births per 1,000 women. Women in the age bracket of 20 to 34 years have the highest fertility rate with 122.0 births per 1,000 women. Women in the age bracket of 20 to 34 years acount for 75.4% of all women with births.
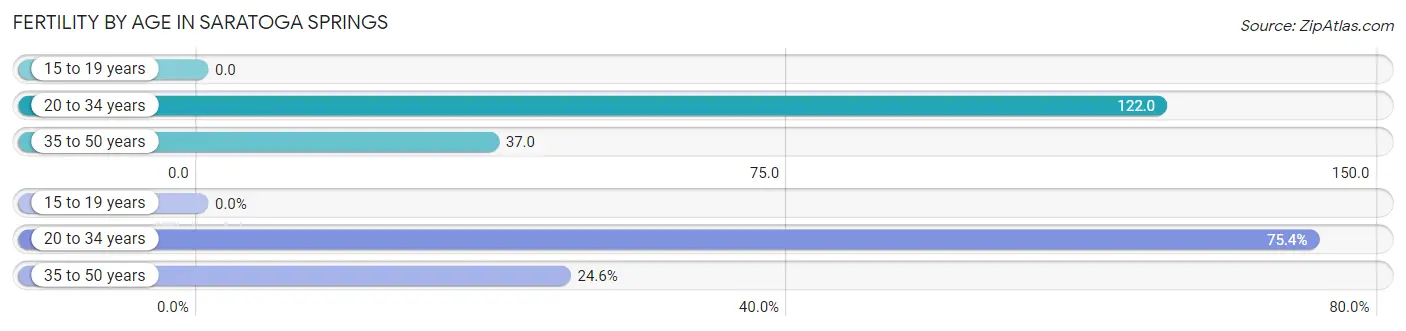
| Age Bracket | Women with Births | Births / 1,000 Women |
| 15 to 19 years | 0 (0.0%) | 0.0 |
| 20 to 34 years | 466 (75.4%) | 122.0 |
| 35 to 50 years | 152 (24.6%) | 37.0 |
| Total | 618 (100.0%) | 63.0 |
Fertility by Age by Marriage Status in Saratoga Springs
97.4% of women with births (618) in Saratoga Springs are married. The highest percentage of unmarried women with births falls into 20 to 34 years age bracket with 3.4% of them unmarried at the time of birth, while the lowest percentage of unmarried women with births belong to 35 to 50 years age bracket with 0.0% of them unmarried.
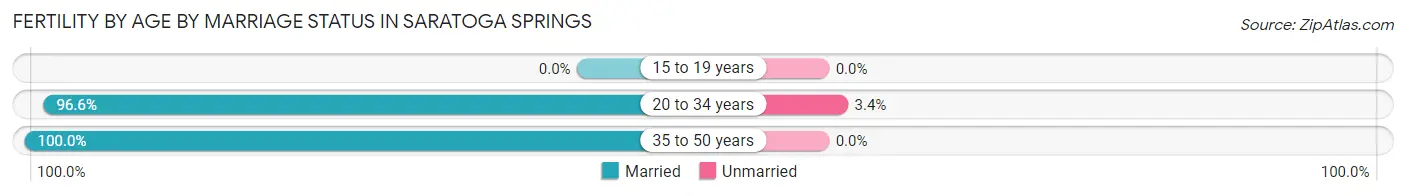
| Age Bracket | Married | Unmarried |
| 15 to 19 years | 0 (0.0%) | 0 (0.0%) |
| 20 to 34 years | 450 (96.6%) | 16 (3.4%) |
| 35 to 50 years | 152 (100.0%) | 0 (0.0%) |
| Total | 602 (97.4%) | 16 (2.6%) |
Fertility by Education in Saratoga Springs
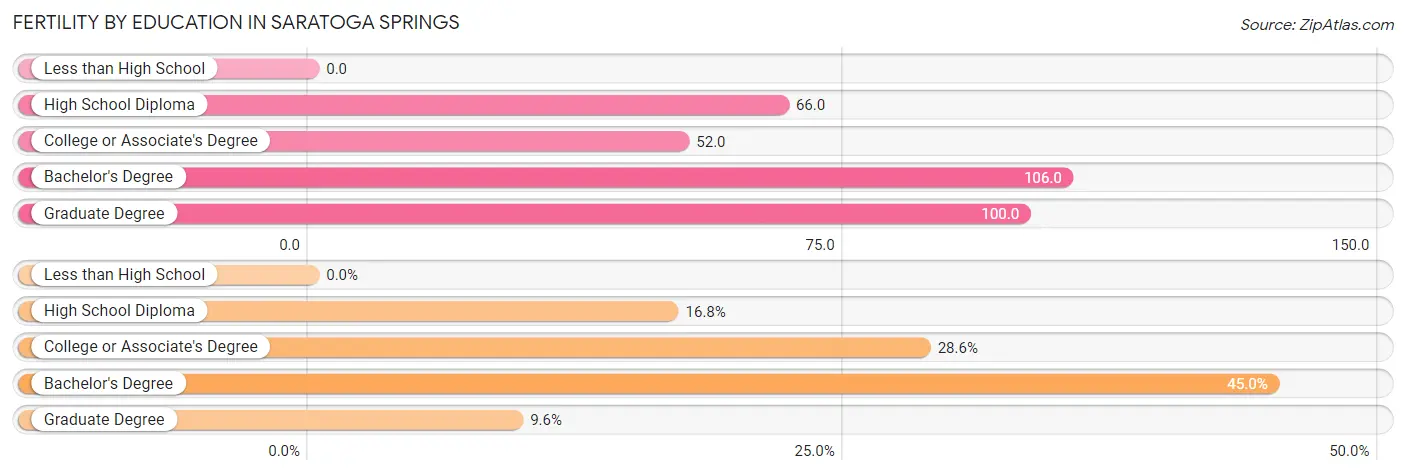
| Educational Attainment | Women with Births | Births / 1,000 Women |
| Less than High School | 0 (0.0%) | 0.0 |
| High School Diploma | 104 (16.8%) | 66.0 |
| College or Associate's Degree | 177 (28.6%) | 52.0 |
| Bachelor's Degree | 278 (45.0%) | 106.0 |
| Graduate Degree | 59 (9.6%) | 100.0 |
| Total | 618 (100.0%) | 63.0 |
Fertility by Education by Marriage Status in Saratoga Springs
2.6% of women with births in Saratoga Springs are unmarried. Women with the educational attainment of high school diploma are most likely to be married with 100.0% of them married at childbirth, while women with the educational attainment of college or associate's degree are least likely to be married with 9.0% of them unmarried at childbirth.
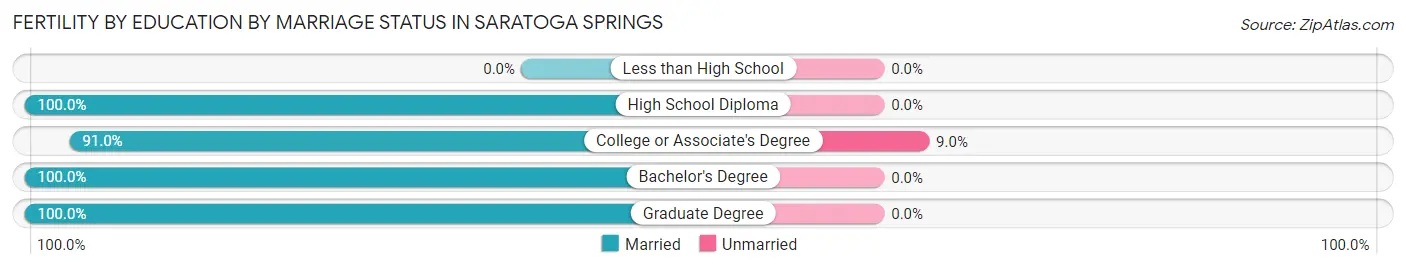
| Educational Attainment | Married | Unmarried |
| Less than High School | 0 (0.0%) | 0 (0.0%) |
| High School Diploma | 104 (100.0%) | 0 (0.0%) |
| College or Associate's Degree | 161 (91.0%) | 16 (9.0%) |
| Bachelor's Degree | 278 (100.0%) | 0 (0.0%) |
| Graduate Degree | 59 (100.0%) | 0 (0.0%) |
| Total | 602 (97.4%) | 16 (2.6%) |
Employment Characteristics in Saratoga Springs
Employment by Class of Employer in Saratoga Springs
Among the 16,585 employed individuals in Saratoga Springs, private company employees (12,022 | 72.5%), not-for-profit organizations (1,117 | 6.7%), and self-employed (not incorporated) (909 | 5.5%) make up the most common classes of employment.
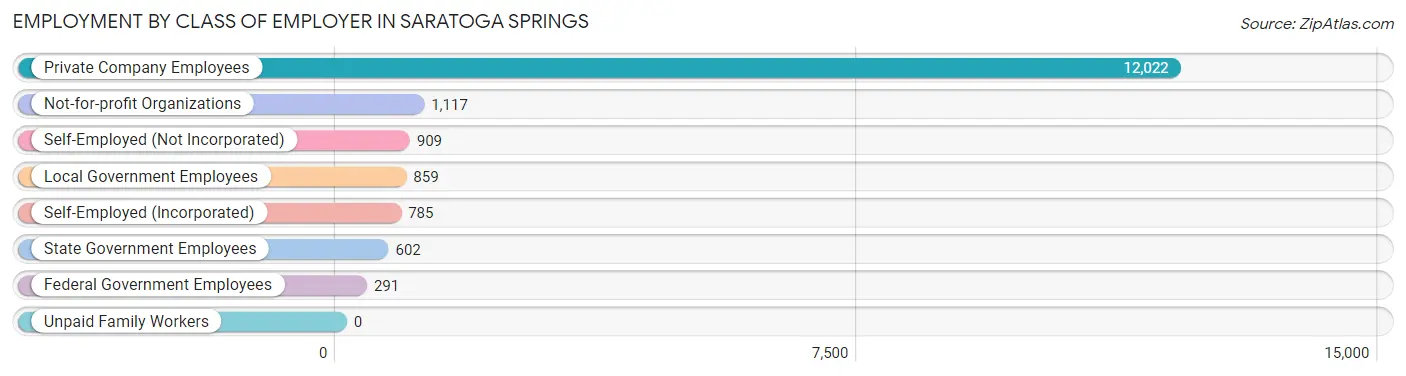
| Employer Class | # Employees | % Employees |
| Private Company Employees | 12,022 | 72.5% |
| Self-Employed (Incorporated) | 785 | 4.7% |
| Self-Employed (Not Incorporated) | 909 | 5.5% |
| Not-for-profit Organizations | 1,117 | 6.7% |
| Local Government Employees | 859 | 5.2% |
| State Government Employees | 602 | 3.6% |
| Federal Government Employees | 291 | 1.8% |
| Unpaid Family Workers | 0 | 0.0% |
| Total | 16,585 | 100.0% |
Employment Status by Age in Saratoga Springs
According to the labor force statistics for Saratoga Springs, out of the total population over 16 years of age (24,513), 70.6% or 17,306 individuals are in the labor force, with 2.2% or 381 of them unemployed. The age group with the highest labor force participation rate is 45 to 54 years, with 83.4% or 2,843 individuals in the labor force. Within the labor force, the 16 to 19 years age range has the highest percentage of unemployed individuals, with 9.4% or 175 of them being unemployed.
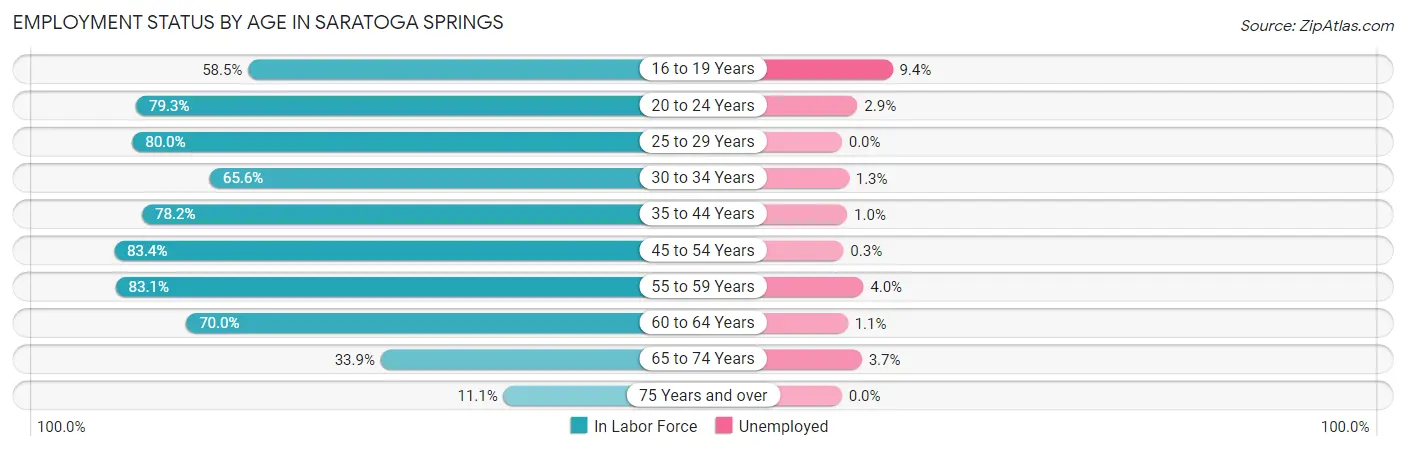
| Age Bracket | In Labor Force | Unemployed |
| 16 to 19 Years | 1,863 (58.5%) | 175 (9.4%) |
| 20 to 24 Years | 1,804 (79.3%) | 52 (2.9%) |
| 25 to 29 Years | 1,813 (80.0%) | 0 (0.0%) |
| 30 to 34 Years | 2,198 (65.6%) | 29 (1.3%) |
| 35 to 44 Years | 4,870 (78.2%) | 49 (1.0%) |
| 45 to 54 Years | 2,843 (83.4%) | 9 (0.3%) |
| 55 to 59 Years | 905 (83.1%) | 36 (4.0%) |
| 60 to 64 Years | 469 (70.0%) | 5 (1.1%) |
| 65 to 74 Years | 465 (33.9%) | 17 (3.7%) |
| 75 Years and over | 74 (11.1%) | 0 (0.0%) |
| Total | 17,306 (70.6%) | 381 (2.2%) |
Employment Status by Educational Attainment in Saratoga Springs
According to labor force statistics for Saratoga Springs, 77.0% of individuals (13,100) out of the total population between 25 and 64 years of age (17,013) are in the labor force, with 1.0% or 131 of them being unemployed. The group with the highest labor force participation rate are those with the educational attainment of bachelor's degree or higher, with 81.9% or 6,844 individuals in the labor force. Within the labor force, individuals with college / associate degree education have the highest percentage of unemployment, with 1.5% or 69 of them being unemployed.
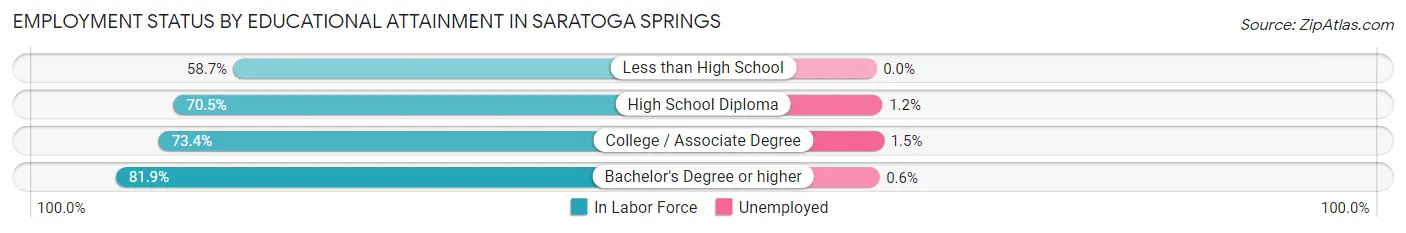
| Educational Attainment | In Labor Force | Unemployed |
| Less than High School | 145 (58.7%) | 0 (0.0%) |
| High School Diploma | 1,500 (70.5%) | 26 (1.2%) |
| College / Associate Degree | 4,612 (73.4%) | 94 (1.5%) |
| Bachelor's Degree or higher | 6,844 (81.9%) | 50 (0.6%) |
| Total | 13,100 (77.0%) | 170 (1.0%) |
Employment Occupations by Sex in Saratoga Springs
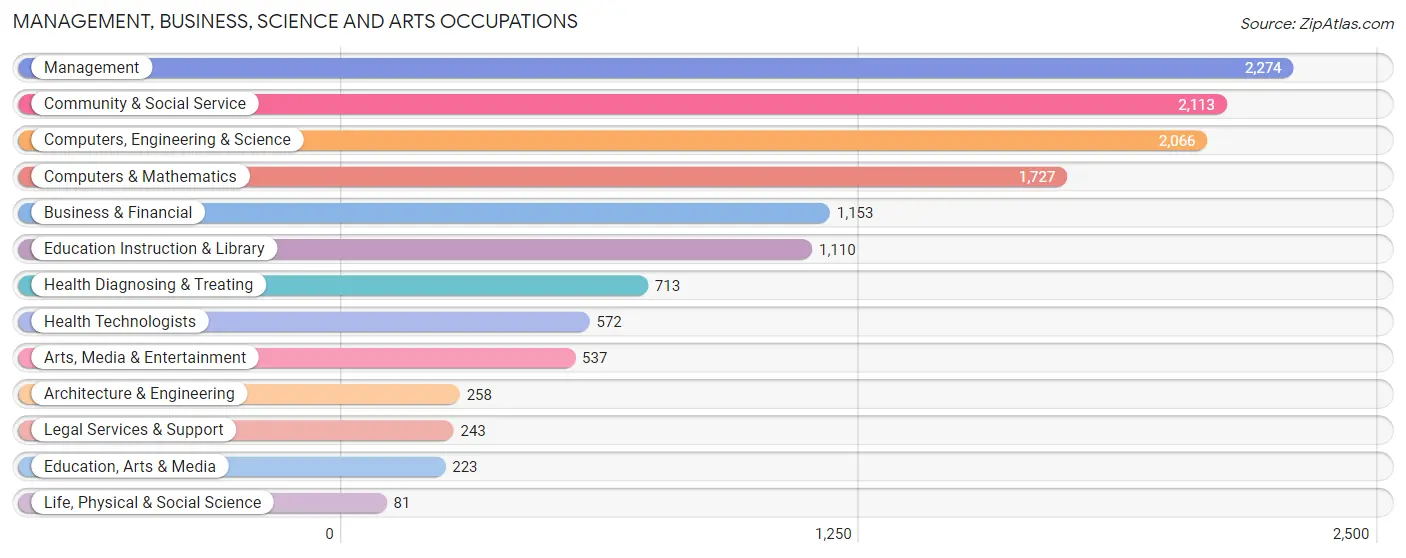
Management, Business, Science and Arts Occupations
The most common Management, Business, Science and Arts occupations in Saratoga Springs are Management (2,274 | 13.5%), Community & Social Service (2,113 | 12.5%), Computers, Engineering & Science (2,066 | 12.2%), Computers & Mathematics (1,727 | 10.2%), and Business & Financial (1,153 | 6.8%).
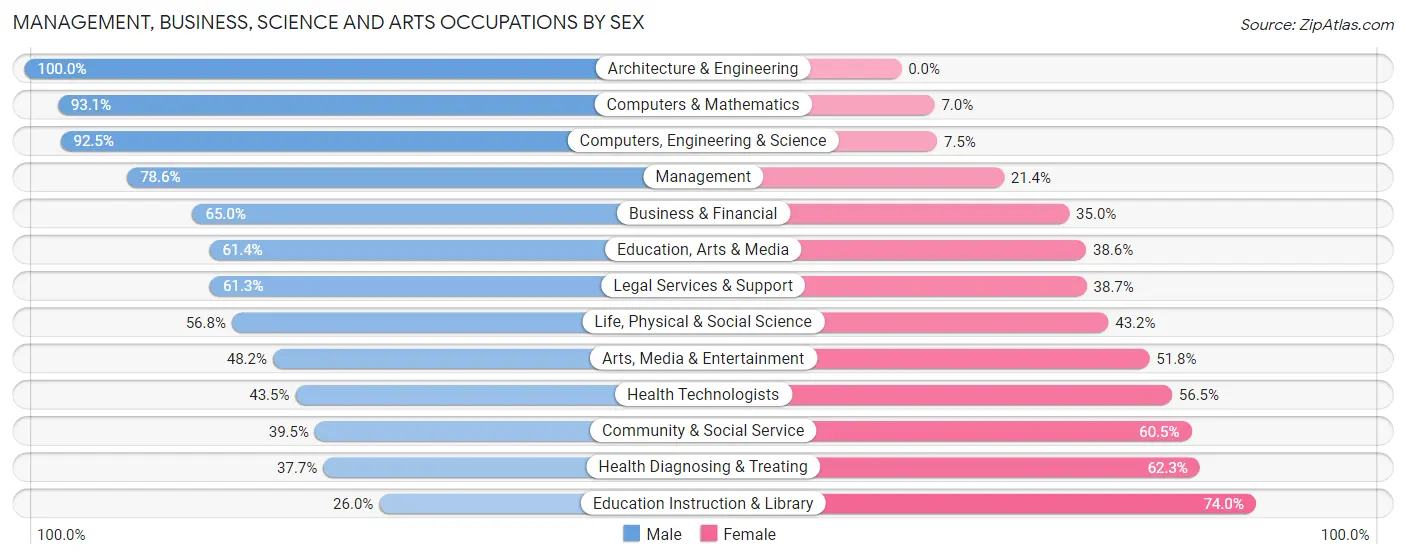
Management, Business, Science and Arts Occupations by Sex
Within the Management, Business, Science and Arts occupations in Saratoga Springs, the most male-oriented occupations are Architecture & Engineering (100.0%), Computers & Mathematics (93.0%), and Computers, Engineering & Science (92.5%), while the most female-oriented occupations are Education Instruction & Library (74.0%), Health Diagnosing & Treating (62.3%), and Community & Social Service (60.5%).
| Occupation | Male | Female |
| Management | 1,787 (78.6%) | 487 (21.4%) |
| Business & Financial | 749 (65.0%) | 404 (35.0%) |
| Computers, Engineering & Science | 1,911 (92.5%) | 155 (7.5%) |
| Computers & Mathematics | 1,607 (93.0%) | 120 (7.0%) |
| Architecture & Engineering | 258 (100.0%) | 0 (0.0%) |
| Life, Physical & Social Science | 46 (56.8%) | 35 (43.2%) |
| Community & Social Service | 834 (39.5%) | 1,279 (60.5%) |
| Education, Arts & Media | 137 (61.4%) | 86 (38.6%) |
| Legal Services & Support | 149 (61.3%) | 94 (38.7%) |
| Education Instruction & Library | 289 (26.0%) | 821 (74.0%) |
| Arts, Media & Entertainment | 259 (48.2%) | 278 (51.8%) |
| Health Diagnosing & Treating | 269 (37.7%) | 444 (62.3%) |
| Health Technologists | 249 (43.5%) | 323 (56.5%) |
| Total (Category) | 5,550 (66.7%) | 2,769 (33.3%) |
| Total (Overall) | 10,915 (64.6%) | 5,982 (35.4%) |
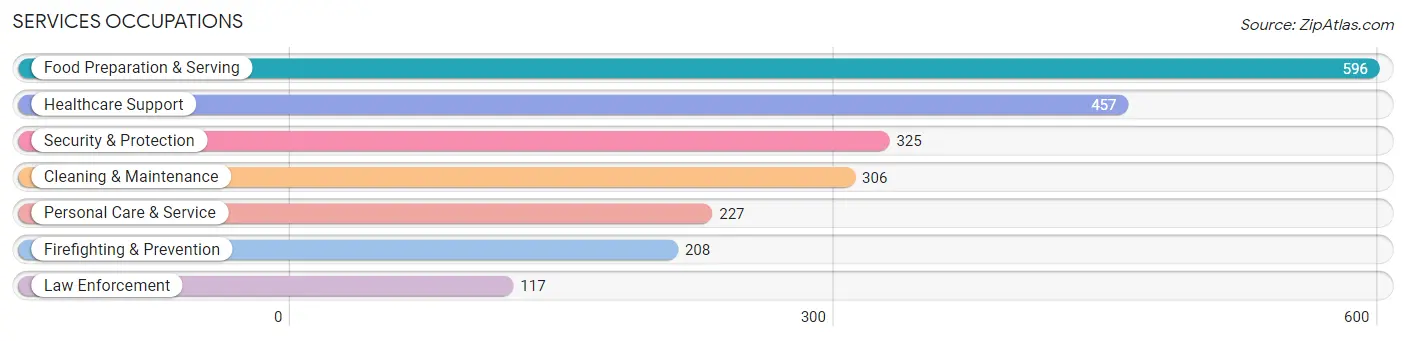
Services Occupations
The most common Services occupations in Saratoga Springs are Food Preparation & Serving (596 | 3.5%), Healthcare Support (457 | 2.7%), Security & Protection (325 | 1.9%), Cleaning & Maintenance (306 | 1.8%), and Personal Care & Service (227 | 1.3%).
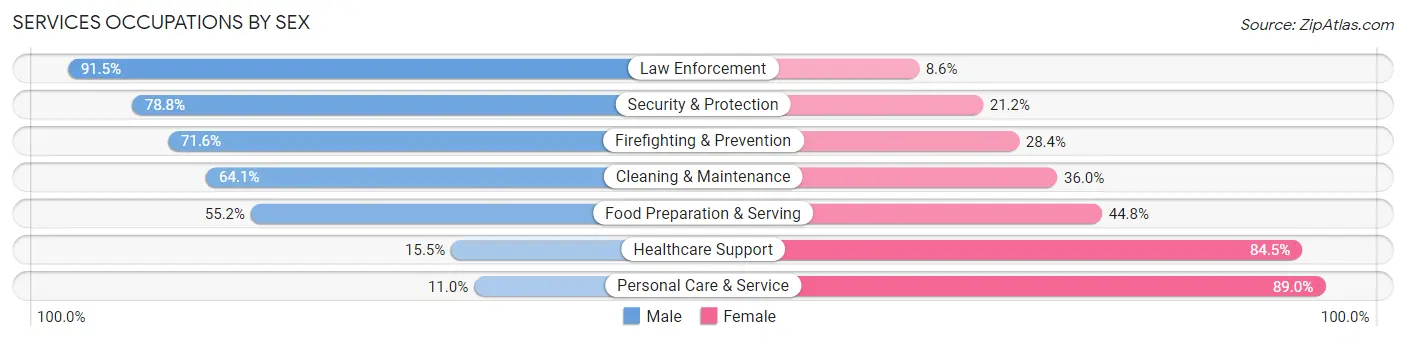
Services Occupations by Sex
Within the Services occupations in Saratoga Springs, the most male-oriented occupations are Law Enforcement (91.4%), Security & Protection (78.8%), and Firefighting & Prevention (71.6%), while the most female-oriented occupations are Personal Care & Service (89.0%), Healthcare Support (84.5%), and Food Preparation & Serving (44.8%).
| Occupation | Male | Female |
| Healthcare Support | 71 (15.5%) | 386 (84.5%) |
| Security & Protection | 256 (78.8%) | 69 (21.2%) |
| Firefighting & Prevention | 149 (71.6%) | 59 (28.4%) |
| Law Enforcement | 107 (91.4%) | 10 (8.6%) |
| Food Preparation & Serving | 329 (55.2%) | 267 (44.8%) |
| Cleaning & Maintenance | 196 (64.0%) | 110 (35.9%) |
| Personal Care & Service | 25 (11.0%) | 202 (89.0%) |
| Total (Category) | 877 (45.9%) | 1,034 (54.1%) |
| Total (Overall) | 10,915 (64.6%) | 5,982 (35.4%) |
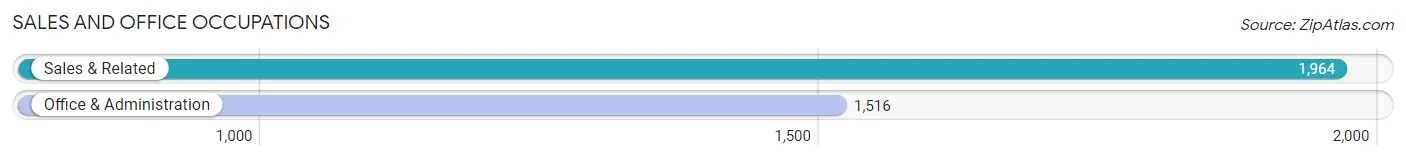
Sales and Office Occupations
The most common Sales and Office occupations in Saratoga Springs are Sales & Related (1,964 | 11.6%), and Office & Administration (1,516 | 9.0%).
Sales and Office Occupations by Sex
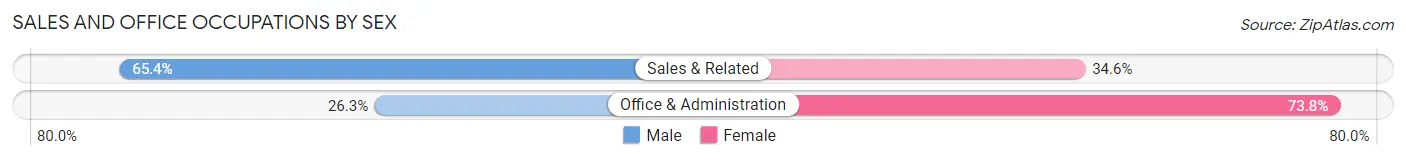
| Occupation | Male | Female |
| Sales & Related | 1,285 (65.4%) | 679 (34.6%) |
| Office & Administration | 398 (26.3%) | 1,118 (73.8%) |
| Total (Category) | 1,683 (48.4%) | 1,797 (51.6%) |
| Total (Overall) | 10,915 (64.6%) | 5,982 (35.4%) |
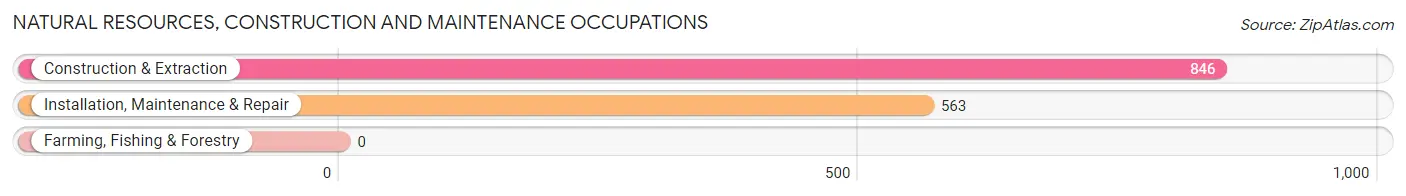
Natural Resources, Construction and Maintenance Occupations
The most common Natural Resources, Construction and Maintenance occupations in Saratoga Springs are Construction & Extraction (846 | 5.0%), and Installation, Maintenance & Repair (563 | 3.3%).
Natural Resources, Construction and Maintenance Occupations by Sex
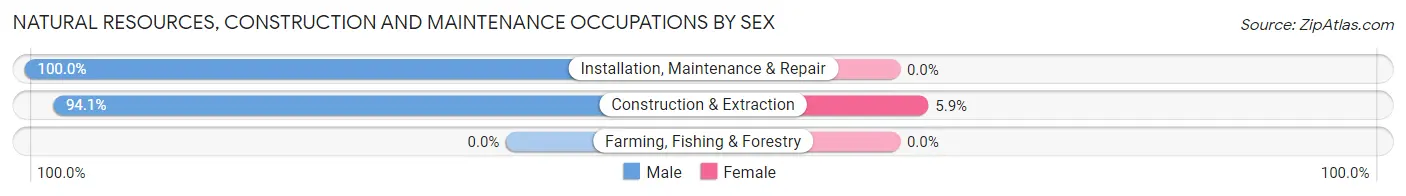
| Occupation | Male | Female |
| Farming, Fishing & Forestry | 0 (0.0%) | 0 (0.0%) |
| Construction & Extraction | 796 (94.1%) | 50 (5.9%) |
| Installation, Maintenance & Repair | 563 (100.0%) | 0 (0.0%) |
| Total (Category) | 1,359 (96.5%) | 50 (3.5%) |
| Total (Overall) | 10,915 (64.6%) | 5,982 (35.4%) |
Production, Transportation and Moving Occupations
The most common Production, Transportation and Moving occupations in Saratoga Springs are Production (787 | 4.7%), Material Moving (503 | 3.0%), and Transportation (488 | 2.9%).
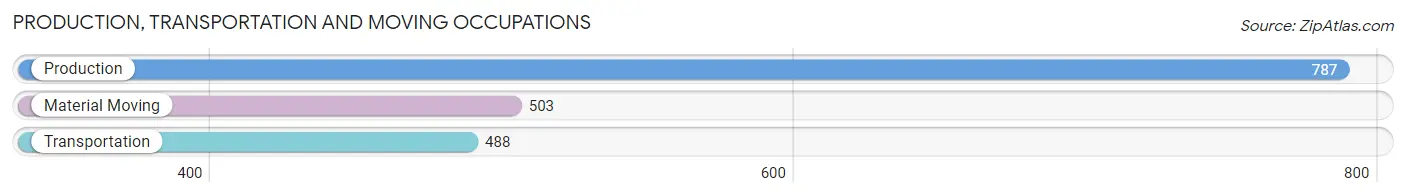
Production, Transportation and Moving Occupations by Sex
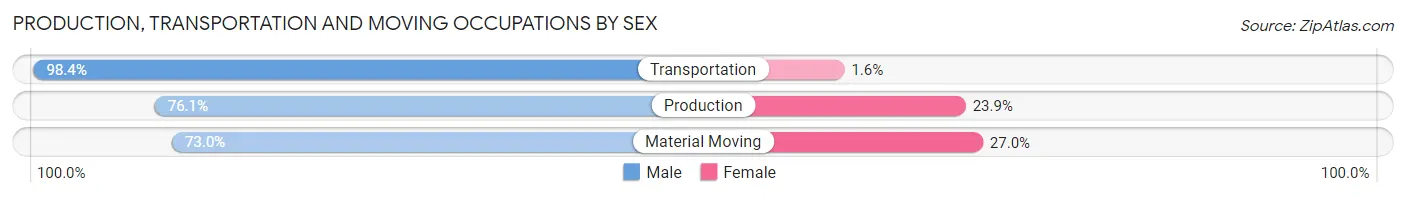
| Occupation | Male | Female |
| Production | 599 (76.1%) | 188 (23.9%) |
| Transportation | 480 (98.4%) | 8 (1.6%) |
| Material Moving | 367 (73.0%) | 136 (27.0%) |
| Total (Category) | 1,446 (81.3%) | 332 (18.7%) |
| Total (Overall) | 10,915 (64.6%) | 5,982 (35.4%) |
Employment Industries by Sex in Saratoga Springs
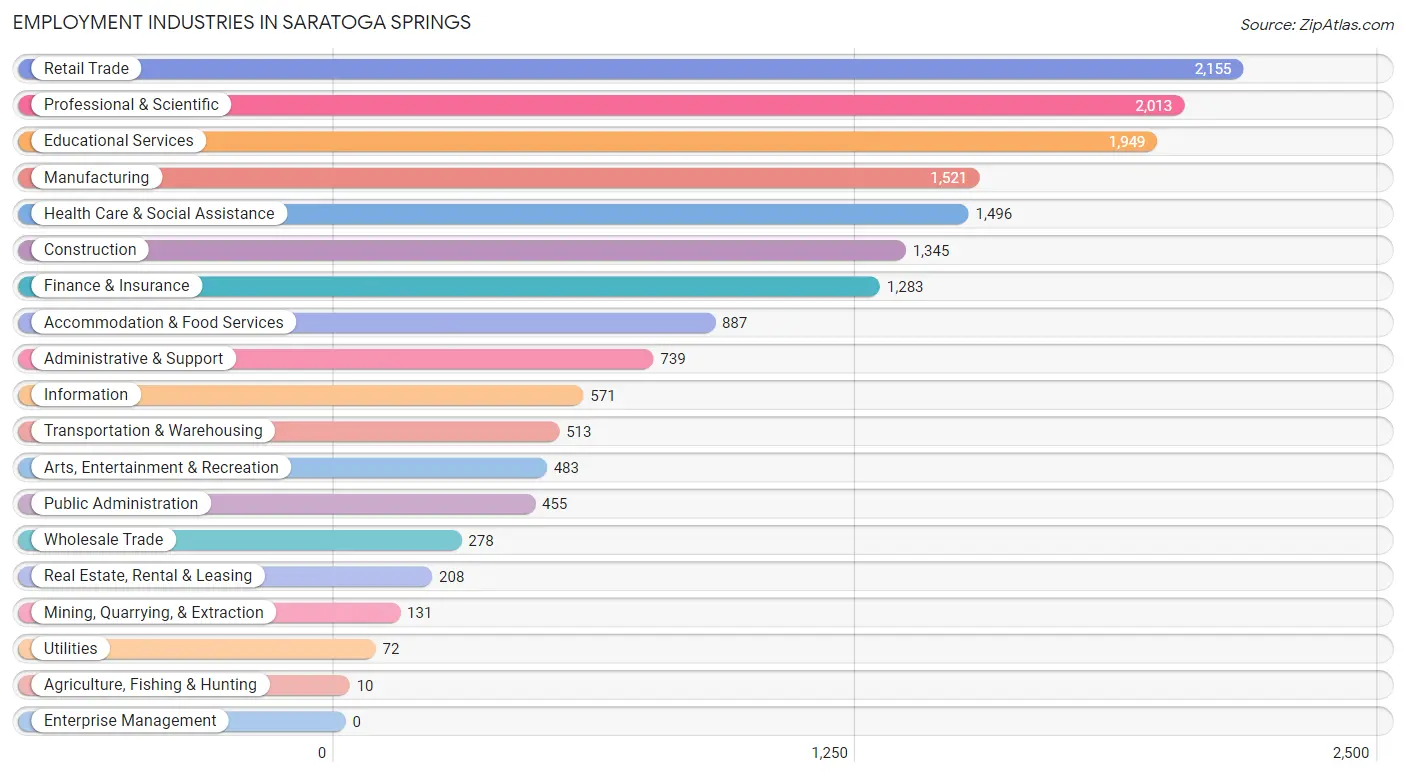
Employment Industries in Saratoga Springs
The major employment industries in Saratoga Springs include Retail Trade (2,155 | 12.8%), Professional & Scientific (2,013 | 11.9%), Educational Services (1,949 | 11.5%), Manufacturing (1,521 | 9.0%), and Health Care & Social Assistance (1,496 | 8.8%).
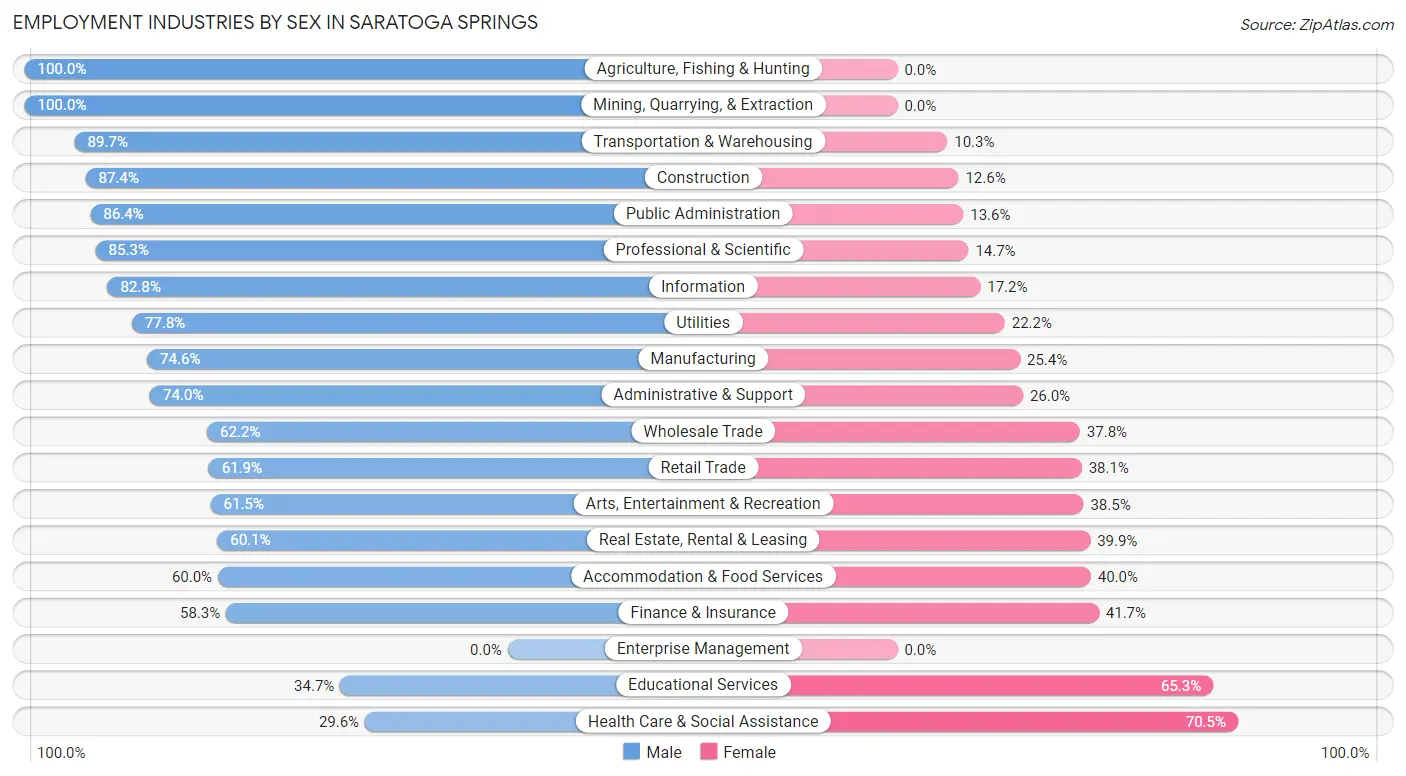
Employment Industries by Sex in Saratoga Springs
The Saratoga Springs industries that see more men than women are Agriculture, Fishing & Hunting (100.0%), Mining, Quarrying, & Extraction (100.0%), and Transportation & Warehousing (89.7%), whereas the industries that tend to have a higher number of women are Health Care & Social Assistance (70.5%), Educational Services (65.3%), and Finance & Insurance (41.7%).
| Industry | Male | Female |
| Agriculture, Fishing & Hunting | 10 (100.0%) | 0 (0.0%) |
| Mining, Quarrying, & Extraction | 131 (100.0%) | 0 (0.0%) |
| Construction | 1,175 (87.4%) | 170 (12.6%) |
| Manufacturing | 1,135 (74.6%) | 386 (25.4%) |
| Wholesale Trade | 173 (62.2%) | 105 (37.8%) |
| Retail Trade | 1,333 (61.9%) | 822 (38.1%) |
| Transportation & Warehousing | 460 (89.7%) | 53 (10.3%) |
| Utilities | 56 (77.8%) | 16 (22.2%) |
| Information | 473 (82.8%) | 98 (17.2%) |
| Finance & Insurance | 748 (58.3%) | 535 (41.7%) |
| Real Estate, Rental & Leasing | 125 (60.1%) | 83 (39.9%) |
| Professional & Scientific | 1,717 (85.3%) | 296 (14.7%) |
| Enterprise Management | 0 (0.0%) | 0 (0.0%) |
| Administrative & Support | 547 (74.0%) | 192 (26.0%) |
| Educational Services | 676 (34.7%) | 1,273 (65.3%) |
| Health Care & Social Assistance | 442 (29.5%) | 1,054 (70.5%) |
| Arts, Entertainment & Recreation | 297 (61.5%) | 186 (38.5%) |
| Accommodation & Food Services | 532 (60.0%) | 355 (40.0%) |
| Public Administration | 393 (86.4%) | 62 (13.6%) |
| Total | 10,915 (64.6%) | 5,982 (35.4%) |
Education in Saratoga Springs
School Enrollment in Saratoga Springs
The most common levels of schooling among the 16,545 students in Saratoga Springs are middle school (4,161 | 25.2%), high school (3,871 | 23.4%), and elementary school (3,531 | 21.3%).
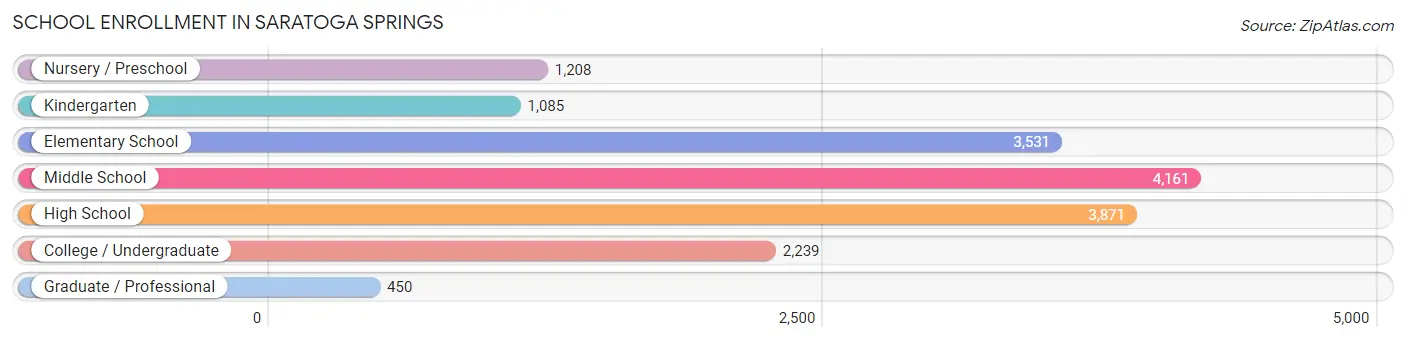
| School Level | # Students | % Students |
| Nursery / Preschool | 1,208 | 7.3% |
| Kindergarten | 1,085 | 6.6% |
| Elementary School | 3,531 | 21.3% |
| Middle School | 4,161 | 25.2% |
| High School | 3,871 | 23.4% |
| College / Undergraduate | 2,239 | 13.5% |
| Graduate / Professional | 450 | 2.7% |
| Total | 16,545 | 100.0% |
School Enrollment by Age by Funding Source in Saratoga Springs
Out of a total of 16,545 students who are enrolled in schools in Saratoga Springs, 1,969 (11.9%) attend a private institution, while the remaining 14,576 (88.1%) are enrolled in public schools. The age group of 3 to 4 year olds has the highest likelihood of being enrolled in private schools, with 320 (39.9% in the age bracket) enrolled. Conversely, the age group of 18 to 19 year olds has the lowest likelihood of being enrolled in a private school, with 1,051 (100.0% in the age bracket) attending a public institution.
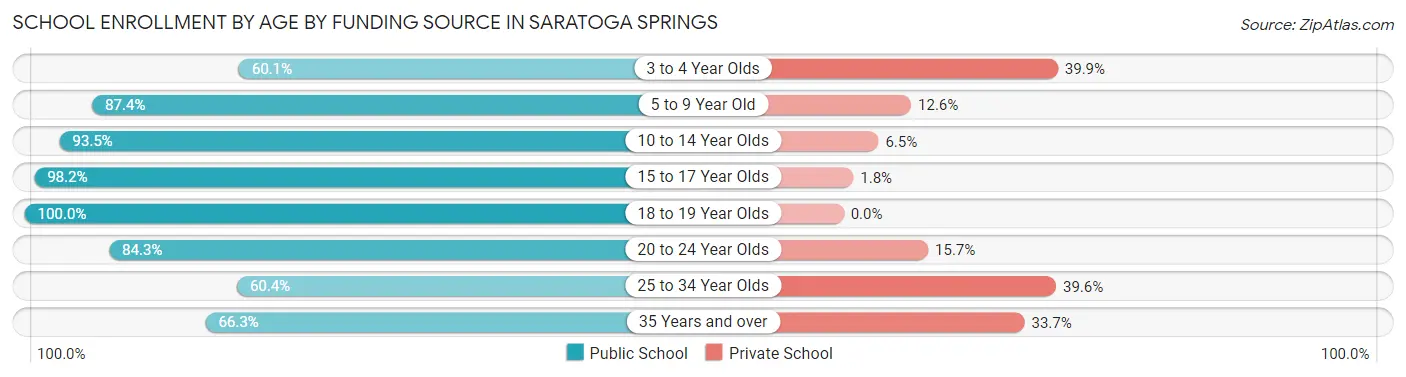
| Age Bracket | Public School | Private School |
| 3 to 4 Year Olds | 482 (60.1%) | 320 (39.9%) |
| 5 to 9 Year Old | 4,101 (87.4%) | 589 (12.6%) |
| 10 to 14 Year Olds | 4,713 (93.5%) | 327 (6.5%) |
| 15 to 17 Year Olds | 2,516 (98.2%) | 46 (1.8%) |
| 18 to 19 Year Olds | 1,051 (100.0%) | 0 (0.0%) |
| 20 to 24 Year Olds | 814 (84.3%) | 152 (15.7%) |
| 25 to 34 Year Olds | 472 (60.4%) | 309 (39.6%) |
| 35 Years and over | 433 (66.3%) | 220 (33.7%) |
| Total | 14,576 (88.1%) | 1,969 (11.9%) |
Educational Attainment by Field of Study in Saratoga Springs
Business (1,992 | 19.7%), education (1,516 | 15.0%), science & technology (1,029 | 10.2%), arts & humanities (915 | 9.1%), and computers & mathematics (781 | 7.7%) are the most common fields of study among 10,100 individuals in Saratoga Springs who have obtained a bachelor's degree or higher.
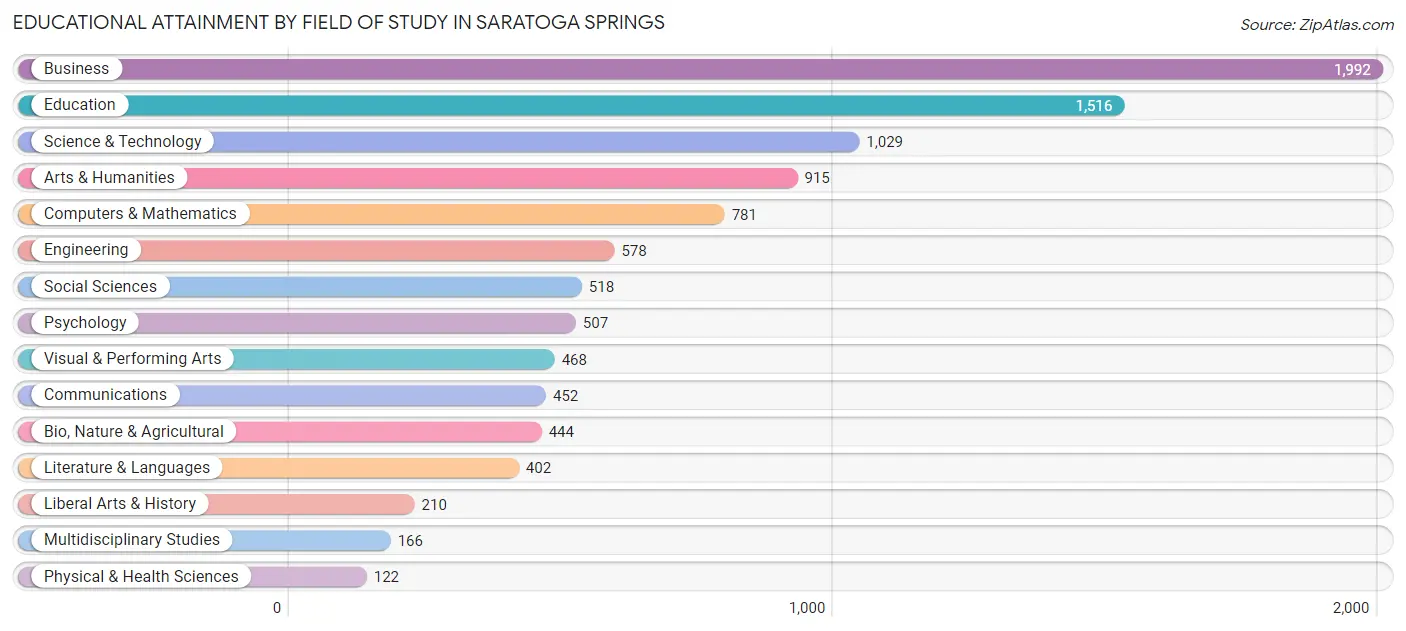
| Field of Study | # Graduates | % Graduates |
| Computers & Mathematics | 781 | 7.7% |
| Bio, Nature & Agricultural | 444 | 4.4% |
| Physical & Health Sciences | 122 | 1.2% |
| Psychology | 507 | 5.0% |
| Social Sciences | 518 | 5.1% |
| Engineering | 578 | 5.7% |
| Multidisciplinary Studies | 166 | 1.6% |
| Science & Technology | 1,029 | 10.2% |
| Business | 1,992 | 19.7% |
| Education | 1,516 | 15.0% |
| Literature & Languages | 402 | 4.0% |
| Liberal Arts & History | 210 | 2.1% |
| Visual & Performing Arts | 468 | 4.6% |
| Communications | 452 | 4.5% |
| Arts & Humanities | 915 | 9.1% |
| Total | 10,100 | 100.0% |
Transportation & Commute in Saratoga Springs
Vehicle Availability by Sex in Saratoga Springs
The most prevalent vehicle ownership categories in Saratoga Springs are males with 2 vehicles (4,683, accounting for 43.3%) and females with 2 vehicles (2,108, making up 81.1%).
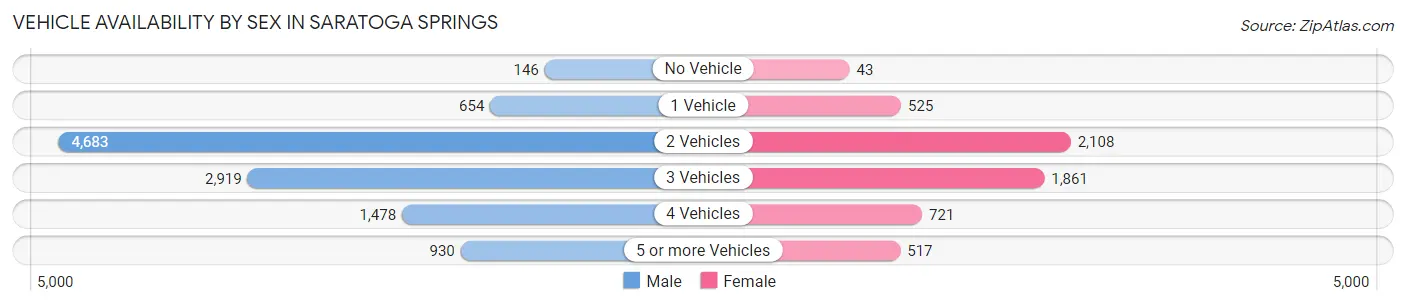
| Vehicles Available | Male | Female |
| No Vehicle | 146 (1.3%) | 43 (0.7%) |
| 1 Vehicle | 654 (6.0%) | 525 (9.1%) |
| 2 Vehicles | 4,683 (43.3%) | 2,108 (36.5%) |
| 3 Vehicles | 2,919 (27.0%) | 1,861 (32.2%) |
| 4 Vehicles | 1,478 (13.7%) | 721 (12.5%) |
| 5 or more Vehicles | 930 (8.6%) | 517 (8.9%) |
| Total | 10,810 (100.0%) | 5,775 (100.0%) |
Commute Time in Saratoga Springs
The most frequently occuring commute durations in Saratoga Springs are 30 to 34 minutes (2,422 commuters, 18.0%), 20 to 24 minutes (1,842 commuters, 13.7%), and 45 to 59 minutes (1,499 commuters, 11.2%).
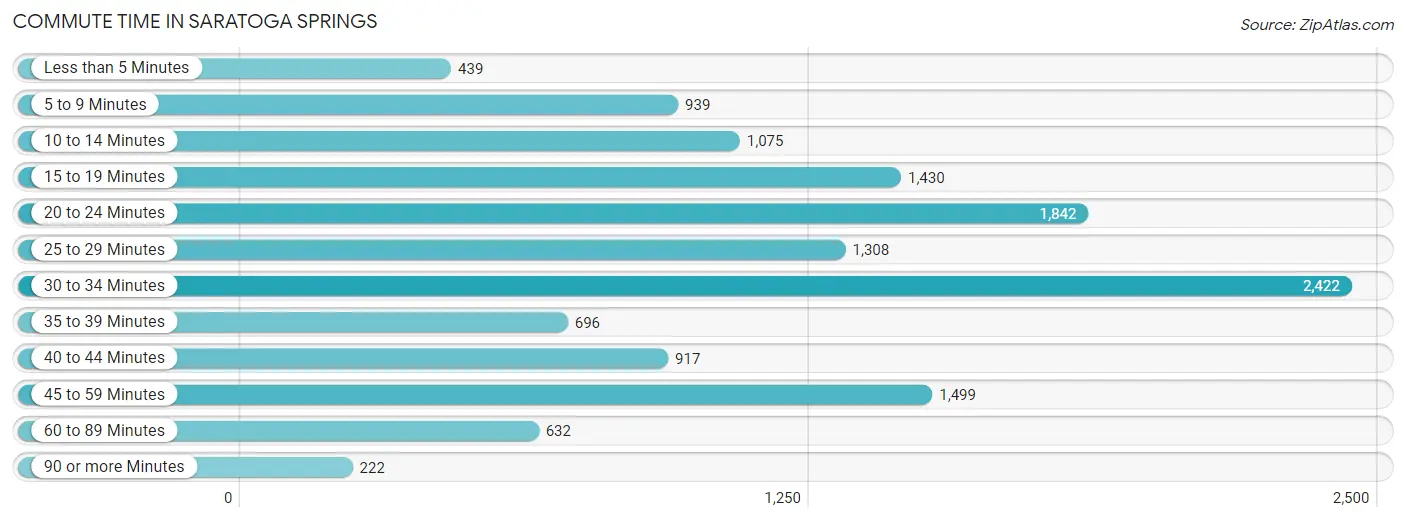
| Commute Time | # Commuters | % Commuters |
| Less than 5 Minutes | 439 | 3.3% |
| 5 to 9 Minutes | 939 | 7.0% |
| 10 to 14 Minutes | 1,075 | 8.0% |
| 15 to 19 Minutes | 1,430 | 10.6% |
| 20 to 24 Minutes | 1,842 | 13.7% |
| 25 to 29 Minutes | 1,308 | 9.8% |
| 30 to 34 Minutes | 2,422 | 18.0% |
| 35 to 39 Minutes | 696 | 5.2% |
| 40 to 44 Minutes | 917 | 6.8% |
| 45 to 59 Minutes | 1,499 | 11.2% |
| 60 to 89 Minutes | 632 | 4.7% |
| 90 or more Minutes | 222 | 1.7% |
Commute Time by Sex in Saratoga Springs
The most common commute times in Saratoga Springs are 30 to 34 minutes (1,620 commuters, 18.7%) for males and 20 to 24 minutes (844 commuters, 17.7%) for females.
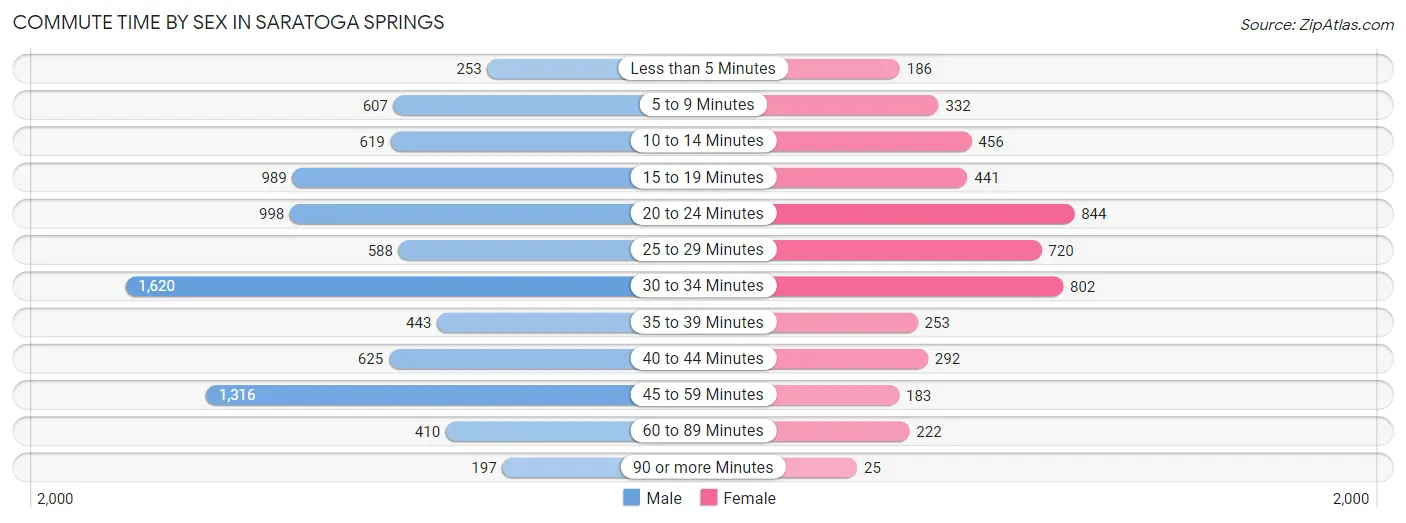
| Commute Time | Male | Female |
| Less than 5 Minutes | 253 (2.9%) | 186 (3.9%) |
| 5 to 9 Minutes | 607 (7.0%) | 332 (7.0%) |
| 10 to 14 Minutes | 619 (7.1%) | 456 (9.6%) |
| 15 to 19 Minutes | 989 (11.4%) | 441 (9.3%) |
| 20 to 24 Minutes | 998 (11.5%) | 844 (17.7%) |
| 25 to 29 Minutes | 588 (6.8%) | 720 (15.1%) |
| 30 to 34 Minutes | 1,620 (18.7%) | 802 (16.9%) |
| 35 to 39 Minutes | 443 (5.1%) | 253 (5.3%) |
| 40 to 44 Minutes | 625 (7.2%) | 292 (6.1%) |
| 45 to 59 Minutes | 1,316 (15.2%) | 183 (3.8%) |
| 60 to 89 Minutes | 410 (4.7%) | 222 (4.7%) |
| 90 or more Minutes | 197 (2.3%) | 25 (0.5%) |
Time of Departure to Work by Sex in Saratoga Springs
The most frequent times of departure to work in Saratoga Springs are 7:00 AM to 7:29 AM (1,378, 15.9%) for males and 7:30 AM to 7:59 AM (913, 19.2%) for females.
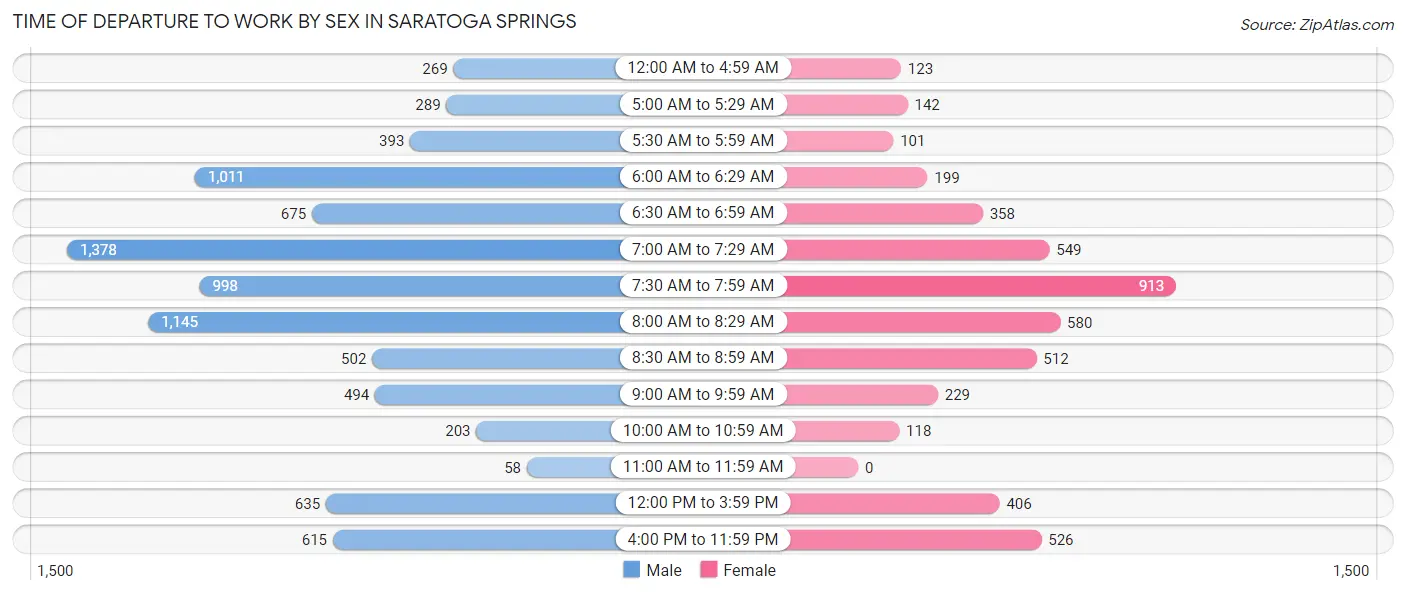
| Time of Departure | Male | Female |
| 12:00 AM to 4:59 AM | 269 (3.1%) | 123 (2.6%) |
| 5:00 AM to 5:29 AM | 289 (3.3%) | 142 (3.0%) |
| 5:30 AM to 5:59 AM | 393 (4.5%) | 101 (2.1%) |
| 6:00 AM to 6:29 AM | 1,011 (11.7%) | 199 (4.2%) |
| 6:30 AM to 6:59 AM | 675 (7.8%) | 358 (7.5%) |
| 7:00 AM to 7:29 AM | 1,378 (15.9%) | 549 (11.5%) |
| 7:30 AM to 7:59 AM | 998 (11.5%) | 913 (19.2%) |
| 8:00 AM to 8:29 AM | 1,145 (13.2%) | 580 (12.2%) |
| 8:30 AM to 8:59 AM | 502 (5.8%) | 512 (10.8%) |
| 9:00 AM to 9:59 AM | 494 (5.7%) | 229 (4.8%) |
| 10:00 AM to 10:59 AM | 203 (2.3%) | 118 (2.5%) |
| 11:00 AM to 11:59 AM | 58 (0.7%) | 0 (0.0%) |
| 12:00 PM to 3:59 PM | 635 (7.3%) | 406 (8.5%) |
| 4:00 PM to 11:59 PM | 615 (7.1%) | 526 (11.1%) |
| Total | 8,665 (100.0%) | 4,756 (100.0%) |
Housing Occupancy in Saratoga Springs
Occupancy by Ownership in Saratoga Springs
Of the total 9,716 dwellings in Saratoga Springs, owner-occupied units account for 8,149 (83.9%), while renter-occupied units make up 1,567 (16.1%).
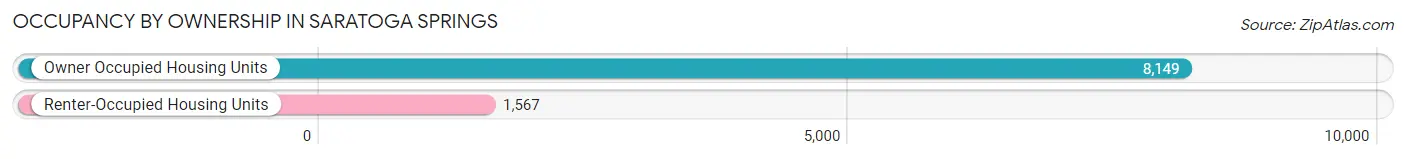
| Occupancy | # Housing Units | % Housing Units |
| Owner Occupied Housing Units | 8,149 | 83.9% |
| Renter-Occupied Housing Units | 1,567 | 16.1% |
| Total Occupied Housing Units | 9,716 | 100.0% |
Occupancy by Household Size in Saratoga Springs
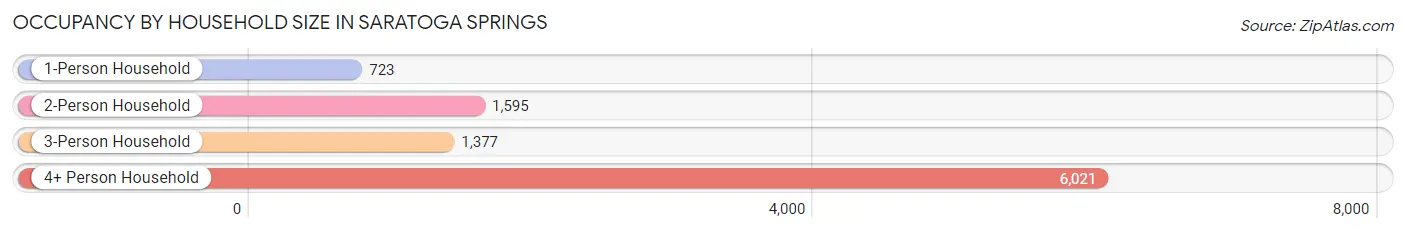
| Household Size | # Housing Units | % Housing Units |
| 1-Person Household | 723 | 7.4% |
| 2-Person Household | 1,595 | 16.4% |
| 3-Person Household | 1,377 | 14.2% |
| 4+ Person Household | 6,021 | 62.0% |
| Total Housing Units | 9,716 | 100.0% |
Occupancy by Ownership by Household Size in Saratoga Springs
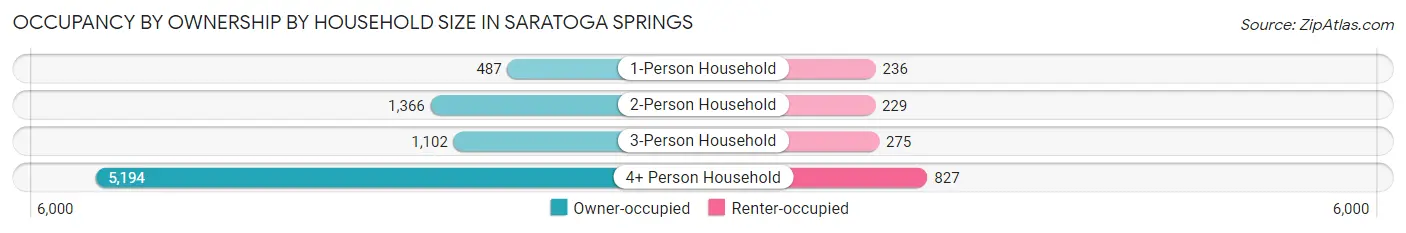
| Household Size | Owner-occupied | Renter-occupied |
| 1-Person Household | 487 (67.4%) | 236 (32.6%) |
| 2-Person Household | 1,366 (85.6%) | 229 (14.4%) |
| 3-Person Household | 1,102 (80.0%) | 275 (20.0%) |
| 4+ Person Household | 5,194 (86.3%) | 827 (13.7%) |
| Total Housing Units | 8,149 (83.9%) | 1,567 (16.1%) |
Occupancy by Educational Attainment in Saratoga Springs

| Household Size | Owner-occupied | Renter-occupied |
| Less than High School | 27 (37.0%) | 46 (63.0%) |
| High School Diploma | 693 (77.3%) | 204 (22.7%) |
| College/Associate Degree | 2,808 (82.4%) | 601 (17.6%) |
| Bachelor's Degree or higher | 4,621 (86.6%) | 716 (13.4%) |
Occupancy by Age of Householder in Saratoga Springs
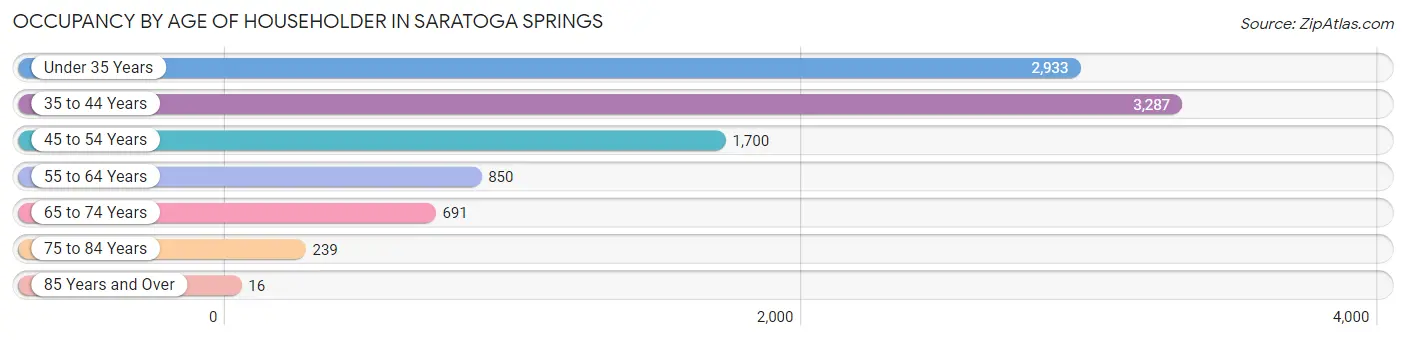
| Age Bracket | # Households | % Households |
| Under 35 Years | 2,933 | 30.2% |
| 35 to 44 Years | 3,287 | 33.8% |
| 45 to 54 Years | 1,700 | 17.5% |
| 55 to 64 Years | 850 | 8.7% |
| 65 to 74 Years | 691 | 7.1% |
| 75 to 84 Years | 239 | 2.5% |
| 85 Years and Over | 16 | 0.2% |
| Total | 9,716 | 100.0% |
Housing Finances in Saratoga Springs
Median Income by Occupancy in Saratoga Springs
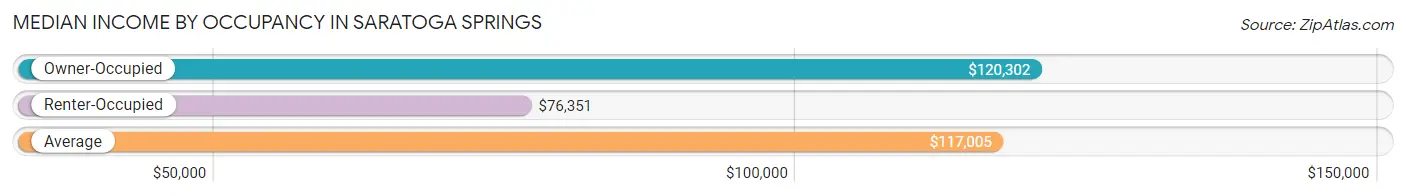
| Occupancy Type | # Households | Median Income |
| Owner-Occupied | 8,149 (83.9%) | $120,302 |
| Renter-Occupied | 1,567 (16.1%) | $76,351 |
| Average | 9,716 (100.0%) | $117,005 |
Occupancy by Householder Income Bracket in Saratoga Springs
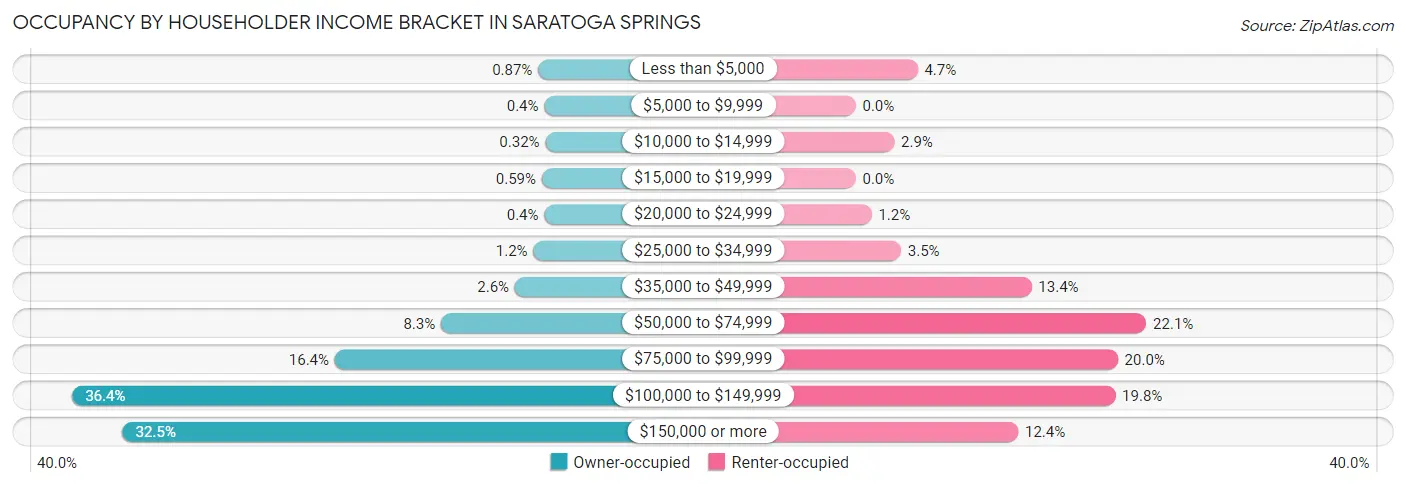
| Income Bracket | Owner-occupied | Renter-occupied |
| Less than $5,000 | 71 (0.9%) | 74 (4.7%) |
| $5,000 to $9,999 | 33 (0.4%) | 0 (0.0%) |
| $10,000 to $14,999 | 26 (0.3%) | 46 (2.9%) |
| $15,000 to $19,999 | 48 (0.6%) | 0 (0.0%) |
| $20,000 to $24,999 | 33 (0.4%) | 19 (1.2%) |
| $25,000 to $34,999 | 100 (1.2%) | 54 (3.5%) |
| $35,000 to $49,999 | 215 (2.6%) | 210 (13.4%) |
| $50,000 to $74,999 | 674 (8.3%) | 347 (22.1%) |
| $75,000 to $99,999 | 1,333 (16.4%) | 313 (20.0%) |
| $100,000 to $149,999 | 2,964 (36.4%) | 310 (19.8%) |
| $150,000 or more | 2,652 (32.5%) | 194 (12.4%) |
| Total | 8,149 (100.0%) | 1,567 (100.0%) |
Monthly Housing Cost Tiers in Saratoga Springs
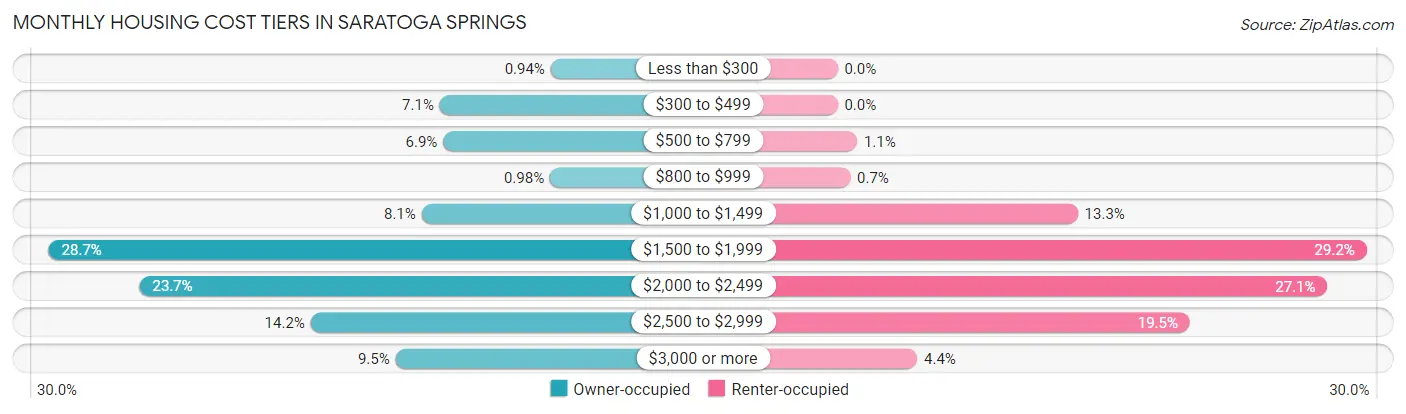
| Monthly Cost | Owner-occupied | Renter-occupied |
| Less than $300 | 77 (0.9%) | 0 (0.0%) |
| $300 to $499 | 576 (7.1%) | 0 (0.0%) |
| $500 to $799 | 561 (6.9%) | 17 (1.1%) |
| $800 to $999 | 80 (1.0%) | 11 (0.7%) |
| $1,000 to $1,499 | 658 (8.1%) | 208 (13.3%) |
| $1,500 to $1,999 | 2,337 (28.7%) | 458 (29.2%) |
| $2,000 to $2,499 | 1,928 (23.7%) | 424 (27.1%) |
| $2,500 to $2,999 | 1,157 (14.2%) | 305 (19.5%) |
| $3,000 or more | 775 (9.5%) | 69 (4.4%) |
| Total | 8,149 (100.0%) | 1,567 (100.0%) |
Physical Housing Characteristics in Saratoga Springs
Housing Structures in Saratoga Springs
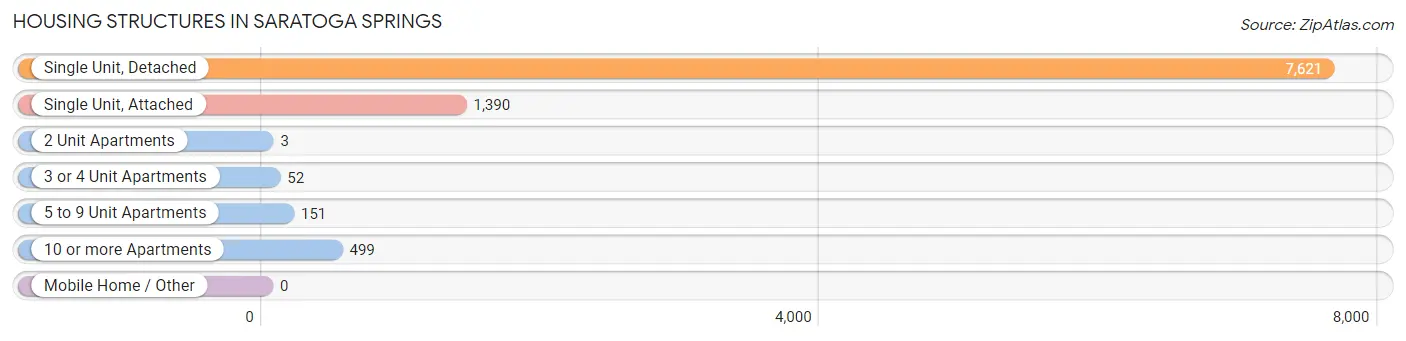
| Structure Type | # Housing Units | % Housing Units |
| Single Unit, Detached | 7,621 | 78.4% |
| Single Unit, Attached | 1,390 | 14.3% |
| 2 Unit Apartments | 3 | 0.0% |
| 3 or 4 Unit Apartments | 52 | 0.5% |
| 5 to 9 Unit Apartments | 151 | 1.5% |
| 10 or more Apartments | 499 | 5.1% |
| Mobile Home / Other | 0 | 0.0% |
| Total | 9,716 | 100.0% |
Housing Structures by Occupancy in Saratoga Springs
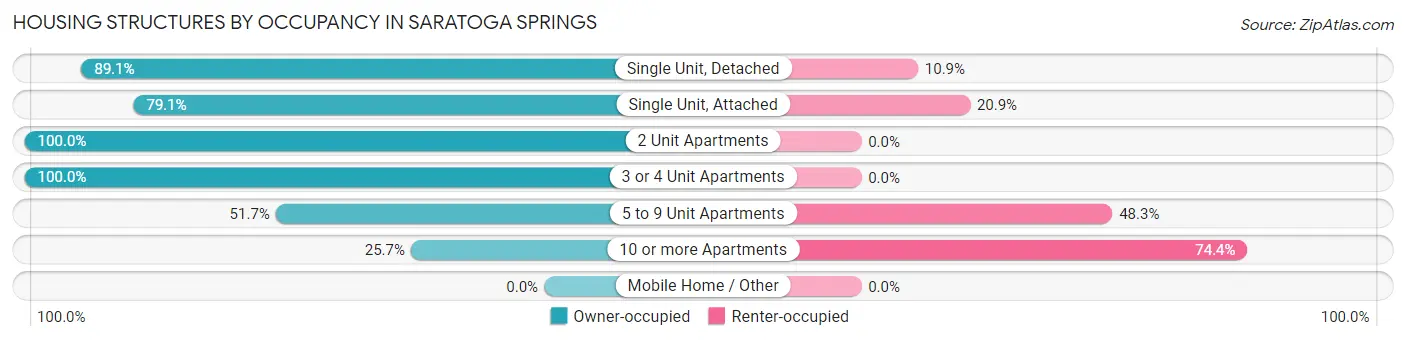
| Structure Type | Owner-occupied | Renter-occupied |
| Single Unit, Detached | 6,789 (89.1%) | 832 (10.9%) |
| Single Unit, Attached | 1,099 (79.1%) | 291 (20.9%) |
| 2 Unit Apartments | 3 (100.0%) | 0 (0.0%) |
| 3 or 4 Unit Apartments | 52 (100.0%) | 0 (0.0%) |
| 5 to 9 Unit Apartments | 78 (51.7%) | 73 (48.3%) |
| 10 or more Apartments | 128 (25.7%) | 371 (74.4%) |
| Mobile Home / Other | 0 (0.0%) | 0 (0.0%) |
| Total | 8,149 (83.9%) | 1,567 (16.1%) |
Housing Structures by Number of Rooms in Saratoga Springs
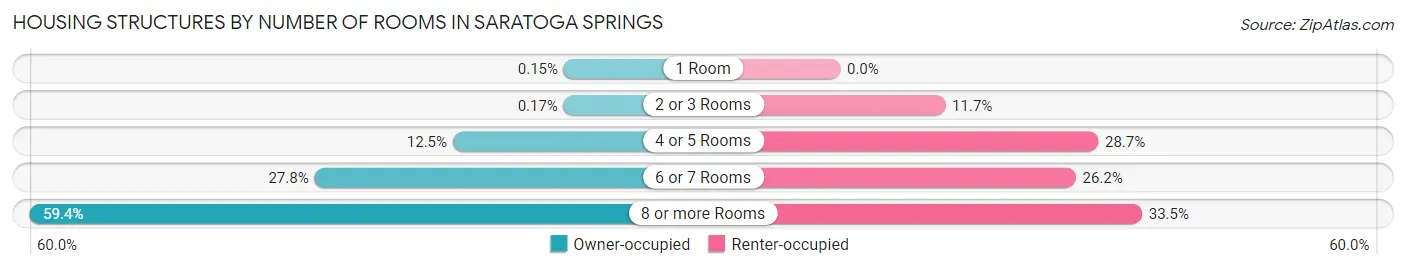
| Number of Rooms | Owner-occupied | Renter-occupied |
| 1 Room | 12 (0.2%) | 0 (0.0%) |
| 2 or 3 Rooms | 14 (0.2%) | 183 (11.7%) |
| 4 or 5 Rooms | 1,016 (12.5%) | 449 (28.6%) |
| 6 or 7 Rooms | 2,268 (27.8%) | 410 (26.2%) |
| 8 or more Rooms | 4,839 (59.4%) | 525 (33.5%) |
| Total | 8,149 (100.0%) | 1,567 (100.0%) |
Housing Structure by Heating Type in Saratoga Springs
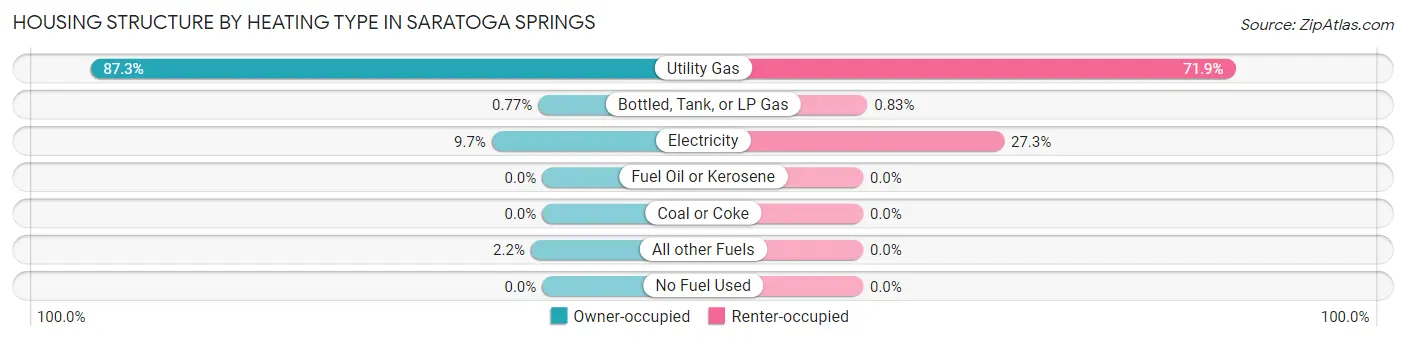
| Heating Type | Owner-occupied | Renter-occupied |
| Utility Gas | 7,113 (87.3%) | 1,127 (71.9%) |
| Bottled, Tank, or LP Gas | 63 (0.8%) | 13 (0.8%) |
| Electricity | 794 (9.7%) | 427 (27.3%) |
| Fuel Oil or Kerosene | 0 (0.0%) | 0 (0.0%) |
| Coal or Coke | 0 (0.0%) | 0 (0.0%) |
| All other Fuels | 179 (2.2%) | 0 (0.0%) |
| No Fuel Used | 0 (0.0%) | 0 (0.0%) |
| Total | 8,149 (100.0%) | 1,567 (100.0%) |
Household Vehicle Usage in Saratoga Springs
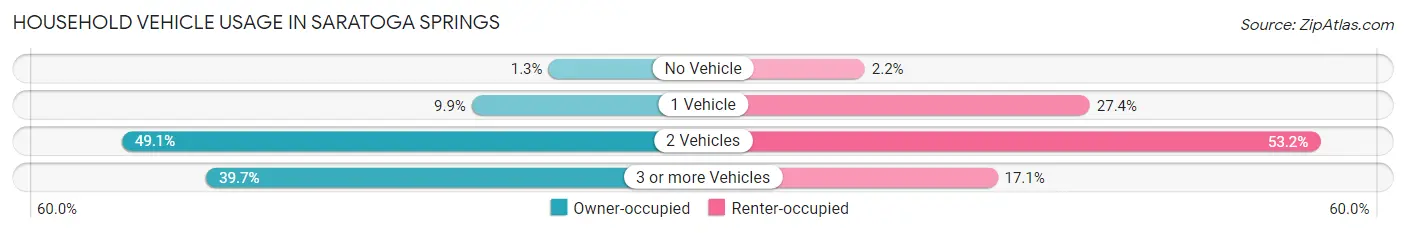
| Vehicles per Household | Owner-occupied | Renter-occupied |
| No Vehicle | 108 (1.3%) | 35 (2.2%) |
| 1 Vehicle | 808 (9.9%) | 430 (27.4%) |
| 2 Vehicles | 4,001 (49.1%) | 834 (53.2%) |
| 3 or more Vehicles | 3,232 (39.7%) | 268 (17.1%) |
| Total | 8,149 (100.0%) | 1,567 (100.0%) |
Real Estate & Mortgages in Saratoga Springs
Real Estate and Mortgage Overview in Saratoga Springs
| Characteristic | Without Mortgage | With Mortgage |
| Housing Units | 1,259 | 6,890 |
| Median Property Value | $477,100 | $492,700 |
| Median Household Income | $108,413 | $2,306 |
| Monthly Housing Costs | $521 | $775 |
| Real Estate Taxes | $2,294 | $86 |
Property Value by Mortgage Status in Saratoga Springs
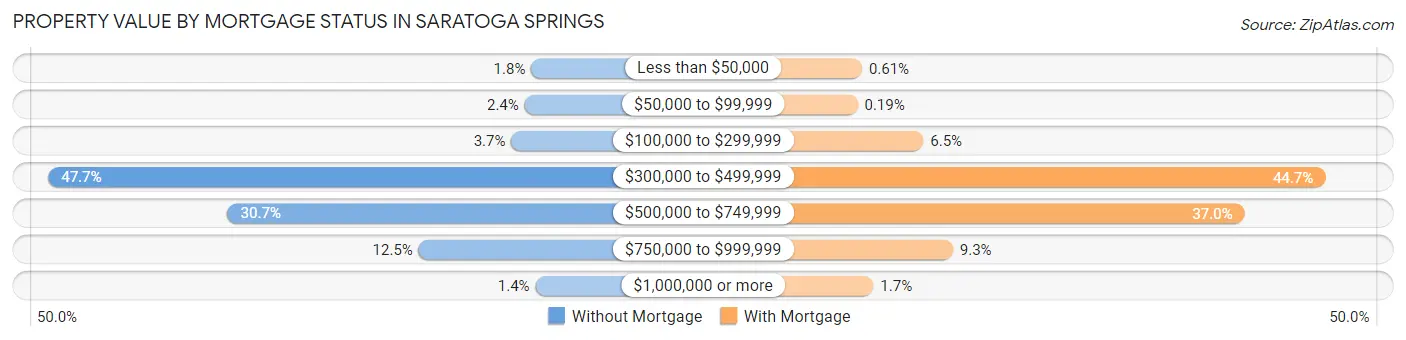
| Property Value | Without Mortgage | With Mortgage |
| Less than $50,000 | 22 (1.8%) | 42 (0.6%) |
| $50,000 to $99,999 | 30 (2.4%) | 13 (0.2%) |
| $100,000 to $299,999 | 46 (3.6%) | 445 (6.5%) |
| $300,000 to $499,999 | 601 (47.7%) | 3,082 (44.7%) |
| $500,000 to $749,999 | 386 (30.7%) | 2,552 (37.0%) |
| $750,000 to $999,999 | 157 (12.5%) | 639 (9.3%) |
| $1,000,000 or more | 17 (1.3%) | 117 (1.7%) |
| Total | 1,259 (100.0%) | 6,890 (100.0%) |
Household Income by Mortgage Status in Saratoga Springs
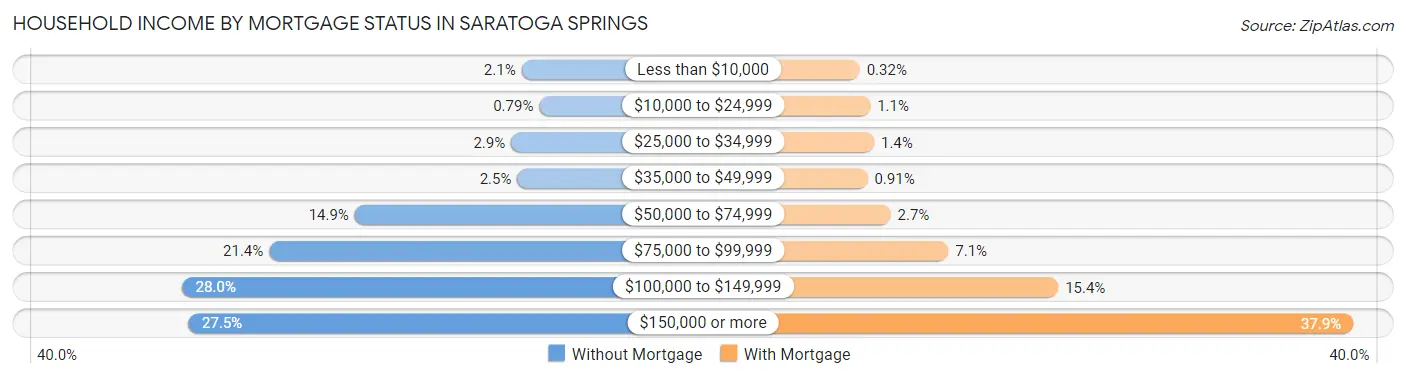
| Household Income | Without Mortgage | With Mortgage |
| Less than $10,000 | 27 (2.1%) | 22 (0.3%) |
| $10,000 to $24,999 | 10 (0.8%) | 77 (1.1%) |
| $25,000 to $34,999 | 37 (2.9%) | 97 (1.4%) |
| $35,000 to $49,999 | 31 (2.5%) | 63 (0.9%) |
| $50,000 to $74,999 | 187 (14.8%) | 184 (2.7%) |
| $75,000 to $99,999 | 269 (21.4%) | 487 (7.1%) |
| $100,000 to $149,999 | 352 (28.0%) | 1,064 (15.4%) |
| $150,000 or more | 346 (27.5%) | 2,612 (37.9%) |
| Total | 1,259 (100.0%) | 6,890 (100.0%) |
Property Value to Household Income Ratio in Saratoga Springs
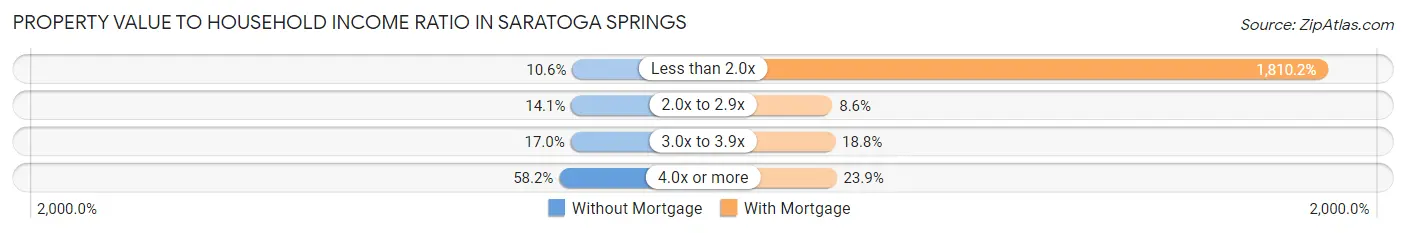
| Value-to-Income Ratio | Without Mortgage | With Mortgage |
| Less than 2.0x | 134 (10.6%) | 124,724 (1,810.2%) |
| 2.0x to 2.9x | 178 (14.1%) | 589 (8.6%) |
| 3.0x to 3.9x | 214 (17.0%) | 1,292 (18.8%) |
| 4.0x or more | 733 (58.2%) | 1,646 (23.9%) |
| Total | 1,259 (100.0%) | 6,890 (100.0%) |
Real Estate Taxes by Mortgage Status in Saratoga Springs
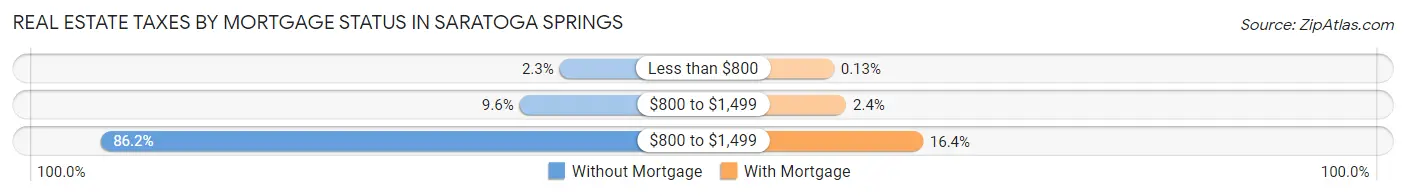
| Property Taxes | Without Mortgage | With Mortgage |
| Less than $800 | 29 (2.3%) | 9 (0.1%) |
| $800 to $1,499 | 121 (9.6%) | 165 (2.4%) |
| $800 to $1,499 | 1,085 (86.2%) | 1,130 (16.4%) |
| Total | 1,259 (100.0%) | 6,890 (100.0%) |
Health & Disability in Saratoga Springs
Health Insurance Coverage by Age in Saratoga Springs
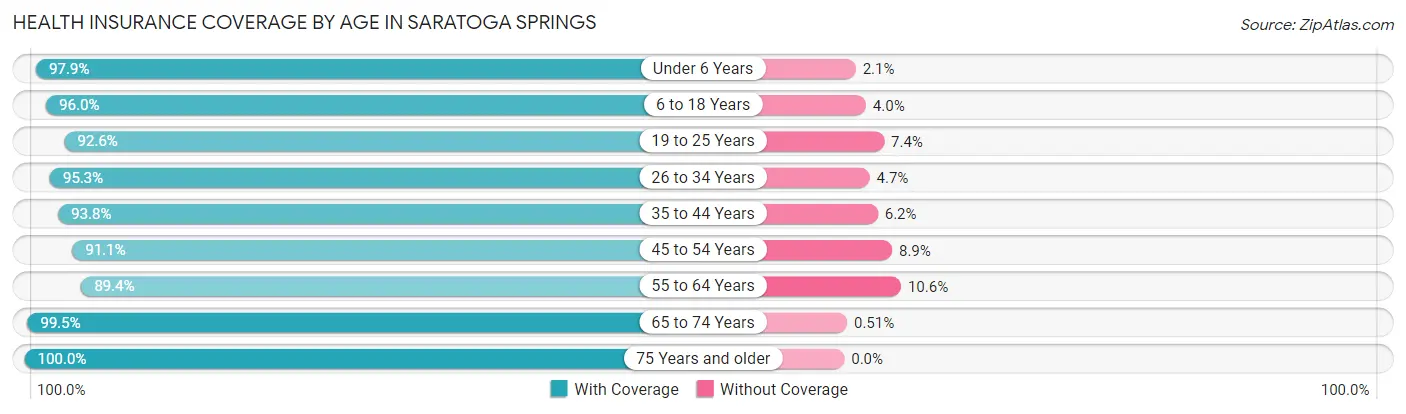
| Age Bracket | With Coverage | Without Coverage |
| Under 6 Years | 5,832 (97.9%) | 127 (2.1%) |
| 6 to 18 Years | 12,068 (96.0%) | 507 (4.0%) |
| 19 to 25 Years | 3,016 (92.6%) | 242 (7.4%) |
| 26 to 34 Years | 4,886 (95.3%) | 242 (4.7%) |
| 35 to 44 Years | 5,829 (93.8%) | 388 (6.2%) |
| 45 to 54 Years | 3,100 (91.1%) | 303 (8.9%) |
| 55 to 64 Years | 1,573 (89.4%) | 186 (10.6%) |
| 65 to 74 Years | 1,365 (99.5%) | 7 (0.5%) |
| 75 Years and older | 668 (100.0%) | 0 (0.0%) |
| Total | 38,337 (95.0%) | 2,002 (5.0%) |
Health Insurance Coverage by Citizenship Status in Saratoga Springs
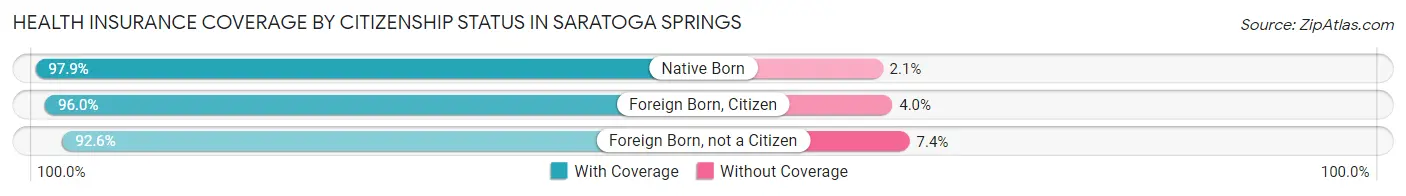
| Citizenship Status | With Coverage | Without Coverage |
| Native Born | 5,832 (97.9%) | 127 (2.1%) |
| Foreign Born, Citizen | 12,068 (96.0%) | 507 (4.0%) |
| Foreign Born, not a Citizen | 3,016 (92.6%) | 242 (7.4%) |
Health Insurance Coverage by Household Income in Saratoga Springs
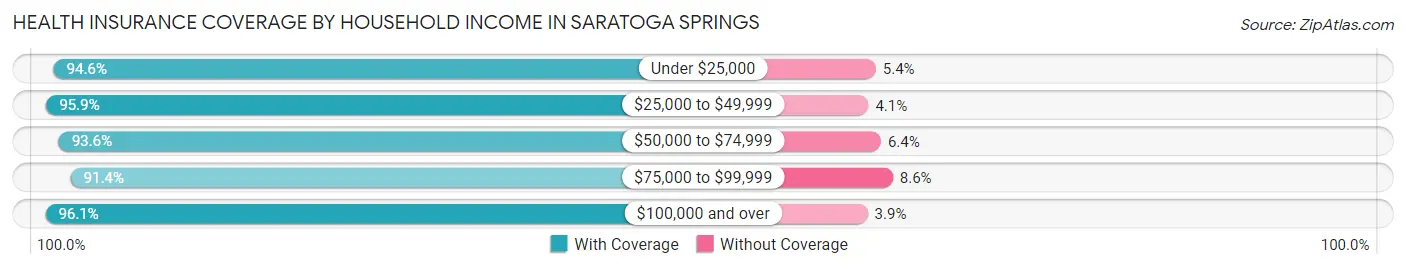
| Household Income | With Coverage | Without Coverage |
| Under $25,000 | 1,268 (94.6%) | 73 (5.4%) |
| $25,000 to $49,999 | 1,797 (95.9%) | 76 (4.1%) |
| $50,000 to $74,999 | 3,098 (93.6%) | 212 (6.4%) |
| $75,000 to $99,999 | 6,163 (91.4%) | 582 (8.6%) |
| $100,000 and over | 26,011 (96.1%) | 1,059 (3.9%) |
Public vs Private Health Insurance Coverage by Age in Saratoga Springs
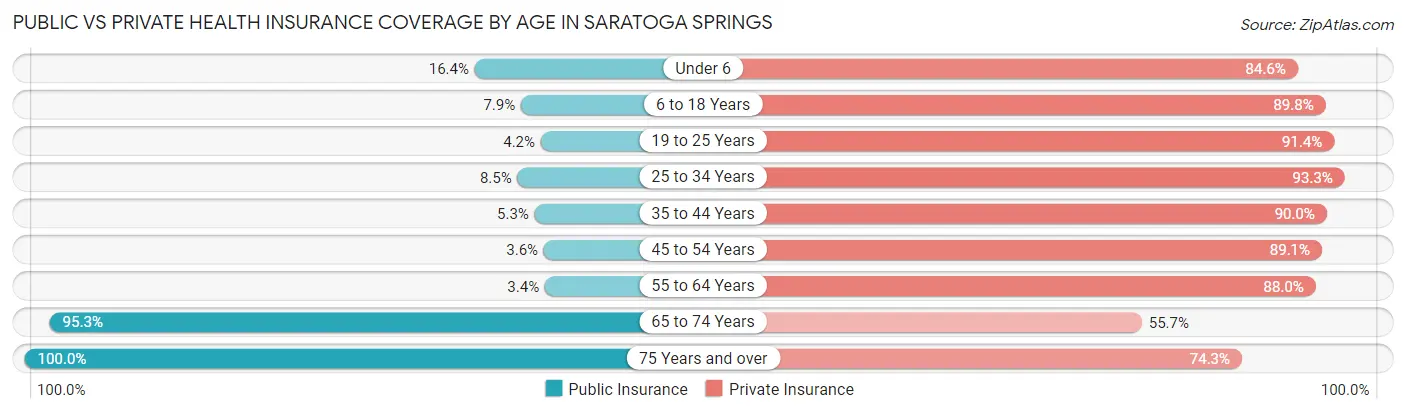
| Age Bracket | Public Insurance | Private Insurance |
| Under 6 | 979 (16.4%) | 5,042 (84.6%) |
| 6 to 18 Years | 987 (7.9%) | 11,289 (89.8%) |
| 19 to 25 Years | 136 (4.2%) | 2,977 (91.4%) |
| 25 to 34 Years | 436 (8.5%) | 4,786 (93.3%) |
| 35 to 44 Years | 331 (5.3%) | 5,595 (90.0%) |
| 45 to 54 Years | 123 (3.6%) | 3,032 (89.1%) |
| 55 to 64 Years | 60 (3.4%) | 1,547 (87.9%) |
| 65 to 74 Years | 1,308 (95.3%) | 764 (55.7%) |
| 75 Years and over | 668 (100.0%) | 496 (74.3%) |
| Total | 5,028 (12.5%) | 35,528 (88.1%) |
Disability Status by Sex by Age in Saratoga Springs
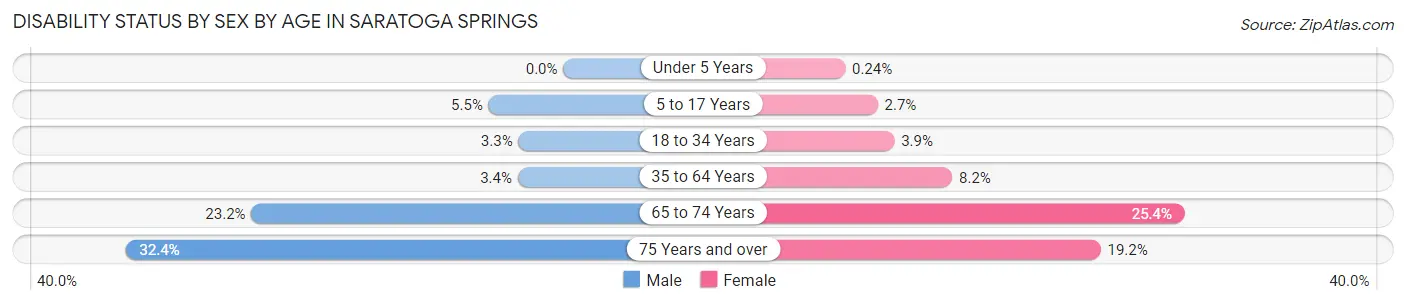
| Age Bracket | Male | Female |
| Under 5 Years | 0 (0.0%) | 5 (0.2%) |
| 5 to 17 Years | 372 (5.5%) | 163 (2.7%) |
| 18 to 34 Years | 164 (3.3%) | 171 (3.9%) |
| 35 to 64 Years | 204 (3.4%) | 437 (8.2%) |
| 65 to 74 Years | 170 (23.2%) | 162 (25.4%) |
| 75 Years and over | 85 (32.4%) | 78 (19.2%) |
Disability Class by Sex by Age in Saratoga Springs
Disability Class: Hearing Difficulty
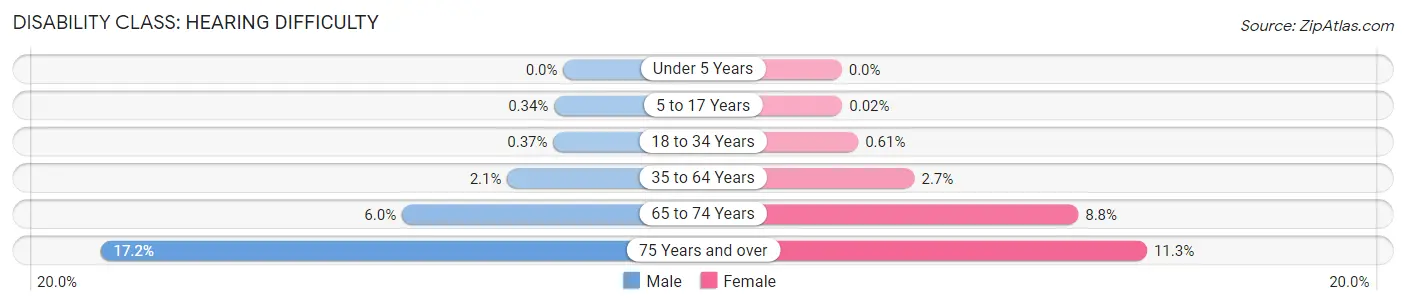
| Age Bracket | Male | Female |
| Under 5 Years | 0 (0.0%) | 0 (0.0%) |
| 5 to 17 Years | 23 (0.3%) | 1 (0.0%) |
| 18 to 34 Years | 18 (0.4%) | 27 (0.6%) |
| 35 to 64 Years | 126 (2.1%) | 144 (2.7%) |
| 65 to 74 Years | 44 (6.0%) | 56 (8.8%) |
| 75 Years and over | 45 (17.2%) | 46 (11.3%) |
Disability Class: Vision Difficulty
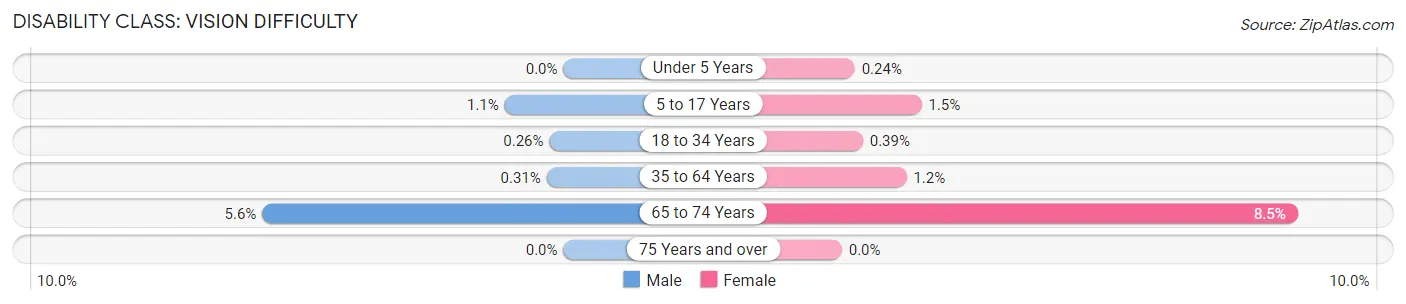
| Age Bracket | Male | Female |
| Under 5 Years | 0 (0.0%) | 5 (0.2%) |
| 5 to 17 Years | 73 (1.1%) | 91 (1.5%) |
| 18 to 34 Years | 13 (0.3%) | 17 (0.4%) |
| 35 to 64 Years | 19 (0.3%) | 64 (1.2%) |
| 65 to 74 Years | 41 (5.6%) | 54 (8.5%) |
| 75 Years and over | 0 (0.0%) | 0 (0.0%) |
Disability Class: Cognitive Difficulty
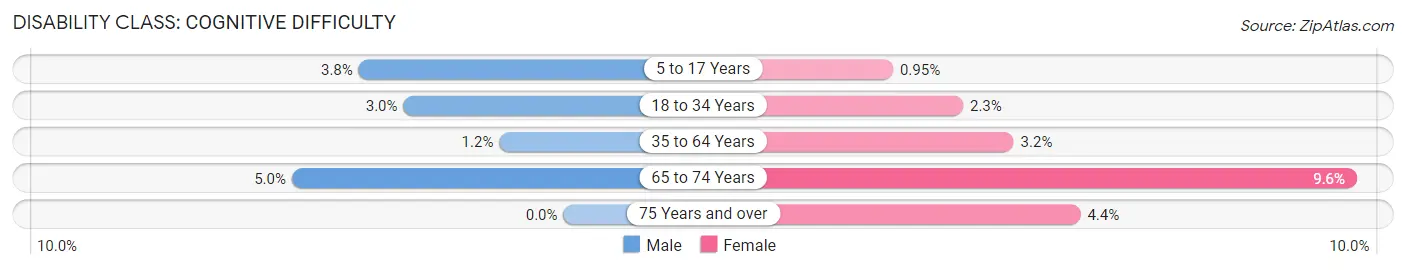
| Age Bracket | Male | Female |
| 5 to 17 Years | 255 (3.8%) | 58 (0.9%) |
| 18 to 34 Years | 146 (3.0%) | 99 (2.2%) |
| 35 to 64 Years | 72 (1.2%) | 170 (3.2%) |
| 65 to 74 Years | 37 (5.0%) | 61 (9.6%) |
| 75 Years and over | 0 (0.0%) | 18 (4.4%) |
Disability Class: Ambulatory Difficulty
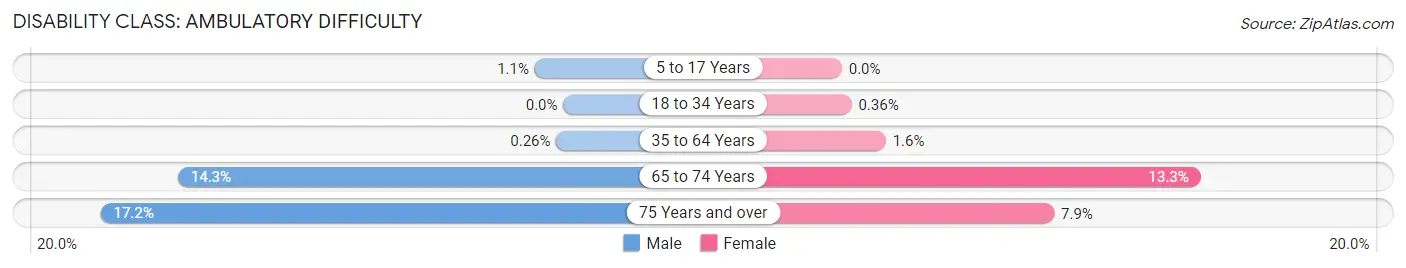
| Age Bracket | Male | Female |
| 5 to 17 Years | 71 (1.1%) | 0 (0.0%) |
| 18 to 34 Years | 0 (0.0%) | 16 (0.4%) |
| 35 to 64 Years | 16 (0.3%) | 87 (1.6%) |
| 65 to 74 Years | 105 (14.3%) | 85 (13.3%) |
| 75 Years and over | 45 (17.2%) | 32 (7.9%) |
Disability Class: Self-Care Difficulty
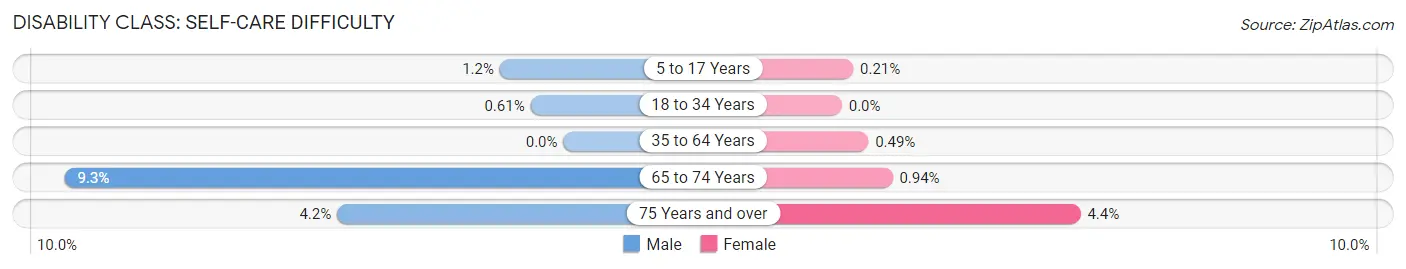
| Age Bracket | Male | Female |
| 5 to 17 Years | 79 (1.2%) | 13 (0.2%) |
| 18 to 34 Years | 30 (0.6%) | 0 (0.0%) |
| 35 to 64 Years | 0 (0.0%) | 26 (0.5%) |
| 65 to 74 Years | 68 (9.3%) | 6 (0.9%) |
| 75 Years and over | 11 (4.2%) | 18 (4.4%) |
Technology Access in Saratoga Springs
Computing Device Access in Saratoga Springs
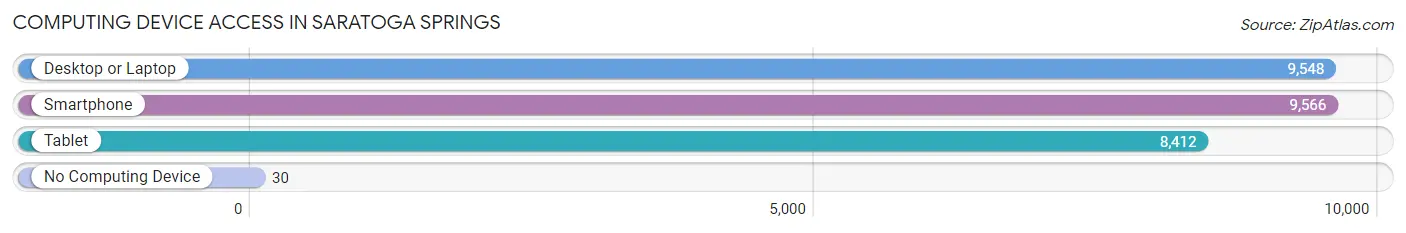
| Device Type | # Households | % Households |
| Desktop or Laptop | 9,548 | 98.3% |
| Smartphone | 9,566 | 98.5% |
| Tablet | 8,412 | 86.6% |
| No Computing Device | 30 | 0.3% |
| Total | 9,716 | 100.0% |
Internet Access in Saratoga Springs
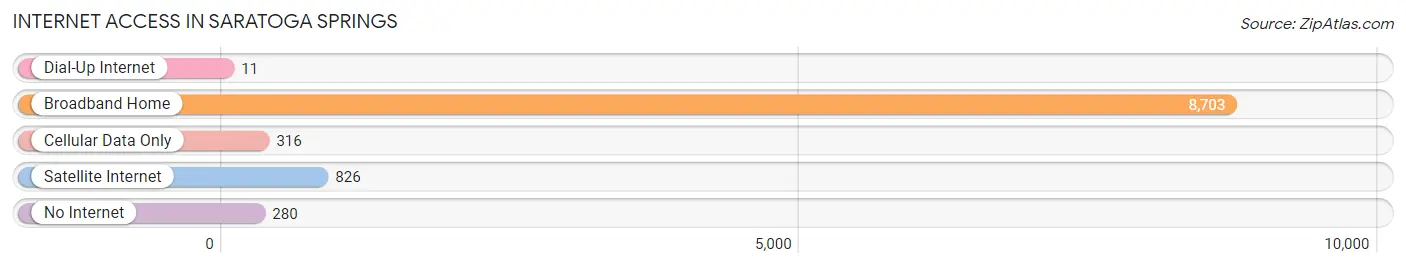
| Internet Type | # Households | % Households |
| Dial-Up Internet | 11 | 0.1% |
| Broadband Home | 8,703 | 89.6% |
| Cellular Data Only | 316 | 3.3% |
| Satellite Internet | 826 | 8.5% |
| No Internet | 280 | 2.9% |
| Total | 9,716 | 100.0% |
Saratoga Springs Summary
Saratoga Springs is a city located in Utah County, Utah, United States. It is part of the Provo-Orem Metropolitan Statistical Area. The population was 18,716 at the 2010 census, making it the fifth-largest city in Utah. Saratoga Springs was incorporated on December 31, 1997, as a town, and became a city on January 1, 2001.
Geography
Saratoga Springs is located at 40°20'17" North, 111°56'45" West (40.338, -111.946). According to the United States Census Bureau, the city has a total area of 24.2 square miles (62.6 km2), of which 24.1 square miles (62.4 km2) is land and 0.1 square miles (0.2 km2) is water.
The city is located in the northeast corner of Utah County, and is bordered by Eagle Mountain to the north, Lehi to the east, and Utah Lake to the south. The city is located in the foothills of the Wasatch Mountains, and is part of the Provo-Orem Metropolitan Statistical Area.
Economy
Saratoga Springs is home to several large employers, including Adobe Systems, Vivint, and the Utah Valley University. The city is also home to several small businesses, including restaurants, retail stores, and service providers.
The city is also home to several industrial parks, including the Saratoga Springs Business Park, which is home to several large companies, including Adobe Systems, Vivint, and the Utah Valley University.
Demographics
As of the census of 2010, there were 18,716 people, 5,945 households, and 4,845 families residing in the city. The population density was 774.3 people per square mile (298.7/km2). There were 6,095 housing units at an average density of 251.3 per square mile (97.1/km2). The racial makeup of the city was 91.2% White, 0.7% African American, 0.4% Native American, 1.7% Asian, 0.2% Pacific Islander, 3.7% from other races, and 2.1% from two or more races. Hispanic or Latino of any race were 8.3% of the population.
There were 5,945 households, out of which 44.2% had children under the age of 18 living with them, 68.2% were married couples living together, 8.2% had a female householder with no husband present, and 20.2% were non-families. 15.2% of all households were made up of individuals, and 4.2% had someone living alone who was 65 years of age or older. The average household size was 3.12 and the average family size was 3.48.
In the city, the population was spread out, with 33.2% under the age of 18, 8.2% from 18 to 24, 32.2% from 25 to 44, 19.7% from 45 to 64, and 6.7% who were 65 years of age or older. The median age was 31.4 years. For every 100 females, there were 98.2 males. For every 100 females age 18 and over, there were 95.7 males.
The median income for a household in the city was $71,945, and the median income for a family was $76,945. Males had a median income of $51,945 versus $35,945 for females. The per capita income for the city was $25,945. About 3.2% of families and 4.2% of the population were below the poverty line, including 5.2% of those under age 18 and 2.2% of those age 65 or over.
Common Questions
What is Per Capita Income in Saratoga Springs?
Per Capita income in Saratoga Springs is $32,100.
What is the Median Family Income in Saratoga Springs?
Median Family Income in Saratoga Springs is $118,217.
What is the Median Household income in Saratoga Springs?
Median Household Income in Saratoga Springs is $117,005.
What is Income or Wage Gap in Saratoga Springs?
Income or Wage Gap in Saratoga Springs is 67.9%.
Women in Saratoga Springs earn 32.1 cents for every dollar earned by a man.
What is Inequality or Gini Index in Saratoga Springs?
Inequality or Gini Index in Saratoga Springs is 0.32.
What is the Total Population of Saratoga Springs?
Total Population of Saratoga Springs is 40,391.
What is the Total Male Population of Saratoga Springs?
Total Male Population of Saratoga Springs is 21,350.
What is the Total Female Population of Saratoga Springs?
Total Female Population of Saratoga Springs is 19,041.
What is the Ratio of Males per 100 Females in Saratoga Springs?
There are 112.13 Males per 100 Females in Saratoga Springs.
What is the Ratio of Females per 100 Males in Saratoga Springs?
There are 89.19 Females per 100 Males in Saratoga Springs.
What is the Median Population Age in Saratoga Springs?
Median Population Age in Saratoga Springs is 22.4 Years.
What is the Average Family Size in Saratoga Springs
Average Family Size in Saratoga Springs is 4.4 People.
What is the Average Household Size in Saratoga Springs
Average Household Size in Saratoga Springs is 4.2 People.
How Large is the Labor Force in Saratoga Springs?
There are 17,306 People in the Labor Forcein in Saratoga Springs.
What is the Percentage of People in the Labor Force in Saratoga Springs?
70.6% of People are in the Labor Force in Saratoga Springs.
What is the Unemployment Rate in Saratoga Springs?
Unemployment Rate in Saratoga Springs is 2.2%.