Elk Grove Village, IL Map & Demographics
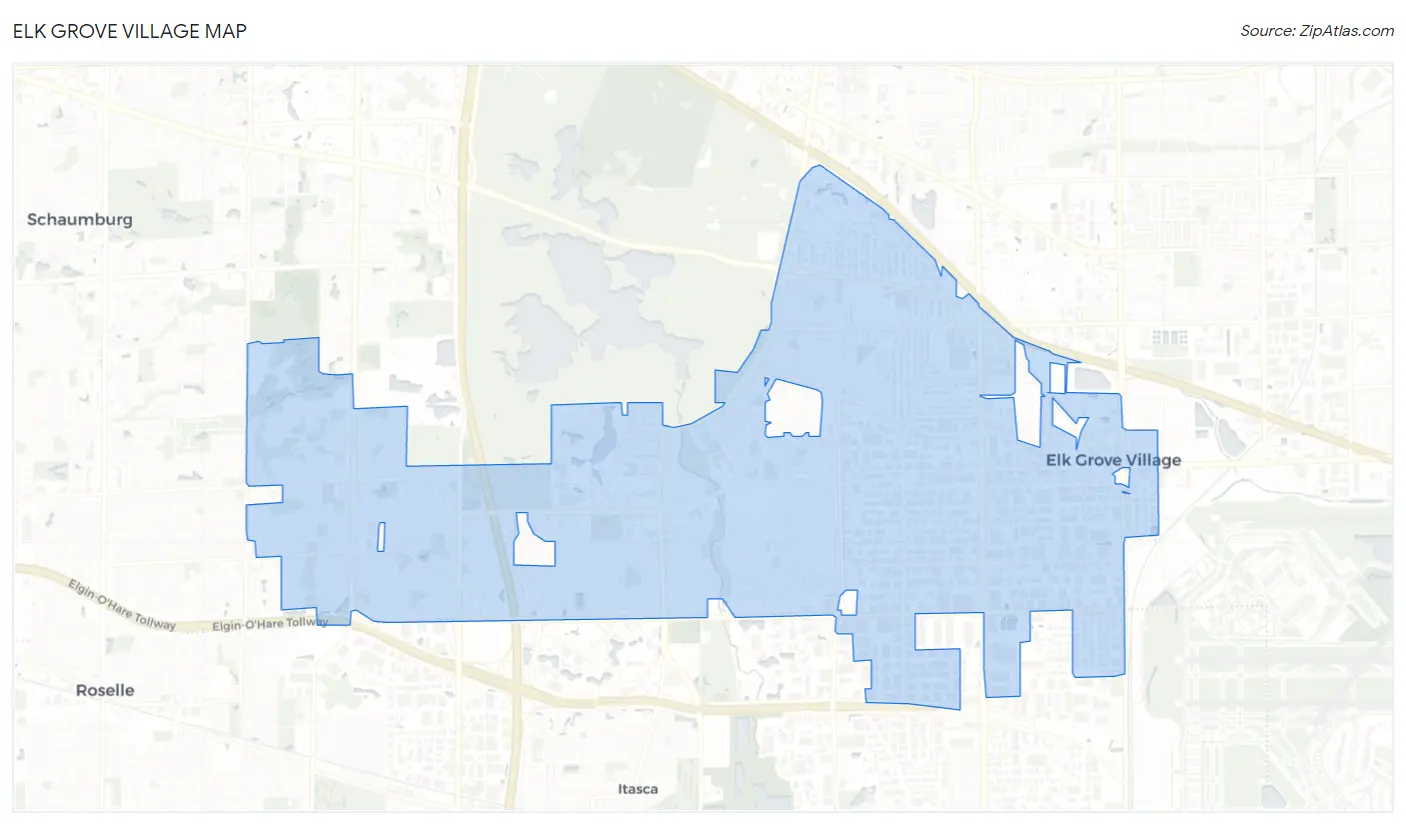
Elk Grove Village Map
Elk Grove Village Overview
$44,953
PER CAPITA INCOME
$117,294
AVG FAMILY INCOME
$93,832
AVG HOUSEHOLD INCOME
23.7%
WAGE / INCOME GAP [ % ]
76.3¢/ $1
WAGE / INCOME GAP [ $ ]
0.39
INEQUALITY / GINI INDEX
32,498
TOTAL POPULATION
15,573
MALE POPULATION
16,925
FEMALE POPULATION
92.01
MALES / 100 FEMALES
108.68
FEMALES / 100 MALES
42.5
MEDIAN AGE
3.1
AVG FAMILY SIZE
2.5
AVG HOUSEHOLD SIZE
18,003
LABOR FORCE [ PEOPLE ]
69.1%
PERCENT IN LABOR FORCE
4.2%
UNEMPLOYMENT RATE
Elk Grove Village Zip Codes
Income in Elk Grove Village
Income Overview in Elk Grove Village
Per Capita Income in Elk Grove Village is $44,953, while median incomes of families and households are $117,294 and $93,832 respectively.
| Characteristic | Number | Measure |
| Per Capita Income | 32,498 | $44,953 |
| Median Family Income | 8,732 | $117,294 |
| Mean Family Income | 8,732 | $133,603 |
| Median Household Income | 12,691 | $93,832 |
| Mean Household Income | 12,691 | $113,908 |
| Income Deficit | 8,732 | $0 |
| Wage / Income Gap (%) | 32,498 | 23.74% |
| Wage / Income Gap ($) | 32,498 | 76.26¢ per $1 |
| Gini / Inequality Index | 32,498 | 0.39 |
Earnings by Sex in Elk Grove Village
Average Earnings in Elk Grove Village are $54,202, $61,640 for men and $47,008 for women, a difference of 23.7%.
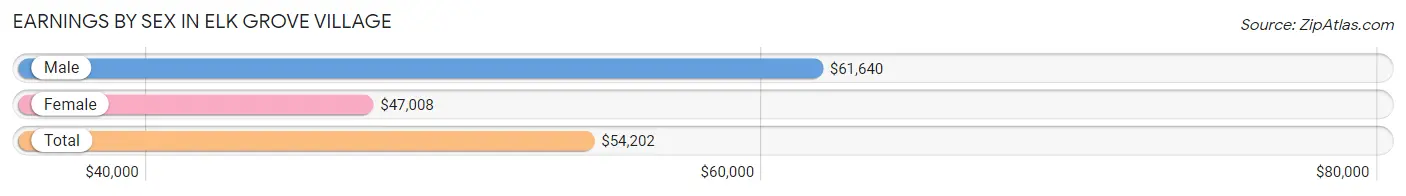
| Sex | Number | Average Earnings |
| Male | 9,368 (50.8%) | $61,640 |
| Female | 9,078 (49.2%) | $47,008 |
| Total | 18,446 (100.0%) | $54,202 |
Earnings by Sex by Income Bracket in Elk Grove Village
The most common earnings brackets in Elk Grove Village are $100,000+ for men (2,325 | 24.8%) and $100,000+ for women (1,267 | 14.0%).
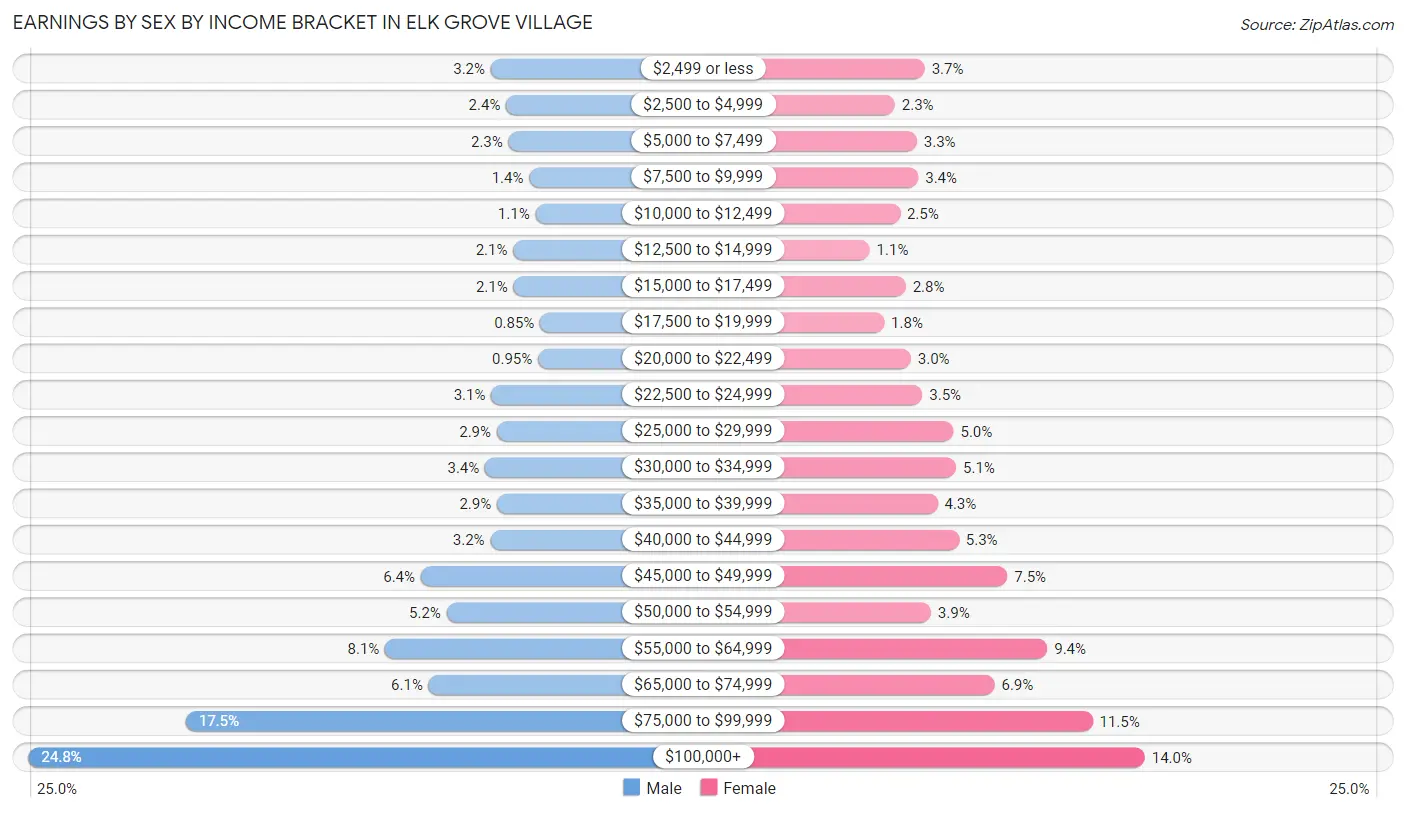
| Income | Male | Female |
| $2,499 or less | 296 (3.2%) | 331 (3.6%) |
| $2,500 to $4,999 | 229 (2.4%) | 204 (2.2%) |
| $5,000 to $7,499 | 218 (2.3%) | 298 (3.3%) |
| $7,500 to $9,999 | 127 (1.4%) | 304 (3.4%) |
| $10,000 to $12,499 | 100 (1.1%) | 226 (2.5%) |
| $12,500 to $14,999 | 198 (2.1%) | 97 (1.1%) |
| $15,000 to $17,499 | 197 (2.1%) | 251 (2.8%) |
| $17,500 to $19,999 | 80 (0.9%) | 159 (1.8%) |
| $20,000 to $22,499 | 89 (0.9%) | 272 (3.0%) |
| $22,500 to $24,999 | 294 (3.1%) | 321 (3.5%) |
| $25,000 to $29,999 | 270 (2.9%) | 454 (5.0%) |
| $30,000 to $34,999 | 321 (3.4%) | 465 (5.1%) |
| $35,000 to $39,999 | 269 (2.9%) | 386 (4.3%) |
| $40,000 to $44,999 | 298 (3.2%) | 477 (5.2%) |
| $45,000 to $49,999 | 603 (6.4%) | 683 (7.5%) |
| $50,000 to $54,999 | 490 (5.2%) | 358 (3.9%) |
| $55,000 to $64,999 | 760 (8.1%) | 852 (9.4%) |
| $65,000 to $74,999 | 569 (6.1%) | 628 (6.9%) |
| $75,000 to $99,999 | 1,635 (17.4%) | 1,045 (11.5%) |
| $100,000+ | 2,325 (24.8%) | 1,267 (14.0%) |
| Total | 9,368 (100.0%) | 9,078 (100.0%) |
Earnings by Sex by Educational Attainment in Elk Grove Village
Average earnings in Elk Grove Village are $67,936 for men and $50,898 for women, a difference of 25.1%. Men with an educational attainment of graduate degree enjoy the highest average annual earnings of $96,026, while those with less than high school education earn the least with $38,964. Women with an educational attainment of graduate degree earn the most with the average annual earnings of $72,455, while those with high school diploma education have the smallest earnings of $30,378.
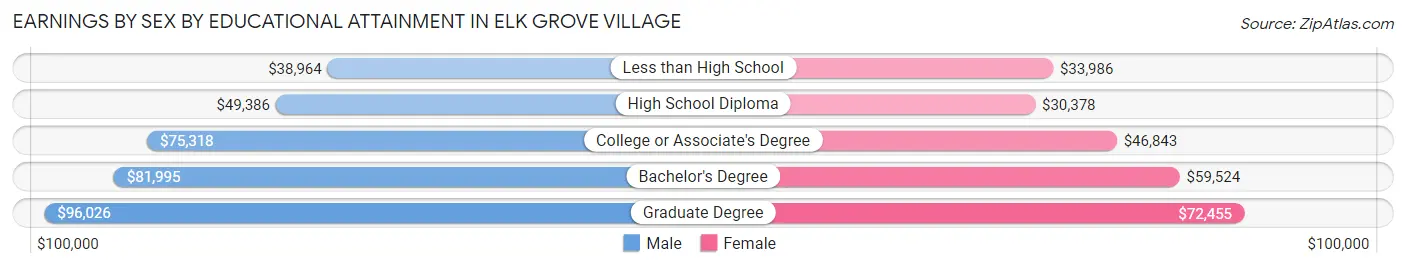
| Educational Attainment | Male Income | Female Income |
| Less than High School | $38,964 | $33,986 |
| High School Diploma | $49,386 | $30,378 |
| College or Associate's Degree | $75,318 | $46,843 |
| Bachelor's Degree | $81,995 | $59,524 |
| Graduate Degree | $96,026 | $72,455 |
| Total | $67,936 | $50,898 |
Family Income in Elk Grove Village
Family Income Brackets in Elk Grove Village
According to the Elk Grove Village family income data, there are 2,043 families falling into the $100,000 to $149,999 income range, which is the most common income bracket and makes up 23.4% of all families. Conversely, the $10,000 to $14,999 income bracket is the least frequent group with only 26 families (0.3%) belonging to this category.
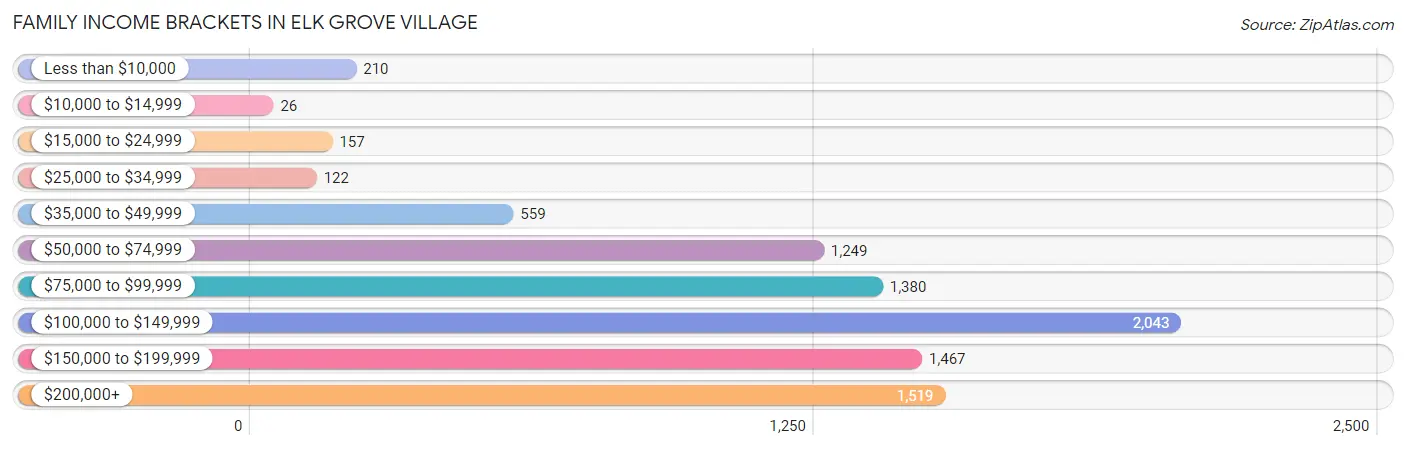
| Income Bracket | # Families | % Families |
| Less than $10,000 | 210 | 2.4% |
| $10,000 to $14,999 | 26 | 0.3% |
| $15,000 to $24,999 | 157 | 1.8% |
| $25,000 to $34,999 | 122 | 1.4% |
| $35,000 to $49,999 | 559 | 6.4% |
| $50,000 to $74,999 | 1,249 | 14.3% |
| $75,000 to $99,999 | 1,380 | 15.8% |
| $100,000 to $149,999 | 2,043 | 23.4% |
| $150,000 to $199,999 | 1,467 | 16.8% |
| $200,000+ | 1,519 | 17.4% |
Family Income by Famaliy Size in Elk Grove Village
5-person families (663 | 7.6%) account for the highest median family income in Elk Grove Village with $146,044 per family, while 2-person families (3,791 | 43.4%) have the highest median income of $49,908 per family member.
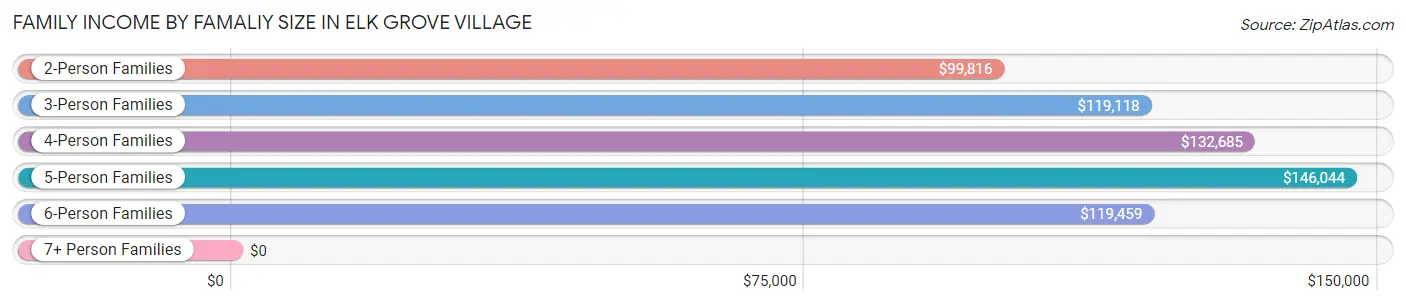
| Income Bracket | # Families | Median Income |
| 2-Person Families | 3,791 (43.4%) | $99,816 |
| 3-Person Families | 1,992 (22.8%) | $119,118 |
| 4-Person Families | 1,974 (22.6%) | $132,685 |
| 5-Person Families | 663 (7.6%) | $146,044 |
| 6-Person Families | 236 (2.7%) | $119,459 |
| 7+ Person Families | 76 (0.9%) | $0 |
| Total | 8,732 (100.0%) | $117,294 |
Family Income by Number of Earners in Elk Grove Village
The median family income in Elk Grove Village is $117,294, with families comprising 3+ earners (1,328) having the highest median family income of $153,958, while families with no earners (1,006) have the lowest median family income of $62,727, accounting for 15.2% and 11.5% of families, respectively.
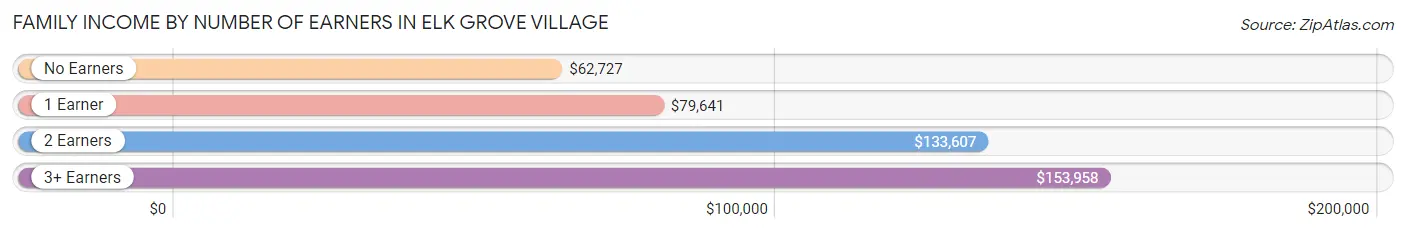
| Number of Earners | # Families | Median Income |
| No Earners | 1,006 (11.5%) | $62,727 |
| 1 Earner | 2,209 (25.3%) | $79,641 |
| 2 Earners | 4,189 (48.0%) | $133,607 |
| 3+ Earners | 1,328 (15.2%) | $153,958 |
| Total | 8,732 (100.0%) | $117,294 |
Household Income in Elk Grove Village
Household Income Brackets in Elk Grove Village
With 2,564 households falling in the category, the $100,000 to $149,999 income range is the most frequent in Elk Grove Village, accounting for 20.2% of all households. In contrast, only 140 households (1.1%) fall into the $10,000 to $14,999 income bracket, making it the least populous group.
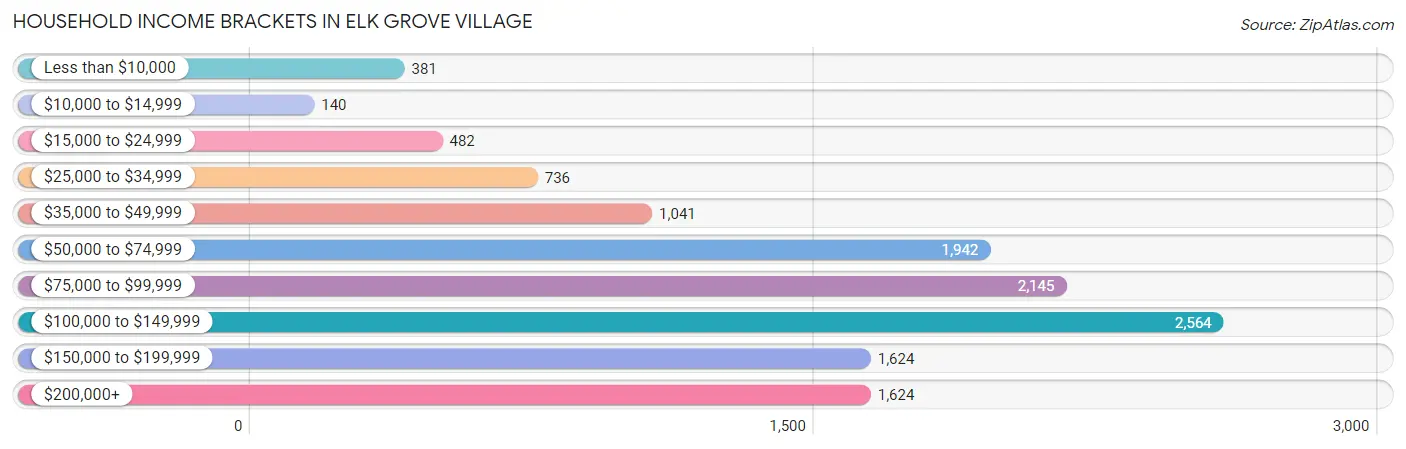
| Income Bracket | # Households | % Households |
| Less than $10,000 | 381 | 3.0% |
| $10,000 to $14,999 | 140 | 1.1% |
| $15,000 to $24,999 | 482 | 3.8% |
| $25,000 to $34,999 | 736 | 5.8% |
| $35,000 to $49,999 | 1,041 | 8.2% |
| $50,000 to $74,999 | 1,942 | 15.3% |
| $75,000 to $99,999 | 2,145 | 16.9% |
| $100,000 to $149,999 | 2,564 | 20.2% |
| $150,000 to $199,999 | 1,624 | 12.8% |
| $200,000+ | 1,624 | 12.8% |
Household Income by Householder Age in Elk Grove Village
The median household income in Elk Grove Village is $93,832, with the highest median household income of $130,289 found in the 45 to 64 years age bracket for the primary householder. A total of 5,266 households (41.5%) fall into this category. Meanwhile, the 15 to 24 years age bracket for the primary householder has the lowest median household income of $48,793, with 78 households (0.6%) in this group.
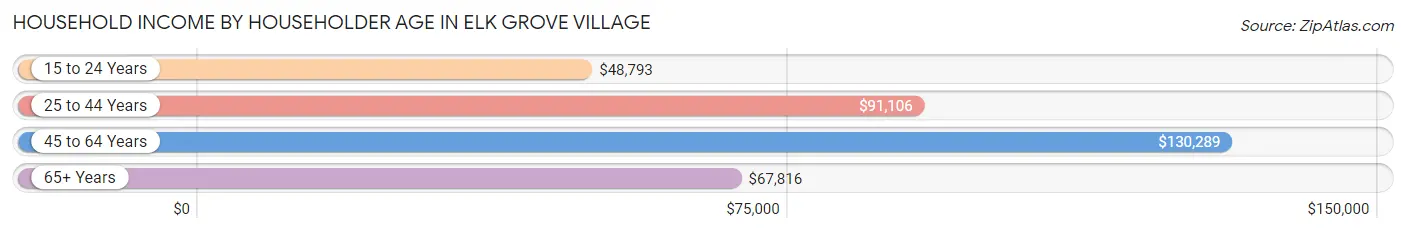
| Income Bracket | # Households | Median Income |
| 15 to 24 Years | 78 (0.6%) | $48,793 |
| 25 to 44 Years | 3,615 (28.5%) | $91,106 |
| 45 to 64 Years | 5,266 (41.5%) | $130,289 |
| 65+ Years | 3,732 (29.4%) | $67,816 |
| Total | 12,691 (100.0%) | $93,832 |
Poverty in Elk Grove Village
Income Below Poverty by Sex and Age in Elk Grove Village
With 6.7% poverty level for males and 4.1% for females among the residents of Elk Grove Village, 15 year old males and 25 to 34 year old females are the most vulnerable to poverty, with 100 males (22.0%) and 153 females (10.3%) in their respective age groups living below the poverty level.
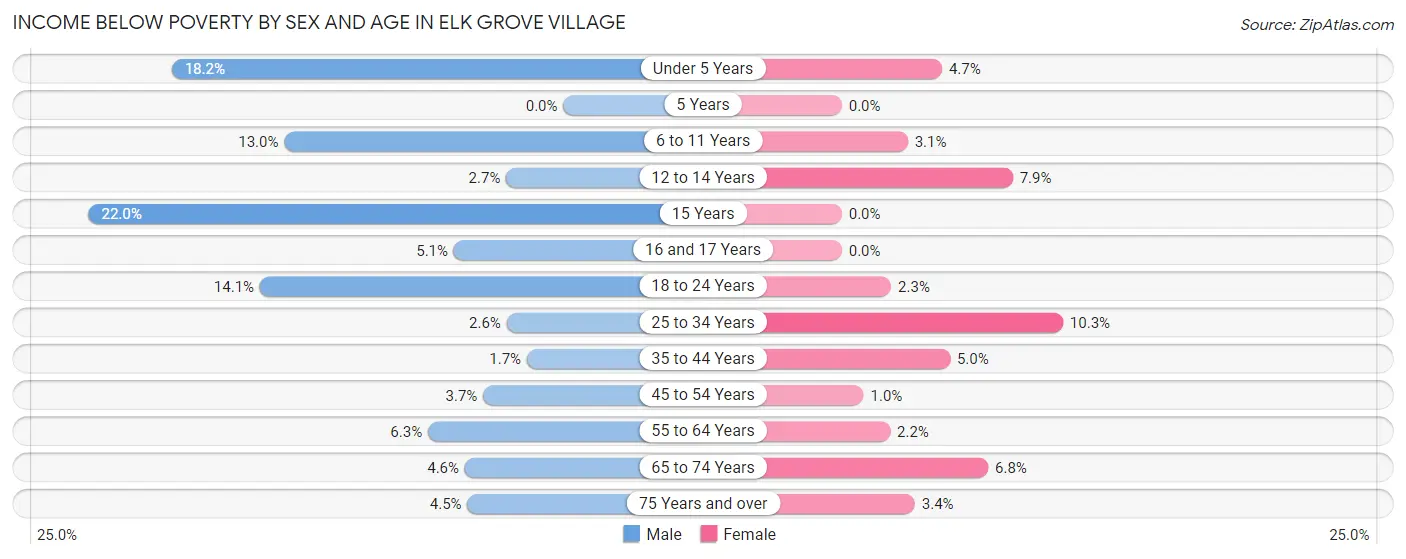
| Age Bracket | Male | Female |
| Under 5 Years | 159 (18.2%) | 36 (4.6%) |
| 5 Years | 0 (0.0%) | 0 (0.0%) |
| 6 to 11 Years | 181 (13.0%) | 32 (3.1%) |
| 12 to 14 Years | 13 (2.6%) | 64 (7.9%) |
| 15 Years | 100 (22.0%) | 0 (0.0%) |
| 16 and 17 Years | 12 (5.1%) | 0 (0.0%) |
| 18 to 24 Years | 146 (14.1%) | 24 (2.3%) |
| 25 to 34 Years | 47 (2.6%) | 153 (10.3%) |
| 35 to 44 Years | 35 (1.7%) | 133 (5.0%) |
| 45 to 54 Years | 87 (3.7%) | 22 (1.0%) |
| 55 to 64 Years | 147 (6.3%) | 56 (2.2%) |
| 65 to 74 Years | 66 (4.6%) | 116 (6.8%) |
| 75 Years and over | 40 (4.4%) | 54 (3.4%) |
| Total | 1,033 (6.7%) | 690 (4.1%) |
Income Above Poverty by Sex and Age in Elk Grove Village
According to the poverty statistics in Elk Grove Village, males aged 5 years and females aged 5 years are the age groups that are most secure financially, with 100.0% of males and 100.0% of females in these age groups living above the poverty line.

| Age Bracket | Male | Female |
| Under 5 Years | 716 (81.8%) | 738 (95.4%) |
| 5 Years | 64 (100.0%) | 286 (100.0%) |
| 6 to 11 Years | 1,217 (87.1%) | 1,013 (96.9%) |
| 12 to 14 Years | 478 (97.4%) | 743 (92.1%) |
| 15 Years | 354 (78.0%) | 97 (100.0%) |
| 16 and 17 Years | 224 (94.9%) | 529 (100.0%) |
| 18 to 24 Years | 891 (85.9%) | 1,023 (97.7%) |
| 25 to 34 Years | 1,743 (97.4%) | 1,338 (89.7%) |
| 35 to 44 Years | 2,030 (98.3%) | 2,514 (95.0%) |
| 45 to 54 Years | 2,250 (96.3%) | 2,161 (99.0%) |
| 55 to 64 Years | 2,193 (93.7%) | 2,446 (97.8%) |
| 65 to 74 Years | 1,378 (95.4%) | 1,592 (93.2%) |
| 75 Years and over | 858 (95.6%) | 1,540 (96.6%) |
| Total | 14,396 (93.3%) | 16,020 (95.9%) |
Income Below Poverty Among Married-Couple Families in Elk Grove Village
The poverty statistics for married-couple families in Elk Grove Village show that 1.8% or 130 of the total 7,053 families live below the poverty line. Families with 3 or 4 children have the highest poverty rate of 12.7%, comprising of 52 families. On the other hand, families with 5 or more children have the lowest poverty rate of 0.0%, which includes 0 families.
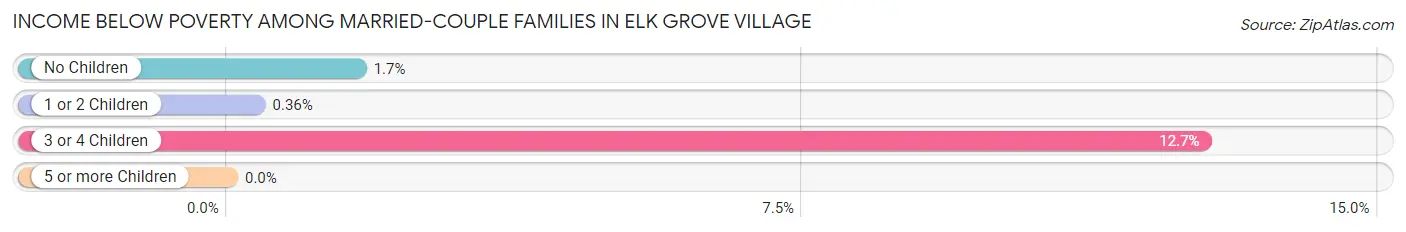
| Children | Above Poverty | Below Poverty |
| No Children | 4,039 (98.3%) | 69 (1.7%) |
| 1 or 2 Children | 2,518 (99.6%) | 9 (0.4%) |
| 3 or 4 Children | 357 (87.3%) | 52 (12.7%) |
| 5 or more Children | 9 (100.0%) | 0 (0.0%) |
| Total | 6,923 (98.2%) | 130 (1.8%) |
Income Below Poverty Among Single-Parent Households in Elk Grove Village
According to the poverty data in Elk Grove Village, 7.0% or 26 single-father households and 13.1% or 172 single-mother households are living below the poverty line. Among single-father households, those with no children have the highest poverty rate, with 26 households (14.1%) experiencing poverty. Likewise, among single-mother households, those with 1 or 2 children have the highest poverty rate, with 147 households (19.9%) falling below the poverty line.
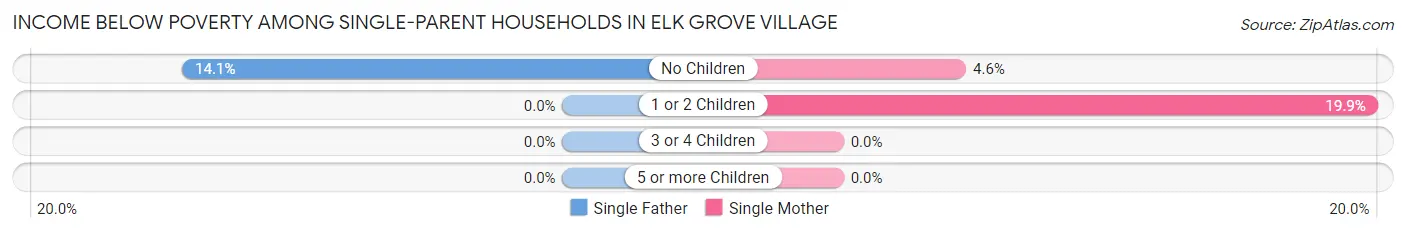
| Children | Single Father | Single Mother |
| No Children | 26 (14.1%) | 25 (4.6%) |
| 1 or 2 Children | 0 (0.0%) | 147 (19.9%) |
| 3 or 4 Children | 0 (0.0%) | 0 (0.0%) |
| 5 or more Children | 0 (0.0%) | 0 (0.0%) |
| Total | 26 (7.0%) | 172 (13.1%) |
Income Below Poverty Among Married-Couple vs Single-Parent Households in Elk Grove Village
The poverty data for Elk Grove Village shows that 130 of the married-couple family households (1.8%) and 198 of the single-parent households (11.8%) are living below the poverty level. Within the married-couple family households, those with 3 or 4 children have the highest poverty rate, with 52 households (12.7%) falling below the poverty line. Among the single-parent households, those with 1 or 2 children have the highest poverty rate, with 147 household (15.9%) living below poverty.
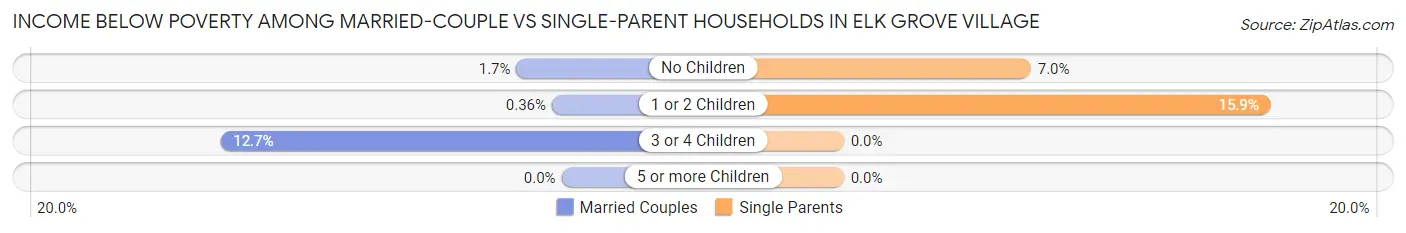
| Children | Married-Couple Families | Single-Parent Households |
| No Children | 69 (1.7%) | 51 (7.0%) |
| 1 or 2 Children | 9 (0.4%) | 147 (15.9%) |
| 3 or 4 Children | 52 (12.7%) | 0 (0.0%) |
| 5 or more Children | 0 (0.0%) | 0 (0.0%) |
| Total | 130 (1.8%) | 198 (11.8%) |
Race in Elk Grove Village
The most populous races in Elk Grove Village are White / Caucasian (24,500 | 75.4%), Hispanic or Latino (4,547 | 14.0%), and Asian (3,690 | 11.4%).
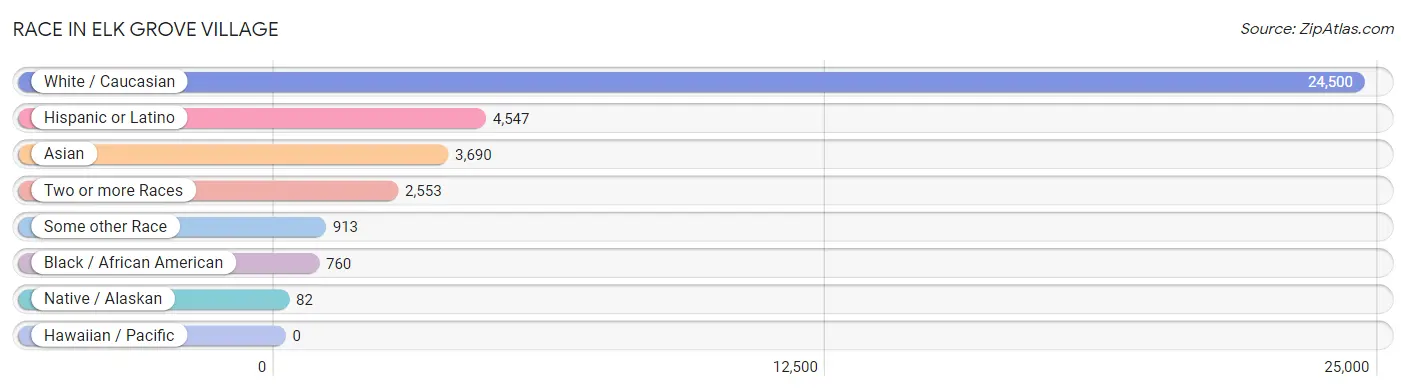
| Race | # Population | % Population |
| Asian | 3,690 | 11.4% |
| Black / African American | 760 | 2.3% |
| Hawaiian / Pacific | 0 | 0.0% |
| Hispanic or Latino | 4,547 | 14.0% |
| Native / Alaskan | 82 | 0.3% |
| White / Caucasian | 24,500 | 75.4% |
| Two or more Races | 2,553 | 7.9% |
| Some other Race | 913 | 2.8% |
| Total | 32,498 | 100.0% |
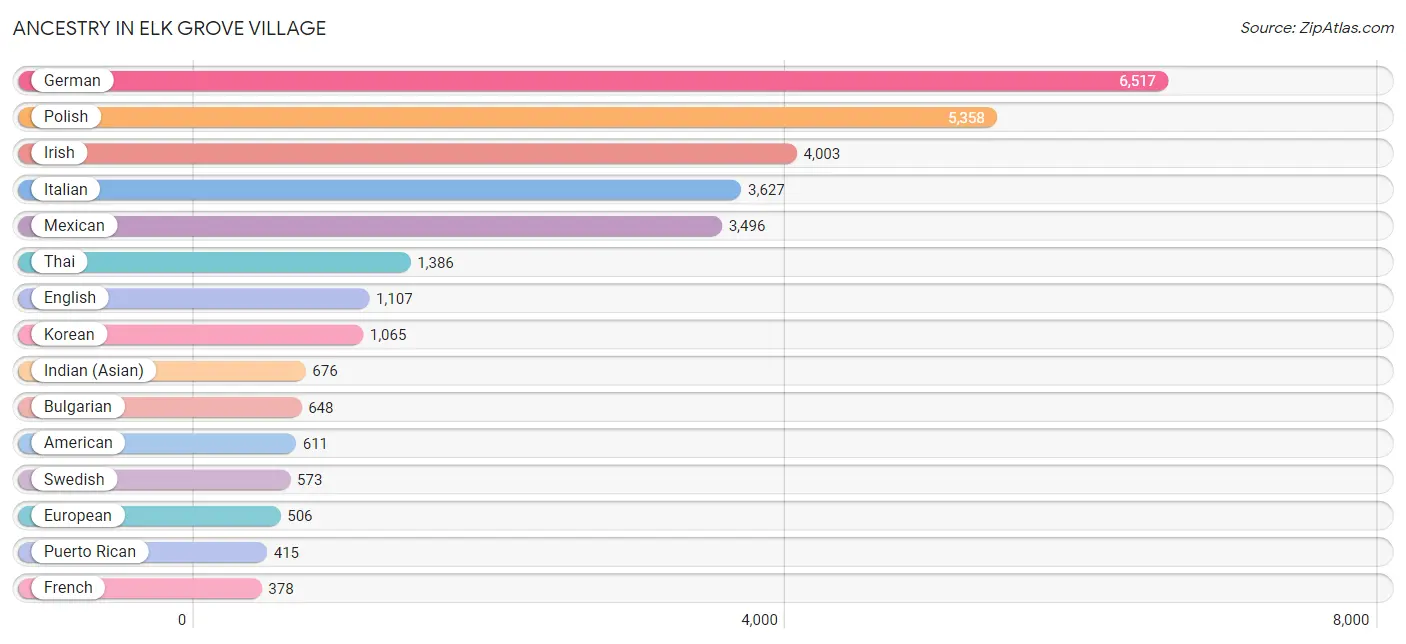
Ancestry in Elk Grove Village
The most populous ancestries reported in Elk Grove Village are German (6,517 | 20.1%), Polish (5,358 | 16.5%), Irish (4,003 | 12.3%), Italian (3,627 | 11.2%), and Mexican (3,496 | 10.8%), together accounting for 70.8% of all Elk Grove Village residents.
| Ancestry | # Population | % Population |
| African | 68 | 0.2% |
| Albanian | 85 | 0.3% |
| American | 611 | 1.9% |
| Arab | 336 | 1.0% |
| Armenian | 83 | 0.3% |
| Assyrian / Chaldean / Syriac | 147 | 0.4% |
| Austrian | 158 | 0.5% |
| Belgian | 41 | 0.1% |
| Belizean | 27 | 0.1% |
| Bhutanese | 283 | 0.9% |
| Brazilian | 14 | 0.0% |
| British | 63 | 0.2% |
| Bulgarian | 648 | 2.0% |
| Burmese | 280 | 0.9% |
| Cambodian | 233 | 0.7% |
| Canadian | 16 | 0.1% |
| Central American | 268 | 0.8% |
| Central American Indian | 24 | 0.1% |
| Cherokee | 70 | 0.2% |
| Chilean | 54 | 0.2% |
| Colombian | 145 | 0.4% |
| Croatian | 170 | 0.5% |
| Cuban | 53 | 0.2% |
| Czech | 212 | 0.6% |
| Czechoslovakian | 43 | 0.1% |
| Danish | 28 | 0.1% |
| Dutch | 190 | 0.6% |
| Eastern European | 66 | 0.2% |
| Ecuadorian | 32 | 0.1% |
| English | 1,107 | 3.4% |
| European | 506 | 1.6% |
| Finnish | 71 | 0.2% |
| French | 378 | 1.2% |
| French Canadian | 27 | 0.1% |
| German | 6,517 | 20.1% |
| Greek | 242 | 0.7% |
| Guatemalan | 143 | 0.4% |
| Haitian | 20 | 0.1% |
| Honduran | 13 | 0.0% |
| Hungarian | 99 | 0.3% |
| Indian (Asian) | 676 | 2.1% |
| Iranian | 130 | 0.4% |
| Iraqi | 20 | 0.1% |
| Irish | 4,003 | 12.3% |
| Italian | 3,627 | 11.2% |
| Japanese | 9 | 0.0% |
| Korean | 1,065 | 3.3% |
| Latvian | 8 | 0.0% |
| Lebanese | 253 | 0.8% |
| Lithuanian | 128 | 0.4% |
| Luxembourger | 25 | 0.1% |
| Mexican | 3,496 | 10.8% |
| Mexican American Indian | 67 | 0.2% |
| Nicaraguan | 40 | 0.1% |
| Norwegian | 298 | 0.9% |
| Palestinian | 91 | 0.3% |
| Panamanian | 72 | 0.2% |
| Peruvian | 56 | 0.2% |
| Polish | 5,358 | 16.5% |
| Puerto Rican | 415 | 1.3% |
| Romanian | 267 | 0.8% |
| Russian | 262 | 0.8% |
| Scandinavian | 86 | 0.3% |
| Scotch-Irish | 104 | 0.3% |
| Scottish | 74 | 0.2% |
| Serbian | 297 | 0.9% |
| Sioux | 25 | 0.1% |
| Slavic | 165 | 0.5% |
| Slovak | 114 | 0.4% |
| Slovene | 13 | 0.0% |
| South American | 287 | 0.9% |
| Spaniard | 10 | 0.0% |
| Sri Lankan | 39 | 0.1% |
| Subsaharan African | 76 | 0.2% |
| Swedish | 573 | 1.8% |
| Thai | 1,386 | 4.3% |
| Trinidadian and Tobagonian | 1 | 0.0% |
| Turkish | 39 | 0.1% |
| Ukrainian | 336 | 1.0% |
| Welsh | 10 | 0.0% |
| Yugoslavian | 68 | 0.2% | View All 81 Rows |
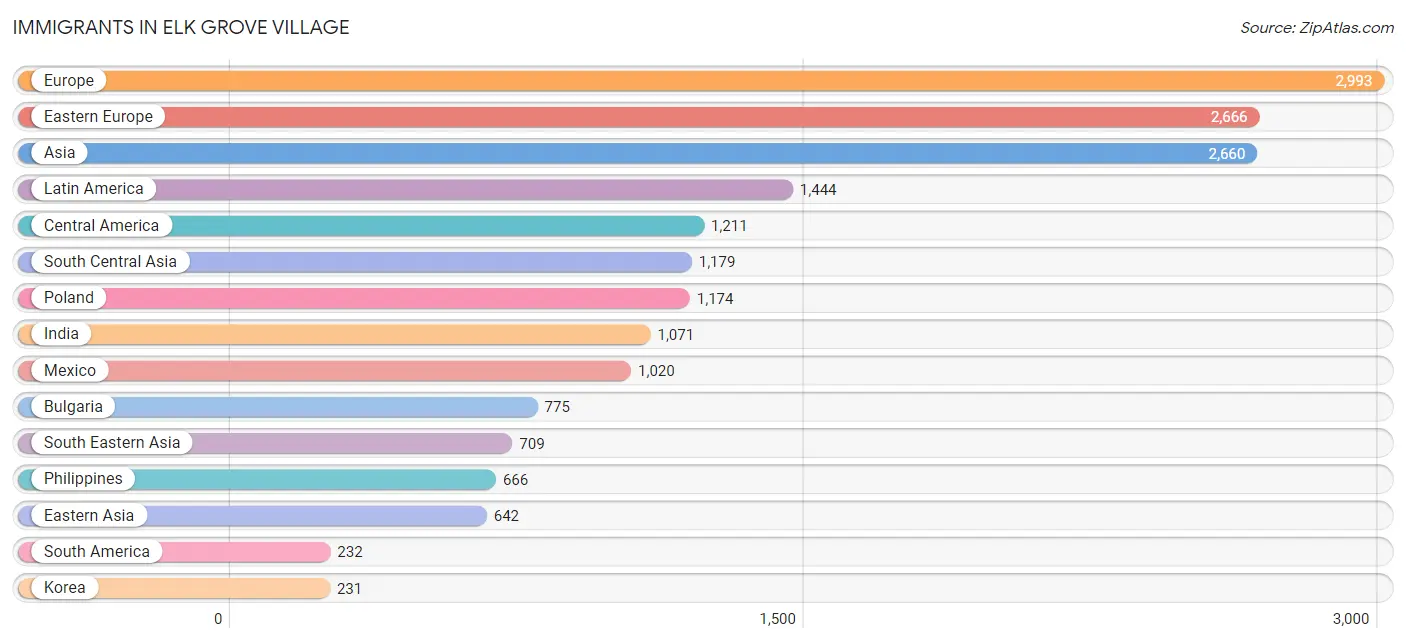
Immigrants in Elk Grove Village
The most numerous immigrant groups reported in Elk Grove Village came from Europe (2,993 | 9.2%), Eastern Europe (2,666 | 8.2%), Asia (2,660 | 8.2%), Latin America (1,444 | 4.4%), and Central America (1,211 | 3.7%), together accounting for 33.8% of all Elk Grove Village residents.
| Immigration Origin | # Population | % Population |
| Africa | 12 | 0.0% |
| Albania | 22 | 0.1% |
| Armenia | 17 | 0.1% |
| Asia | 2,660 | 8.2% |
| Belize | 27 | 0.1% |
| Bosnia and Herzegovina | 76 | 0.2% |
| Bulgaria | 775 | 2.4% |
| Cambodia | 8 | 0.0% |
| Canada | 41 | 0.1% |
| Caribbean | 1 | 0.0% |
| Central America | 1,211 | 3.7% |
| China | 172 | 0.5% |
| Colombia | 194 | 0.6% |
| Croatia | 125 | 0.4% |
| Czechoslovakia | 41 | 0.1% |
| Denmark | 15 | 0.1% |
| Eastern Africa | 8 | 0.0% |
| Eastern Asia | 642 | 2.0% |
| Eastern Europe | 2,666 | 8.2% |
| Ecuador | 15 | 0.1% |
| Egypt | 4 | 0.0% |
| England | 28 | 0.1% |
| Europe | 2,993 | 9.2% |
| Germany | 19 | 0.1% |
| Greece | 69 | 0.2% |
| Guatemala | 39 | 0.1% |
| Honduras | 13 | 0.0% |
| Hong Kong | 11 | 0.0% |
| India | 1,071 | 3.3% |
| Iran | 108 | 0.3% |
| Iraq | 11 | 0.0% |
| Ireland | 31 | 0.1% |
| Italy | 124 | 0.4% |
| Japan | 159 | 0.5% |
| Jordan | 14 | 0.0% |
| Korea | 231 | 0.7% |
| Kuwait | 39 | 0.1% |
| Latin America | 1,444 | 4.4% |
| Latvia | 8 | 0.0% |
| Lebanon | 14 | 0.0% |
| Malaysia | 8 | 0.0% |
| Mexico | 1,020 | 3.1% |
| Moldova | 57 | 0.2% |
| Netherlands | 8 | 0.0% |
| Nicaragua | 40 | 0.1% |
| North Macedonia | 14 | 0.0% |
| Northern Africa | 4 | 0.0% |
| Northern Europe | 107 | 0.3% |
| Panama | 72 | 0.2% |
| Peru | 23 | 0.1% |
| Philippines | 666 | 2.1% |
| Poland | 1,174 | 3.6% |
| Romania | 123 | 0.4% |
| Russia | 23 | 0.1% |
| Scotland | 14 | 0.0% |
| Serbia | 81 | 0.3% |
| South America | 232 | 0.7% |
| South Central Asia | 1,179 | 3.6% |
| South Eastern Asia | 709 | 2.2% |
| Southern Europe | 193 | 0.6% |
| Taiwan | 8 | 0.0% |
| Trinidad and Tobago | 1 | 0.0% |
| Turkey | 21 | 0.1% |
| Ukraine | 138 | 0.4% |
| Vietnam | 27 | 0.1% |
| Western Asia | 116 | 0.4% |
| Western Europe | 27 | 0.1% | View All 67 Rows |
Sex and Age in Elk Grove Village
Sex and Age in Elk Grove Village
The most populous age groups in Elk Grove Village are 60 to 64 Years (1,302 | 8.4%) for men and 35 to 39 Years (1,501 | 8.9%) for women.
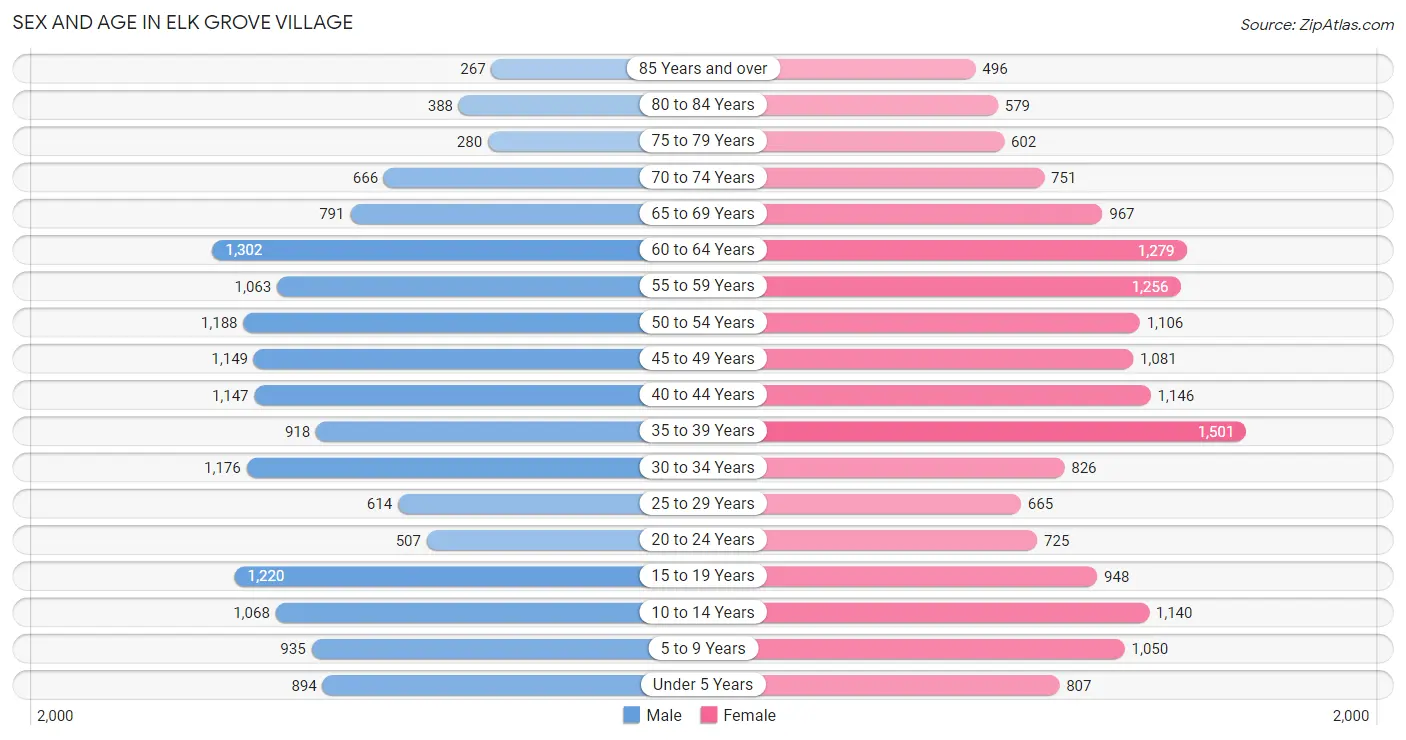
| Age Bracket | Male | Female |
| Under 5 Years | 894 (5.7%) | 807 (4.8%) |
| 5 to 9 Years | 935 (6.0%) | 1,050 (6.2%) |
| 10 to 14 Years | 1,068 (6.9%) | 1,140 (6.7%) |
| 15 to 19 Years | 1,220 (7.8%) | 948 (5.6%) |
| 20 to 24 Years | 507 (3.3%) | 725 (4.3%) |
| 25 to 29 Years | 614 (3.9%) | 665 (3.9%) |
| 30 to 34 Years | 1,176 (7.5%) | 826 (4.9%) |
| 35 to 39 Years | 918 (5.9%) | 1,501 (8.9%) |
| 40 to 44 Years | 1,147 (7.4%) | 1,146 (6.8%) |
| 45 to 49 Years | 1,149 (7.4%) | 1,081 (6.4%) |
| 50 to 54 Years | 1,188 (7.6%) | 1,106 (6.5%) |
| 55 to 59 Years | 1,063 (6.8%) | 1,256 (7.4%) |
| 60 to 64 Years | 1,302 (8.4%) | 1,279 (7.6%) |
| 65 to 69 Years | 791 (5.1%) | 967 (5.7%) |
| 70 to 74 Years | 666 (4.3%) | 751 (4.4%) |
| 75 to 79 Years | 280 (1.8%) | 602 (3.6%) |
| 80 to 84 Years | 388 (2.5%) | 579 (3.4%) |
| 85 Years and over | 267 (1.7%) | 496 (2.9%) |
| Total | 15,573 (100.0%) | 16,925 (100.0%) |
Families and Households in Elk Grove Village
Median Family Size in Elk Grove Village
The median family size in Elk Grove Village is 3.12 persons per family, with married-couple families (7,053 | 80.8%) accounting for the largest median family size of 3.17 persons per family. On the other hand, single male/father families (369 | 4.2%) represent the smallest median family size with 2.73 persons per family.
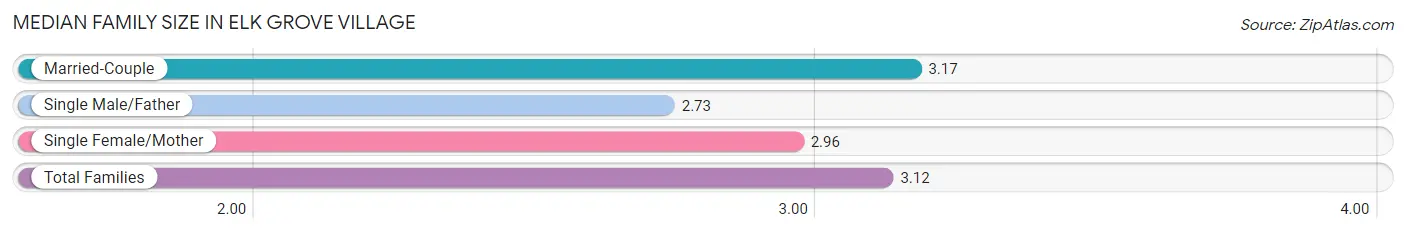
| Family Type | # Families | Family Size |
| Married-Couple | 7,053 (80.8%) | 3.17 |
| Single Male/Father | 369 (4.2%) | 2.73 |
| Single Female/Mother | 1,310 (15.0%) | 2.96 |
| Total Families | 8,732 (100.0%) | 3.12 |
Median Household Size in Elk Grove Village
The median household size in Elk Grove Village is 2.54 persons per household, with married-couple households (7,053 | 55.6%) accounting for the largest median household size of 3.19 persons per household. non-family households (3,959 | 31.2%) represent the smallest median household size with 1.16 persons per household.
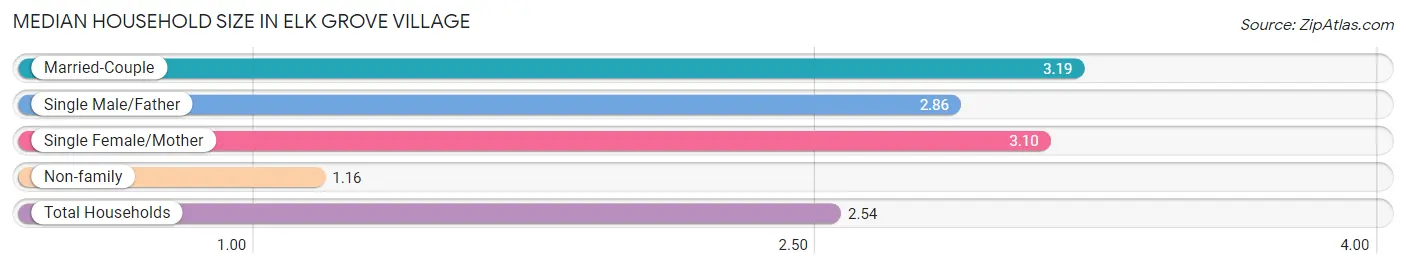
| Household Type | # Households | Household Size |
| Married-Couple | 7,053 (55.6%) | 3.19 |
| Single Male/Father | 369 (2.9%) | 2.86 |
| Single Female/Mother | 1,310 (10.3%) | 3.10 |
| Non-family | 3,959 (31.2%) | 1.16 |
| Total Households | 12,691 (100.0%) | 2.54 |
Household Size by Marriage Status in Elk Grove Village
Out of a total of 12,691 households in Elk Grove Village, 8,732 (68.8%) are family households, while 3,959 (31.2%) are nonfamily households. The most numerous type of family households are 2-person households, comprising 3,683, and the most common type of nonfamily households are 1-person households, comprising 3,536.
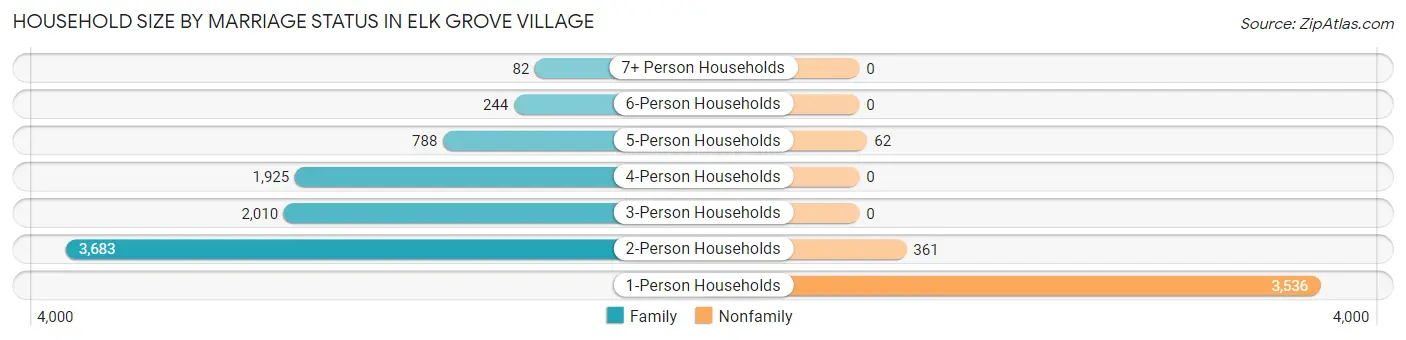
| Household Size | Family Households | Nonfamily Households |
| 1-Person Households | - | 3,536 (27.9%) |
| 2-Person Households | 3,683 (29.0%) | 361 (2.8%) |
| 3-Person Households | 2,010 (15.8%) | 0 (0.0%) |
| 4-Person Households | 1,925 (15.2%) | 0 (0.0%) |
| 5-Person Households | 788 (6.2%) | 62 (0.5%) |
| 6-Person Households | 244 (1.9%) | 0 (0.0%) |
| 7+ Person Households | 82 (0.6%) | 0 (0.0%) |
| Total | 8,732 (68.8%) | 3,959 (31.2%) |
Female Fertility in Elk Grove Village
Fertility by Age in Elk Grove Village
Average fertility rate in Elk Grove Village is 49.0 births per 1,000 women. Women in the age bracket of 20 to 34 years have the highest fertility rate with 93.0 births per 1,000 women. Women in the age bracket of 20 to 34 years acount for 59.7% of all women with births.
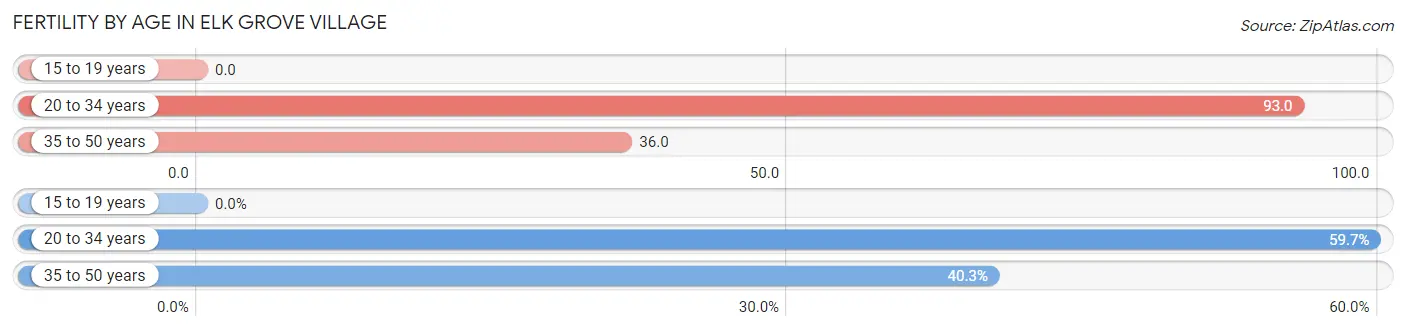
| Age Bracket | Women with Births | Births / 1,000 Women |
| 15 to 19 years | 0 (0.0%) | 0.0 |
| 20 to 34 years | 206 (59.7%) | 93.0 |
| 35 to 50 years | 139 (40.3%) | 36.0 |
| Total | 345 (100.0%) | 49.0 |
Fertility by Age by Marriage Status in Elk Grove Village
79.7% of women with births (345) in Elk Grove Village are married. The highest percentage of unmarried women with births falls into 20 to 34 years age bracket with 34.0% of them unmarried at the time of birth, while the lowest percentage of unmarried women with births belong to 35 to 50 years age bracket with 0.0% of them unmarried.
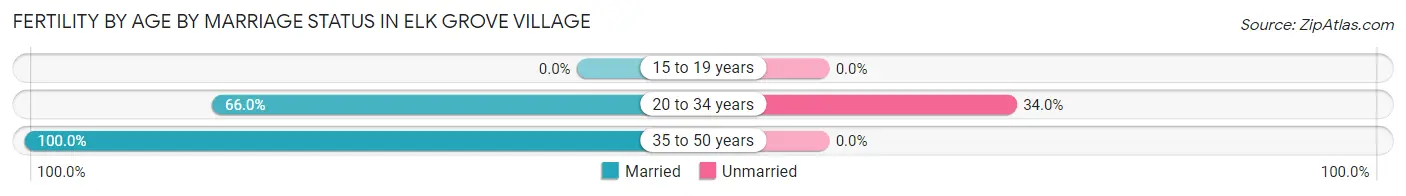
| Age Bracket | Married | Unmarried |
| 15 to 19 years | 0 (0.0%) | 0 (0.0%) |
| 20 to 34 years | 136 (66.0%) | 70 (34.0%) |
| 35 to 50 years | 139 (100.0%) | 0 (0.0%) |
| Total | 275 (79.7%) | 70 (20.3%) |
Fertility by Education in Elk Grove Village
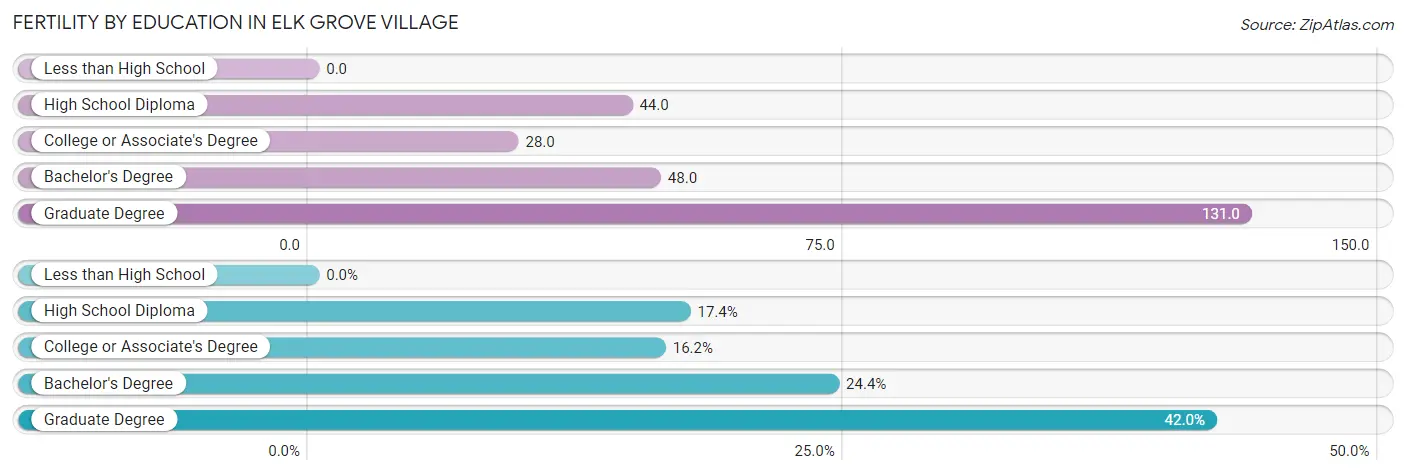
| Educational Attainment | Women with Births | Births / 1,000 Women |
| Less than High School | 0 (0.0%) | 0.0 |
| High School Diploma | 60 (17.4%) | 44.0 |
| College or Associate's Degree | 56 (16.2%) | 28.0 |
| Bachelor's Degree | 84 (24.3%) | 48.0 |
| Graduate Degree | 145 (42.0%) | 131.0 |
| Total | 345 (100.0%) | 49.0 |
Fertility by Education by Marriage Status in Elk Grove Village
20.3% of women with births in Elk Grove Village are unmarried. Women with the educational attainment of bachelor's degree are most likely to be married with 100.0% of them married at childbirth, while women with the educational attainment of college or associate's degree are least likely to be married with 100.0% of them unmarried at childbirth.
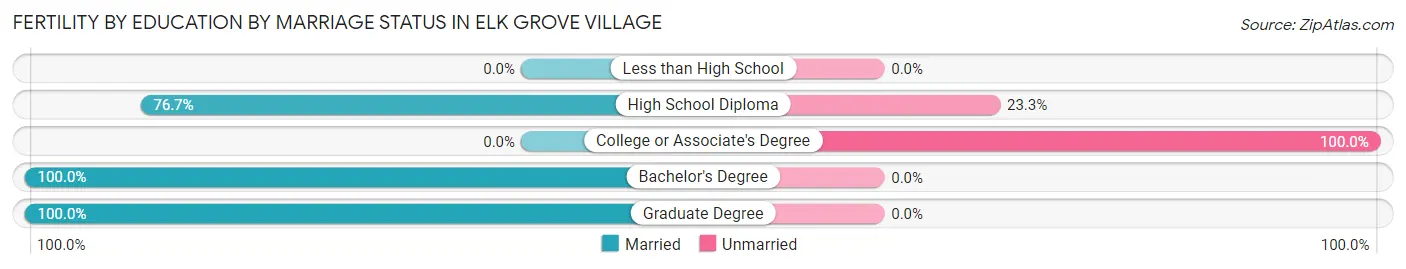
| Educational Attainment | Married | Unmarried |
| Less than High School | 0 (0.0%) | 0 (0.0%) |
| High School Diploma | 46 (76.7%) | 14 (23.3%) |
| College or Associate's Degree | 0 (0.0%) | 56 (100.0%) |
| Bachelor's Degree | 84 (100.0%) | 0 (0.0%) |
| Graduate Degree | 145 (100.0%) | 0 (0.0%) |
| Total | 275 (79.7%) | 70 (20.3%) |
Employment Characteristics in Elk Grove Village
Employment by Class of Employer in Elk Grove Village
Among the 17,002 employed individuals in Elk Grove Village, private company employees (12,098 | 71.2%), local government employees (1,446 | 8.5%), and not-for-profit organizations (1,362 | 8.0%) make up the most common classes of employment.
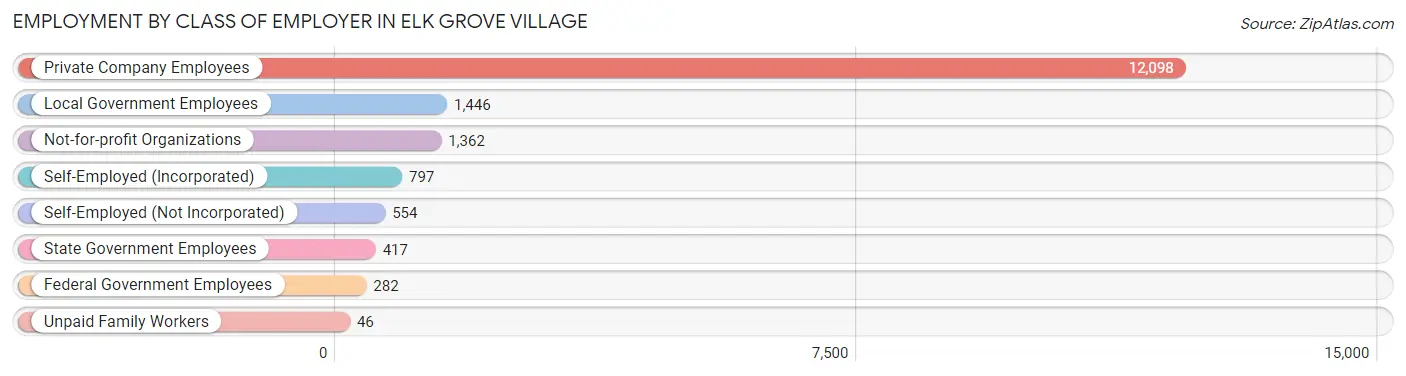
| Employer Class | # Employees | % Employees |
| Private Company Employees | 12,098 | 71.2% |
| Self-Employed (Incorporated) | 797 | 4.7% |
| Self-Employed (Not Incorporated) | 554 | 3.3% |
| Not-for-profit Organizations | 1,362 | 8.0% |
| Local Government Employees | 1,446 | 8.5% |
| State Government Employees | 417 | 2.5% |
| Federal Government Employees | 282 | 1.7% |
| Unpaid Family Workers | 46 | 0.3% |
| Total | 17,002 | 100.0% |
Employment Status by Age in Elk Grove Village
According to the labor force statistics for Elk Grove Village, out of the total population over 16 years of age (26,053), 69.1% or 18,003 individuals are in the labor force, with 4.2% or 756 of them unemployed. The age group with the highest labor force participation rate is 30 to 34 years, with 89.6% or 1,794 individuals in the labor force. Within the labor force, the 16 to 19 years age range has the highest percentage of unemployed individuals, with 27.0% or 190 of them being unemployed.
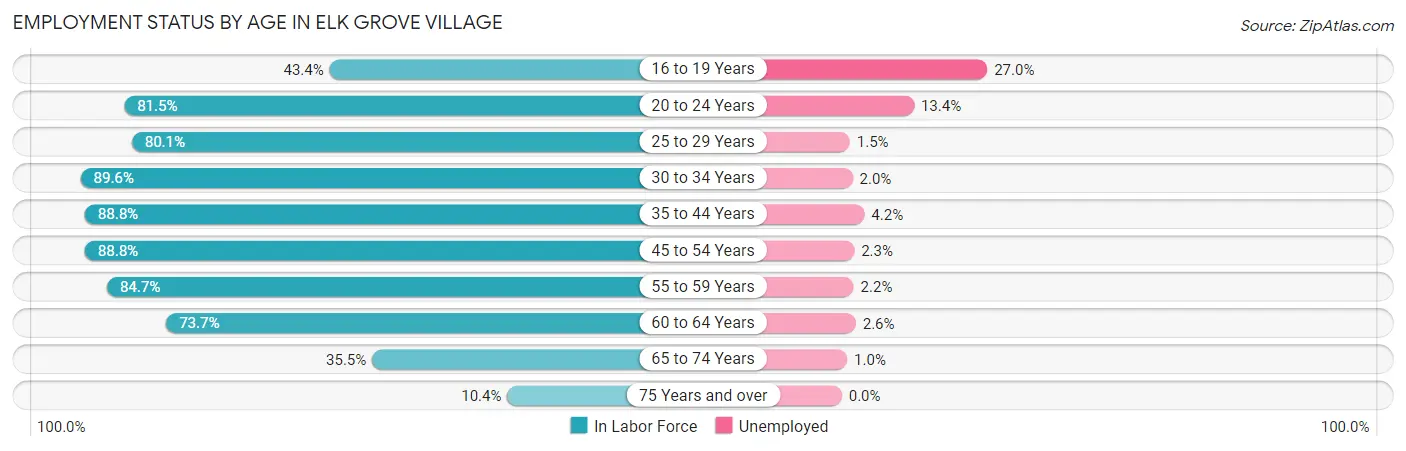
| Age Bracket | In Labor Force | Unemployed |
| 16 to 19 Years | 702 (43.4%) | 190 (27.0%) |
| 20 to 24 Years | 1,004 (81.5%) | 135 (13.4%) |
| 25 to 29 Years | 1,024 (80.1%) | 15 (1.5%) |
| 30 to 34 Years | 1,794 (89.6%) | 36 (2.0%) |
| 35 to 44 Years | 4,184 (88.8%) | 176 (4.2%) |
| 45 to 54 Years | 4,017 (88.8%) | 92 (2.3%) |
| 55 to 59 Years | 1,964 (84.7%) | 43 (2.2%) |
| 60 to 64 Years | 1,902 (73.7%) | 49 (2.6%) |
| 65 to 74 Years | 1,127 (35.5%) | 11 (1.0%) |
| 75 Years and over | 272 (10.4%) | 0 (0.0%) |
| Total | 18,003 (69.1%) | 756 (4.2%) |
Employment Status by Educational Attainment in Elk Grove Village
According to labor force statistics for Elk Grove Village, 85.5% of individuals (14,892) out of the total population between 25 and 64 years of age (17,417) are in the labor force, with 2.8% or 417 of them being unemployed. The group with the highest labor force participation rate are those with the educational attainment of bachelor's degree or higher, with 92.2% or 7,052 individuals in the labor force. Within the labor force, individuals with less than high school education have the highest percentage of unemployment, with 8.2% or 49 of them being unemployed.
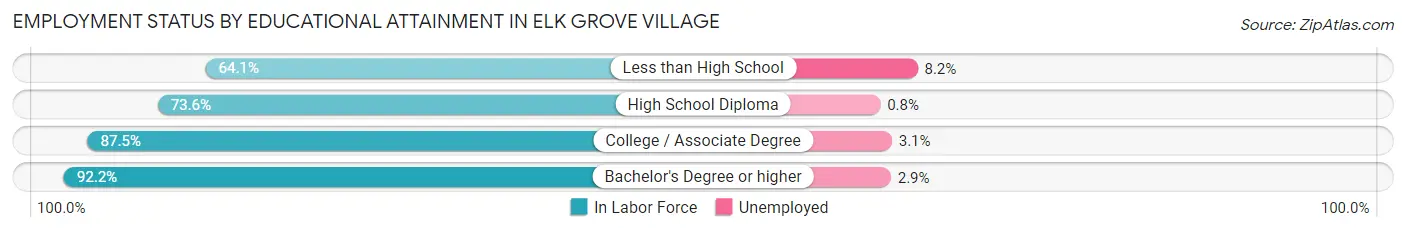
| Educational Attainment | In Labor Force | Unemployed |
| Less than High School | 601 (64.1%) | 77 (8.2%) |
| High School Diploma | 2,608 (73.6%) | 28 (0.8%) |
| College / Associate Degree | 4,626 (87.5%) | 164 (3.1%) |
| Bachelor's Degree or higher | 7,052 (92.2%) | 222 (2.9%) |
| Total | 14,892 (85.5%) | 488 (2.8%) |
Employment Occupations by Sex in Elk Grove Village
Management, Business, Science and Arts Occupations
The most common Management, Business, Science and Arts occupations in Elk Grove Village are Management (2,417 | 14.0%), Community & Social Service (1,859 | 10.8%), Education Instruction & Library (1,365 | 7.9%), Business & Financial (1,103 | 6.4%), and Computers, Engineering & Science (1,061 | 6.1%).
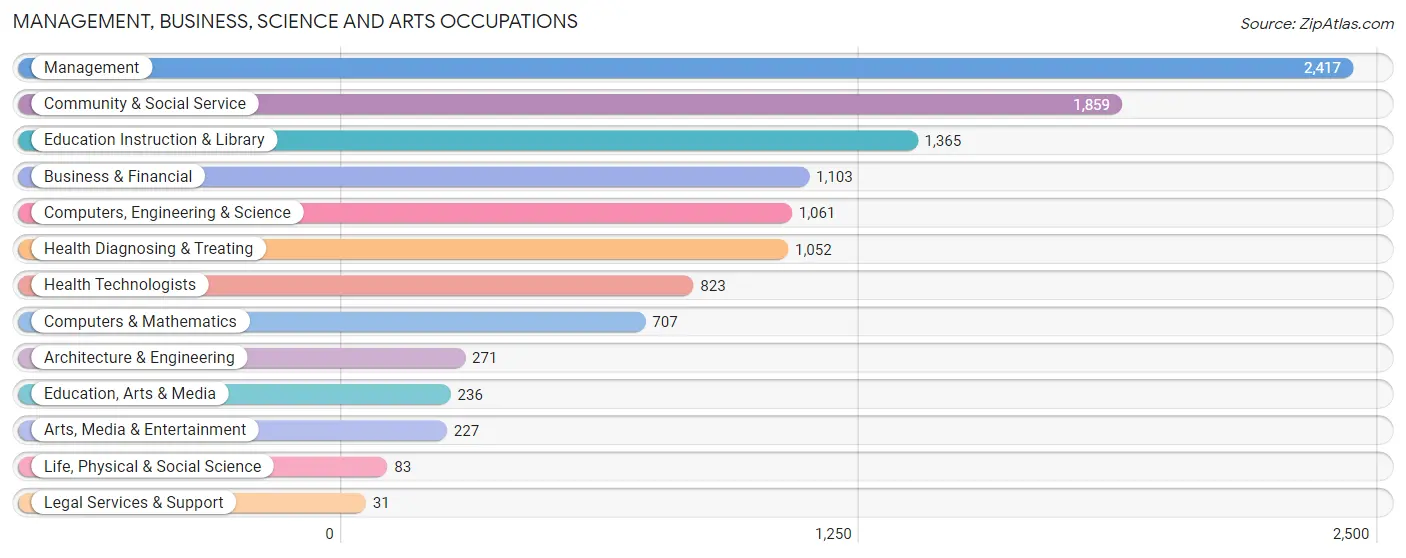
Management, Business, Science and Arts Occupations by Sex
Within the Management, Business, Science and Arts occupations in Elk Grove Village, the most male-oriented occupations are Architecture & Engineering (80.8%), Computers & Mathematics (71.9%), and Computers, Engineering & Science (71.2%), while the most female-oriented occupations are Legal Services & Support (100.0%), Health Diagnosing & Treating (79.5%), and Education Instruction & Library (78.2%).
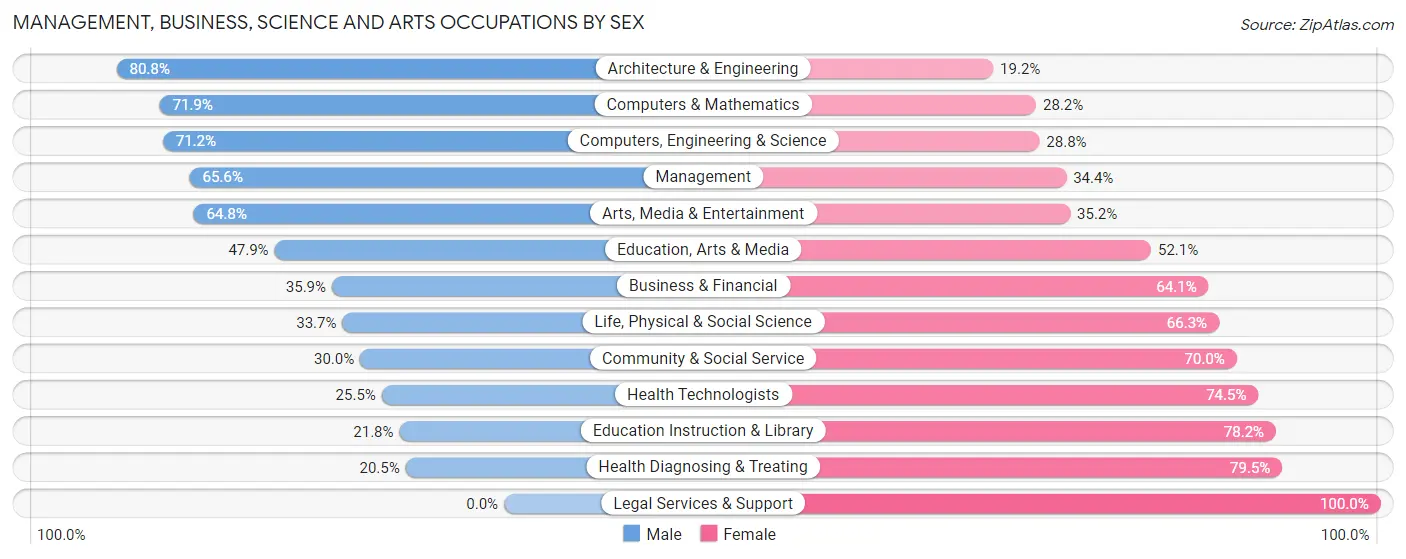
| Occupation | Male | Female |
| Management | 1,585 (65.6%) | 832 (34.4%) |
| Business & Financial | 396 (35.9%) | 707 (64.1%) |
| Computers, Engineering & Science | 755 (71.2%) | 306 (28.8%) |
| Computers & Mathematics | 508 (71.9%) | 199 (28.1%) |
| Architecture & Engineering | 219 (80.8%) | 52 (19.2%) |
| Life, Physical & Social Science | 28 (33.7%) | 55 (66.3%) |
| Community & Social Service | 558 (30.0%) | 1,301 (70.0%) |
| Education, Arts & Media | 113 (47.9%) | 123 (52.1%) |
| Legal Services & Support | 0 (0.0%) | 31 (100.0%) |
| Education Instruction & Library | 298 (21.8%) | 1,067 (78.2%) |
| Arts, Media & Entertainment | 147 (64.8%) | 80 (35.2%) |
| Health Diagnosing & Treating | 216 (20.5%) | 836 (79.5%) |
| Health Technologists | 210 (25.5%) | 613 (74.5%) |
| Total (Category) | 3,510 (46.9%) | 3,982 (53.1%) |
| Total (Overall) | 8,776 (50.9%) | 8,468 (49.1%) |
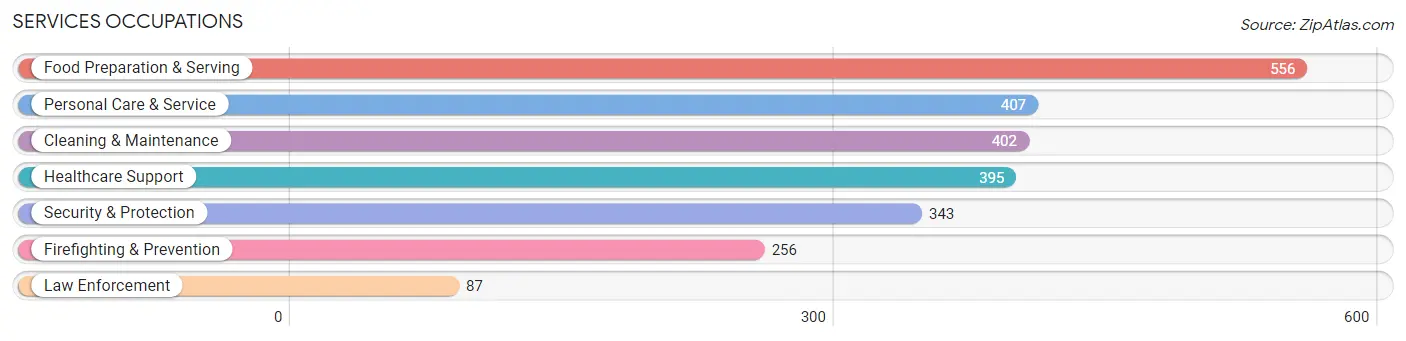
Services Occupations
The most common Services occupations in Elk Grove Village are Food Preparation & Serving (556 | 3.2%), Personal Care & Service (407 | 2.4%), Cleaning & Maintenance (402 | 2.3%), Healthcare Support (395 | 2.3%), and Security & Protection (343 | 2.0%).
Services Occupations by Sex
Within the Services occupations in Elk Grove Village, the most male-oriented occupations are Cleaning & Maintenance (65.2%), Law Enforcement (62.1%), and Security & Protection (40.2%), while the most female-oriented occupations are Healthcare Support (79.0%), Food Preparation & Serving (70.3%), and Firefighting & Prevention (67.2%).
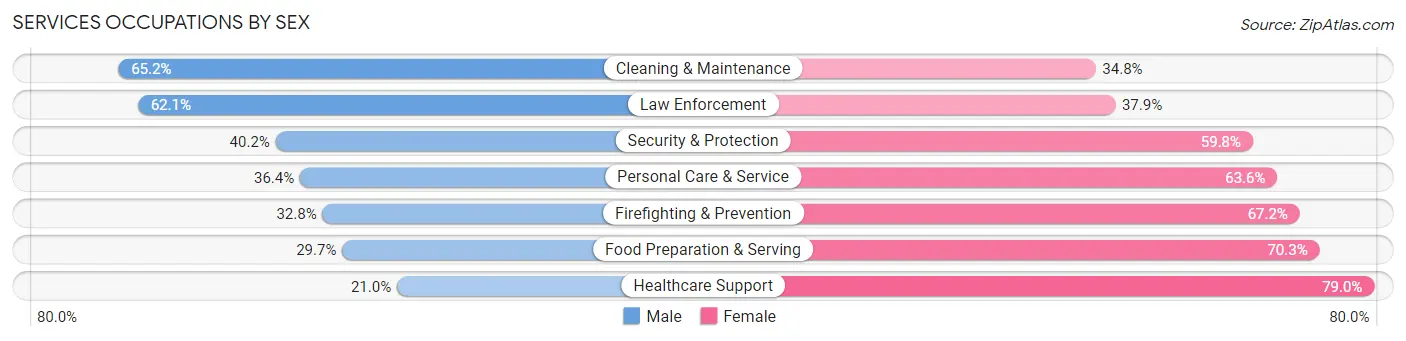
| Occupation | Male | Female |
| Healthcare Support | 83 (21.0%) | 312 (79.0%) |
| Security & Protection | 138 (40.2%) | 205 (59.8%) |
| Firefighting & Prevention | 84 (32.8%) | 172 (67.2%) |
| Law Enforcement | 54 (62.1%) | 33 (37.9%) |
| Food Preparation & Serving | 165 (29.7%) | 391 (70.3%) |
| Cleaning & Maintenance | 262 (65.2%) | 140 (34.8%) |
| Personal Care & Service | 148 (36.4%) | 259 (63.6%) |
| Total (Category) | 796 (37.9%) | 1,307 (62.2%) |
| Total (Overall) | 8,776 (50.9%) | 8,468 (49.1%) |
Sales and Office Occupations
The most common Sales and Office occupations in Elk Grove Village are Office & Administration (2,505 | 14.5%), and Sales & Related (1,644 | 9.5%).

Sales and Office Occupations by Sex

| Occupation | Male | Female |
| Sales & Related | 861 (52.4%) | 783 (47.6%) |
| Office & Administration | 660 (26.4%) | 1,845 (73.7%) |
| Total (Category) | 1,521 (36.7%) | 2,628 (63.3%) |
| Total (Overall) | 8,776 (50.9%) | 8,468 (49.1%) |
Natural Resources, Construction and Maintenance Occupations
The most common Natural Resources, Construction and Maintenance occupations in Elk Grove Village are Construction & Extraction (929 | 5.4%), Installation, Maintenance & Repair (392 | 2.3%), and Farming, Fishing & Forestry (98 | 0.6%).

Natural Resources, Construction and Maintenance Occupations by Sex

| Occupation | Male | Female |
| Farming, Fishing & Forestry | 98 (100.0%) | 0 (0.0%) |
| Construction & Extraction | 906 (97.5%) | 23 (2.5%) |
| Installation, Maintenance & Repair | 385 (98.2%) | 7 (1.8%) |
| Total (Category) | 1,389 (97.9%) | 30 (2.1%) |
| Total (Overall) | 8,776 (50.9%) | 8,468 (49.1%) |
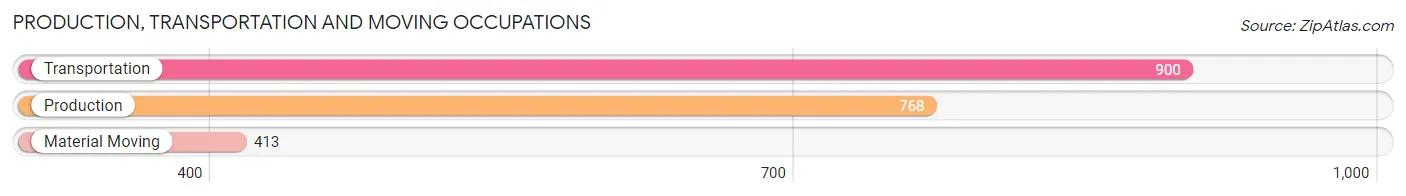
Production, Transportation and Moving Occupations
The most common Production, Transportation and Moving occupations in Elk Grove Village are Transportation (900 | 5.2%), Production (768 | 4.4%), and Material Moving (413 | 2.4%).
Production, Transportation and Moving Occupations by Sex

| Occupation | Male | Female |
| Production | 610 (79.4%) | 158 (20.6%) |
| Transportation | 722 (80.2%) | 178 (19.8%) |
| Material Moving | 228 (55.2%) | 185 (44.8%) |
| Total (Category) | 1,560 (75.0%) | 521 (25.0%) |
| Total (Overall) | 8,776 (50.9%) | 8,468 (49.1%) |
Employment Industries by Sex in Elk Grove Village
Employment Industries in Elk Grove Village
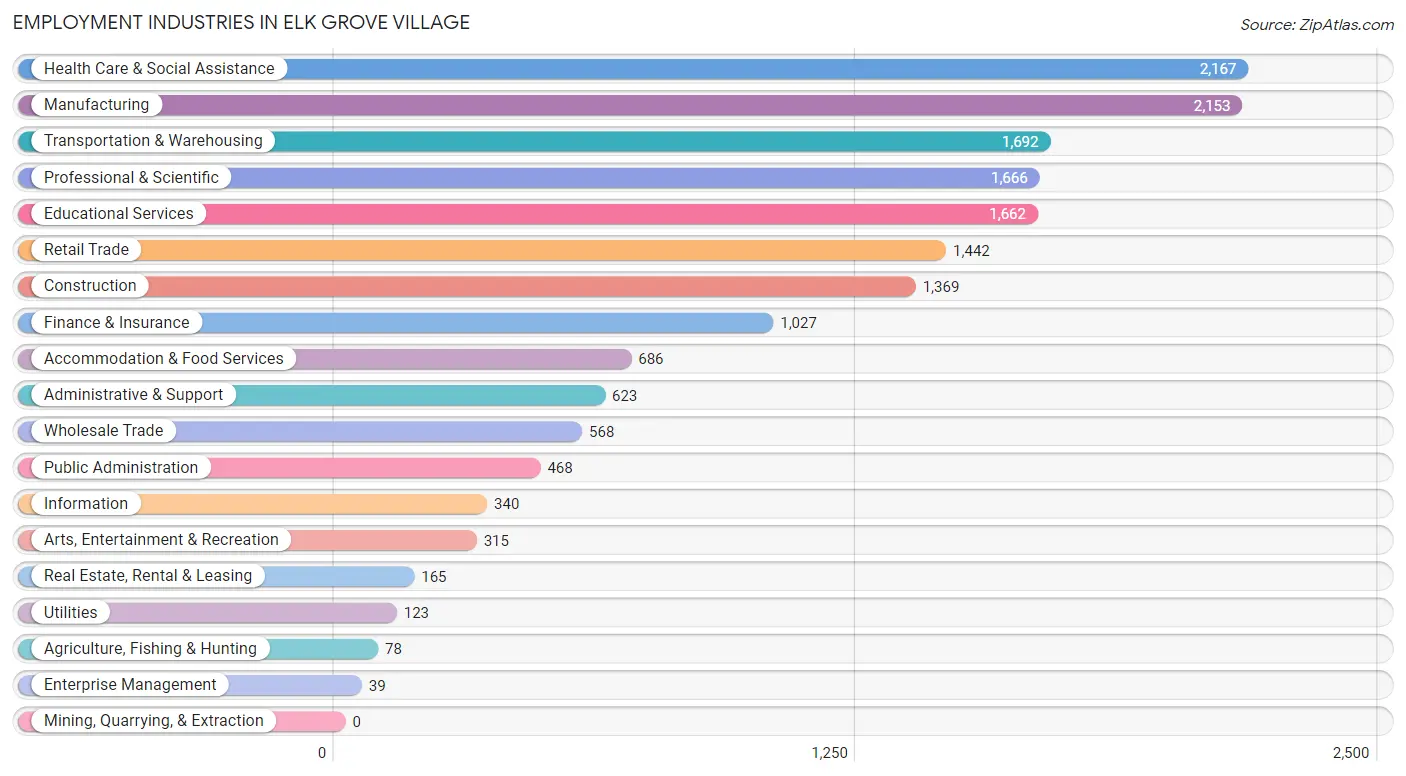
The major employment industries in Elk Grove Village include Health Care & Social Assistance (2,167 | 12.6%), Manufacturing (2,153 | 12.5%), Transportation & Warehousing (1,692 | 9.8%), Professional & Scientific (1,666 | 9.7%), and Educational Services (1,662 | 9.6%).
Employment Industries by Sex in Elk Grove Village
The Elk Grove Village industries that see more men than women are Utilities (100.0%), Construction (90.8%), and Wholesale Trade (73.2%), whereas the industries that tend to have a higher number of women are Health Care & Social Assistance (82.2%), Public Administration (77.1%), and Enterprise Management (74.4%).
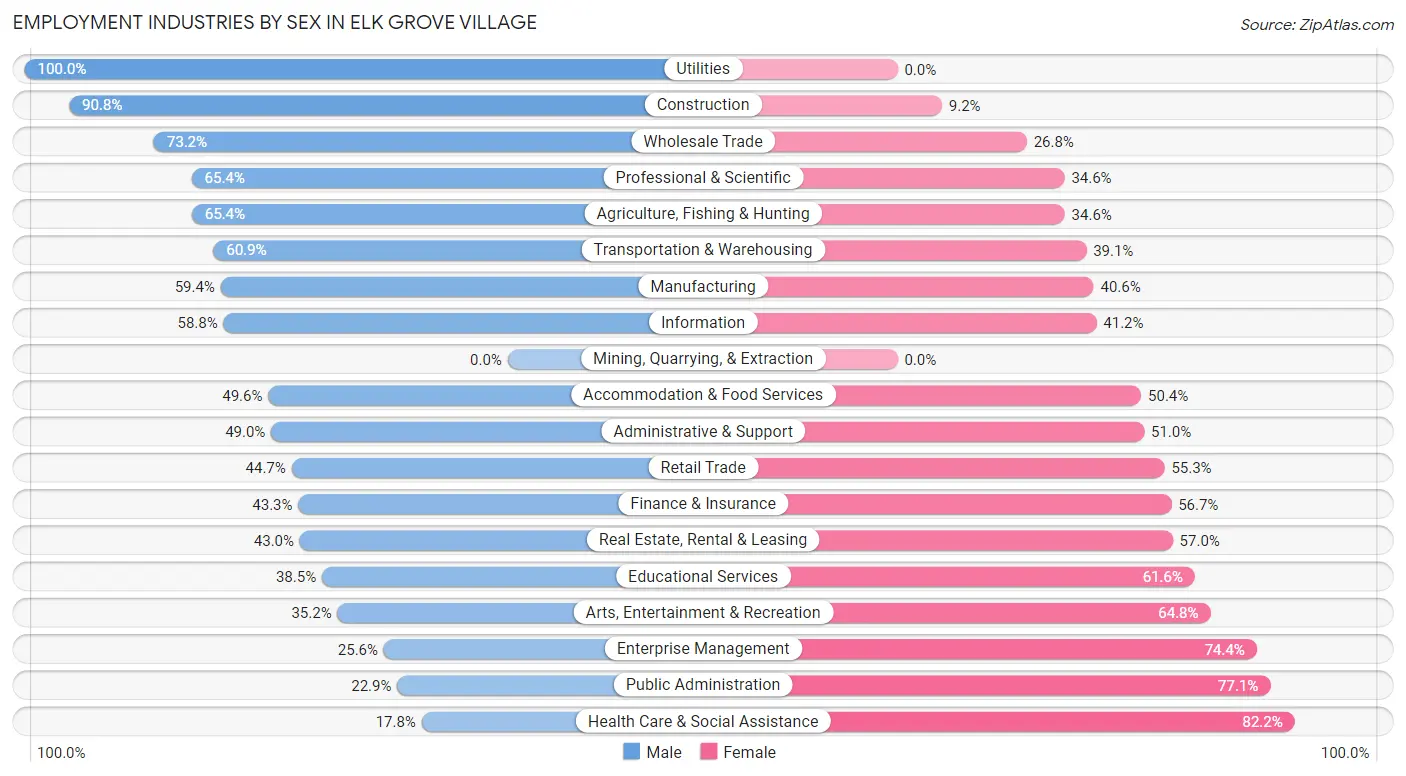
| Industry | Male | Female |
| Agriculture, Fishing & Hunting | 51 (65.4%) | 27 (34.6%) |
| Mining, Quarrying, & Extraction | 0 (0.0%) | 0 (0.0%) |
| Construction | 1,243 (90.8%) | 126 (9.2%) |
| Manufacturing | 1,279 (59.4%) | 874 (40.6%) |
| Wholesale Trade | 416 (73.2%) | 152 (26.8%) |
| Retail Trade | 645 (44.7%) | 797 (55.3%) |
| Transportation & Warehousing | 1,031 (60.9%) | 661 (39.1%) |
| Utilities | 123 (100.0%) | 0 (0.0%) |
| Information | 200 (58.8%) | 140 (41.2%) |
| Finance & Insurance | 445 (43.3%) | 582 (56.7%) |
| Real Estate, Rental & Leasing | 71 (43.0%) | 94 (57.0%) |
| Professional & Scientific | 1,090 (65.4%) | 576 (34.6%) |
| Enterprise Management | 10 (25.6%) | 29 (74.4%) |
| Administrative & Support | 305 (49.0%) | 318 (51.0%) |
| Educational Services | 639 (38.5%) | 1,023 (61.6%) |
| Health Care & Social Assistance | 386 (17.8%) | 1,781 (82.2%) |
| Arts, Entertainment & Recreation | 111 (35.2%) | 204 (64.8%) |
| Accommodation & Food Services | 340 (49.6%) | 346 (50.4%) |
| Public Administration | 107 (22.9%) | 361 (77.1%) |
| Total | 8,776 (50.9%) | 8,468 (49.1%) |
Education in Elk Grove Village
School Enrollment in Elk Grove Village
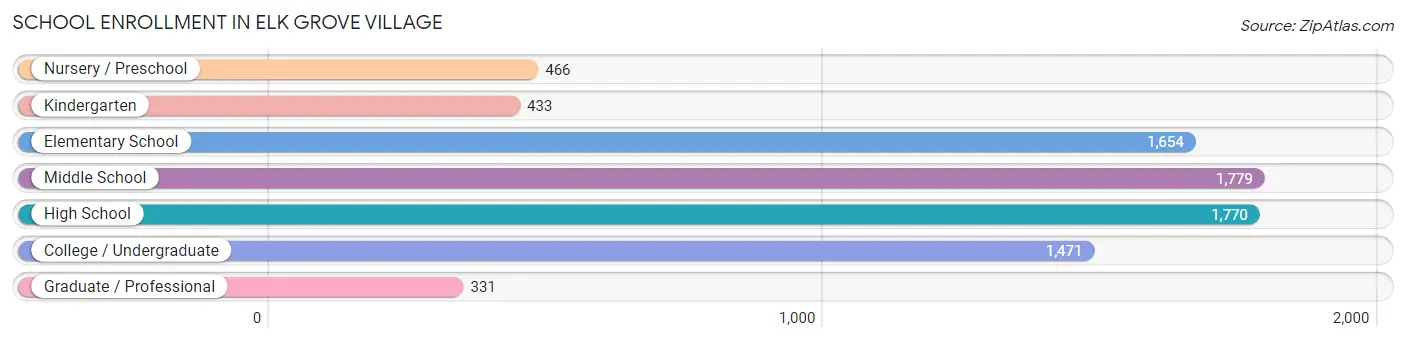
The most common levels of schooling among the 7,904 students in Elk Grove Village are middle school (1,779 | 22.5%), high school (1,770 | 22.4%), and elementary school (1,654 | 20.9%).
| School Level | # Students | % Students |
| Nursery / Preschool | 466 | 5.9% |
| Kindergarten | 433 | 5.5% |
| Elementary School | 1,654 | 20.9% |
| Middle School | 1,779 | 22.5% |
| High School | 1,770 | 22.4% |
| College / Undergraduate | 1,471 | 18.6% |
| Graduate / Professional | 331 | 4.2% |
| Total | 7,904 | 100.0% |
School Enrollment by Age by Funding Source in Elk Grove Village
Out of a total of 7,904 students who are enrolled in schools in Elk Grove Village, 941 (11.9%) attend a private institution, while the remaining 6,963 (88.1%) are enrolled in public schools. The age group of 3 to 4 year olds has the highest likelihood of being enrolled in private schools, with 212 (56.7% in the age bracket) enrolled. Conversely, the age group of 15 to 17 year olds has the lowest likelihood of being enrolled in a private school, with 1,289 (98.0% in the age bracket) attending a public institution.
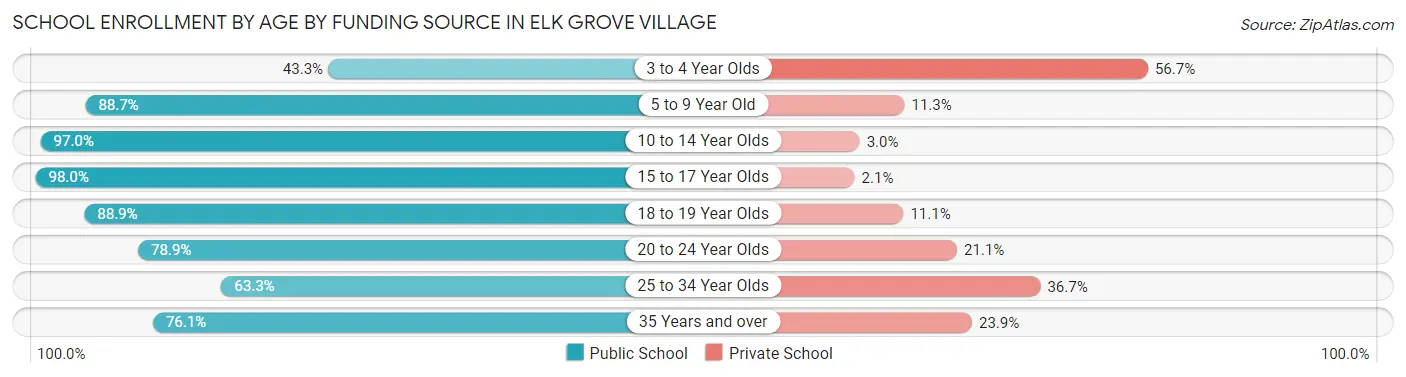
| Age Bracket | Public School | Private School |
| 3 to 4 Year Olds | 162 (43.3%) | 212 (56.7%) |
| 5 to 9 Year Old | 1,728 (88.7%) | 221 (11.3%) |
| 10 to 14 Year Olds | 2,142 (97.0%) | 66 (3.0%) |
| 15 to 17 Year Olds | 1,289 (98.0%) | 27 (2.1%) |
| 18 to 19 Year Olds | 734 (88.9%) | 92 (11.1%) |
| 20 to 24 Year Olds | 444 (78.9%) | 119 (21.1%) |
| 25 to 34 Year Olds | 235 (63.3%) | 136 (36.7%) |
| 35 Years and over | 226 (76.1%) | 71 (23.9%) |
| Total | 6,963 (88.1%) | 941 (11.9%) |
Educational Attainment by Field of Study in Elk Grove Village
Business (2,369 | 23.5%), education (1,465 | 14.5%), arts & humanities (742 | 7.3%), engineering (710 | 7.0%), and science & technology (691 | 6.8%) are the most common fields of study among 10,100 individuals in Elk Grove Village who have obtained a bachelor's degree or higher.
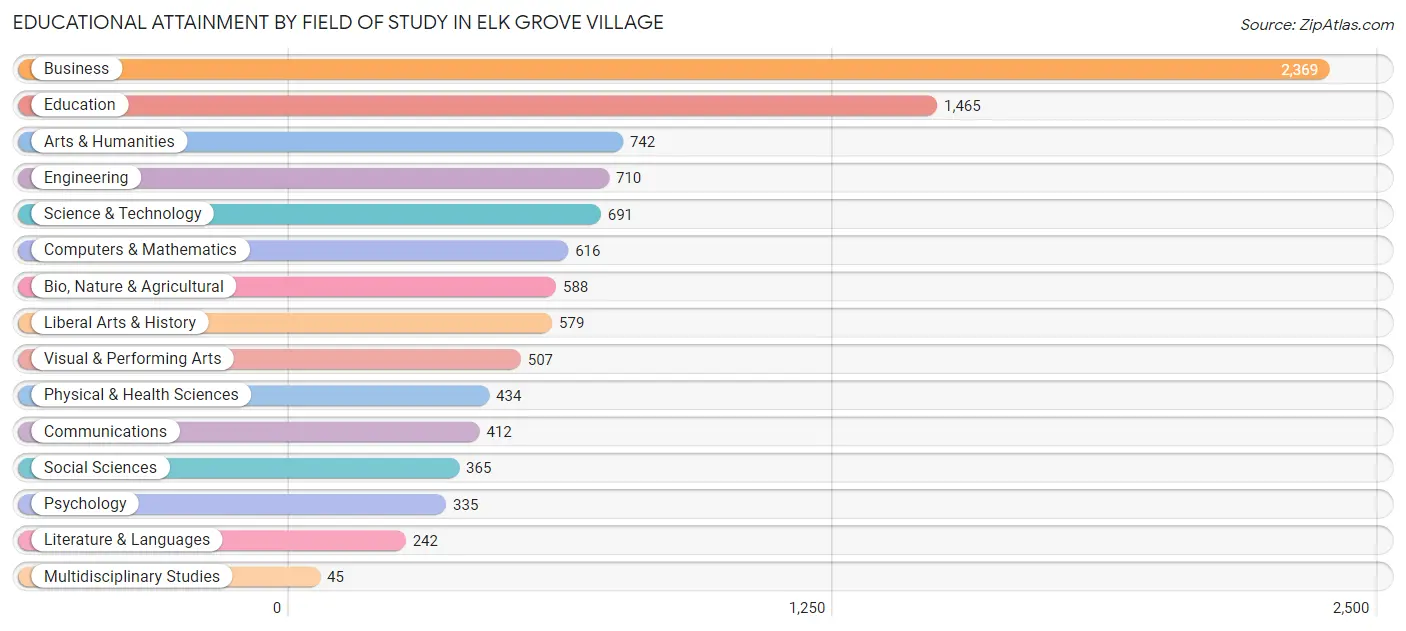
| Field of Study | # Graduates | % Graduates |
| Computers & Mathematics | 616 | 6.1% |
| Bio, Nature & Agricultural | 588 | 5.8% |
| Physical & Health Sciences | 434 | 4.3% |
| Psychology | 335 | 3.3% |
| Social Sciences | 365 | 3.6% |
| Engineering | 710 | 7.0% |
| Multidisciplinary Studies | 45 | 0.4% |
| Science & Technology | 691 | 6.8% |
| Business | 2,369 | 23.5% |
| Education | 1,465 | 14.5% |
| Literature & Languages | 242 | 2.4% |
| Liberal Arts & History | 579 | 5.7% |
| Visual & Performing Arts | 507 | 5.0% |
| Communications | 412 | 4.1% |
| Arts & Humanities | 742 | 7.3% |
| Total | 10,100 | 100.0% |
Transportation & Commute in Elk Grove Village
Vehicle Availability by Sex in Elk Grove Village
The most prevalent vehicle ownership categories in Elk Grove Village are males with 2 vehicles (4,184, accounting for 48.5%) and females with 2 vehicles (3,843, making up 49.9%).
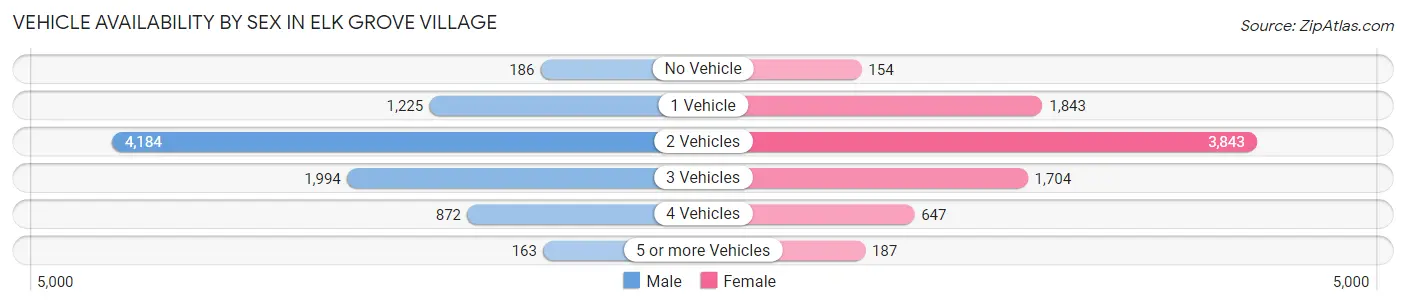
| Vehicles Available | Male | Female |
| No Vehicle | 186 (2.2%) | 154 (1.8%) |
| 1 Vehicle | 1,225 (14.2%) | 1,843 (22.0%) |
| 2 Vehicles | 4,184 (48.5%) | 3,843 (45.9%) |
| 3 Vehicles | 1,994 (23.1%) | 1,704 (20.3%) |
| 4 Vehicles | 872 (10.1%) | 647 (7.7%) |
| 5 or more Vehicles | 163 (1.9%) | 187 (2.2%) |
| Total | 8,624 (100.0%) | 8,378 (100.0%) |
Commute Time in Elk Grove Village
The most frequently occuring commute durations in Elk Grove Village are 10 to 14 minutes (2,284 commuters, 15.4%), 15 to 19 minutes (2,206 commuters, 14.9%), and 30 to 34 minutes (1,918 commuters, 12.9%).
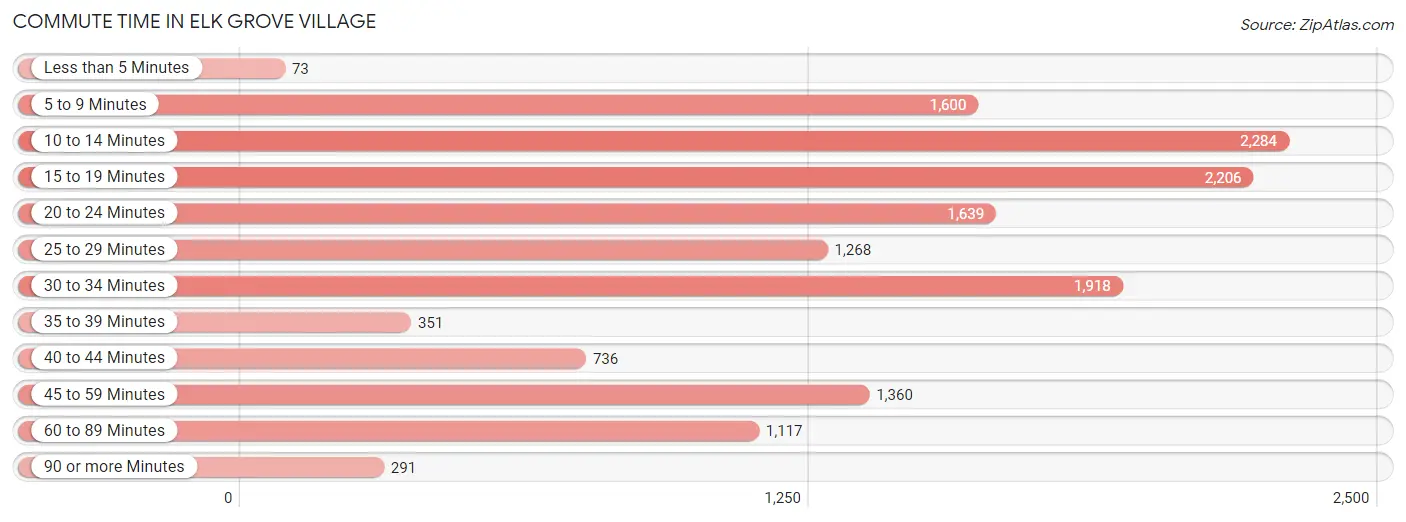
| Commute Time | # Commuters | % Commuters |
| Less than 5 Minutes | 73 | 0.5% |
| 5 to 9 Minutes | 1,600 | 10.8% |
| 10 to 14 Minutes | 2,284 | 15.4% |
| 15 to 19 Minutes | 2,206 | 14.9% |
| 20 to 24 Minutes | 1,639 | 11.0% |
| 25 to 29 Minutes | 1,268 | 8.5% |
| 30 to 34 Minutes | 1,918 | 12.9% |
| 35 to 39 Minutes | 351 | 2.4% |
| 40 to 44 Minutes | 736 | 5.0% |
| 45 to 59 Minutes | 1,360 | 9.2% |
| 60 to 89 Minutes | 1,117 | 7.5% |
| 90 or more Minutes | 291 | 2.0% |
Commute Time by Sex in Elk Grove Village
The most common commute times in Elk Grove Village are 30 to 34 minutes (1,089 commuters, 14.8%) for males and 15 to 19 minutes (1,286 commuters, 17.2%) for females.
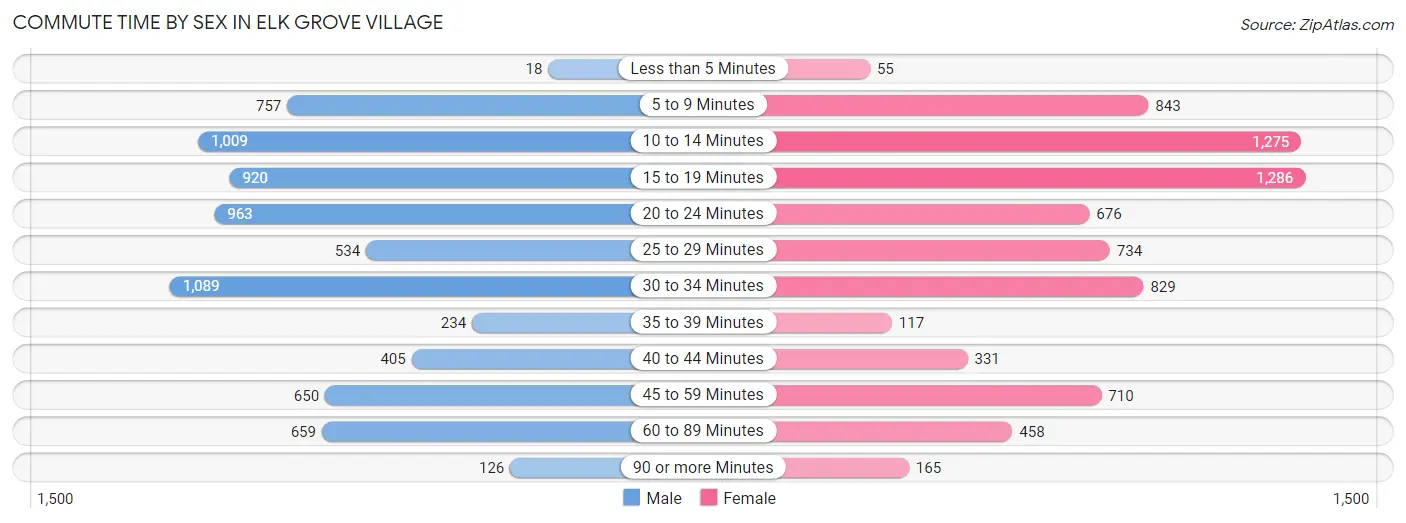
| Commute Time | Male | Female |
| Less than 5 Minutes | 18 (0.2%) | 55 (0.7%) |
| 5 to 9 Minutes | 757 (10.3%) | 843 (11.3%) |
| 10 to 14 Minutes | 1,009 (13.7%) | 1,275 (17.1%) |
| 15 to 19 Minutes | 920 (12.5%) | 1,286 (17.2%) |
| 20 to 24 Minutes | 963 (13.1%) | 676 (9.0%) |
| 25 to 29 Minutes | 534 (7.2%) | 734 (9.8%) |
| 30 to 34 Minutes | 1,089 (14.8%) | 829 (11.1%) |
| 35 to 39 Minutes | 234 (3.2%) | 117 (1.6%) |
| 40 to 44 Minutes | 405 (5.5%) | 331 (4.4%) |
| 45 to 59 Minutes | 650 (8.8%) | 710 (9.5%) |
| 60 to 89 Minutes | 659 (8.9%) | 458 (6.1%) |
| 90 or more Minutes | 126 (1.7%) | 165 (2.2%) |
Time of Departure to Work by Sex in Elk Grove Village
The most frequent times of departure to work in Elk Grove Village are 7:00 AM to 7:29 AM (997, 13.5%) for males and 7:30 AM to 7:59 AM (1,318, 17.6%) for females.
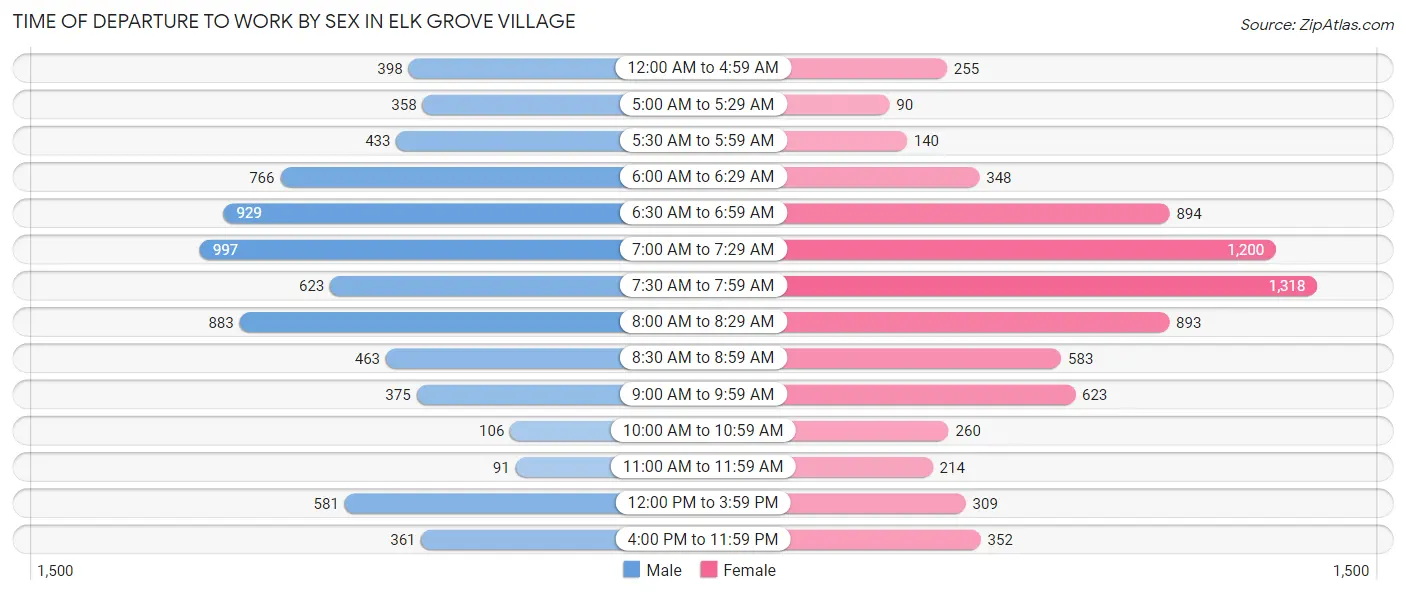
| Time of Departure | Male | Female |
| 12:00 AM to 4:59 AM | 398 (5.4%) | 255 (3.4%) |
| 5:00 AM to 5:29 AM | 358 (4.9%) | 90 (1.2%) |
| 5:30 AM to 5:59 AM | 433 (5.9%) | 140 (1.9%) |
| 6:00 AM to 6:29 AM | 766 (10.4%) | 348 (4.6%) |
| 6:30 AM to 6:59 AM | 929 (12.6%) | 894 (11.9%) |
| 7:00 AM to 7:29 AM | 997 (13.5%) | 1,200 (16.0%) |
| 7:30 AM to 7:59 AM | 623 (8.5%) | 1,318 (17.6%) |
| 8:00 AM to 8:29 AM | 883 (12.0%) | 893 (11.9%) |
| 8:30 AM to 8:59 AM | 463 (6.3%) | 583 (7.8%) |
| 9:00 AM to 9:59 AM | 375 (5.1%) | 623 (8.3%) |
| 10:00 AM to 10:59 AM | 106 (1.4%) | 260 (3.5%) |
| 11:00 AM to 11:59 AM | 91 (1.2%) | 214 (2.9%) |
| 12:00 PM to 3:59 PM | 581 (7.9%) | 309 (4.1%) |
| 4:00 PM to 11:59 PM | 361 (4.9%) | 352 (4.7%) |
| Total | 7,364 (100.0%) | 7,479 (100.0%) |
Housing Occupancy in Elk Grove Village
Occupancy by Ownership in Elk Grove Village
Of the total 12,691 dwellings in Elk Grove Village, owner-occupied units account for 9,474 (74.7%), while renter-occupied units make up 3,217 (25.4%).
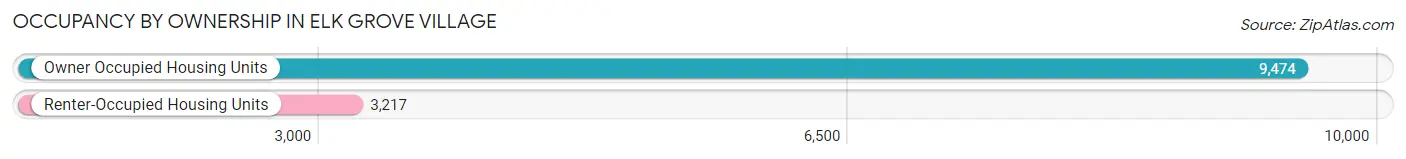
| Occupancy | # Housing Units | % Housing Units |
| Owner Occupied Housing Units | 9,474 | 74.7% |
| Renter-Occupied Housing Units | 3,217 | 25.4% |
| Total Occupied Housing Units | 12,691 | 100.0% |
Occupancy by Household Size in Elk Grove Village
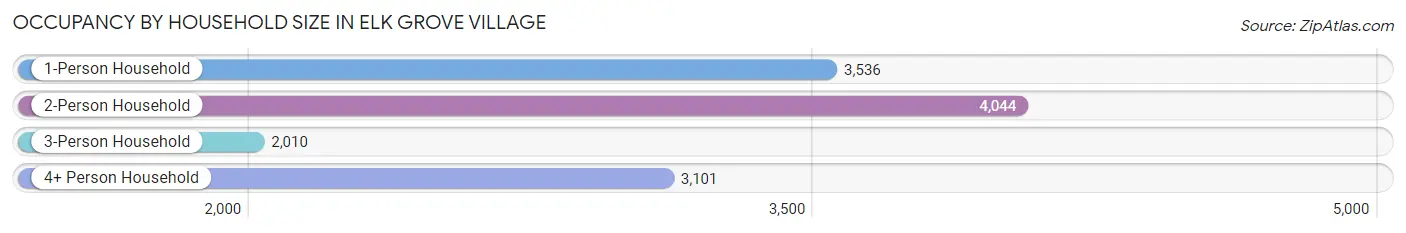
| Household Size | # Housing Units | % Housing Units |
| 1-Person Household | 3,536 | 27.9% |
| 2-Person Household | 4,044 | 31.9% |
| 3-Person Household | 2,010 | 15.8% |
| 4+ Person Household | 3,101 | 24.4% |
| Total Housing Units | 12,691 | 100.0% |
Occupancy by Ownership by Household Size in Elk Grove Village
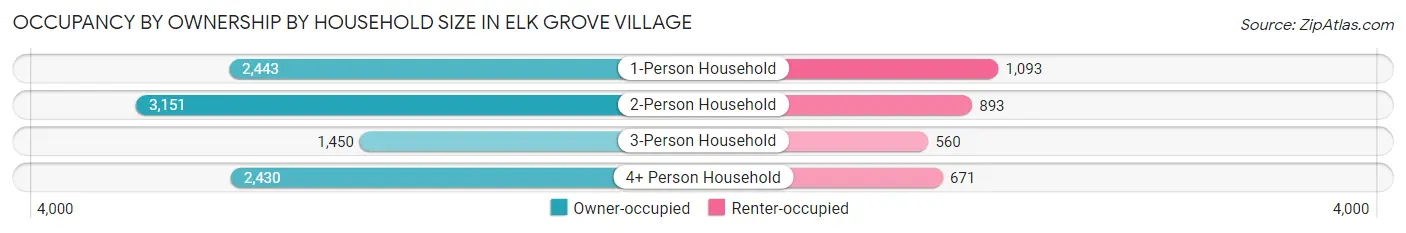
| Household Size | Owner-occupied | Renter-occupied |
| 1-Person Household | 2,443 (69.1%) | 1,093 (30.9%) |
| 2-Person Household | 3,151 (77.9%) | 893 (22.1%) |
| 3-Person Household | 1,450 (72.1%) | 560 (27.9%) |
| 4+ Person Household | 2,430 (78.4%) | 671 (21.6%) |
| Total Housing Units | 9,474 (74.7%) | 3,217 (25.4%) |
Occupancy by Educational Attainment in Elk Grove Village
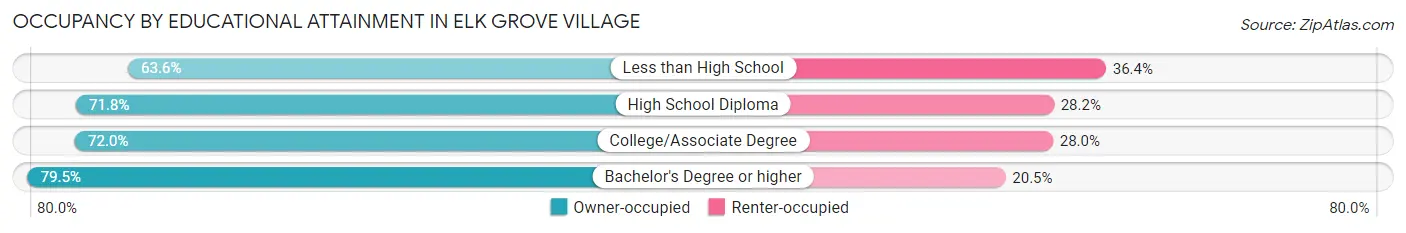
| Household Size | Owner-occupied | Renter-occupied |
| Less than High School | 384 (63.6%) | 220 (36.4%) |
| High School Diploma | 1,893 (71.8%) | 742 (28.2%) |
| College/Associate Degree | 3,044 (72.0%) | 1,185 (28.0%) |
| Bachelor's Degree or higher | 4,153 (79.5%) | 1,070 (20.5%) |
Occupancy by Age of Householder in Elk Grove Village
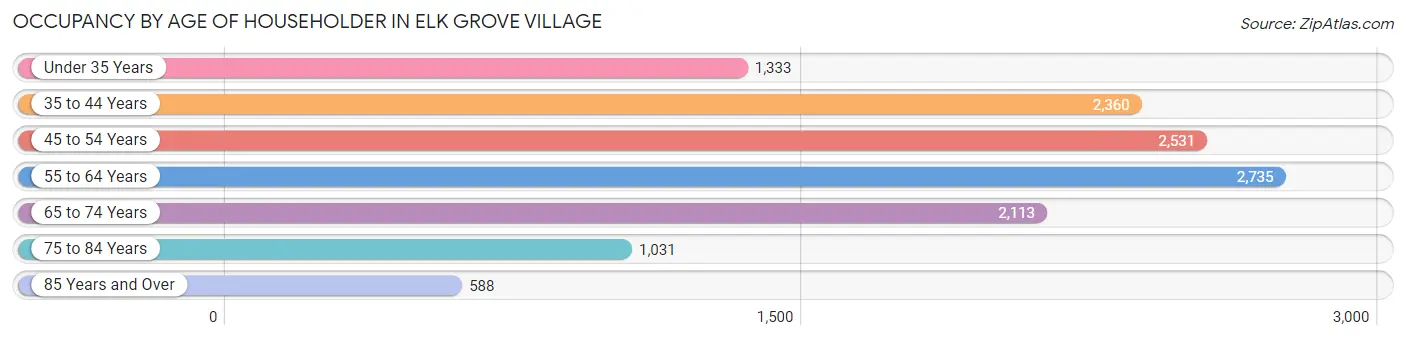
| Age Bracket | # Households | % Households |
| Under 35 Years | 1,333 | 10.5% |
| 35 to 44 Years | 2,360 | 18.6% |
| 45 to 54 Years | 2,531 | 19.9% |
| 55 to 64 Years | 2,735 | 21.5% |
| 65 to 74 Years | 2,113 | 16.7% |
| 75 to 84 Years | 1,031 | 8.1% |
| 85 Years and Over | 588 | 4.6% |
| Total | 12,691 | 100.0% |
Housing Finances in Elk Grove Village
Median Income by Occupancy in Elk Grove Village
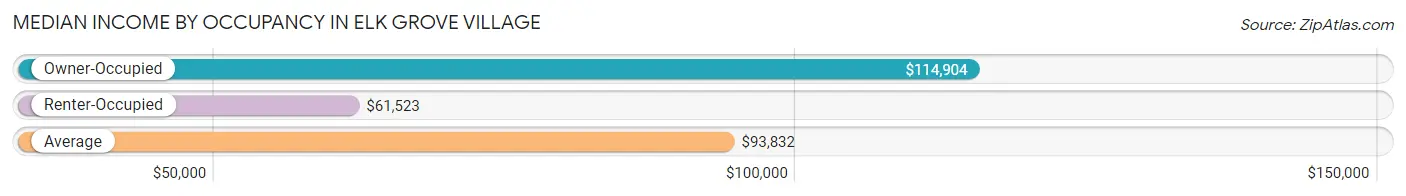
| Occupancy Type | # Households | Median Income |
| Owner-Occupied | 9,474 (74.7%) | $114,904 |
| Renter-Occupied | 3,217 (25.4%) | $61,523 |
| Average | 12,691 (100.0%) | $93,832 |
Occupancy by Householder Income Bracket in Elk Grove Village
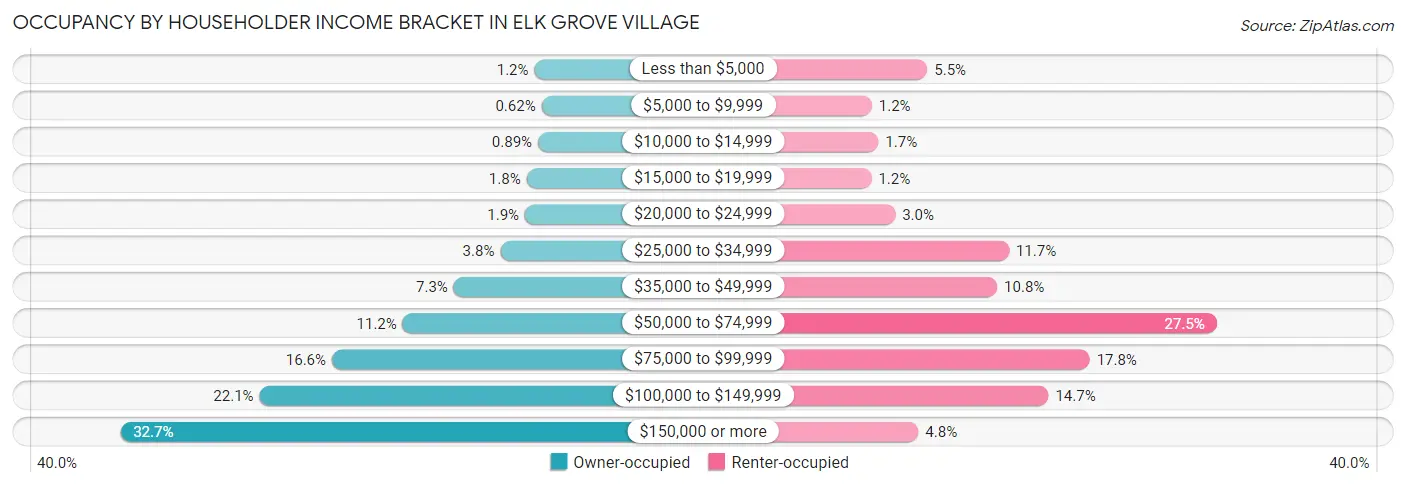
| Income Bracket | Owner-occupied | Renter-occupied |
| Less than $5,000 | 110 (1.2%) | 176 (5.5%) |
| $5,000 to $9,999 | 59 (0.6%) | 40 (1.2%) |
| $10,000 to $14,999 | 84 (0.9%) | 56 (1.7%) |
| $15,000 to $19,999 | 167 (1.8%) | 39 (1.2%) |
| $20,000 to $24,999 | 178 (1.9%) | 97 (3.0%) |
| $25,000 to $34,999 | 356 (3.8%) | 376 (11.7%) |
| $35,000 to $49,999 | 693 (7.3%) | 347 (10.8%) |
| $50,000 to $74,999 | 1,061 (11.2%) | 885 (27.5%) |
| $75,000 to $99,999 | 1,572 (16.6%) | 574 (17.8%) |
| $100,000 to $149,999 | 2,095 (22.1%) | 473 (14.7%) |
| $150,000 or more | 3,099 (32.7%) | 154 (4.8%) |
| Total | 9,474 (100.0%) | 3,217 (100.0%) |
Monthly Housing Cost Tiers in Elk Grove Village
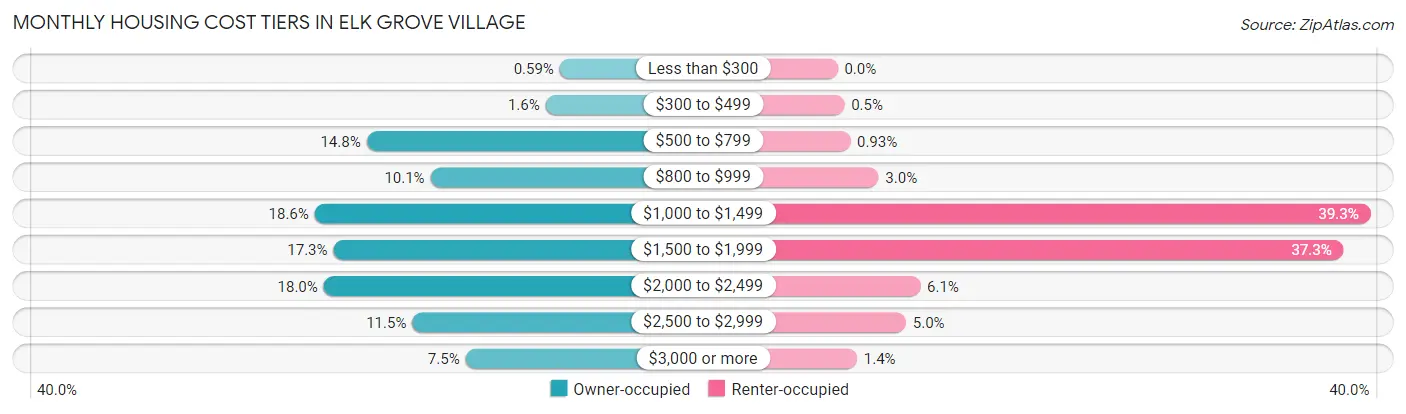
| Monthly Cost | Owner-occupied | Renter-occupied |
| Less than $300 | 56 (0.6%) | 0 (0.0%) |
| $300 to $499 | 154 (1.6%) | 16 (0.5%) |
| $500 to $799 | 1,404 (14.8%) | 30 (0.9%) |
| $800 to $999 | 958 (10.1%) | 97 (3.0%) |
| $1,000 to $1,499 | 1,766 (18.6%) | 1,263 (39.3%) |
| $1,500 to $1,999 | 1,635 (17.3%) | 1,199 (37.3%) |
| $2,000 to $2,499 | 1,703 (18.0%) | 196 (6.1%) |
| $2,500 to $2,999 | 1,085 (11.5%) | 162 (5.0%) |
| $3,000 or more | 713 (7.5%) | 46 (1.4%) |
| Total | 9,474 (100.0%) | 3,217 (100.0%) |
Physical Housing Characteristics in Elk Grove Village
Housing Structures in Elk Grove Village
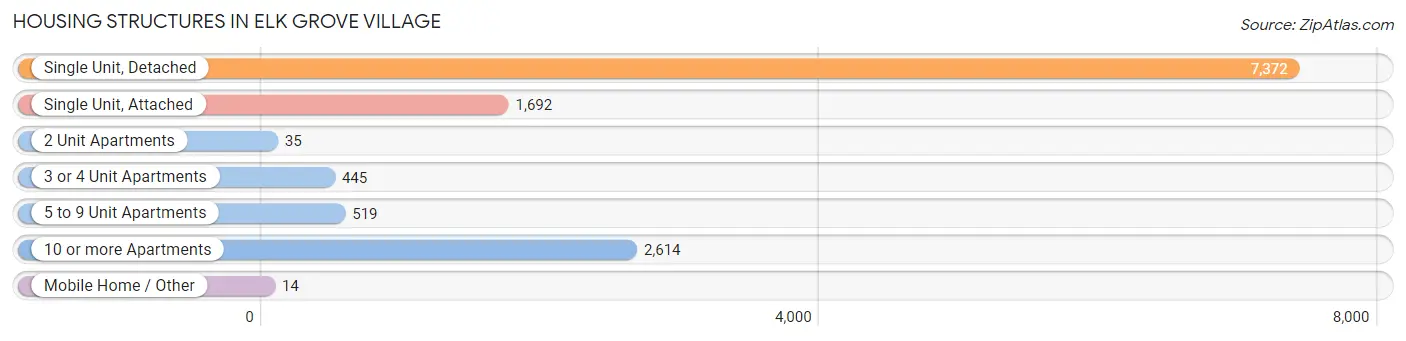
| Structure Type | # Housing Units | % Housing Units |
| Single Unit, Detached | 7,372 | 58.1% |
| Single Unit, Attached | 1,692 | 13.3% |
| 2 Unit Apartments | 35 | 0.3% |
| 3 or 4 Unit Apartments | 445 | 3.5% |
| 5 to 9 Unit Apartments | 519 | 4.1% |
| 10 or more Apartments | 2,614 | 20.6% |
| Mobile Home / Other | 14 | 0.1% |
| Total | 12,691 | 100.0% |
Housing Structures by Occupancy in Elk Grove Village
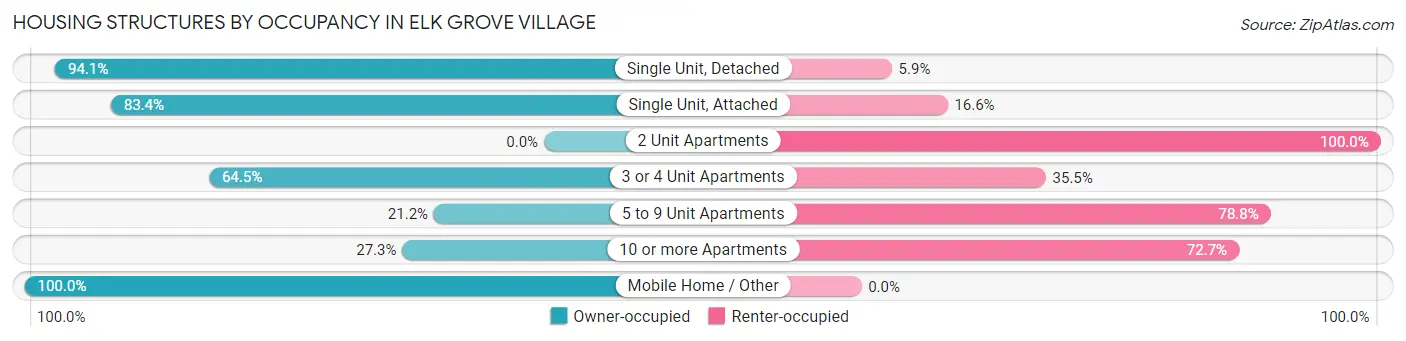
| Structure Type | Owner-occupied | Renter-occupied |
| Single Unit, Detached | 6,939 (94.1%) | 433 (5.9%) |
| Single Unit, Attached | 1,411 (83.4%) | 281 (16.6%) |
| 2 Unit Apartments | 0 (0.0%) | 35 (100.0%) |
| 3 or 4 Unit Apartments | 287 (64.5%) | 158 (35.5%) |
| 5 to 9 Unit Apartments | 110 (21.2%) | 409 (78.8%) |
| 10 or more Apartments | 713 (27.3%) | 1,901 (72.7%) |
| Mobile Home / Other | 14 (100.0%) | 0 (0.0%) |
| Total | 9,474 (74.7%) | 3,217 (25.4%) |
Housing Structures by Number of Rooms in Elk Grove Village
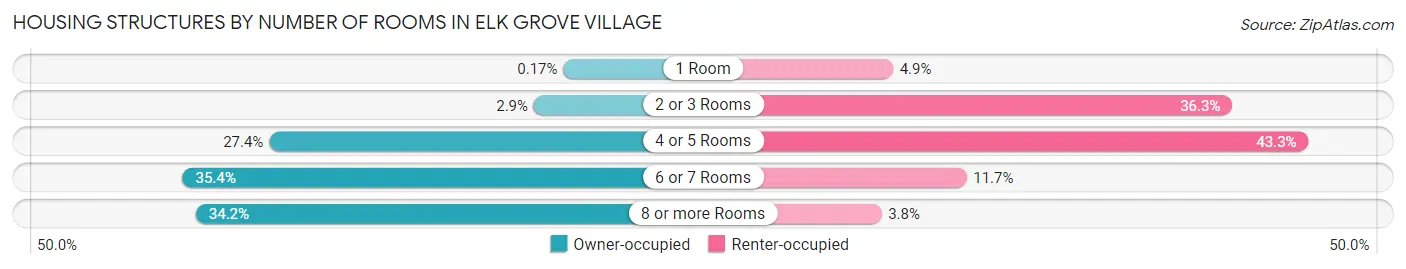
| Number of Rooms | Owner-occupied | Renter-occupied |
| 1 Room | 16 (0.2%) | 157 (4.9%) |
| 2 or 3 Rooms | 275 (2.9%) | 1,167 (36.3%) |
| 4 or 5 Rooms | 2,594 (27.4%) | 1,394 (43.3%) |
| 6 or 7 Rooms | 3,353 (35.4%) | 376 (11.7%) |
| 8 or more Rooms | 3,236 (34.2%) | 123 (3.8%) |
| Total | 9,474 (100.0%) | 3,217 (100.0%) |
Housing Structure by Heating Type in Elk Grove Village
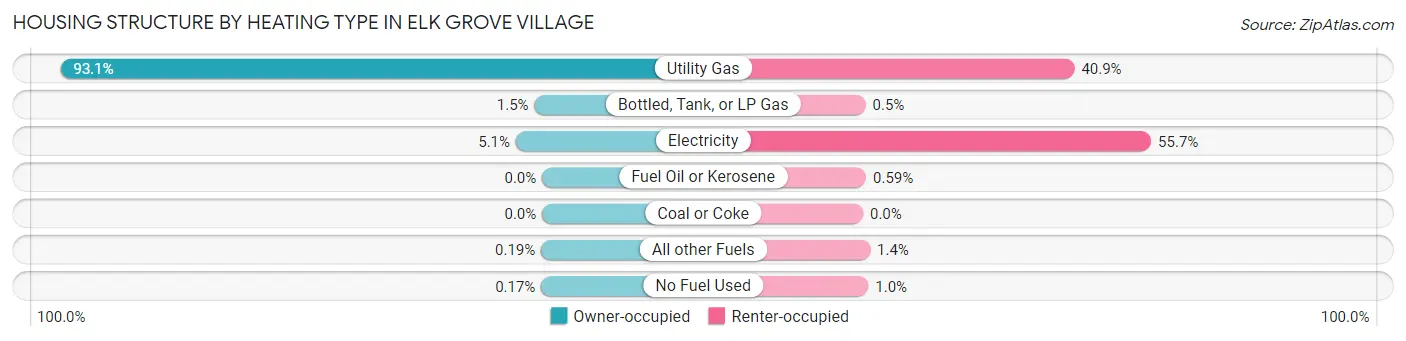
| Heating Type | Owner-occupied | Renter-occupied |
| Utility Gas | 8,819 (93.1%) | 1,314 (40.8%) |
| Bottled, Tank, or LP Gas | 141 (1.5%) | 16 (0.5%) |
| Electricity | 480 (5.1%) | 1,791 (55.7%) |
| Fuel Oil or Kerosene | 0 (0.0%) | 19 (0.6%) |
| Coal or Coke | 0 (0.0%) | 0 (0.0%) |
| All other Fuels | 18 (0.2%) | 44 (1.4%) |
| No Fuel Used | 16 (0.2%) | 33 (1.0%) |
| Total | 9,474 (100.0%) | 3,217 (100.0%) |
Household Vehicle Usage in Elk Grove Village
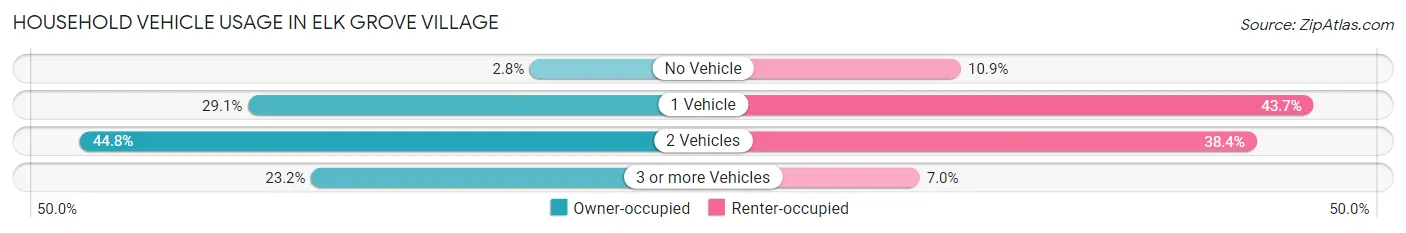
| Vehicles per Household | Owner-occupied | Renter-occupied |
| No Vehicle | 266 (2.8%) | 349 (10.8%) |
| 1 Vehicle | 2,760 (29.1%) | 1,407 (43.7%) |
| 2 Vehicles | 4,247 (44.8%) | 1,236 (38.4%) |
| 3 or more Vehicles | 2,201 (23.2%) | 225 (7.0%) |
| Total | 9,474 (100.0%) | 3,217 (100.0%) |
Real Estate & Mortgages in Elk Grove Village
Real Estate and Mortgage Overview in Elk Grove Village
| Characteristic | Without Mortgage | With Mortgage |
| Housing Units | 3,477 | 5,997 |
| Median Property Value | $322,200 | $325,800 |
| Median Household Income | $88,750 | $2,306 |
| Monthly Housing Costs | $843 | $713 |
| Real Estate Taxes | $6,237 | $32 |
Property Value by Mortgage Status in Elk Grove Village
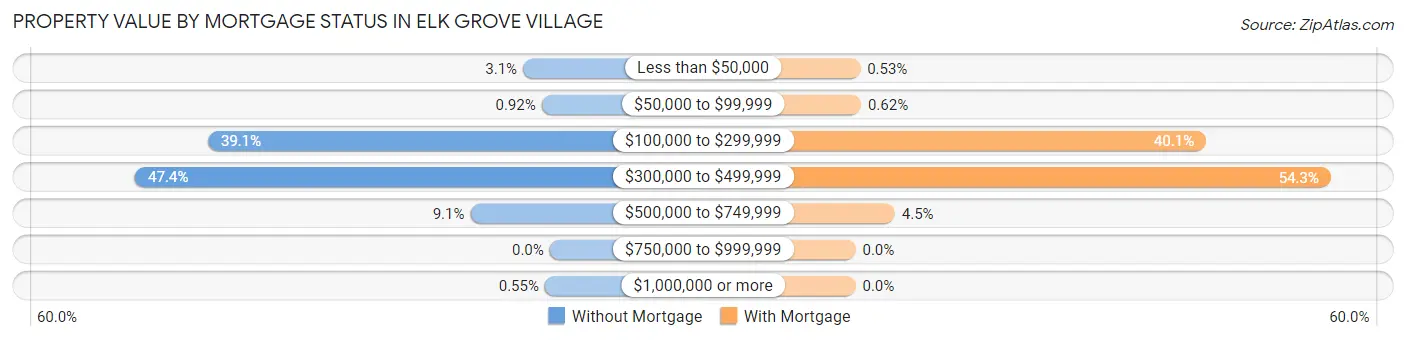
| Property Value | Without Mortgage | With Mortgage |
| Less than $50,000 | 106 (3.0%) | 32 (0.5%) |
| $50,000 to $99,999 | 32 (0.9%) | 37 (0.6%) |
| $100,000 to $299,999 | 1,358 (39.1%) | 2,402 (40.1%) |
| $300,000 to $499,999 | 1,647 (47.4%) | 3,257 (54.3%) |
| $500,000 to $749,999 | 315 (9.1%) | 269 (4.5%) |
| $750,000 to $999,999 | 0 (0.0%) | 0 (0.0%) |
| $1,000,000 or more | 19 (0.5%) | 0 (0.0%) |
| Total | 3,477 (100.0%) | 5,997 (100.0%) |
Household Income by Mortgage Status in Elk Grove Village
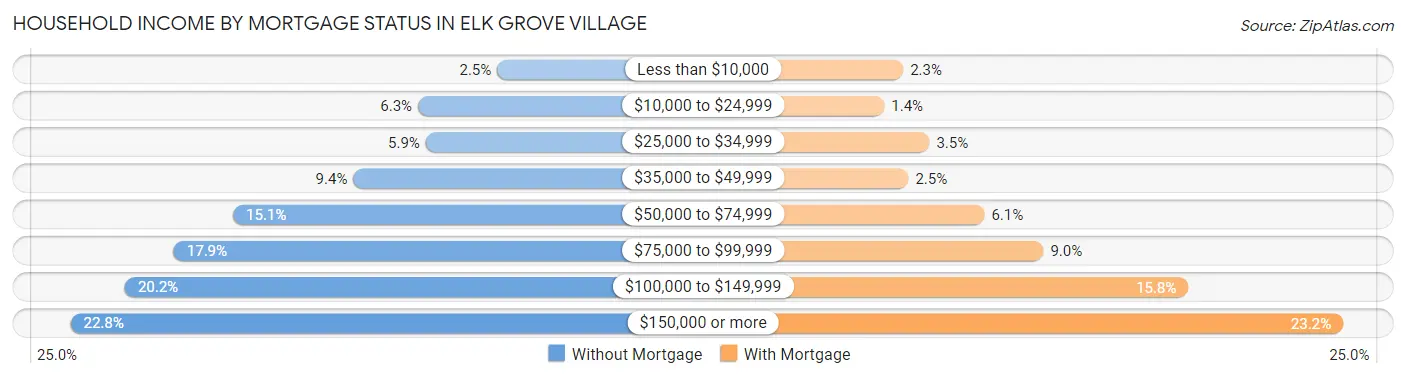
| Household Income | Without Mortgage | With Mortgage |
| Less than $10,000 | 87 (2.5%) | 136 (2.3%) |
| $10,000 to $24,999 | 218 (6.3%) | 82 (1.4%) |
| $25,000 to $34,999 | 205 (5.9%) | 211 (3.5%) |
| $35,000 to $49,999 | 325 (9.3%) | 151 (2.5%) |
| $50,000 to $74,999 | 524 (15.1%) | 368 (6.1%) |
| $75,000 to $99,999 | 622 (17.9%) | 537 (8.9%) |
| $100,000 to $149,999 | 703 (20.2%) | 950 (15.8%) |
| $150,000 or more | 793 (22.8%) | 1,392 (23.2%) |
| Total | 3,477 (100.0%) | 5,997 (100.0%) |
Property Value to Household Income Ratio in Elk Grove Village
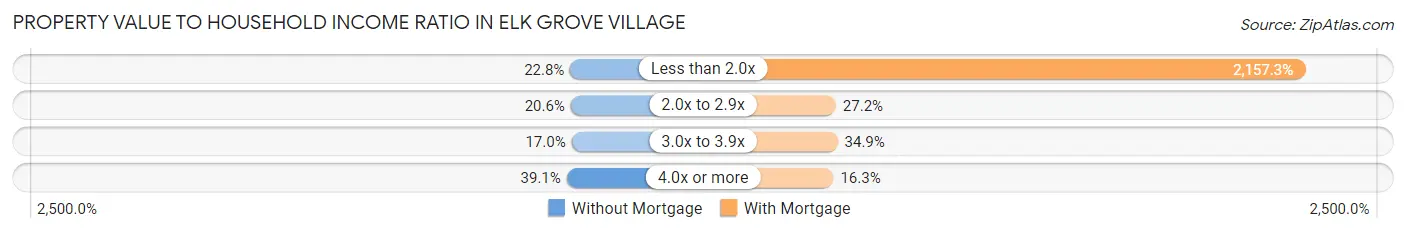
| Value-to-Income Ratio | Without Mortgage | With Mortgage |
| Less than 2.0x | 793 (22.8%) | 129,375 (2,157.3%) |
| 2.0x to 2.9x | 716 (20.6%) | 1,629 (27.2%) |
| 3.0x to 3.9x | 591 (17.0%) | 2,092 (34.9%) |
| 4.0x or more | 1,359 (39.1%) | 978 (16.3%) |
| Total | 3,477 (100.0%) | 5,997 (100.0%) |
Real Estate Taxes by Mortgage Status in Elk Grove Village

| Property Taxes | Without Mortgage | With Mortgage |
| Less than $800 | 23 (0.7%) | 16 (0.3%) |
| $800 to $1,499 | 94 (2.7%) | 13 (0.2%) |
| $800 to $1,499 | 3,287 (94.5%) | 159 (2.6%) |
| Total | 3,477 (100.0%) | 5,997 (100.0%) |
Health & Disability in Elk Grove Village
Health Insurance Coverage by Age in Elk Grove Village
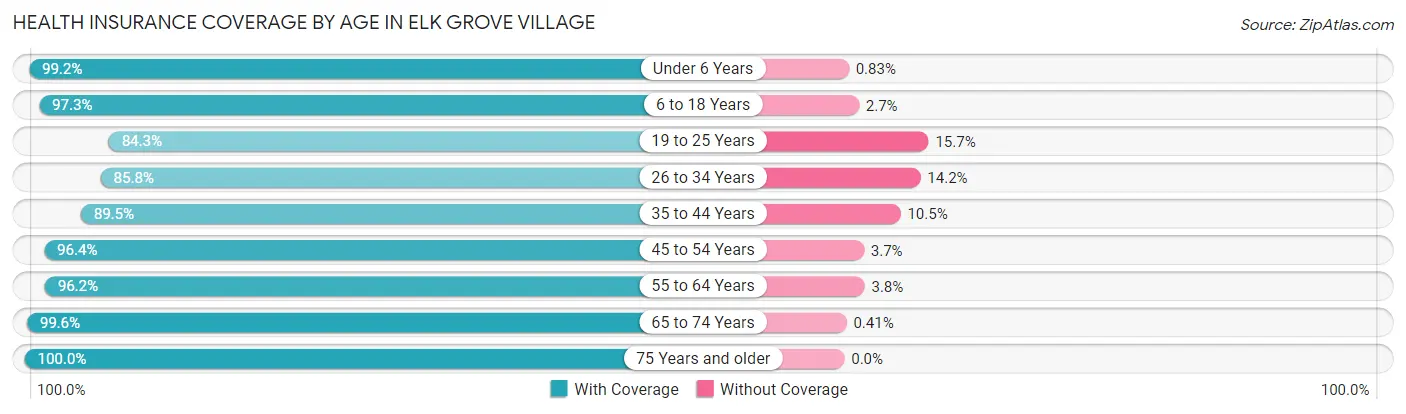
| Age Bracket | With Coverage | Without Coverage |
| Under 6 Years | 2,034 (99.2%) | 17 (0.8%) |
| 6 to 18 Years | 5,468 (97.3%) | 153 (2.7%) |
| 19 to 25 Years | 1,638 (84.3%) | 305 (15.7%) |
| 26 to 34 Years | 2,540 (85.8%) | 420 (14.2%) |
| 35 to 44 Years | 4,218 (89.5%) | 494 (10.5%) |
| 45 to 54 Years | 4,355 (96.4%) | 165 (3.6%) |
| 55 to 64 Years | 4,659 (96.2%) | 183 (3.8%) |
| 65 to 74 Years | 3,139 (99.6%) | 13 (0.4%) |
| 75 Years and older | 2,492 (100.0%) | 0 (0.0%) |
| Total | 30,543 (94.6%) | 1,750 (5.4%) |
Health Insurance Coverage by Citizenship Status in Elk Grove Village

| Citizenship Status | With Coverage | Without Coverage |
| Native Born | 2,034 (99.2%) | 17 (0.8%) |
| Foreign Born, Citizen | 5,468 (97.3%) | 153 (2.7%) |
| Foreign Born, not a Citizen | 1,638 (84.3%) | 305 (15.7%) |
Health Insurance Coverage by Household Income in Elk Grove Village

| Household Income | With Coverage | Without Coverage |
| Under $25,000 | 1,850 (97.8%) | 42 (2.2%) |
| $25,000 to $49,999 | 2,785 (93.4%) | 198 (6.6%) |
| $50,000 to $74,999 | 3,861 (93.9%) | 252 (6.1%) |
| $75,000 to $99,999 | 4,767 (91.7%) | 433 (8.3%) |
| $100,000 and over | 17,243 (95.4%) | 823 (4.6%) |
Public vs Private Health Insurance Coverage by Age in Elk Grove Village
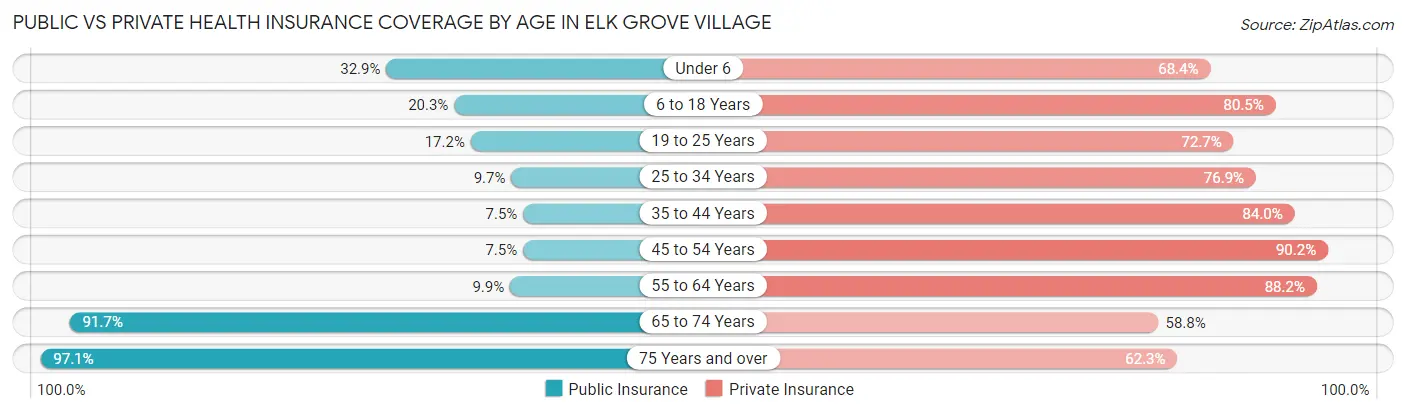
| Age Bracket | Public Insurance | Private Insurance |
| Under 6 | 674 (32.9%) | 1,403 (68.4%) |
| 6 to 18 Years | 1,139 (20.3%) | 4,526 (80.5%) |
| 19 to 25 Years | 334 (17.2%) | 1,413 (72.7%) |
| 25 to 34 Years | 286 (9.7%) | 2,275 (76.9%) |
| 35 to 44 Years | 351 (7.4%) | 3,960 (84.0%) |
| 45 to 54 Years | 338 (7.5%) | 4,079 (90.2%) |
| 55 to 64 Years | 479 (9.9%) | 4,268 (88.1%) |
| 65 to 74 Years | 2,889 (91.7%) | 1,853 (58.8%) |
| 75 Years and over | 2,419 (97.1%) | 1,552 (62.3%) |
| Total | 8,909 (27.6%) | 25,329 (78.4%) |
Disability Status by Sex by Age in Elk Grove Village
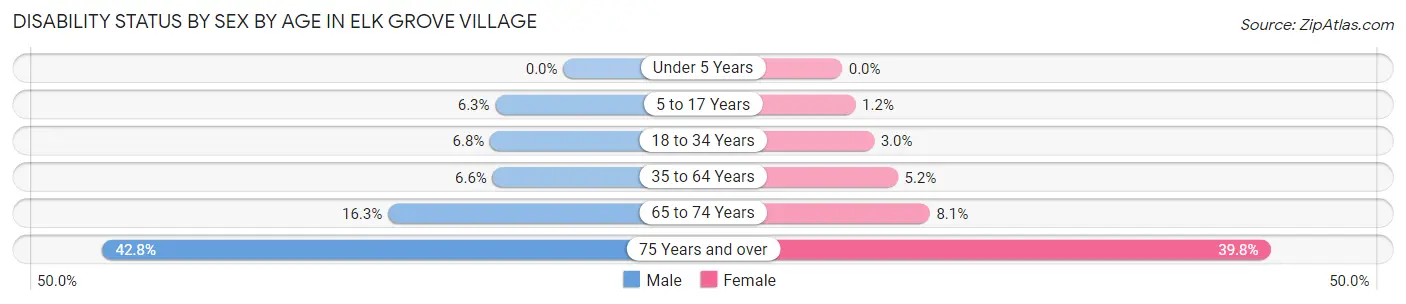
| Age Bracket | Male | Female |
| Under 5 Years | 0 (0.0%) | 0 (0.0%) |
| 5 to 17 Years | 170 (6.3%) | 35 (1.2%) |
| 18 to 34 Years | 192 (6.8%) | 75 (3.0%) |
| 35 to 64 Years | 442 (6.6%) | 379 (5.2%) |
| 65 to 74 Years | 235 (16.3%) | 139 (8.1%) |
| 75 Years and over | 384 (42.8%) | 634 (39.8%) |
Disability Class by Sex by Age in Elk Grove Village
Disability Class: Hearing Difficulty
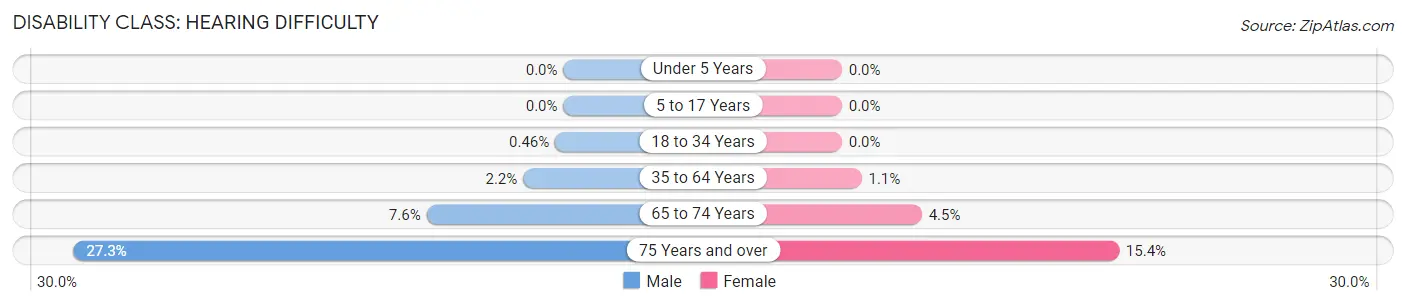
| Age Bracket | Male | Female |
| Under 5 Years | 0 (0.0%) | 0 (0.0%) |
| 5 to 17 Years | 0 (0.0%) | 0 (0.0%) |
| 18 to 34 Years | 13 (0.5%) | 0 (0.0%) |
| 35 to 64 Years | 151 (2.2%) | 81 (1.1%) |
| 65 to 74 Years | 110 (7.6%) | 76 (4.4%) |
| 75 Years and over | 245 (27.3%) | 246 (15.4%) |
Disability Class: Vision Difficulty
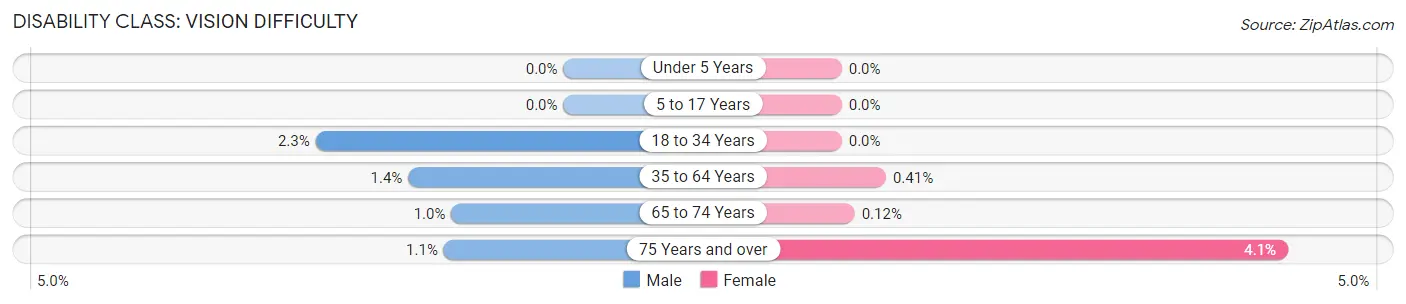
| Age Bracket | Male | Female |
| Under 5 Years | 0 (0.0%) | 0 (0.0%) |
| 5 to 17 Years | 0 (0.0%) | 0 (0.0%) |
| 18 to 34 Years | 65 (2.3%) | 0 (0.0%) |
| 35 to 64 Years | 97 (1.4%) | 30 (0.4%) |
| 65 to 74 Years | 15 (1.0%) | 2 (0.1%) |
| 75 Years and over | 10 (1.1%) | 66 (4.1%) |
Disability Class: Cognitive Difficulty

| Age Bracket | Male | Female |
| 5 to 17 Years | 146 (5.4%) | 35 (1.2%) |
| 18 to 34 Years | 109 (3.9%) | 75 (3.0%) |
| 35 to 64 Years | 139 (2.1%) | 83 (1.1%) |
| 65 to 74 Years | 31 (2.1%) | 33 (1.9%) |
| 75 Years and over | 90 (10.0%) | 73 (4.6%) |
Disability Class: Ambulatory Difficulty
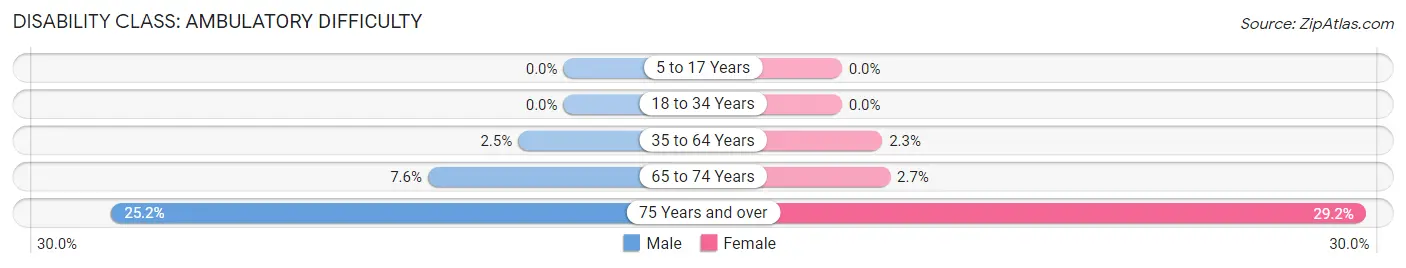
| Age Bracket | Male | Female |
| 5 to 17 Years | 0 (0.0%) | 0 (0.0%) |
| 18 to 34 Years | 0 (0.0%) | 0 (0.0%) |
| 35 to 64 Years | 170 (2.5%) | 165 (2.2%) |
| 65 to 74 Years | 109 (7.5%) | 46 (2.7%) |
| 75 Years and over | 226 (25.2%) | 465 (29.2%) |
Disability Class: Self-Care Difficulty
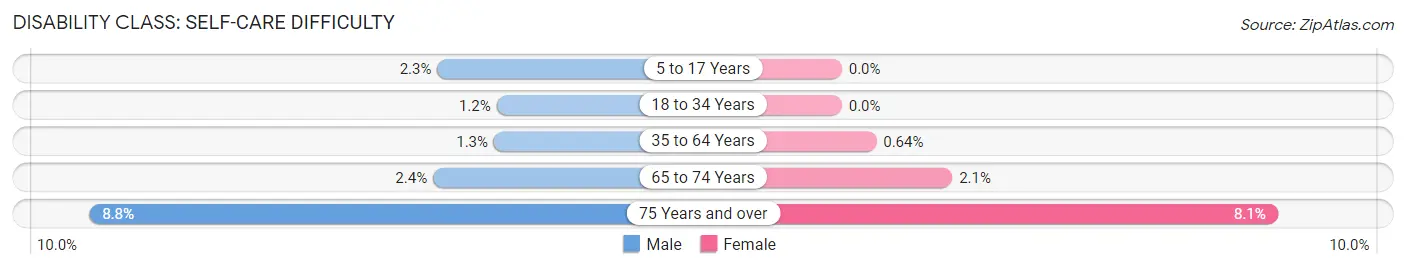
| Age Bracket | Male | Female |
| 5 to 17 Years | 63 (2.3%) | 0 (0.0%) |
| 18 to 34 Years | 35 (1.2%) | 0 (0.0%) |
| 35 to 64 Years | 87 (1.3%) | 47 (0.6%) |
| 65 to 74 Years | 35 (2.4%) | 35 (2.1%) |
| 75 Years and over | 79 (8.8%) | 129 (8.1%) |
Technology Access in Elk Grove Village
Computing Device Access in Elk Grove Village
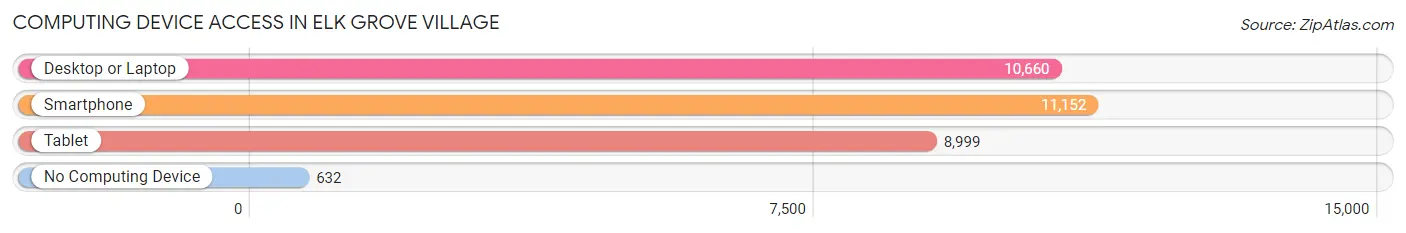
| Device Type | # Households | % Households |
| Desktop or Laptop | 10,660 | 84.0% |
| Smartphone | 11,152 | 87.9% |
| Tablet | 8,999 | 70.9% |
| No Computing Device | 632 | 5.0% |
| Total | 12,691 | 100.0% |
Internet Access in Elk Grove Village
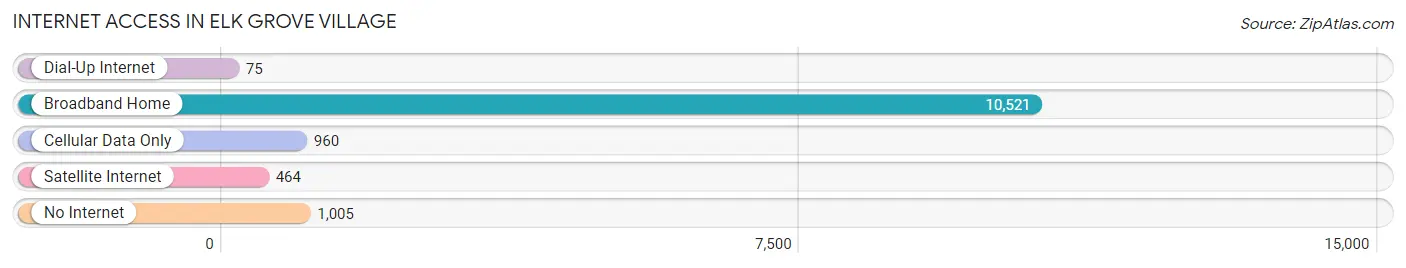
| Internet Type | # Households | % Households |
| Dial-Up Internet | 75 | 0.6% |
| Broadband Home | 10,521 | 82.9% |
| Cellular Data Only | 960 | 7.6% |
| Satellite Internet | 464 | 3.7% |
| No Internet | 1,005 | 7.9% |
| Total | 12,691 | 100.0% |
Elk Grove Village Summary
Elk Grove Village is a village located in Cook and DuPage counties in the state of Illinois. It is a northwest suburb of Chicago and is located approximately 25 miles from the city. The village has a population of 33,127 as of the 2010 census.
Geography
Elk Grove Village is located at 42°00′N 87°59′W (42.00, -87.99). It is situated in the northwest corner of Cook County and the northeast corner of DuPage County. The village is bordered by the city of Chicago to the east, the village of Schaumburg to the north, the village of Mount Prospect to the west, and the village of Arlington Heights to the south. The village is located in the Chicago metropolitan area and is part of the Golden Corridor.
The village is situated on a flat plain, with an elevation of 690 feet above sea level. The village is located in the Fox River watershed. The main waterway is the Elk Grove Creek, which flows through the village from east to west.
Climate
Elk Grove Village has a humid continental climate, with hot, humid summers and cold, snowy winters. The average annual temperature is 48°F, with an average high of 68°F in July and an average low of 28°F in January. The average annual precipitation is 36.5 inches, with an average of 4.5 inches of snowfall per year.
Demographics
As of the 2010 census, there were 33,127 people, 11,945 households, and 8,845 families residing in the village. The population density was 4,845.3 people per square mile. The racial makeup of the village was 79.2% White, 4.2% African American, 0.3% Native American, 8.7% Asian, 0.1% Pacific Islander, 4.7% from other races, and 2.9% from two or more races. Hispanic or Latino of any race were 11.7% of the population.
The median age in the village was 38.2 years. 22.7% of residents were under the age of 18; 8.2% were between the ages of 18 and 24; 28.2% were from 25 to 44; 28.2% were from 45 to 64; and 12.7% were 65 years of age or older. The gender makeup of the village was 48.7% male and 51.3% female.
Economy
Elk Grove Village is home to a variety of businesses, including manufacturing, retail, and service industries. The village is home to the largest industrial park in the United States, the Elk Grove Technology Park. The park is home to over 3,000 businesses, including Motorola, AT&T, and United Airlines.
The village is also home to the headquarters of the American Academy of Pediatrics, the American Osteopathic Association, and the American Veterinary Medical Association. The village is also home to the headquarters of the National Association of Realtors.
The village has a total area of 10.3 square miles, of which 9.9 square miles is land and 0.4 square miles is water. The village has a total assessed value of $3.3 billion. The median household income in the village is $76,845.
Conclusion
Elk Grove Village is a village located in Cook and DuPage counties in the state of Illinois. It is a northwest suburb of Chicago and is located approximately 25 miles from the city. The village has a population of 33,127 as of the 2010 census. It is situated on a flat plain, with an elevation of 690 feet above sea level. The village has a humid continental climate, with hot, humid summers and cold, snowy winters. The racial makeup of the village was 79.2% White, 4.2% African American, 0.3% Native American, 8.7% Asian, 0.1% Pacific Islander, 4.7% from other races, and 2.9% from two or more races. The median household income in the village is $76,845. Elk Grove Village is home to a variety of businesses, including manufacturing, retail, and service industries. The village is home to the largest industrial park in the United States, the Elk Grove Technology Park.
Common Questions
What is Per Capita Income in Elk Grove Village?
Per Capita income in Elk Grove Village is $44,953.
What is the Median Family Income in Elk Grove Village?
Median Family Income in Elk Grove Village is $117,294.
What is the Median Household income in Elk Grove Village?
Median Household Income in Elk Grove Village is $93,832.
What is Income or Wage Gap in Elk Grove Village?
Income or Wage Gap in Elk Grove Village is 23.7%.
Women in Elk Grove Village earn 76.3 cents for every dollar earned by a man.
What is Inequality or Gini Index in Elk Grove Village?
Inequality or Gini Index in Elk Grove Village is 0.39.
What is the Total Population of Elk Grove Village?
Total Population of Elk Grove Village is 32,498.
What is the Total Male Population of Elk Grove Village?
Total Male Population of Elk Grove Village is 15,573.
What is the Total Female Population of Elk Grove Village?
Total Female Population of Elk Grove Village is 16,925.
What is the Ratio of Males per 100 Females in Elk Grove Village?
There are 92.01 Males per 100 Females in Elk Grove Village.
What is the Ratio of Females per 100 Males in Elk Grove Village?
There are 108.68 Females per 100 Males in Elk Grove Village.
What is the Median Population Age in Elk Grove Village?
Median Population Age in Elk Grove Village is 42.5 Years.
What is the Average Family Size in Elk Grove Village
Average Family Size in Elk Grove Village is 3.1 People.
What is the Average Household Size in Elk Grove Village
Average Household Size in Elk Grove Village is 2.5 People.
How Large is the Labor Force in Elk Grove Village?
There are 18,003 People in the Labor Forcein in Elk Grove Village.
What is the Percentage of People in the Labor Force in Elk Grove Village?
69.1% of People are in the Labor Force in Elk Grove Village.
What is the Unemployment Rate in Elk Grove Village?
Unemployment Rate in Elk Grove Village is 4.2%.