Spokane Valley, WA Map & Demographics
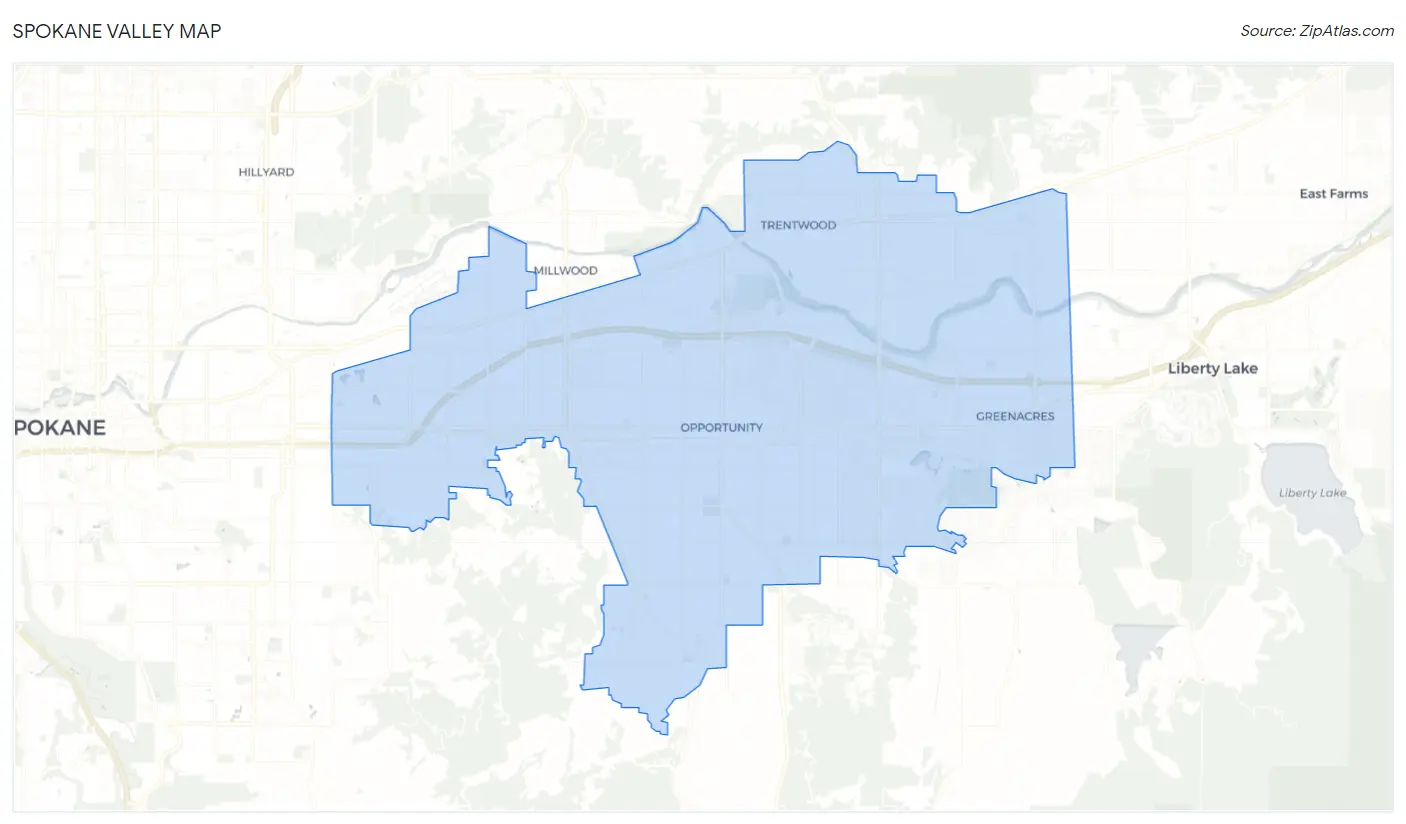
Spokane Valley Map
Spokane Valley Overview
$33,650
PER CAPITA INCOME
$79,665
AVG FAMILY INCOME
$66,483
AVG HOUSEHOLD INCOME
27.1%
WAGE / INCOME GAP [ % ]
72.9¢/ $1
WAGE / INCOME GAP [ $ ]
$10,207
FAMILY INCOME DEFICIT
0.41
INEQUALITY / GINI INDEX
103,761
TOTAL POPULATION
51,779
MALE POPULATION
51,982
FEMALE POPULATION
99.61
MALES / 100 FEMALES
100.39
FEMALES / 100 MALES
37.4
MEDIAN AGE
3.0
AVG FAMILY SIZE
2.4
AVG HOUSEHOLD SIZE
53,337
LABOR FORCE [ PEOPLE ]
64.1%
PERCENT IN LABOR FORCE
5.8%
UNEMPLOYMENT RATE
Spokane Valley Area Codes
Income in Spokane Valley
Income Overview in Spokane Valley
Per Capita Income in Spokane Valley is $33,650, while median incomes of families and households are $79,665 and $66,483 respectively.
| Characteristic | Number | Measure |
| Per Capita Income | 103,761 | $33,650 |
| Median Family Income | 25,846 | $79,665 |
| Mean Family Income | 25,846 | $94,249 |
| Median Household Income | 41,984 | $66,483 |
| Mean Household Income | 41,984 | $80,854 |
| Income Deficit | 25,846 | $10,207 |
| Wage / Income Gap (%) | 103,761 | 27.14% |
| Wage / Income Gap ($) | 103,761 | 72.86¢ per $1 |
| Gini / Inequality Index | 103,761 | 0.41 |
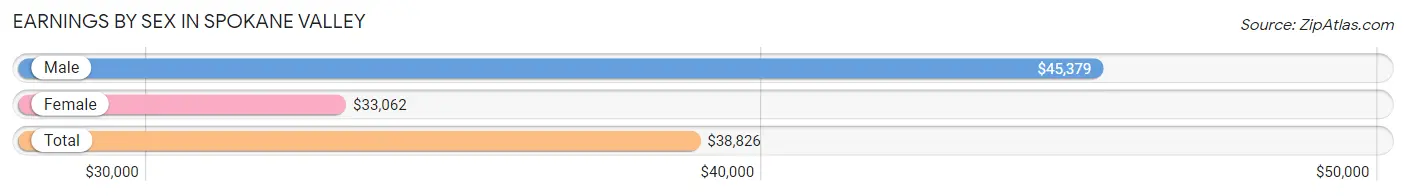
Earnings by Sex in Spokane Valley
Average Earnings in Spokane Valley are $38,826, $45,379 for men and $33,062 for women, a difference of 27.1%.
| Sex | Number | Average Earnings |
| Male | 29,826 (53.7%) | $45,379 |
| Female | 25,675 (46.3%) | $33,062 |
| Total | 55,501 (100.0%) | $38,826 |
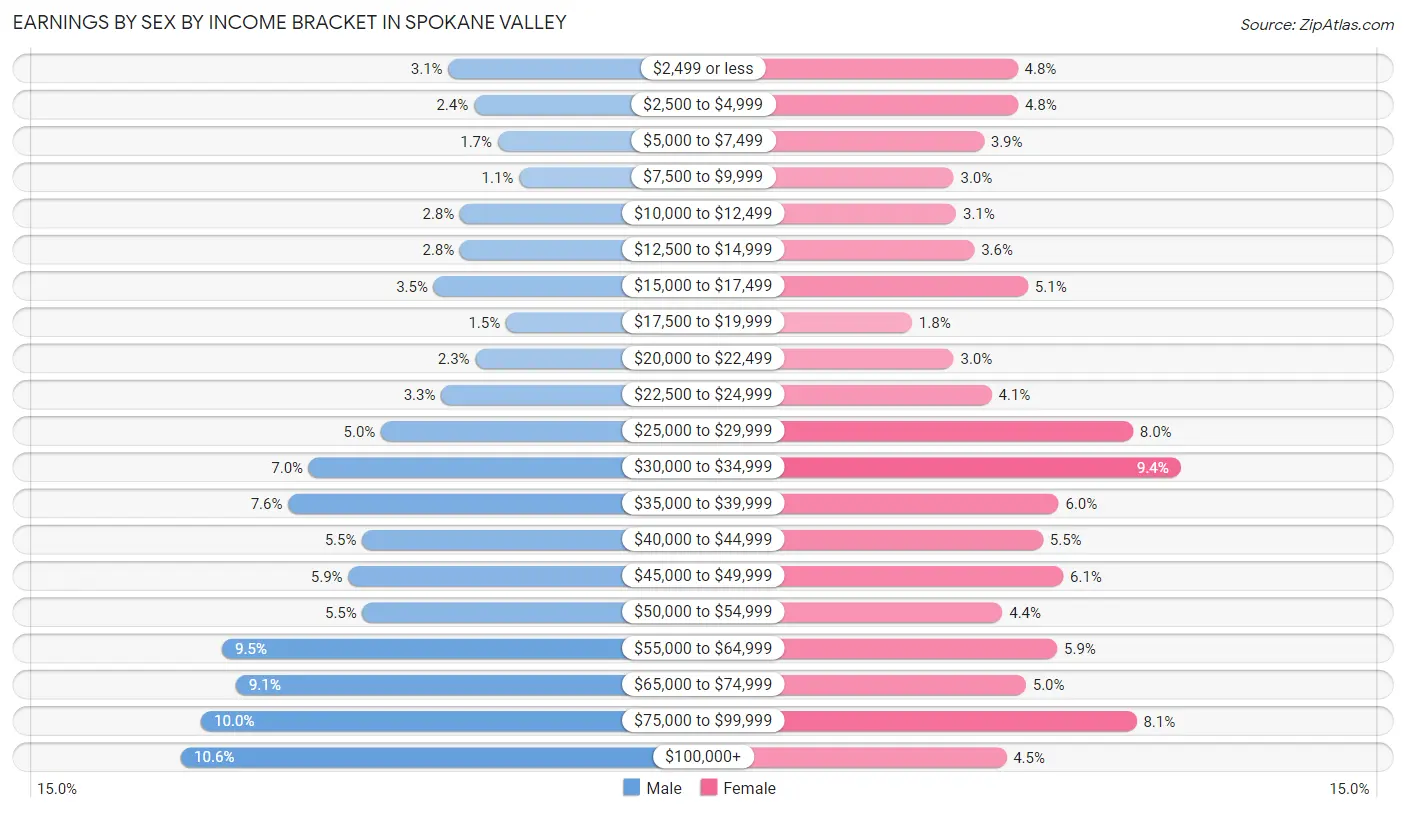
Earnings by Sex by Income Bracket in Spokane Valley
The most common earnings brackets in Spokane Valley are $100,000+ for men (3,161 | 10.6%) and $30,000 to $34,999 for women (2,408 | 9.4%).
| Income | Male | Female |
| $2,499 or less | 923 (3.1%) | 1,232 (4.8%) |
| $2,500 to $4,999 | 707 (2.4%) | 1,236 (4.8%) |
| $5,000 to $7,499 | 506 (1.7%) | 988 (3.8%) |
| $7,500 to $9,999 | 328 (1.1%) | 771 (3.0%) |
| $10,000 to $12,499 | 822 (2.8%) | 789 (3.1%) |
| $12,500 to $14,999 | 823 (2.8%) | 920 (3.6%) |
| $15,000 to $17,499 | 1,044 (3.5%) | 1,306 (5.1%) |
| $17,500 to $19,999 | 438 (1.5%) | 471 (1.8%) |
| $20,000 to $22,499 | 695 (2.3%) | 769 (3.0%) |
| $22,500 to $24,999 | 982 (3.3%) | 1,044 (4.1%) |
| $25,000 to $29,999 | 1,486 (5.0%) | 2,065 (8.0%) |
| $30,000 to $34,999 | 2,090 (7.0%) | 2,408 (9.4%) |
| $35,000 to $39,999 | 2,263 (7.6%) | 1,527 (5.9%) |
| $40,000 to $44,999 | 1,643 (5.5%) | 1,415 (5.5%) |
| $45,000 to $49,999 | 1,760 (5.9%) | 1,561 (6.1%) |
| $50,000 to $54,999 | 1,640 (5.5%) | 1,123 (4.4%) |
| $55,000 to $64,999 | 2,818 (9.5%) | 1,517 (5.9%) |
| $65,000 to $74,999 | 2,702 (9.1%) | 1,292 (5.0%) |
| $75,000 to $99,999 | 2,995 (10.0%) | 2,090 (8.1%) |
| $100,000+ | 3,161 (10.6%) | 1,151 (4.5%) |
| Total | 29,826 (100.0%) | 25,675 (100.0%) |
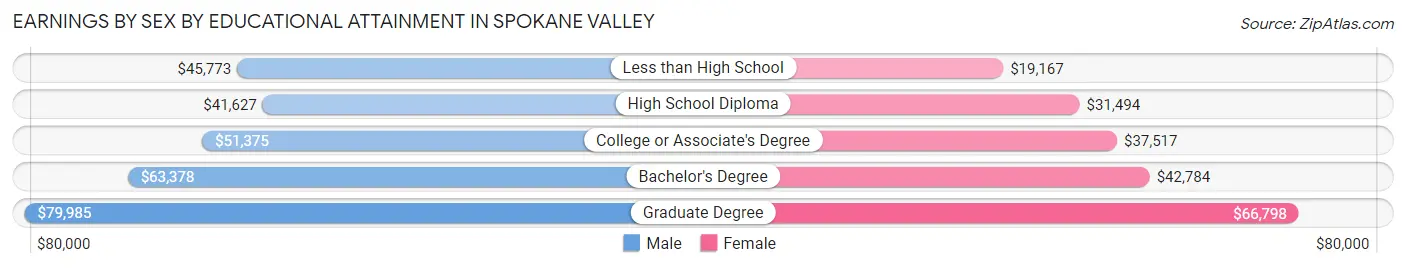
Earnings by Sex by Educational Attainment in Spokane Valley
Average earnings in Spokane Valley are $50,491 for men and $36,412 for women, a difference of 27.9%. Men with an educational attainment of graduate degree enjoy the highest average annual earnings of $79,985, while those with high school diploma education earn the least with $41,627. Women with an educational attainment of graduate degree earn the most with the average annual earnings of $66,798, while those with less than high school education have the smallest earnings of $19,167.
| Educational Attainment | Male Income | Female Income |
| Less than High School | $45,773 | $19,167 |
| High School Diploma | $41,627 | $31,494 |
| College or Associate's Degree | $51,375 | $37,517 |
| Bachelor's Degree | $63,378 | $42,784 |
| Graduate Degree | $79,985 | $66,798 |
| Total | $50,491 | $36,412 |
Family Income in Spokane Valley
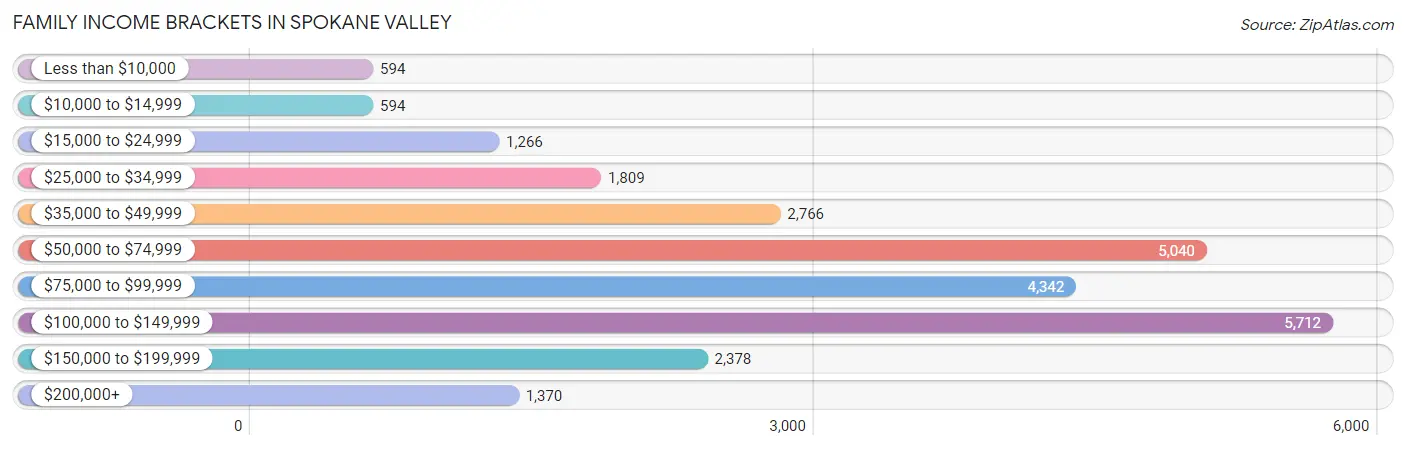
Family Income Brackets in Spokane Valley
According to the Spokane Valley family income data, there are 5,712 families falling into the $100,000 to $149,999 income range, which is the most common income bracket and makes up 22.1% of all families. Conversely, the less than $10,000 income bracket is the least frequent group with only 594 families (2.3%) belonging to this category.
| Income Bracket | # Families | % Families |
| Less than $10,000 | 594 | 2.3% |
| $10,000 to $14,999 | 594 | 2.3% |
| $15,000 to $24,999 | 1,266 | 4.9% |
| $25,000 to $34,999 | 1,809 | 7.0% |
| $35,000 to $49,999 | 2,766 | 10.7% |
| $50,000 to $74,999 | 5,040 | 19.5% |
| $75,000 to $99,999 | 4,342 | 16.8% |
| $100,000 to $149,999 | 5,712 | 22.1% |
| $150,000 to $199,999 | 2,378 | 9.2% |
| $200,000+ | 1,370 | 5.3% |
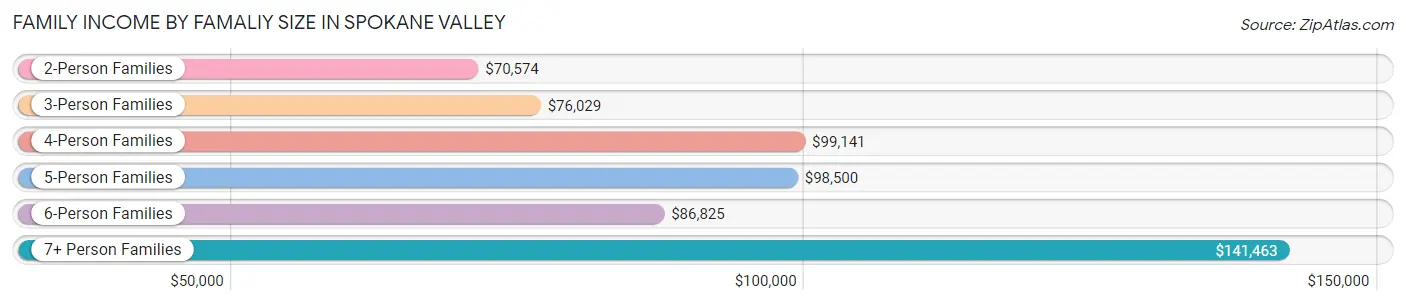
Family Income by Famaliy Size in Spokane Valley
7+ person families (446 | 1.7%) account for the highest median family income in Spokane Valley with $141,463 per family, while 2-person families (12,851 | 49.7%) have the highest median income of $35,287 per family member.
| Income Bracket | # Families | Median Income |
| 2-Person Families | 12,851 (49.7%) | $70,574 |
| 3-Person Families | 5,368 (20.8%) | $76,029 |
| 4-Person Families | 4,250 (16.4%) | $99,141 |
| 5-Person Families | 2,032 (7.9%) | $98,500 |
| 6-Person Families | 899 (3.5%) | $86,825 |
| 7+ Person Families | 446 (1.7%) | $141,463 |
| Total | 25,846 (100.0%) | $79,665 |
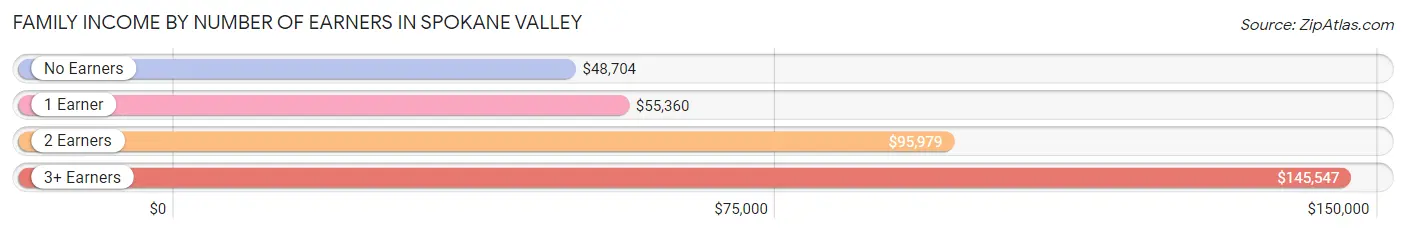
Family Income by Number of Earners in Spokane Valley
The median family income in Spokane Valley is $79,665, with families comprising 3+ earners (2,893) having the highest median family income of $145,547, while families with no earners (4,055) have the lowest median family income of $48,704, accounting for 11.2% and 15.7% of families, respectively.
| Number of Earners | # Families | Median Income |
| No Earners | 4,055 (15.7%) | $48,704 |
| 1 Earner | 7,774 (30.1%) | $55,360 |
| 2 Earners | 11,124 (43.0%) | $95,979 |
| 3+ Earners | 2,893 (11.2%) | $145,547 |
| Total | 25,846 (100.0%) | $79,665 |
Household Income in Spokane Valley
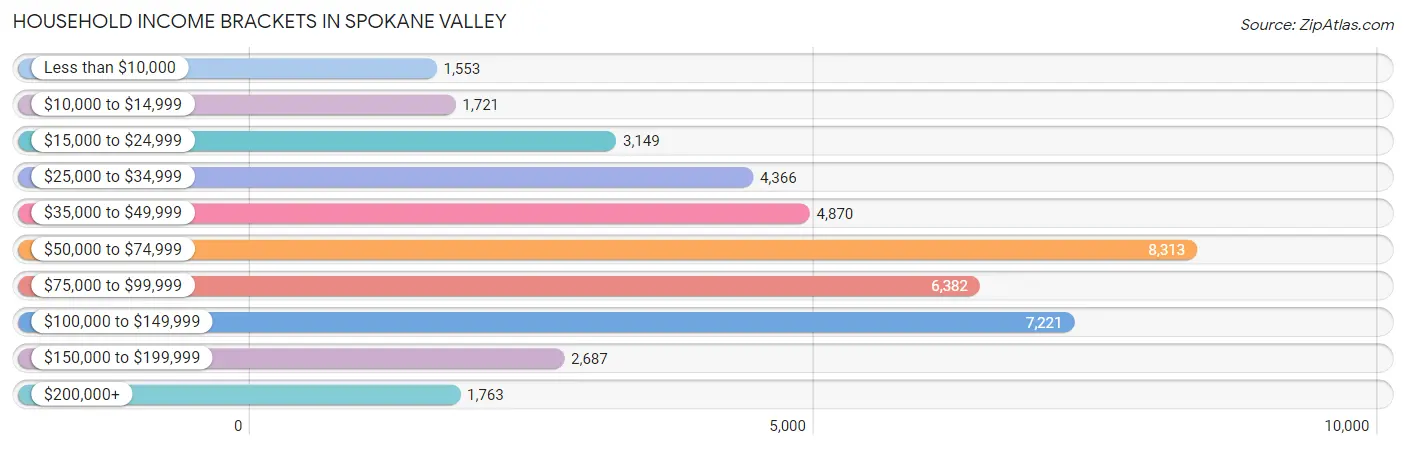
Household Income Brackets in Spokane Valley
With 8,313 households falling in the category, the $50,000 to $74,999 income range is the most frequent in Spokane Valley, accounting for 19.8% of all households. In contrast, only 1,553 households (3.7%) fall into the less than $10,000 income bracket, making it the least populous group.
| Income Bracket | # Households | % Households |
| Less than $10,000 | 1,553 | 3.7% |
| $10,000 to $14,999 | 1,721 | 4.1% |
| $15,000 to $24,999 | 3,149 | 7.5% |
| $25,000 to $34,999 | 4,366 | 10.4% |
| $35,000 to $49,999 | 4,870 | 11.6% |
| $50,000 to $74,999 | 8,313 | 19.8% |
| $75,000 to $99,999 | 6,382 | 15.2% |
| $100,000 to $149,999 | 7,221 | 17.2% |
| $150,000 to $199,999 | 2,687 | 6.4% |
| $200,000+ | 1,763 | 4.2% |
Household Income by Householder Age in Spokane Valley
The median household income in Spokane Valley is $66,483, with the highest median household income of $80,062 found in the 45 to 64 years age bracket for the primary householder. A total of 13,522 households (32.2%) fall into this category. Meanwhile, the 65+ years age bracket for the primary householder has the lowest median household income of $44,592, with 11,674 households (27.8%) in this group.
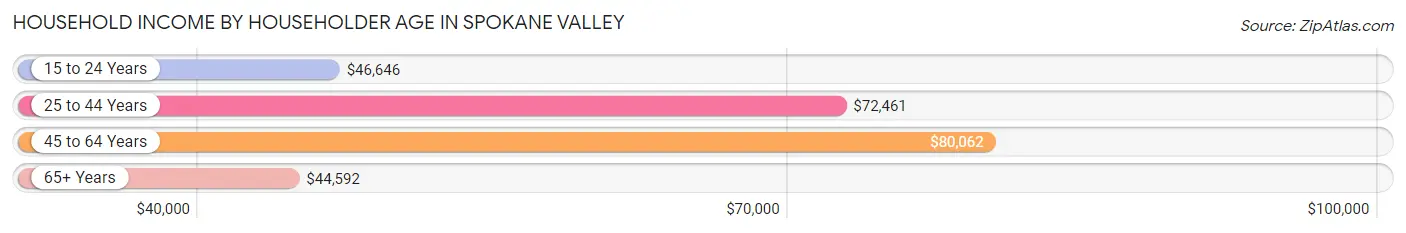
| Income Bracket | # Households | Median Income |
| 15 to 24 Years | 2,349 (5.6%) | $46,646 |
| 25 to 44 Years | 14,439 (34.4%) | $72,461 |
| 45 to 64 Years | 13,522 (32.2%) | $80,062 |
| 65+ Years | 11,674 (27.8%) | $44,592 |
| Total | 41,984 (100.0%) | $66,483 |
Poverty in Spokane Valley
Income Below Poverty by Sex and Age in Spokane Valley
With 10.8% poverty level for males and 12.1% for females among the residents of Spokane Valley, 15 year old males and under 5 year old females are the most vulnerable to poverty, with 235 males (34.1%) and 639 females (21.7%) in their respective age groups living below the poverty level.
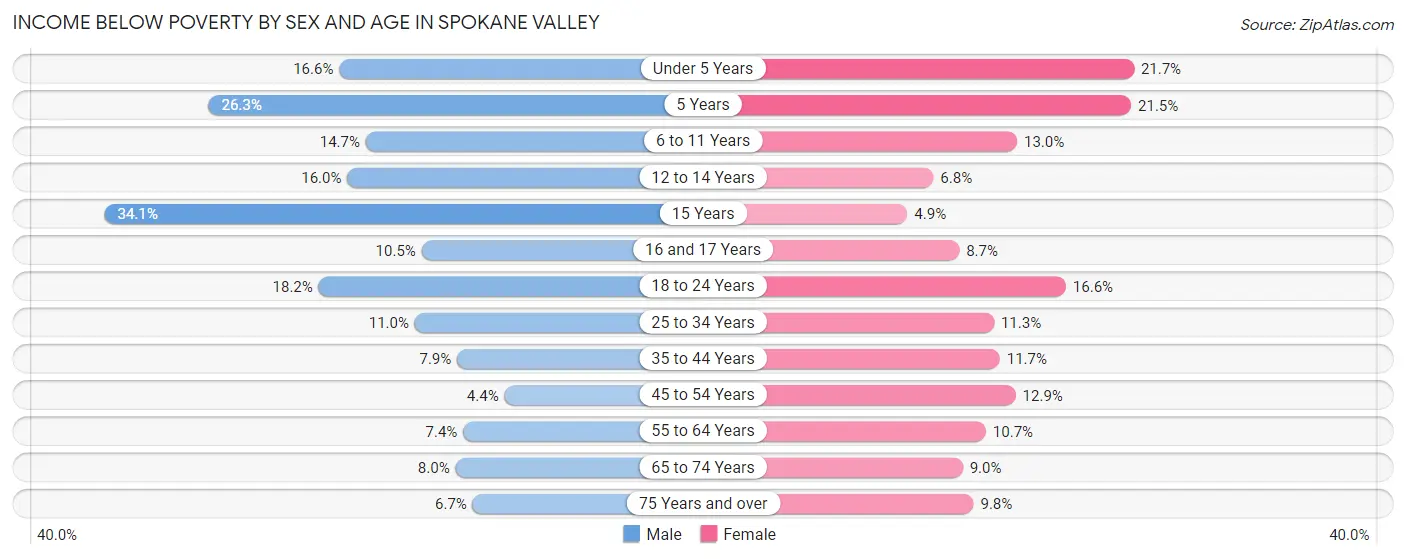
| Age Bracket | Male | Female |
| Under 5 Years | 582 (16.6%) | 639 (21.7%) |
| 5 Years | 133 (26.3%) | 119 (21.5%) |
| 6 to 11 Years | 565 (14.7%) | 502 (13.0%) |
| 12 to 14 Years | 260 (16.0%) | 100 (6.8%) |
| 15 Years | 235 (34.1%) | 32 (4.9%) |
| 16 and 17 Years | 111 (10.5%) | 76 (8.7%) |
| 18 to 24 Years | 836 (18.2%) | 706 (16.6%) |
| 25 to 34 Years | 991 (11.0%) | 917 (11.3%) |
| 35 to 44 Years | 556 (7.9%) | 708 (11.7%) |
| 45 to 54 Years | 253 (4.4%) | 786 (12.9%) |
| 55 to 64 Years | 455 (7.4%) | 647 (10.7%) |
| 65 to 74 Years | 358 (8.0%) | 512 (9.0%) |
| 75 Years and over | 206 (6.7%) | 440 (9.8%) |
| Total | 5,541 (10.8%) | 6,184 (12.1%) |
Income Above Poverty by Sex and Age in Spokane Valley
According to the poverty statistics in Spokane Valley, males aged 45 to 54 years and females aged 15 years are the age groups that are most secure financially, with 95.6% of males and 95.1% of females in these age groups living above the poverty line.
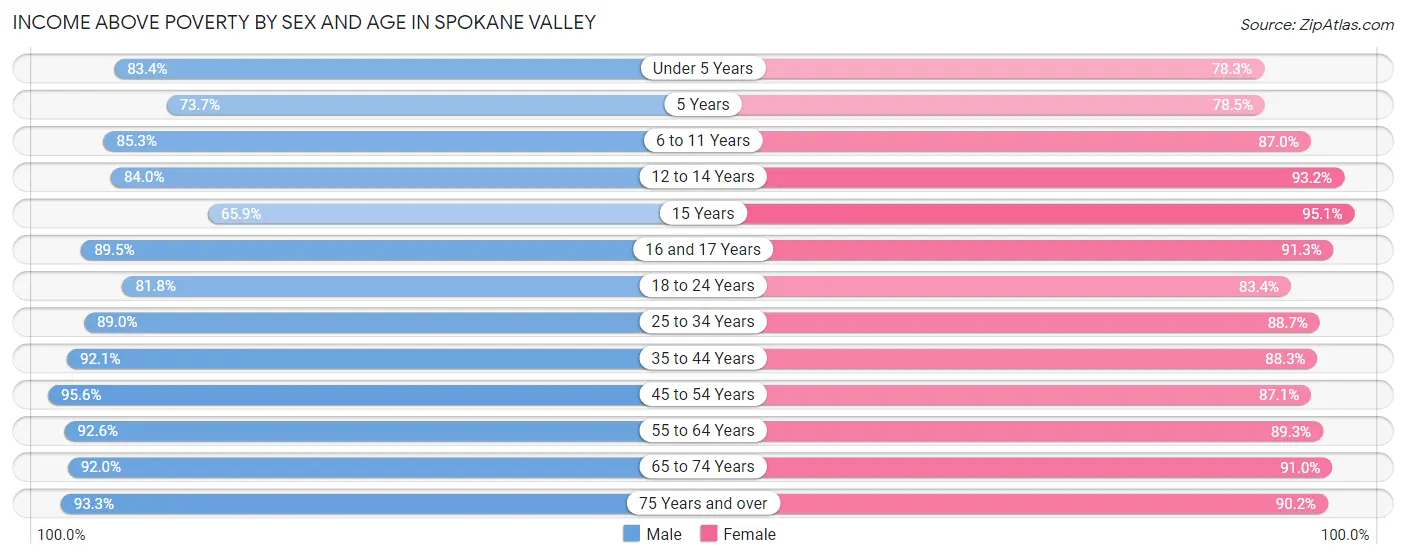
| Age Bracket | Male | Female |
| Under 5 Years | 2,915 (83.4%) | 2,307 (78.3%) |
| 5 Years | 372 (73.7%) | 435 (78.5%) |
| 6 to 11 Years | 3,287 (85.3%) | 3,358 (87.0%) |
| 12 to 14 Years | 1,361 (84.0%) | 1,371 (93.2%) |
| 15 Years | 455 (65.9%) | 625 (95.1%) |
| 16 and 17 Years | 944 (89.5%) | 796 (91.3%) |
| 18 to 24 Years | 3,764 (81.8%) | 3,536 (83.4%) |
| 25 to 34 Years | 7,997 (89.0%) | 7,198 (88.7%) |
| 35 to 44 Years | 6,490 (92.1%) | 5,327 (88.3%) |
| 45 to 54 Years | 5,533 (95.6%) | 5,301 (87.1%) |
| 55 to 64 Years | 5,658 (92.6%) | 5,397 (89.3%) |
| 65 to 74 Years | 4,111 (92.0%) | 5,192 (91.0%) |
| 75 Years and over | 2,857 (93.3%) | 4,059 (90.2%) |
| Total | 45,744 (89.2%) | 44,902 (87.9%) |
Income Below Poverty Among Married-Couple Families in Spokane Valley
The poverty statistics for married-couple families in Spokane Valley show that 3.3% or 624 of the total 18,774 families live below the poverty line. Families with 5 or more children have the highest poverty rate of 28.6%, comprising of 63 families. On the other hand, families with no children have the lowest poverty rate of 2.2%, which includes 242 families.
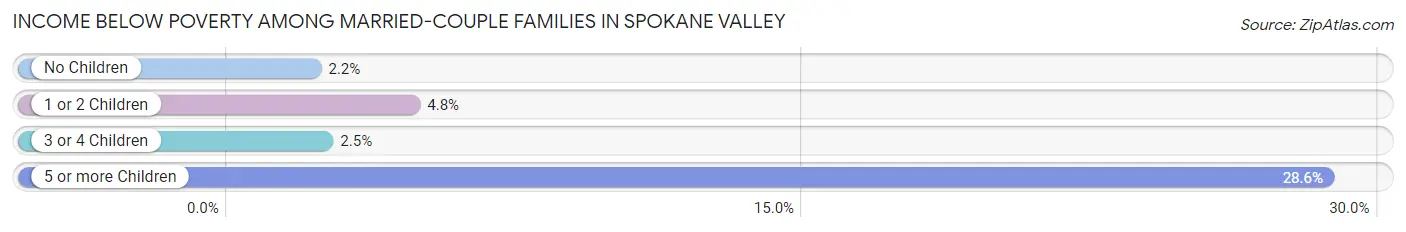
| Children | Above Poverty | Below Poverty |
| No Children | 10,877 (97.8%) | 242 (2.2%) |
| 1 or 2 Children | 5,627 (95.2%) | 281 (4.8%) |
| 3 or 4 Children | 1,489 (97.5%) | 38 (2.5%) |
| 5 or more Children | 157 (71.4%) | 63 (28.6%) |
| Total | 18,150 (96.7%) | 624 (3.3%) |
Income Below Poverty Among Single-Parent Households in Spokane Valley
According to the poverty data in Spokane Valley, 11.8% or 298 single-father households and 26.0% or 1,181 single-mother households are living below the poverty line. Among single-father households, those with 5 or more children have the highest poverty rate, with 97 households (100.0%) experiencing poverty. Likewise, among single-mother households, those with 3 or 4 children have the highest poverty rate, with 241 households (55.1%) falling below the poverty line.
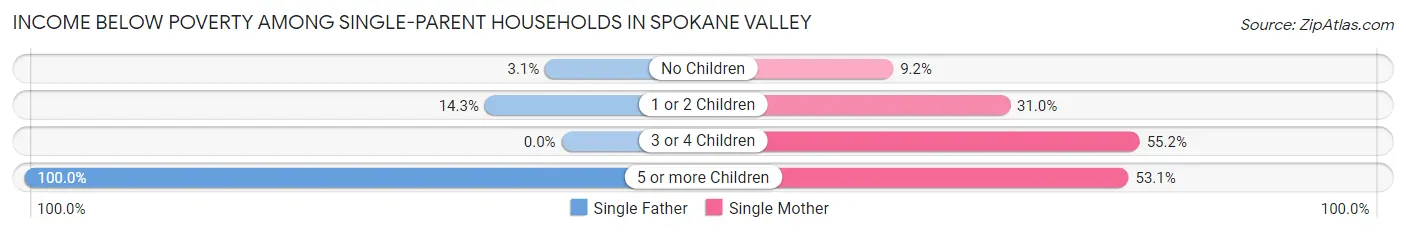
| Children | Single Father | Single Mother |
| No Children | 38 (3.0%) | 146 (9.2%) |
| 1 or 2 Children | 163 (14.3%) | 768 (31.0%) |
| 3 or 4 Children | 0 (0.0%) | 241 (55.1%) |
| 5 or more Children | 97 (100.0%) | 26 (53.1%) |
| Total | 298 (11.8%) | 1,181 (26.0%) |
Income Below Poverty Among Married-Couple vs Single-Parent Households in Spokane Valley
The poverty data for Spokane Valley shows that 624 of the married-couple family households (3.3%) and 1,479 of the single-parent households (20.9%) are living below the poverty level. Within the married-couple family households, those with 5 or more children have the highest poverty rate, with 63 households (28.6%) falling below the poverty line. Among the single-parent households, those with 5 or more children have the highest poverty rate, with 123 household (84.3%) living below poverty.
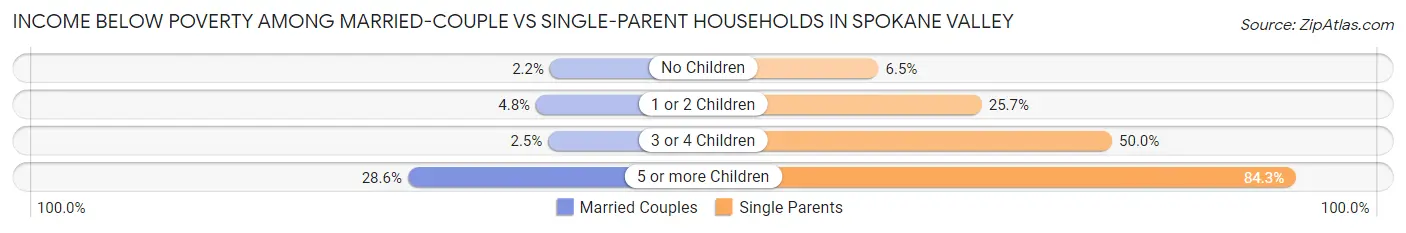
| Children | Married-Couple Families | Single-Parent Households |
| No Children | 242 (2.2%) | 184 (6.5%) |
| 1 or 2 Children | 281 (4.8%) | 931 (25.7%) |
| 3 or 4 Children | 38 (2.5%) | 241 (50.0%) |
| 5 or more Children | 63 (28.6%) | 123 (84.3%) |
| Total | 624 (3.3%) | 1,479 (20.9%) |
Race in Spokane Valley
The most populous races in Spokane Valley are White / Caucasian (89,149 | 85.9%), Two or more Races (7,821 | 7.5%), and Hispanic or Latino (7,381 | 7.1%).
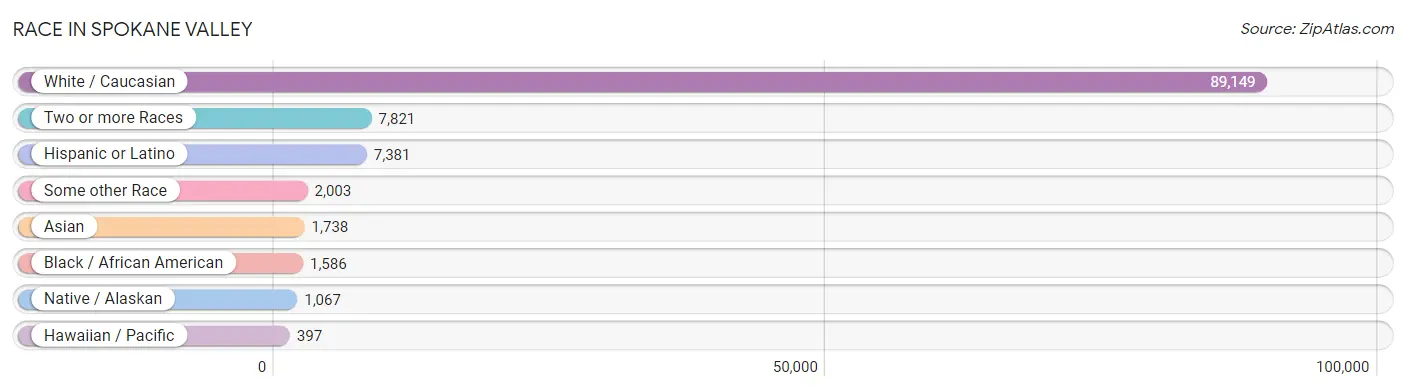
| Race | # Population | % Population |
| Asian | 1,738 | 1.7% |
| Black / African American | 1,586 | 1.5% |
| Hawaiian / Pacific | 397 | 0.4% |
| Hispanic or Latino | 7,381 | 7.1% |
| Native / Alaskan | 1,067 | 1.0% |
| White / Caucasian | 89,149 | 85.9% |
| Two or more Races | 7,821 | 7.5% |
| Some other Race | 2,003 | 1.9% |
| Total | 103,761 | 100.0% |
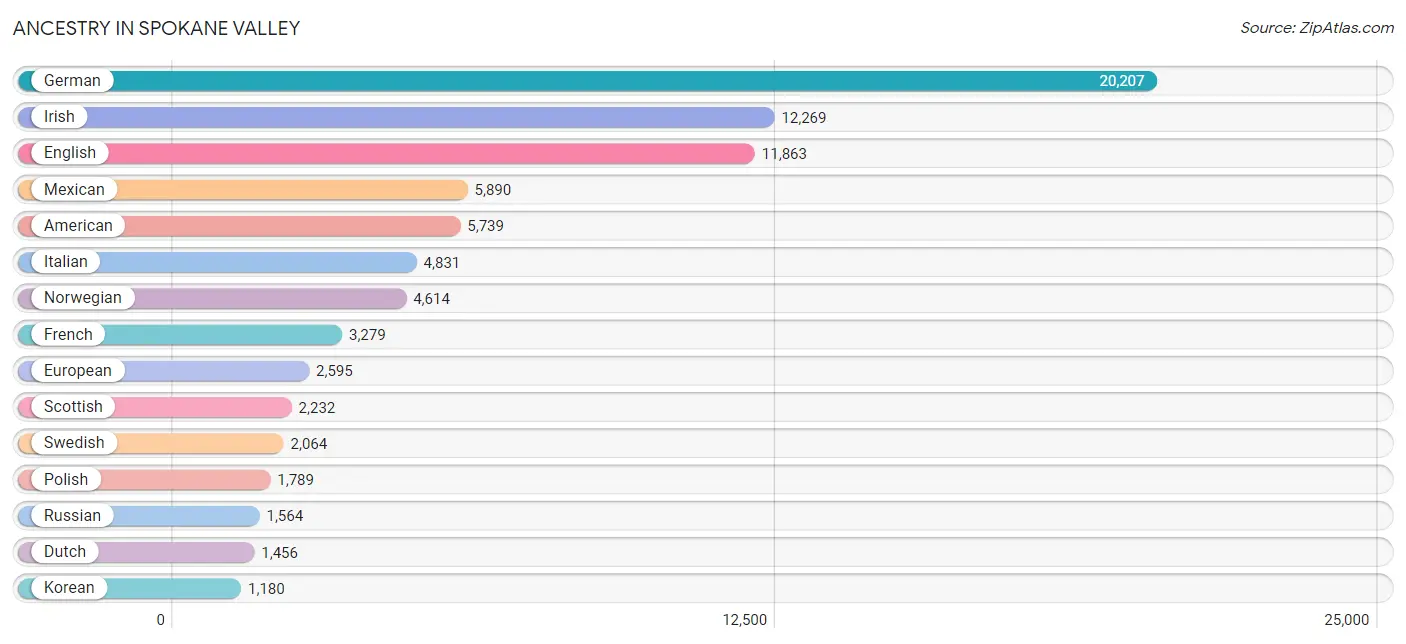
Ancestry in Spokane Valley
The most populous ancestries reported in Spokane Valley are German (20,207 | 19.5%), Irish (12,269 | 11.8%), English (11,863 | 11.4%), Mexican (5,890 | 5.7%), and American (5,739 | 5.5%), together accounting for 53.9% of all Spokane Valley residents.
| Ancestry | # Population | % Population |
| African | 186 | 0.2% |
| Alaska Native | 30 | 0.0% |
| Alaskan Athabascan | 11 | 0.0% |
| American | 5,739 | 5.5% |
| Apache | 58 | 0.1% |
| Arab | 394 | 0.4% |
| Armenian | 120 | 0.1% |
| Australian | 16 | 0.0% |
| Austrian | 159 | 0.2% |
| Bangladeshi | 112 | 0.1% |
| Basque | 27 | 0.0% |
| Belgian | 31 | 0.0% |
| Bhutanese | 775 | 0.7% |
| Blackfeet | 393 | 0.4% |
| Bolivian | 46 | 0.0% |
| Brazilian | 24 | 0.0% |
| British | 651 | 0.6% |
| Burmese | 301 | 0.3% |
| Cambodian | 85 | 0.1% |
| Canadian | 479 | 0.5% |
| Central American | 203 | 0.2% |
| Cherokee | 410 | 0.4% |
| Chickasaw | 9 | 0.0% |
| Chippewa | 137 | 0.1% |
| Choctaw | 20 | 0.0% |
| Colombian | 37 | 0.0% |
| Colville | 204 | 0.2% |
| Comanche | 24 | 0.0% |
| Cree | 43 | 0.0% |
| Creek | 40 | 0.0% |
| Croatian | 67 | 0.1% |
| Cuban | 157 | 0.2% |
| Czech | 371 | 0.4% |
| Danish | 951 | 0.9% |
| Dominican | 34 | 0.0% |
| Dutch | 1,456 | 1.4% |
| Eastern European | 634 | 0.6% |
| English | 11,863 | 11.4% |
| European | 2,595 | 2.5% |
| Fijian | 126 | 0.1% |
| Filipino | 43 | 0.0% |
| Finnish | 334 | 0.3% |
| French | 3,279 | 3.2% |
| French American Indian | 15 | 0.0% |
| French Canadian | 634 | 0.6% |
| German | 20,207 | 19.5% |
| Greek | 340 | 0.3% |
| Guamanian / Chamorro | 3 | 0.0% |
| Guatemalan | 4 | 0.0% |
| Honduran | 34 | 0.0% |
| Hungarian | 233 | 0.2% |
| Icelander | 154 | 0.2% |
| Indian (Asian) | 464 | 0.4% |
| Inupiat | 52 | 0.1% |
| Iranian | 16 | 0.0% |
| Iraqi | 62 | 0.1% |
| Irish | 12,269 | 11.8% |
| Iroquois | 80 | 0.1% |
| Italian | 4,831 | 4.7% |
| Japanese | 22 | 0.0% |
| Jordanian | 8 | 0.0% |
| Kenyan | 80 | 0.1% |
| Korean | 1,180 | 1.1% |
| Laotian | 109 | 0.1% |
| Latvian | 7 | 0.0% |
| Lebanese | 30 | 0.0% |
| Lithuanian | 44 | 0.0% |
| Luxembourger | 32 | 0.0% |
| Marshallese | 87 | 0.1% |
| Menominee | 14 | 0.0% |
| Mexican | 5,890 | 5.7% |
| Mexican American Indian | 82 | 0.1% |
| Native Hawaiian | 211 | 0.2% |
| Navajo | 202 | 0.2% |
| Nepalese | 47 | 0.1% |
| Nigerian | 34 | 0.0% |
| Northern European | 264 | 0.3% |
| Norwegian | 4,614 | 4.4% |
| Pakistani | 147 | 0.1% |
| Palestinian | 22 | 0.0% |
| Panamanian | 64 | 0.1% |
| Pennsylvania German | 27 | 0.0% |
| Polish | 1,789 | 1.7% |
| Portuguese | 444 | 0.4% |
| Pueblo | 11 | 0.0% |
| Puerto Rican | 341 | 0.3% |
| Puget Sound Salish | 25 | 0.0% |
| Romanian | 209 | 0.2% |
| Russian | 1,564 | 1.5% |
| Salvadoran | 101 | 0.1% |
| Samoan | 37 | 0.0% |
| Scandinavian | 1,152 | 1.1% |
| Scotch-Irish | 1,070 | 1.0% |
| Scottish | 2,232 | 2.1% |
| Serbian | 22 | 0.0% |
| Sioux | 161 | 0.2% |
| Slavic | 20 | 0.0% |
| Slovak | 89 | 0.1% |
| Slovene | 33 | 0.0% |
| South American | 114 | 0.1% |
| Spaniard | 281 | 0.3% |
| Spanish | 136 | 0.1% |
| Spanish American | 48 | 0.1% |
| Sri Lankan | 525 | 0.5% |
| Subsaharan African | 706 | 0.7% |
| Sudanese | 258 | 0.3% |
| Swedish | 2,064 | 2.0% |
| Swiss | 323 | 0.3% |
| Thai | 95 | 0.1% |
| Tohono O'Odham | 39 | 0.0% |
| Trinidadian and Tobagonian | 81 | 0.1% |
| Turkish | 67 | 0.1% |
| Ugandan | 35 | 0.0% |
| Ukrainian | 1,066 | 1.0% |
| Uruguayan | 6 | 0.0% |
| Venezuelan | 25 | 0.0% |
| Welsh | 1,068 | 1.0% |
| Yakama | 3 | 0.0% |
| Yaqui | 36 | 0.0% |
| Yugoslavian | 104 | 0.1% | View All 120 Rows |
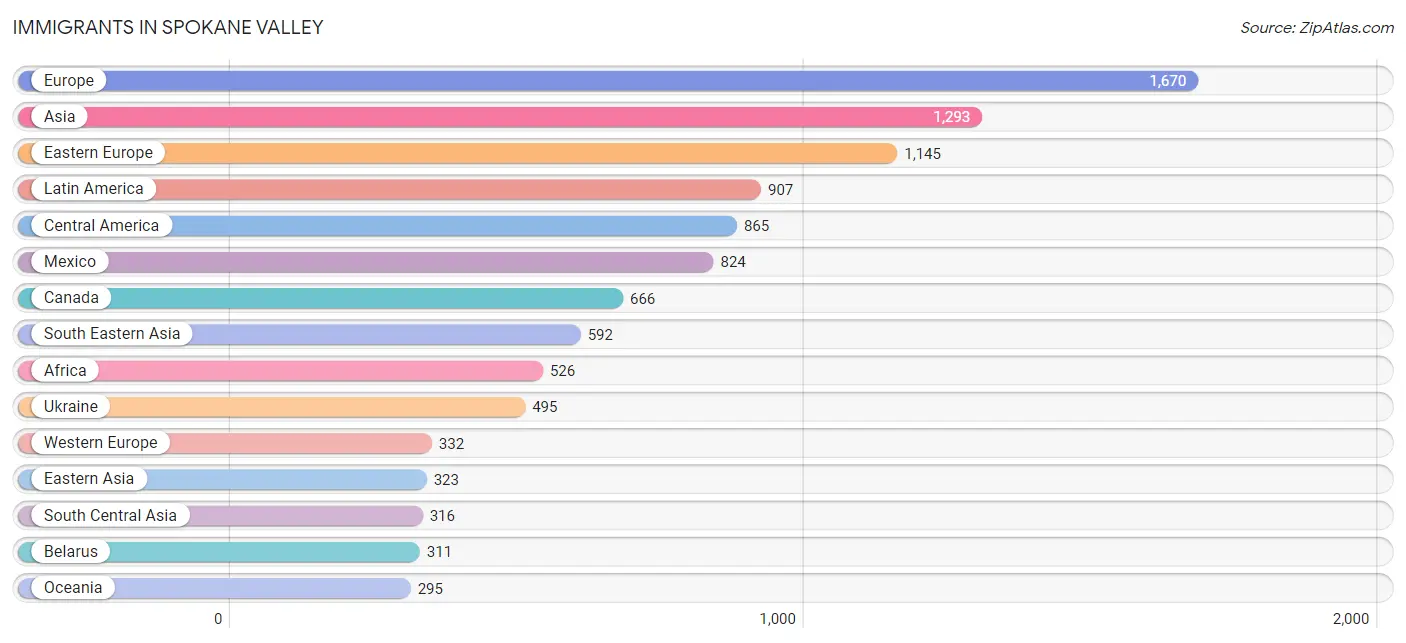
Immigrants in Spokane Valley
The most numerous immigrant groups reported in Spokane Valley came from Europe (1,670 | 1.6%), Asia (1,293 | 1.3%), Eastern Europe (1,145 | 1.1%), Latin America (907 | 0.9%), and Central America (865 | 0.8%), together accounting for 5.7% of all Spokane Valley residents.
| Immigration Origin | # Population | % Population |
| Africa | 526 | 0.5% |
| Asia | 1,293 | 1.3% |
| Australia | 13 | 0.0% |
| Belarus | 311 | 0.3% |
| Brazil | 8 | 0.0% |
| Cambodia | 4 | 0.0% |
| Canada | 666 | 0.6% |
| Caribbean | 13 | 0.0% |
| Central America | 865 | 0.8% |
| China | 170 | 0.2% |
| Colombia | 15 | 0.0% |
| Czechoslovakia | 8 | 0.0% |
| Dominican Republic | 12 | 0.0% |
| Eastern Africa | 120 | 0.1% |
| Eastern Asia | 323 | 0.3% |
| Eastern Europe | 1,145 | 1.1% |
| Egypt | 25 | 0.0% |
| England | 98 | 0.1% |
| Europe | 1,670 | 1.6% |
| France | 30 | 0.0% |
| Germany | 293 | 0.3% |
| India | 35 | 0.0% |
| Indonesia | 57 | 0.1% |
| Iraq | 62 | 0.1% |
| Italy | 13 | 0.0% |
| Jamaica | 1 | 0.0% |
| Japan | 22 | 0.0% |
| Kazakhstan | 169 | 0.2% |
| Kenya | 85 | 0.1% |
| Korea | 66 | 0.1% |
| Laos | 27 | 0.0% |
| Latin America | 907 | 0.9% |
| Malaysia | 10 | 0.0% |
| Mexico | 824 | 0.8% |
| Micronesia | 59 | 0.1% |
| Middle Africa | 45 | 0.0% |
| Moldova | 94 | 0.1% |
| Nepal | 53 | 0.1% |
| Netherlands | 9 | 0.0% |
| Northern Africa | 283 | 0.3% |
| Northern Europe | 153 | 0.2% |
| Oceania | 295 | 0.3% |
| Panama | 41 | 0.0% |
| Philippines | 259 | 0.3% |
| Romania | 3 | 0.0% |
| Russia | 195 | 0.2% |
| Scotland | 11 | 0.0% |
| South Africa | 10 | 0.0% |
| South America | 29 | 0.0% |
| South Central Asia | 316 | 0.3% |
| South Eastern Asia | 592 | 0.6% |
| Southern Europe | 40 | 0.0% |
| Spain | 27 | 0.0% |
| Sudan | 203 | 0.2% |
| Taiwan | 21 | 0.0% |
| Thailand | 41 | 0.0% |
| Uganda | 35 | 0.0% |
| Ukraine | 495 | 0.5% |
| Uruguay | 6 | 0.0% |
| Vietnam | 194 | 0.2% |
| Western Africa | 68 | 0.1% |
| Western Asia | 62 | 0.1% |
| Western Europe | 332 | 0.3% |
| Zaire | 45 | 0.0% | View All 64 Rows |
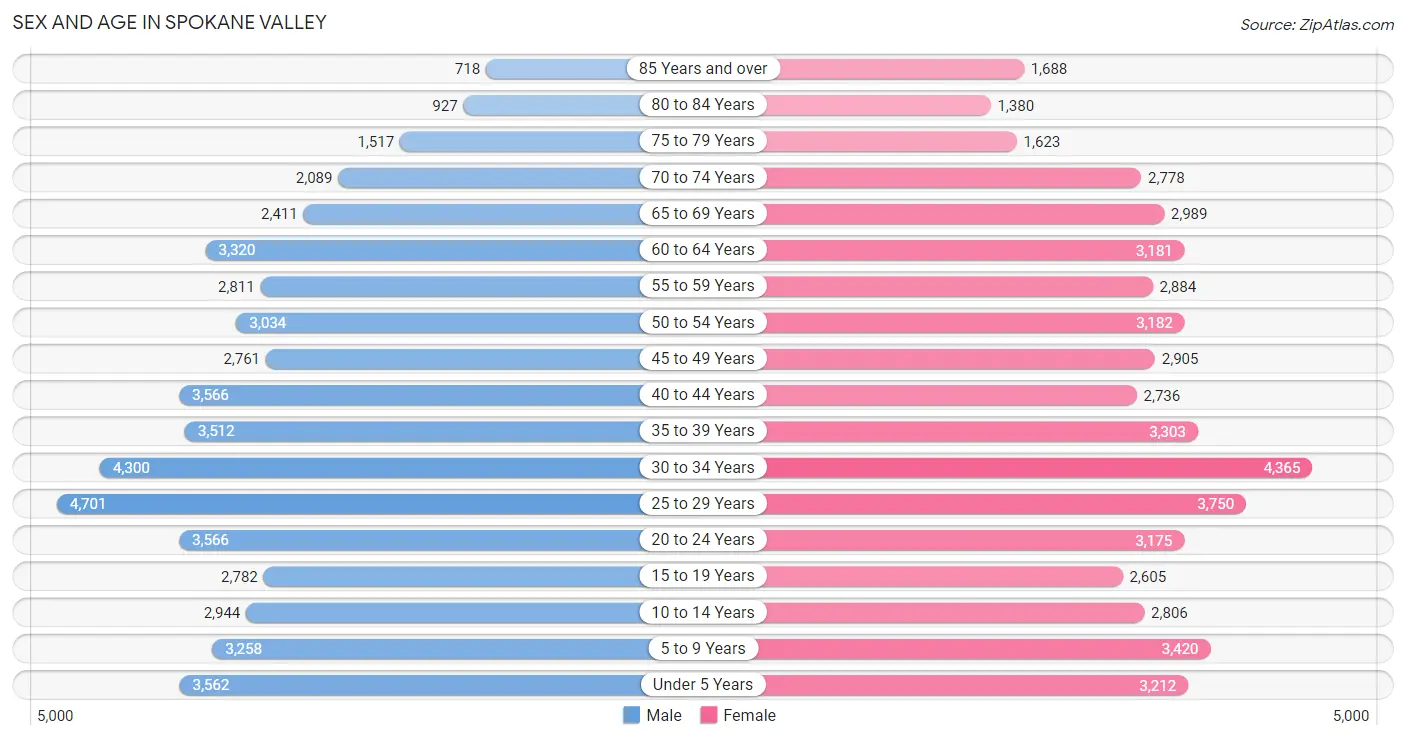
Sex and Age in Spokane Valley
Sex and Age in Spokane Valley
The most populous age groups in Spokane Valley are 25 to 29 Years (4,701 | 9.1%) for men and 30 to 34 Years (4,365 | 8.4%) for women.
| Age Bracket | Male | Female |
| Under 5 Years | 3,562 (6.9%) | 3,212 (6.2%) |
| 5 to 9 Years | 3,258 (6.3%) | 3,420 (6.6%) |
| 10 to 14 Years | 2,944 (5.7%) | 2,806 (5.4%) |
| 15 to 19 Years | 2,782 (5.4%) | 2,605 (5.0%) |
| 20 to 24 Years | 3,566 (6.9%) | 3,175 (6.1%) |
| 25 to 29 Years | 4,701 (9.1%) | 3,750 (7.2%) |
| 30 to 34 Years | 4,300 (8.3%) | 4,365 (8.4%) |
| 35 to 39 Years | 3,512 (6.8%) | 3,303 (6.4%) |
| 40 to 44 Years | 3,566 (6.9%) | 2,736 (5.3%) |
| 45 to 49 Years | 2,761 (5.3%) | 2,905 (5.6%) |
| 50 to 54 Years | 3,034 (5.9%) | 3,182 (6.1%) |
| 55 to 59 Years | 2,811 (5.4%) | 2,884 (5.6%) |
| 60 to 64 Years | 3,320 (6.4%) | 3,181 (6.1%) |
| 65 to 69 Years | 2,411 (4.7%) | 2,989 (5.8%) |
| 70 to 74 Years | 2,089 (4.0%) | 2,778 (5.3%) |
| 75 to 79 Years | 1,517 (2.9%) | 1,623 (3.1%) |
| 80 to 84 Years | 927 (1.8%) | 1,380 (2.6%) |
| 85 Years and over | 718 (1.4%) | 1,688 (3.3%) |
| Total | 51,779 (100.0%) | 51,982 (100.0%) |
Families and Households in Spokane Valley
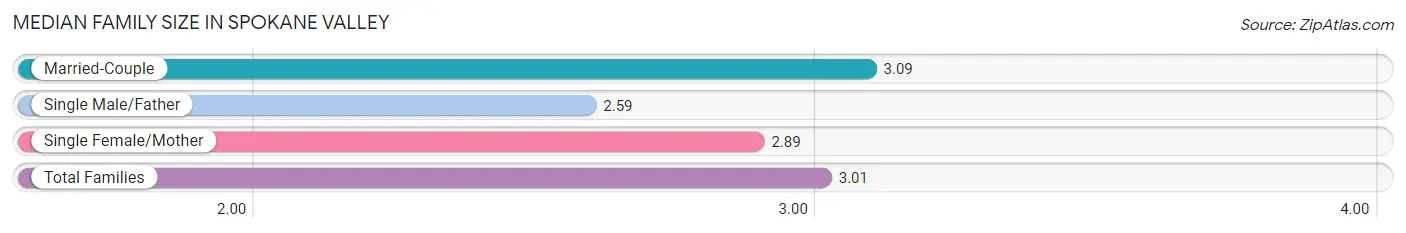
Median Family Size in Spokane Valley
The median family size in Spokane Valley is 3.01 persons per family, with married-couple families (18,774 | 72.6%) accounting for the largest median family size of 3.09 persons per family. On the other hand, single male/father families (2,527 | 9.8%) represent the smallest median family size with 2.59 persons per family.
| Family Type | # Families | Family Size |
| Married-Couple | 18,774 (72.6%) | 3.09 |
| Single Male/Father | 2,527 (9.8%) | 2.59 |
| Single Female/Mother | 4,545 (17.6%) | 2.89 |
| Total Families | 25,846 (100.0%) | 3.01 |
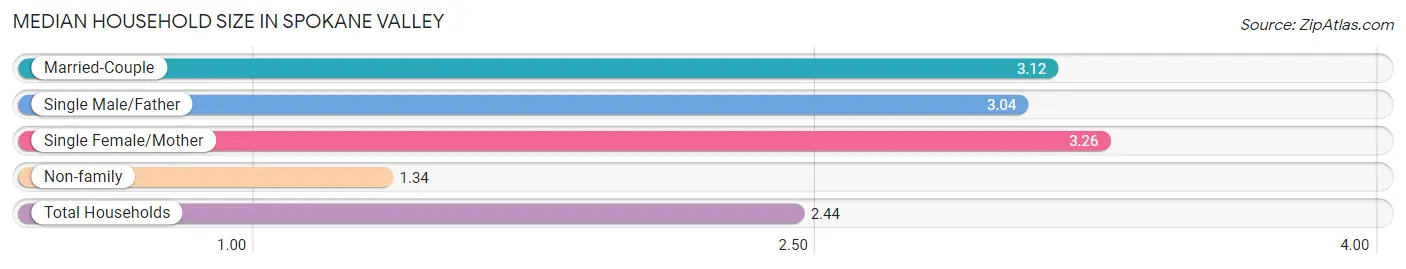
Median Household Size in Spokane Valley
The median household size in Spokane Valley is 2.44 persons per household, with single female/mother households (4,545 | 10.8%) accounting for the largest median household size of 3.26 persons per household. non-family households (16,138 | 38.4%) represent the smallest median household size with 1.34 persons per household.
| Household Type | # Households | Household Size |
| Married-Couple | 18,774 (44.7%) | 3.12 |
| Single Male/Father | 2,527 (6.0%) | 3.04 |
| Single Female/Mother | 4,545 (10.8%) | 3.26 |
| Non-family | 16,138 (38.4%) | 1.34 |
| Total Households | 41,984 (100.0%) | 2.44 |
Household Size by Marriage Status in Spokane Valley
Out of a total of 41,984 households in Spokane Valley, 25,846 (61.6%) are family households, while 16,138 (38.4%) are nonfamily households. The most numerous type of family households are 2-person households, comprising 11,426, and the most common type of nonfamily households are 1-person households, comprising 12,316.
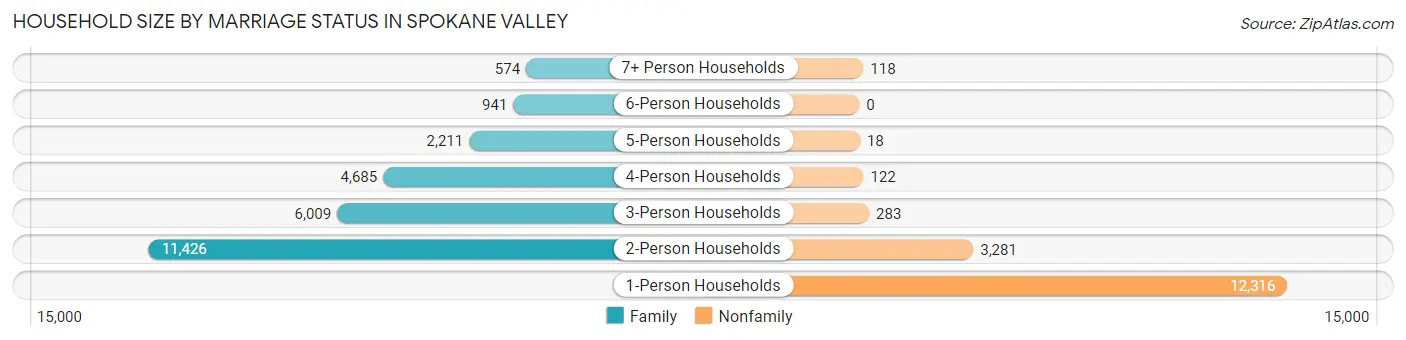
| Household Size | Family Households | Nonfamily Households |
| 1-Person Households | - | 12,316 (29.3%) |
| 2-Person Households | 11,426 (27.2%) | 3,281 (7.8%) |
| 3-Person Households | 6,009 (14.3%) | 283 (0.7%) |
| 4-Person Households | 4,685 (11.2%) | 122 (0.3%) |
| 5-Person Households | 2,211 (5.3%) | 18 (0.0%) |
| 6-Person Households | 941 (2.2%) | 0 (0.0%) |
| 7+ Person Households | 574 (1.4%) | 118 (0.3%) |
| Total | 25,846 (61.6%) | 16,138 (38.4%) |
Female Fertility in Spokane Valley
Fertility by Age in Spokane Valley
Average fertility rate in Spokane Valley is 51.0 births per 1,000 women. Women in the age bracket of 20 to 34 years have the highest fertility rate with 93.0 births per 1,000 women. Women in the age bracket of 20 to 34 years acount for 89.2% of all women with births.
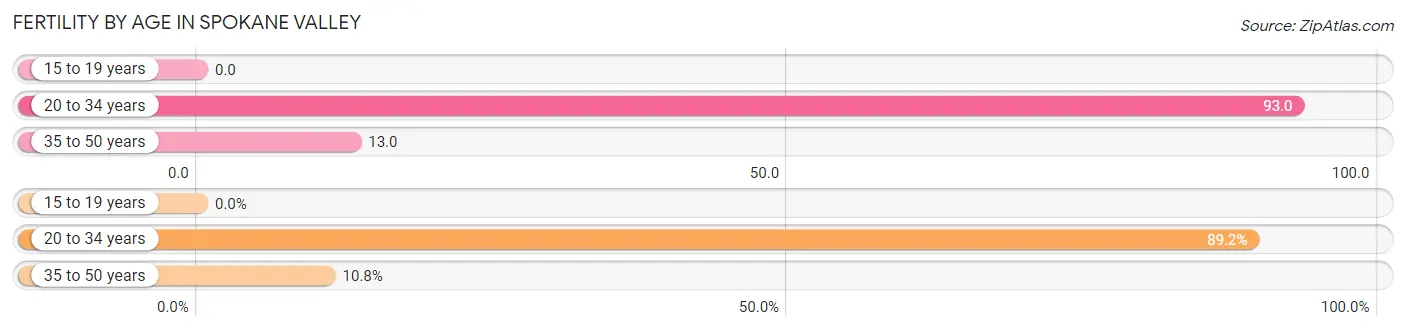
| Age Bracket | Women with Births | Births / 1,000 Women |
| 15 to 19 years | 0 (0.0%) | 0.0 |
| 20 to 34 years | 1,055 (89.2%) | 93.0 |
| 35 to 50 years | 128 (10.8%) | 13.0 |
| Total | 1,183 (100.0%) | 51.0 |
Fertility by Age by Marriage Status in Spokane Valley
75.0% of women with births (1,183) in Spokane Valley are married. The highest percentage of unmarried women with births falls into 35 to 50 years age bracket with 29.7% of them unmarried at the time of birth, while the lowest percentage of unmarried women with births belong to 20 to 34 years age bracket with 24.5% of them unmarried.
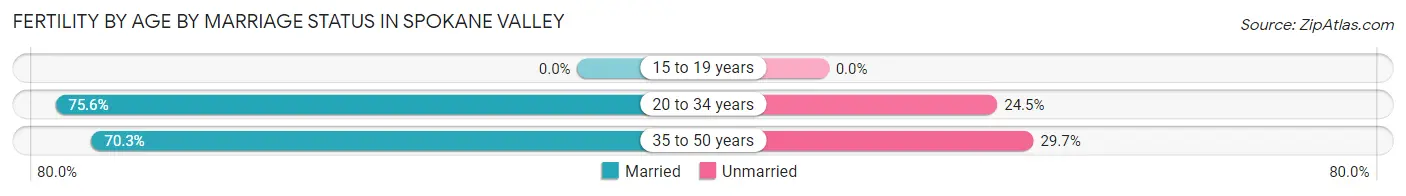
| Age Bracket | Married | Unmarried |
| 15 to 19 years | 0 (0.0%) | 0 (0.0%) |
| 20 to 34 years | 797 (75.5%) | 258 (24.4%) |
| 35 to 50 years | 90 (70.3%) | 38 (29.7%) |
| Total | 887 (75.0%) | 296 (25.0%) |
Fertility by Education in Spokane Valley
Average fertility rate in Spokane Valley is 51.0 births per 1,000 women. Women with the education attainment of high school diploma have the highest fertility rate of 60.0 births per 1,000 women, while women with the education attainment of less than high school have the lowest fertility at 22.0 births per 1,000 women. Women with the education attainment of college or associate's degree represent 42.8% of all women with births.
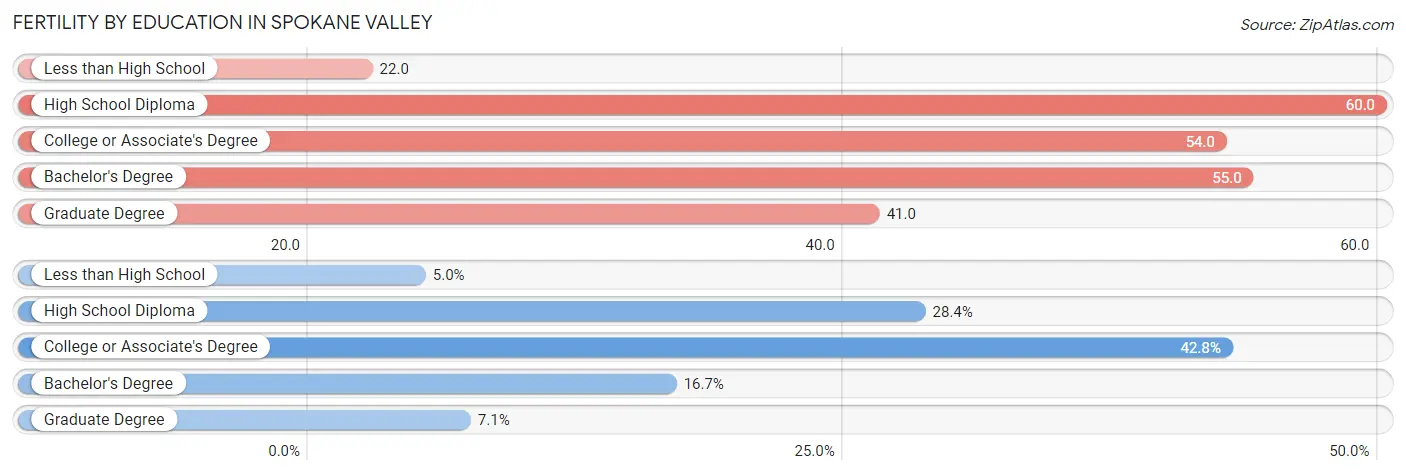
| Educational Attainment | Women with Births | Births / 1,000 Women |
| Less than High School | 59 (5.0%) | 22.0 |
| High School Diploma | 336 (28.4%) | 60.0 |
| College or Associate's Degree | 506 (42.8%) | 54.0 |
| Bachelor's Degree | 198 (16.7%) | 55.0 |
| Graduate Degree | 84 (7.1%) | 41.0 |
| Total | 1,183 (100.0%) | 51.0 |
Fertility by Education by Marriage Status in Spokane Valley
25.0% of women with births in Spokane Valley are unmarried. Women with the educational attainment of bachelor's degree are most likely to be married with 97.5% of them married at childbirth, while women with the educational attainment of less than high school are least likely to be married with 74.6% of them unmarried at childbirth.
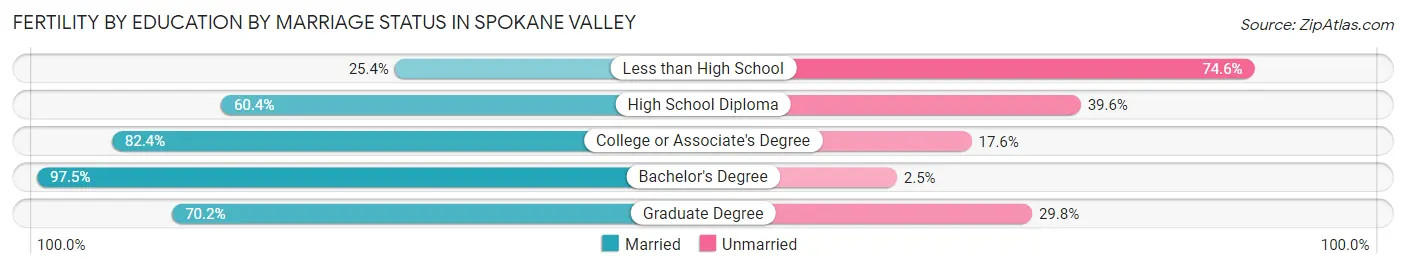
| Educational Attainment | Married | Unmarried |
| Less than High School | 15 (25.4%) | 44 (74.6%) |
| High School Diploma | 203 (60.4%) | 133 (39.6%) |
| College or Associate's Degree | 417 (82.4%) | 89 (17.6%) |
| Bachelor's Degree | 193 (97.5%) | 5 (2.5%) |
| Graduate Degree | 59 (70.2%) | 25 (29.8%) |
| Total | 887 (75.0%) | 296 (25.0%) |
Employment Characteristics in Spokane Valley
Employment by Class of Employer in Spokane Valley
Among the 49,089 employed individuals in Spokane Valley, private company employees (34,270 | 69.8%), not-for-profit organizations (4,737 | 9.7%), and local government employees (2,997 | 6.1%) make up the most common classes of employment.
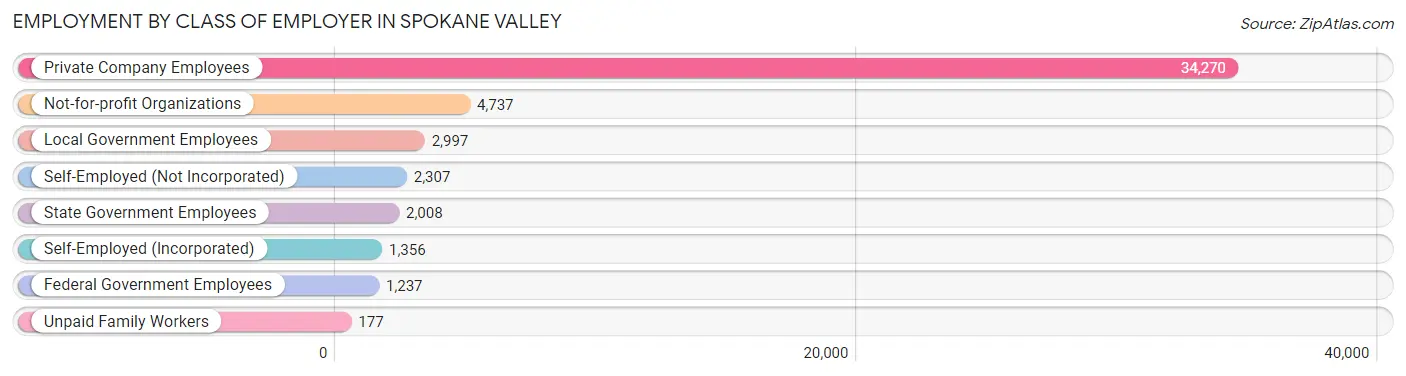
| Employer Class | # Employees | % Employees |
| Private Company Employees | 34,270 | 69.8% |
| Self-Employed (Incorporated) | 1,356 | 2.8% |
| Self-Employed (Not Incorporated) | 2,307 | 4.7% |
| Not-for-profit Organizations | 4,737 | 9.7% |
| Local Government Employees | 2,997 | 6.1% |
| State Government Employees | 2,008 | 4.1% |
| Federal Government Employees | 1,237 | 2.5% |
| Unpaid Family Workers | 177 | 0.4% |
| Total | 49,089 | 100.0% |
Employment Status by Age in Spokane Valley
According to the labor force statistics for Spokane Valley, out of the total population over 16 years of age (83,209), 64.1% or 53,337 individuals are in the labor force, with 5.8% or 3,094 of them unemployed. The age group with the highest labor force participation rate is 30 to 34 years, with 87.3% or 7,565 individuals in the labor force. Within the labor force, the 16 to 19 years age range has the highest percentage of unemployed individuals, with 12.7% or 246 of them being unemployed.
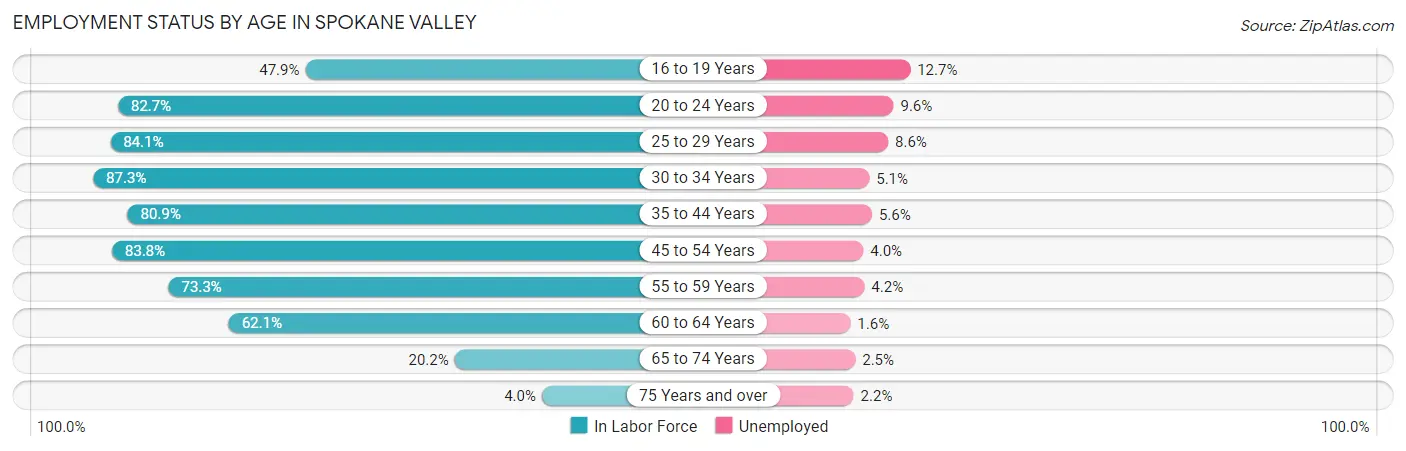
| Age Bracket | In Labor Force | Unemployed |
| 16 to 19 Years | 1,934 (47.9%) | 246 (12.7%) |
| 20 to 24 Years | 5,575 (82.7%) | 535 (9.6%) |
| 25 to 29 Years | 7,107 (84.1%) | 611 (8.6%) |
| 30 to 34 Years | 7,565 (87.3%) | 386 (5.1%) |
| 35 to 44 Years | 10,612 (80.9%) | 594 (5.6%) |
| 45 to 54 Years | 9,957 (83.8%) | 398 (4.0%) |
| 55 to 59 Years | 4,174 (73.3%) | 175 (4.2%) |
| 60 to 64 Years | 4,037 (62.1%) | 65 (1.6%) |
| 65 to 74 Years | 2,074 (20.2%) | 52 (2.5%) |
| 75 Years and over | 314 (4.0%) | 7 (2.2%) |
| Total | 53,337 (64.1%) | 3,094 (5.8%) |
Employment Status by Educational Attainment in Spokane Valley
According to labor force statistics for Spokane Valley, 80.0% of individuals (43,449) out of the total population between 25 and 64 years of age (54,311) are in the labor force, with 5.1% or 2,216 of them being unemployed. The group with the highest labor force participation rate are those with the educational attainment of bachelor's degree or higher, with 84.0% or 11,519 individuals in the labor force. Within the labor force, individuals with less than high school education have the highest percentage of unemployment, with 12.9% or 294 of them being unemployed.
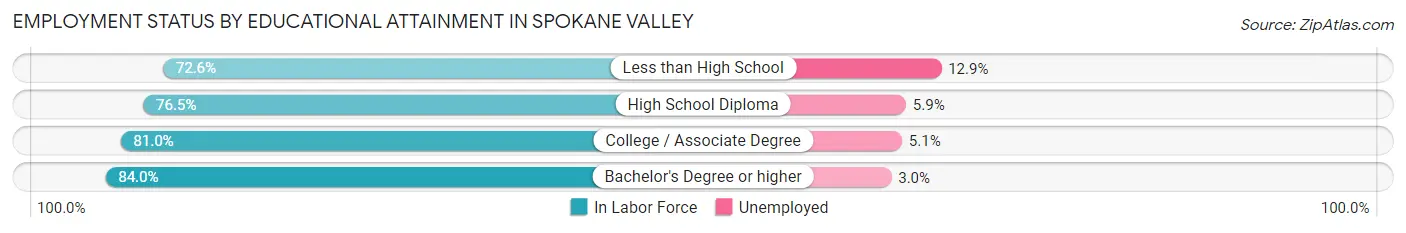
| Educational Attainment | In Labor Force | Unemployed |
| Less than High School | 2,282 (72.6%) | 405 (12.9%) |
| High School Diploma | 11,625 (76.5%) | 897 (5.9%) |
| College / Associate Degree | 18,030 (81.0%) | 1,135 (5.1%) |
| Bachelor's Degree or higher | 11,519 (84.0%) | 411 (3.0%) |
| Total | 43,449 (80.0%) | 2,770 (5.1%) |
Employment Occupations by Sex in Spokane Valley
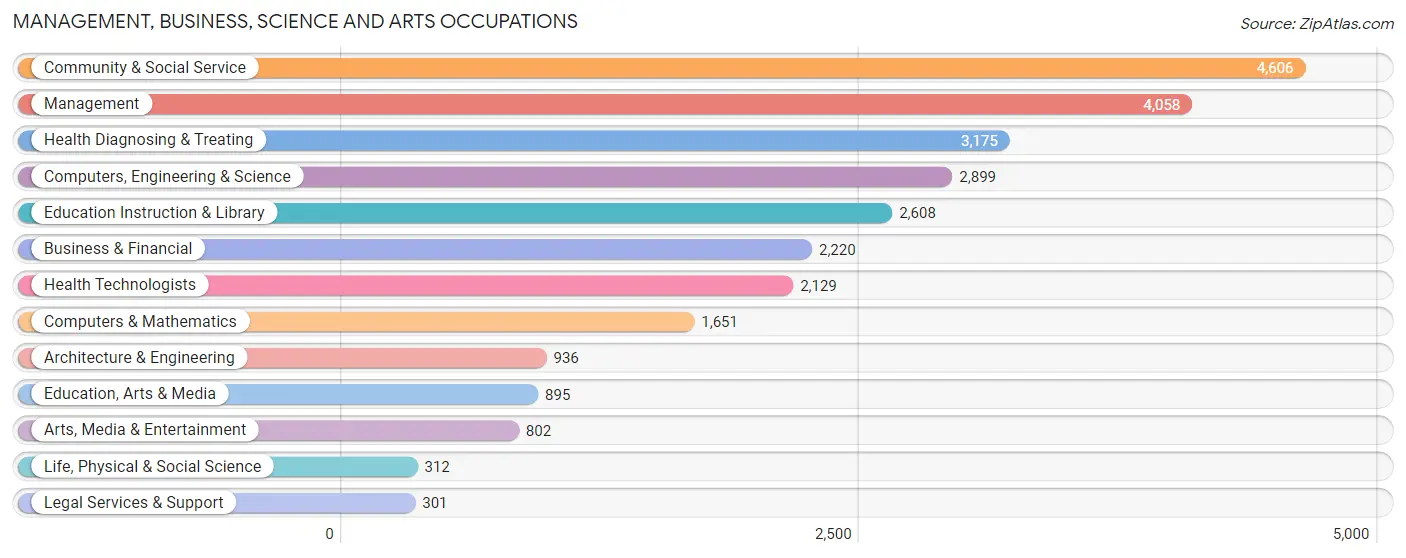
Management, Business, Science and Arts Occupations
The most common Management, Business, Science and Arts occupations in Spokane Valley are Community & Social Service (4,606 | 9.2%), Management (4,058 | 8.1%), Health Diagnosing & Treating (3,175 | 6.3%), Computers, Engineering & Science (2,899 | 5.8%), and Education Instruction & Library (2,608 | 5.2%).
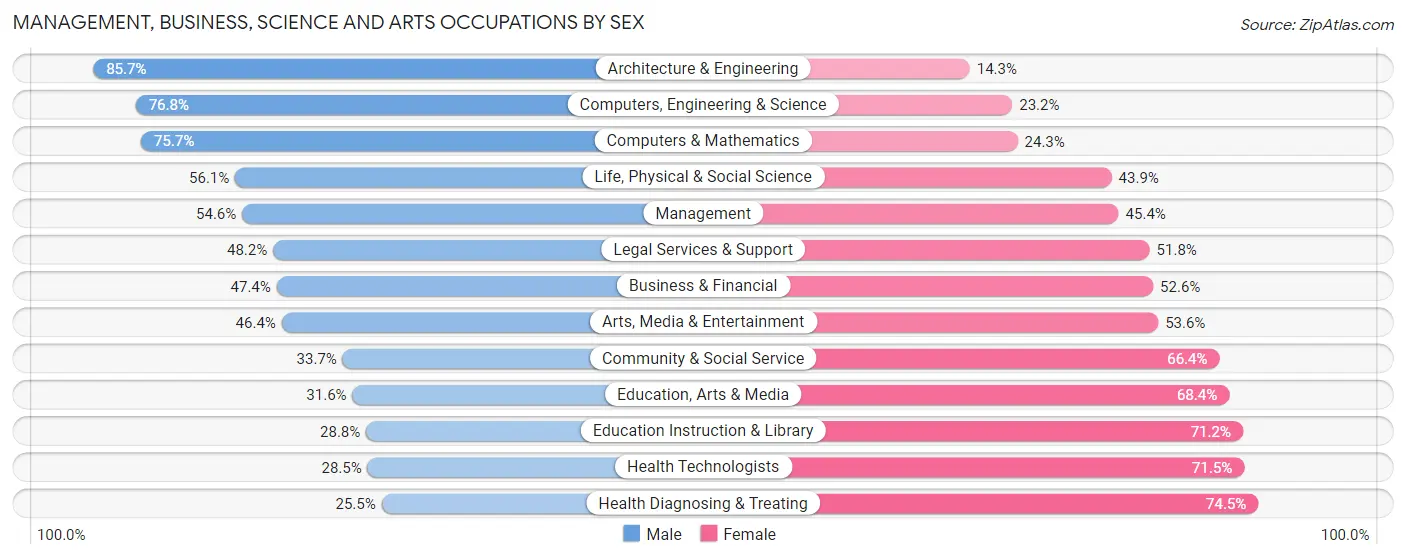
Management, Business, Science and Arts Occupations by Sex
Within the Management, Business, Science and Arts occupations in Spokane Valley, the most male-oriented occupations are Architecture & Engineering (85.7%), Computers, Engineering & Science (76.8%), and Computers & Mathematics (75.7%), while the most female-oriented occupations are Health Diagnosing & Treating (74.5%), Health Technologists (71.5%), and Education Instruction & Library (71.2%).
| Occupation | Male | Female |
| Management | 2,217 (54.6%) | 1,841 (45.4%) |
| Business & Financial | 1,053 (47.4%) | 1,167 (52.6%) |
| Computers, Engineering & Science | 2,227 (76.8%) | 672 (23.2%) |
| Computers & Mathematics | 1,250 (75.7%) | 401 (24.3%) |
| Architecture & Engineering | 802 (85.7%) | 134 (14.3%) |
| Life, Physical & Social Science | 175 (56.1%) | 137 (43.9%) |
| Community & Social Service | 1,550 (33.7%) | 3,056 (66.3%) |
| Education, Arts & Media | 283 (31.6%) | 612 (68.4%) |
| Legal Services & Support | 145 (48.2%) | 156 (51.8%) |
| Education Instruction & Library | 750 (28.8%) | 1,858 (71.2%) |
| Arts, Media & Entertainment | 372 (46.4%) | 430 (53.6%) |
| Health Diagnosing & Treating | 811 (25.5%) | 2,364 (74.5%) |
| Health Technologists | 606 (28.5%) | 1,523 (71.5%) |
| Total (Category) | 7,858 (46.3%) | 9,100 (53.7%) |
| Total (Overall) | 26,980 (53.8%) | 23,123 (46.2%) |
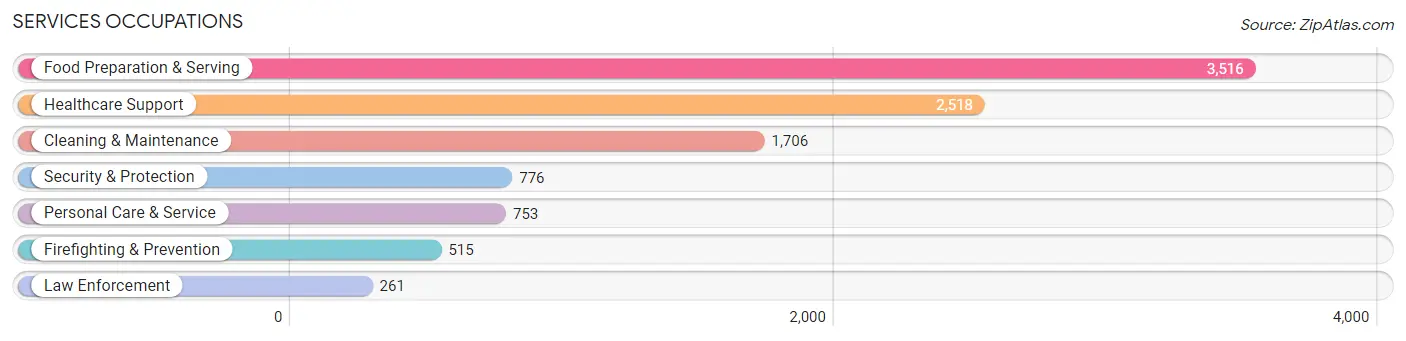
Services Occupations
The most common Services occupations in Spokane Valley are Food Preparation & Serving (3,516 | 7.0%), Healthcare Support (2,518 | 5.0%), Cleaning & Maintenance (1,706 | 3.4%), Security & Protection (776 | 1.5%), and Personal Care & Service (753 | 1.5%).
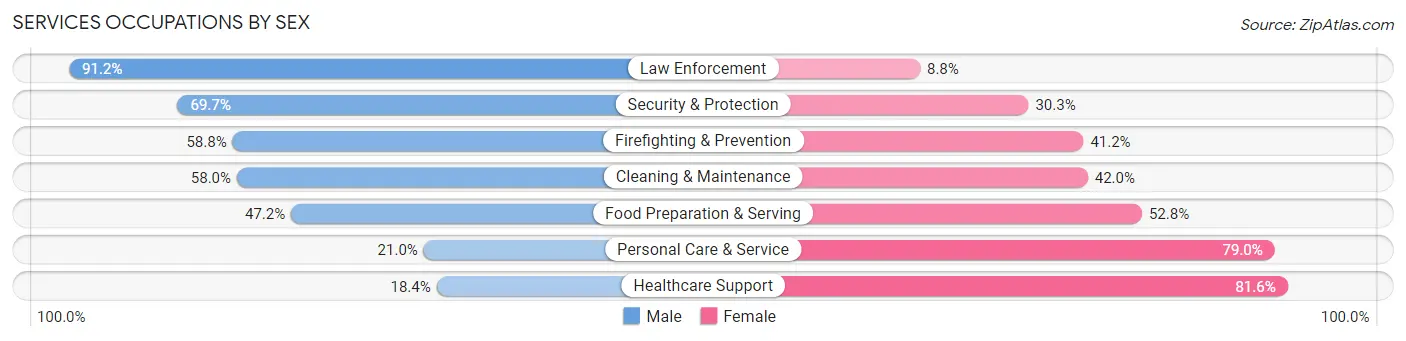
Services Occupations by Sex
Within the Services occupations in Spokane Valley, the most male-oriented occupations are Law Enforcement (91.2%), Security & Protection (69.7%), and Firefighting & Prevention (58.8%), while the most female-oriented occupations are Healthcare Support (81.6%), Personal Care & Service (79.0%), and Food Preparation & Serving (52.8%).
| Occupation | Male | Female |
| Healthcare Support | 464 (18.4%) | 2,054 (81.6%) |
| Security & Protection | 541 (69.7%) | 235 (30.3%) |
| Firefighting & Prevention | 303 (58.8%) | 212 (41.2%) |
| Law Enforcement | 238 (91.2%) | 23 (8.8%) |
| Food Preparation & Serving | 1,661 (47.2%) | 1,855 (52.8%) |
| Cleaning & Maintenance | 989 (58.0%) | 717 (42.0%) |
| Personal Care & Service | 158 (21.0%) | 595 (79.0%) |
| Total (Category) | 3,813 (41.1%) | 5,456 (58.9%) |
| Total (Overall) | 26,980 (53.8%) | 23,123 (46.2%) |
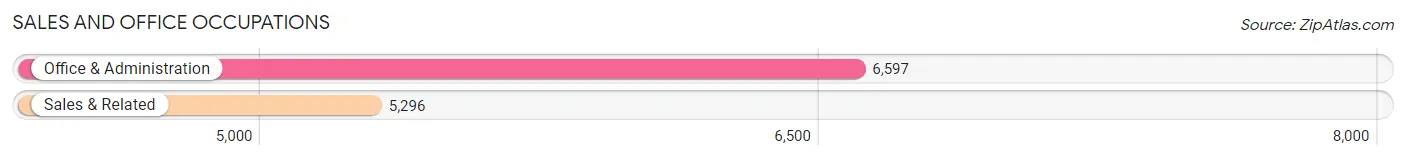
Sales and Office Occupations
The most common Sales and Office occupations in Spokane Valley are Office & Administration (6,597 | 13.2%), and Sales & Related (5,296 | 10.6%).
Sales and Office Occupations by Sex
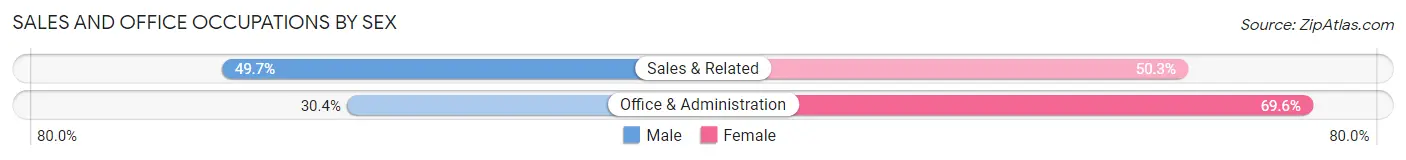
| Occupation | Male | Female |
| Sales & Related | 2,630 (49.7%) | 2,666 (50.3%) |
| Office & Administration | 2,008 (30.4%) | 4,589 (69.6%) |
| Total (Category) | 4,638 (39.0%) | 7,255 (61.0%) |
| Total (Overall) | 26,980 (53.8%) | 23,123 (46.2%) |
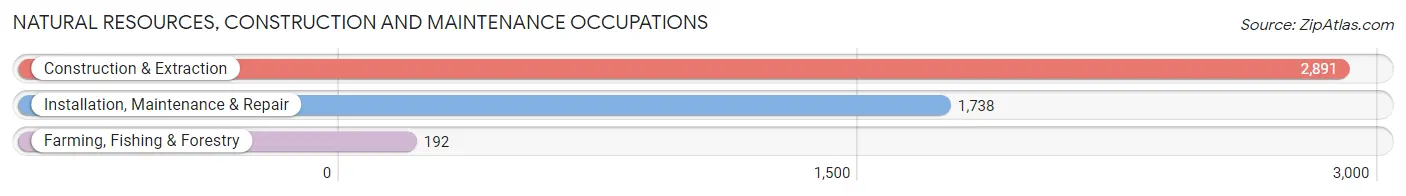
Natural Resources, Construction and Maintenance Occupations
The most common Natural Resources, Construction and Maintenance occupations in Spokane Valley are Construction & Extraction (2,891 | 5.8%), Installation, Maintenance & Repair (1,738 | 3.5%), and Farming, Fishing & Forestry (192 | 0.4%).
Natural Resources, Construction and Maintenance Occupations by Sex
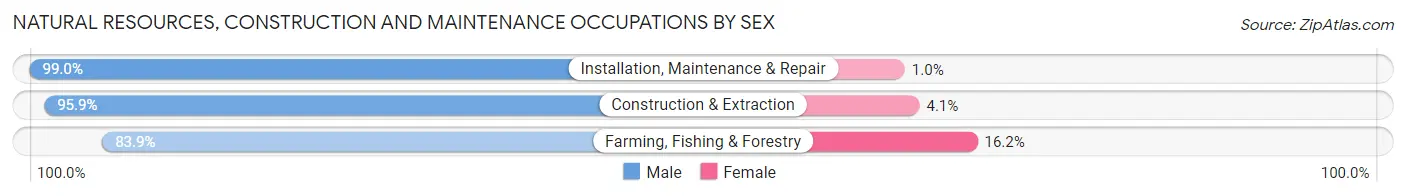
| Occupation | Male | Female |
| Farming, Fishing & Forestry | 161 (83.9%) | 31 (16.2%) |
| Construction & Extraction | 2,773 (95.9%) | 118 (4.1%) |
| Installation, Maintenance & Repair | 1,720 (99.0%) | 18 (1.0%) |
| Total (Category) | 4,654 (96.5%) | 167 (3.5%) |
| Total (Overall) | 26,980 (53.8%) | 23,123 (46.2%) |
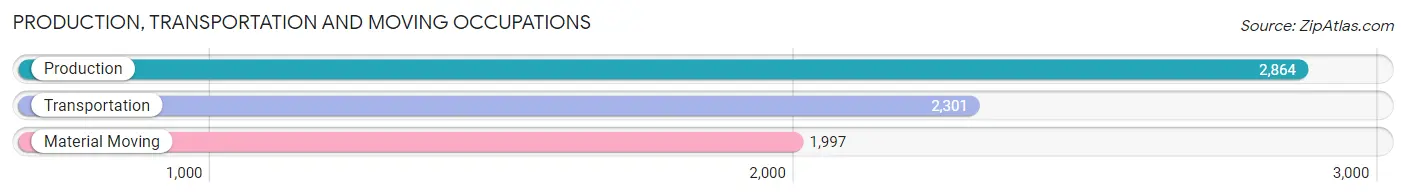
Production, Transportation and Moving Occupations
The most common Production, Transportation and Moving occupations in Spokane Valley are Production (2,864 | 5.7%), Transportation (2,301 | 4.6%), and Material Moving (1,997 | 4.0%).
Production, Transportation and Moving Occupations by Sex
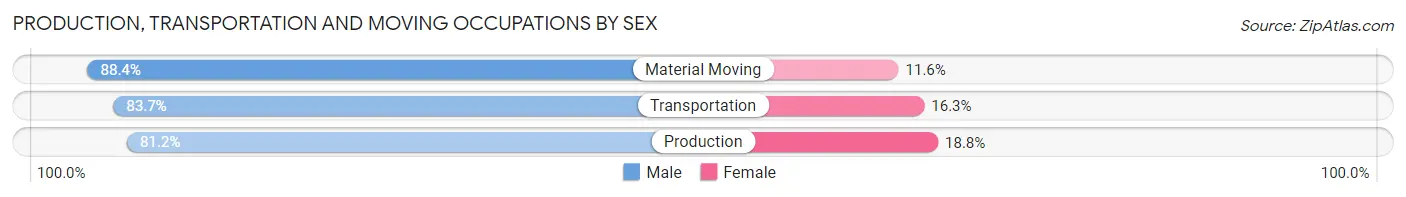
| Occupation | Male | Female |
| Production | 2,325 (81.2%) | 539 (18.8%) |
| Transportation | 1,926 (83.7%) | 375 (16.3%) |
| Material Moving | 1,766 (88.4%) | 231 (11.6%) |
| Total (Category) | 6,017 (84.0%) | 1,145 (16.0%) |
| Total (Overall) | 26,980 (53.8%) | 23,123 (46.2%) |
Employment Industries by Sex in Spokane Valley
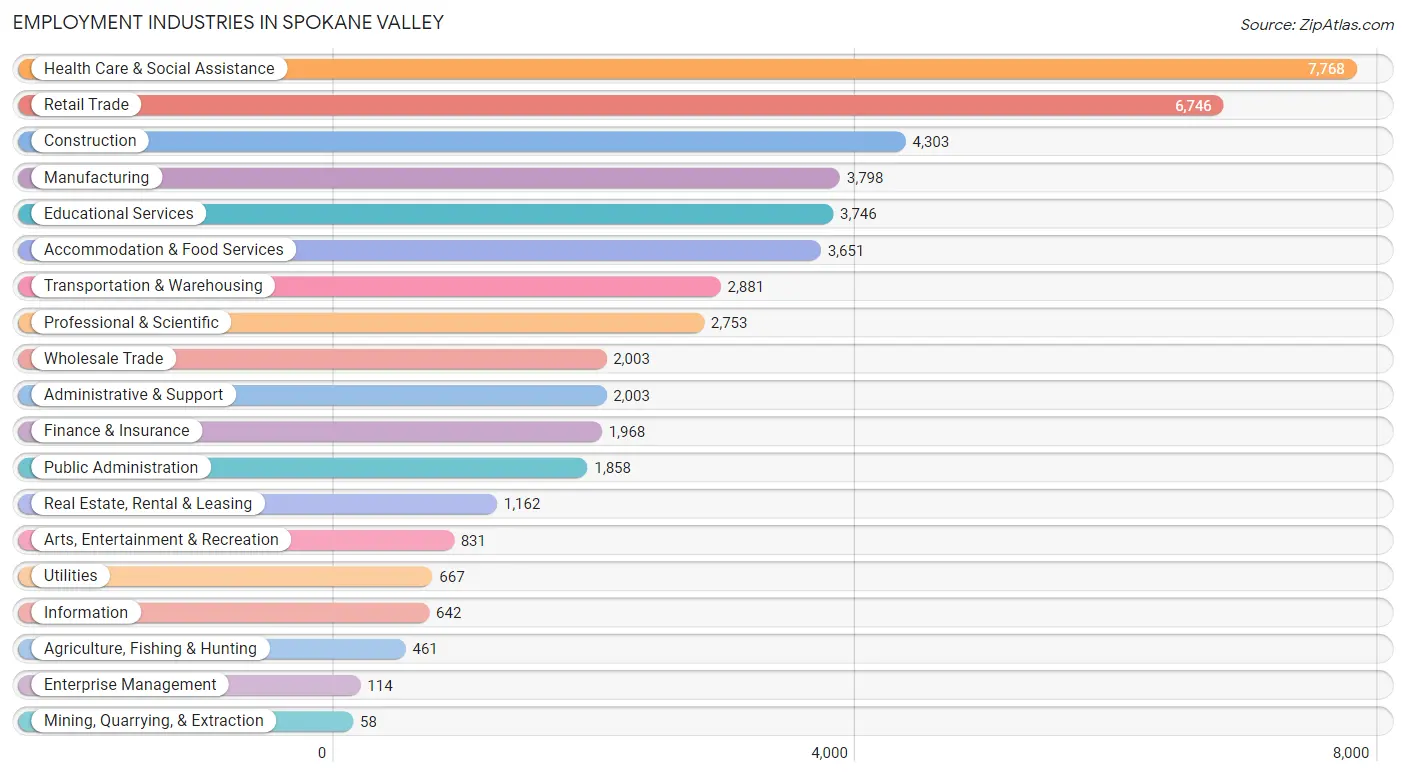
Employment Industries in Spokane Valley
The major employment industries in Spokane Valley include Health Care & Social Assistance (7,768 | 15.5%), Retail Trade (6,746 | 13.5%), Construction (4,303 | 8.6%), Manufacturing (3,798 | 7.6%), and Educational Services (3,746 | 7.5%).
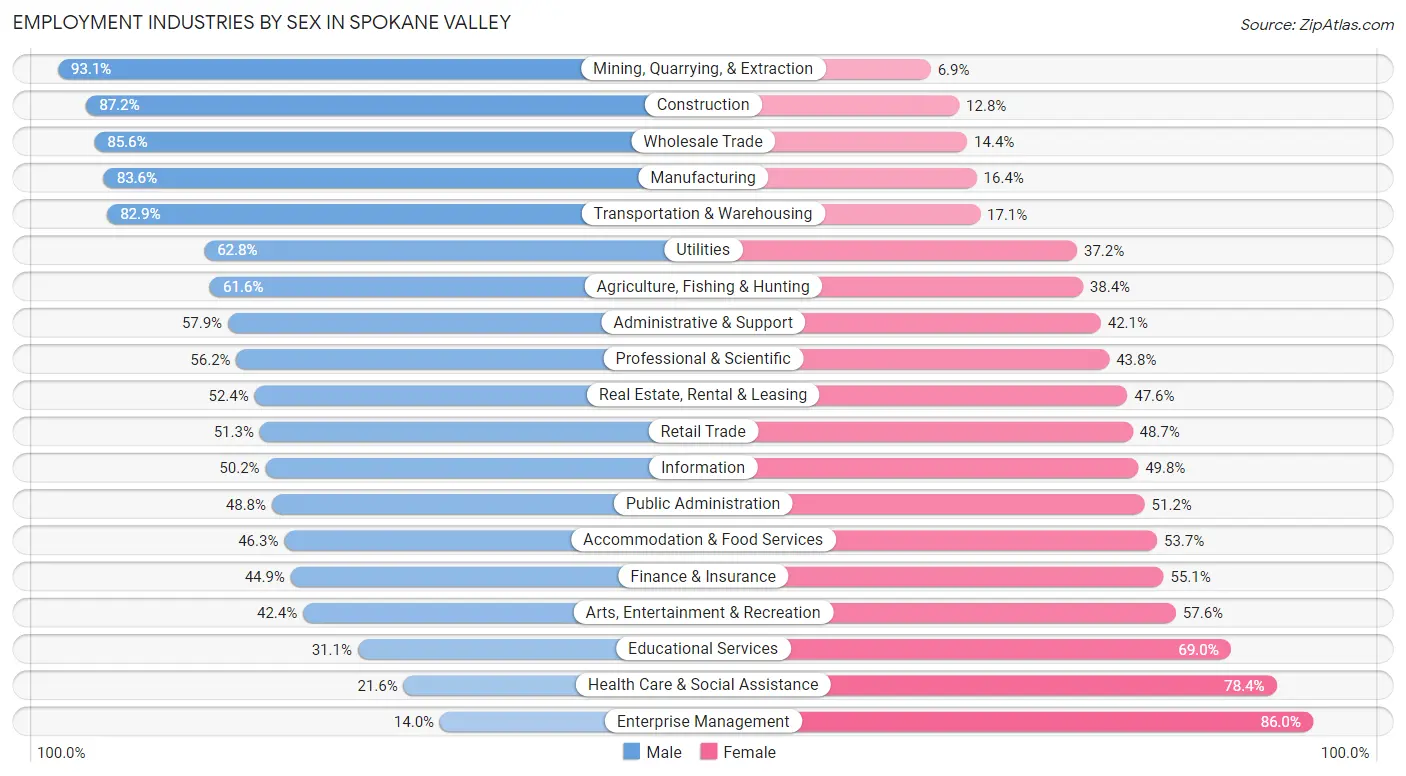
Employment Industries by Sex in Spokane Valley
The Spokane Valley industries that see more men than women are Mining, Quarrying, & Extraction (93.1%), Construction (87.2%), and Wholesale Trade (85.6%), whereas the industries that tend to have a higher number of women are Enterprise Management (86.0%), Health Care & Social Assistance (78.4%), and Educational Services (69.0%).
| Industry | Male | Female |
| Agriculture, Fishing & Hunting | 284 (61.6%) | 177 (38.4%) |
| Mining, Quarrying, & Extraction | 54 (93.1%) | 4 (6.9%) |
| Construction | 3,753 (87.2%) | 550 (12.8%) |
| Manufacturing | 3,175 (83.6%) | 623 (16.4%) |
| Wholesale Trade | 1,714 (85.6%) | 289 (14.4%) |
| Retail Trade | 3,463 (51.3%) | 3,283 (48.7%) |
| Transportation & Warehousing | 2,388 (82.9%) | 493 (17.1%) |
| Utilities | 419 (62.8%) | 248 (37.2%) |
| Information | 322 (50.2%) | 320 (49.8%) |
| Finance & Insurance | 884 (44.9%) | 1,084 (55.1%) |
| Real Estate, Rental & Leasing | 609 (52.4%) | 553 (47.6%) |
| Professional & Scientific | 1,546 (56.2%) | 1,207 (43.8%) |
| Enterprise Management | 16 (14.0%) | 98 (86.0%) |
| Administrative & Support | 1,160 (57.9%) | 843 (42.1%) |
| Educational Services | 1,163 (31.0%) | 2,583 (69.0%) |
| Health Care & Social Assistance | 1,675 (21.6%) | 6,093 (78.4%) |
| Arts, Entertainment & Recreation | 352 (42.4%) | 479 (57.6%) |
| Accommodation & Food Services | 1,689 (46.3%) | 1,962 (53.7%) |
| Public Administration | 907 (48.8%) | 951 (51.2%) |
| Total | 26,980 (53.8%) | 23,123 (46.2%) |
Education in Spokane Valley
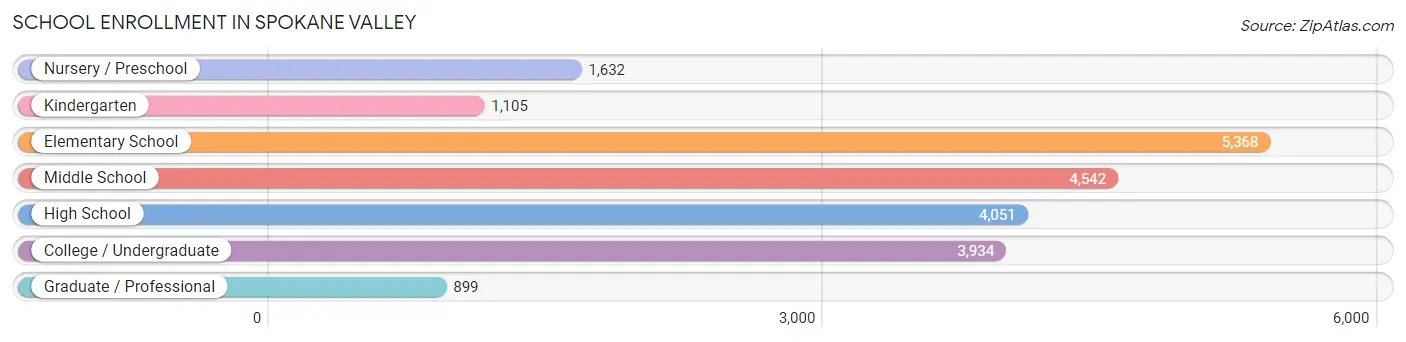
School Enrollment in Spokane Valley
The most common levels of schooling among the 21,531 students in Spokane Valley are elementary school (5,368 | 24.9%), middle school (4,542 | 21.1%), and high school (4,051 | 18.8%).
| School Level | # Students | % Students |
| Nursery / Preschool | 1,632 | 7.6% |
| Kindergarten | 1,105 | 5.1% |
| Elementary School | 5,368 | 24.9% |
| Middle School | 4,542 | 21.1% |
| High School | 4,051 | 18.8% |
| College / Undergraduate | 3,934 | 18.3% |
| Graduate / Professional | 899 | 4.2% |
| Total | 21,531 | 100.0% |
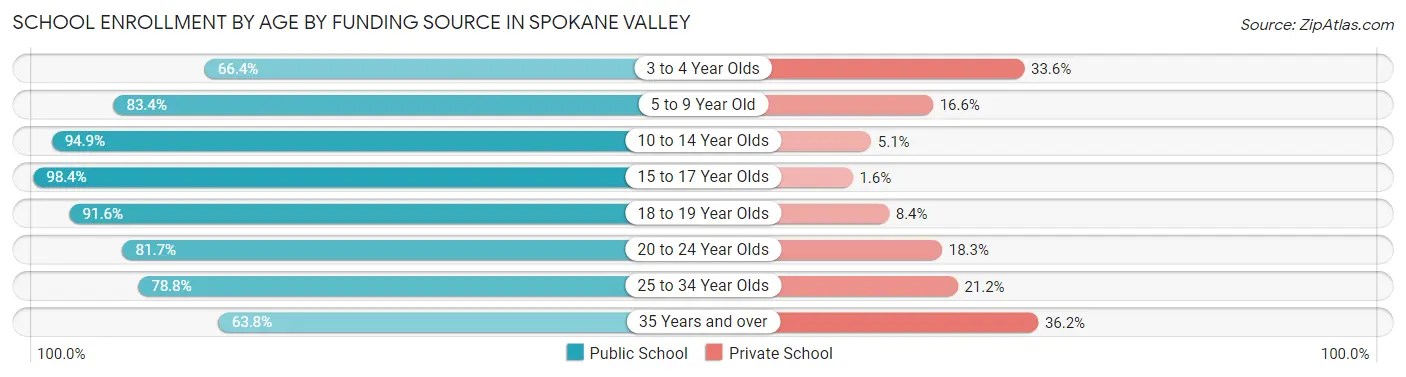
School Enrollment by Age by Funding Source in Spokane Valley
Out of a total of 21,531 students who are enrolled in schools in Spokane Valley, 2,885 (13.4%) attend a private institution, while the remaining 18,646 (86.6%) are enrolled in public schools. The age group of 35 years and over has the highest likelihood of being enrolled in private schools, with 338 (36.2% in the age bracket) enrolled. Conversely, the age group of 15 to 17 year olds has the lowest likelihood of being enrolled in a private school, with 3,058 (98.4% in the age bracket) attending a public institution.
| Age Bracket | Public School | Private School |
| 3 to 4 Year Olds | 781 (66.4%) | 395 (33.6%) |
| 5 to 9 Year Old | 5,266 (83.4%) | 1,047 (16.6%) |
| 10 to 14 Year Olds | 5,215 (94.9%) | 278 (5.1%) |
| 15 to 17 Year Olds | 3,058 (98.4%) | 51 (1.6%) |
| 18 to 19 Year Olds | 960 (91.6%) | 88 (8.4%) |
| 20 to 24 Year Olds | 1,476 (81.7%) | 330 (18.3%) |
| 25 to 34 Year Olds | 1,302 (78.8%) | 350 (21.2%) |
| 35 Years and over | 596 (63.8%) | 338 (36.2%) |
| Total | 18,646 (86.6%) | 2,885 (13.4%) |
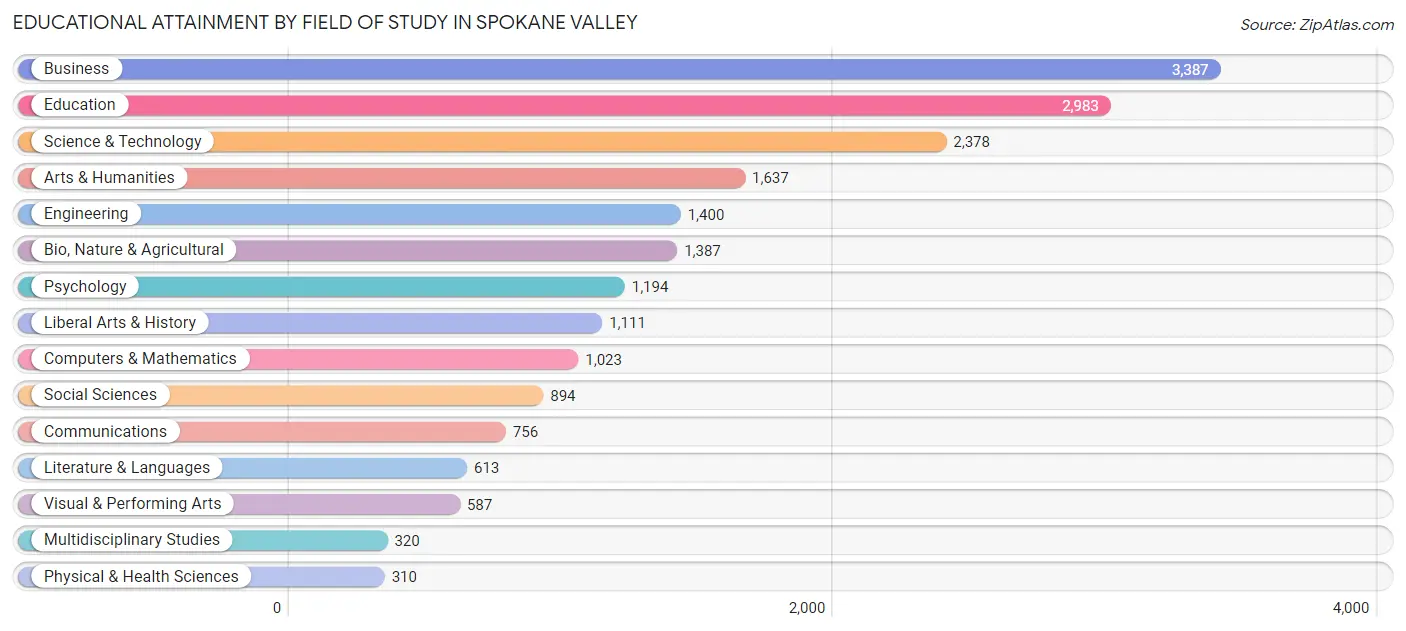
Educational Attainment by Field of Study in Spokane Valley
Business (3,387 | 17.0%), education (2,983 | 14.9%), science & technology (2,378 | 11.9%), arts & humanities (1,637 | 8.2%), and engineering (1,400 | 7.0%) are the most common fields of study among 19,980 individuals in Spokane Valley who have obtained a bachelor's degree or higher.
| Field of Study | # Graduates | % Graduates |
| Computers & Mathematics | 1,023 | 5.1% |
| Bio, Nature & Agricultural | 1,387 | 6.9% |
| Physical & Health Sciences | 310 | 1.5% |
| Psychology | 1,194 | 6.0% |
| Social Sciences | 894 | 4.5% |
| Engineering | 1,400 | 7.0% |
| Multidisciplinary Studies | 320 | 1.6% |
| Science & Technology | 2,378 | 11.9% |
| Business | 3,387 | 17.0% |
| Education | 2,983 | 14.9% |
| Literature & Languages | 613 | 3.1% |
| Liberal Arts & History | 1,111 | 5.6% |
| Visual & Performing Arts | 587 | 2.9% |
| Communications | 756 | 3.8% |
| Arts & Humanities | 1,637 | 8.2% |
| Total | 19,980 | 100.0% |
Transportation & Commute in Spokane Valley
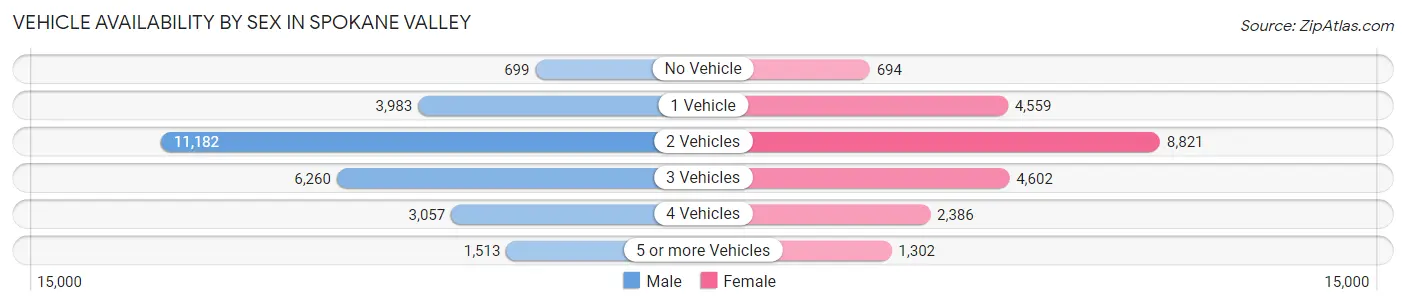
Vehicle Availability by Sex in Spokane Valley
The most prevalent vehicle ownership categories in Spokane Valley are males with 2 vehicles (11,182, accounting for 41.9%) and females with 2 vehicles (8,821, making up 50.0%).
| Vehicles Available | Male | Female |
| No Vehicle | 699 (2.6%) | 694 (3.1%) |
| 1 Vehicle | 3,983 (14.9%) | 4,559 (20.4%) |
| 2 Vehicles | 11,182 (41.9%) | 8,821 (39.4%) |
| 3 Vehicles | 6,260 (23.4%) | 4,602 (20.6%) |
| 4 Vehicles | 3,057 (11.5%) | 2,386 (10.7%) |
| 5 or more Vehicles | 1,513 (5.7%) | 1,302 (5.8%) |
| Total | 26,694 (100.0%) | 22,364 (100.0%) |
Commute Time in Spokane Valley
The most frequently occuring commute durations in Spokane Valley are 15 to 19 minutes (9,761 commuters, 22.2%), 20 to 24 minutes (8,272 commuters, 18.8%), and 10 to 14 minutes (6,800 commuters, 15.5%).

| Commute Time | # Commuters | % Commuters |
| Less than 5 Minutes | 920 | 2.1% |
| 5 to 9 Minutes | 5,163 | 11.7% |
| 10 to 14 Minutes | 6,800 | 15.5% |
| 15 to 19 Minutes | 9,761 | 22.2% |
| 20 to 24 Minutes | 8,272 | 18.8% |
| 25 to 29 Minutes | 3,578 | 8.1% |
| 30 to 34 Minutes | 5,688 | 12.9% |
| 35 to 39 Minutes | 685 | 1.6% |
| 40 to 44 Minutes | 790 | 1.8% |
| 45 to 59 Minutes | 1,038 | 2.4% |
| 60 to 89 Minutes | 767 | 1.7% |
| 90 or more Minutes | 510 | 1.2% |
Commute Time by Sex in Spokane Valley
The most common commute times in Spokane Valley are 15 to 19 minutes (5,442 commuters, 22.4%) for males and 15 to 19 minutes (4,319 commuters, 21.9%) for females.
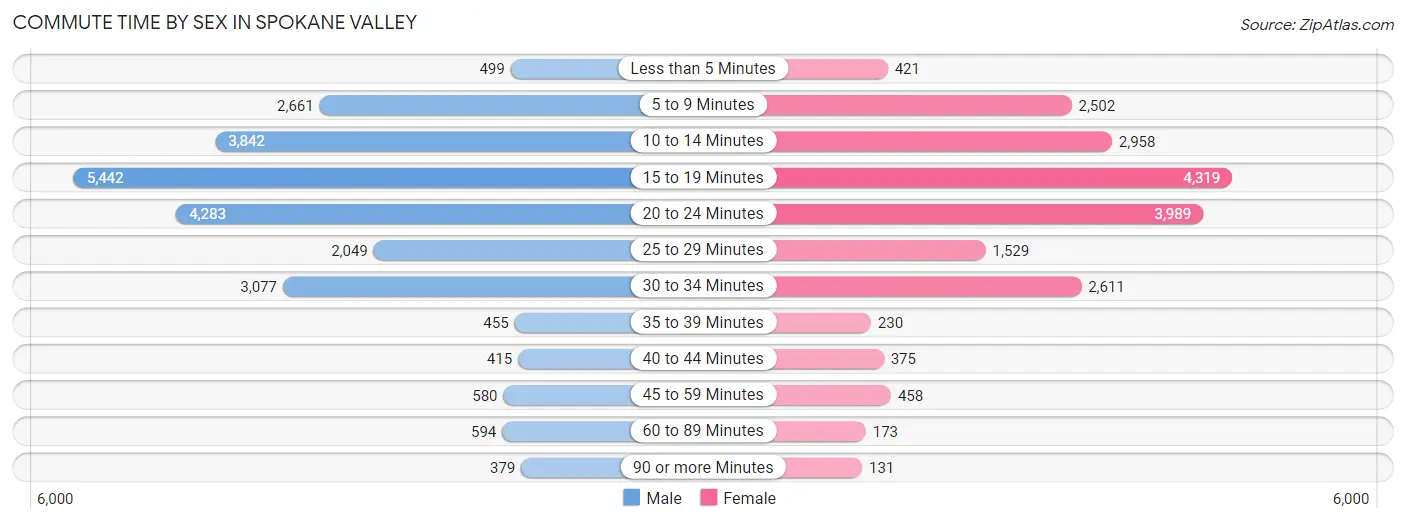
| Commute Time | Male | Female |
| Less than 5 Minutes | 499 (2.1%) | 421 (2.1%) |
| 5 to 9 Minutes | 2,661 (11.0%) | 2,502 (12.7%) |
| 10 to 14 Minutes | 3,842 (15.8%) | 2,958 (15.0%) |
| 15 to 19 Minutes | 5,442 (22.4%) | 4,319 (21.9%) |
| 20 to 24 Minutes | 4,283 (17.6%) | 3,989 (20.3%) |
| 25 to 29 Minutes | 2,049 (8.4%) | 1,529 (7.8%) |
| 30 to 34 Minutes | 3,077 (12.7%) | 2,611 (13.3%) |
| 35 to 39 Minutes | 455 (1.9%) | 230 (1.2%) |
| 40 to 44 Minutes | 415 (1.7%) | 375 (1.9%) |
| 45 to 59 Minutes | 580 (2.4%) | 458 (2.3%) |
| 60 to 89 Minutes | 594 (2.5%) | 173 (0.9%) |
| 90 or more Minutes | 379 (1.6%) | 131 (0.7%) |
Time of Departure to Work by Sex in Spokane Valley
The most frequent times of departure to work in Spokane Valley are 7:00 AM to 7:29 AM (3,733, 15.4%) for males and 7:00 AM to 7:29 AM (3,315, 16.8%) for females.
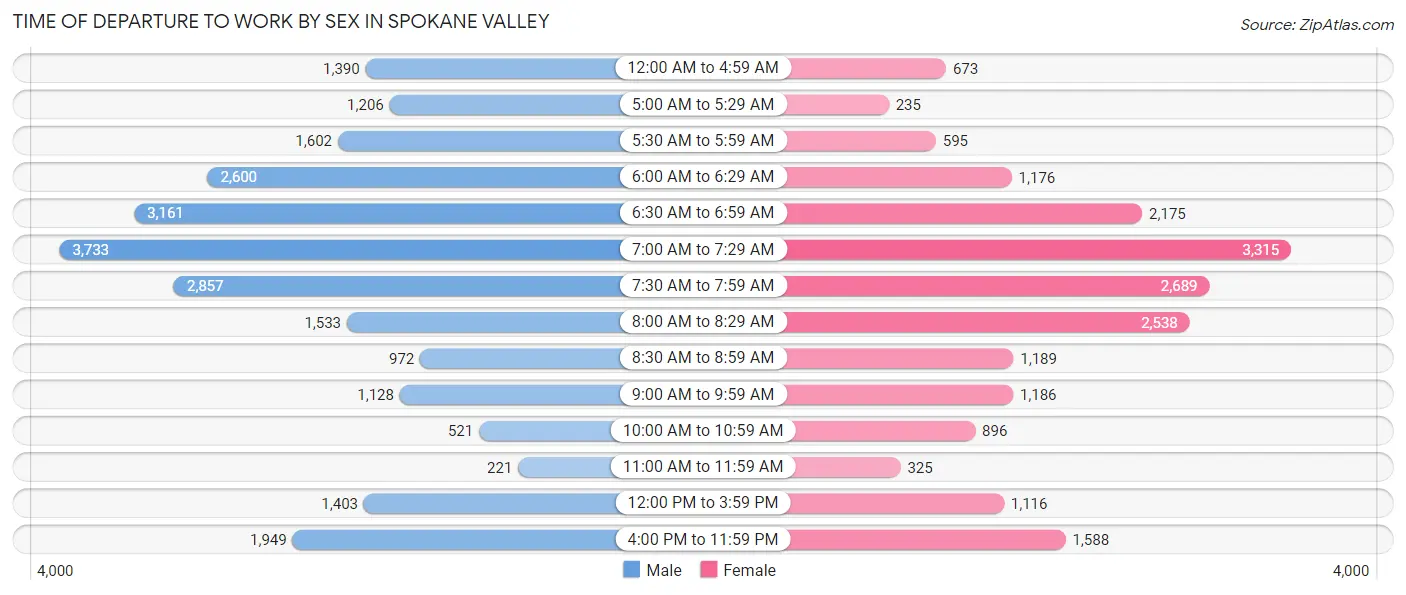
| Time of Departure | Male | Female |
| 12:00 AM to 4:59 AM | 1,390 (5.7%) | 673 (3.4%) |
| 5:00 AM to 5:29 AM | 1,206 (5.0%) | 235 (1.2%) |
| 5:30 AM to 5:59 AM | 1,602 (6.6%) | 595 (3.0%) |
| 6:00 AM to 6:29 AM | 2,600 (10.7%) | 1,176 (6.0%) |
| 6:30 AM to 6:59 AM | 3,161 (13.0%) | 2,175 (11.0%) |
| 7:00 AM to 7:29 AM | 3,733 (15.4%) | 3,315 (16.8%) |
| 7:30 AM to 7:59 AM | 2,857 (11.8%) | 2,689 (13.7%) |
| 8:00 AM to 8:29 AM | 1,533 (6.3%) | 2,538 (12.9%) |
| 8:30 AM to 8:59 AM | 972 (4.0%) | 1,189 (6.0%) |
| 9:00 AM to 9:59 AM | 1,128 (4.6%) | 1,186 (6.0%) |
| 10:00 AM to 10:59 AM | 521 (2.1%) | 896 (4.5%) |
| 11:00 AM to 11:59 AM | 221 (0.9%) | 325 (1.7%) |
| 12:00 PM to 3:59 PM | 1,403 (5.8%) | 1,116 (5.7%) |
| 4:00 PM to 11:59 PM | 1,949 (8.0%) | 1,588 (8.1%) |
| Total | 24,276 (100.0%) | 19,696 (100.0%) |
Housing Occupancy in Spokane Valley
Occupancy by Ownership in Spokane Valley
Of the total 41,984 dwellings in Spokane Valley, owner-occupied units account for 24,239 (57.7%), while renter-occupied units make up 17,745 (42.3%).
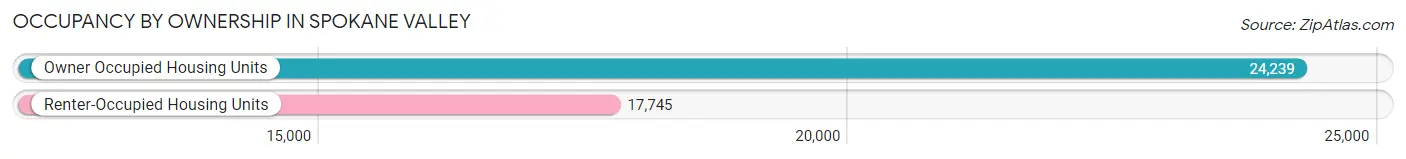
| Occupancy | # Housing Units | % Housing Units |
| Owner Occupied Housing Units | 24,239 | 57.7% |
| Renter-Occupied Housing Units | 17,745 | 42.3% |
| Total Occupied Housing Units | 41,984 | 100.0% |
Occupancy by Household Size in Spokane Valley
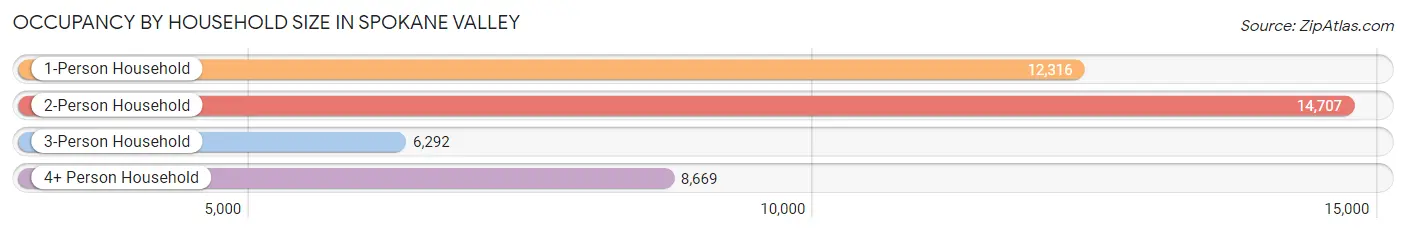
| Household Size | # Housing Units | % Housing Units |
| 1-Person Household | 12,316 | 29.3% |
| 2-Person Household | 14,707 | 35.0% |
| 3-Person Household | 6,292 | 15.0% |
| 4+ Person Household | 8,669 | 20.6% |
| Total Housing Units | 41,984 | 100.0% |
Occupancy by Ownership by Household Size in Spokane Valley
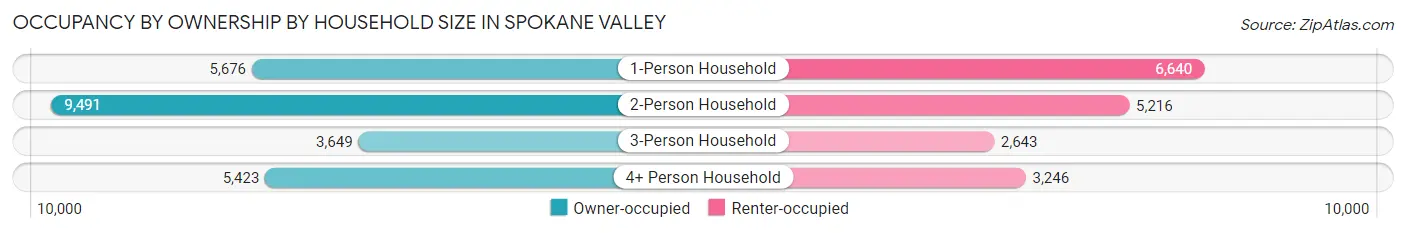
| Household Size | Owner-occupied | Renter-occupied |
| 1-Person Household | 5,676 (46.1%) | 6,640 (53.9%) |
| 2-Person Household | 9,491 (64.5%) | 5,216 (35.5%) |
| 3-Person Household | 3,649 (58.0%) | 2,643 (42.0%) |
| 4+ Person Household | 5,423 (62.6%) | 3,246 (37.4%) |
| Total Housing Units | 24,239 (57.7%) | 17,745 (42.3%) |
Occupancy by Educational Attainment in Spokane Valley
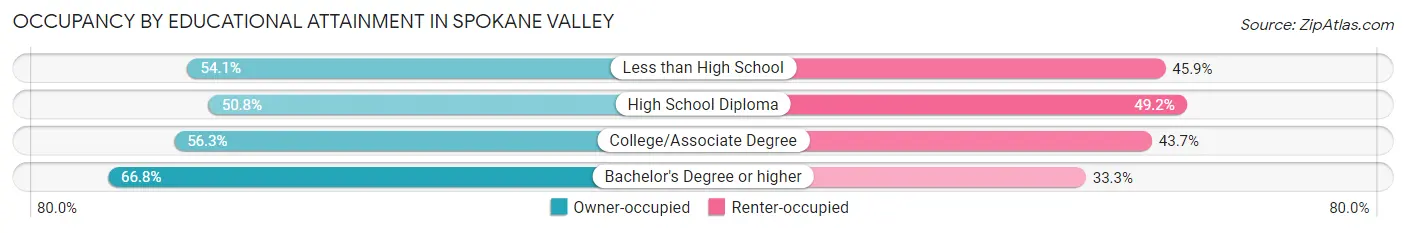
| Household Size | Owner-occupied | Renter-occupied |
| Less than High School | 1,055 (54.1%) | 894 (45.9%) |
| High School Diploma | 5,424 (50.8%) | 5,257 (49.2%) |
| College/Associate Degree | 9,840 (56.3%) | 7,648 (43.7%) |
| Bachelor's Degree or higher | 7,920 (66.7%) | 3,946 (33.3%) |
Occupancy by Age of Householder in Spokane Valley
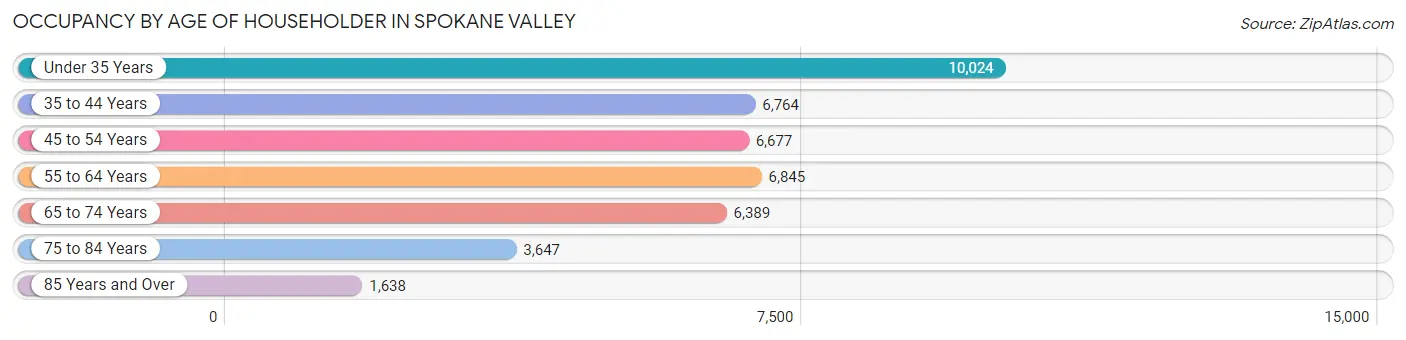
| Age Bracket | # Households | % Households |
| Under 35 Years | 10,024 | 23.9% |
| 35 to 44 Years | 6,764 | 16.1% |
| 45 to 54 Years | 6,677 | 15.9% |
| 55 to 64 Years | 6,845 | 16.3% |
| 65 to 74 Years | 6,389 | 15.2% |
| 75 to 84 Years | 3,647 | 8.7% |
| 85 Years and Over | 1,638 | 3.9% |
| Total | 41,984 | 100.0% |
Housing Finances in Spokane Valley
Median Income by Occupancy in Spokane Valley
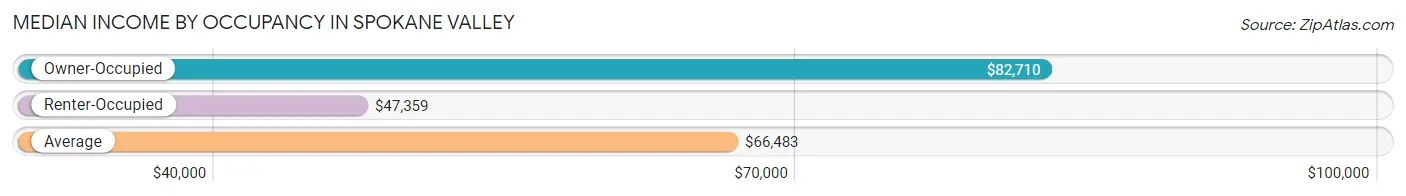
| Occupancy Type | # Households | Median Income |
| Owner-Occupied | 24,239 (57.7%) | $82,710 |
| Renter-Occupied | 17,745 (42.3%) | $47,359 |
| Average | 41,984 (100.0%) | $66,483 |
Occupancy by Householder Income Bracket in Spokane Valley
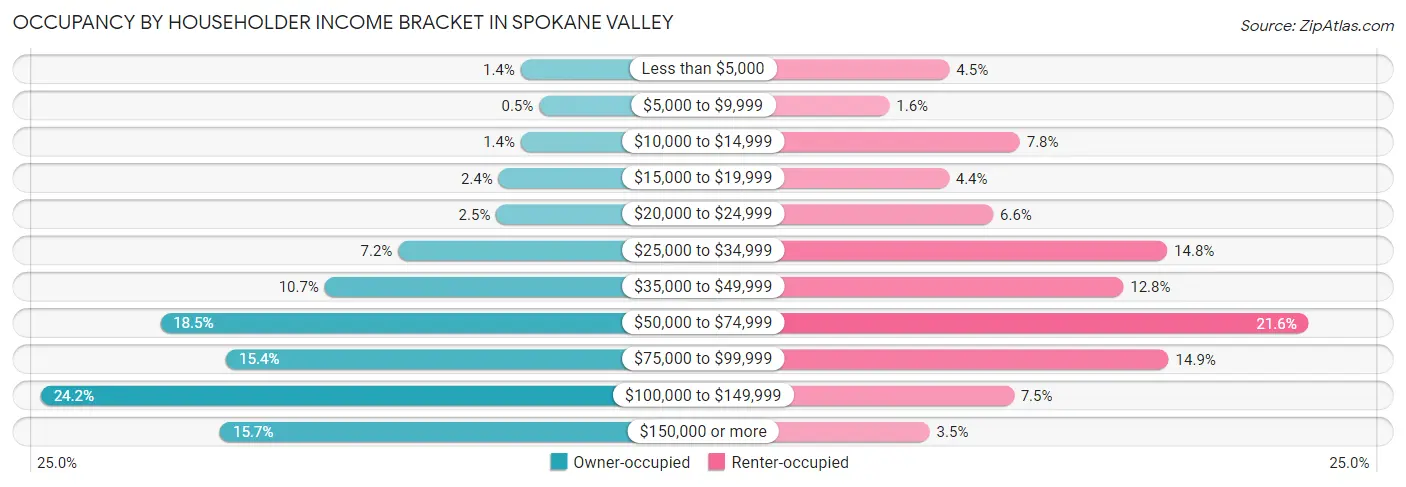
| Income Bracket | Owner-occupied | Renter-occupied |
| Less than $5,000 | 334 (1.4%) | 793 (4.5%) |
| $5,000 to $9,999 | 122 (0.5%) | 286 (1.6%) |
| $10,000 to $14,999 | 333 (1.4%) | 1,387 (7.8%) |
| $15,000 to $19,999 | 589 (2.4%) | 787 (4.4%) |
| $20,000 to $24,999 | 615 (2.5%) | 1,162 (6.6%) |
| $25,000 to $34,999 | 1,747 (7.2%) | 2,633 (14.8%) |
| $35,000 to $49,999 | 2,597 (10.7%) | 2,263 (12.8%) |
| $50,000 to $74,999 | 4,493 (18.5%) | 3,827 (21.6%) |
| $75,000 to $99,999 | 3,733 (15.4%) | 2,645 (14.9%) |
| $100,000 to $149,999 | 5,873 (24.2%) | 1,336 (7.5%) |
| $150,000 or more | 3,803 (15.7%) | 626 (3.5%) |
| Total | 24,239 (100.0%) | 17,745 (100.0%) |
Monthly Housing Cost Tiers in Spokane Valley
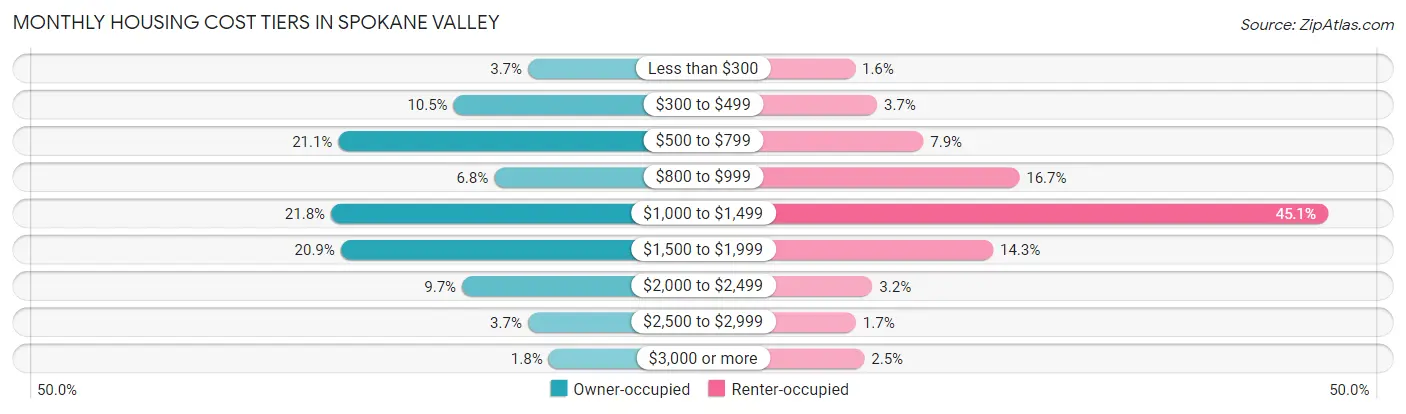
| Monthly Cost | Owner-occupied | Renter-occupied |
| Less than $300 | 889 (3.7%) | 287 (1.6%) |
| $300 to $499 | 2,551 (10.5%) | 647 (3.6%) |
| $500 to $799 | 5,122 (21.1%) | 1,404 (7.9%) |
| $800 to $999 | 1,643 (6.8%) | 2,971 (16.7%) |
| $1,000 to $1,499 | 5,284 (21.8%) | 8,010 (45.1%) |
| $1,500 to $1,999 | 5,068 (20.9%) | 2,543 (14.3%) |
| $2,000 to $2,499 | 2,361 (9.7%) | 571 (3.2%) |
| $2,500 to $2,999 | 893 (3.7%) | 301 (1.7%) |
| $3,000 or more | 428 (1.8%) | 440 (2.5%) |
| Total | 24,239 (100.0%) | 17,745 (100.0%) |
Physical Housing Characteristics in Spokane Valley
Housing Structures in Spokane Valley
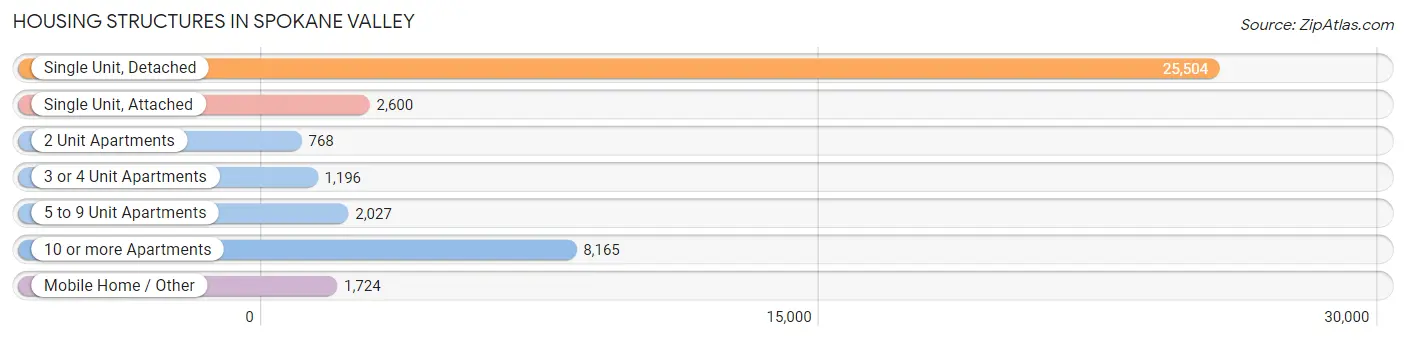
| Structure Type | # Housing Units | % Housing Units |
| Single Unit, Detached | 25,504 | 60.8% |
| Single Unit, Attached | 2,600 | 6.2% |
| 2 Unit Apartments | 768 | 1.8% |
| 3 or 4 Unit Apartments | 1,196 | 2.9% |
| 5 to 9 Unit Apartments | 2,027 | 4.8% |
| 10 or more Apartments | 8,165 | 19.5% |
| Mobile Home / Other | 1,724 | 4.1% |
| Total | 41,984 | 100.0% |
Housing Structures by Occupancy in Spokane Valley
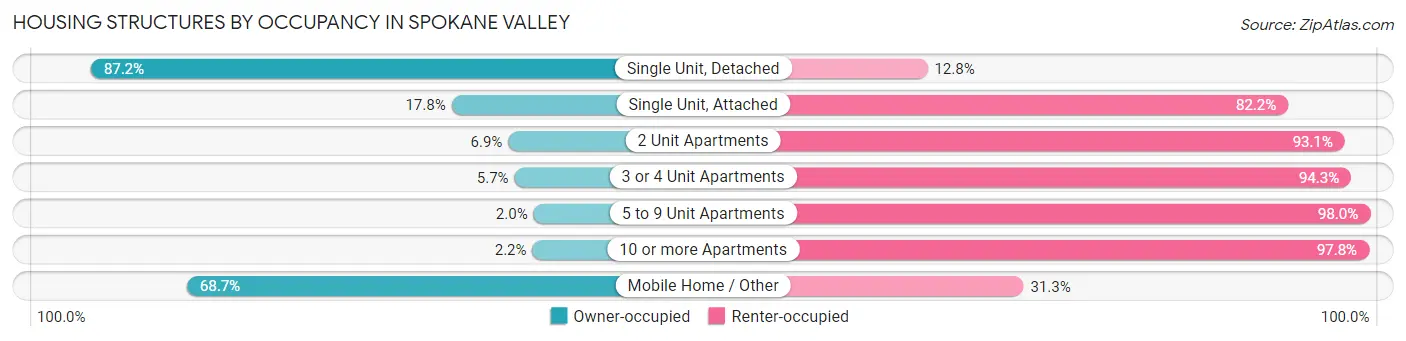
| Structure Type | Owner-occupied | Renter-occupied |
| Single Unit, Detached | 22,246 (87.2%) | 3,258 (12.8%) |
| Single Unit, Attached | 463 (17.8%) | 2,137 (82.2%) |
| 2 Unit Apartments | 53 (6.9%) | 715 (93.1%) |
| 3 or 4 Unit Apartments | 68 (5.7%) | 1,128 (94.3%) |
| 5 to 9 Unit Apartments | 41 (2.0%) | 1,986 (98.0%) |
| 10 or more Apartments | 183 (2.2%) | 7,982 (97.8%) |
| Mobile Home / Other | 1,185 (68.7%) | 539 (31.3%) |
| Total | 24,239 (57.7%) | 17,745 (42.3%) |
Housing Structures by Number of Rooms in Spokane Valley
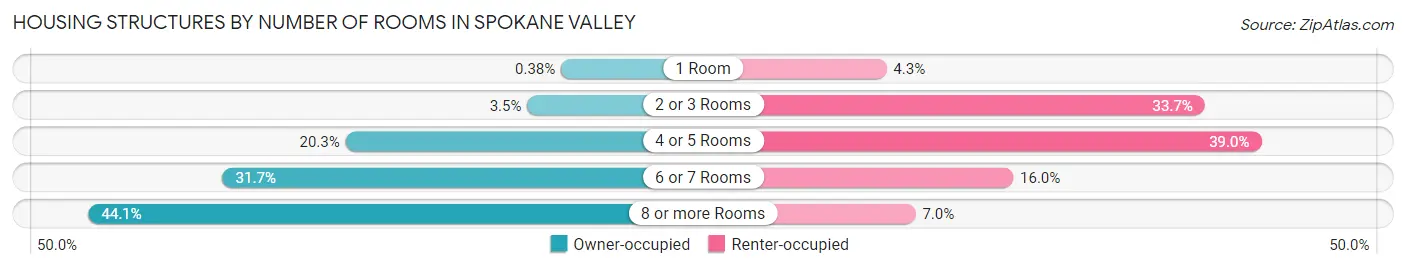
| Number of Rooms | Owner-occupied | Renter-occupied |
| 1 Room | 92 (0.4%) | 763 (4.3%) |
| 2 or 3 Rooms | 852 (3.5%) | 5,985 (33.7%) |
| 4 or 5 Rooms | 4,926 (20.3%) | 6,913 (39.0%) |
| 6 or 7 Rooms | 7,680 (31.7%) | 2,843 (16.0%) |
| 8 or more Rooms | 10,689 (44.1%) | 1,241 (7.0%) |
| Total | 24,239 (100.0%) | 17,745 (100.0%) |
Housing Structure by Heating Type in Spokane Valley
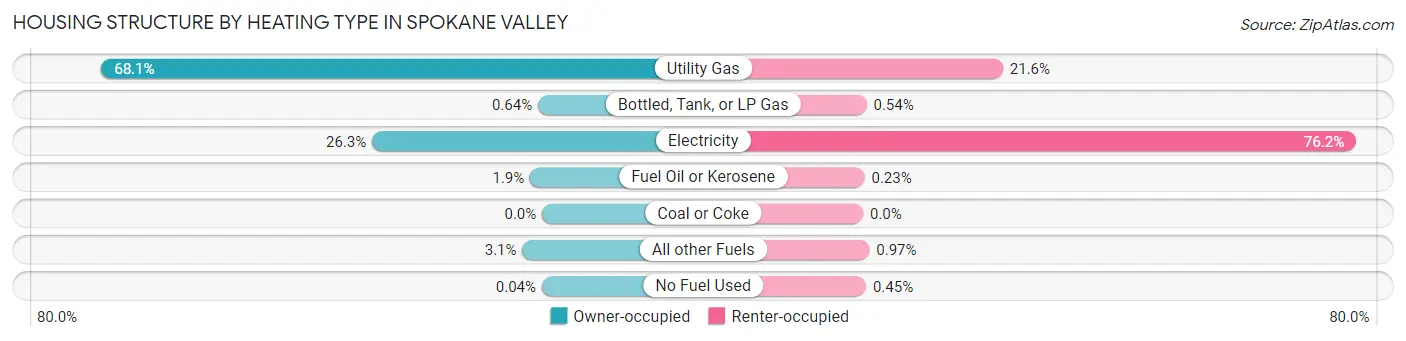
| Heating Type | Owner-occupied | Renter-occupied |
| Utility Gas | 16,517 (68.1%) | 3,834 (21.6%) |
| Bottled, Tank, or LP Gas | 155 (0.6%) | 95 (0.5%) |
| Electricity | 6,370 (26.3%) | 13,524 (76.2%) |
| Fuel Oil or Kerosene | 448 (1.8%) | 40 (0.2%) |
| Coal or Coke | 0 (0.0%) | 0 (0.0%) |
| All other Fuels | 740 (3.0%) | 173 (1.0%) |
| No Fuel Used | 9 (0.0%) | 79 (0.4%) |
| Total | 24,239 (100.0%) | 17,745 (100.0%) |
Household Vehicle Usage in Spokane Valley
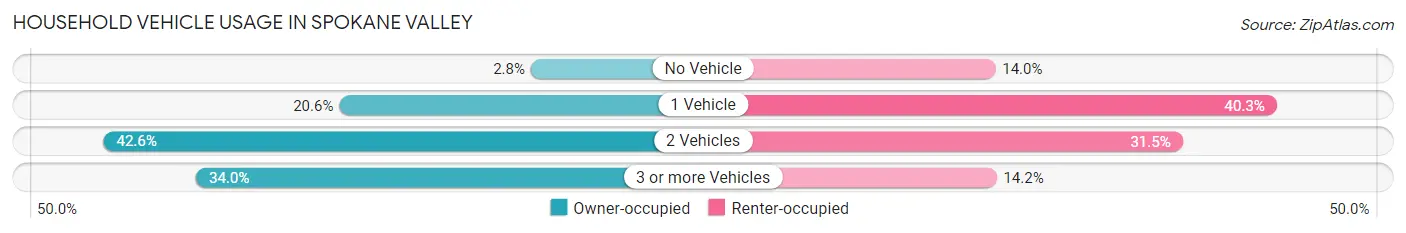
| Vehicles per Household | Owner-occupied | Renter-occupied |
| No Vehicle | 667 (2.8%) | 2,491 (14.0%) |
| 1 Vehicle | 5,000 (20.6%) | 7,152 (40.3%) |
| 2 Vehicles | 10,333 (42.6%) | 5,591 (31.5%) |
| 3 or more Vehicles | 8,239 (34.0%) | 2,511 (14.1%) |
| Total | 24,239 (100.0%) | 17,745 (100.0%) |
Real Estate & Mortgages in Spokane Valley
Real Estate and Mortgage Overview in Spokane Valley
| Characteristic | Without Mortgage | With Mortgage |
| Housing Units | 8,491 | 15,748 |
| Median Property Value | $301,100 | $311,100 |
| Median Household Income | $61,100 | $2,744 |
| Monthly Housing Costs | $543 | $413 |
| Real Estate Taxes | $2,971 | $348 |
Property Value by Mortgage Status in Spokane Valley
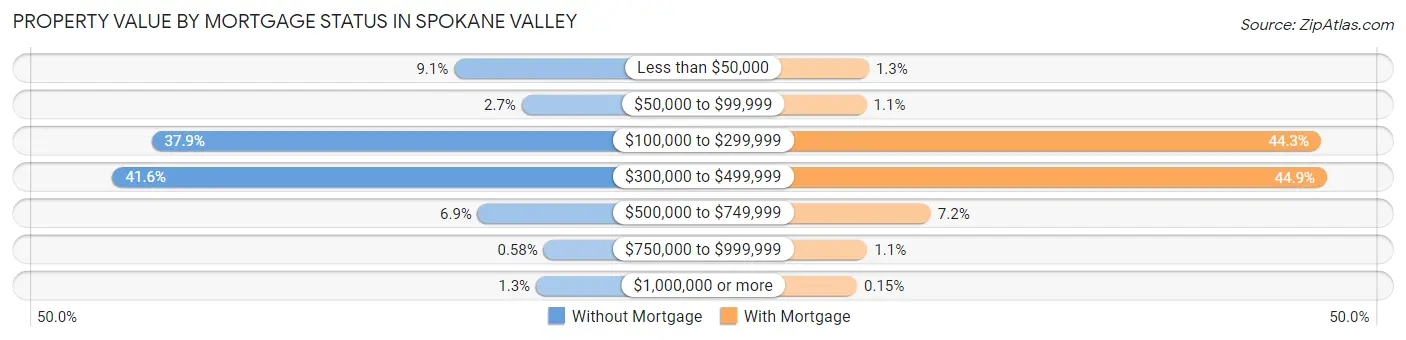
| Property Value | Without Mortgage | With Mortgage |
| Less than $50,000 | 773 (9.1%) | 201 (1.3%) |
| $50,000 to $99,999 | 226 (2.7%) | 167 (1.1%) |
| $100,000 to $299,999 | 3,218 (37.9%) | 6,978 (44.3%) |
| $300,000 to $499,999 | 3,533 (41.6%) | 7,070 (44.9%) |
| $500,000 to $749,999 | 582 (6.9%) | 1,130 (7.2%) |
| $750,000 to $999,999 | 49 (0.6%) | 178 (1.1%) |
| $1,000,000 or more | 110 (1.3%) | 24 (0.2%) |
| Total | 8,491 (100.0%) | 15,748 (100.0%) |
Household Income by Mortgage Status in Spokane Valley
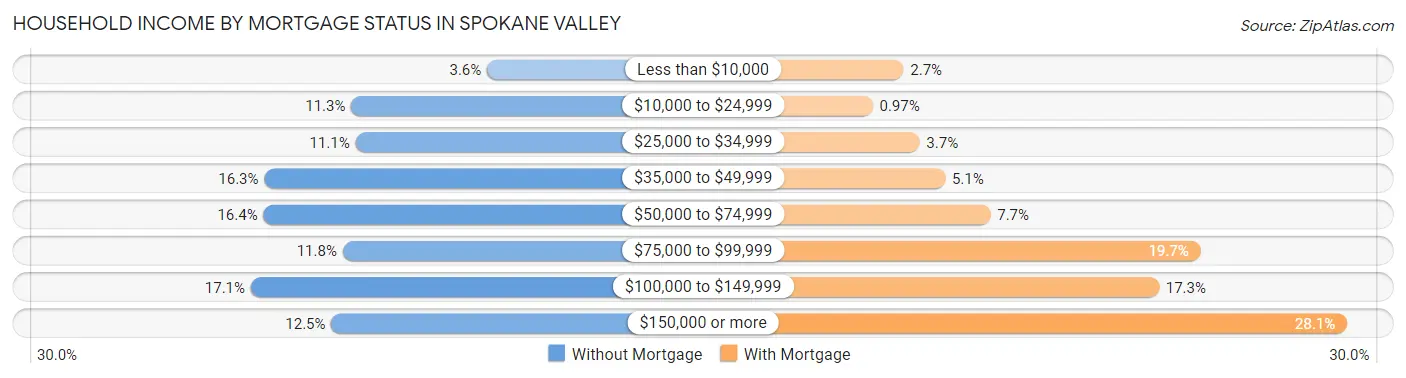
| Household Income | Without Mortgage | With Mortgage |
| Less than $10,000 | 303 (3.6%) | 430 (2.7%) |
| $10,000 to $24,999 | 962 (11.3%) | 153 (1.0%) |
| $25,000 to $34,999 | 942 (11.1%) | 575 (3.6%) |
| $35,000 to $49,999 | 1,384 (16.3%) | 805 (5.1%) |
| $50,000 to $74,999 | 1,388 (16.4%) | 1,213 (7.7%) |
| $75,000 to $99,999 | 1,004 (11.8%) | 3,105 (19.7%) |
| $100,000 to $149,999 | 1,449 (17.1%) | 2,729 (17.3%) |
| $150,000 or more | 1,059 (12.5%) | 4,424 (28.1%) |
| Total | 8,491 (100.0%) | 15,748 (100.0%) |
Property Value to Household Income Ratio in Spokane Valley
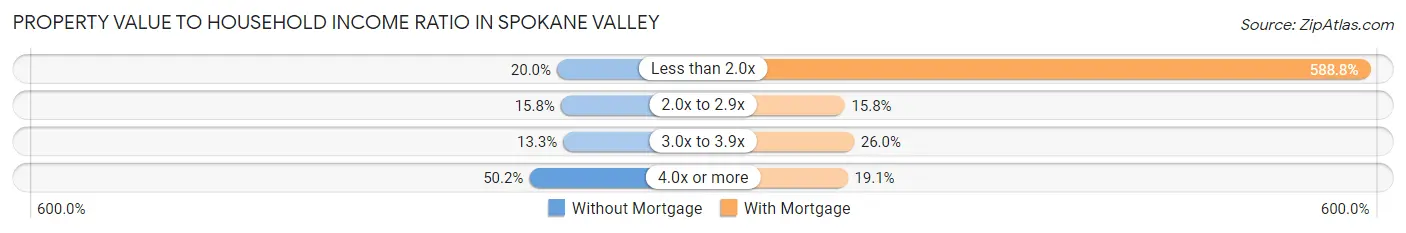
| Value-to-Income Ratio | Without Mortgage | With Mortgage |
| Less than 2.0x | 1,702 (20.0%) | 92,726 (588.8%) |
| 2.0x to 2.9x | 1,343 (15.8%) | 2,494 (15.8%) |
| 3.0x to 3.9x | 1,126 (13.3%) | 4,100 (26.0%) |
| 4.0x or more | 4,259 (50.2%) | 3,004 (19.1%) |
| Total | 8,491 (100.0%) | 15,748 (100.0%) |
Real Estate Taxes by Mortgage Status in Spokane Valley
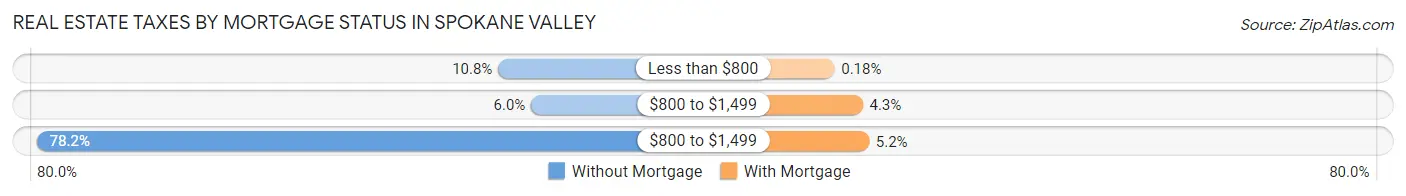
| Property Taxes | Without Mortgage | With Mortgage |
| Less than $800 | 917 (10.8%) | 28 (0.2%) |
| $800 to $1,499 | 508 (6.0%) | 678 (4.3%) |
| $800 to $1,499 | 6,643 (78.2%) | 824 (5.2%) |
| Total | 8,491 (100.0%) | 15,748 (100.0%) |
Health & Disability in Spokane Valley
Health Insurance Coverage by Age in Spokane Valley
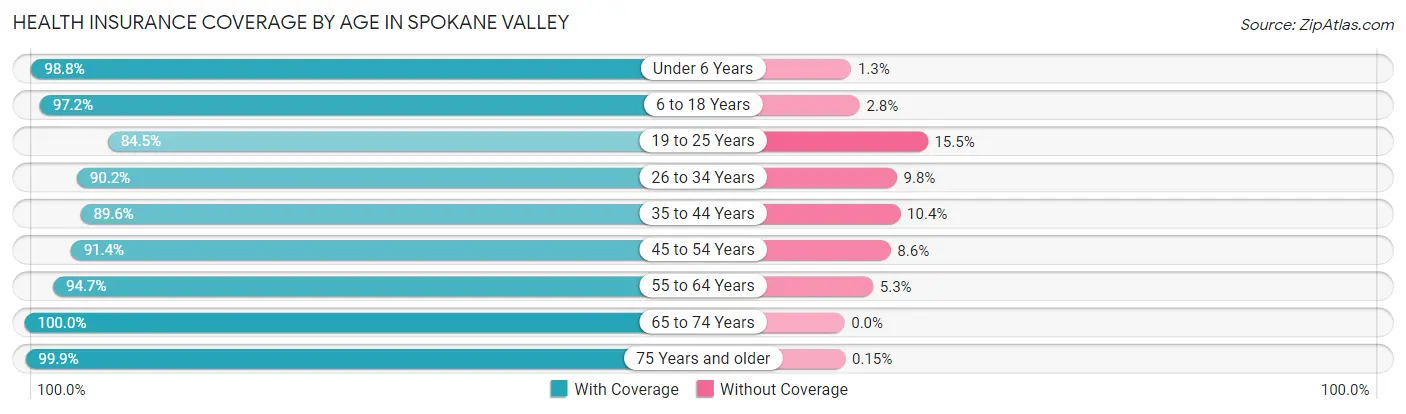
| Age Bracket | With Coverage | Without Coverage |
| Under 6 Years | 7,752 (98.8%) | 98 (1.3%) |
| 6 to 18 Years | 15,112 (97.2%) | 441 (2.8%) |
| 19 to 25 Years | 7,814 (84.5%) | 1,434 (15.5%) |
| 26 to 34 Years | 14,094 (90.2%) | 1,525 (9.8%) |
| 35 to 44 Years | 11,682 (89.6%) | 1,359 (10.4%) |
| 45 to 54 Years | 10,833 (91.4%) | 1,019 (8.6%) |
| 55 to 64 Years | 11,510 (94.7%) | 647 (5.3%) |
| 65 to 74 Years | 10,173 (100.0%) | 0 (0.0%) |
| 75 Years and older | 7,551 (99.9%) | 11 (0.2%) |
| Total | 96,521 (93.7%) | 6,534 (6.3%) |
Health Insurance Coverage by Citizenship Status in Spokane Valley
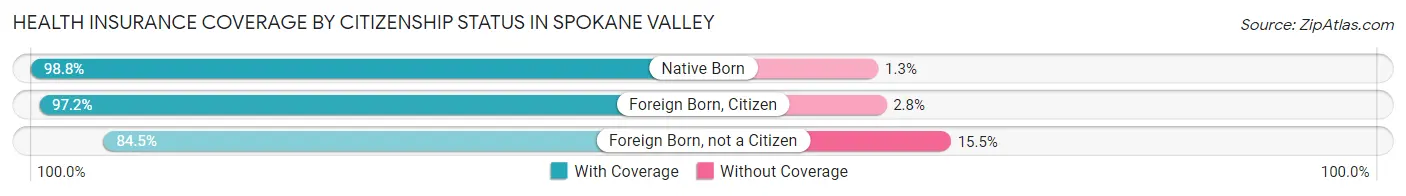
| Citizenship Status | With Coverage | Without Coverage |
| Native Born | 7,752 (98.8%) | 98 (1.3%) |
| Foreign Born, Citizen | 15,112 (97.2%) | 441 (2.8%) |
| Foreign Born, not a Citizen | 7,814 (84.5%) | 1,434 (15.5%) |
Health Insurance Coverage by Household Income in Spokane Valley
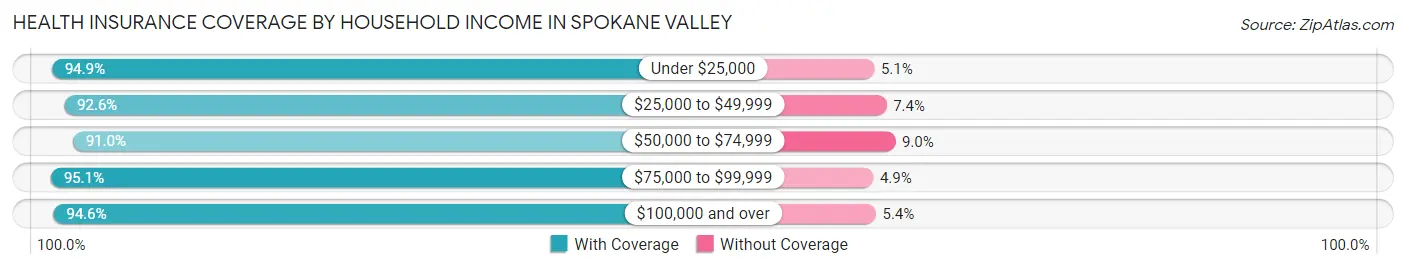
| Household Income | With Coverage | Without Coverage |
| Under $25,000 | 9,874 (94.9%) | 530 (5.1%) |
| $25,000 to $49,999 | 16,639 (92.6%) | 1,325 (7.4%) |
| $50,000 to $74,999 | 18,345 (91.0%) | 1,818 (9.0%) |
| $75,000 to $99,999 | 16,085 (95.1%) | 829 (4.9%) |
| $100,000 and over | 34,916 (94.6%) | 1,991 (5.4%) |
Public vs Private Health Insurance Coverage by Age in Spokane Valley
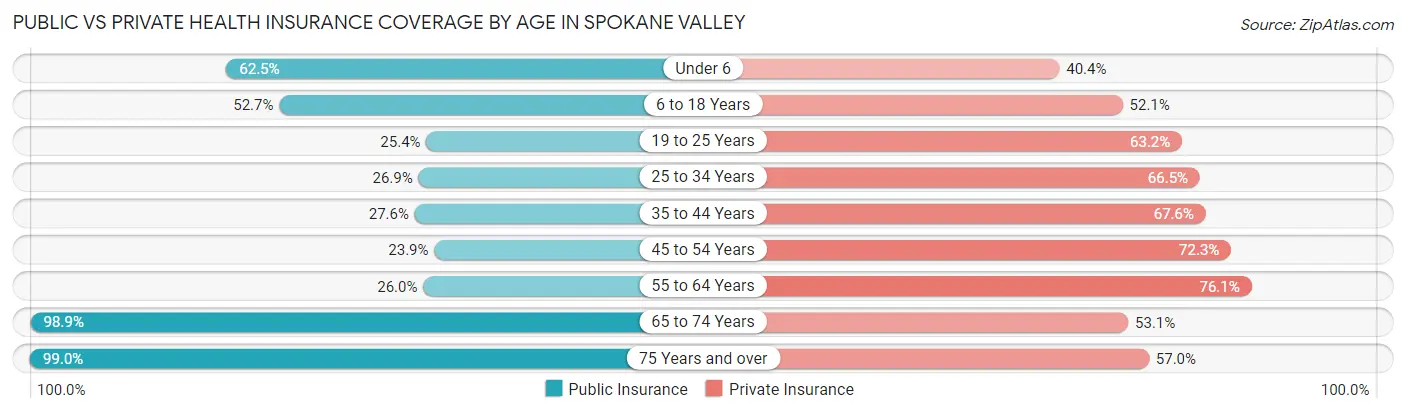
| Age Bracket | Public Insurance | Private Insurance |
| Under 6 | 4,909 (62.5%) | 3,169 (40.4%) |
| 6 to 18 Years | 8,201 (52.7%) | 8,107 (52.1%) |
| 19 to 25 Years | 2,351 (25.4%) | 5,841 (63.2%) |
| 25 to 34 Years | 4,199 (26.9%) | 10,381 (66.5%) |
| 35 to 44 Years | 3,597 (27.6%) | 8,811 (67.6%) |
| 45 to 54 Years | 2,837 (23.9%) | 8,565 (72.3%) |
| 55 to 64 Years | 3,161 (26.0%) | 9,245 (76.0%) |
| 65 to 74 Years | 10,061 (98.9%) | 5,406 (53.1%) |
| 75 Years and over | 7,487 (99.0%) | 4,310 (57.0%) |
| Total | 46,803 (45.4%) | 63,835 (61.9%) |
Disability Status by Sex by Age in Spokane Valley
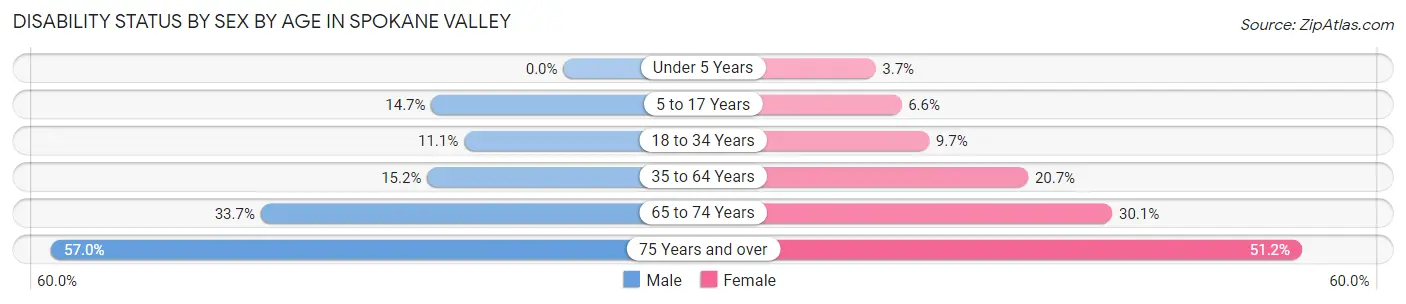
| Age Bracket | Male | Female |
| Under 5 Years | 0 (0.0%) | 120 (3.7%) |
| 5 to 17 Years | 1,167 (14.7%) | 513 (6.6%) |
| 18 to 34 Years | 1,493 (11.1%) | 1,195 (9.7%) |
| 35 to 64 Years | 2,863 (15.2%) | 3,766 (20.7%) |
| 65 to 74 Years | 1,506 (33.7%) | 1,717 (30.1%) |
| 75 Years and over | 1,747 (57.0%) | 2,305 (51.2%) |
Disability Class by Sex by Age in Spokane Valley
Disability Class: Hearing Difficulty
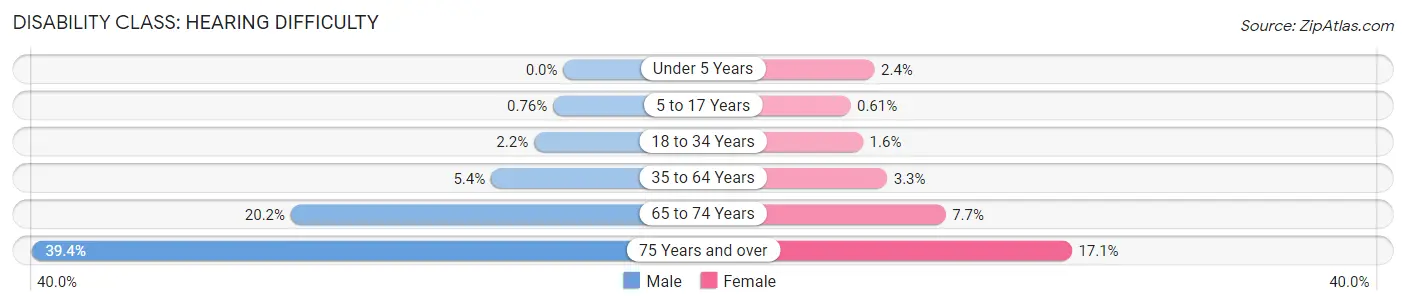
| Age Bracket | Male | Female |
| Under 5 Years | 0 (0.0%) | 77 (2.4%) |
| 5 to 17 Years | 60 (0.8%) | 47 (0.6%) |
| 18 to 34 Years | 294 (2.2%) | 191 (1.5%) |
| 35 to 64 Years | 1,015 (5.4%) | 607 (3.3%) |
| 65 to 74 Years | 904 (20.2%) | 438 (7.7%) |
| 75 Years and over | 1,207 (39.4%) | 767 (17.1%) |
Disability Class: Vision Difficulty
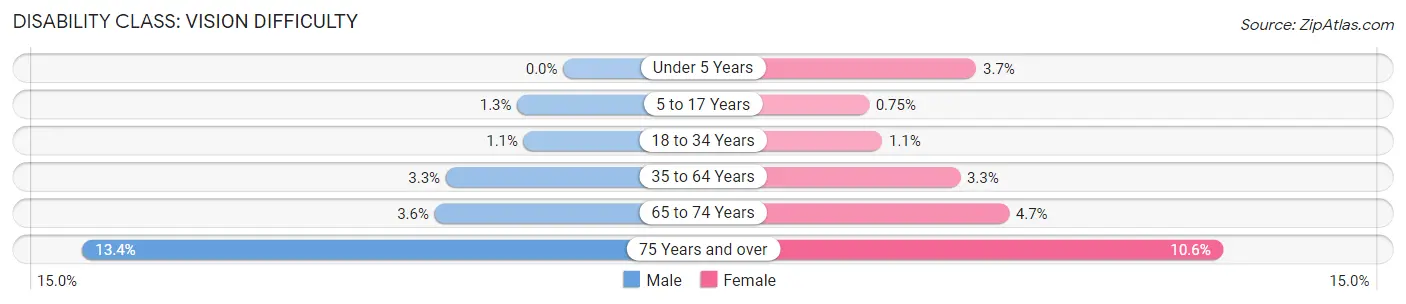
| Age Bracket | Male | Female |
| Under 5 Years | 0 (0.0%) | 120 (3.7%) |
| 5 to 17 Years | 102 (1.3%) | 58 (0.7%) |
| 18 to 34 Years | 148 (1.1%) | 138 (1.1%) |
| 35 to 64 Years | 617 (3.3%) | 598 (3.3%) |
| 65 to 74 Years | 160 (3.6%) | 265 (4.6%) |
| 75 Years and over | 410 (13.4%) | 477 (10.6%) |
Disability Class: Cognitive Difficulty
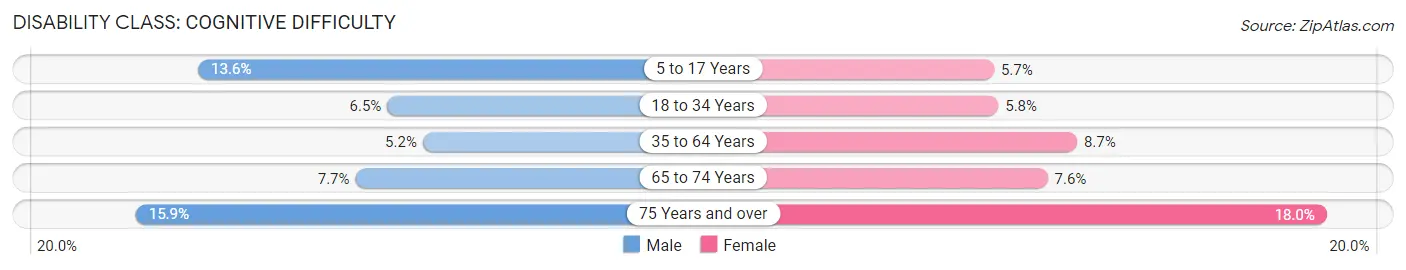
| Age Bracket | Male | Female |
| 5 to 17 Years | 1,076 (13.6%) | 438 (5.7%) |
| 18 to 34 Years | 882 (6.5%) | 715 (5.8%) |
| 35 to 64 Years | 985 (5.2%) | 1,586 (8.7%) |
| 65 to 74 Years | 345 (7.7%) | 436 (7.6%) |
| 75 Years and over | 486 (15.9%) | 810 (18.0%) |
Disability Class: Ambulatory Difficulty
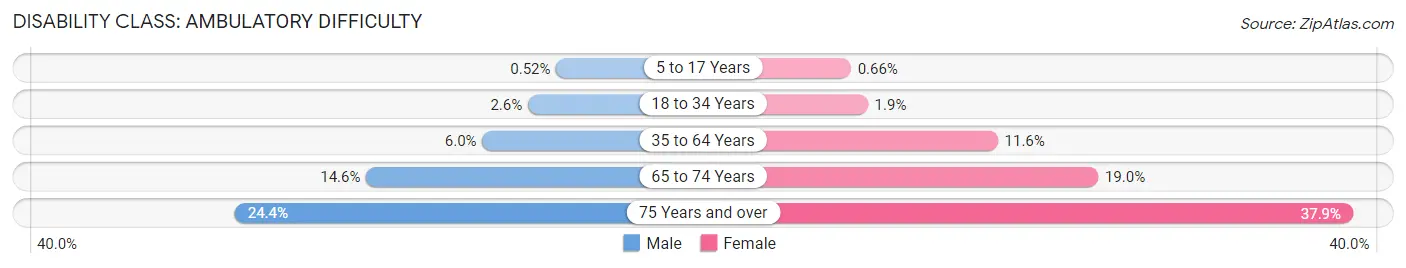
| Age Bracket | Male | Female |
| 5 to 17 Years | 41 (0.5%) | 51 (0.7%) |
| 18 to 34 Years | 354 (2.6%) | 237 (1.9%) |
| 35 to 64 Years | 1,134 (6.0%) | 2,102 (11.6%) |
| 65 to 74 Years | 654 (14.6%) | 1,085 (19.0%) |
| 75 Years and over | 747 (24.4%) | 1,707 (37.9%) |
Disability Class: Self-Care Difficulty
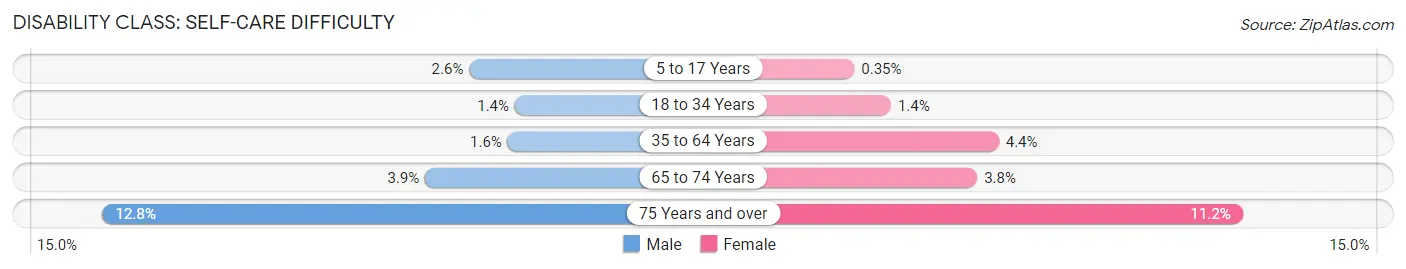
| Age Bracket | Male | Female |
| 5 to 17 Years | 208 (2.6%) | 27 (0.4%) |
| 18 to 34 Years | 182 (1.3%) | 169 (1.4%) |
| 35 to 64 Years | 293 (1.5%) | 793 (4.4%) |
| 65 to 74 Years | 172 (3.8%) | 215 (3.8%) |
| 75 Years and over | 393 (12.8%) | 502 (11.2%) |
Technology Access in Spokane Valley
Computing Device Access in Spokane Valley
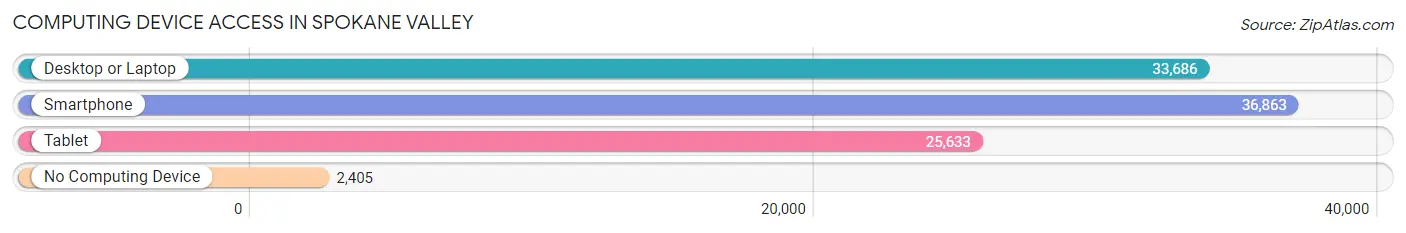
| Device Type | # Households | % Households |
| Desktop or Laptop | 33,686 | 80.2% |
| Smartphone | 36,863 | 87.8% |
| Tablet | 25,633 | 61.1% |
| No Computing Device | 2,405 | 5.7% |
| Total | 41,984 | 100.0% |
Internet Access in Spokane Valley
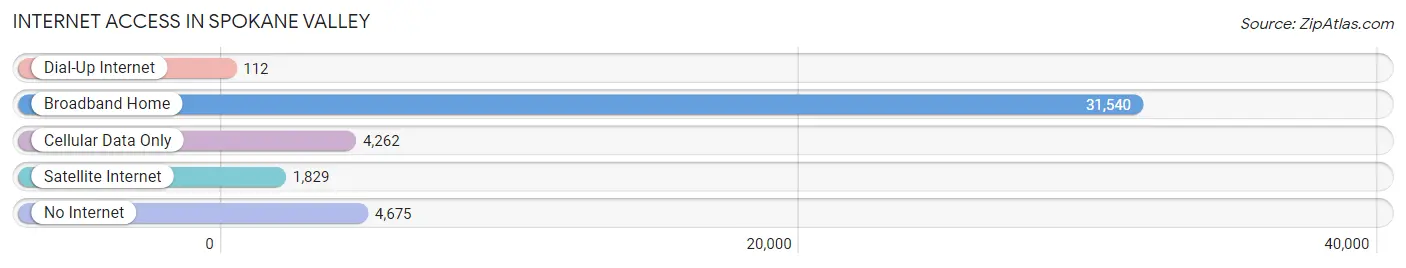
| Internet Type | # Households | % Households |
| Dial-Up Internet | 112 | 0.3% |
| Broadband Home | 31,540 | 75.1% |
| Cellular Data Only | 4,262 | 10.2% |
| Satellite Internet | 1,829 | 4.4% |
| No Internet | 4,675 | 11.1% |
| Total | 41,984 | 100.0% |
Spokane Valley Summary
Spokane Valley is a city located in the eastern part of Washington State, in the United States. It is part of the Spokane Metropolitan Statistical Area and is the second largest city in the state. The city is situated in the Spokane Valley, a wide valley between the Cascade Mountains and the Rocky Mountains. The city is bordered by the cities of Spokane, Cheney, and Liberty Lake.
History
The area that is now Spokane Valley was originally inhabited by the Spokane Tribe of Native Americans. The first European settlers arrived in the area in the late 1800s, and the city was officially incorporated in 2003. Prior to its incorporation, the area was part of unincorporated Spokane County.
The city was named after the Spokane River, which runs through the city. The river was named by early French explorers, who called it “la rivière aux Espagnols”, meaning “the river of the Spaniards”.
Geography
Spokane Valley is located in the eastern part of Washington State, in the United States. It is part of the Spokane Metropolitan Statistical Area and is the second largest city in the state. The city is situated in the Spokane Valley, a wide valley between the Cascade Mountains and the Rocky Mountains. The city is bordered by the cities of Spokane, Cheney, and Liberty Lake.
The city has a total area of 24.3 square miles, of which 24.2 square miles is land and 0.1 square miles is water. The city is located at an elevation of 1,890 feet above sea level.
Economy
The economy of Spokane Valley is largely based on the service industry, with many businesses providing services to the surrounding area. The city is home to several large employers, including the Spokane Valley Mall, the Spokane Valley Medical Center, and the Spokane Valley Fire Department.
The city also has a thriving retail sector, with many stores and restaurants located in the city. The city is also home to several large industrial parks, which provide employment opportunities for many residents.
Demographics
As of the 2010 census, the population of Spokane Valley was 89,755. The racial makeup of the city was 87.3% White, 1.3% African American, 0.7% Native American, 3.2% Asian, 0.2% Pacific Islander, 3.2% from other races, and 4.3% from two or more races. Hispanic or Latino of any race were 8.2% of the population.
The median income for a household in the city was $50,945, and the median income for a family was $60,945. The per capita income for the city was $25,945. About 8.2% of families and 10.7% of the population were below the poverty line, including 14.2% of those under age 18 and 6.2% of those age 65 or over.
Conclusion
Spokane Valley is a city located in the eastern part of Washington State, in the United States. It is part of the Spokane Metropolitan Statistical Area and is the second largest city in the state. The city is situated in the Spokane Valley, a wide valley between the Cascade Mountains and the Rocky Mountains. The city is bordered by the cities of Spokane, Cheney, and Liberty Lake. The economy of Spokane Valley is largely based on the service industry, with many businesses providing services to the surrounding area. As of the 2010 census, the population of Spokane Valley was 89,755. The median income for a household in the city was $50,945, and the median income for a family was $60,945. The city is a vibrant and diverse community, with many businesses and attractions to explore.
Common Questions
What is Per Capita Income in Spokane Valley?
Per Capita income in Spokane Valley is $33,650.
What is the Median Family Income in Spokane Valley?
Median Family Income in Spokane Valley is $79,665.
What is the Median Household income in Spokane Valley?
Median Household Income in Spokane Valley is $66,483.
What is Income or Wage Gap in Spokane Valley?
Income or Wage Gap in Spokane Valley is 27.1%.
Women in Spokane Valley earn 72.9 cents for every dollar earned by a man.
What is Family Income Deficit in Spokane Valley?
Family Income Deficit in Spokane Valley is $10,207.
Families that are below poverty line in Spokane Valley earn $10,207 less on average than the poverty threshold level.
What is Inequality or Gini Index in Spokane Valley?
Inequality or Gini Index in Spokane Valley is 0.41.
What is the Total Population of Spokane Valley?
Total Population of Spokane Valley is 103,761.
What is the Total Male Population of Spokane Valley?
Total Male Population of Spokane Valley is 51,779.
What is the Total Female Population of Spokane Valley?
Total Female Population of Spokane Valley is 51,982.
What is the Ratio of Males per 100 Females in Spokane Valley?
There are 99.61 Males per 100 Females in Spokane Valley.
What is the Ratio of Females per 100 Males in Spokane Valley?
There are 100.39 Females per 100 Males in Spokane Valley.
What is the Median Population Age in Spokane Valley?
Median Population Age in Spokane Valley is 37.4 Years.
What is the Average Family Size in Spokane Valley
Average Family Size in Spokane Valley is 3.0 People.
What is the Average Household Size in Spokane Valley
Average Household Size in Spokane Valley is 2.4 People.
How Large is the Labor Force in Spokane Valley?
There are 53,337 People in the Labor Forcein in Spokane Valley.
What is the Percentage of People in the Labor Force in Spokane Valley?
64.1% of People are in the Labor Force in Spokane Valley.
What is the Unemployment Rate in Spokane Valley?
Unemployment Rate in Spokane Valley is 5.8%.