Albany, CA Map & Demographics
Albany Map
Albany Overview
$65,976
PER CAPITA INCOME
$153,031
AVG FAMILY INCOME
$124,469
AVG HOUSEHOLD INCOME
20.1%
WAGE / INCOME GAP [ % ]
79.9¢/ $1
WAGE / INCOME GAP [ $ ]
$13,619
FAMILY INCOME DEFICIT
0.45
INEQUALITY / GINI INDEX
20,027
TOTAL POPULATION
9,550
MALE POPULATION
10,477
FEMALE POPULATION
91.15
MALES / 100 FEMALES
109.71
FEMALES / 100 MALES
37.2
MEDIAN AGE
3.0
AVG FAMILY SIZE
2.5
AVG HOUSEHOLD SIZE
10,703
LABOR FORCE [ PEOPLE ]
68.2%
PERCENT IN LABOR FORCE
3.3%
UNEMPLOYMENT RATE
Albany Zip Codes
Albany Area Codes
Income in Albany
Income Overview in Albany
Per Capita Income in Albany is $65,976, while median incomes of families and households are $153,031 and $124,469 respectively.
| Characteristic | Number | Measure |
| Per Capita Income | 20,027 | $65,976 |
| Median Family Income | 5,177 | $153,031 |
| Mean Family Income | 5,177 | $193,554 |
| Median Household Income | 7,746 | $124,469 |
| Mean Household Income | 7,746 | $166,873 |
| Income Deficit | 5,177 | $13,619 |
| Wage / Income Gap (%) | 20,027 | 20.08% |
| Wage / Income Gap ($) | 20,027 | 79.92¢ per $1 |
| Gini / Inequality Index | 20,027 | 0.45 |
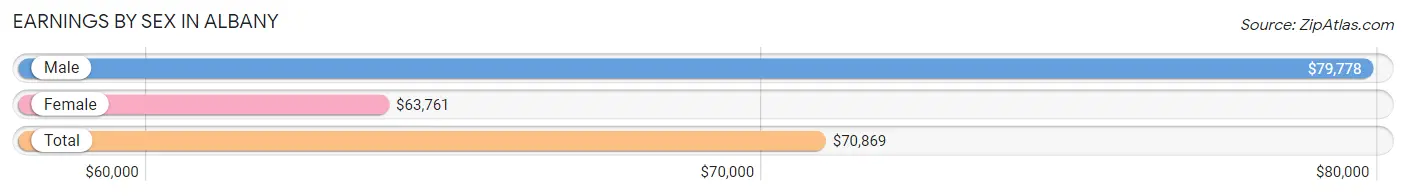
Earnings by Sex in Albany
Average Earnings in Albany are $70,869, $79,778 for men and $63,761 for women, a difference of 20.1%.
| Sex | Number | Average Earnings |
| Male | 5,683 (49.6%) | $79,778 |
| Female | 5,776 (50.4%) | $63,761 |
| Total | 11,459 (100.0%) | $70,869 |
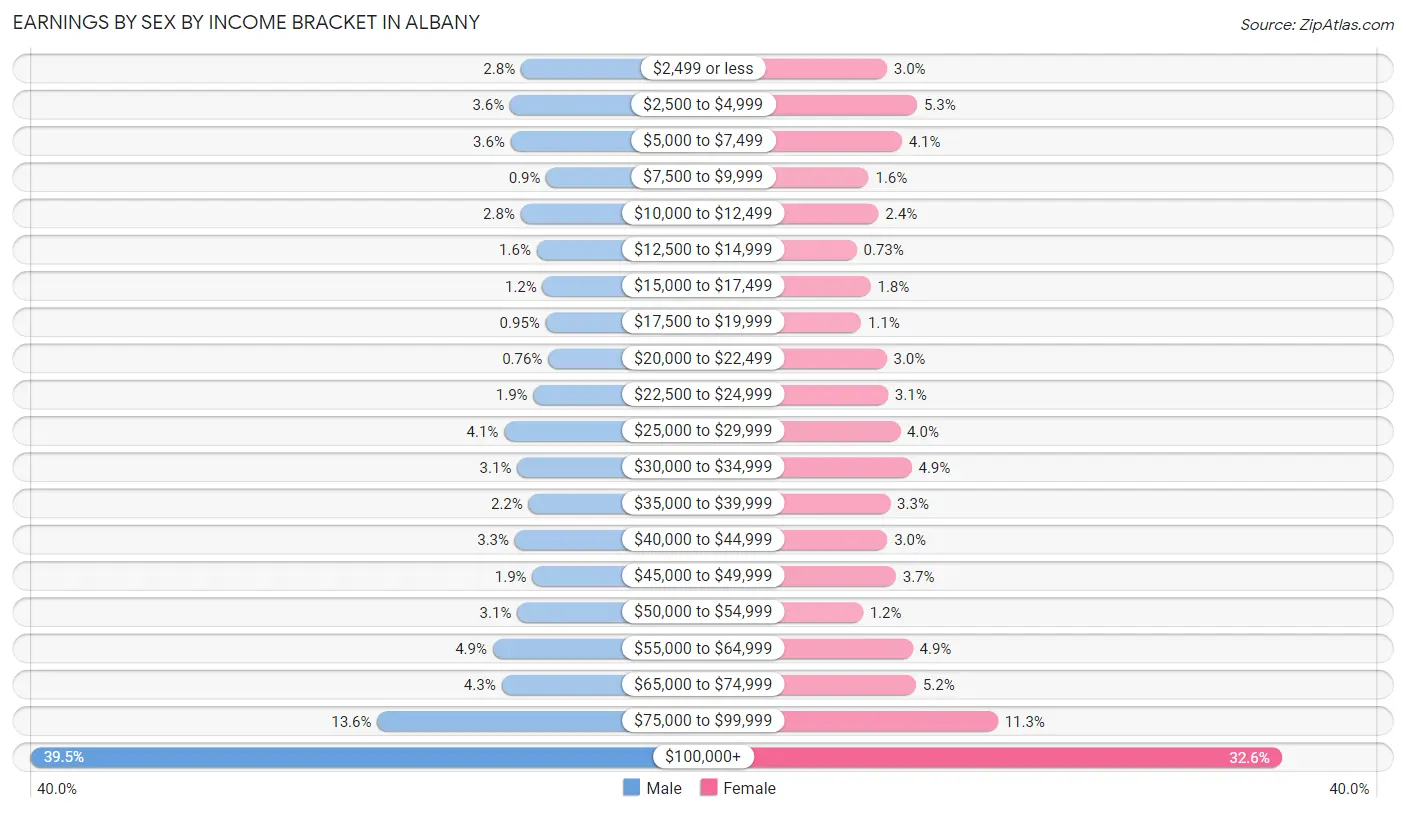
Earnings by Sex by Income Bracket in Albany
The most common earnings brackets in Albany are $100,000+ for men (2,247 | 39.5%) and $100,000+ for women (1,882 | 32.6%).
| Income | Male | Female |
| $2,499 or less | 159 (2.8%) | 173 (3.0%) |
| $2,500 to $4,999 | 206 (3.6%) | 304 (5.3%) |
| $5,000 to $7,499 | 203 (3.6%) | 238 (4.1%) |
| $7,500 to $9,999 | 51 (0.9%) | 94 (1.6%) |
| $10,000 to $12,499 | 160 (2.8%) | 137 (2.4%) |
| $12,500 to $14,999 | 92 (1.6%) | 42 (0.7%) |
| $15,000 to $17,499 | 67 (1.2%) | 103 (1.8%) |
| $17,500 to $19,999 | 54 (0.9%) | 61 (1.1%) |
| $20,000 to $22,499 | 43 (0.8%) | 172 (3.0%) |
| $22,500 to $24,999 | 106 (1.9%) | 178 (3.1%) |
| $25,000 to $29,999 | 231 (4.1%) | 231 (4.0%) |
| $30,000 to $34,999 | 175 (3.1%) | 280 (4.9%) |
| $35,000 to $39,999 | 127 (2.2%) | 188 (3.3%) |
| $40,000 to $44,999 | 185 (3.3%) | 175 (3.0%) |
| $45,000 to $49,999 | 110 (1.9%) | 212 (3.7%) |
| $50,000 to $54,999 | 175 (3.1%) | 69 (1.2%) |
| $55,000 to $64,999 | 279 (4.9%) | 285 (4.9%) |
| $65,000 to $74,999 | 242 (4.3%) | 299 (5.2%) |
| $75,000 to $99,999 | 771 (13.6%) | 653 (11.3%) |
| $100,000+ | 2,247 (39.5%) | 1,882 (32.6%) |
| Total | 5,683 (100.0%) | 5,776 (100.0%) |
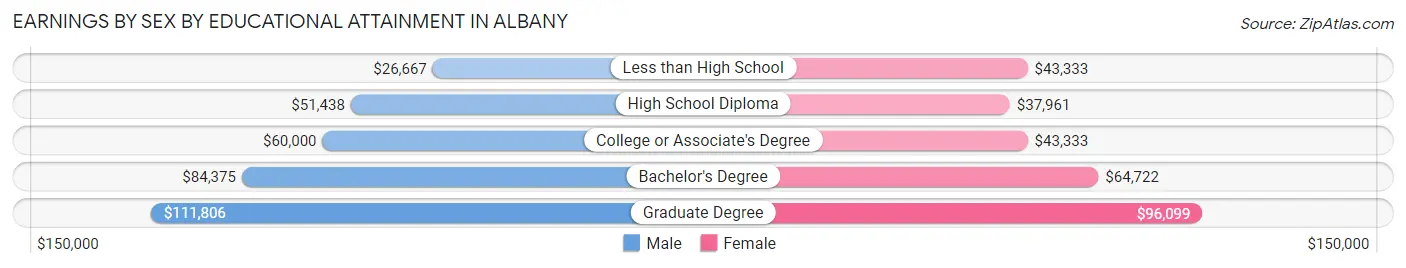
Earnings by Sex by Educational Attainment in Albany
Average earnings in Albany are $89,420 for men and $74,837 for women, a difference of 16.3%. Men with an educational attainment of graduate degree enjoy the highest average annual earnings of $111,806, while those with less than high school education earn the least with $26,667. Women with an educational attainment of graduate degree earn the most with the average annual earnings of $96,099, while those with high school diploma education have the smallest earnings of $37,961.
| Educational Attainment | Male Income | Female Income |
| Less than High School | $26,667 | $43,333 |
| High School Diploma | $51,438 | $37,961 |
| College or Associate's Degree | $60,000 | $43,333 |
| Bachelor's Degree | $84,375 | $64,722 |
| Graduate Degree | $111,806 | $96,099 |
| Total | $89,420 | $74,837 |
Family Income in Albany
Family Income Brackets in Albany
According to the Albany family income data, there are 2,014 families falling into the $200,000+ income range, which is the most common income bracket and makes up 38.9% of all families. Conversely, the $10,000 to $14,999 income bracket is the least frequent group with only 36 families (0.7%) belonging to this category.
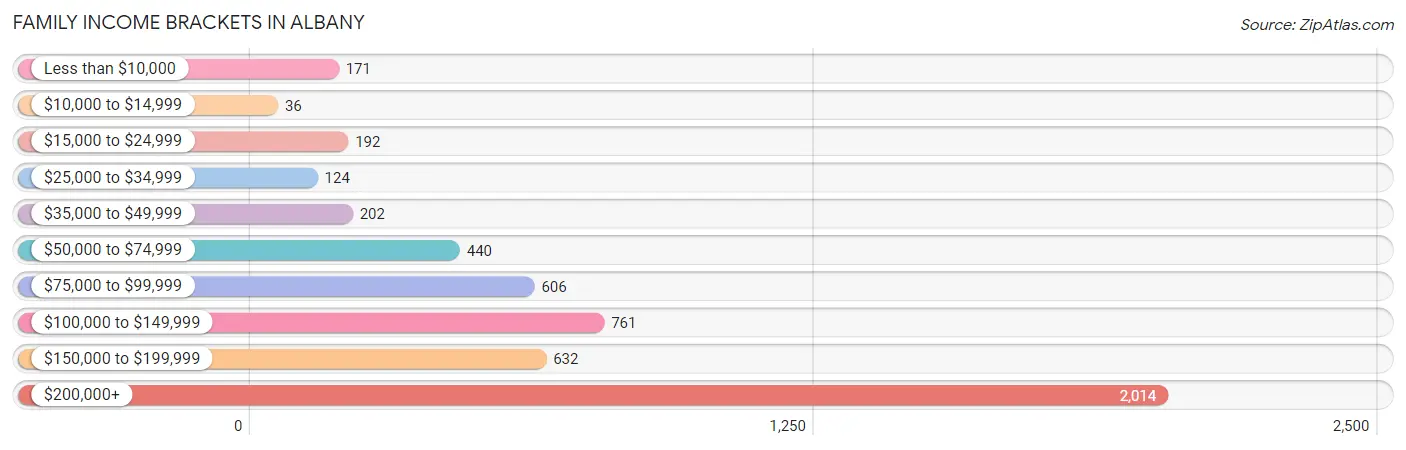
| Income Bracket | # Families | % Families |
| Less than $10,000 | 171 | 3.3% |
| $10,000 to $14,999 | 36 | 0.7% |
| $15,000 to $24,999 | 192 | 3.7% |
| $25,000 to $34,999 | 124 | 2.4% |
| $35,000 to $49,999 | 202 | 3.9% |
| $50,000 to $74,999 | 440 | 8.5% |
| $75,000 to $99,999 | 606 | 11.7% |
| $100,000 to $149,999 | 761 | 14.7% |
| $150,000 to $199,999 | 632 | 12.2% |
| $200,000+ | 2,014 | 38.9% |
Family Income by Famaliy Size in Albany
6-person families (37 | 0.7%) account for the highest median family income in Albany with $250,001 per family, while 4-person families (1,163 | 22.5%) have the highest median income of $59,782 per family member.
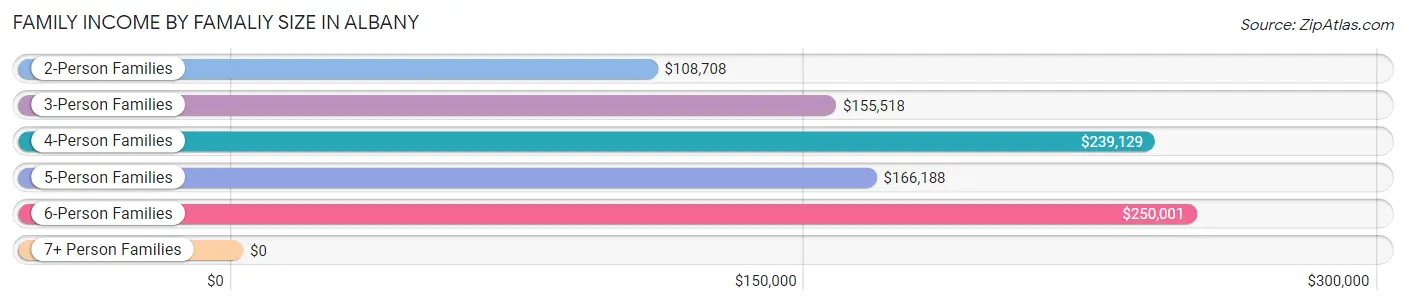
| Income Bracket | # Families | Median Income |
| 2-Person Families | 2,253 (43.5%) | $108,708 |
| 3-Person Families | 1,399 (27.0%) | $155,518 |
| 4-Person Families | 1,163 (22.5%) | $239,129 |
| 5-Person Families | 325 (6.3%) | $166,188 |
| 6-Person Families | 37 (0.7%) | $250,001 |
| 7+ Person Families | 0 (0.0%) | $0 |
| Total | 5,177 (100.0%) | $153,031 |
Family Income by Number of Earners in Albany
The median family income in Albany is $153,031, with families comprising 2 earners (2,709) having the highest median family income of $215,625, while families with no earners (466) have the lowest median family income of $76,250, accounting for 52.3% and 9.0% of families, respectively.
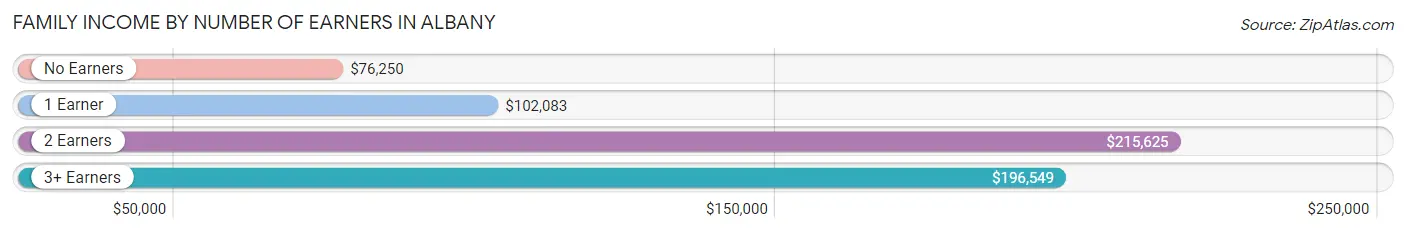
| Number of Earners | # Families | Median Income |
| No Earners | 466 (9.0%) | $76,250 |
| 1 Earner | 1,665 (32.2%) | $102,083 |
| 2 Earners | 2,709 (52.3%) | $215,625 |
| 3+ Earners | 337 (6.5%) | $196,549 |
| Total | 5,177 (100.0%) | $153,031 |
Household Income in Albany
Household Income Brackets in Albany
With 2,432 households falling in the category, the $200,000+ income range is the most frequent in Albany, accounting for 31.4% of all households. In contrast, only 108 households (1.4%) fall into the $10,000 to $14,999 income bracket, making it the least populous group.
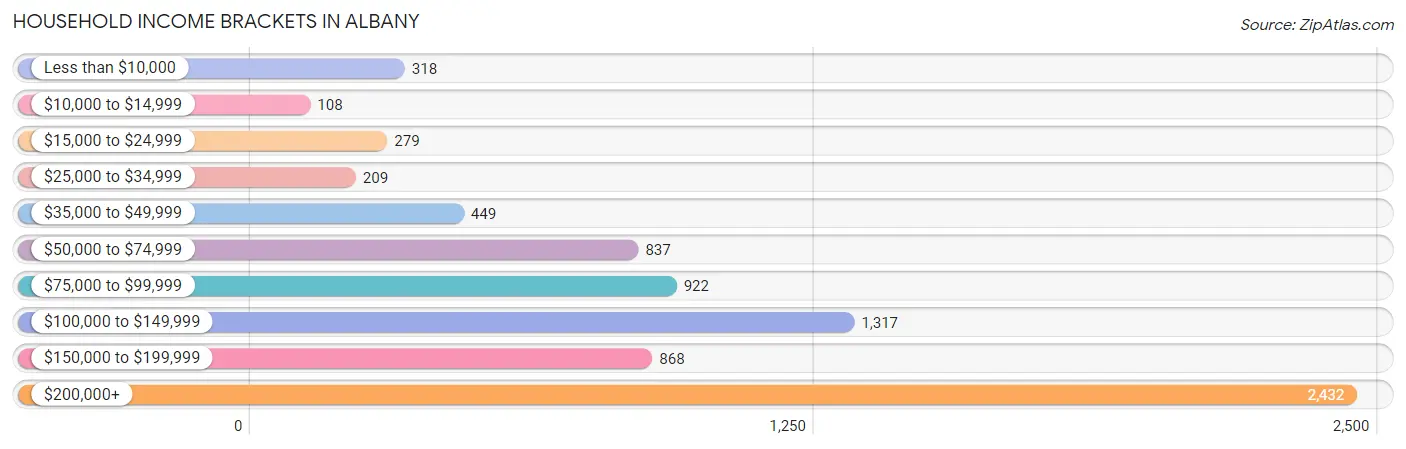
| Income Bracket | # Households | % Households |
| Less than $10,000 | 318 | 4.1% |
| $10,000 to $14,999 | 108 | 1.4% |
| $15,000 to $24,999 | 279 | 3.6% |
| $25,000 to $34,999 | 209 | 2.7% |
| $35,000 to $49,999 | 449 | 5.8% |
| $50,000 to $74,999 | 837 | 10.8% |
| $75,000 to $99,999 | 922 | 11.9% |
| $100,000 to $149,999 | 1,317 | 17.0% |
| $150,000 to $199,999 | 868 | 11.2% |
| $200,000+ | 2,432 | 31.4% |
Household Income by Householder Age in Albany
The median household income in Albany is $124,469, with the highest median household income of $142,143 found in the 45 to 64 years age bracket for the primary householder. A total of 2,862 households (36.9%) fall into this category. Meanwhile, the 15 to 24 years age bracket for the primary householder has the lowest median household income of $58,750, with 173 households (2.2%) in this group.
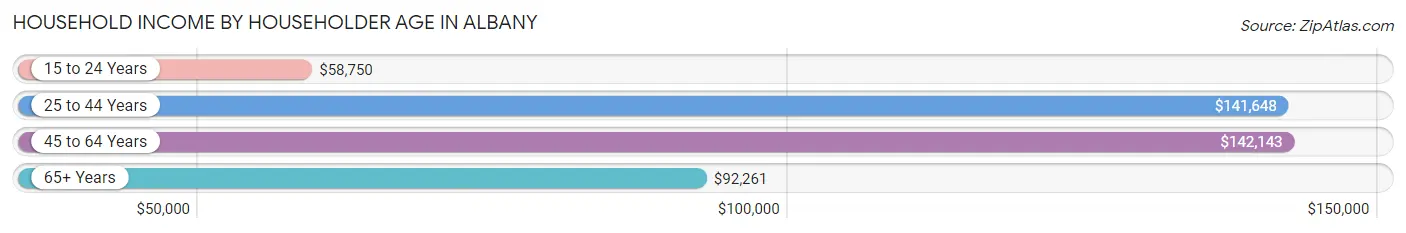
| Income Bracket | # Households | Median Income |
| 15 to 24 Years | 173 (2.2%) | $58,750 |
| 25 to 44 Years | 2,880 (37.2%) | $141,648 |
| 45 to 64 Years | 2,862 (36.9%) | $142,143 |
| 65+ Years | 1,831 (23.6%) | $92,261 |
| Total | 7,746 (100.0%) | $124,469 |
Poverty in Albany
Income Below Poverty by Sex and Age in Albany
With 10.6% poverty level for males and 7.7% for females among the residents of Albany, 5 year old males and 6 to 11 year old females are the most vulnerable to poverty, with 33 males (20.0%) and 108 females (16.5%) in their respective age groups living below the poverty level.
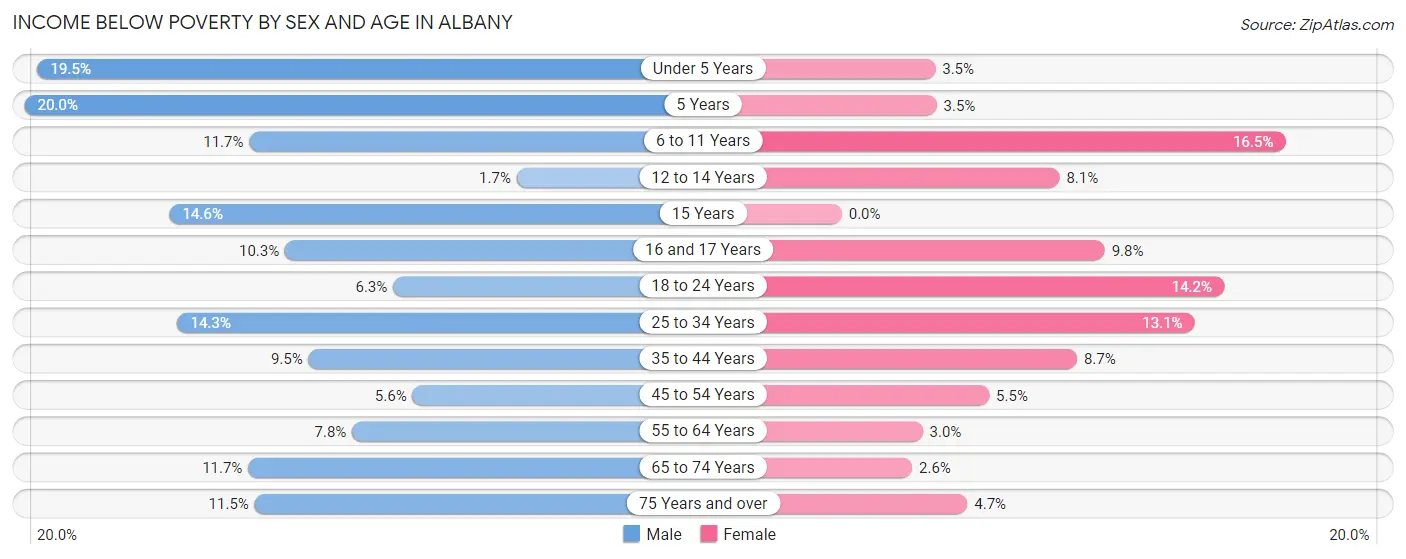
| Age Bracket | Male | Female |
| Under 5 Years | 129 (19.5%) | 19 (3.5%) |
| 5 Years | 33 (20.0%) | 9 (3.5%) |
| 6 to 11 Years | 104 (11.7%) | 108 (16.5%) |
| 12 to 14 Years | 7 (1.7%) | 35 (8.1%) |
| 15 Years | 19 (14.6%) | 0 (0.0%) |
| 16 and 17 Years | 22 (10.3%) | 33 (9.8%) |
| 18 to 24 Years | 24 (6.3%) | 93 (14.2%) |
| 25 to 34 Years | 211 (14.3%) | 184 (13.1%) |
| 35 to 44 Years | 162 (9.5%) | 149 (8.7%) |
| 45 to 54 Years | 66 (5.6%) | 75 (5.5%) |
| 55 to 64 Years | 70 (7.8%) | 40 (3.0%) |
| 65 to 74 Years | 106 (11.7%) | 23 (2.6%) |
| 75 Years and over | 44 (11.5%) | 27 (4.7%) |
| Total | 997 (10.6%) | 795 (7.7%) |
Income Above Poverty by Sex and Age in Albany
According to the poverty statistics in Albany, males aged 12 to 14 years and females aged 15 years are the age groups that are most secure financially, with 98.3% of males and 100.0% of females in these age groups living above the poverty line.
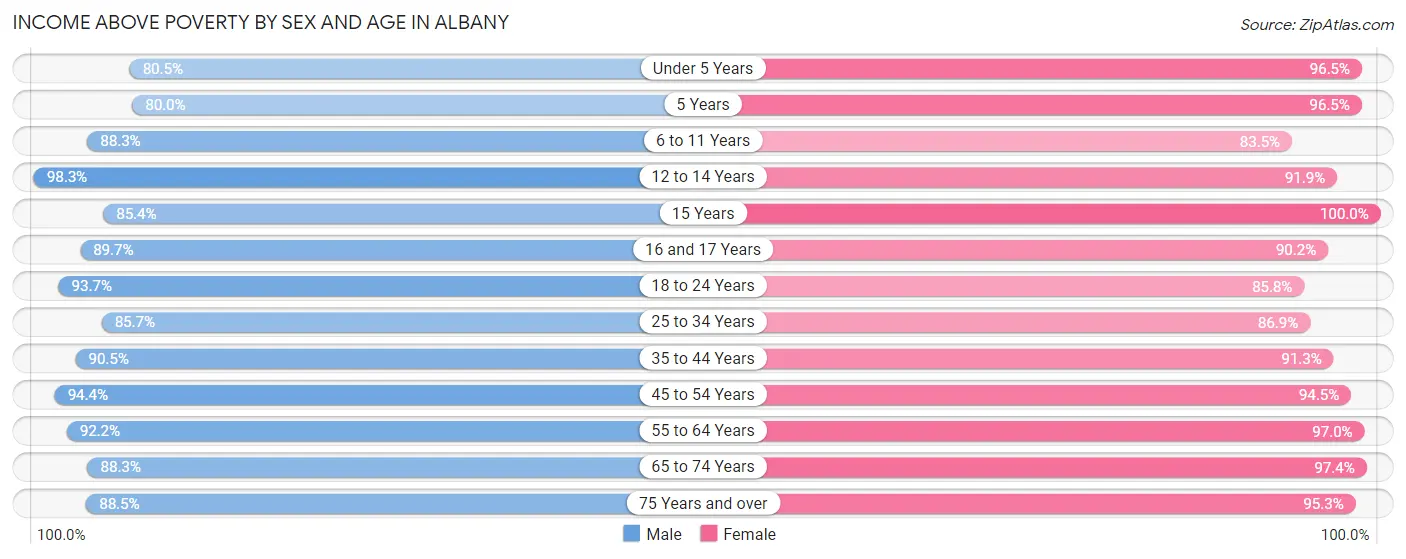
| Age Bracket | Male | Female |
| Under 5 Years | 532 (80.5%) | 528 (96.5%) |
| 5 Years | 132 (80.0%) | 247 (96.5%) |
| 6 to 11 Years | 788 (88.3%) | 548 (83.5%) |
| 12 to 14 Years | 398 (98.3%) | 398 (91.9%) |
| 15 Years | 111 (85.4%) | 148 (100.0%) |
| 16 and 17 Years | 191 (89.7%) | 305 (90.2%) |
| 18 to 24 Years | 356 (93.7%) | 563 (85.8%) |
| 25 to 34 Years | 1,262 (85.7%) | 1,222 (86.9%) |
| 35 to 44 Years | 1,550 (90.5%) | 1,557 (91.3%) |
| 45 to 54 Years | 1,112 (94.4%) | 1,295 (94.5%) |
| 55 to 64 Years | 823 (92.2%) | 1,294 (97.0%) |
| 65 to 74 Years | 800 (88.3%) | 858 (97.4%) |
| 75 Years and over | 340 (88.5%) | 552 (95.3%) |
| Total | 8,395 (89.4%) | 9,515 (92.3%) |
Income Below Poverty Among Married-Couple Families in Albany
The poverty statistics for married-couple families in Albany show that 4.8% or 196 of the total 4,082 families live below the poverty line. Families with 3 or 4 children have the highest poverty rate of 8.8%, comprising of 17 families. On the other hand, families with no children have the lowest poverty rate of 3.1%, which includes 56 families.
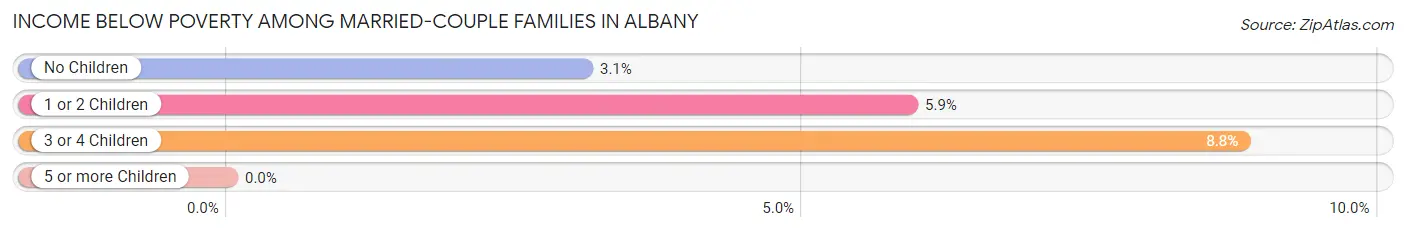
| Children | Above Poverty | Below Poverty |
| No Children | 1,757 (96.9%) | 56 (3.1%) |
| 1 or 2 Children | 1,953 (94.1%) | 123 (5.9%) |
| 3 or 4 Children | 176 (91.2%) | 17 (8.8%) |
| 5 or more Children | 0 (0.0%) | 0 (0.0%) |
| Total | 3,886 (95.2%) | 196 (4.8%) |
Income Below Poverty Among Single-Parent Households in Albany
According to the poverty data in Albany, 16.5% or 35 single-father households and 13.4% or 118 single-mother households are living below the poverty line. Among single-father households, those with 3 or 4 children have the highest poverty rate, with 12 households (100.0%) experiencing poverty. Likewise, among single-mother households, those with 3 or 4 children have the highest poverty rate, with 15 households (93.8%) falling below the poverty line.
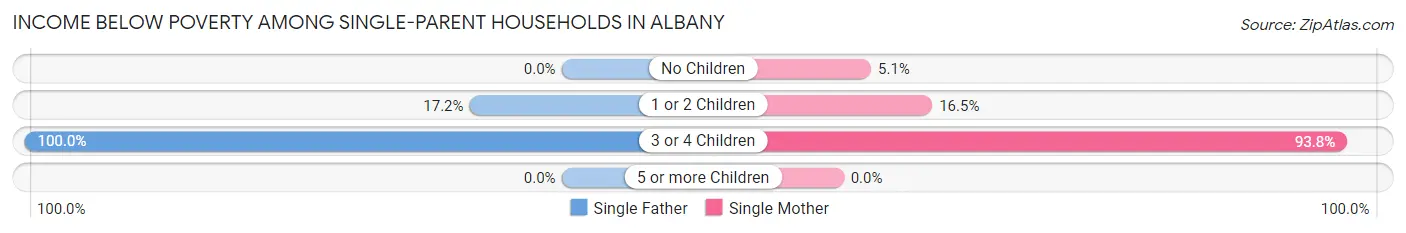
| Children | Single Father | Single Mother |
| No Children | 0 (0.0%) | 18 (5.1%) |
| 1 or 2 Children | 23 (17.2%) | 85 (16.5%) |
| 3 or 4 Children | 12 (100.0%) | 15 (93.8%) |
| 5 or more Children | 0 (0.0%) | 0 (0.0%) |
| Total | 35 (16.5%) | 118 (13.4%) |
Income Below Poverty Among Married-Couple vs Single-Parent Households in Albany
The poverty data for Albany shows that 196 of the married-couple family households (4.8%) and 153 of the single-parent households (14.0%) are living below the poverty level. Within the married-couple family households, those with 3 or 4 children have the highest poverty rate, with 17 households (8.8%) falling below the poverty line. Among the single-parent households, those with 3 or 4 children have the highest poverty rate, with 27 household (96.4%) living below poverty.
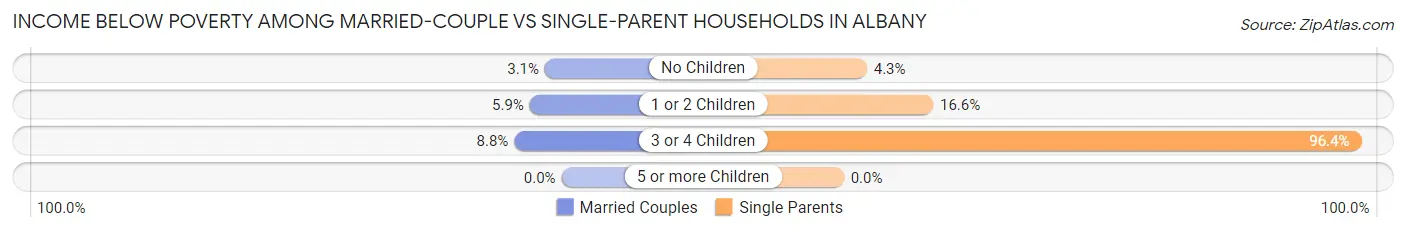
| Children | Married-Couple Families | Single-Parent Households |
| No Children | 56 (3.1%) | 18 (4.3%) |
| 1 or 2 Children | 123 (5.9%) | 108 (16.6%) |
| 3 or 4 Children | 17 (8.8%) | 27 (96.4%) |
| 5 or more Children | 0 (0.0%) | 0 (0.0%) |
| Total | 196 (4.8%) | 153 (14.0%) |
Race in Albany
The most populous races in Albany are White / Caucasian (9,465 | 47.3%), Asian (6,029 | 30.1%), and Two or more Races (2,842 | 14.2%).
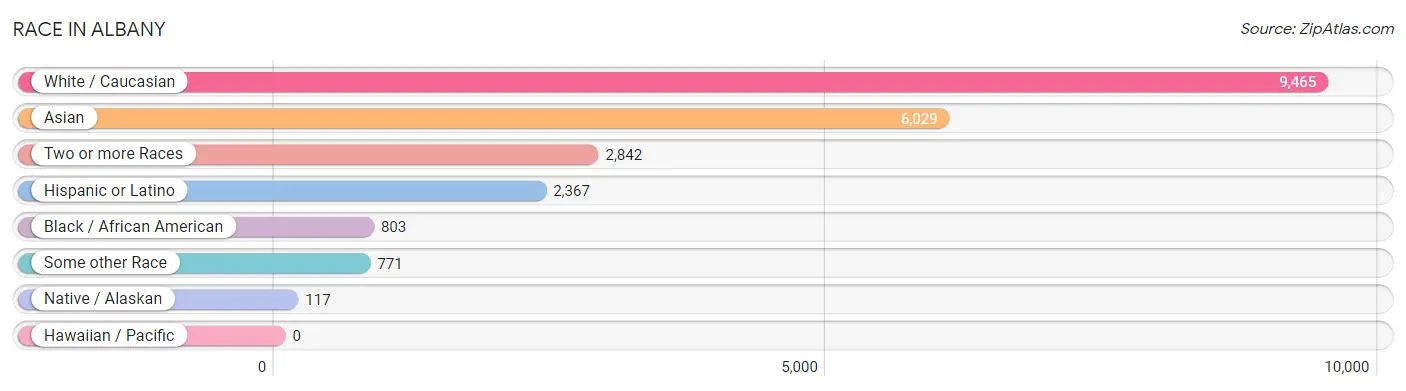
| Race | # Population | % Population |
| Asian | 6,029 | 30.1% |
| Black / African American | 803 | 4.0% |
| Hawaiian / Pacific | 0 | 0.0% |
| Hispanic or Latino | 2,367 | 11.8% |
| Native / Alaskan | 117 | 0.6% |
| White / Caucasian | 9,465 | 47.3% |
| Two or more Races | 2,842 | 14.2% |
| Some other Race | 771 | 3.8% |
| Total | 20,027 | 100.0% |
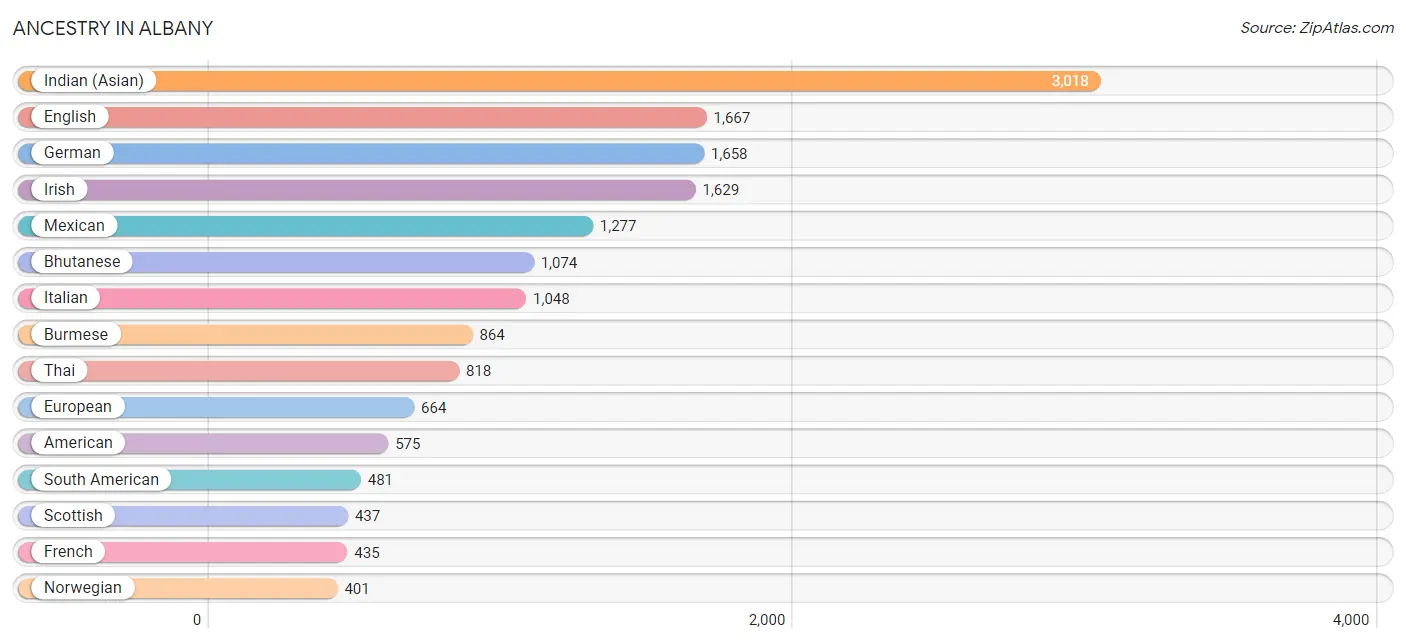
Ancestry in Albany
The most populous ancestries reported in Albany are Indian (Asian) (3,018 | 15.1%), English (1,667 | 8.3%), German (1,658 | 8.3%), Irish (1,629 | 8.1%), and Mexican (1,277 | 6.4%), together accounting for 46.2% of all Albany residents.
| Ancestry | # Population | % Population |
| Afghan | 10 | 0.1% |
| African | 85 | 0.4% |
| Alaskan Athabascan | 2 | 0.0% |
| Albanian | 169 | 0.8% |
| American | 575 | 2.9% |
| Arab | 107 | 0.5% |
| Argentinean | 174 | 0.9% |
| Armenian | 5 | 0.0% |
| Assyrian / Chaldean / Syriac | 5 | 0.0% |
| Australian | 17 | 0.1% |
| Austrian | 26 | 0.1% |
| Bangladeshi | 17 | 0.1% |
| Basque | 8 | 0.0% |
| Belgian | 10 | 0.1% |
| Bhutanese | 1,074 | 5.4% |
| Blackfeet | 14 | 0.1% |
| Brazilian | 80 | 0.4% |
| British | 276 | 1.4% |
| Bulgarian | 5 | 0.0% |
| Burmese | 864 | 4.3% |
| Cambodian | 88 | 0.4% |
| Canadian | 5 | 0.0% |
| Central American | 261 | 1.3% |
| Central American Indian | 15 | 0.1% |
| Cherokee | 52 | 0.3% |
| Chickasaw | 7 | 0.0% |
| Chilean | 71 | 0.4% |
| Choctaw | 6 | 0.0% |
| Colombian | 71 | 0.4% |
| Costa Rican | 13 | 0.1% |
| Croatian | 26 | 0.1% |
| Cuban | 51 | 0.3% |
| Cypriot | 6 | 0.0% |
| Czech | 49 | 0.2% |
| Czechoslovakian | 15 | 0.1% |
| Danish | 240 | 1.2% |
| Dominican | 8 | 0.0% |
| Dutch | 188 | 0.9% |
| Eastern European | 230 | 1.1% |
| Ecuadorian | 116 | 0.6% |
| Egyptian | 5 | 0.0% |
| English | 1,667 | 8.3% |
| European | 664 | 3.3% |
| Filipino | 381 | 1.9% |
| Finnish | 44 | 0.2% |
| French | 435 | 2.2% |
| French Canadian | 89 | 0.4% |
| German | 1,658 | 8.3% |
| Greek | 103 | 0.5% |
| Guatemalan | 78 | 0.4% |
| Hungarian | 252 | 1.3% |
| Indian (Asian) | 3,018 | 15.1% |
| Indonesian | 15 | 0.1% |
| Iranian | 343 | 1.7% |
| Iraqi | 6 | 0.0% |
| Irish | 1,629 | 8.1% |
| Iroquois | 7 | 0.0% |
| Israeli | 11 | 0.1% |
| Italian | 1,048 | 5.2% |
| Jamaican | 117 | 0.6% |
| Japanese | 23 | 0.1% |
| Kenyan | 2 | 0.0% |
| Korean | 390 | 1.9% |
| Laotian | 16 | 0.1% |
| Lebanese | 12 | 0.1% |
| Lithuanian | 82 | 0.4% |
| Luxembourger | 11 | 0.1% |
| Macedonian | 8 | 0.0% |
| Malaysian | 124 | 0.6% |
| Mexican | 1,277 | 6.4% |
| Mexican American Indian | 8 | 0.0% |
| Mongolian | 21 | 0.1% |
| Native Hawaiian | 50 | 0.3% |
| Navajo | 8 | 0.0% |
| Nicaraguan | 46 | 0.2% |
| Nigerian | 60 | 0.3% |
| Northern European | 88 | 0.4% |
| Norwegian | 401 | 2.0% |
| Okinawan | 41 | 0.2% |
| Pakistani | 102 | 0.5% |
| Panamanian | 33 | 0.2% |
| Peruvian | 39 | 0.2% |
| Polish | 394 | 2.0% |
| Portuguese | 160 | 0.8% |
| Puerto Rican | 102 | 0.5% |
| Romanian | 78 | 0.4% |
| Russian | 392 | 2.0% |
| Salvadoran | 81 | 0.4% |
| Scandinavian | 78 | 0.4% |
| Scotch-Irish | 242 | 1.2% |
| Scottish | 437 | 2.2% |
| Serbian | 12 | 0.1% |
| Slavic | 43 | 0.2% |
| Slovak | 25 | 0.1% |
| South African | 34 | 0.2% |
| South American | 481 | 2.4% |
| Spaniard | 10 | 0.1% |
| Spanish | 61 | 0.3% |
| Sri Lankan | 275 | 1.4% |
| Subsaharan African | 181 | 0.9% |
| Swedish | 293 | 1.5% |
| Swiss | 45 | 0.2% |
| Syrian | 4 | 0.0% |
| Thai | 818 | 4.1% |
| Turkish | 140 | 0.7% |
| Ukrainian | 51 | 0.3% |
| Vietnamese | 9 | 0.0% |
| Welsh | 216 | 1.1% |
| West Indian | 20 | 0.1% | View All 109 Rows |
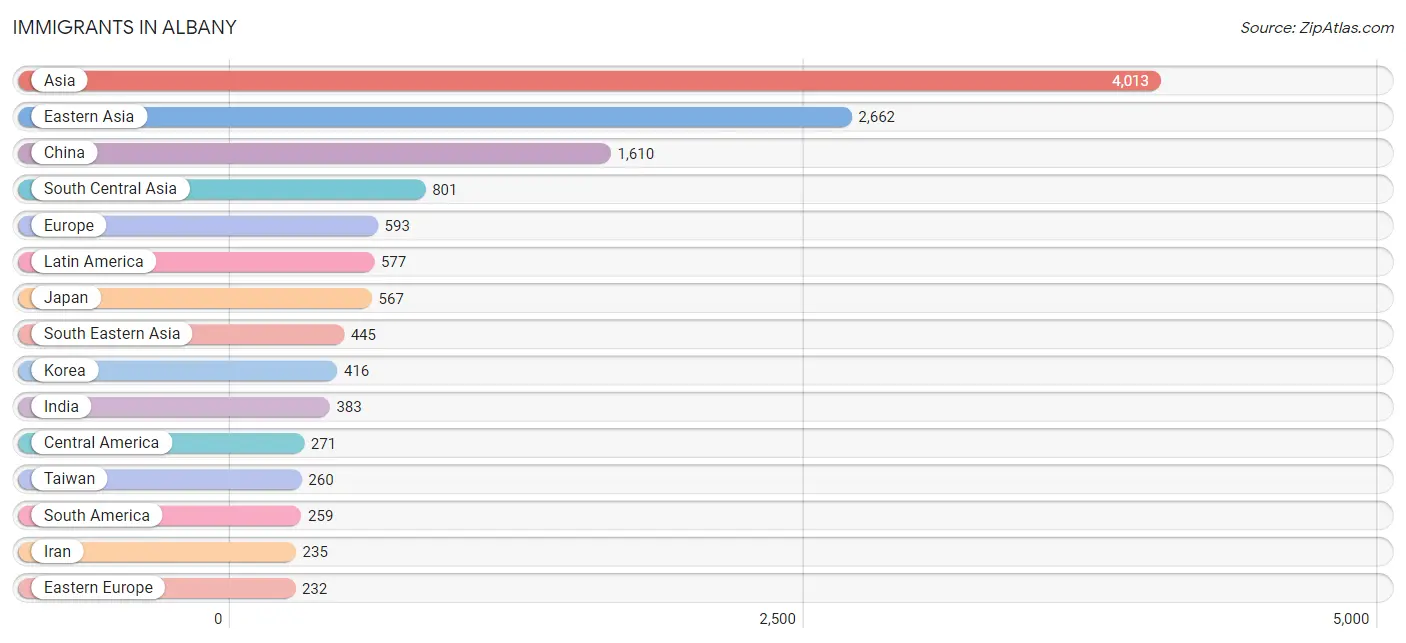
Immigrants in Albany
The most numerous immigrant groups reported in Albany came from Asia (4,013 | 20.0%), Eastern Asia (2,662 | 13.3%), China (1,610 | 8.0%), South Central Asia (801 | 4.0%), and Europe (593 | 3.0%), together accounting for 48.3% of all Albany residents.
| Immigration Origin | # Population | % Population |
| Africa | 115 | 0.6% |
| Albania | 84 | 0.4% |
| Argentina | 60 | 0.3% |
| Asia | 4,013 | 20.0% |
| Australia | 25 | 0.1% |
| Austria | 5 | 0.0% |
| Brazil | 77 | 0.4% |
| Canada | 94 | 0.5% |
| Caribbean | 47 | 0.2% |
| Central America | 271 | 1.3% |
| Chile | 47 | 0.2% |
| China | 1,610 | 8.0% |
| Colombia | 23 | 0.1% |
| Czechoslovakia | 45 | 0.2% |
| Denmark | 6 | 0.0% |
| Eastern Africa | 2 | 0.0% |
| Eastern Asia | 2,662 | 13.3% |
| Eastern Europe | 232 | 1.2% |
| Ecuador | 6 | 0.0% |
| Egypt | 5 | 0.0% |
| El Salvador | 56 | 0.3% |
| England | 30 | 0.2% |
| Europe | 593 | 3.0% |
| France | 74 | 0.4% |
| Germany | 56 | 0.3% |
| Guatemala | 18 | 0.1% |
| Hong Kong | 128 | 0.6% |
| Hungary | 6 | 0.0% |
| India | 383 | 1.9% |
| Indonesia | 52 | 0.3% |
| Iran | 235 | 1.2% |
| Iraq | 6 | 0.0% |
| Ireland | 23 | 0.1% |
| Israel | 29 | 0.1% |
| Italy | 22 | 0.1% |
| Jamaica | 47 | 0.2% |
| Japan | 567 | 2.8% |
| Kazakhstan | 59 | 0.3% |
| Kenya | 2 | 0.0% |
| Korea | 416 | 2.1% |
| Kuwait | 20 | 0.1% |
| Laos | 44 | 0.2% |
| Latin America | 577 | 2.9% |
| Lithuania | 5 | 0.0% |
| Malaysia | 29 | 0.1% |
| Mexico | 197 | 1.0% |
| Nepal | 82 | 0.4% |
| Netherlands | 22 | 0.1% |
| Nigeria | 49 | 0.2% |
| Northern Africa | 46 | 0.2% |
| Northern Europe | 119 | 0.6% |
| Oceania | 25 | 0.1% |
| Pakistan | 42 | 0.2% |
| Peru | 40 | 0.2% |
| Philippines | 130 | 0.6% |
| Poland | 9 | 0.0% |
| Romania | 23 | 0.1% |
| Russia | 47 | 0.2% |
| Saudi Arabia | 8 | 0.0% |
| Singapore | 57 | 0.3% |
| South Africa | 18 | 0.1% |
| South America | 259 | 1.3% |
| South Central Asia | 801 | 4.0% |
| South Eastern Asia | 445 | 2.2% |
| Southern Europe | 52 | 0.3% |
| Spain | 30 | 0.2% |
| Sweden | 8 | 0.0% |
| Switzerland | 33 | 0.2% |
| Taiwan | 260 | 1.3% |
| Thailand | 45 | 0.2% |
| Turkey | 36 | 0.2% |
| Ukraine | 9 | 0.0% |
| Vietnam | 81 | 0.4% |
| Western Africa | 49 | 0.2% |
| Western Asia | 105 | 0.5% |
| Western Europe | 190 | 0.9% | View All 76 Rows |
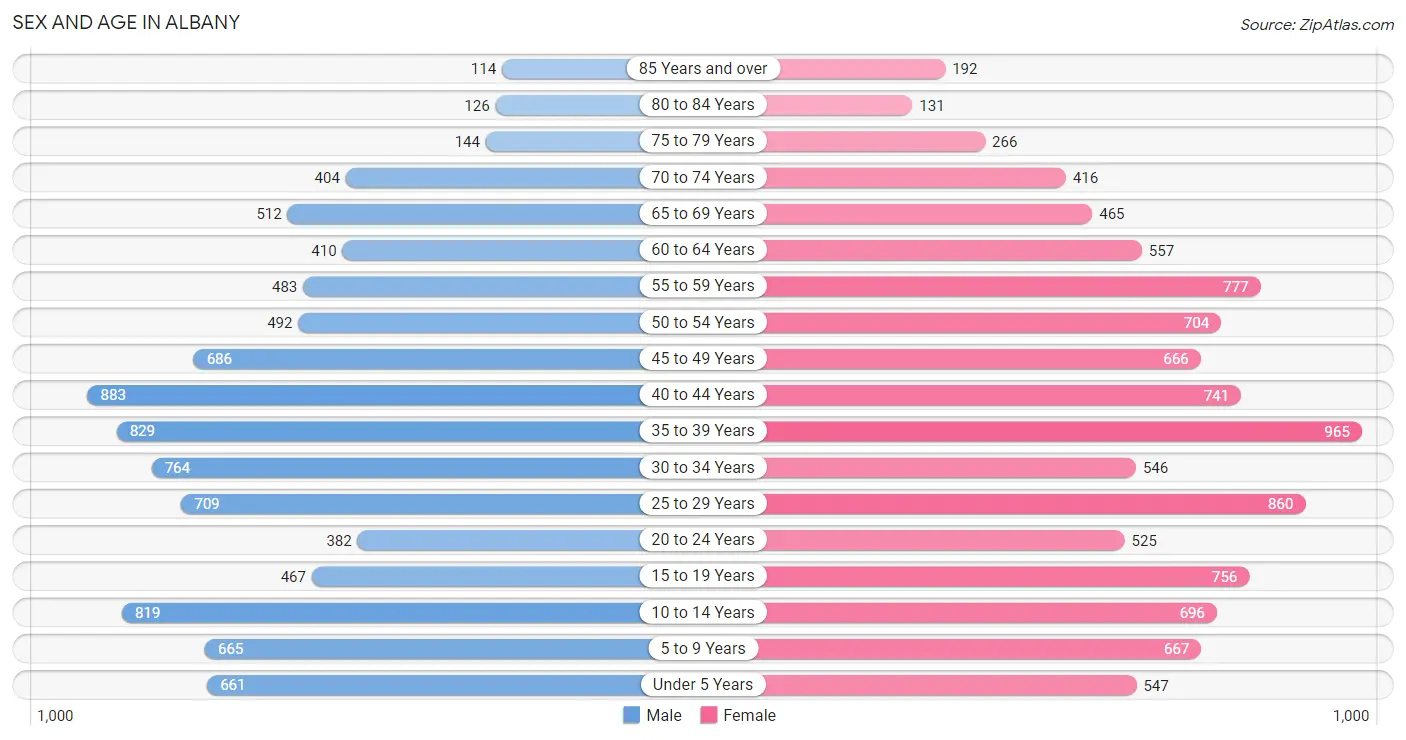
Sex and Age in Albany
Sex and Age in Albany
The most populous age groups in Albany are 40 to 44 Years (883 | 9.2%) for men and 35 to 39 Years (965 | 9.2%) for women.
| Age Bracket | Male | Female |
| Under 5 Years | 661 (6.9%) | 547 (5.2%) |
| 5 to 9 Years | 665 (7.0%) | 667 (6.4%) |
| 10 to 14 Years | 819 (8.6%) | 696 (6.6%) |
| 15 to 19 Years | 467 (4.9%) | 756 (7.2%) |
| 20 to 24 Years | 382 (4.0%) | 525 (5.0%) |
| 25 to 29 Years | 709 (7.4%) | 860 (8.2%) |
| 30 to 34 Years | 764 (8.0%) | 546 (5.2%) |
| 35 to 39 Years | 829 (8.7%) | 965 (9.2%) |
| 40 to 44 Years | 883 (9.2%) | 741 (7.1%) |
| 45 to 49 Years | 686 (7.2%) | 666 (6.4%) |
| 50 to 54 Years | 492 (5.1%) | 704 (6.7%) |
| 55 to 59 Years | 483 (5.1%) | 777 (7.4%) |
| 60 to 64 Years | 410 (4.3%) | 557 (5.3%) |
| 65 to 69 Years | 512 (5.4%) | 465 (4.4%) |
| 70 to 74 Years | 404 (4.2%) | 416 (4.0%) |
| 75 to 79 Years | 144 (1.5%) | 266 (2.5%) |
| 80 to 84 Years | 126 (1.3%) | 131 (1.3%) |
| 85 Years and over | 114 (1.2%) | 192 (1.8%) |
| Total | 9,550 (100.0%) | 10,477 (100.0%) |
Families and Households in Albany
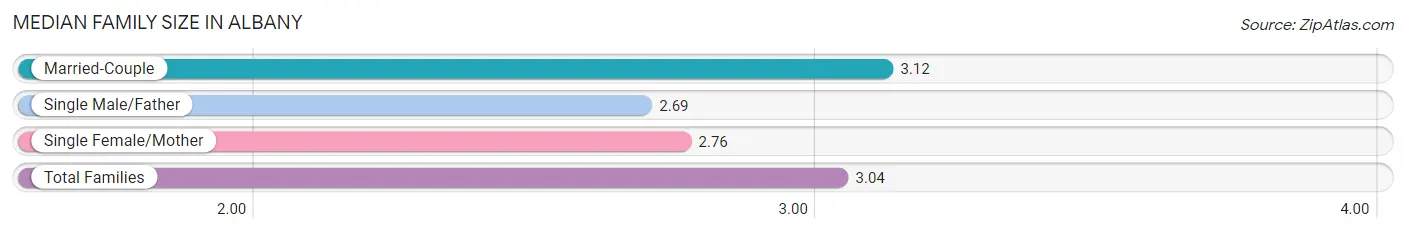
Median Family Size in Albany
The median family size in Albany is 3.04 persons per family, with married-couple families (4,082 | 78.8%) accounting for the largest median family size of 3.12 persons per family. On the other hand, single male/father families (212 | 4.1%) represent the smallest median family size with 2.69 persons per family.
| Family Type | # Families | Family Size |
| Married-Couple | 4,082 (78.8%) | 3.12 |
| Single Male/Father | 212 (4.1%) | 2.69 |
| Single Female/Mother | 883 (17.1%) | 2.76 |
| Total Families | 5,177 (100.0%) | 3.04 |
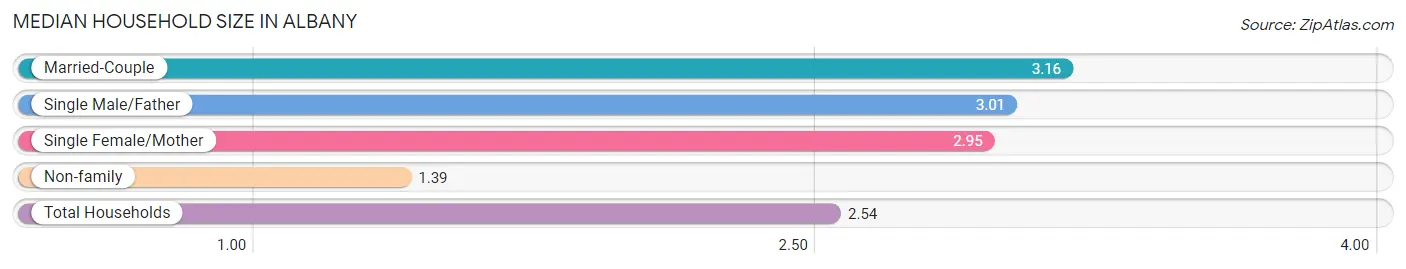
Median Household Size in Albany
The median household size in Albany is 2.54 persons per household, with married-couple households (4,082 | 52.7%) accounting for the largest median household size of 3.16 persons per household. non-family households (2,569 | 33.2%) represent the smallest median household size with 1.39 persons per household.
| Household Type | # Households | Household Size |
| Married-Couple | 4,082 (52.7%) | 3.16 |
| Single Male/Father | 212 (2.7%) | 3.01 |
| Single Female/Mother | 883 (11.4%) | 2.95 |
| Non-family | 2,569 (33.2%) | 1.39 |
| Total Households | 7,746 (100.0%) | 2.54 |
Household Size by Marriage Status in Albany
Out of a total of 7,746 households in Albany, 5,177 (66.8%) are family households, while 2,569 (33.2%) are nonfamily households. The most numerous type of family households are 2-person households, comprising 2,096, and the most common type of nonfamily households are 1-person households, comprising 1,790.
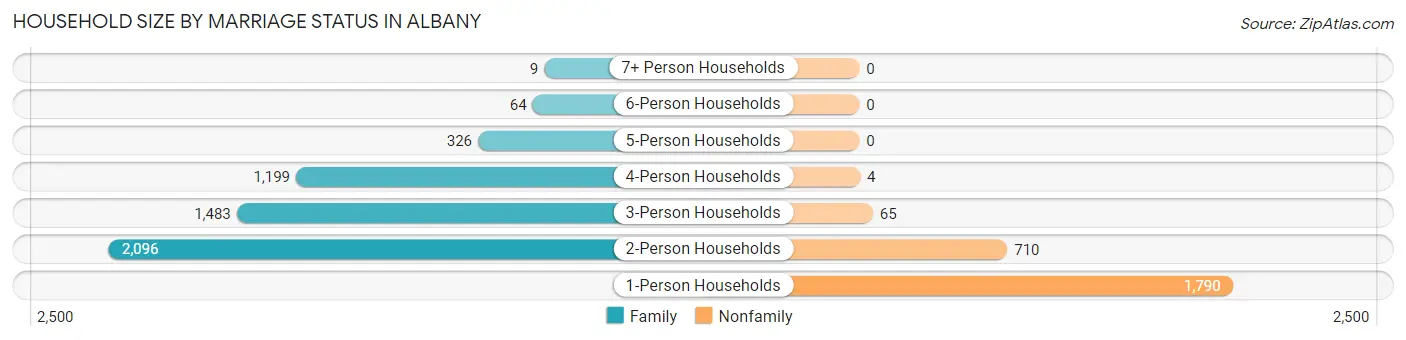
| Household Size | Family Households | Nonfamily Households |
| 1-Person Households | - | 1,790 (23.1%) |
| 2-Person Households | 2,096 (27.1%) | 710 (9.2%) |
| 3-Person Households | 1,483 (19.2%) | 65 (0.8%) |
| 4-Person Households | 1,199 (15.5%) | 4 (0.1%) |
| 5-Person Households | 326 (4.2%) | 0 (0.0%) |
| 6-Person Households | 64 (0.8%) | 0 (0.0%) |
| 7+ Person Households | 9 (0.1%) | 0 (0.0%) |
| Total | 5,177 (66.8%) | 2,569 (33.2%) |
Female Fertility in Albany
Fertility by Age in Albany
Average fertility rate in Albany is 38.0 births per 1,000 women. Women in the age bracket of 35 to 50 years have the highest fertility rate with 55.0 births per 1,000 women. Women in the age bracket of 35 to 50 years acount for 71.7% of all women with births.
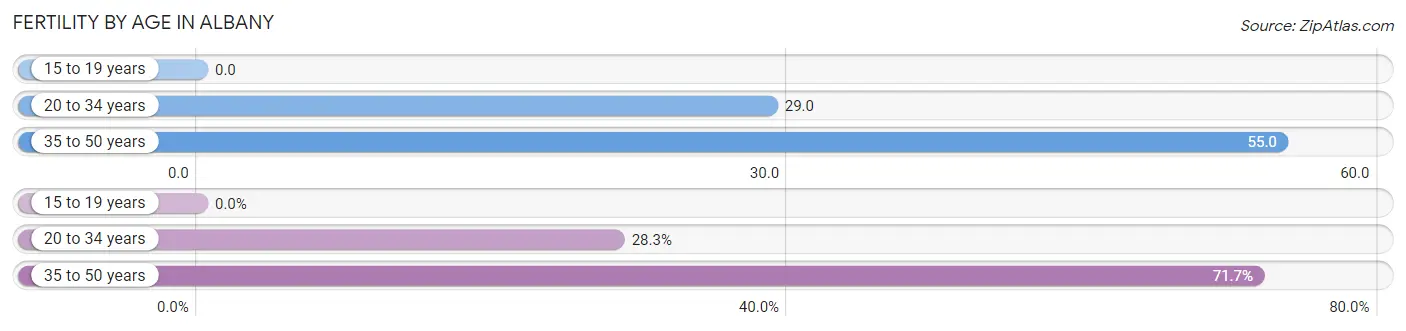
| Age Bracket | Women with Births | Births / 1,000 Women |
| 15 to 19 years | 0 (0.0%) | 0.0 |
| 20 to 34 years | 56 (28.3%) | 29.0 |
| 35 to 50 years | 142 (71.7%) | 55.0 |
| Total | 198 (100.0%) | 38.0 |
Fertility by Age by Marriage Status in Albany
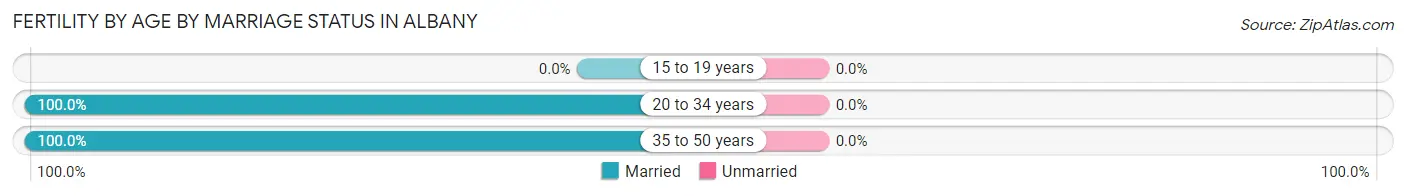
| Age Bracket | Married | Unmarried |
| 15 to 19 years | 0 (0.0%) | 0 (0.0%) |
| 20 to 34 years | 56 (100.0%) | 0 (0.0%) |
| 35 to 50 years | 142 (100.0%) | 0 (0.0%) |
| Total | 198 (100.0%) | 0 (0.0%) |
Fertility by Education in Albany
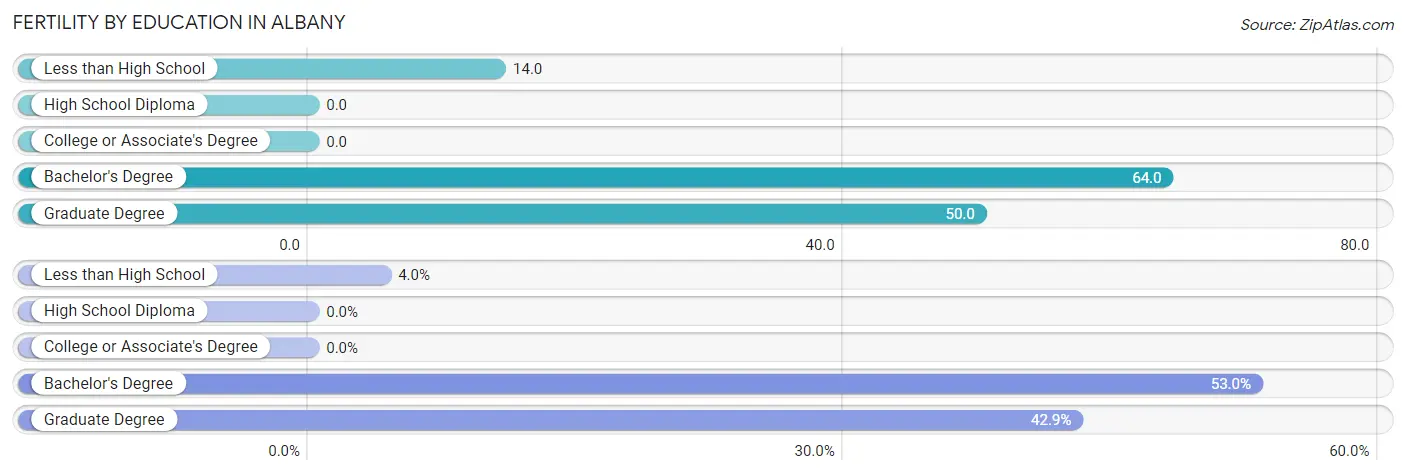
| Educational Attainment | Women with Births | Births / 1,000 Women |
| Less than High School | 8 (4.0%) | 14.0 |
| High School Diploma | 0 (0.0%) | 0.0 |
| College or Associate's Degree | 0 (0.0%) | 0.0 |
| Bachelor's Degree | 105 (53.0%) | 64.0 |
| Graduate Degree | 85 (42.9%) | 50.0 |
| Total | 198 (100.0%) | 38.0 |
Fertility by Education by Marriage Status in Albany
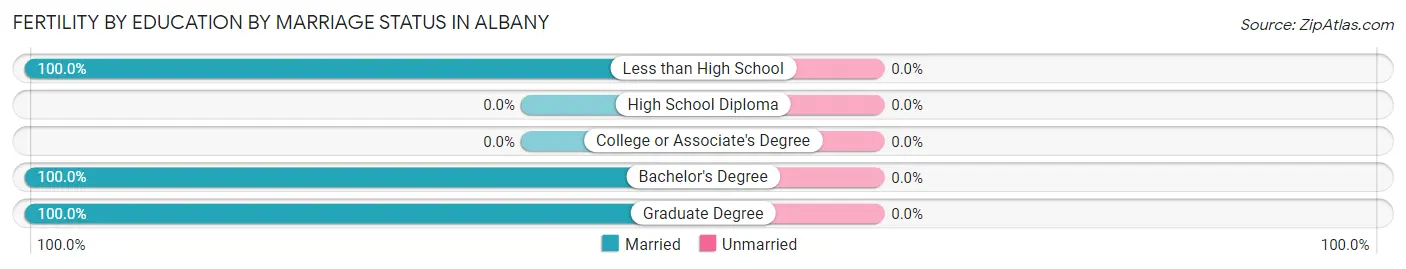
| Educational Attainment | Married | Unmarried |
| Less than High School | 8 (100.0%) | 0 (0.0%) |
| High School Diploma | 0 (0.0%) | 0 (0.0%) |
| College or Associate's Degree | 0 (0.0%) | 0 (0.0%) |
| Bachelor's Degree | 105 (100.0%) | 0 (0.0%) |
| Graduate Degree | 85 (100.0%) | 0 (0.0%) |
| Total | 198 (100.0%) | 0 (0.0%) |
Employment Characteristics in Albany
Employment by Class of Employer in Albany
Among the 10,087 employed individuals in Albany, private company employees (5,184 | 51.4%), state government employees (1,391 | 13.8%), and not-for-profit organizations (1,190 | 11.8%) make up the most common classes of employment.
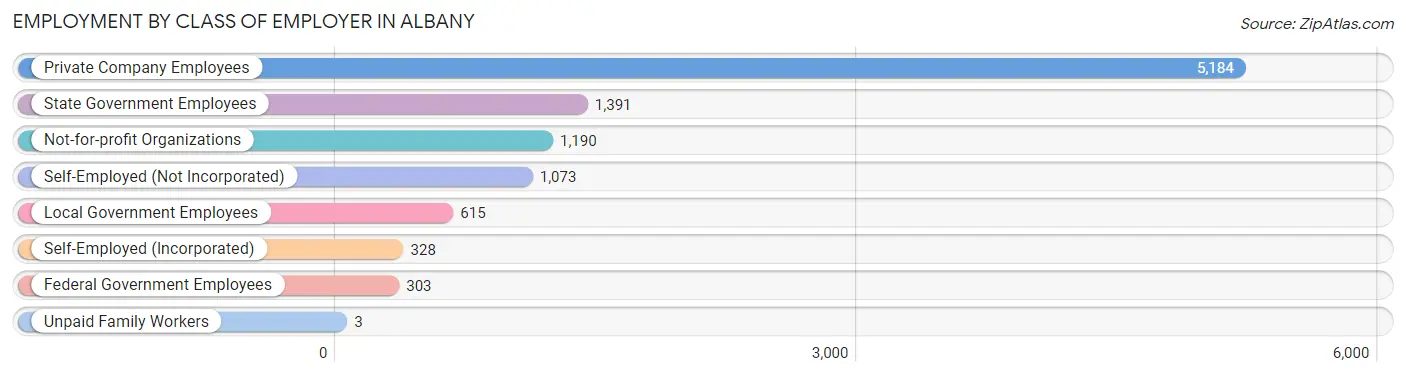
| Employer Class | # Employees | % Employees |
| Private Company Employees | 5,184 | 51.4% |
| Self-Employed (Incorporated) | 328 | 3.3% |
| Self-Employed (Not Incorporated) | 1,073 | 10.6% |
| Not-for-profit Organizations | 1,190 | 11.8% |
| Local Government Employees | 615 | 6.1% |
| State Government Employees | 1,391 | 13.8% |
| Federal Government Employees | 303 | 3.0% |
| Unpaid Family Workers | 3 | 0.0% |
| Total | 10,087 | 100.0% |
Employment Status by Age in Albany
According to the labor force statistics for Albany, out of the total population over 16 years of age (15,694), 68.2% or 10,703 individuals are in the labor force, with 3.3% or 353 of them unemployed. The age group with the highest labor force participation rate is 45 to 54 years, with 89.2% or 2,273 individuals in the labor force. Within the labor force, the 16 to 19 years age range has the highest percentage of unemployed individuals, with 12.9% or 23 of them being unemployed.
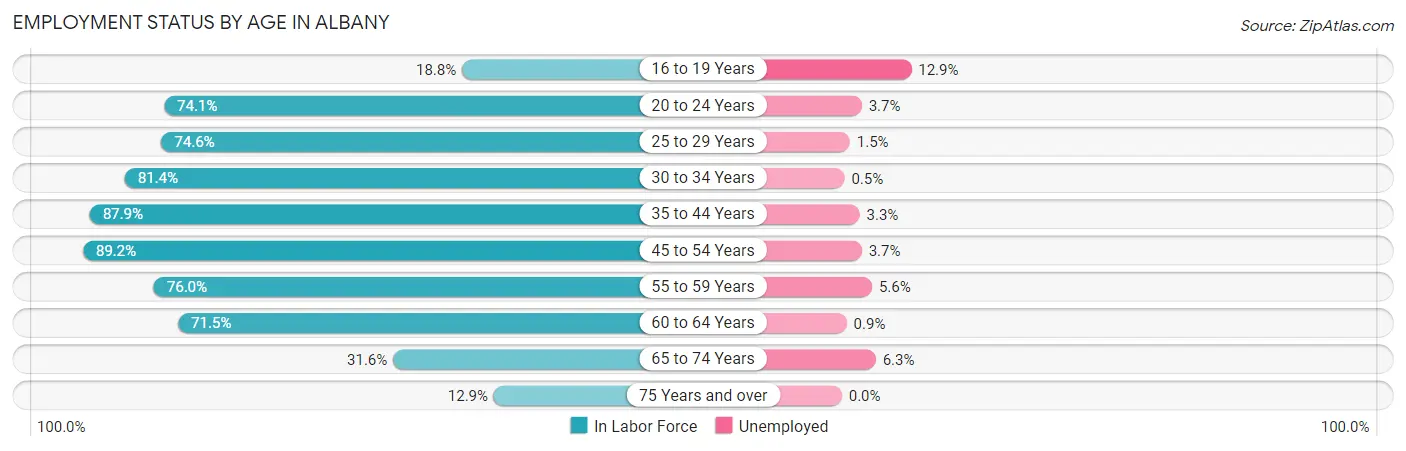
| Age Bracket | In Labor Force | Unemployed |
| 16 to 19 Years | 178 (18.8%) | 23 (12.9%) |
| 20 to 24 Years | 672 (74.1%) | 25 (3.7%) |
| 25 to 29 Years | 1,170 (74.6%) | 18 (1.5%) |
| 30 to 34 Years | 1,066 (81.4%) | 5 (0.5%) |
| 35 to 44 Years | 3,004 (87.9%) | 99 (3.3%) |
| 45 to 54 Years | 2,273 (89.2%) | 84 (3.7%) |
| 55 to 59 Years | 958 (76.0%) | 54 (5.6%) |
| 60 to 64 Years | 691 (71.5%) | 6 (0.9%) |
| 65 to 74 Years | 568 (31.6%) | 36 (6.3%) |
| 75 Years and over | 126 (12.9%) | 0 (0.0%) |
| Total | 10,703 (68.2%) | 353 (3.3%) |
Employment Status by Educational Attainment in Albany
According to labor force statistics for Albany, 82.8% of individuals (9,168) out of the total population between 25 and 64 years of age (11,072) are in the labor force, with 2.9% or 266 of them being unemployed. The group with the highest labor force participation rate are those with the educational attainment of bachelor's degree or higher, with 86.0% or 7,336 individuals in the labor force. Within the labor force, individuals with college / associate degree education have the highest percentage of unemployment, with 12.0% or 107 of them being unemployed.
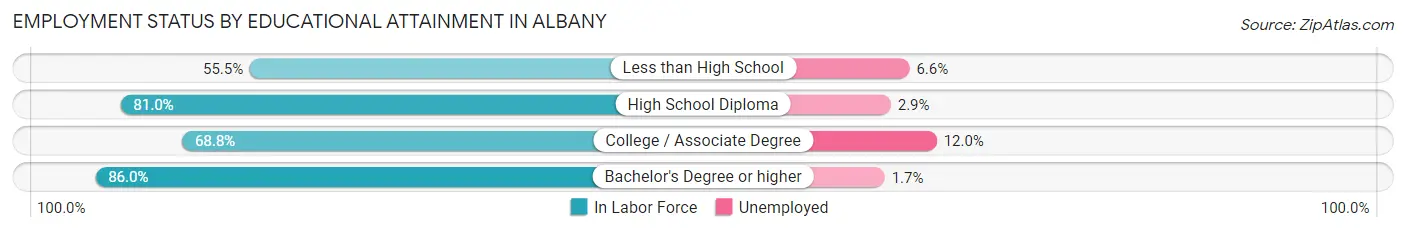
| Educational Attainment | In Labor Force | Unemployed |
| Less than High School | 151 (55.5%) | 18 (6.6%) |
| High School Diploma | 789 (81.0%) | 28 (2.9%) |
| College / Associate Degree | 892 (68.8%) | 156 (12.0%) |
| Bachelor's Degree or higher | 7,336 (86.0%) | 145 (1.7%) |
| Total | 9,168 (82.8%) | 321 (2.9%) |
Employment Occupations by Sex in Albany
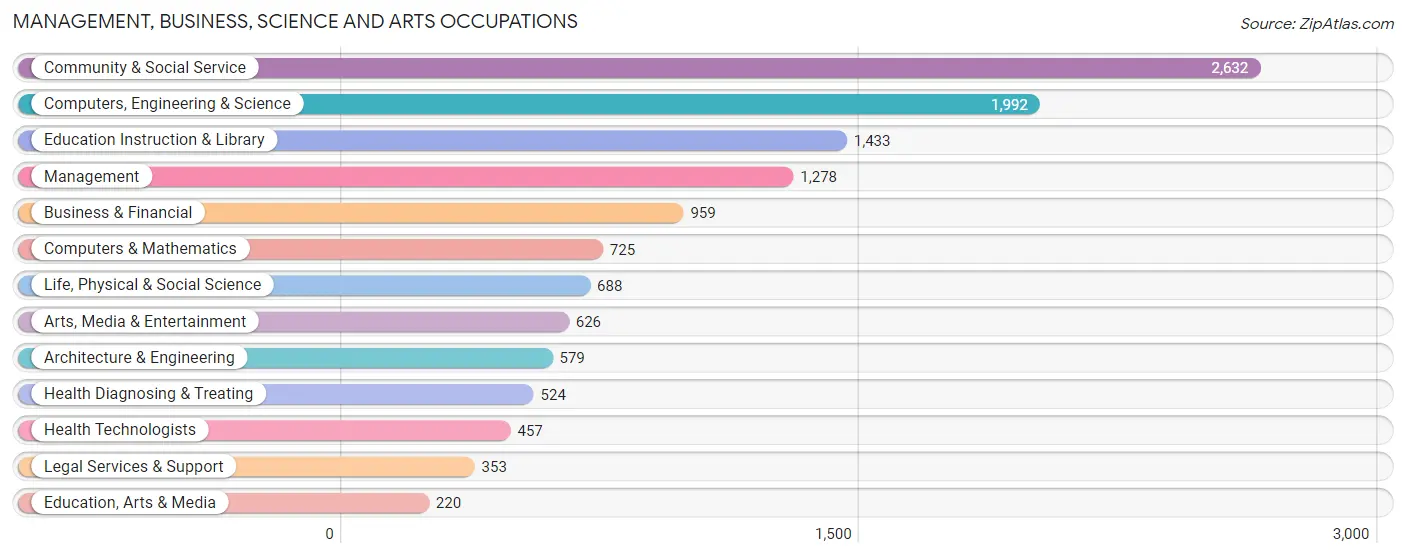
Management, Business, Science and Arts Occupations
The most common Management, Business, Science and Arts occupations in Albany are Community & Social Service (2,632 | 25.5%), Computers, Engineering & Science (1,992 | 19.3%), Education Instruction & Library (1,433 | 13.9%), Management (1,278 | 12.4%), and Business & Financial (959 | 9.3%).
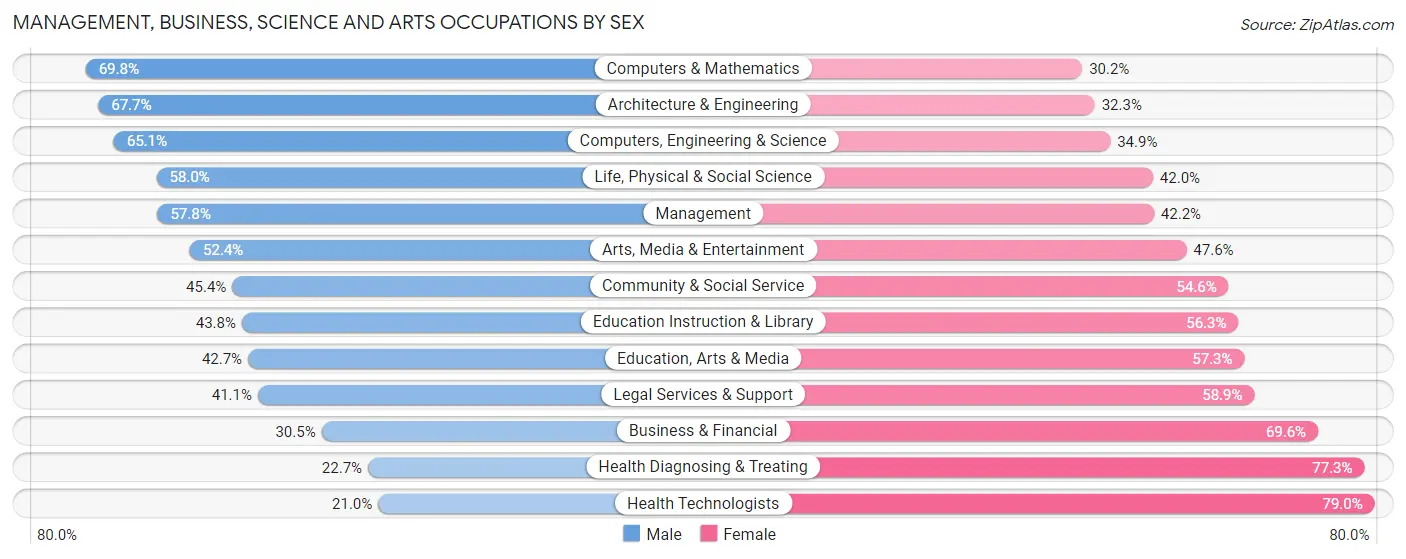
Management, Business, Science and Arts Occupations by Sex
Within the Management, Business, Science and Arts occupations in Albany, the most male-oriented occupations are Computers & Mathematics (69.8%), Architecture & Engineering (67.7%), and Computers, Engineering & Science (65.1%), while the most female-oriented occupations are Health Technologists (79.0%), Health Diagnosing & Treating (77.3%), and Business & Financial (69.6%).
| Occupation | Male | Female |
| Management | 739 (57.8%) | 539 (42.2%) |
| Business & Financial | 292 (30.4%) | 667 (69.6%) |
| Computers, Engineering & Science | 1,297 (65.1%) | 695 (34.9%) |
| Computers & Mathematics | 506 (69.8%) | 219 (30.2%) |
| Architecture & Engineering | 392 (67.7%) | 187 (32.3%) |
| Life, Physical & Social Science | 399 (58.0%) | 289 (42.0%) |
| Community & Social Service | 1,194 (45.4%) | 1,438 (54.6%) |
| Education, Arts & Media | 94 (42.7%) | 126 (57.3%) |
| Legal Services & Support | 145 (41.1%) | 208 (58.9%) |
| Education Instruction & Library | 627 (43.8%) | 806 (56.2%) |
| Arts, Media & Entertainment | 328 (52.4%) | 298 (47.6%) |
| Health Diagnosing & Treating | 119 (22.7%) | 405 (77.3%) |
| Health Technologists | 96 (21.0%) | 361 (79.0%) |
| Total (Category) | 3,641 (49.3%) | 3,744 (50.7%) |
| Total (Overall) | 5,222 (50.5%) | 5,117 (49.5%) |
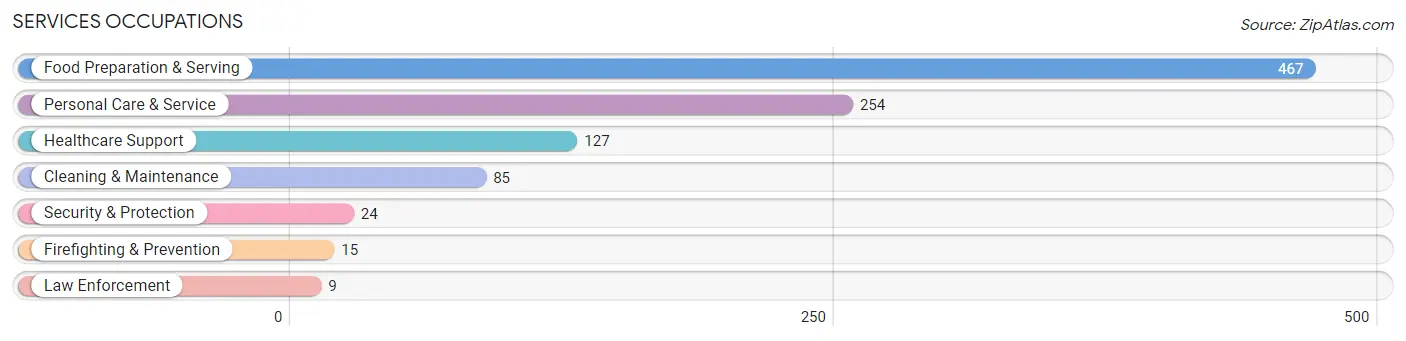
Services Occupations
The most common Services occupations in Albany are Food Preparation & Serving (467 | 4.5%), Personal Care & Service (254 | 2.5%), Healthcare Support (127 | 1.2%), Cleaning & Maintenance (85 | 0.8%), and Security & Protection (24 | 0.2%).
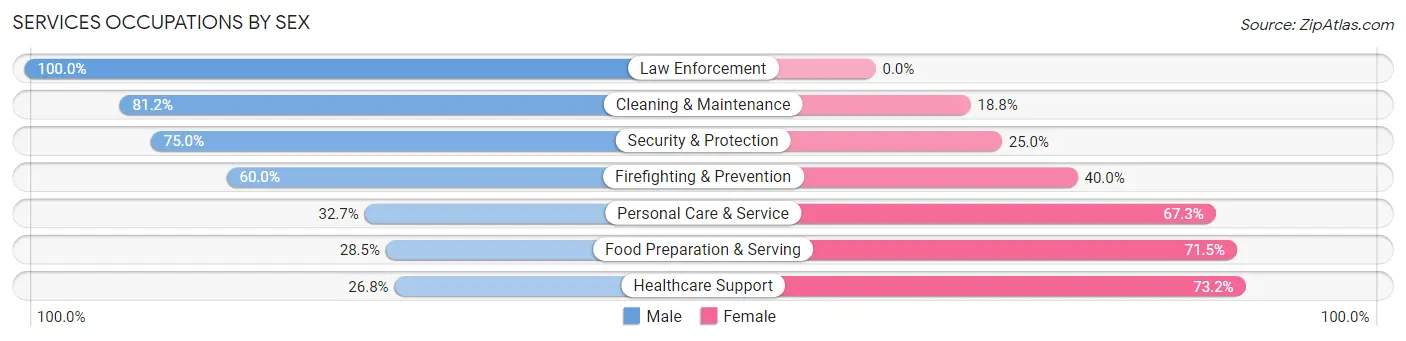
Services Occupations by Sex
Within the Services occupations in Albany, the most male-oriented occupations are Law Enforcement (100.0%), Cleaning & Maintenance (81.2%), and Security & Protection (75.0%), while the most female-oriented occupations are Healthcare Support (73.2%), Food Preparation & Serving (71.5%), and Personal Care & Service (67.3%).
| Occupation | Male | Female |
| Healthcare Support | 34 (26.8%) | 93 (73.2%) |
| Security & Protection | 18 (75.0%) | 6 (25.0%) |
| Firefighting & Prevention | 9 (60.0%) | 6 (40.0%) |
| Law Enforcement | 9 (100.0%) | 0 (0.0%) |
| Food Preparation & Serving | 133 (28.5%) | 334 (71.5%) |
| Cleaning & Maintenance | 69 (81.2%) | 16 (18.8%) |
| Personal Care & Service | 83 (32.7%) | 171 (67.3%) |
| Total (Category) | 337 (35.2%) | 620 (64.8%) |
| Total (Overall) | 5,222 (50.5%) | 5,117 (49.5%) |
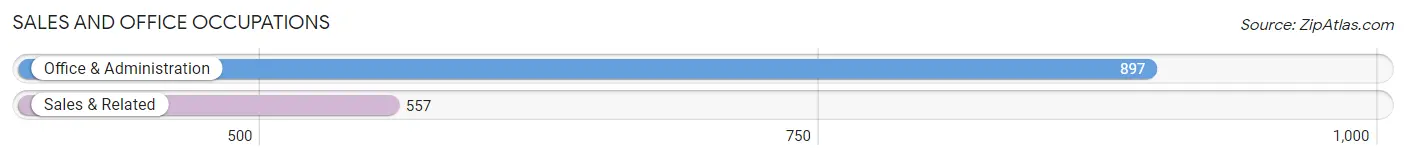
Sales and Office Occupations
The most common Sales and Office occupations in Albany are Office & Administration (897 | 8.7%), and Sales & Related (557 | 5.4%).
Sales and Office Occupations by Sex
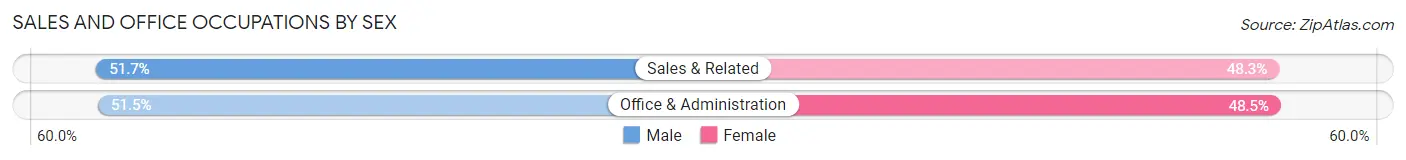
| Occupation | Male | Female |
| Sales & Related | 288 (51.7%) | 269 (48.3%) |
| Office & Administration | 462 (51.5%) | 435 (48.5%) |
| Total (Category) | 750 (51.6%) | 704 (48.4%) |
| Total (Overall) | 5,222 (50.5%) | 5,117 (49.5%) |
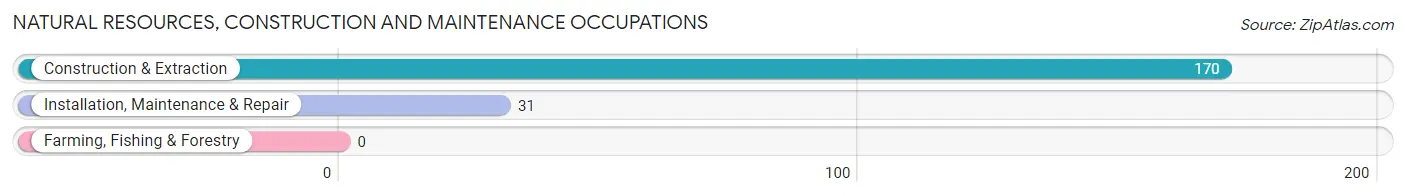
Natural Resources, Construction and Maintenance Occupations
The most common Natural Resources, Construction and Maintenance occupations in Albany are Construction & Extraction (170 | 1.6%), and Installation, Maintenance & Repair (31 | 0.3%).
Natural Resources, Construction and Maintenance Occupations by Sex
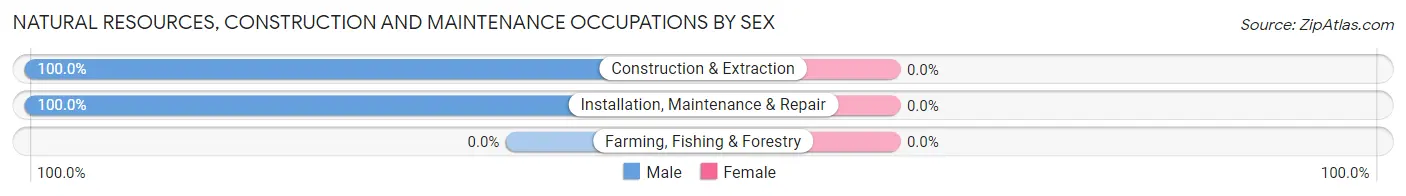
| Occupation | Male | Female |
| Farming, Fishing & Forestry | 0 (0.0%) | 0 (0.0%) |
| Construction & Extraction | 170 (100.0%) | 0 (0.0%) |
| Installation, Maintenance & Repair | 31 (100.0%) | 0 (0.0%) |
| Total (Category) | 201 (100.0%) | 0 (0.0%) |
| Total (Overall) | 5,222 (50.5%) | 5,117 (49.5%) |
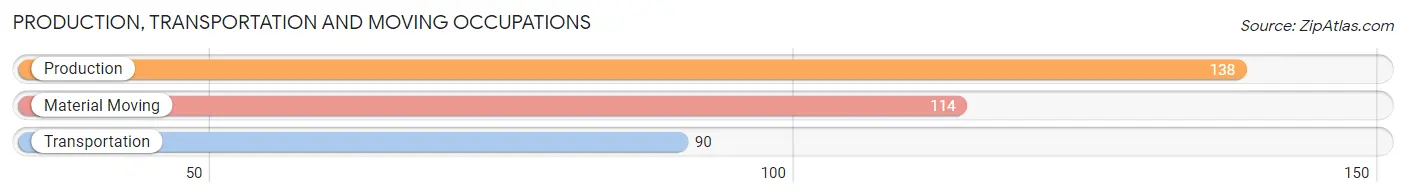
Production, Transportation and Moving Occupations
The most common Production, Transportation and Moving occupations in Albany are Production (138 | 1.3%), Material Moving (114 | 1.1%), and Transportation (90 | 0.9%).
Production, Transportation and Moving Occupations by Sex
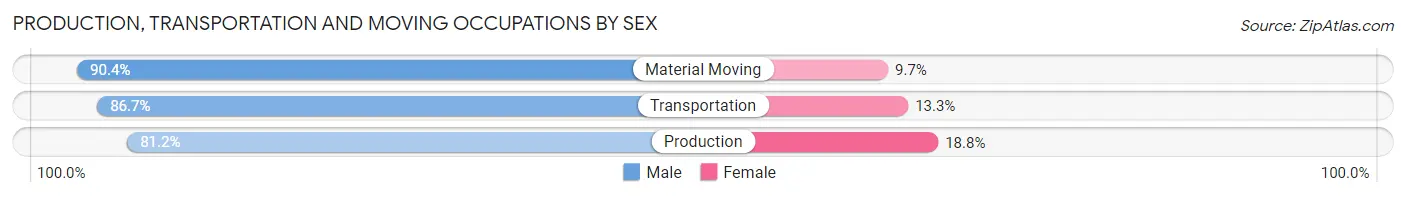
| Occupation | Male | Female |
| Production | 112 (81.2%) | 26 (18.8%) |
| Transportation | 78 (86.7%) | 12 (13.3%) |
| Material Moving | 103 (90.3%) | 11 (9.7%) |
| Total (Category) | 293 (85.7%) | 49 (14.3%) |
| Total (Overall) | 5,222 (50.5%) | 5,117 (49.5%) |
Employment Industries by Sex in Albany
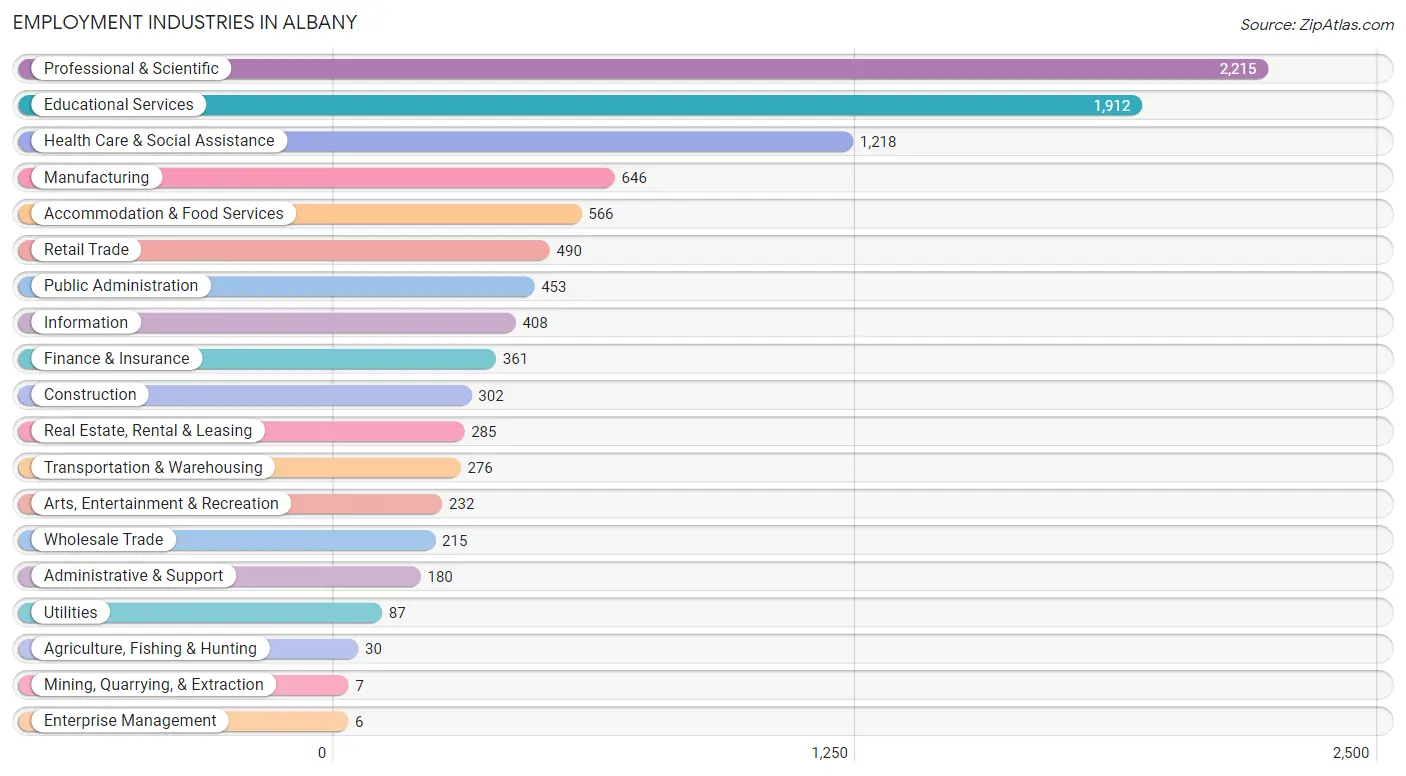
Employment Industries in Albany
The major employment industries in Albany include Professional & Scientific (2,215 | 21.4%), Educational Services (1,912 | 18.5%), Health Care & Social Assistance (1,218 | 11.8%), Manufacturing (646 | 6.2%), and Accommodation & Food Services (566 | 5.5%).
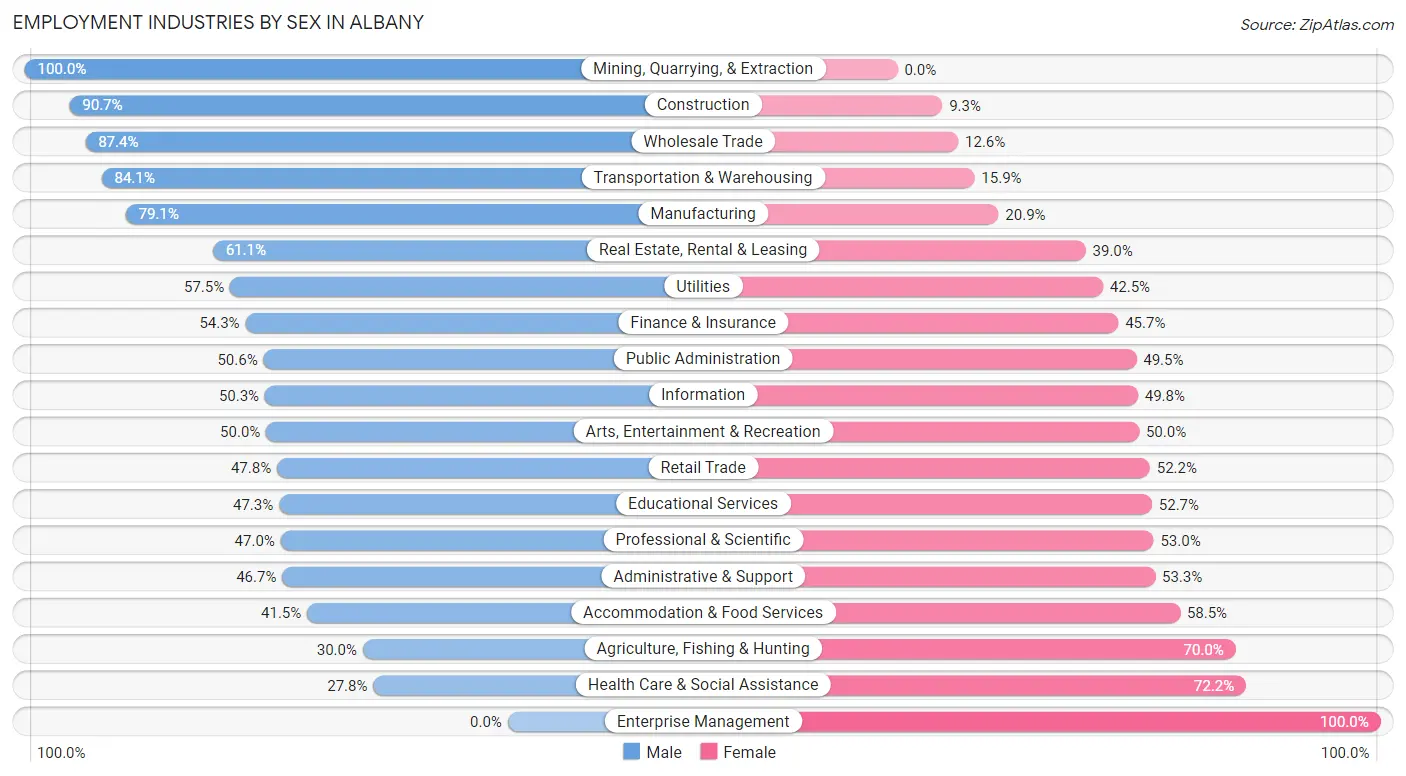
Employment Industries by Sex in Albany
The Albany industries that see more men than women are Mining, Quarrying, & Extraction (100.0%), Construction (90.7%), and Wholesale Trade (87.4%), whereas the industries that tend to have a higher number of women are Enterprise Management (100.0%), Health Care & Social Assistance (72.2%), and Agriculture, Fishing & Hunting (70.0%).
| Industry | Male | Female |
| Agriculture, Fishing & Hunting | 9 (30.0%) | 21 (70.0%) |
| Mining, Quarrying, & Extraction | 7 (100.0%) | 0 (0.0%) |
| Construction | 274 (90.7%) | 28 (9.3%) |
| Manufacturing | 511 (79.1%) | 135 (20.9%) |
| Wholesale Trade | 188 (87.4%) | 27 (12.6%) |
| Retail Trade | 234 (47.8%) | 256 (52.2%) |
| Transportation & Warehousing | 232 (84.1%) | 44 (15.9%) |
| Utilities | 50 (57.5%) | 37 (42.5%) |
| Information | 205 (50.2%) | 203 (49.7%) |
| Finance & Insurance | 196 (54.3%) | 165 (45.7%) |
| Real Estate, Rental & Leasing | 174 (61.1%) | 111 (39.0%) |
| Professional & Scientific | 1,041 (47.0%) | 1,174 (53.0%) |
| Enterprise Management | 0 (0.0%) | 6 (100.0%) |
| Administrative & Support | 84 (46.7%) | 96 (53.3%) |
| Educational Services | 905 (47.3%) | 1,007 (52.7%) |
| Health Care & Social Assistance | 339 (27.8%) | 879 (72.2%) |
| Arts, Entertainment & Recreation | 116 (50.0%) | 116 (50.0%) |
| Accommodation & Food Services | 235 (41.5%) | 331 (58.5%) |
| Public Administration | 229 (50.5%) | 224 (49.4%) |
| Total | 5,222 (50.5%) | 5,117 (49.5%) |
Education in Albany
School Enrollment in Albany
The most common levels of schooling among the 6,400 students in Albany are college / undergraduate (1,332 | 20.8%), middle school (1,109 | 17.3%), and high school (1,080 | 16.9%).
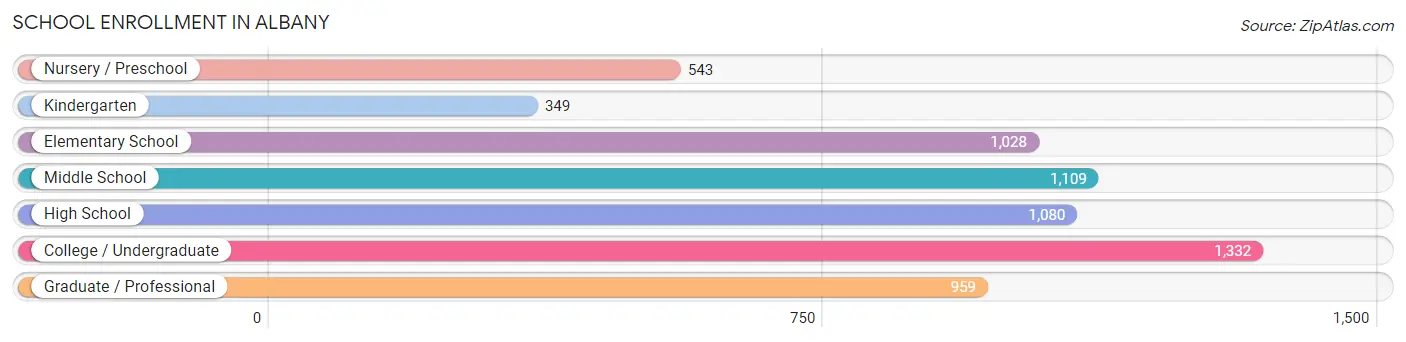
| School Level | # Students | % Students |
| Nursery / Preschool | 543 | 8.5% |
| Kindergarten | 349 | 5.4% |
| Elementary School | 1,028 | 16.1% |
| Middle School | 1,109 | 17.3% |
| High School | 1,080 | 16.9% |
| College / Undergraduate | 1,332 | 20.8% |
| Graduate / Professional | 959 | 15.0% |
| Total | 6,400 | 100.0% |
School Enrollment by Age by Funding Source in Albany
Out of a total of 6,400 students who are enrolled in schools in Albany, 915 (14.3%) attend a private institution, while the remaining 5,485 (85.7%) are enrolled in public schools. The age group of 3 to 4 year olds has the highest likelihood of being enrolled in private schools, with 256 (67.9% in the age bracket) enrolled. Conversely, the age group of 20 to 24 year olds has the lowest likelihood of being enrolled in a private school, with 612 (94.4% in the age bracket) attending a public institution.
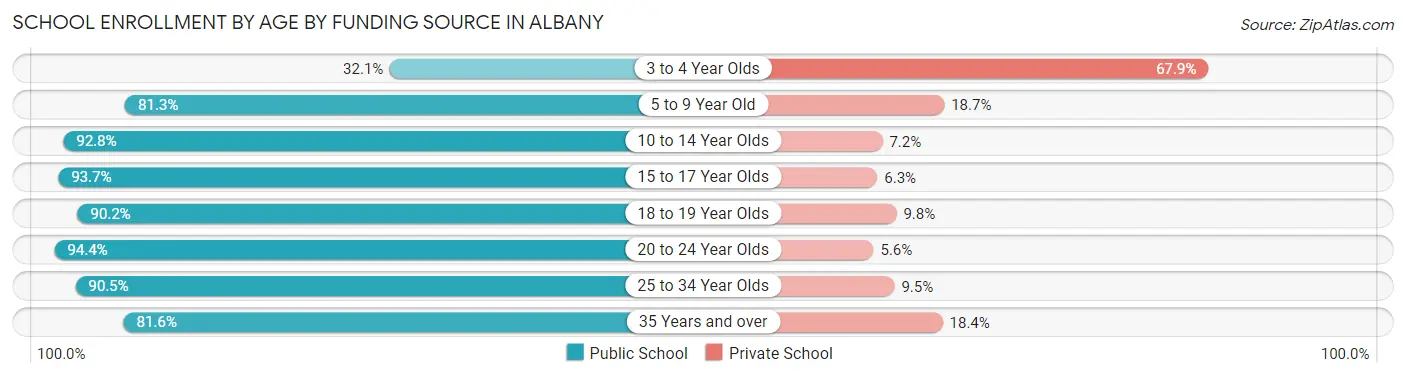
| Age Bracket | Public School | Private School |
| 3 to 4 Year Olds | 121 (32.1%) | 256 (67.9%) |
| 5 to 9 Year Old | 1,059 (81.3%) | 244 (18.7%) |
| 10 to 14 Year Olds | 1,400 (92.8%) | 109 (7.2%) |
| 15 to 17 Year Olds | 777 (93.7%) | 52 (6.3%) |
| 18 to 19 Year Olds | 330 (90.2%) | 36 (9.8%) |
| 20 to 24 Year Olds | 612 (94.4%) | 36 (5.6%) |
| 25 to 34 Year Olds | 718 (90.5%) | 75 (9.5%) |
| 35 Years and over | 469 (81.6%) | 106 (18.4%) |
| Total | 5,485 (85.7%) | 915 (14.3%) |
Educational Attainment by Field of Study in Albany
Social sciences (1,846 | 16.2%), literature & languages (1,289 | 11.3%), engineering (982 | 8.6%), business (905 | 7.9%), and bio, nature & agricultural (844 | 7.4%) are the most common fields of study among 11,431 individuals in Albany who have obtained a bachelor's degree or higher.
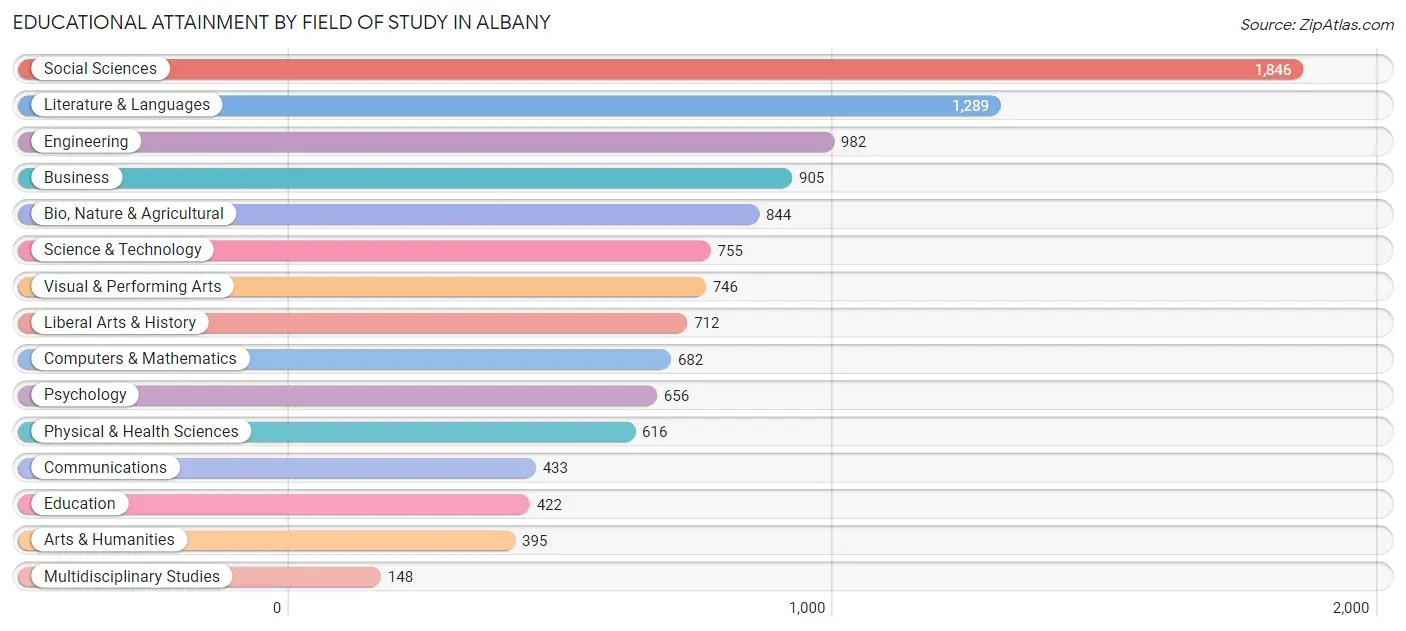
| Field of Study | # Graduates | % Graduates |
| Computers & Mathematics | 682 | 6.0% |
| Bio, Nature & Agricultural | 844 | 7.4% |
| Physical & Health Sciences | 616 | 5.4% |
| Psychology | 656 | 5.7% |
| Social Sciences | 1,846 | 16.2% |
| Engineering | 982 | 8.6% |
| Multidisciplinary Studies | 148 | 1.3% |
| Science & Technology | 755 | 6.6% |
| Business | 905 | 7.9% |
| Education | 422 | 3.7% |
| Literature & Languages | 1,289 | 11.3% |
| Liberal Arts & History | 712 | 6.2% |
| Visual & Performing Arts | 746 | 6.5% |
| Communications | 433 | 3.8% |
| Arts & Humanities | 395 | 3.5% |
| Total | 11,431 | 100.0% |
Transportation & Commute in Albany
Vehicle Availability by Sex in Albany
The most prevalent vehicle ownership categories in Albany are males with 2 vehicles (2,114, accounting for 41.7%) and females with 2 vehicles (2,125, making up 43.3%).
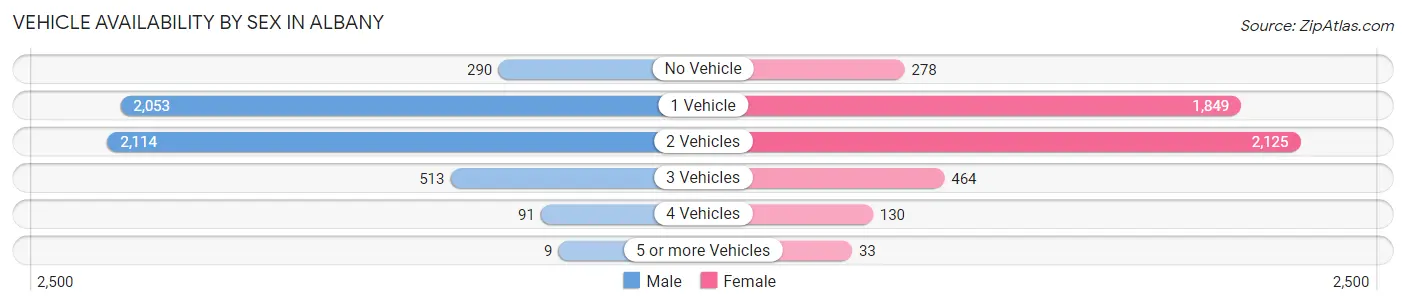
| Vehicles Available | Male | Female |
| No Vehicle | 290 (5.7%) | 278 (5.7%) |
| 1 Vehicle | 2,053 (40.5%) | 1,849 (37.9%) |
| 2 Vehicles | 2,114 (41.7%) | 2,125 (43.5%) |
| 3 Vehicles | 513 (10.1%) | 464 (9.5%) |
| 4 Vehicles | 91 (1.8%) | 130 (2.7%) |
| 5 or more Vehicles | 9 (0.2%) | 33 (0.7%) |
| Total | 5,070 (100.0%) | 4,879 (100.0%) |
Commute Time in Albany
The most frequently occuring commute durations in Albany are 30 to 34 minutes (1,002 commuters, 14.5%), 20 to 24 minutes (992 commuters, 14.3%), and 15 to 19 minutes (874 commuters, 12.6%).
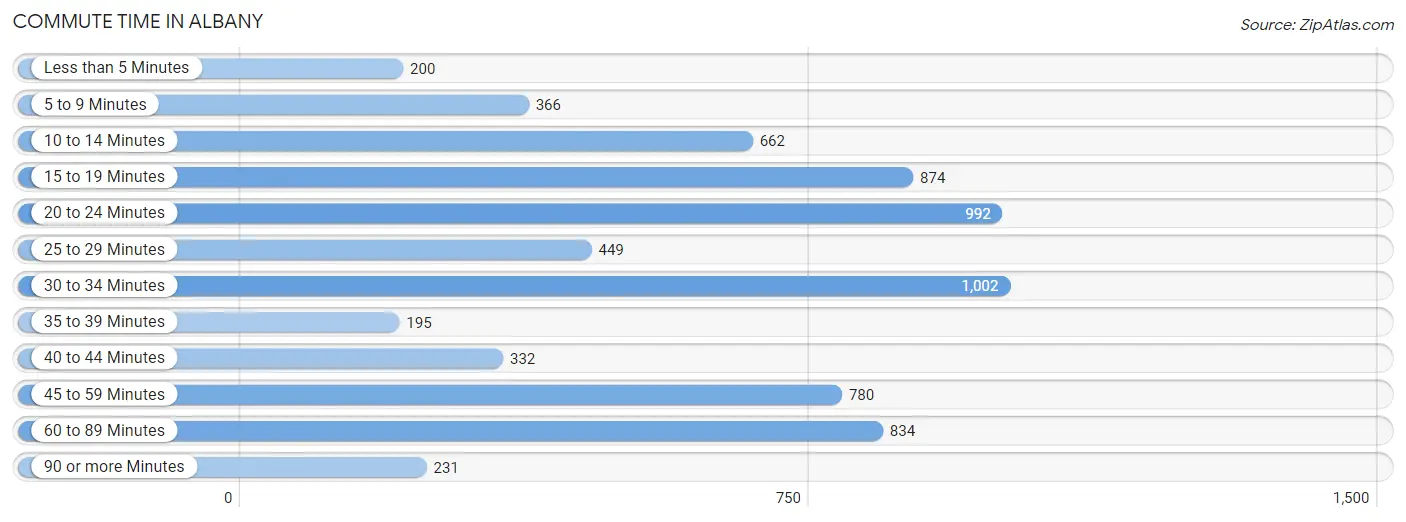
| Commute Time | # Commuters | % Commuters |
| Less than 5 Minutes | 200 | 2.9% |
| 5 to 9 Minutes | 366 | 5.3% |
| 10 to 14 Minutes | 662 | 9.6% |
| 15 to 19 Minutes | 874 | 12.6% |
| 20 to 24 Minutes | 992 | 14.3% |
| 25 to 29 Minutes | 449 | 6.5% |
| 30 to 34 Minutes | 1,002 | 14.5% |
| 35 to 39 Minutes | 195 | 2.8% |
| 40 to 44 Minutes | 332 | 4.8% |
| 45 to 59 Minutes | 780 | 11.3% |
| 60 to 89 Minutes | 834 | 12.1% |
| 90 or more Minutes | 231 | 3.3% |
Commute Time by Sex in Albany
The most common commute times in Albany are 30 to 34 minutes (618 commuters, 16.4%) for males and 20 to 24 minutes (538 commuters, 17.1%) for females.
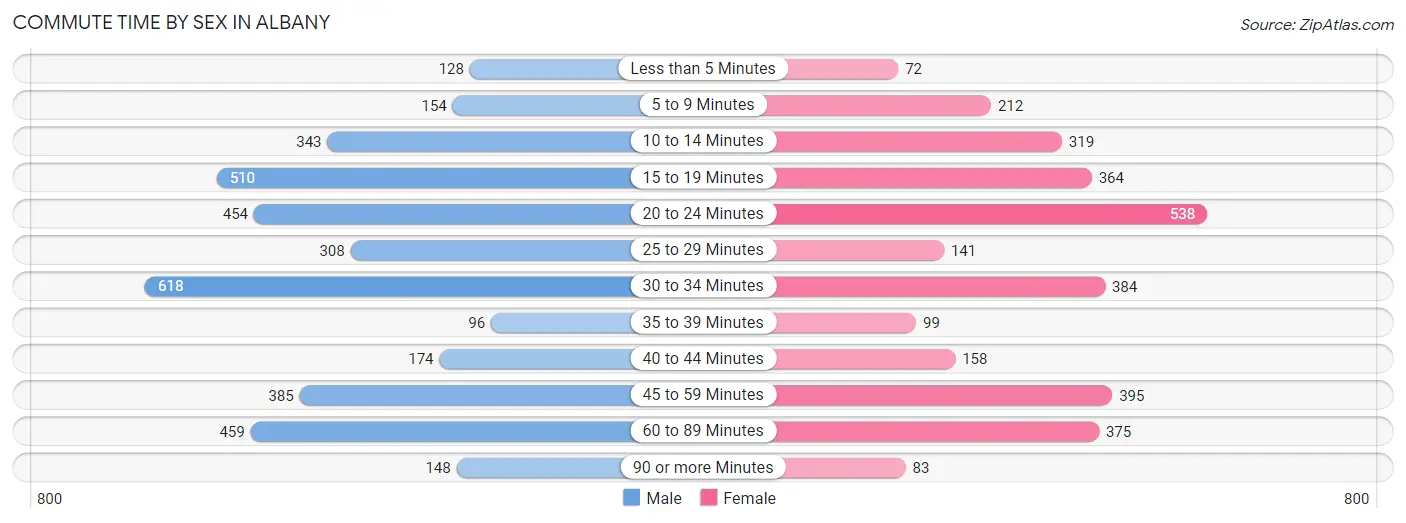
| Commute Time | Male | Female |
| Less than 5 Minutes | 128 (3.4%) | 72 (2.3%) |
| 5 to 9 Minutes | 154 (4.1%) | 212 (6.8%) |
| 10 to 14 Minutes | 343 (9.1%) | 319 (10.2%) |
| 15 to 19 Minutes | 510 (13.5%) | 364 (11.6%) |
| 20 to 24 Minutes | 454 (12.0%) | 538 (17.1%) |
| 25 to 29 Minutes | 308 (8.2%) | 141 (4.5%) |
| 30 to 34 Minutes | 618 (16.4%) | 384 (12.2%) |
| 35 to 39 Minutes | 96 (2.5%) | 99 (3.2%) |
| 40 to 44 Minutes | 174 (4.6%) | 158 (5.0%) |
| 45 to 59 Minutes | 385 (10.2%) | 395 (12.6%) |
| 60 to 89 Minutes | 459 (12.1%) | 375 (11.9%) |
| 90 or more Minutes | 148 (3.9%) | 83 (2.6%) |
Time of Departure to Work by Sex in Albany
The most frequent times of departure to work in Albany are 8:00 AM to 8:29 AM (731, 19.4%) for males and 8:00 AM to 8:29 AM (544, 17.3%) for females.
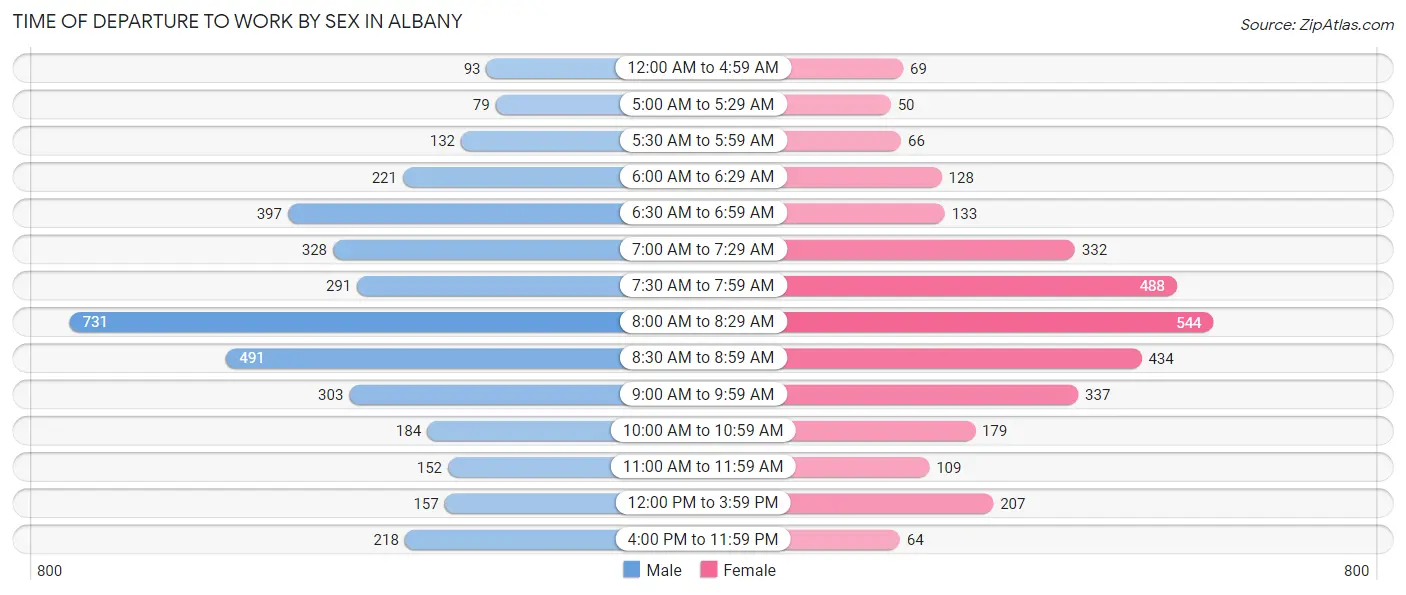
| Time of Departure | Male | Female |
| 12:00 AM to 4:59 AM | 93 (2.5%) | 69 (2.2%) |
| 5:00 AM to 5:29 AM | 79 (2.1%) | 50 (1.6%) |
| 5:30 AM to 5:59 AM | 132 (3.5%) | 66 (2.1%) |
| 6:00 AM to 6:29 AM | 221 (5.9%) | 128 (4.1%) |
| 6:30 AM to 6:59 AM | 397 (10.5%) | 133 (4.2%) |
| 7:00 AM to 7:29 AM | 328 (8.7%) | 332 (10.6%) |
| 7:30 AM to 7:59 AM | 291 (7.7%) | 488 (15.5%) |
| 8:00 AM to 8:29 AM | 731 (19.4%) | 544 (17.3%) |
| 8:30 AM to 8:59 AM | 491 (13.0%) | 434 (13.8%) |
| 9:00 AM to 9:59 AM | 303 (8.0%) | 337 (10.7%) |
| 10:00 AM to 10:59 AM | 184 (4.9%) | 179 (5.7%) |
| 11:00 AM to 11:59 AM | 152 (4.0%) | 109 (3.5%) |
| 12:00 PM to 3:59 PM | 157 (4.2%) | 207 (6.6%) |
| 4:00 PM to 11:59 PM | 218 (5.8%) | 64 (2.0%) |
| Total | 3,777 (100.0%) | 3,140 (100.0%) |
Housing Occupancy in Albany
Occupancy by Ownership in Albany
Of the total 7,746 dwellings in Albany, owner-occupied units account for 3,915 (50.5%), while renter-occupied units make up 3,831 (49.5%).
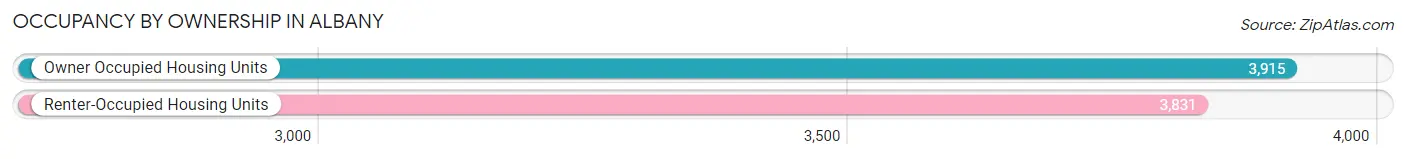
| Occupancy | # Housing Units | % Housing Units |
| Owner Occupied Housing Units | 3,915 | 50.5% |
| Renter-Occupied Housing Units | 3,831 | 49.5% |
| Total Occupied Housing Units | 7,746 | 100.0% |
Occupancy by Household Size in Albany
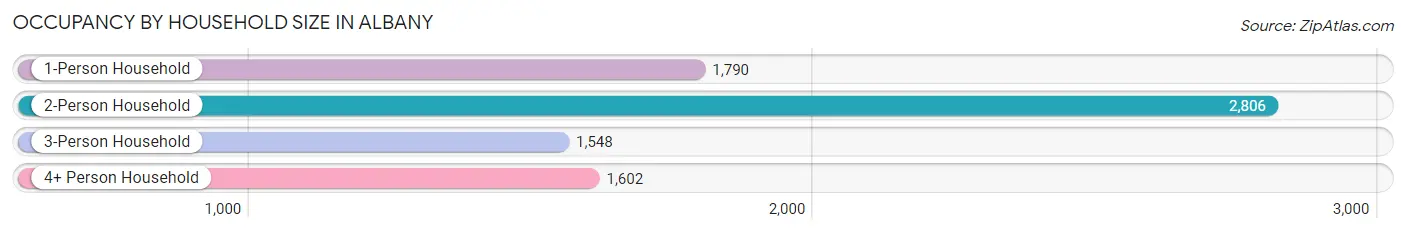
| Household Size | # Housing Units | % Housing Units |
| 1-Person Household | 1,790 | 23.1% |
| 2-Person Household | 2,806 | 36.2% |
| 3-Person Household | 1,548 | 20.0% |
| 4+ Person Household | 1,602 | 20.7% |
| Total Housing Units | 7,746 | 100.0% |
Occupancy by Ownership by Household Size in Albany
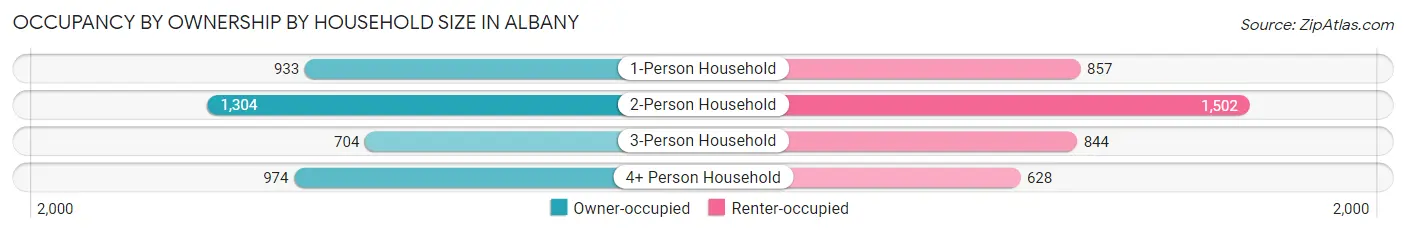
| Household Size | Owner-occupied | Renter-occupied |
| 1-Person Household | 933 (52.1%) | 857 (47.9%) |
| 2-Person Household | 1,304 (46.5%) | 1,502 (53.5%) |
| 3-Person Household | 704 (45.5%) | 844 (54.5%) |
| 4+ Person Household | 974 (60.8%) | 628 (39.2%) |
| Total Housing Units | 3,915 (50.5%) | 3,831 (49.5%) |
Occupancy by Educational Attainment in Albany
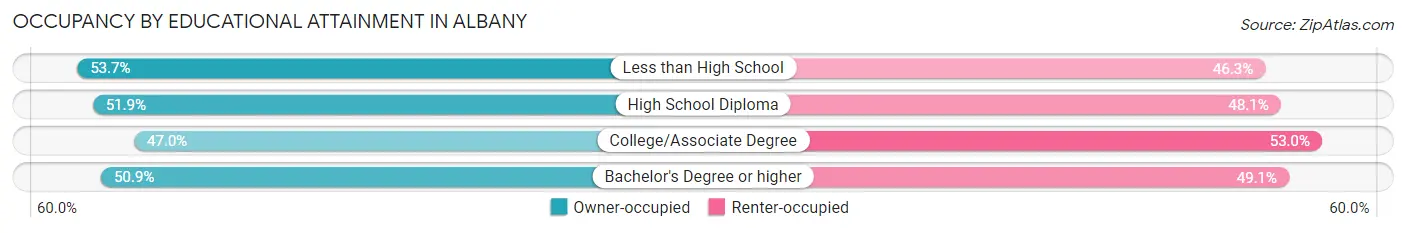
| Household Size | Owner-occupied | Renter-occupied |
| Less than High School | 79 (53.7%) | 68 (46.3%) |
| High School Diploma | 247 (51.9%) | 229 (48.1%) |
| College/Associate Degree | 445 (47.0%) | 502 (53.0%) |
| Bachelor's Degree or higher | 3,144 (50.9%) | 3,032 (49.1%) |
Occupancy by Age of Householder in Albany
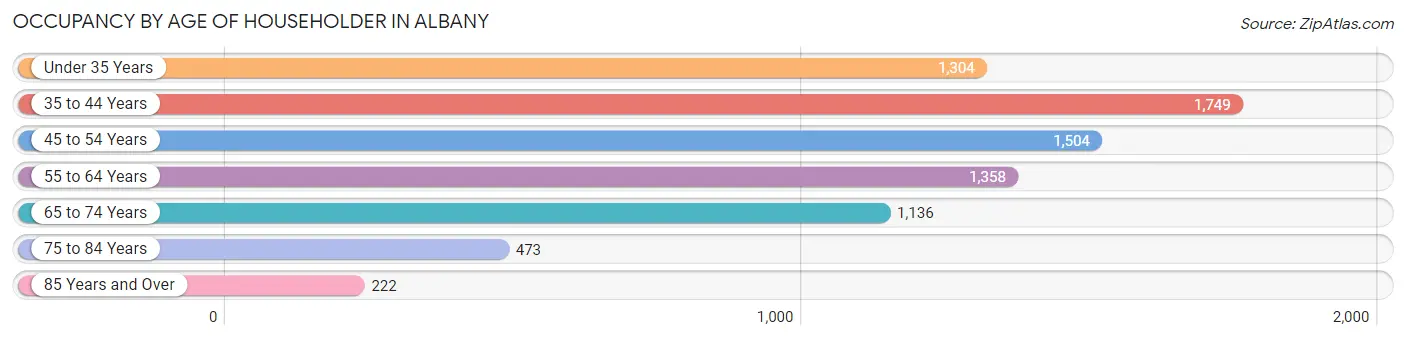
| Age Bracket | # Households | % Households |
| Under 35 Years | 1,304 | 16.8% |
| 35 to 44 Years | 1,749 | 22.6% |
| 45 to 54 Years | 1,504 | 19.4% |
| 55 to 64 Years | 1,358 | 17.5% |
| 65 to 74 Years | 1,136 | 14.7% |
| 75 to 84 Years | 473 | 6.1% |
| 85 Years and Over | 222 | 2.9% |
| Total | 7,746 | 100.0% |
Housing Finances in Albany
Median Income by Occupancy in Albany
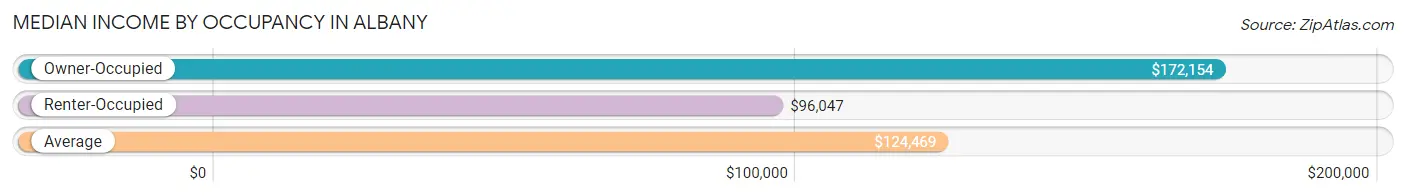
| Occupancy Type | # Households | Median Income |
| Owner-Occupied | 3,915 (50.5%) | $172,154 |
| Renter-Occupied | 3,831 (49.5%) | $96,047 |
| Average | 7,746 (100.0%) | $124,469 |
Occupancy by Householder Income Bracket in Albany
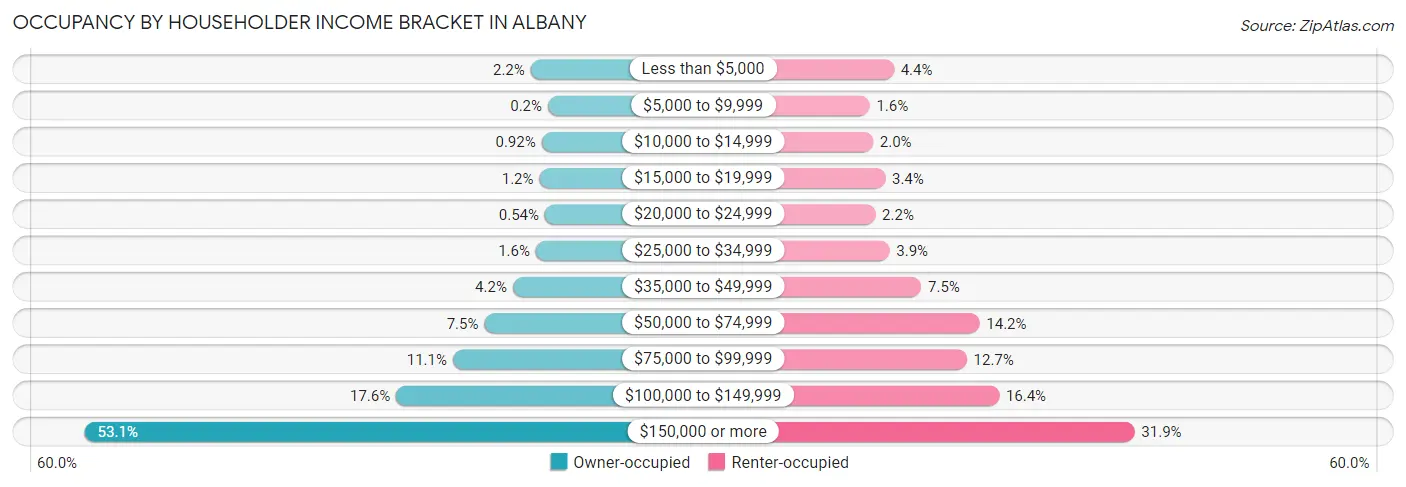
| Income Bracket | Owner-occupied | Renter-occupied |
| Less than $5,000 | 85 (2.2%) | 167 (4.4%) |
| $5,000 to $9,999 | 8 (0.2%) | 61 (1.6%) |
| $10,000 to $14,999 | 36 (0.9%) | 76 (2.0%) |
| $15,000 to $19,999 | 46 (1.2%) | 129 (3.4%) |
| $20,000 to $24,999 | 21 (0.5%) | 86 (2.2%) |
| $25,000 to $34,999 | 62 (1.6%) | 148 (3.9%) |
| $35,000 to $49,999 | 165 (4.2%) | 287 (7.5%) |
| $50,000 to $74,999 | 292 (7.5%) | 542 (14.1%) |
| $75,000 to $99,999 | 433 (11.1%) | 486 (12.7%) |
| $100,000 to $149,999 | 687 (17.5%) | 628 (16.4%) |
| $150,000 or more | 2,080 (53.1%) | 1,221 (31.9%) |
| Total | 3,915 (100.0%) | 3,831 (100.0%) |
Monthly Housing Cost Tiers in Albany
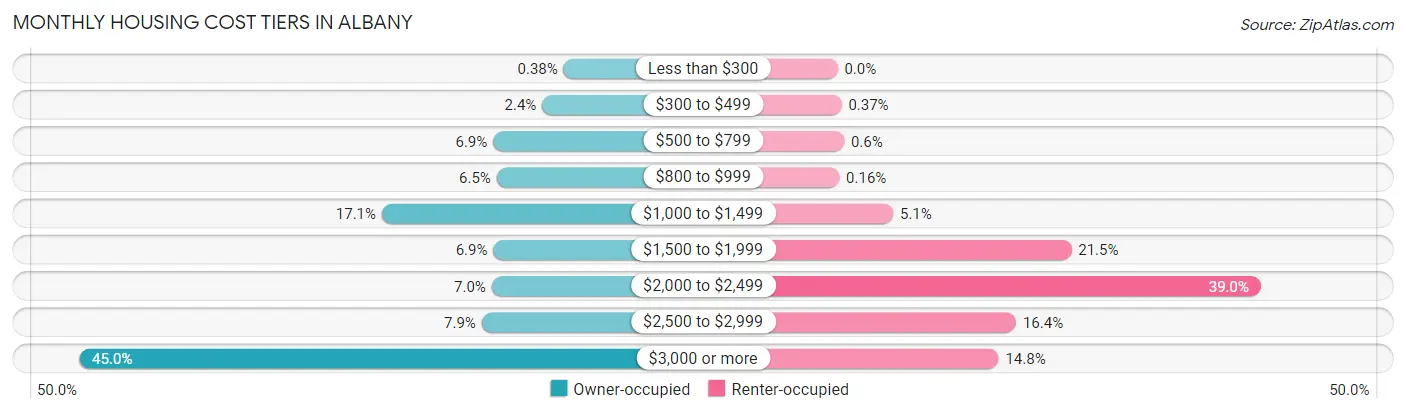
| Monthly Cost | Owner-occupied | Renter-occupied |
| Less than $300 | 15 (0.4%) | 0 (0.0%) |
| $300 to $499 | 92 (2.4%) | 14 (0.4%) |
| $500 to $799 | 269 (6.9%) | 23 (0.6%) |
| $800 to $999 | 256 (6.5%) | 6 (0.2%) |
| $1,000 to $1,499 | 670 (17.1%) | 196 (5.1%) |
| $1,500 to $1,999 | 268 (6.9%) | 825 (21.5%) |
| $2,000 to $2,499 | 274 (7.0%) | 1,493 (39.0%) |
| $2,500 to $2,999 | 310 (7.9%) | 630 (16.4%) |
| $3,000 or more | 1,761 (45.0%) | 568 (14.8%) |
| Total | 3,915 (100.0%) | 3,831 (100.0%) |
Physical Housing Characteristics in Albany
Housing Structures in Albany
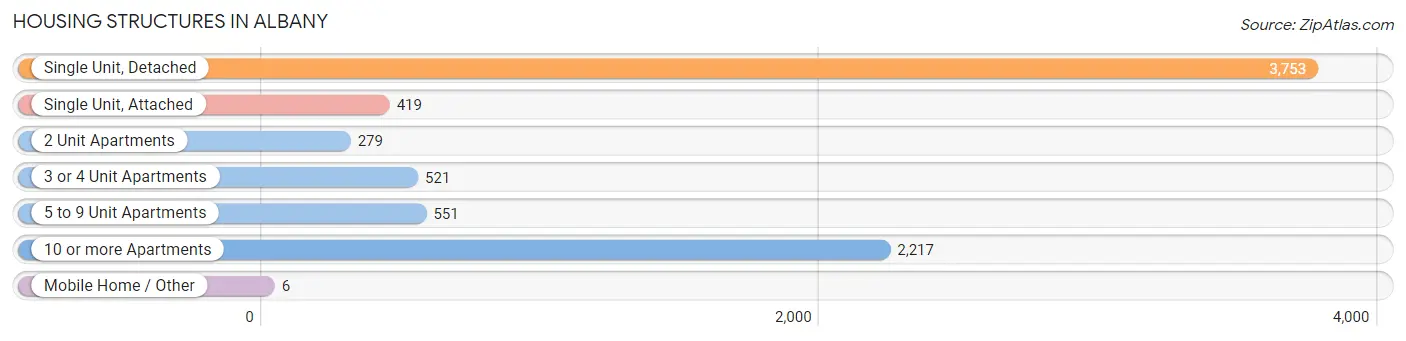
| Structure Type | # Housing Units | % Housing Units |
| Single Unit, Detached | 3,753 | 48.4% |
| Single Unit, Attached | 419 | 5.4% |
| 2 Unit Apartments | 279 | 3.6% |
| 3 or 4 Unit Apartments | 521 | 6.7% |
| 5 to 9 Unit Apartments | 551 | 7.1% |
| 10 or more Apartments | 2,217 | 28.6% |
| Mobile Home / Other | 6 | 0.1% |
| Total | 7,746 | 100.0% |
Housing Structures by Occupancy in Albany
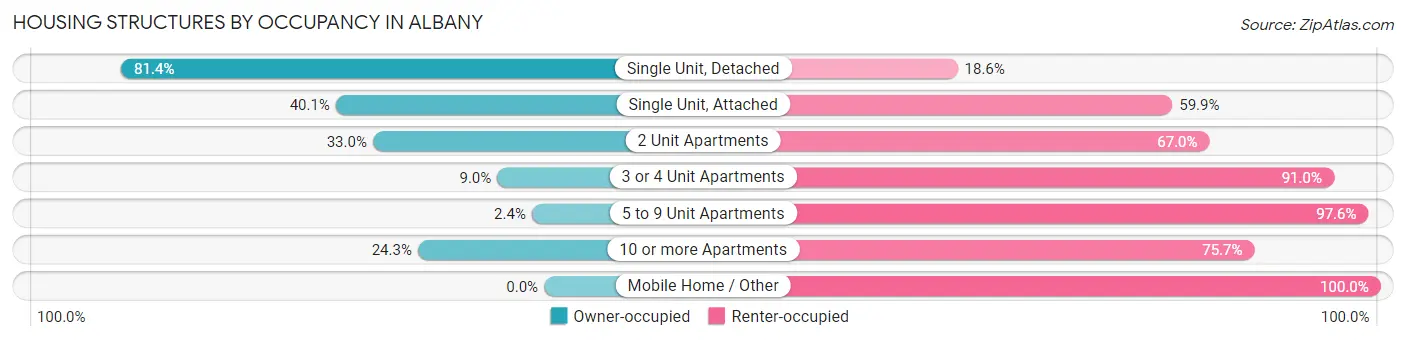
| Structure Type | Owner-occupied | Renter-occupied |
| Single Unit, Detached | 3,056 (81.4%) | 697 (18.6%) |
| Single Unit, Attached | 168 (40.1%) | 251 (59.9%) |
| 2 Unit Apartments | 92 (33.0%) | 187 (67.0%) |
| 3 or 4 Unit Apartments | 47 (9.0%) | 474 (91.0%) |
| 5 to 9 Unit Apartments | 13 (2.4%) | 538 (97.6%) |
| 10 or more Apartments | 539 (24.3%) | 1,678 (75.7%) |
| Mobile Home / Other | 0 (0.0%) | 6 (100.0%) |
| Total | 3,915 (50.5%) | 3,831 (49.5%) |
Housing Structures by Number of Rooms in Albany
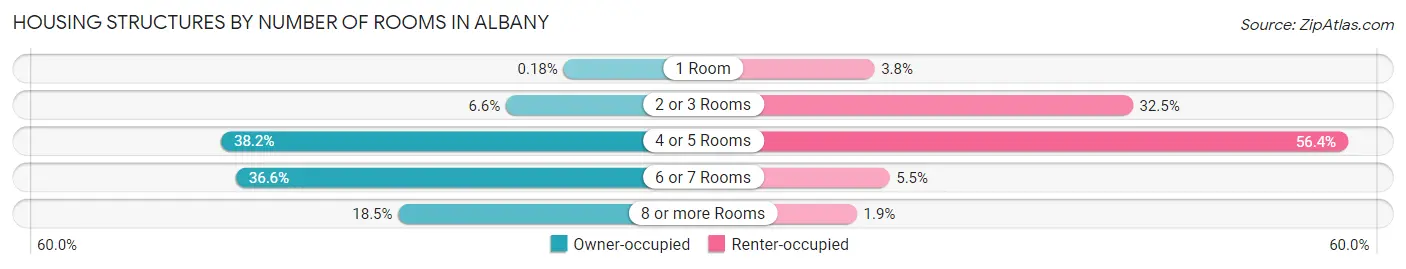
| Number of Rooms | Owner-occupied | Renter-occupied |
| 1 Room | 7 (0.2%) | 146 (3.8%) |
| 2 or 3 Rooms | 257 (6.6%) | 1,244 (32.5%) |
| 4 or 5 Rooms | 1,495 (38.2%) | 2,160 (56.4%) |
| 6 or 7 Rooms | 1,431 (36.5%) | 210 (5.5%) |
| 8 or more Rooms | 725 (18.5%) | 71 (1.8%) |
| Total | 3,915 (100.0%) | 3,831 (100.0%) |
Housing Structure by Heating Type in Albany
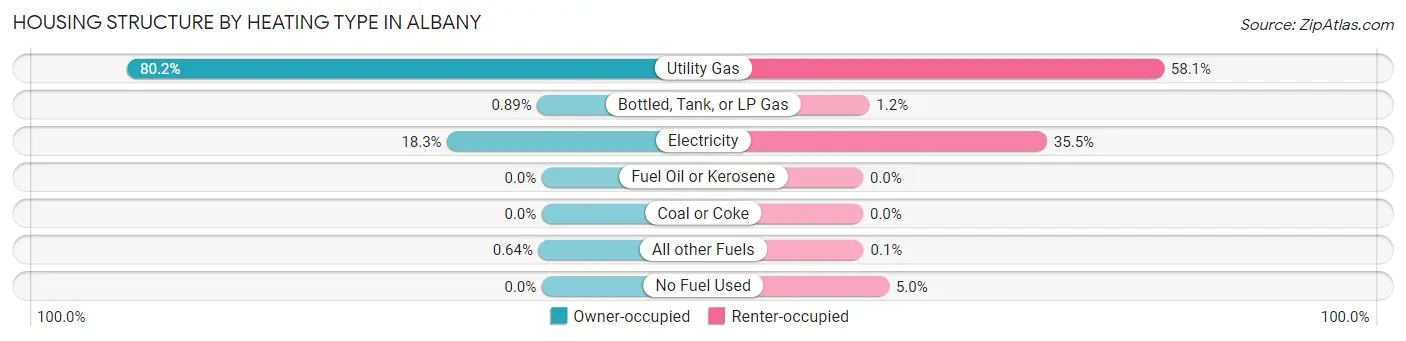
| Heating Type | Owner-occupied | Renter-occupied |
| Utility Gas | 3,139 (80.2%) | 2,227 (58.1%) |
| Bottled, Tank, or LP Gas | 35 (0.9%) | 47 (1.2%) |
| Electricity | 716 (18.3%) | 1,361 (35.5%) |
| Fuel Oil or Kerosene | 0 (0.0%) | 0 (0.0%) |
| Coal or Coke | 0 (0.0%) | 0 (0.0%) |
| All other Fuels | 25 (0.6%) | 4 (0.1%) |
| No Fuel Used | 0 (0.0%) | 192 (5.0%) |
| Total | 3,915 (100.0%) | 3,831 (100.0%) |
Household Vehicle Usage in Albany
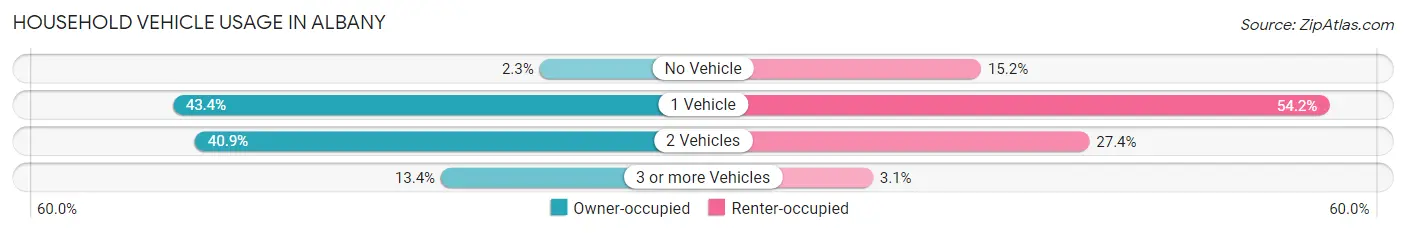
| Vehicles per Household | Owner-occupied | Renter-occupied |
| No Vehicle | 91 (2.3%) | 584 (15.2%) |
| 1 Vehicle | 1,699 (43.4%) | 2,078 (54.2%) |
| 2 Vehicles | 1,602 (40.9%) | 1,049 (27.4%) |
| 3 or more Vehicles | 523 (13.4%) | 120 (3.1%) |
| Total | 3,915 (100.0%) | 3,831 (100.0%) |
Real Estate & Mortgages in Albany
Real Estate and Mortgage Overview in Albany
| Characteristic | Without Mortgage | With Mortgage |
| Housing Units | 1,444 | 2,471 |
| Median Property Value | $1,099,500 | $1,145,100 |
| Median Household Income | $108,860 | $1,550 |
| Monthly Housing Costs | $1,158 | $1,743 |
| Real Estate Taxes | $8,257 | $17 |
Property Value by Mortgage Status in Albany
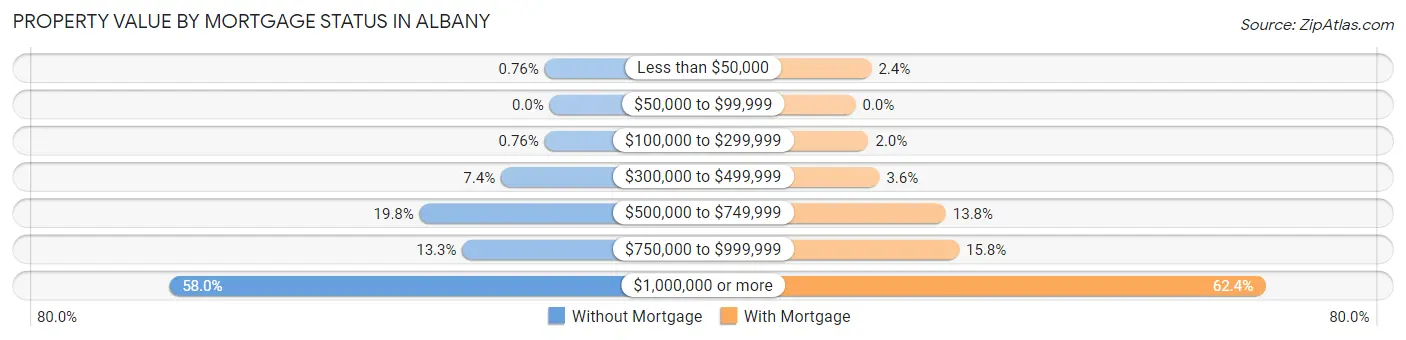
| Property Value | Without Mortgage | With Mortgage |
| Less than $50,000 | 11 (0.8%) | 60 (2.4%) |
| $50,000 to $99,999 | 0 (0.0%) | 0 (0.0%) |
| $100,000 to $299,999 | 11 (0.8%) | 49 (2.0%) |
| $300,000 to $499,999 | 107 (7.4%) | 90 (3.6%) |
| $500,000 to $749,999 | 286 (19.8%) | 340 (13.8%) |
| $750,000 to $999,999 | 192 (13.3%) | 390 (15.8%) |
| $1,000,000 or more | 837 (58.0%) | 1,542 (62.4%) |
| Total | 1,444 (100.0%) | 2,471 (100.0%) |
Household Income by Mortgage Status in Albany
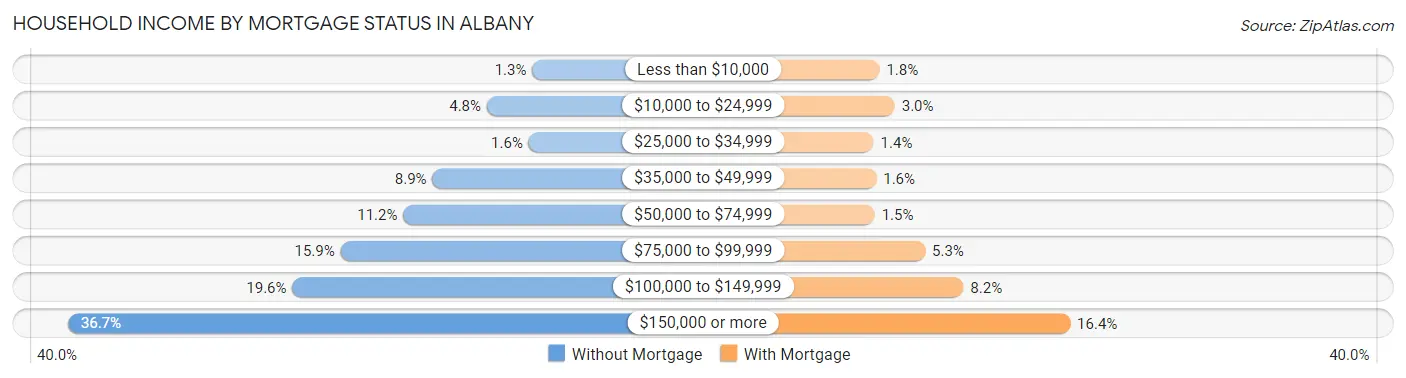
| Household Income | Without Mortgage | With Mortgage |
| Less than $10,000 | 19 (1.3%) | 45 (1.8%) |
| $10,000 to $24,999 | 69 (4.8%) | 74 (3.0%) |
| $25,000 to $34,999 | 23 (1.6%) | 34 (1.4%) |
| $35,000 to $49,999 | 129 (8.9%) | 39 (1.6%) |
| $50,000 to $74,999 | 161 (11.2%) | 36 (1.5%) |
| $75,000 to $99,999 | 230 (15.9%) | 131 (5.3%) |
| $100,000 to $149,999 | 283 (19.6%) | 203 (8.2%) |
| $150,000 or more | 530 (36.7%) | 404 (16.4%) |
| Total | 1,444 (100.0%) | 2,471 (100.0%) |
Property Value to Household Income Ratio in Albany
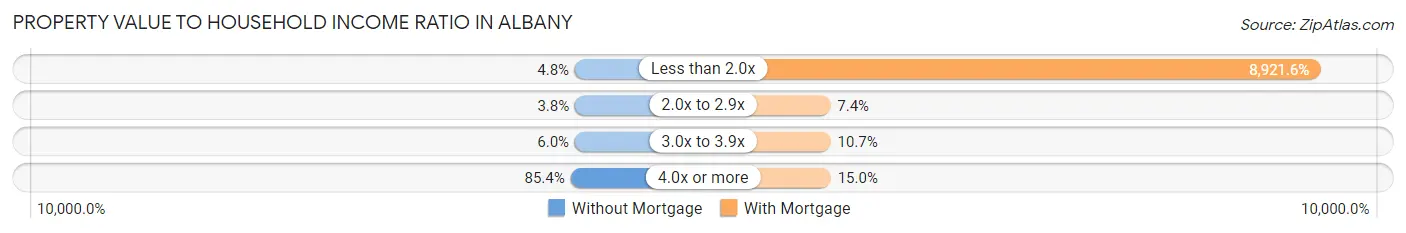
| Value-to-Income Ratio | Without Mortgage | With Mortgage |
| Less than 2.0x | 69 (4.8%) | 220,452 (8,921.6%) |
| 2.0x to 2.9x | 55 (3.8%) | 182 (7.4%) |
| 3.0x to 3.9x | 87 (6.0%) | 265 (10.7%) |
| 4.0x or more | 1,233 (85.4%) | 371 (15.0%) |
| Total | 1,444 (100.0%) | 2,471 (100.0%) |
Real Estate Taxes by Mortgage Status in Albany
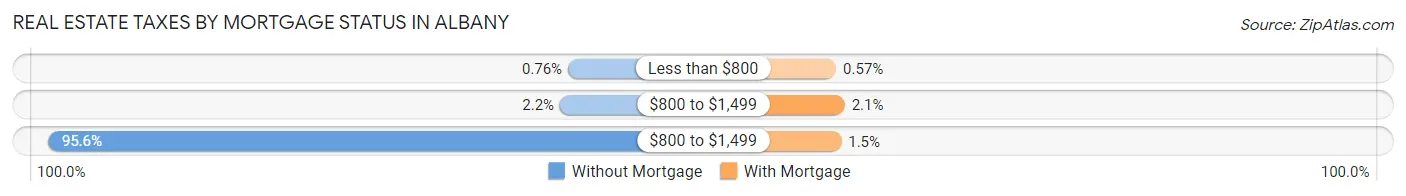
| Property Taxes | Without Mortgage | With Mortgage |
| Less than $800 | 11 (0.8%) | 14 (0.6%) |
| $800 to $1,499 | 32 (2.2%) | 53 (2.1%) |
| $800 to $1,499 | 1,380 (95.6%) | 37 (1.5%) |
| Total | 1,444 (100.0%) | 2,471 (100.0%) |
Health & Disability in Albany
Health Insurance Coverage by Age in Albany
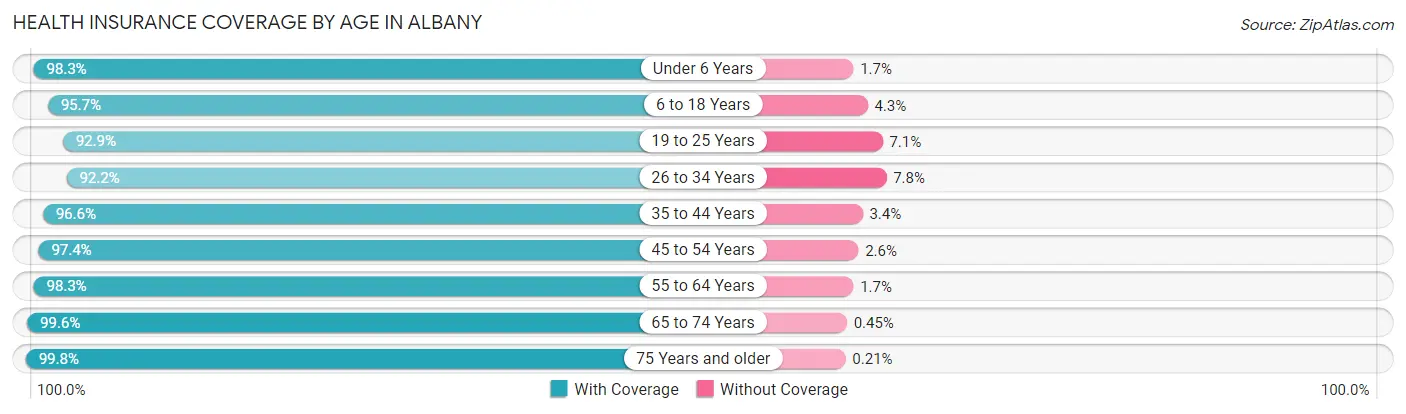
| Age Bracket | With Coverage | Without Coverage |
| Under 6 Years | 1,602 (98.3%) | 27 (1.7%) |
| 6 to 18 Years | 3,430 (95.7%) | 155 (4.3%) |
| 19 to 25 Years | 1,043 (92.9%) | 80 (7.1%) |
| 26 to 34 Years | 2,489 (92.2%) | 211 (7.8%) |
| 35 to 44 Years | 3,302 (96.6%) | 116 (3.4%) |
| 45 to 54 Years | 2,482 (97.4%) | 66 (2.6%) |
| 55 to 64 Years | 2,190 (98.3%) | 37 (1.7%) |
| 65 to 74 Years | 1,779 (99.6%) | 8 (0.4%) |
| 75 Years and older | 961 (99.8%) | 2 (0.2%) |
| Total | 19,278 (96.5%) | 702 (3.5%) |
Health Insurance Coverage by Citizenship Status in Albany
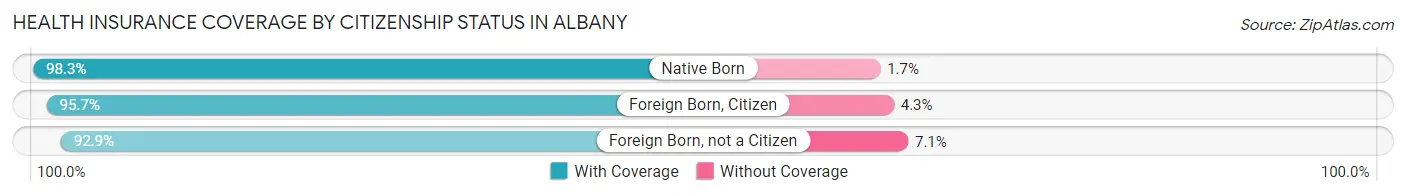
| Citizenship Status | With Coverage | Without Coverage |
| Native Born | 1,602 (98.3%) | 27 (1.7%) |
| Foreign Born, Citizen | 3,430 (95.7%) | 155 (4.3%) |
| Foreign Born, not a Citizen | 1,043 (92.9%) | 80 (7.1%) |
Health Insurance Coverage by Household Income in Albany
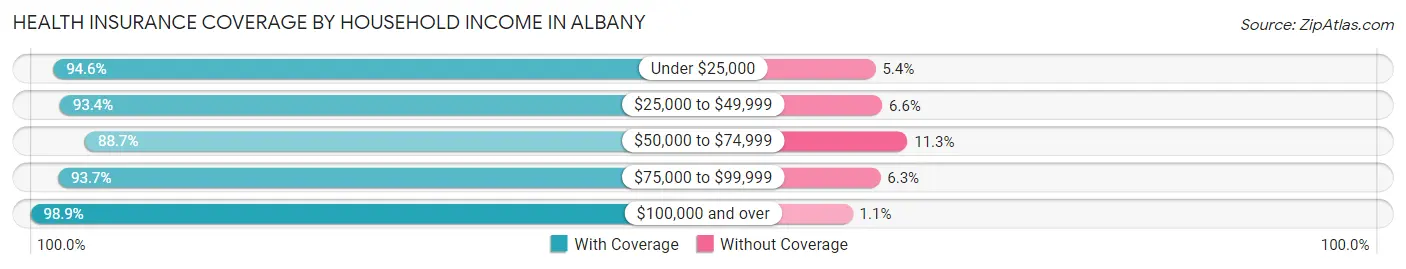
| Household Income | With Coverage | Without Coverage |
| Under $25,000 | 1,374 (94.6%) | 78 (5.4%) |
| $25,000 to $49,999 | 1,216 (93.4%) | 86 (6.6%) |
| $50,000 to $74,999 | 1,462 (88.7%) | 187 (11.3%) |
| $75,000 to $99,999 | 1,999 (93.7%) | 134 (6.3%) |
| $100,000 and over | 13,004 (98.9%) | 145 (1.1%) |
Public vs Private Health Insurance Coverage by Age in Albany
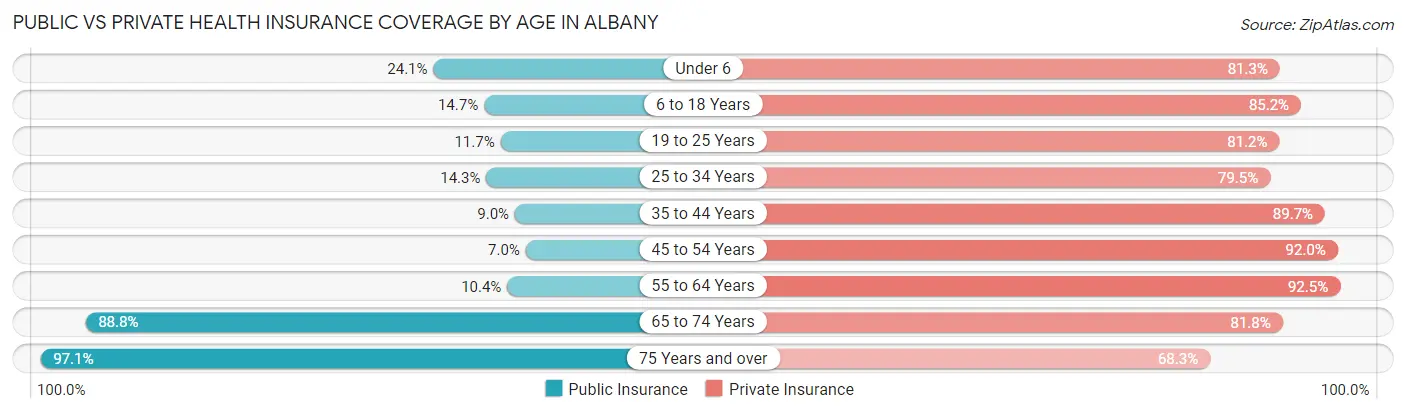
| Age Bracket | Public Insurance | Private Insurance |
| Under 6 | 393 (24.1%) | 1,324 (81.3%) |
| 6 to 18 Years | 528 (14.7%) | 3,055 (85.2%) |
| 19 to 25 Years | 131 (11.7%) | 912 (81.2%) |
| 25 to 34 Years | 386 (14.3%) | 2,146 (79.5%) |
| 35 to 44 Years | 307 (9.0%) | 3,065 (89.7%) |
| 45 to 54 Years | 178 (7.0%) | 2,345 (92.0%) |
| 55 to 64 Years | 232 (10.4%) | 2,059 (92.5%) |
| 65 to 74 Years | 1,586 (88.7%) | 1,462 (81.8%) |
| 75 Years and over | 935 (97.1%) | 658 (68.3%) |
| Total | 4,676 (23.4%) | 17,026 (85.2%) |
Disability Status by Sex by Age in Albany
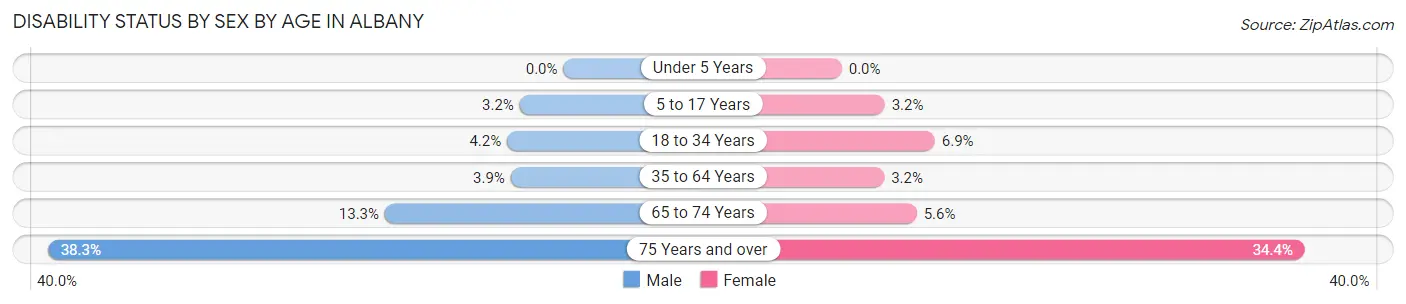
| Age Bracket | Male | Female |
| Under 5 Years | 0 (0.0%) | 0 (0.0%) |
| 5 to 17 Years | 59 (3.2%) | 59 (3.2%) |
| 18 to 34 Years | 82 (4.2%) | 152 (6.9%) |
| 35 to 64 Years | 148 (3.9%) | 139 (3.2%) |
| 65 to 74 Years | 120 (13.3%) | 49 (5.6%) |
| 75 Years and over | 147 (38.3%) | 199 (34.4%) |
Disability Class by Sex by Age in Albany
Disability Class: Hearing Difficulty
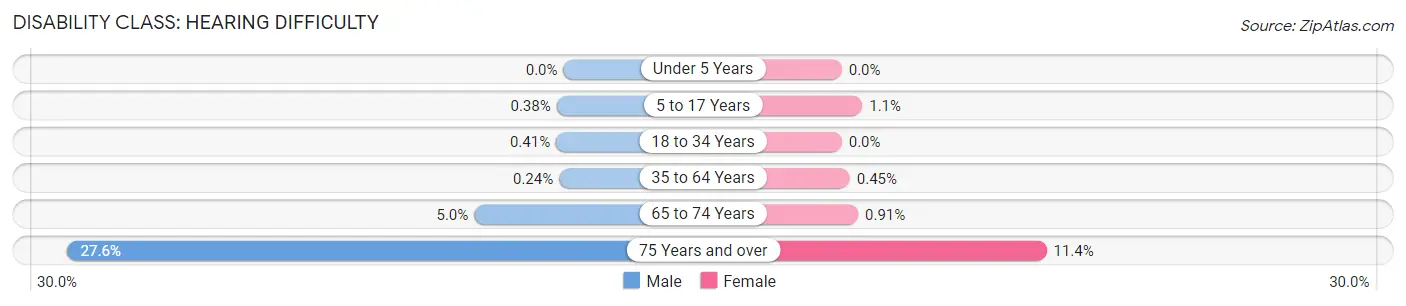
| Age Bracket | Male | Female |
| Under 5 Years | 0 (0.0%) | 0 (0.0%) |
| 5 to 17 Years | 7 (0.4%) | 21 (1.1%) |
| 18 to 34 Years | 8 (0.4%) | 0 (0.0%) |
| 35 to 64 Years | 9 (0.2%) | 20 (0.4%) |
| 65 to 74 Years | 45 (5.0%) | 8 (0.9%) |
| 75 Years and over | 106 (27.6%) | 66 (11.4%) |
Disability Class: Vision Difficulty
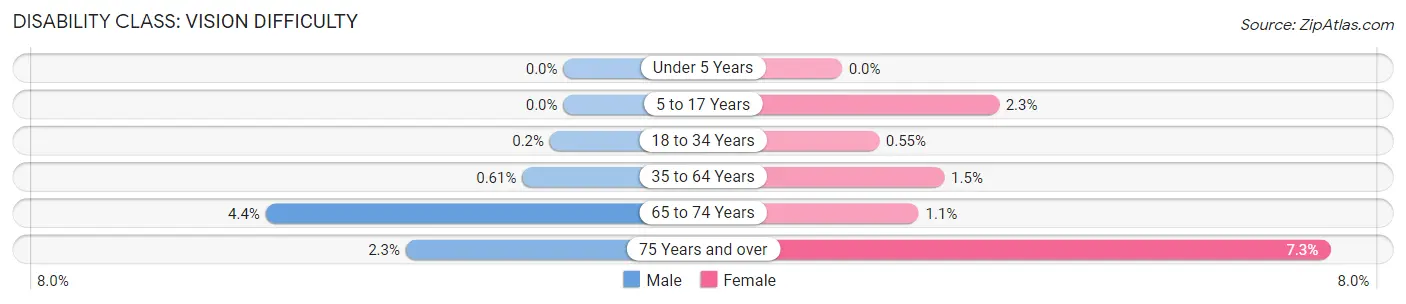
| Age Bracket | Male | Female |
| Under 5 Years | 0 (0.0%) | 0 (0.0%) |
| 5 to 17 Years | 0 (0.0%) | 43 (2.3%) |
| 18 to 34 Years | 4 (0.2%) | 12 (0.5%) |
| 35 to 64 Years | 23 (0.6%) | 67 (1.5%) |
| 65 to 74 Years | 40 (4.4%) | 10 (1.1%) |
| 75 Years and over | 9 (2.3%) | 42 (7.2%) |
Disability Class: Cognitive Difficulty
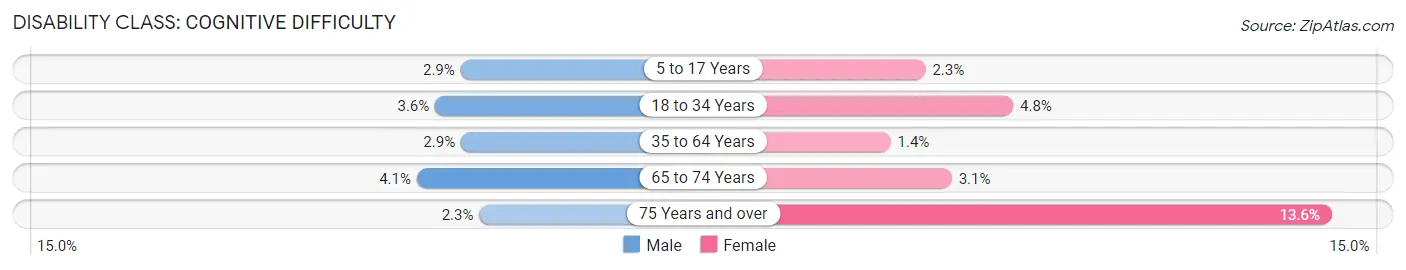
| Age Bracket | Male | Female |
| 5 to 17 Years | 52 (2.9%) | 43 (2.3%) |
| 18 to 34 Years | 70 (3.6%) | 105 (4.8%) |
| 35 to 64 Years | 108 (2.9%) | 60 (1.4%) |
| 65 to 74 Years | 37 (4.1%) | 27 (3.1%) |
| 75 Years and over | 9 (2.3%) | 79 (13.6%) |
Disability Class: Ambulatory Difficulty
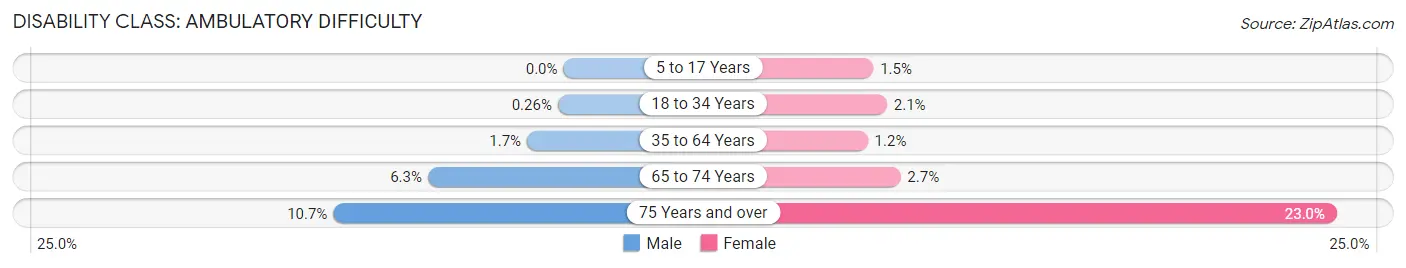
| Age Bracket | Male | Female |
| 5 to 17 Years | 0 (0.0%) | 27 (1.5%) |
| 18 to 34 Years | 5 (0.3%) | 46 (2.1%) |
| 35 to 64 Years | 64 (1.7%) | 53 (1.2%) |
| 65 to 74 Years | 57 (6.3%) | 24 (2.7%) |
| 75 Years and over | 41 (10.7%) | 133 (23.0%) |
Disability Class: Self-Care Difficulty
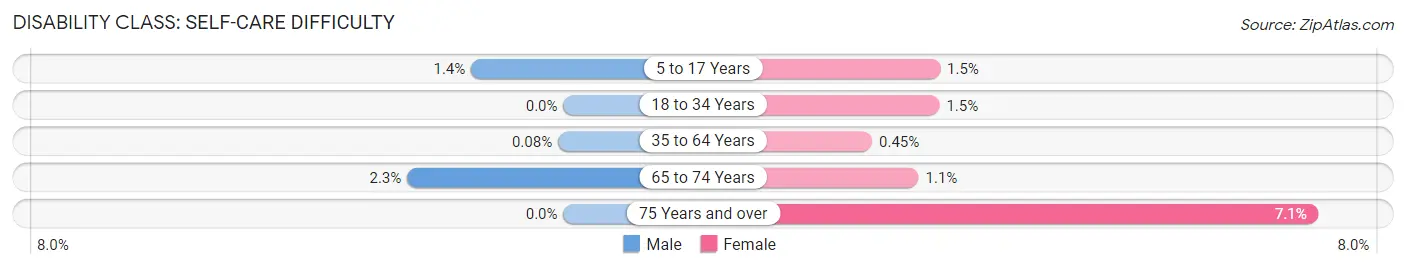
| Age Bracket | Male | Female |
| 5 to 17 Years | 25 (1.4%) | 27 (1.5%) |
| 18 to 34 Years | 0 (0.0%) | 32 (1.5%) |
| 35 to 64 Years | 3 (0.1%) | 20 (0.4%) |
| 65 to 74 Years | 21 (2.3%) | 10 (1.1%) |
| 75 Years and over | 0 (0.0%) | 41 (7.1%) |
Technology Access in Albany
Computing Device Access in Albany
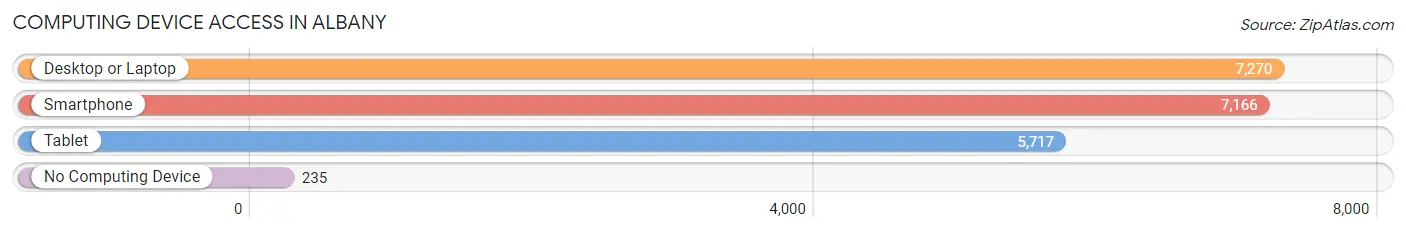
| Device Type | # Households | % Households |
| Desktop or Laptop | 7,270 | 93.9% |
| Smartphone | 7,166 | 92.5% |
| Tablet | 5,717 | 73.8% |
| No Computing Device | 235 | 3.0% |
| Total | 7,746 | 100.0% |
Internet Access in Albany
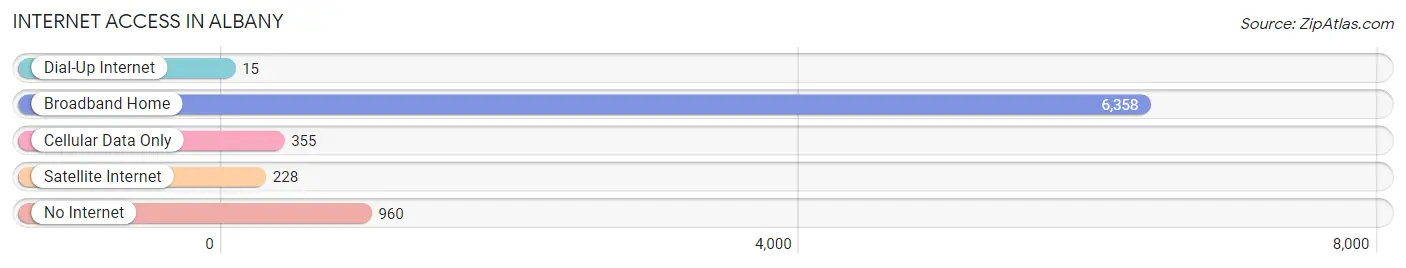
| Internet Type | # Households | % Households |
| Dial-Up Internet | 15 | 0.2% |
| Broadband Home | 6,358 | 82.1% |
| Cellular Data Only | 355 | 4.6% |
| Satellite Internet | 228 | 2.9% |
| No Internet | 960 | 12.4% |
| Total | 7,746 | 100.0% |
Albany Summary
Albany is a city located in the East Bay region of the San Francisco Bay Area in Alameda County, California. It is situated on the eastern shore of San Francisco Bay, near Berkeley and Oakland. The city has a population of approximately 19,000 people and covers an area of 7.5 square miles.
History
The area that is now Albany was originally inhabited by the Ohlone people, who lived in the area for thousands of years before the arrival of Europeans. The first Europeans to settle in the area were the Spanish, who established a mission in the area in 1772. The area was then part of the Rancho San Antonio land grant, which was granted to Luis Maria Peralta in 1820.
In 1853, the area was incorporated as the town of Ocean View. The town was renamed Albany in 1908, after the city of Albany, New York. The city was officially incorporated in 1909.
Geography
Albany is located in the East Bay region of the San Francisco Bay Area in Alameda County, California. It is situated on the eastern shore of San Francisco Bay, near Berkeley and Oakland. The city has a total area of 7.5 square miles, of which 0.2 square miles is water.
The city is located in a hilly area, with the Albany Hill being the highest point in the city. The city is bordered by Berkeley to the south, El Cerrito to the west, and Richmond to the north.
Economy
Albany’s economy is largely based on the service industry, with many residents employed in the retail, hospitality, and healthcare sectors. The city is also home to a number of small businesses, including restaurants, cafes, and shops.
The city is also home to a number of large employers, including the University of California, Berkeley, the Lawrence Berkeley National Laboratory, and the Golden Gate Fields racetrack.
Demographics
As of the 2010 census, Albany had a population of 19,056 people. The racial makeup of the city was 57.2% White, 16.3% Asian, 15.2% Hispanic or Latino, 8.2% African American, 0.5% Native American, and 2.6% from other races.
The median household income in Albany was $68,945 in 2019, and the median home value was $845,000. The city has a high cost of living, with the median rent being $2,400 per month.
Conclusion
Albany is a city located in the East Bay region of the San Francisco Bay Area in Alameda County, California. It has a population of approximately 19,000 people and covers an area of 7.5 square miles. The city has a long history, dating back to the Ohlone people who originally inhabited the area. The city’s economy is largely based on the service industry, with many residents employed in the retail, hospitality, and healthcare sectors. The city has a diverse population, with the majority of residents being White, Asian, Hispanic or Latino, African American, and Native American. The median household income in Albany is $68,945, and the median home value is $845,000.
Common Questions
What is Per Capita Income in Albany?
Per Capita income in Albany is $65,976.
What is the Median Family Income in Albany?
Median Family Income in Albany is $153,031.
What is the Median Household income in Albany?
Median Household Income in Albany is $124,469.
What is Income or Wage Gap in Albany?
Income or Wage Gap in Albany is 20.1%.
Women in Albany earn 79.9 cents for every dollar earned by a man.
What is Family Income Deficit in Albany?
Family Income Deficit in Albany is $13,619.
Families that are below poverty line in Albany earn $13,619 less on average than the poverty threshold level.
What is Inequality or Gini Index in Albany?
Inequality or Gini Index in Albany is 0.45.
What is the Total Population of Albany?
Total Population of Albany is 20,027.
What is the Total Male Population of Albany?
Total Male Population of Albany is 9,550.
What is the Total Female Population of Albany?
Total Female Population of Albany is 10,477.
What is the Ratio of Males per 100 Females in Albany?
There are 91.15 Males per 100 Females in Albany.
What is the Ratio of Females per 100 Males in Albany?
There are 109.71 Females per 100 Males in Albany.
What is the Median Population Age in Albany?
Median Population Age in Albany is 37.2 Years.
What is the Average Family Size in Albany
Average Family Size in Albany is 3.0 People.
What is the Average Household Size in Albany
Average Household Size in Albany is 2.5 People.
How Large is the Labor Force in Albany?
There are 10,703 People in the Labor Forcein in Albany.
What is the Percentage of People in the Labor Force in Albany?
68.2% of People are in the Labor Force in Albany.
What is the Unemployment Rate in Albany?
Unemployment Rate in Albany is 3.3%.