Erie, PA Map & Demographics
Erie Map
Erie Overview
$25,090
PER CAPITA INCOME
$56,399
AVG FAMILY INCOME
$43,135
AVG HOUSEHOLD INCOME
24.1%
WAGE / INCOME GAP [ % ]
75.9¢/ $1
WAGE / INCOME GAP [ $ ]
$10,902
FAMILY INCOME DEFICIT
0.46
INEQUALITY / GINI INDEX
94,826
TOTAL POPULATION
46,773
MALE POPULATION
48,053
FEMALE POPULATION
97.34
MALES / 100 FEMALES
102.74
FEMALES / 100 MALES
35.0
MEDIAN AGE
3.1
AVG FAMILY SIZE
2.3
AVG HOUSEHOLD SIZE
45,458
LABOR FORCE [ PEOPLE ]
59.2%
PERCENT IN LABOR FORCE
6.8%
UNEMPLOYMENT RATE
Erie Zip Codes
Erie Area Codes
Income in Erie
Income Overview in Erie
Per Capita Income in Erie is $25,090, while median incomes of families and households are $56,399 and $43,135 respectively.
| Characteristic | Number | Measure |
| Per Capita Income | 94,826 | $25,090 |
| Median Family Income | 20,570 | $56,399 |
| Mean Family Income | 20,570 | $70,030 |
| Median Household Income | 39,180 | $43,135 |
| Mean Household Income | 39,180 | $58,187 |
| Income Deficit | 20,570 | $10,902 |
| Wage / Income Gap (%) | 94,826 | 24.09% |
| Wage / Income Gap ($) | 94,826 | 75.91¢ per $1 |
| Gini / Inequality Index | 94,826 | 0.46 |
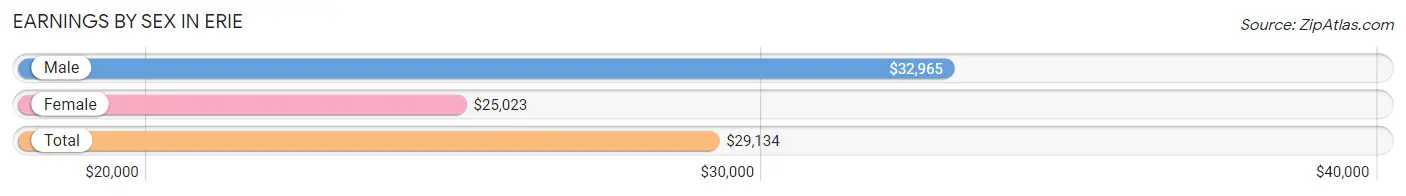
Earnings by Sex in Erie
Average Earnings in Erie are $29,134, $32,965 for men and $25,023 for women, a difference of 24.1%.
| Sex | Number | Average Earnings |
| Male | 24,089 (50.1%) | $32,965 |
| Female | 23,965 (49.9%) | $25,023 |
| Total | 48,054 (100.0%) | $29,134 |
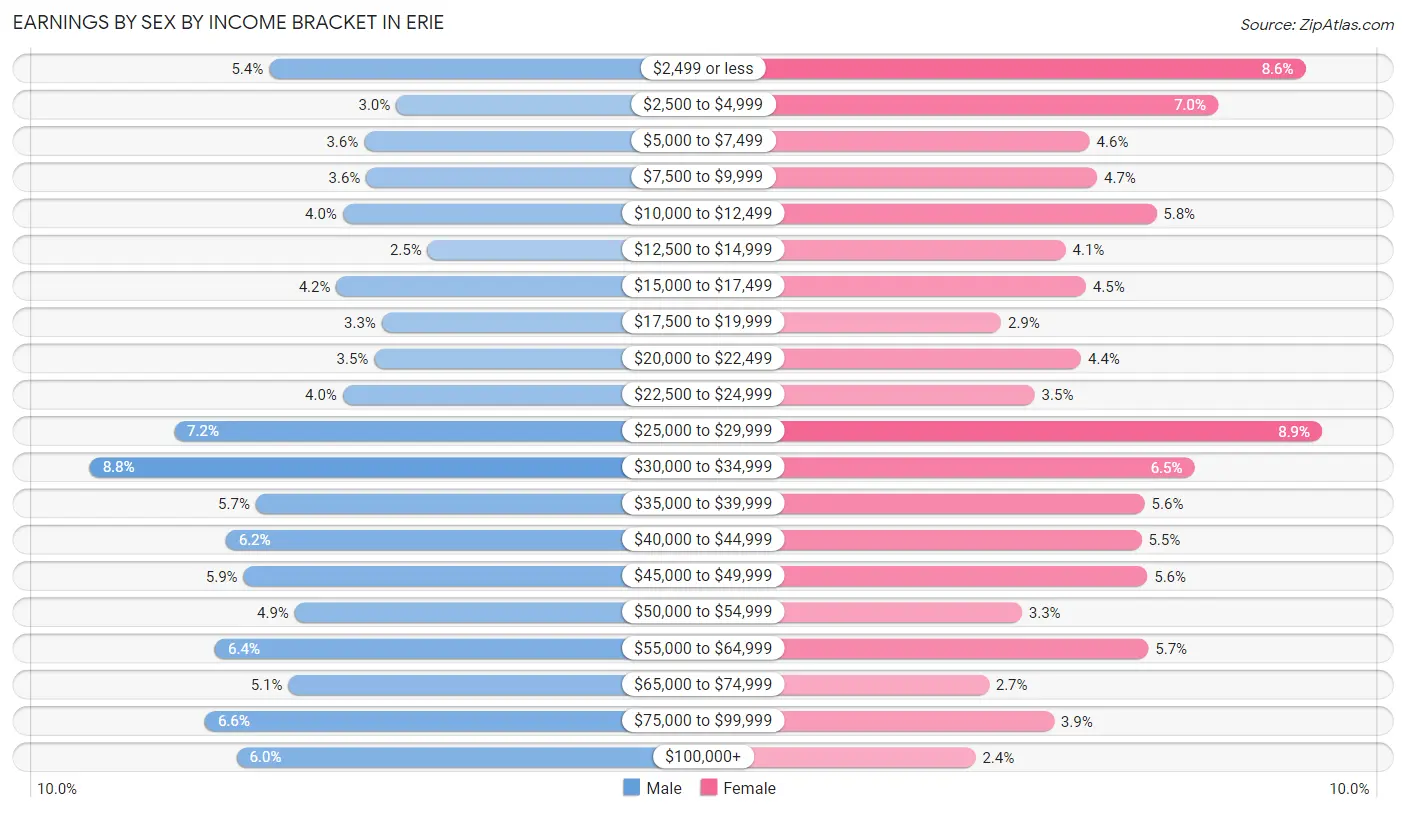
Earnings by Sex by Income Bracket in Erie
The most common earnings brackets in Erie are $30,000 to $34,999 for men (2,116 | 8.8%) and $25,000 to $29,999 for women (2,133 | 8.9%).
| Income | Male | Female |
| $2,499 or less | 1,306 (5.4%) | 2,059 (8.6%) |
| $2,500 to $4,999 | 732 (3.0%) | 1,665 (7.0%) |
| $5,000 to $7,499 | 876 (3.6%) | 1,091 (4.5%) |
| $7,500 to $9,999 | 866 (3.6%) | 1,124 (4.7%) |
| $10,000 to $12,499 | 973 (4.0%) | 1,389 (5.8%) |
| $12,500 to $14,999 | 590 (2.5%) | 982 (4.1%) |
| $15,000 to $17,499 | 1,002 (4.2%) | 1,074 (4.5%) |
| $17,500 to $19,999 | 798 (3.3%) | 693 (2.9%) |
| $20,000 to $22,499 | 830 (3.5%) | 1,053 (4.4%) |
| $22,500 to $24,999 | 972 (4.0%) | 844 (3.5%) |
| $25,000 to $29,999 | 1,735 (7.2%) | 2,133 (8.9%) |
| $30,000 to $34,999 | 2,116 (8.8%) | 1,561 (6.5%) |
| $35,000 to $39,999 | 1,367 (5.7%) | 1,338 (5.6%) |
| $40,000 to $44,999 | 1,500 (6.2%) | 1,322 (5.5%) |
| $45,000 to $49,999 | 1,421 (5.9%) | 1,350 (5.6%) |
| $50,000 to $54,999 | 1,189 (4.9%) | 786 (3.3%) |
| $55,000 to $64,999 | 1,550 (6.4%) | 1,355 (5.7%) |
| $65,000 to $74,999 | 1,220 (5.1%) | 638 (2.7%) |
| $75,000 to $99,999 | 1,594 (6.6%) | 930 (3.9%) |
| $100,000+ | 1,452 (6.0%) | 578 (2.4%) |
| Total | 24,089 (100.0%) | 23,965 (100.0%) |
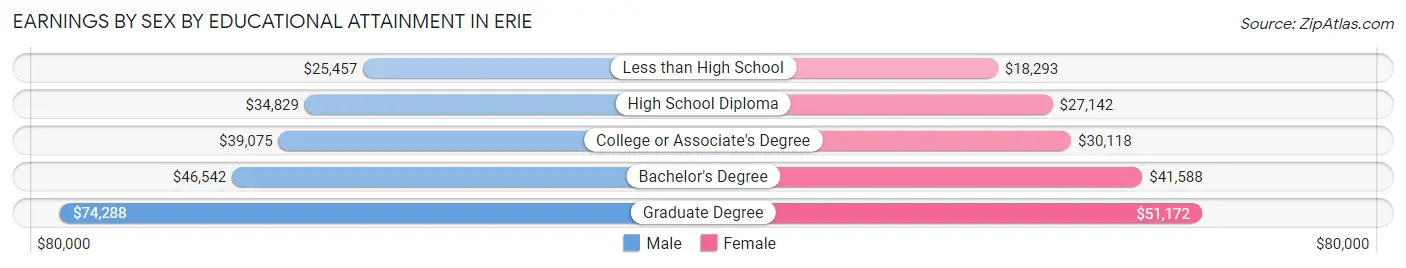
Earnings by Sex by Educational Attainment in Erie
Average earnings in Erie are $39,278 for men and $30,167 for women, a difference of 23.2%. Men with an educational attainment of graduate degree enjoy the highest average annual earnings of $74,288, while those with less than high school education earn the least with $25,457. Women with an educational attainment of graduate degree earn the most with the average annual earnings of $51,172, while those with less than high school education have the smallest earnings of $18,293.
| Educational Attainment | Male Income | Female Income |
| Less than High School | $25,457 | $18,293 |
| High School Diploma | $34,829 | $27,142 |
| College or Associate's Degree | $39,075 | $30,118 |
| Bachelor's Degree | $46,542 | $41,588 |
| Graduate Degree | $74,288 | $51,172 |
| Total | $39,278 | $30,167 |
Family Income in Erie
Family Income Brackets in Erie
According to the Erie family income data, there are 4,237 families falling into the $50,000 to $74,999 income range, which is the most common income bracket and makes up 20.6% of all families. Conversely, the $200,000+ income bracket is the least frequent group with only 597 families (2.9%) belonging to this category.
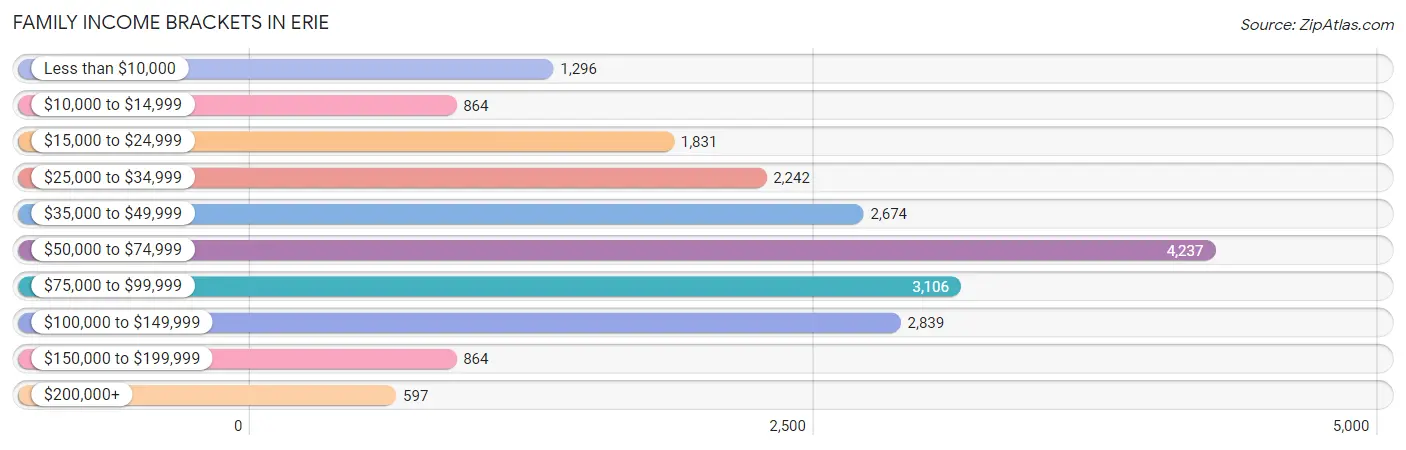
| Income Bracket | # Families | % Families |
| Less than $10,000 | 1,296 | 6.3% |
| $10,000 to $14,999 | 864 | 4.2% |
| $15,000 to $24,999 | 1,831 | 8.9% |
| $25,000 to $34,999 | 2,242 | 10.9% |
| $35,000 to $49,999 | 2,674 | 13.0% |
| $50,000 to $74,999 | 4,237 | 20.6% |
| $75,000 to $99,999 | 3,106 | 15.1% |
| $100,000 to $149,999 | 2,839 | 13.8% |
| $150,000 to $199,999 | 864 | 4.2% |
| $200,000+ | 597 | 2.9% |
Family Income by Famaliy Size in Erie
6-person families (548 | 2.7%) account for the highest median family income in Erie with $66,711 per family, while 2-person families (9,827 | 47.8%) have the highest median income of $28,085 per family member.
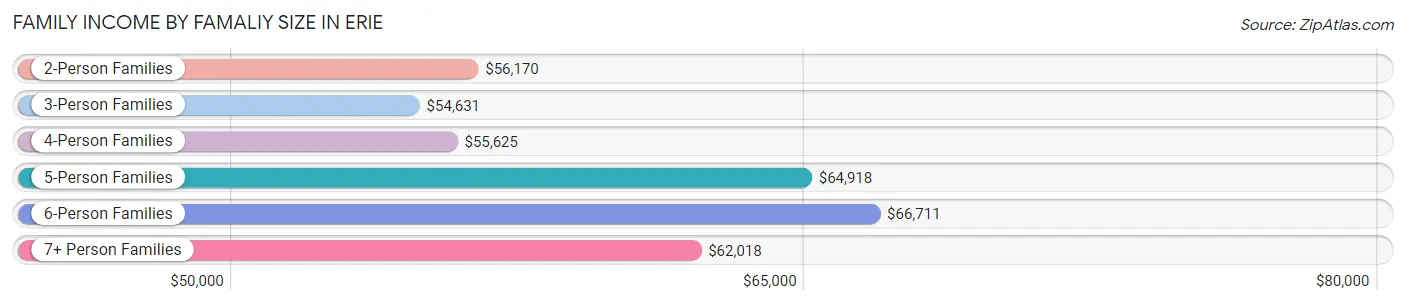
| Income Bracket | # Families | Median Income |
| 2-Person Families | 9,827 (47.8%) | $56,170 |
| 3-Person Families | 5,226 (25.4%) | $54,631 |
| 4-Person Families | 2,856 (13.9%) | $55,625 |
| 5-Person Families | 1,765 (8.6%) | $64,918 |
| 6-Person Families | 548 (2.7%) | $66,711 |
| 7+ Person Families | 348 (1.7%) | $62,018 |
| Total | 20,570 (100.0%) | $56,399 |
Family Income by Number of Earners in Erie
The median family income in Erie is $56,399, with families comprising 3+ earners (1,740) having the highest median family income of $98,314, while families with no earners (3,297) have the lowest median family income of $31,118, accounting for 8.5% and 16.0% of families, respectively.
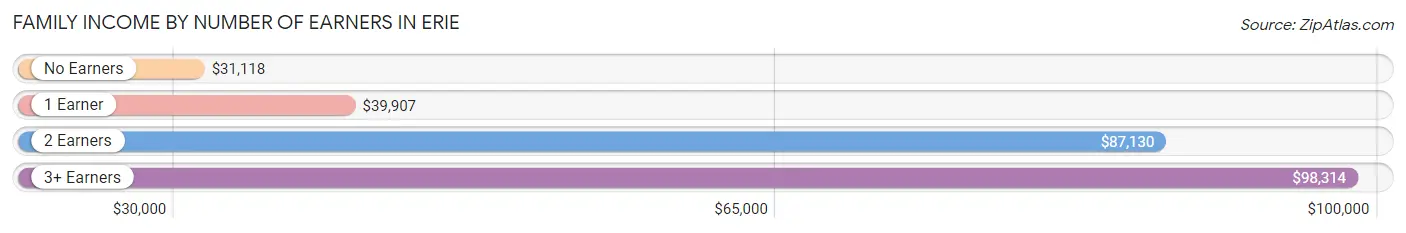
| Number of Earners | # Families | Median Income |
| No Earners | 3,297 (16.0%) | $31,118 |
| 1 Earner | 8,354 (40.6%) | $39,907 |
| 2 Earners | 7,179 (34.9%) | $87,130 |
| 3+ Earners | 1,740 (8.5%) | $98,314 |
| Total | 20,570 (100.0%) | $56,399 |
Household Income in Erie
Household Income Brackets in Erie
With 6,661 households falling in the category, the $50,000 to $74,999 income range is the most frequent in Erie, accounting for 17.0% of all households. In contrast, only 862 households (2.2%) fall into the $200,000+ income bracket, making it the least populous group.
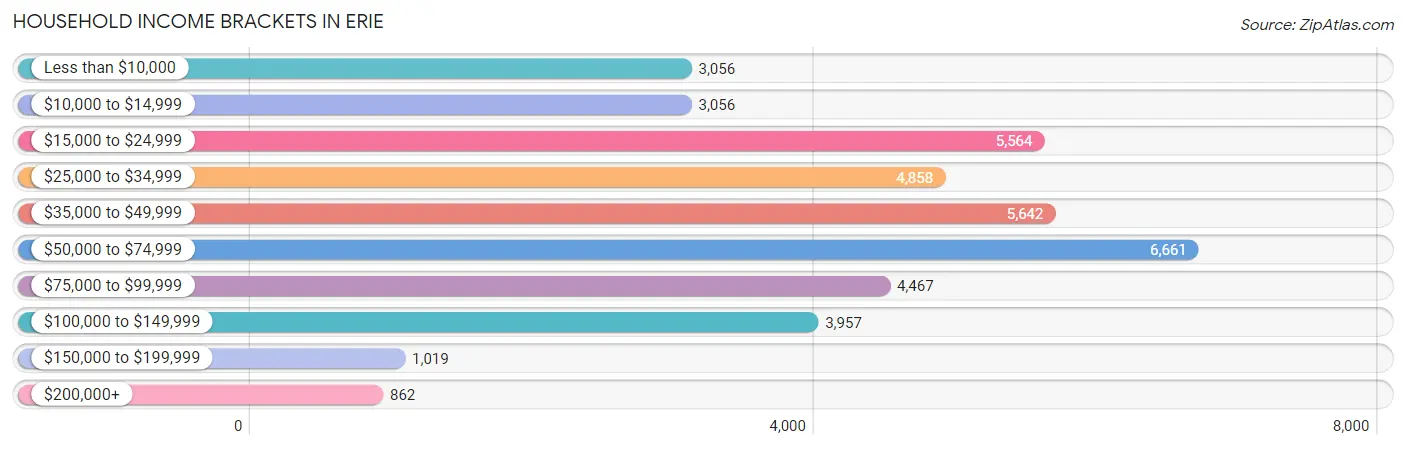
| Income Bracket | # Households | % Households |
| Less than $10,000 | 3,056 | 7.8% |
| $10,000 to $14,999 | 3,056 | 7.8% |
| $15,000 to $24,999 | 5,564 | 14.2% |
| $25,000 to $34,999 | 4,858 | 12.4% |
| $35,000 to $49,999 | 5,642 | 14.4% |
| $50,000 to $74,999 | 6,661 | 17.0% |
| $75,000 to $99,999 | 4,467 | 11.4% |
| $100,000 to $149,999 | 3,957 | 10.1% |
| $150,000 to $199,999 | 1,019 | 2.6% |
| $200,000+ | 862 | 2.2% |
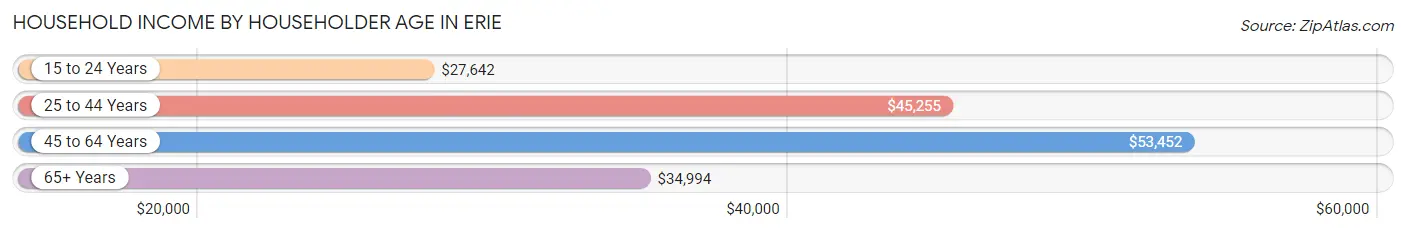
Household Income by Householder Age in Erie
The median household income in Erie is $43,135, with the highest median household income of $53,452 found in the 45 to 64 years age bracket for the primary householder. A total of 13,709 households (35.0%) fall into this category. Meanwhile, the 15 to 24 years age bracket for the primary householder has the lowest median household income of $27,642, with 2,323 households (5.9%) in this group.
| Income Bracket | # Households | Median Income |
| 15 to 24 Years | 2,323 (5.9%) | $27,642 |
| 25 to 44 Years | 13,180 (33.6%) | $45,255 |
| 45 to 64 Years | 13,709 (35.0%) | $53,452 |
| 65+ Years | 9,968 (25.4%) | $34,994 |
| Total | 39,180 (100.0%) | $43,135 |
Poverty in Erie
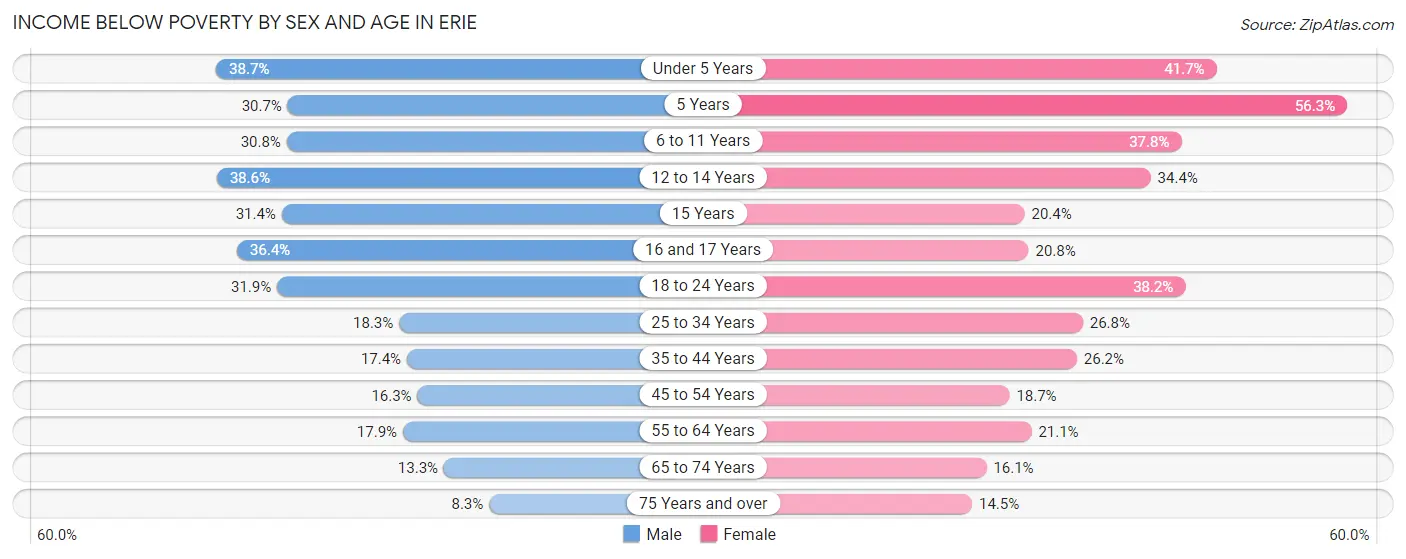
Income Below Poverty by Sex and Age in Erie
With 22.5% poverty level for males and 26.1% for females among the residents of Erie, under 5 year old males and 5 year old females are the most vulnerable to poverty, with 1,093 males (38.7%) and 355 females (56.3%) in their respective age groups living below the poverty level.
| Age Bracket | Male | Female |
| Under 5 Years | 1,093 (38.7%) | 982 (41.7%) |
| 5 Years | 101 (30.7%) | 355 (56.3%) |
| 6 to 11 Years | 1,115 (30.8%) | 1,164 (37.8%) |
| 12 to 14 Years | 721 (38.6%) | 503 (34.4%) |
| 15 Years | 250 (31.4%) | 106 (20.3%) |
| 16 and 17 Years | 438 (36.3%) | 218 (20.8%) |
| 18 to 24 Years | 1,505 (31.9%) | 1,685 (38.2%) |
| 25 to 34 Years | 1,344 (18.3%) | 1,940 (26.8%) |
| 35 to 44 Years | 820 (17.4%) | 1,357 (26.2%) |
| 45 to 54 Years | 810 (16.3%) | 989 (18.7%) |
| 55 to 64 Years | 1,041 (17.9%) | 1,240 (21.1%) |
| 65 to 74 Years | 508 (13.3%) | 742 (16.1%) |
| 75 Years and over | 166 (8.3%) | 520 (14.5%) |
| Total | 9,912 (22.5%) | 11,801 (26.1%) |
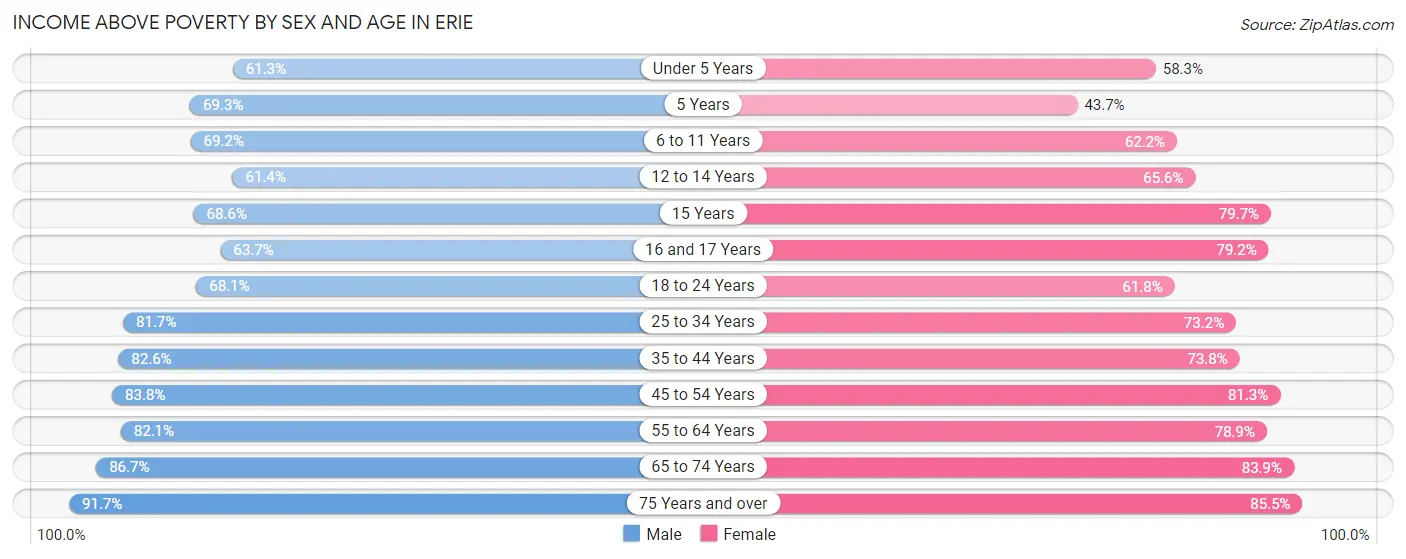
Income Above Poverty by Sex and Age in Erie
According to the poverty statistics in Erie, males aged 75 years and over and females aged 75 years and over are the age groups that are most secure financially, with 91.7% of males and 85.5% of females in these age groups living above the poverty line.
| Age Bracket | Male | Female |
| Under 5 Years | 1,734 (61.3%) | 1,372 (58.3%) |
| 5 Years | 228 (69.3%) | 276 (43.7%) |
| 6 to 11 Years | 2,504 (69.2%) | 1,915 (62.2%) |
| 12 to 14 Years | 1,147 (61.4%) | 959 (65.6%) |
| 15 Years | 547 (68.6%) | 415 (79.6%) |
| 16 and 17 Years | 767 (63.6%) | 830 (79.2%) |
| 18 to 24 Years | 3,214 (68.1%) | 2,721 (61.8%) |
| 25 to 34 Years | 6,003 (81.7%) | 5,289 (73.2%) |
| 35 to 44 Years | 3,888 (82.6%) | 3,826 (73.8%) |
| 45 to 54 Years | 4,174 (83.8%) | 4,308 (81.3%) |
| 55 to 64 Years | 4,783 (82.1%) | 4,630 (78.9%) |
| 65 to 74 Years | 3,312 (86.7%) | 3,863 (83.9%) |
| 75 Years and over | 1,841 (91.7%) | 3,063 (85.5%) |
| Total | 34,142 (77.5%) | 33,467 (73.9%) |
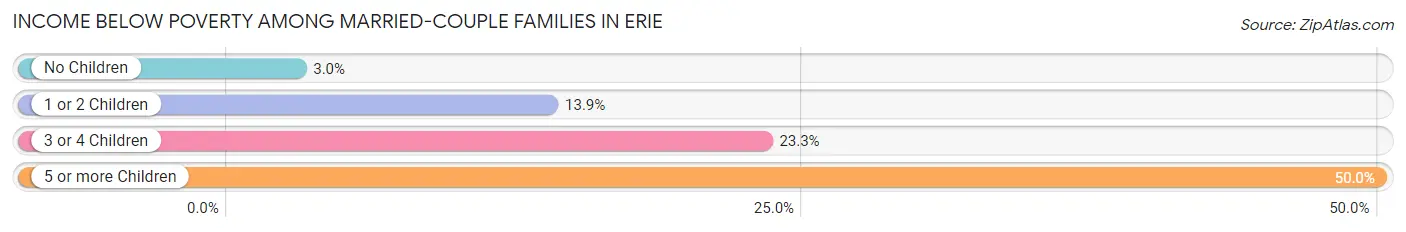
Income Below Poverty Among Married-Couple Families in Erie
The poverty statistics for married-couple families in Erie show that 8.0% or 919 of the total 11,552 families live below the poverty line. Families with 5 or more children have the highest poverty rate of 50.0%, comprising of 52 families. On the other hand, families with no children have the lowest poverty rate of 3.0%, which includes 223 families.
| Children | Above Poverty | Below Poverty |
| No Children | 7,297 (97.0%) | 223 (3.0%) |
| 1 or 2 Children | 2,489 (86.1%) | 403 (13.9%) |
| 3 or 4 Children | 795 (76.7%) | 241 (23.3%) |
| 5 or more Children | 52 (50.0%) | 52 (50.0%) |
| Total | 10,633 (92.0%) | 919 (8.0%) |
Income Below Poverty Among Single-Parent Households in Erie
According to the poverty data in Erie, 20.8% or 450 single-father households and 38.5% or 2,638 single-mother households are living below the poverty line. Among single-father households, those with 5 or more children have the highest poverty rate, with 21 households (100.0%) experiencing poverty. Likewise, among single-mother households, those with 3 or 4 children have the highest poverty rate, with 706 households (66.2%) falling below the poverty line.
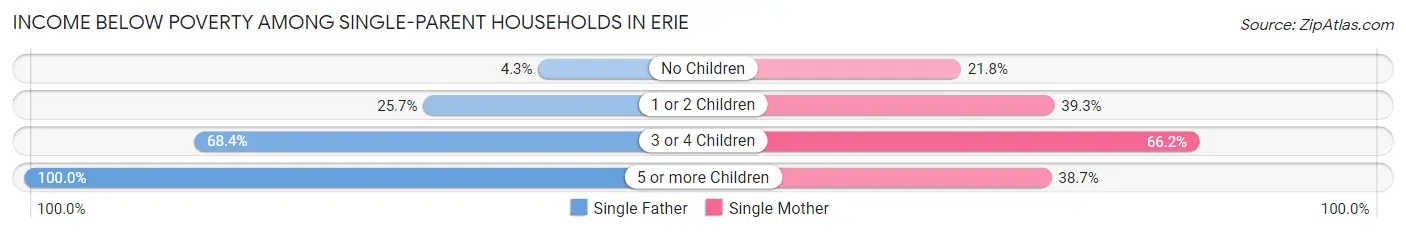
| Children | Single Father | Single Mother |
| No Children | 33 (4.3%) | 422 (21.8%) |
| 1 or 2 Children | 331 (25.7%) | 1,431 (39.3%) |
| 3 or 4 Children | 65 (68.4%) | 706 (66.2%) |
| 5 or more Children | 21 (100.0%) | 79 (38.7%) |
| Total | 450 (20.8%) | 2,638 (38.5%) |
Income Below Poverty Among Married-Couple vs Single-Parent Households in Erie
The poverty data for Erie shows that 919 of the married-couple family households (8.0%) and 3,088 of the single-parent households (34.2%) are living below the poverty level. Within the married-couple family households, those with 5 or more children have the highest poverty rate, with 52 households (50.0%) falling below the poverty line. Among the single-parent households, those with 3 or 4 children have the highest poverty rate, with 771 household (66.3%) living below poverty.
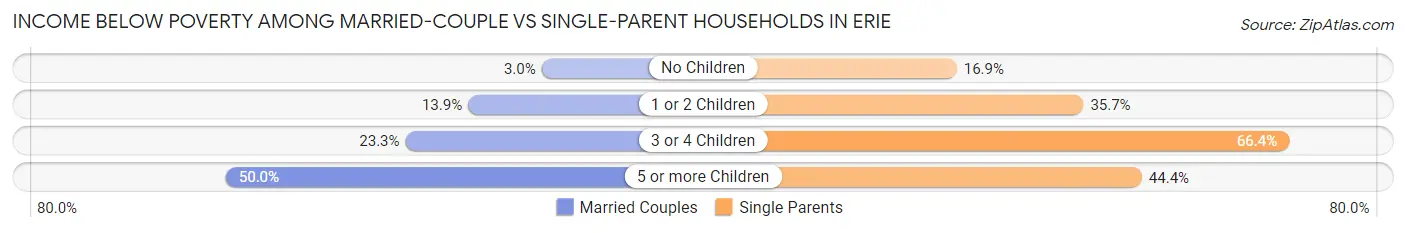
| Children | Married-Couple Families | Single-Parent Households |
| No Children | 223 (3.0%) | 455 (16.9%) |
| 1 or 2 Children | 403 (13.9%) | 1,762 (35.7%) |
| 3 or 4 Children | 241 (23.3%) | 771 (66.3%) |
| 5 or more Children | 52 (50.0%) | 100 (44.4%) |
| Total | 919 (8.0%) | 3,088 (34.2%) |
Race in Erie
The most populous races in Erie are White / Caucasian (66,189 | 69.8%), Black / African American (15,473 | 16.3%), and Two or more Races (7,942 | 8.4%).
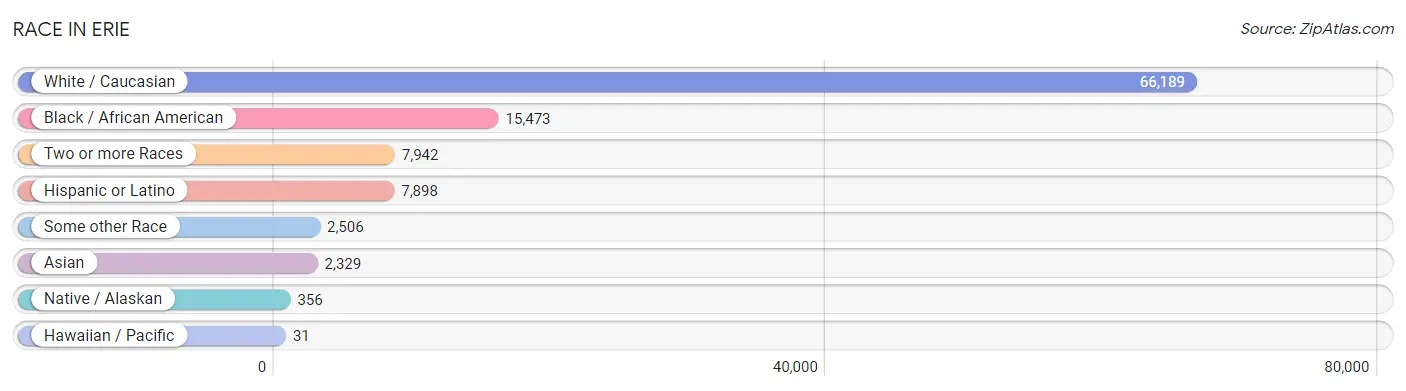
| Race | # Population | % Population |
| Asian | 2,329 | 2.5% |
| Black / African American | 15,473 | 16.3% |
| Hawaiian / Pacific | 31 | 0.0% |
| Hispanic or Latino | 7,898 | 8.3% |
| Native / Alaskan | 356 | 0.4% |
| White / Caucasian | 66,189 | 69.8% |
| Two or more Races | 7,942 | 8.4% |
| Some other Race | 2,506 | 2.6% |
| Total | 94,826 | 100.0% |
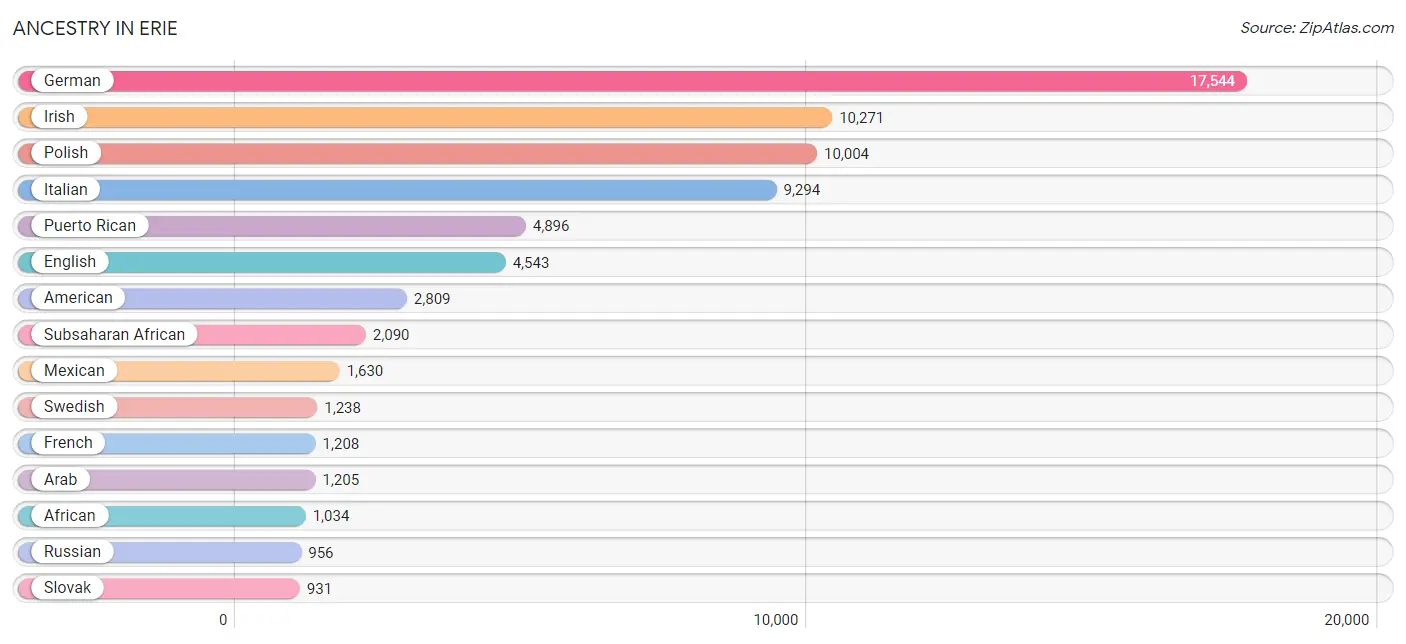
Ancestry in Erie
The most populous ancestries reported in Erie are German (17,544 | 18.5%), Irish (10,271 | 10.8%), Polish (10,004 | 10.5%), Italian (9,294 | 9.8%), and Puerto Rican (4,896 | 5.2%), together accounting for 54.8% of all Erie residents.
| Ancestry | # Population | % Population |
| Afghan | 21 | 0.0% |
| African | 1,034 | 1.1% |
| Albanian | 78 | 0.1% |
| American | 2,809 | 3.0% |
| Arab | 1,205 | 1.3% |
| Armenian | 83 | 0.1% |
| Assyrian / Chaldean / Syriac | 23 | 0.0% |
| Australian | 53 | 0.1% |
| Austrian | 242 | 0.3% |
| Barbadian | 2 | 0.0% |
| Basque | 10 | 0.0% |
| Belgian | 82 | 0.1% |
| Bhutanese | 268 | 0.3% |
| Blackfeet | 47 | 0.1% |
| British | 220 | 0.2% |
| British West Indian | 20 | 0.0% |
| Bulgarian | 21 | 0.0% |
| Burmese | 194 | 0.2% |
| Cajun | 8 | 0.0% |
| Cambodian | 60 | 0.1% |
| Canadian | 223 | 0.2% |
| Carpatho Rusyn | 15 | 0.0% |
| Central American | 197 | 0.2% |
| Central American Indian | 118 | 0.1% |
| Cherokee | 623 | 0.7% |
| Chickasaw | 9 | 0.0% |
| Choctaw | 29 | 0.0% |
| Colombian | 39 | 0.0% |
| Comanche | 5 | 0.0% |
| Costa Rican | 77 | 0.1% |
| Creek | 4 | 0.0% |
| Croatian | 157 | 0.2% |
| Cuban | 64 | 0.1% |
| Czech | 344 | 0.4% |
| Czechoslovakian | 71 | 0.1% |
| Danish | 56 | 0.1% |
| Dominican | 220 | 0.2% |
| Dutch | 687 | 0.7% |
| Eastern European | 165 | 0.2% |
| Ecuadorian | 49 | 0.1% |
| Egyptian | 16 | 0.0% |
| English | 4,543 | 4.8% |
| Ethiopian | 307 | 0.3% |
| European | 526 | 0.5% |
| Fijian | 7 | 0.0% |
| Finnish | 178 | 0.2% |
| French | 1,208 | 1.3% |
| French American Indian | 11 | 0.0% |
| French Canadian | 64 | 0.1% |
| German | 17,544 | 18.5% |
| Greek | 242 | 0.3% |
| Guatemalan | 41 | 0.0% |
| Guyanese | 5 | 0.0% |
| Haitian | 48 | 0.1% |
| Honduran | 79 | 0.1% |
| Hungarian | 501 | 0.5% |
| Icelander | 29 | 0.0% |
| Indian (Asian) | 122 | 0.1% |
| Iranian | 23 | 0.0% |
| Iraqi | 372 | 0.4% |
| Irish | 10,271 | 10.8% |
| Iroquois | 75 | 0.1% |
| Italian | 9,294 | 9.8% |
| Jamaican | 264 | 0.3% |
| Jordanian | 14 | 0.0% |
| Kenyan | 129 | 0.1% |
| Korean | 603 | 0.6% |
| Lebanese | 112 | 0.1% |
| Lithuanian | 335 | 0.4% |
| Luxembourger | 9 | 0.0% |
| Mexican | 1,630 | 1.7% |
| Mexican American Indian | 29 | 0.0% |
| Moroccan | 64 | 0.1% |
| Native Hawaiian | 18 | 0.0% |
| Navajo | 4 | 0.0% |
| Nigerian | 12 | 0.0% |
| Northern European | 21 | 0.0% |
| Norwegian | 103 | 0.1% |
| Pakistani | 145 | 0.2% |
| Palestinian | 28 | 0.0% |
| Pennsylvania German | 144 | 0.2% |
| Peruvian | 227 | 0.2% |
| Polish | 10,004 | 10.5% |
| Portuguese | 327 | 0.3% |
| Potawatomi | 40 | 0.0% |
| Puerto Rican | 4,896 | 5.2% |
| Romanian | 96 | 0.1% |
| Russian | 956 | 1.0% |
| Samoan | 15 | 0.0% |
| Scandinavian | 196 | 0.2% |
| Scotch-Irish | 861 | 0.9% |
| Scottish | 821 | 0.9% |
| Senegalese | 22 | 0.0% |
| Sioux | 108 | 0.1% |
| Slavic | 95 | 0.1% |
| Slovak | 931 | 1.0% |
| Slovene | 7 | 0.0% |
| Somali | 280 | 0.3% |
| South African | 8 | 0.0% |
| South American | 435 | 0.5% |
| South American Indian | 17 | 0.0% |
| Spaniard | 71 | 0.1% |
| Spanish | 75 | 0.1% |
| Sri Lankan | 113 | 0.1% |
| Subsaharan African | 2,090 | 2.2% |
| Sudanese | 124 | 0.1% |
| Swedish | 1,238 | 1.3% |
| Swiss | 189 | 0.2% |
| Syrian | 232 | 0.2% |
| Thai | 304 | 0.3% |
| Tlingit-Haida | 34 | 0.0% |
| Trinidadian and Tobagonian | 9 | 0.0% |
| Turkish | 36 | 0.0% |
| Ugandan | 139 | 0.2% |
| Ukrainian | 864 | 0.9% |
| Uruguayan | 6 | 0.0% |
| Venezuelan | 114 | 0.1% |
| Vietnamese | 89 | 0.1% |
| Welsh | 643 | 0.7% |
| West Indian | 19 | 0.0% |
| Yugoslavian | 527 | 0.6% | View All 121 Rows |
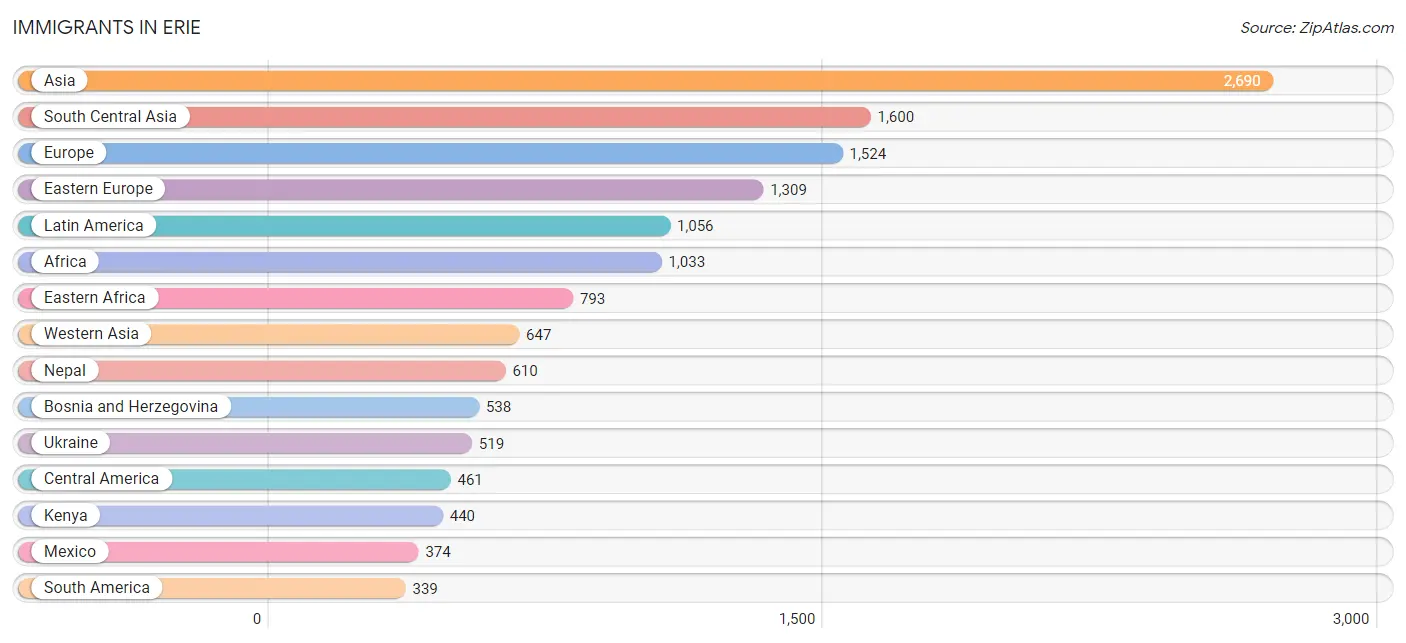
Immigrants in Erie
The most numerous immigrant groups reported in Erie came from Asia (2,690 | 2.8%), South Central Asia (1,600 | 1.7%), Europe (1,524 | 1.6%), Eastern Europe (1,309 | 1.4%), and Latin America (1,056 | 1.1%), together accounting for 8.6% of all Erie residents.
| Immigration Origin | # Population | % Population |
| Afghanistan | 16 | 0.0% |
| Africa | 1,033 | 1.1% |
| Asia | 2,690 | 2.8% |
| Bangladesh | 56 | 0.1% |
| Barbados | 2 | 0.0% |
| Belarus | 51 | 0.1% |
| Bosnia and Herzegovina | 538 | 0.6% |
| Bulgaria | 21 | 0.0% |
| Cameroon | 13 | 0.0% |
| Canada | 176 | 0.2% |
| Caribbean | 256 | 0.3% |
| Central America | 461 | 0.5% |
| China | 69 | 0.1% |
| Colombia | 7 | 0.0% |
| Dominican Republic | 132 | 0.1% |
| Eastern Africa | 793 | 0.8% |
| Eastern Asia | 184 | 0.2% |
| Eastern Europe | 1,309 | 1.4% |
| Egypt | 18 | 0.0% |
| England | 32 | 0.0% |
| Ethiopia | 137 | 0.1% |
| Europe | 1,524 | 1.6% |
| France | 19 | 0.0% |
| Germany | 69 | 0.1% |
| Ghana | 21 | 0.0% |
| Grenada | 11 | 0.0% |
| Guatemala | 22 | 0.0% |
| Guyana | 5 | 0.0% |
| Haiti | 64 | 0.1% |
| Honduras | 42 | 0.0% |
| Hungary | 4 | 0.0% |
| India | 35 | 0.0% |
| Iran | 34 | 0.0% |
| Iraq | 175 | 0.2% |
| Italy | 54 | 0.1% |
| Jamaica | 23 | 0.0% |
| Japan | 20 | 0.0% |
| Jordan | 25 | 0.0% |
| Kazakhstan | 27 | 0.0% |
| Kenya | 440 | 0.5% |
| Korea | 35 | 0.0% |
| Kuwait | 23 | 0.0% |
| Latin America | 1,056 | 1.1% |
| Lithuania | 6 | 0.0% |
| Mexico | 374 | 0.4% |
| Middle Africa | 13 | 0.0% |
| Morocco | 59 | 0.1% |
| Nepal | 610 | 0.6% |
| Nicaragua | 23 | 0.0% |
| Nigeria | 23 | 0.0% |
| Northern Africa | 115 | 0.1% |
| Northern Europe | 69 | 0.1% |
| Oceania | 7 | 0.0% |
| Pakistan | 39 | 0.0% |
| Peru | 294 | 0.3% |
| Philippines | 147 | 0.2% |
| Poland | 44 | 0.1% |
| Romania | 51 | 0.1% |
| Russia | 15 | 0.0% |
| Saudi Arabia | 198 | 0.2% |
| Senegal | 30 | 0.0% |
| Serbia | 8 | 0.0% |
| Sierra Leone | 21 | 0.0% |
| Somalia | 60 | 0.1% |
| South Africa | 8 | 0.0% |
| South America | 339 | 0.4% |
| South Central Asia | 1,600 | 1.7% |
| South Eastern Asia | 259 | 0.3% |
| Southern Europe | 58 | 0.1% |
| Spain | 4 | 0.0% |
| Sudan | 38 | 0.0% |
| Syria | 210 | 0.2% |
| Thailand | 6 | 0.0% |
| Trinidad and Tobago | 24 | 0.0% |
| Uganda | 102 | 0.1% |
| Ukraine | 519 | 0.5% |
| Uzbekistan | 18 | 0.0% |
| Venezuela | 33 | 0.0% |
| Vietnam | 106 | 0.1% |
| Western Africa | 95 | 0.1% |
| Western Asia | 647 | 0.7% |
| Western Europe | 88 | 0.1% | View All 82 Rows |
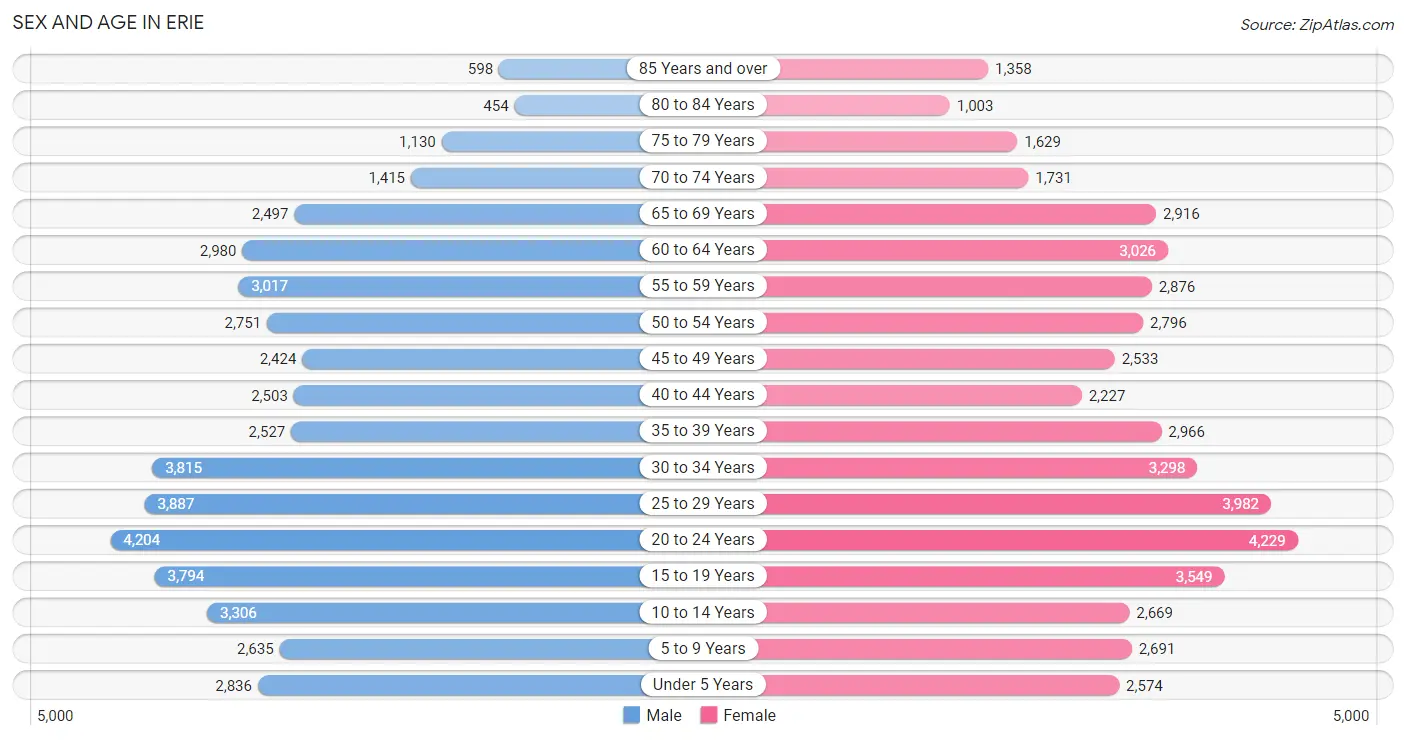
Sex and Age in Erie
Sex and Age in Erie
The most populous age groups in Erie are 20 to 24 Years (4,204 | 9.0%) for men and 20 to 24 Years (4,229 | 8.8%) for women.
| Age Bracket | Male | Female |
| Under 5 Years | 2,836 (6.1%) | 2,574 (5.4%) |
| 5 to 9 Years | 2,635 (5.6%) | 2,691 (5.6%) |
| 10 to 14 Years | 3,306 (7.1%) | 2,669 (5.6%) |
| 15 to 19 Years | 3,794 (8.1%) | 3,549 (7.4%) |
| 20 to 24 Years | 4,204 (9.0%) | 4,229 (8.8%) |
| 25 to 29 Years | 3,887 (8.3%) | 3,982 (8.3%) |
| 30 to 34 Years | 3,815 (8.2%) | 3,298 (6.9%) |
| 35 to 39 Years | 2,527 (5.4%) | 2,966 (6.2%) |
| 40 to 44 Years | 2,503 (5.3%) | 2,227 (4.6%) |
| 45 to 49 Years | 2,424 (5.2%) | 2,533 (5.3%) |
| 50 to 54 Years | 2,751 (5.9%) | 2,796 (5.8%) |
| 55 to 59 Years | 3,017 (6.5%) | 2,876 (6.0%) |
| 60 to 64 Years | 2,980 (6.4%) | 3,026 (6.3%) |
| 65 to 69 Years | 2,497 (5.3%) | 2,916 (6.1%) |
| 70 to 74 Years | 1,415 (3.0%) | 1,731 (3.6%) |
| 75 to 79 Years | 1,130 (2.4%) | 1,629 (3.4%) |
| 80 to 84 Years | 454 (1.0%) | 1,003 (2.1%) |
| 85 Years and over | 598 (1.3%) | 1,358 (2.8%) |
| Total | 46,773 (100.0%) | 48,053 (100.0%) |
Families and Households in Erie
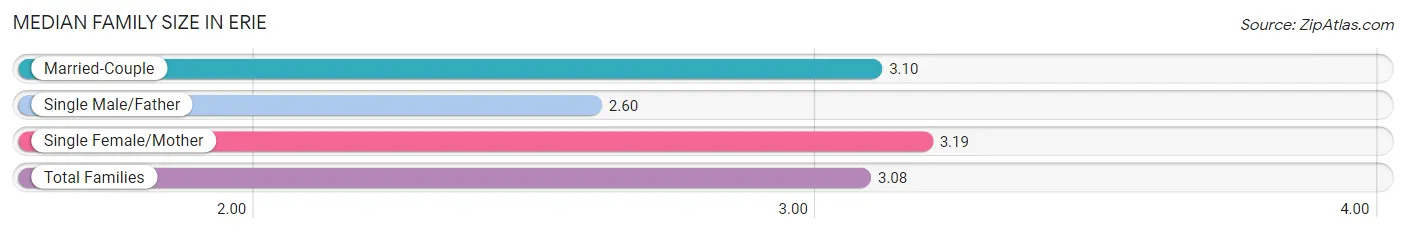
Median Family Size in Erie
The median family size in Erie is 3.08 persons per family, with single female/mother families (6,851 | 33.3%) accounting for the largest median family size of 3.19 persons per family. On the other hand, single male/father families (2,167 | 10.5%) represent the smallest median family size with 2.60 persons per family.
| Family Type | # Families | Family Size |
| Married-Couple | 11,552 (56.2%) | 3.10 |
| Single Male/Father | 2,167 (10.5%) | 2.60 |
| Single Female/Mother | 6,851 (33.3%) | 3.19 |
| Total Families | 20,570 (100.0%) | 3.08 |
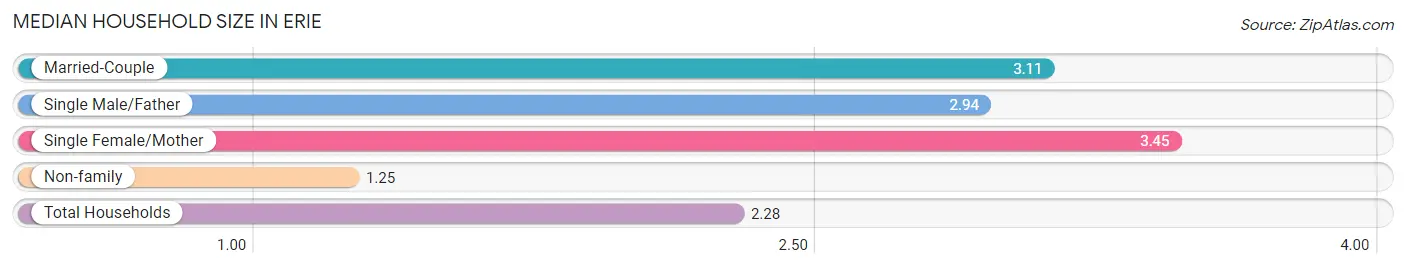
Median Household Size in Erie
The median household size in Erie is 2.28 persons per household, with single female/mother households (6,851 | 17.5%) accounting for the largest median household size of 3.45 persons per household. non-family households (18,610 | 47.5%) represent the smallest median household size with 1.25 persons per household.
| Household Type | # Households | Household Size |
| Married-Couple | 11,552 (29.5%) | 3.11 |
| Single Male/Father | 2,167 (5.5%) | 2.94 |
| Single Female/Mother | 6,851 (17.5%) | 3.45 |
| Non-family | 18,610 (47.5%) | 1.25 |
| Total Households | 39,180 (100.0%) | 2.28 |
Household Size by Marriage Status in Erie
Out of a total of 39,180 households in Erie, 20,570 (52.5%) are family households, while 18,610 (47.5%) are nonfamily households. The most numerous type of family households are 2-person households, comprising 9,103, and the most common type of nonfamily households are 1-person households, comprising 14,936.
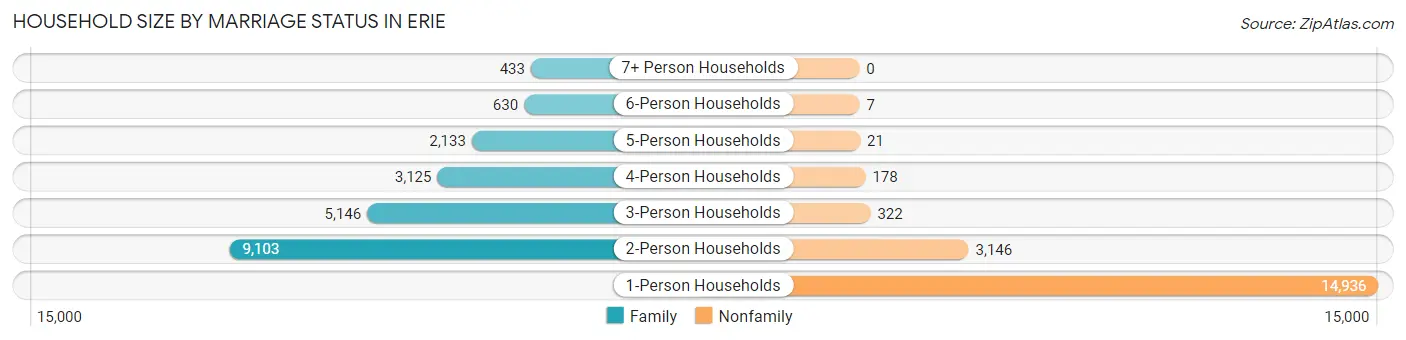
| Household Size | Family Households | Nonfamily Households |
| 1-Person Households | - | 14,936 (38.1%) |
| 2-Person Households | 9,103 (23.2%) | 3,146 (8.0%) |
| 3-Person Households | 5,146 (13.1%) | 322 (0.8%) |
| 4-Person Households | 3,125 (8.0%) | 178 (0.4%) |
| 5-Person Households | 2,133 (5.4%) | 21 (0.1%) |
| 6-Person Households | 630 (1.6%) | 7 (0.0%) |
| 7+ Person Households | 433 (1.1%) | 0 (0.0%) |
| Total | 20,570 (52.5%) | 18,610 (47.5%) |
Female Fertility in Erie
Fertility by Age in Erie
Average fertility rate in Erie is 63.0 births per 1,000 women. Women in the age bracket of 20 to 34 years have the highest fertility rate with 95.0 births per 1,000 women. Women in the age bracket of 20 to 34 years acount for 74.5% of all women with births.
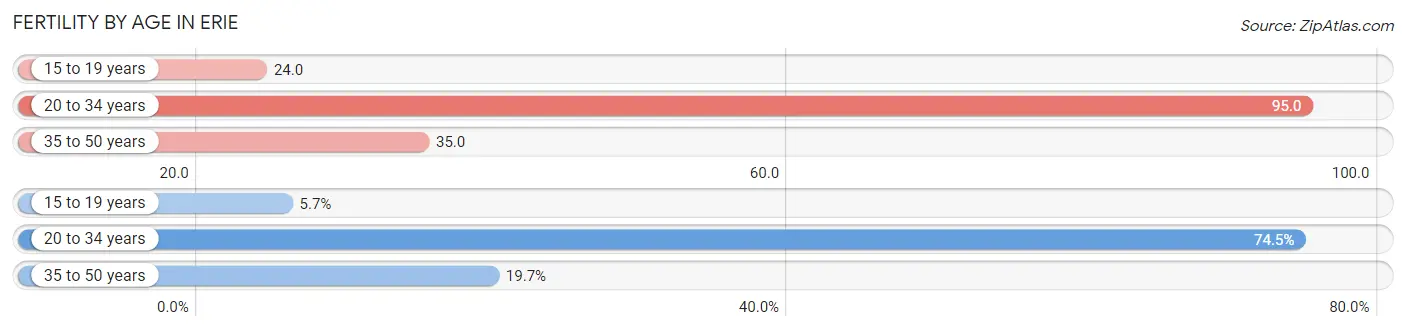
| Age Bracket | Women with Births | Births / 1,000 Women |
| 15 to 19 years | 84 (5.7%) | 24.0 |
| 20 to 34 years | 1,091 (74.5%) | 95.0 |
| 35 to 50 years | 289 (19.7%) | 35.0 |
| Total | 1,464 (100.0%) | 63.0 |
Fertility by Age by Marriage Status in Erie
49.2% of women with births (1,464) in Erie are married. The highest percentage of unmarried women with births falls into 20 to 34 years age bracket with 57.8% of them unmarried at the time of birth, while the lowest percentage of unmarried women with births belong to 35 to 50 years age bracket with 30.4% of them unmarried.
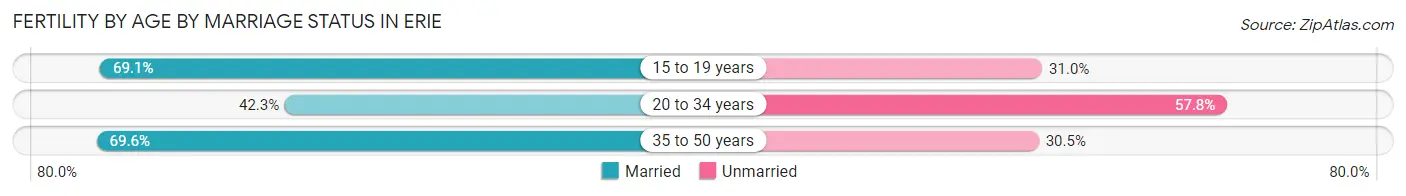
| Age Bracket | Married | Unmarried |
| 15 to 19 years | 58 (69.1%) | 26 (30.9%) |
| 20 to 34 years | 461 (42.2%) | 630 (57.8%) |
| 35 to 50 years | 201 (69.6%) | 88 (30.4%) |
| Total | 720 (49.2%) | 744 (50.8%) |
Fertility by Education in Erie
Average fertility rate in Erie is 63.0 births per 1,000 women. Women with the education attainment of graduate degree have the highest fertility rate of 83.0 births per 1,000 women, while women with the education attainment of bachelor's degree have the lowest fertility at 42.0 births per 1,000 women. Women with the education attainment of college or associate's degree represent 30.5% of all women with births.
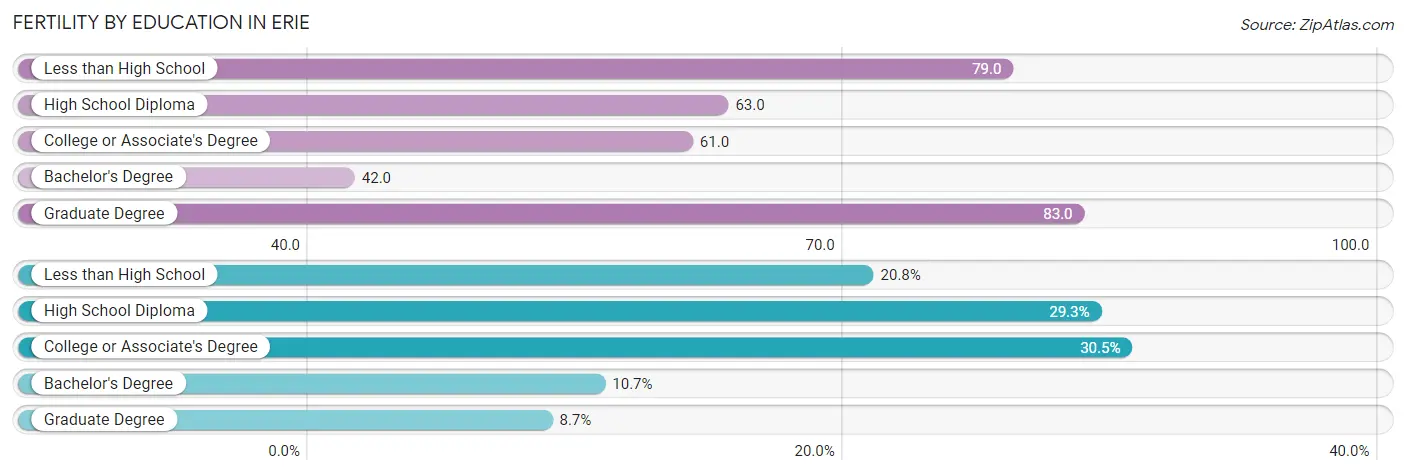
| Educational Attainment | Women with Births | Births / 1,000 Women |
| Less than High School | 304 (20.8%) | 79.0 |
| High School Diploma | 429 (29.3%) | 63.0 |
| College or Associate's Degree | 446 (30.5%) | 61.0 |
| Bachelor's Degree | 157 (10.7%) | 42.0 |
| Graduate Degree | 128 (8.7%) | 83.0 |
| Total | 1,464 (100.0%) | 63.0 |
Fertility by Education by Marriage Status in Erie
50.8% of women with births in Erie are unmarried. Women with the educational attainment of graduate degree are most likely to be married with 100.0% of them married at childbirth, while women with the educational attainment of high school diploma are least likely to be married with 74.1% of them unmarried at childbirth.
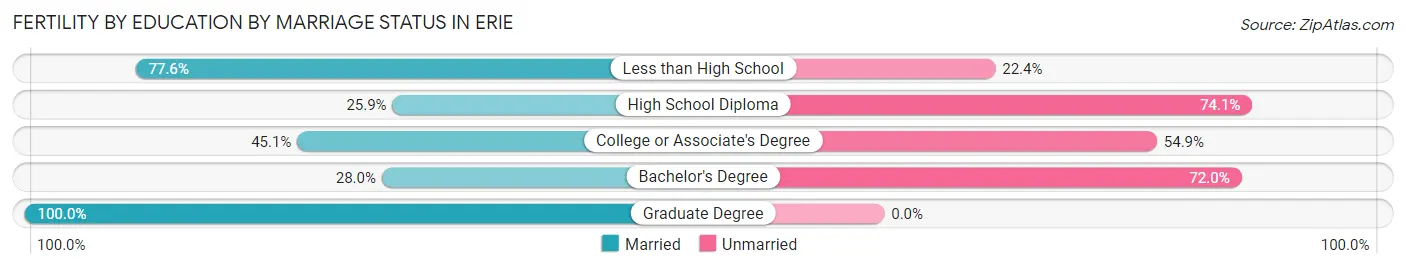
| Educational Attainment | Married | Unmarried |
| Less than High School | 236 (77.6%) | 68 (22.4%) |
| High School Diploma | 111 (25.9%) | 318 (74.1%) |
| College or Associate's Degree | 201 (45.1%) | 245 (54.9%) |
| Bachelor's Degree | 44 (28.0%) | 113 (72.0%) |
| Graduate Degree | 128 (100.0%) | 0 (0.0%) |
| Total | 720 (49.2%) | 744 (50.8%) |
Employment Characteristics in Erie
Employment by Class of Employer in Erie
Among the 41,554 employed individuals in Erie, private company employees (28,077 | 67.6%), not-for-profit organizations (7,131 | 17.2%), and local government employees (2,082 | 5.0%) make up the most common classes of employment.
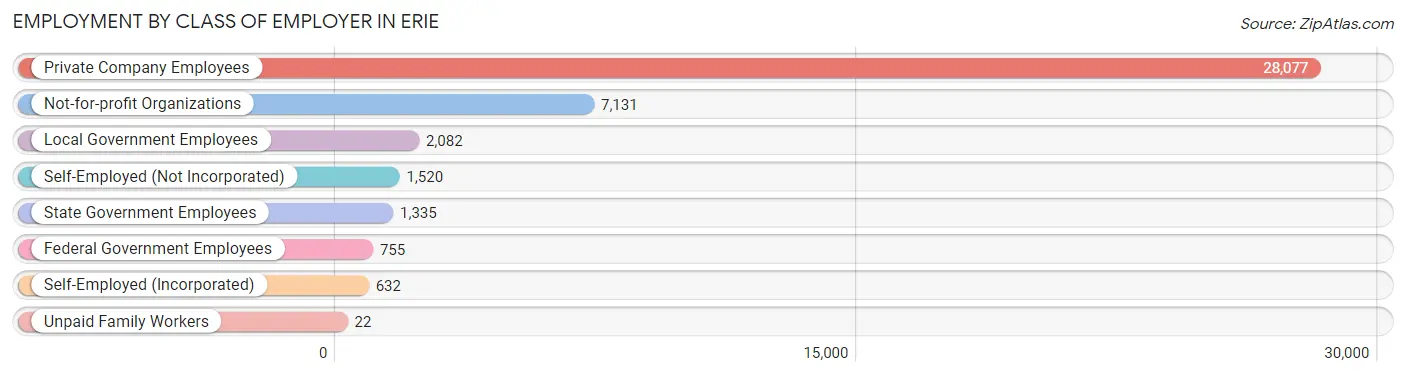
| Employer Class | # Employees | % Employees |
| Private Company Employees | 28,077 | 67.6% |
| Self-Employed (Incorporated) | 632 | 1.5% |
| Self-Employed (Not Incorporated) | 1,520 | 3.7% |
| Not-for-profit Organizations | 7,131 | 17.2% |
| Local Government Employees | 2,082 | 5.0% |
| State Government Employees | 1,335 | 3.2% |
| Federal Government Employees | 755 | 1.8% |
| Unpaid Family Workers | 22 | 0.1% |
| Total | 41,554 | 100.0% |
Employment Status by Age in Erie
According to the labor force statistics for Erie, out of the total population over 16 years of age (76,787), 59.2% or 45,458 individuals are in the labor force, with 6.8% or 3,091 of them unemployed. The age group with the highest labor force participation rate is 35 to 44 years, with 82.0% or 8,383 individuals in the labor force. Within the labor force, the 16 to 19 years age range has the highest percentage of unemployed individuals, with 17.4% or 368 of them being unemployed.
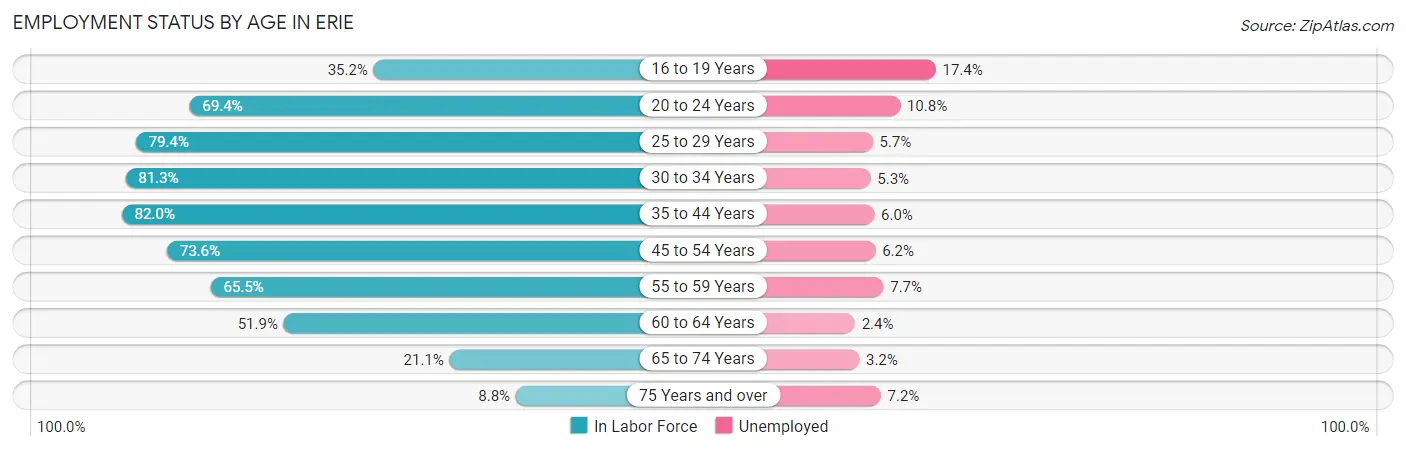
| Age Bracket | In Labor Force | Unemployed |
| 16 to 19 Years | 2,117 (35.2%) | 368 (17.4%) |
| 20 to 24 Years | 5,853 (69.4%) | 632 (10.8%) |
| 25 to 29 Years | 6,248 (79.4%) | 356 (5.7%) |
| 30 to 34 Years | 5,783 (81.3%) | 306 (5.3%) |
| 35 to 44 Years | 8,383 (82.0%) | 503 (6.0%) |
| 45 to 54 Years | 7,731 (73.6%) | 479 (6.2%) |
| 55 to 59 Years | 3,860 (65.5%) | 297 (7.7%) |
| 60 to 64 Years | 3,117 (51.9%) | 75 (2.4%) |
| 65 to 74 Years | 1,806 (21.1%) | 58 (3.2%) |
| 75 Years and over | 543 (8.8%) | 39 (7.2%) |
| Total | 45,458 (59.2%) | 3,091 (6.8%) |
Employment Status by Educational Attainment in Erie
According to labor force statistics for Erie, 73.8% of individuals (35,135) out of the total population between 25 and 64 years of age (47,608) are in the labor force, with 5.7% or 2,003 of them being unemployed. The group with the highest labor force participation rate are those with the educational attainment of bachelor's degree or higher, with 85.1% or 9,735 individuals in the labor force. Within the labor force, individuals with less than high school education have the highest percentage of unemployment, with 11.1% or 278 of them being unemployed.
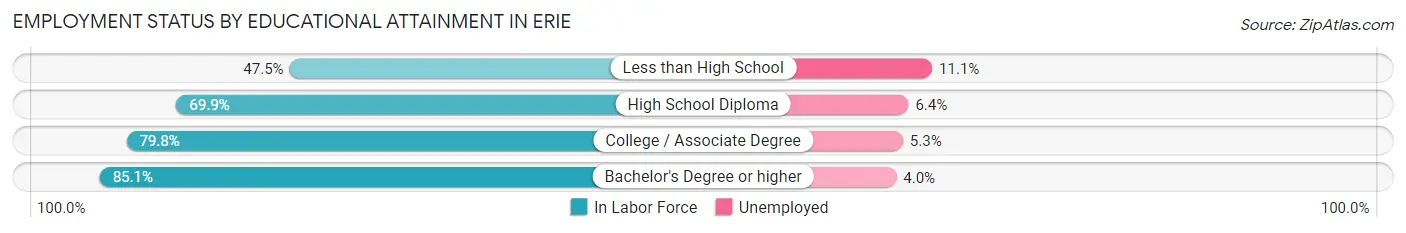
| Educational Attainment | In Labor Force | Unemployed |
| Less than High School | 2,502 (47.5%) | 585 (11.1%) |
| High School Diploma | 12,482 (69.9%) | 1,143 (6.4%) |
| College / Associate Degree | 10,410 (79.8%) | 691 (5.3%) |
| Bachelor's Degree or higher | 9,735 (85.1%) | 458 (4.0%) |
| Total | 35,135 (73.8%) | 2,714 (5.7%) |
Employment Occupations by Sex in Erie
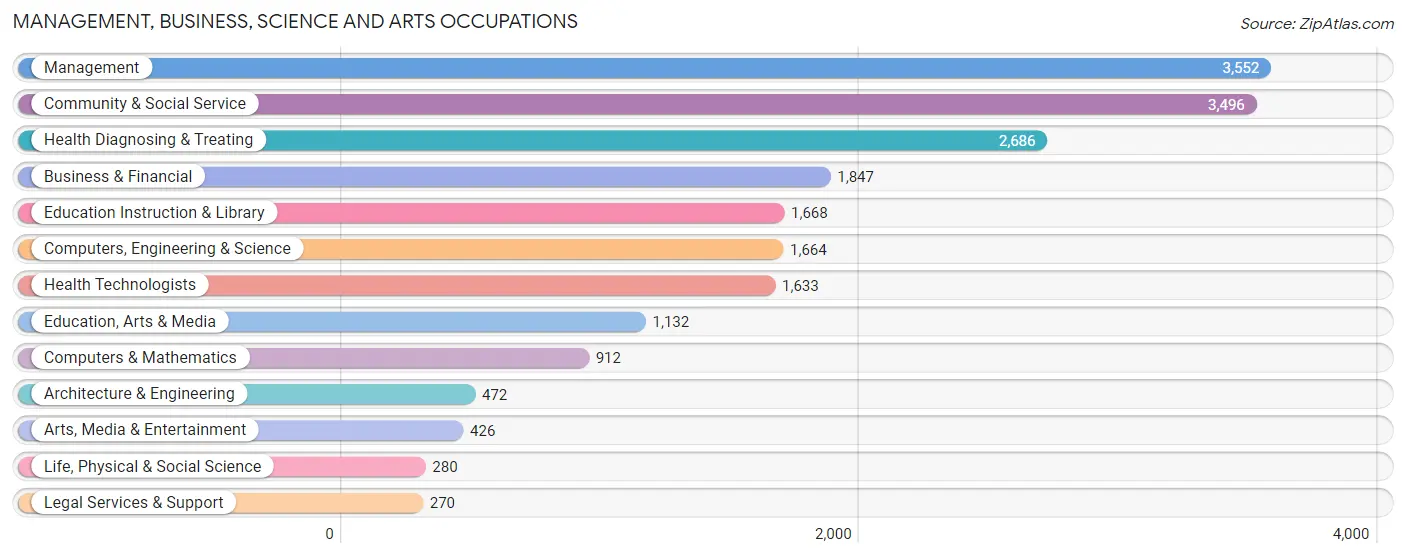
Management, Business, Science and Arts Occupations
The most common Management, Business, Science and Arts occupations in Erie are Management (3,552 | 8.4%), Community & Social Service (3,496 | 8.3%), Health Diagnosing & Treating (2,686 | 6.4%), Business & Financial (1,847 | 4.4%), and Education Instruction & Library (1,668 | 4.0%).
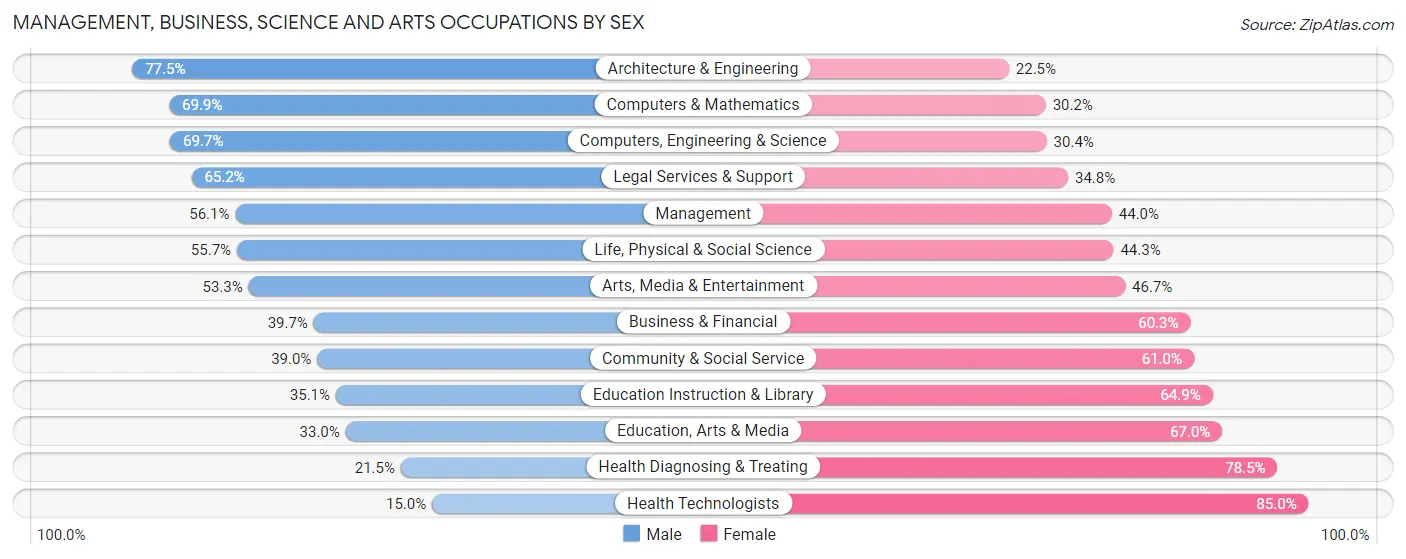
Management, Business, Science and Arts Occupations by Sex
Within the Management, Business, Science and Arts occupations in Erie, the most male-oriented occupations are Architecture & Engineering (77.5%), Computers & Mathematics (69.9%), and Computers, Engineering & Science (69.7%), while the most female-oriented occupations are Health Technologists (85.0%), Health Diagnosing & Treating (78.5%), and Education, Arts & Media (67.0%).
| Occupation | Male | Female |
| Management | 1,991 (56.0%) | 1,561 (44.0%) |
| Business & Financial | 733 (39.7%) | 1,114 (60.3%) |
| Computers, Engineering & Science | 1,159 (69.7%) | 505 (30.3%) |
| Computers & Mathematics | 637 (69.9%) | 275 (30.1%) |
| Architecture & Engineering | 366 (77.5%) | 106 (22.5%) |
| Life, Physical & Social Science | 156 (55.7%) | 124 (44.3%) |
| Community & Social Service | 1,362 (39.0%) | 2,134 (61.0%) |
| Education, Arts & Media | 374 (33.0%) | 758 (67.0%) |
| Legal Services & Support | 176 (65.2%) | 94 (34.8%) |
| Education Instruction & Library | 585 (35.1%) | 1,083 (64.9%) |
| Arts, Media & Entertainment | 227 (53.3%) | 199 (46.7%) |
| Health Diagnosing & Treating | 578 (21.5%) | 2,108 (78.5%) |
| Health Technologists | 245 (15.0%) | 1,388 (85.0%) |
| Total (Category) | 5,823 (44.0%) | 7,422 (56.0%) |
| Total (Overall) | 21,218 (50.2%) | 21,014 (49.8%) |
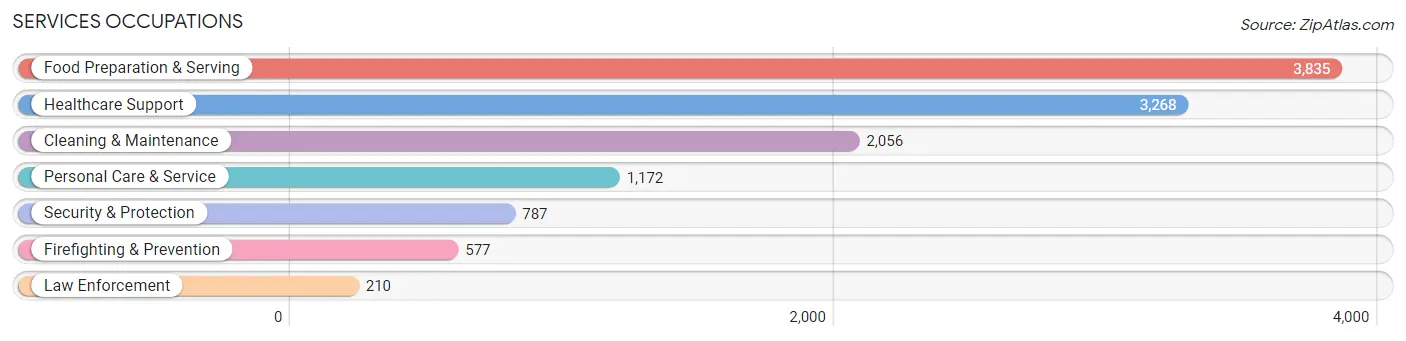
Services Occupations
The most common Services occupations in Erie are Food Preparation & Serving (3,835 | 9.1%), Healthcare Support (3,268 | 7.7%), Cleaning & Maintenance (2,056 | 4.9%), Personal Care & Service (1,172 | 2.8%), and Security & Protection (787 | 1.9%).
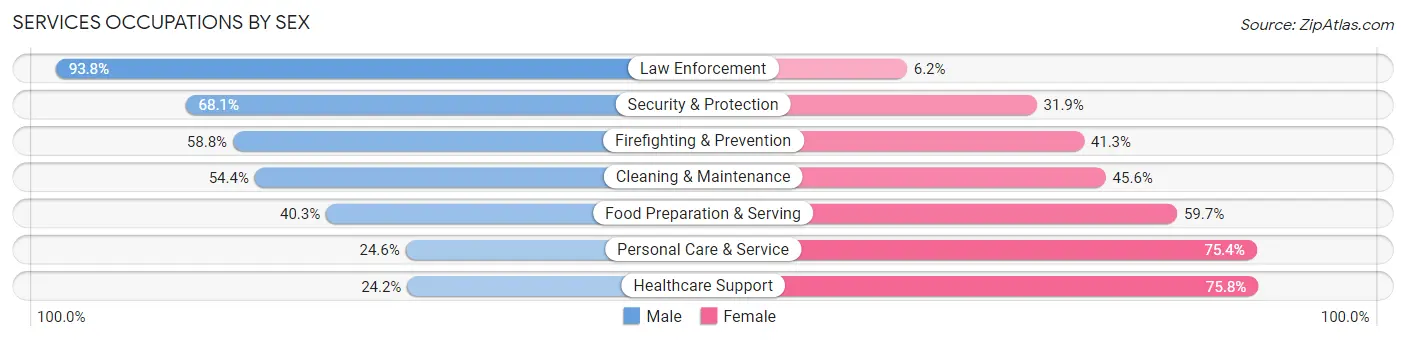
Services Occupations by Sex
Within the Services occupations in Erie, the most male-oriented occupations are Law Enforcement (93.8%), Security & Protection (68.1%), and Firefighting & Prevention (58.8%), while the most female-oriented occupations are Healthcare Support (75.8%), Personal Care & Service (75.4%), and Food Preparation & Serving (59.7%).
| Occupation | Male | Female |
| Healthcare Support | 792 (24.2%) | 2,476 (75.8%) |
| Security & Protection | 536 (68.1%) | 251 (31.9%) |
| Firefighting & Prevention | 339 (58.8%) | 238 (41.2%) |
| Law Enforcement | 197 (93.8%) | 13 (6.2%) |
| Food Preparation & Serving | 1,546 (40.3%) | 2,289 (59.7%) |
| Cleaning & Maintenance | 1,119 (54.4%) | 937 (45.6%) |
| Personal Care & Service | 288 (24.6%) | 884 (75.4%) |
| Total (Category) | 4,281 (38.5%) | 6,837 (61.5%) |
| Total (Overall) | 21,218 (50.2%) | 21,014 (49.8%) |
Sales and Office Occupations
The most common Sales and Office occupations in Erie are Office & Administration (4,567 | 10.8%), and Sales & Related (3,784 | 9.0%).

Sales and Office Occupations by Sex
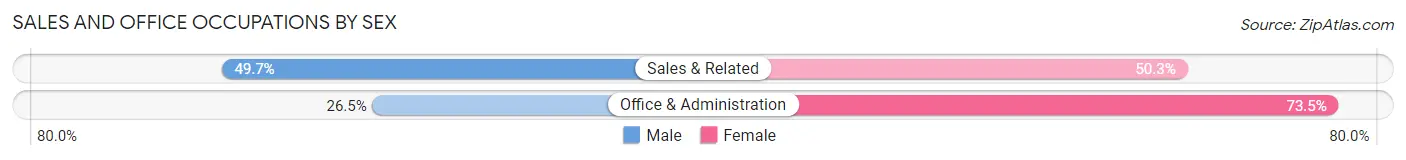
| Occupation | Male | Female |
| Sales & Related | 1,881 (49.7%) | 1,903 (50.3%) |
| Office & Administration | 1,209 (26.5%) | 3,358 (73.5%) |
| Total (Category) | 3,090 (37.0%) | 5,261 (63.0%) |
| Total (Overall) | 21,218 (50.2%) | 21,014 (49.8%) |
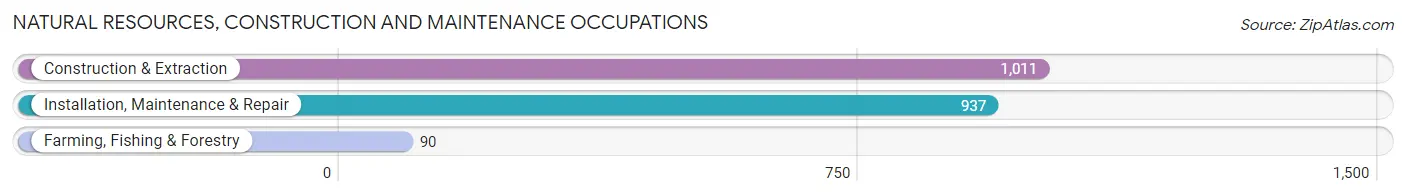
Natural Resources, Construction and Maintenance Occupations
The most common Natural Resources, Construction and Maintenance occupations in Erie are Construction & Extraction (1,011 | 2.4%), Installation, Maintenance & Repair (937 | 2.2%), and Farming, Fishing & Forestry (90 | 0.2%).
Natural Resources, Construction and Maintenance Occupations by Sex
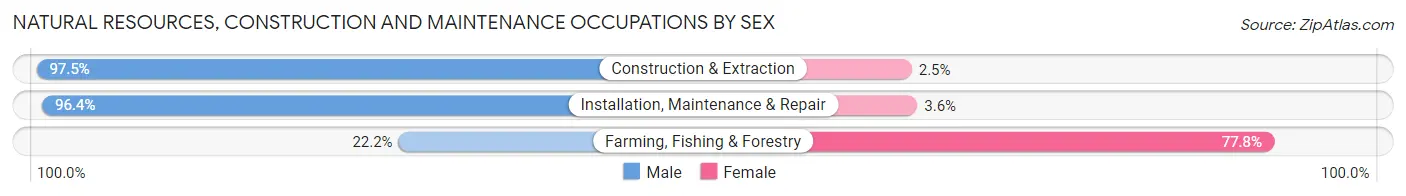
| Occupation | Male | Female |
| Farming, Fishing & Forestry | 20 (22.2%) | 70 (77.8%) |
| Construction & Extraction | 986 (97.5%) | 25 (2.5%) |
| Installation, Maintenance & Repair | 903 (96.4%) | 34 (3.6%) |
| Total (Category) | 1,909 (93.7%) | 129 (6.3%) |
| Total (Overall) | 21,218 (50.2%) | 21,014 (49.8%) |
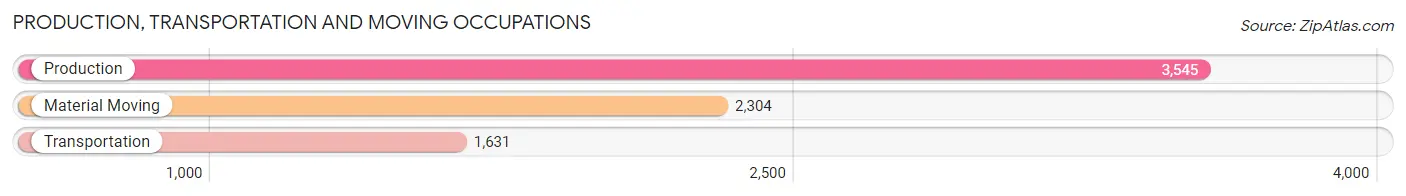
Production, Transportation and Moving Occupations
The most common Production, Transportation and Moving occupations in Erie are Production (3,545 | 8.4%), Material Moving (2,304 | 5.5%), and Transportation (1,631 | 3.9%).
Production, Transportation and Moving Occupations by Sex
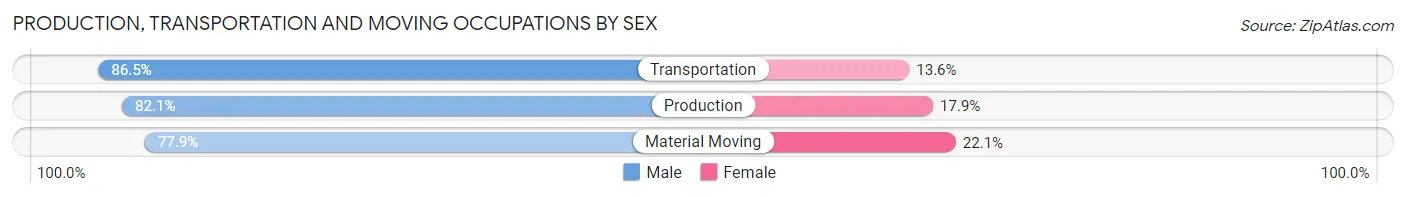
| Occupation | Male | Female |
| Production | 2,910 (82.1%) | 635 (17.9%) |
| Transportation | 1,410 (86.5%) | 221 (13.6%) |
| Material Moving | 1,795 (77.9%) | 509 (22.1%) |
| Total (Category) | 6,115 (81.8%) | 1,365 (18.2%) |
| Total (Overall) | 21,218 (50.2%) | 21,014 (49.8%) |
Employment Industries by Sex in Erie
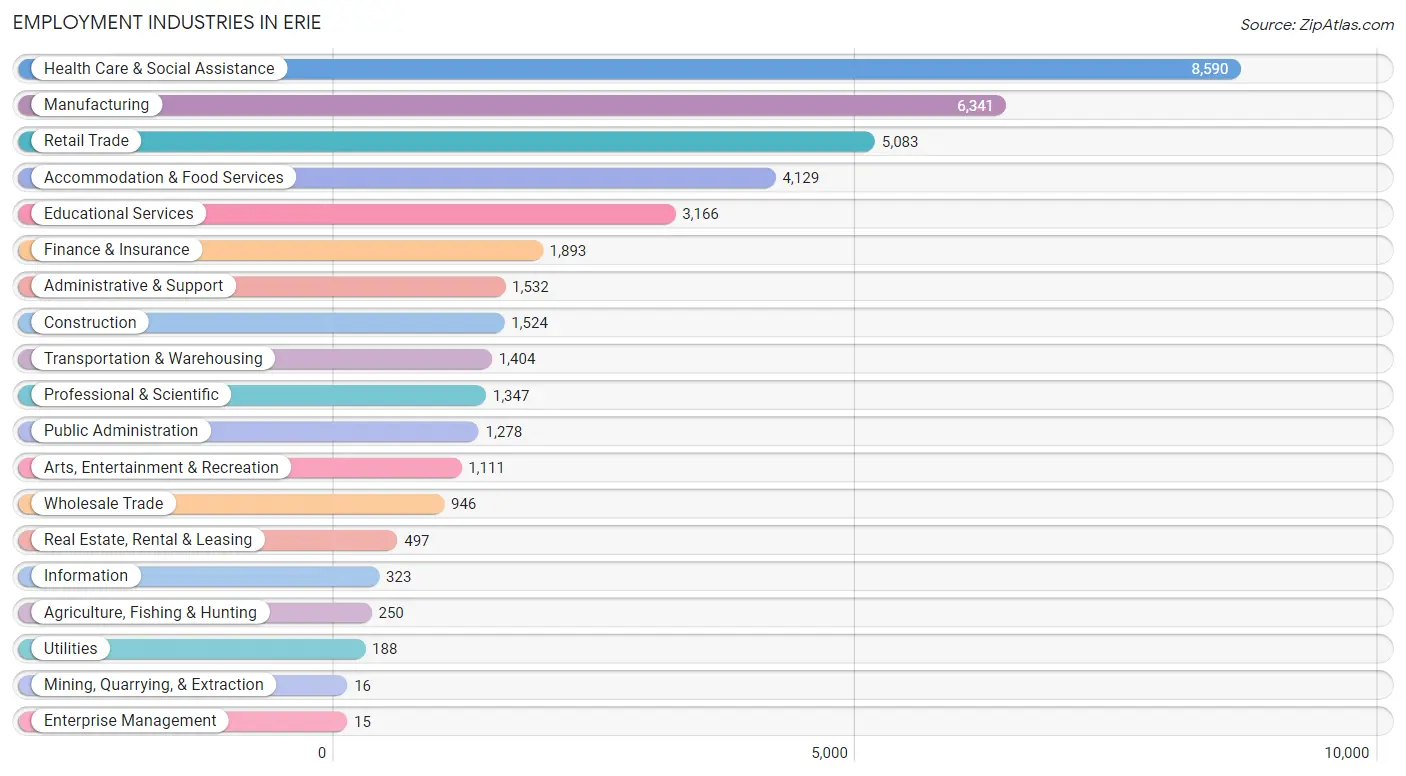
Employment Industries in Erie
The major employment industries in Erie include Health Care & Social Assistance (8,590 | 20.3%), Manufacturing (6,341 | 15.0%), Retail Trade (5,083 | 12.0%), Accommodation & Food Services (4,129 | 9.8%), and Educational Services (3,166 | 7.5%).
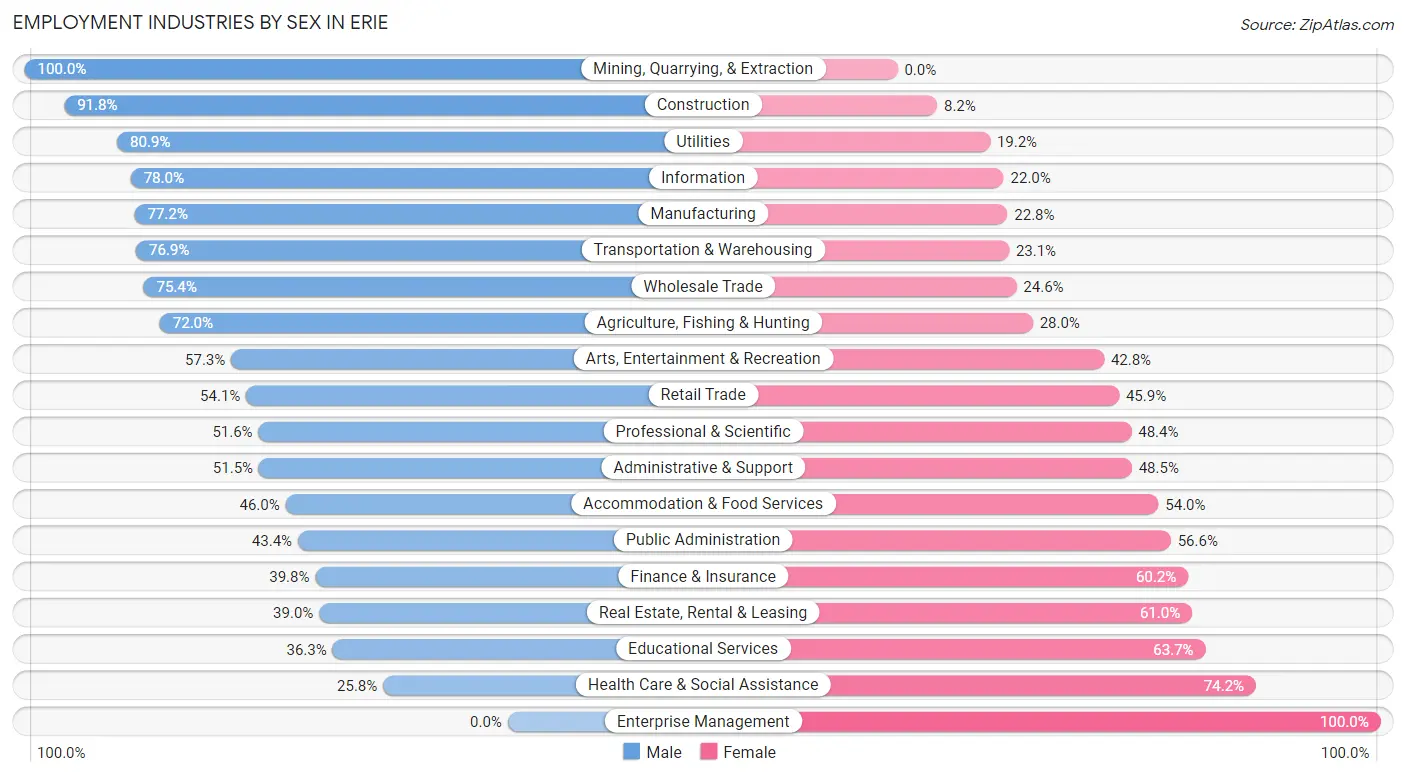
Employment Industries by Sex in Erie
The Erie industries that see more men than women are Mining, Quarrying, & Extraction (100.0%), Construction (91.8%), and Utilities (80.8%), whereas the industries that tend to have a higher number of women are Enterprise Management (100.0%), Health Care & Social Assistance (74.2%), and Educational Services (63.7%).
| Industry | Male | Female |
| Agriculture, Fishing & Hunting | 180 (72.0%) | 70 (28.0%) |
| Mining, Quarrying, & Extraction | 16 (100.0%) | 0 (0.0%) |
| Construction | 1,399 (91.8%) | 125 (8.2%) |
| Manufacturing | 4,898 (77.2%) | 1,443 (22.8%) |
| Wholesale Trade | 713 (75.4%) | 233 (24.6%) |
| Retail Trade | 2,752 (54.1%) | 2,331 (45.9%) |
| Transportation & Warehousing | 1,080 (76.9%) | 324 (23.1%) |
| Utilities | 152 (80.8%) | 36 (19.2%) |
| Information | 252 (78.0%) | 71 (22.0%) |
| Finance & Insurance | 754 (39.8%) | 1,139 (60.2%) |
| Real Estate, Rental & Leasing | 194 (39.0%) | 303 (61.0%) |
| Professional & Scientific | 695 (51.6%) | 652 (48.4%) |
| Enterprise Management | 0 (0.0%) | 15 (100.0%) |
| Administrative & Support | 789 (51.5%) | 743 (48.5%) |
| Educational Services | 1,148 (36.3%) | 2,018 (63.7%) |
| Health Care & Social Assistance | 2,216 (25.8%) | 6,374 (74.2%) |
| Arts, Entertainment & Recreation | 636 (57.3%) | 475 (42.7%) |
| Accommodation & Food Services | 1,899 (46.0%) | 2,230 (54.0%) |
| Public Administration | 555 (43.4%) | 723 (56.6%) |
| Total | 21,218 (50.2%) | 21,014 (49.8%) |
Education in Erie
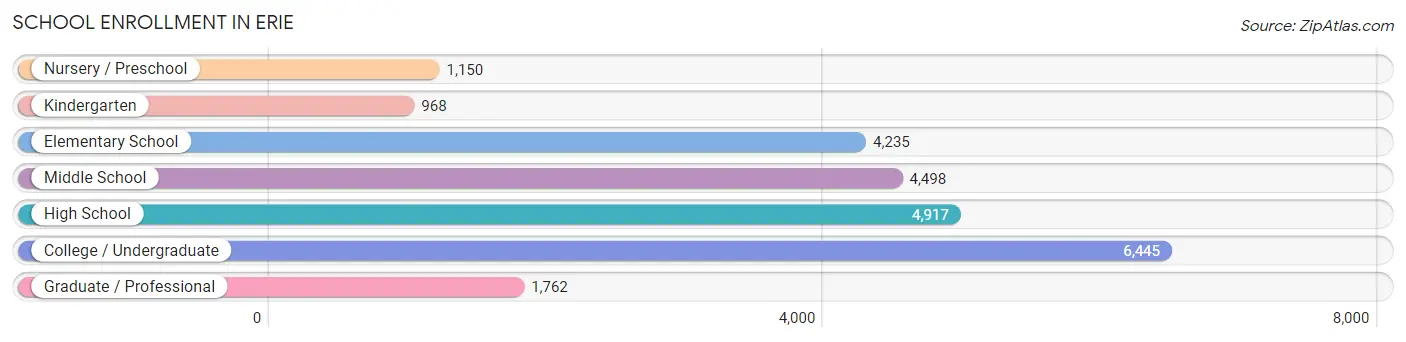
School Enrollment in Erie
The most common levels of schooling among the 23,975 students in Erie are college / undergraduate (6,445 | 26.9%), high school (4,917 | 20.5%), and middle school (4,498 | 18.8%).
| School Level | # Students | % Students |
| Nursery / Preschool | 1,150 | 4.8% |
| Kindergarten | 968 | 4.0% |
| Elementary School | 4,235 | 17.7% |
| Middle School | 4,498 | 18.8% |
| High School | 4,917 | 20.5% |
| College / Undergraduate | 6,445 | 26.9% |
| Graduate / Professional | 1,762 | 7.3% |
| Total | 23,975 | 100.0% |
School Enrollment by Age by Funding Source in Erie
Out of a total of 23,975 students who are enrolled in schools in Erie, 8,295 (34.6%) attend a private institution, while the remaining 15,680 (65.4%) are enrolled in public schools. The age group of 20 to 24 year olds has the highest likelihood of being enrolled in private schools, with 2,342 (64.9% in the age bracket) enrolled. Conversely, the age group of 5 to 9 year old has the lowest likelihood of being enrolled in a private school, with 4,154 (85.9% in the age bracket) attending a public institution.
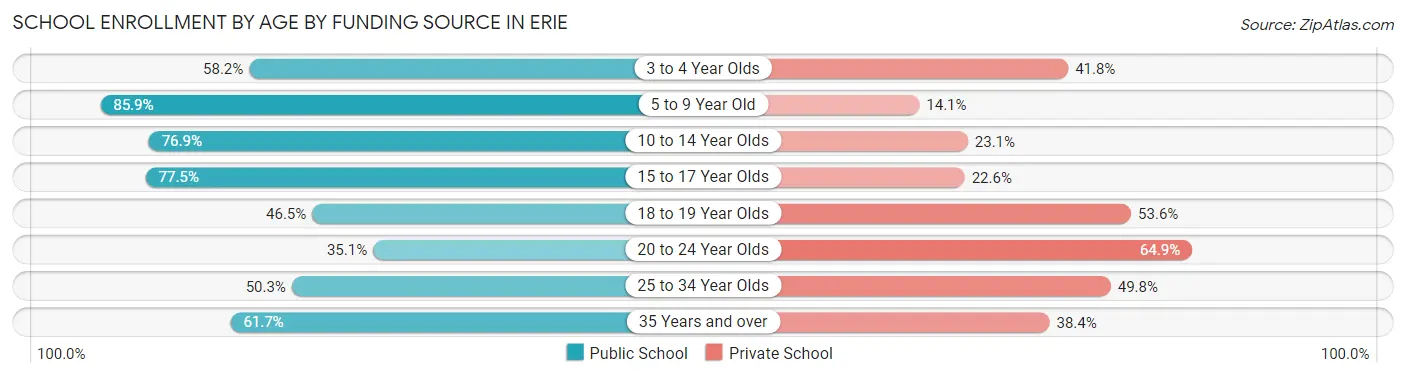
| Age Bracket | Public School | Private School |
| 3 to 4 Year Olds | 498 (58.2%) | 358 (41.8%) |
| 5 to 9 Year Old | 4,154 (85.9%) | 682 (14.1%) |
| 10 to 14 Year Olds | 4,326 (76.9%) | 1,302 (23.1%) |
| 15 to 17 Year Olds | 2,589 (77.4%) | 754 (22.6%) |
| 18 to 19 Year Olds | 1,374 (46.5%) | 1,584 (53.5%) |
| 20 to 24 Year Olds | 1,267 (35.1%) | 2,342 (64.9%) |
| 25 to 34 Year Olds | 922 (50.2%) | 913 (49.7%) |
| 35 Years and over | 561 (61.7%) | 349 (38.4%) |
| Total | 15,680 (65.4%) | 8,295 (34.6%) |
Educational Attainment by Field of Study in Erie
Business (2,952 | 19.5%), education (1,926 | 12.7%), science & technology (1,920 | 12.7%), arts & humanities (1,186 | 7.8%), and bio, nature & agricultural (942 | 6.2%) are the most common fields of study among 15,150 individuals in Erie who have obtained a bachelor's degree or higher.
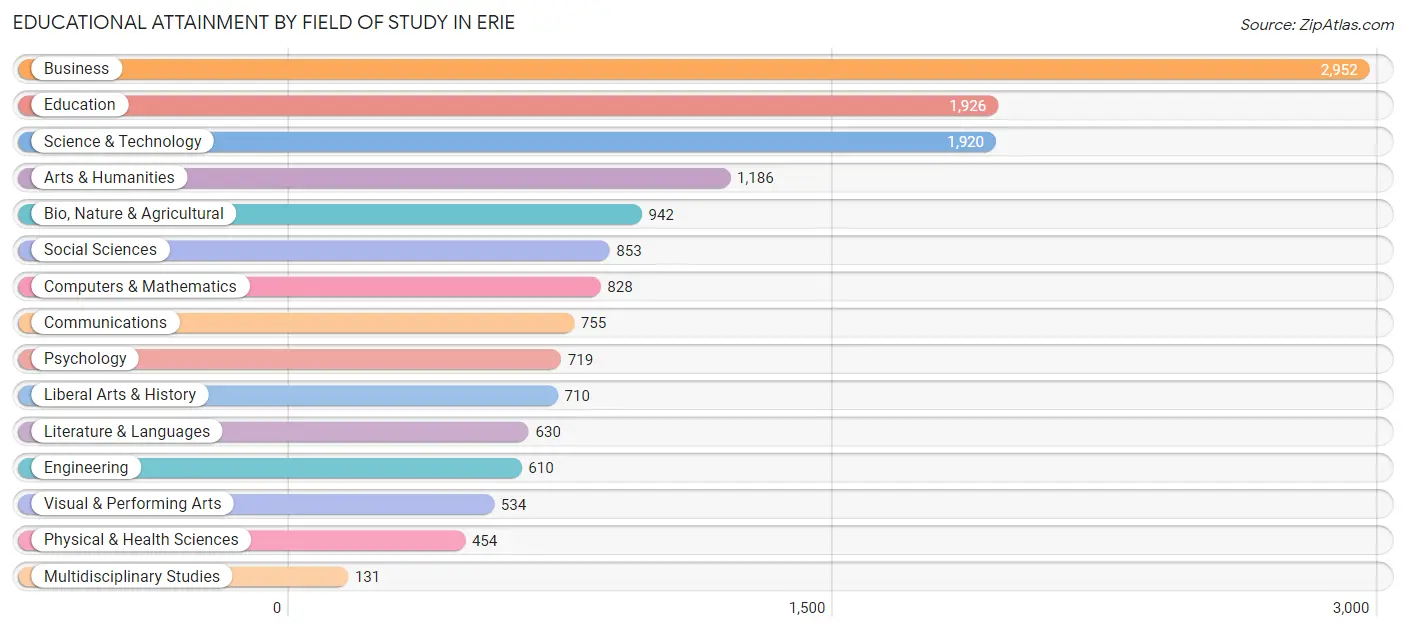
| Field of Study | # Graduates | % Graduates |
| Computers & Mathematics | 828 | 5.5% |
| Bio, Nature & Agricultural | 942 | 6.2% |
| Physical & Health Sciences | 454 | 3.0% |
| Psychology | 719 | 4.8% |
| Social Sciences | 853 | 5.6% |
| Engineering | 610 | 4.0% |
| Multidisciplinary Studies | 131 | 0.9% |
| Science & Technology | 1,920 | 12.7% |
| Business | 2,952 | 19.5% |
| Education | 1,926 | 12.7% |
| Literature & Languages | 630 | 4.2% |
| Liberal Arts & History | 710 | 4.7% |
| Visual & Performing Arts | 534 | 3.5% |
| Communications | 755 | 5.0% |
| Arts & Humanities | 1,186 | 7.8% |
| Total | 15,150 | 100.0% |
Transportation & Commute in Erie
Vehicle Availability by Sex in Erie
The most prevalent vehicle ownership categories in Erie are males with 2 vehicles (8,768, accounting for 42.3%) and females with 2 vehicles (8,320, making up 44.3%).
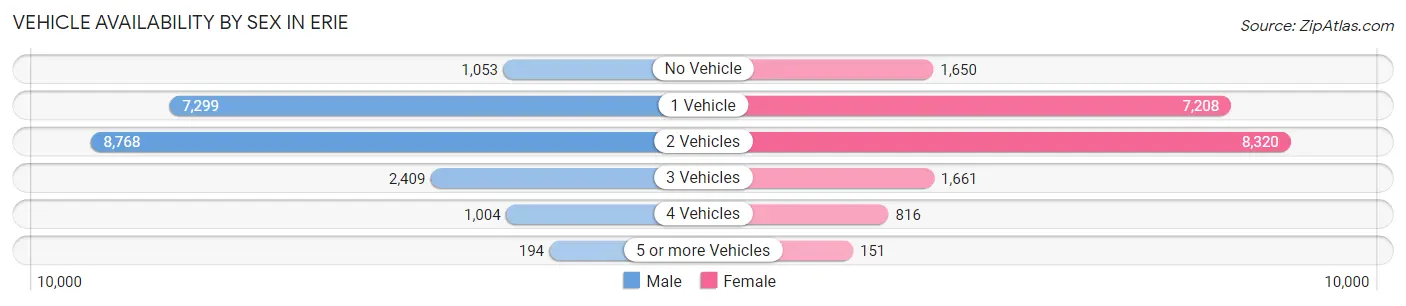
| Vehicles Available | Male | Female |
| No Vehicle | 1,053 (5.1%) | 1,650 (8.3%) |
| 1 Vehicle | 7,299 (35.2%) | 7,208 (36.4%) |
| 2 Vehicles | 8,768 (42.3%) | 8,320 (42.0%) |
| 3 Vehicles | 2,409 (11.6%) | 1,661 (8.4%) |
| 4 Vehicles | 1,004 (4.8%) | 816 (4.1%) |
| 5 or more Vehicles | 194 (0.9%) | 151 (0.8%) |
| Total | 20,727 (100.0%) | 19,806 (100.0%) |
Commute Time in Erie
The most frequently occuring commute durations in Erie are 10 to 14 minutes (10,345 commuters, 26.4%), 15 to 19 minutes (8,544 commuters, 21.8%), and 5 to 9 minutes (6,141 commuters, 15.7%).
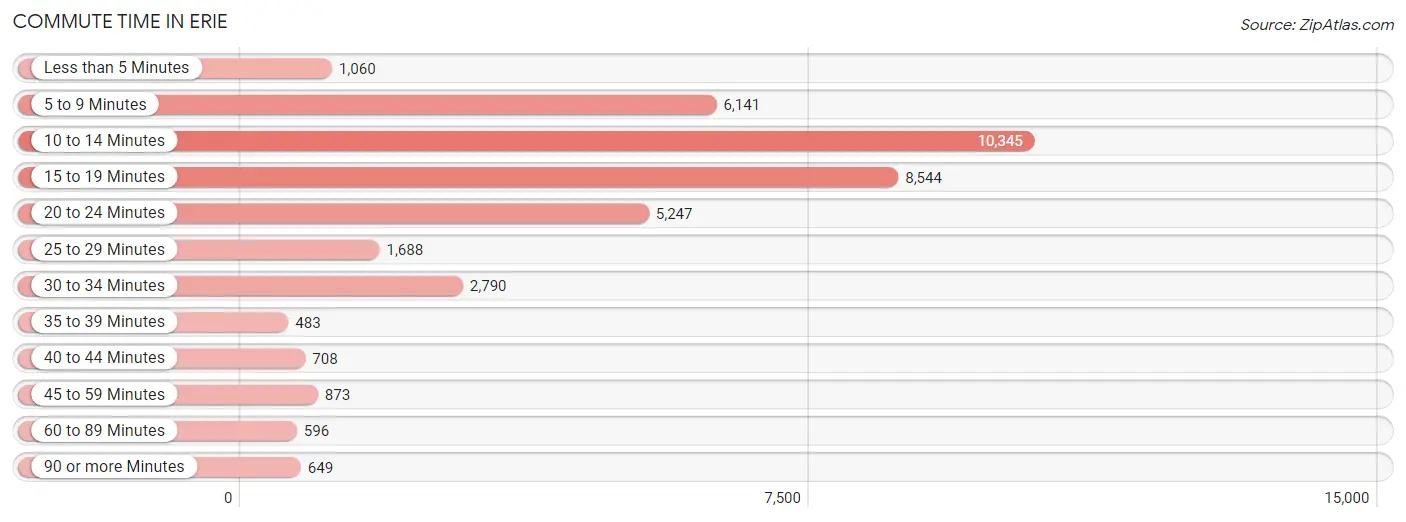
| Commute Time | # Commuters | % Commuters |
| Less than 5 Minutes | 1,060 | 2.7% |
| 5 to 9 Minutes | 6,141 | 15.7% |
| 10 to 14 Minutes | 10,345 | 26.4% |
| 15 to 19 Minutes | 8,544 | 21.8% |
| 20 to 24 Minutes | 5,247 | 13.4% |
| 25 to 29 Minutes | 1,688 | 4.3% |
| 30 to 34 Minutes | 2,790 | 7.1% |
| 35 to 39 Minutes | 483 | 1.2% |
| 40 to 44 Minutes | 708 | 1.8% |
| 45 to 59 Minutes | 873 | 2.2% |
| 60 to 89 Minutes | 596 | 1.5% |
| 90 or more Minutes | 649 | 1.7% |
Commute Time by Sex in Erie
The most common commute times in Erie are 10 to 14 minutes (4,880 commuters, 24.4%) for males and 10 to 14 minutes (5,465 commuters, 28.5%) for females.
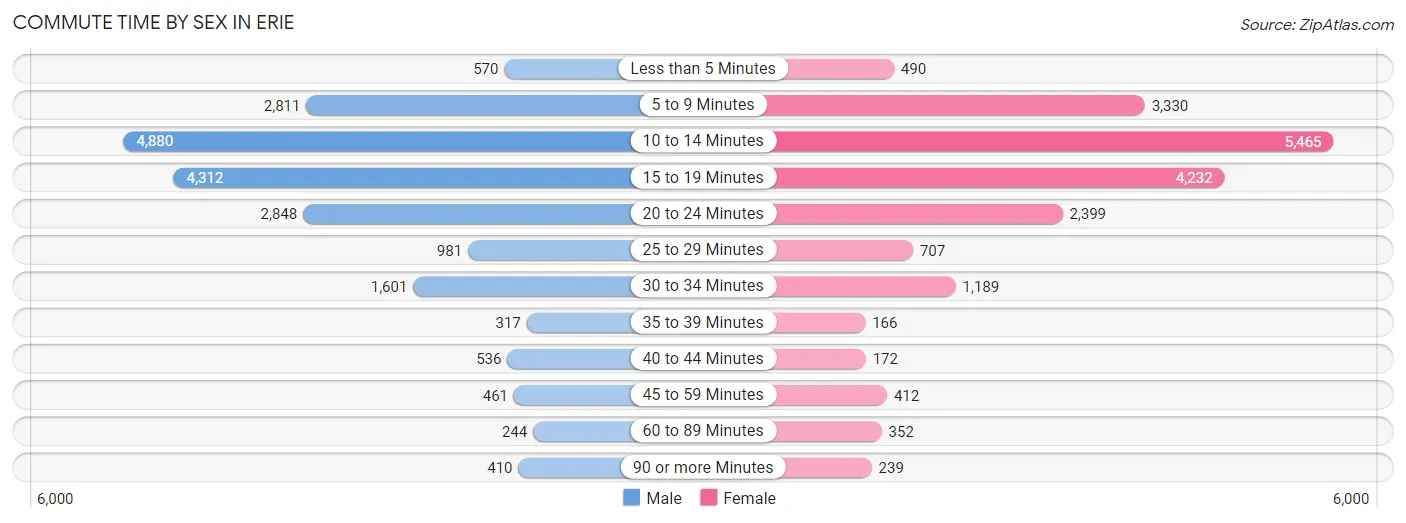
| Commute Time | Male | Female |
| Less than 5 Minutes | 570 (2.9%) | 490 (2.6%) |
| 5 to 9 Minutes | 2,811 (14.1%) | 3,330 (17.4%) |
| 10 to 14 Minutes | 4,880 (24.4%) | 5,465 (28.5%) |
| 15 to 19 Minutes | 4,312 (21.6%) | 4,232 (22.1%) |
| 20 to 24 Minutes | 2,848 (14.3%) | 2,399 (12.5%) |
| 25 to 29 Minutes | 981 (4.9%) | 707 (3.7%) |
| 30 to 34 Minutes | 1,601 (8.0%) | 1,189 (6.2%) |
| 35 to 39 Minutes | 317 (1.6%) | 166 (0.9%) |
| 40 to 44 Minutes | 536 (2.7%) | 172 (0.9%) |
| 45 to 59 Minutes | 461 (2.3%) | 412 (2.1%) |
| 60 to 89 Minutes | 244 (1.2%) | 352 (1.8%) |
| 90 or more Minutes | 410 (2.1%) | 239 (1.3%) |
Time of Departure to Work by Sex in Erie
The most frequent times of departure to work in Erie are 7:00 AM to 7:29 AM (2,487, 12.4%) for males and 7:30 AM to 7:59 AM (2,982, 15.6%) for females.
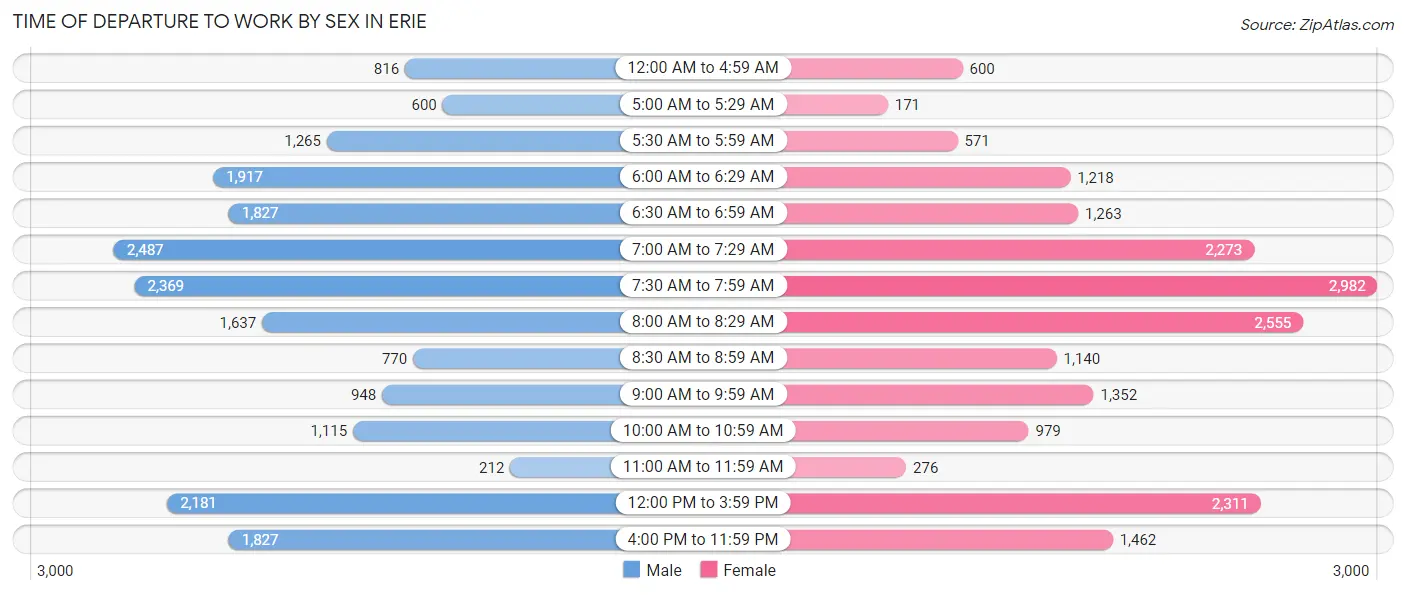
| Time of Departure | Male | Female |
| 12:00 AM to 4:59 AM | 816 (4.1%) | 600 (3.1%) |
| 5:00 AM to 5:29 AM | 600 (3.0%) | 171 (0.9%) |
| 5:30 AM to 5:59 AM | 1,265 (6.3%) | 571 (3.0%) |
| 6:00 AM to 6:29 AM | 1,917 (9.6%) | 1,218 (6.4%) |
| 6:30 AM to 6:59 AM | 1,827 (9.1%) | 1,263 (6.6%) |
| 7:00 AM to 7:29 AM | 2,487 (12.4%) | 2,273 (11.9%) |
| 7:30 AM to 7:59 AM | 2,369 (11.9%) | 2,982 (15.6%) |
| 8:00 AM to 8:29 AM | 1,637 (8.2%) | 2,555 (13.3%) |
| 8:30 AM to 8:59 AM | 770 (3.9%) | 1,140 (5.9%) |
| 9:00 AM to 9:59 AM | 948 (4.8%) | 1,352 (7.1%) |
| 10:00 AM to 10:59 AM | 1,115 (5.6%) | 979 (5.1%) |
| 11:00 AM to 11:59 AM | 212 (1.1%) | 276 (1.4%) |
| 12:00 PM to 3:59 PM | 2,181 (10.9%) | 2,311 (12.1%) |
| 4:00 PM to 11:59 PM | 1,827 (9.1%) | 1,462 (7.6%) |
| Total | 19,971 (100.0%) | 19,153 (100.0%) |
Housing Occupancy in Erie
Occupancy by Ownership in Erie
Of the total 39,180 dwellings in Erie, owner-occupied units account for 20,621 (52.6%), while renter-occupied units make up 18,559 (47.4%).
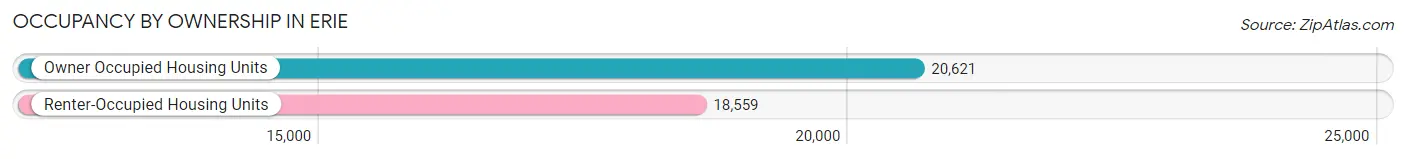
| Occupancy | # Housing Units | % Housing Units |
| Owner Occupied Housing Units | 20,621 | 52.6% |
| Renter-Occupied Housing Units | 18,559 | 47.4% |
| Total Occupied Housing Units | 39,180 | 100.0% |
Occupancy by Household Size in Erie
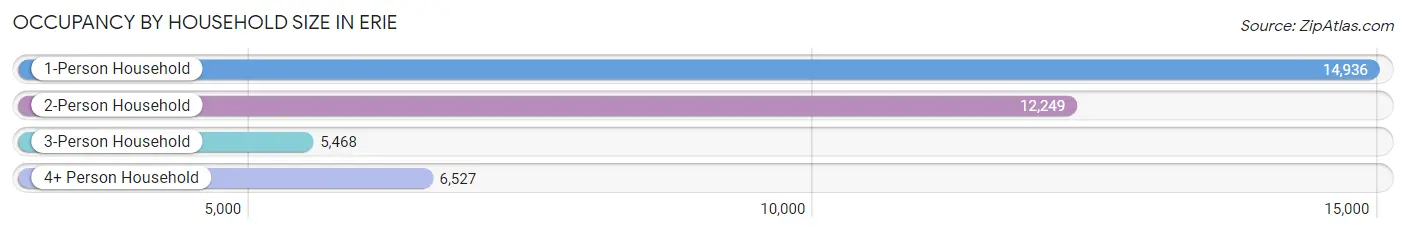
| Household Size | # Housing Units | % Housing Units |
| 1-Person Household | 14,936 | 38.1% |
| 2-Person Household | 12,249 | 31.3% |
| 3-Person Household | 5,468 | 14.0% |
| 4+ Person Household | 6,527 | 16.7% |
| Total Housing Units | 39,180 | 100.0% |
Occupancy by Ownership by Household Size in Erie
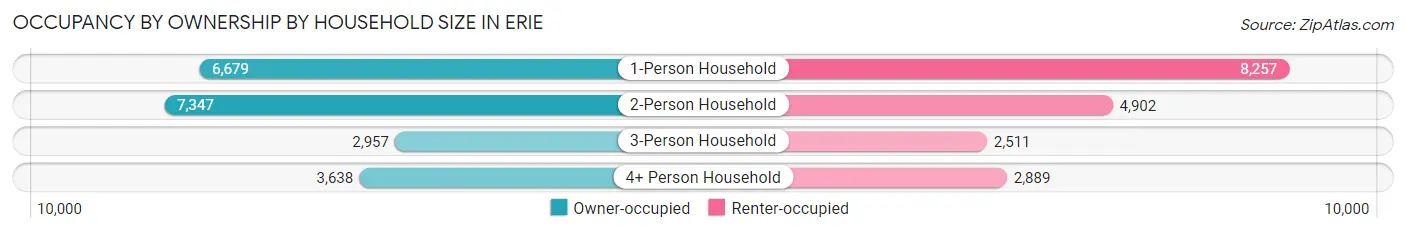
| Household Size | Owner-occupied | Renter-occupied |
| 1-Person Household | 6,679 (44.7%) | 8,257 (55.3%) |
| 2-Person Household | 7,347 (60.0%) | 4,902 (40.0%) |
| 3-Person Household | 2,957 (54.1%) | 2,511 (45.9%) |
| 4+ Person Household | 3,638 (55.7%) | 2,889 (44.3%) |
| Total Housing Units | 20,621 (52.6%) | 18,559 (47.4%) |
Occupancy by Educational Attainment in Erie
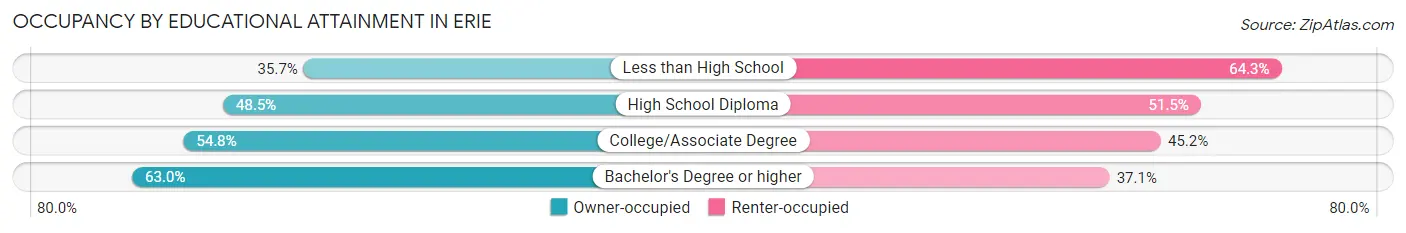
| Household Size | Owner-occupied | Renter-occupied |
| Less than High School | 1,354 (35.7%) | 2,435 (64.3%) |
| High School Diploma | 6,860 (48.5%) | 7,273 (51.5%) |
| College/Associate Degree | 6,568 (54.8%) | 5,415 (45.2%) |
| Bachelor's Degree or higher | 5,839 (62.9%) | 3,436 (37.0%) |
Occupancy by Age of Householder in Erie
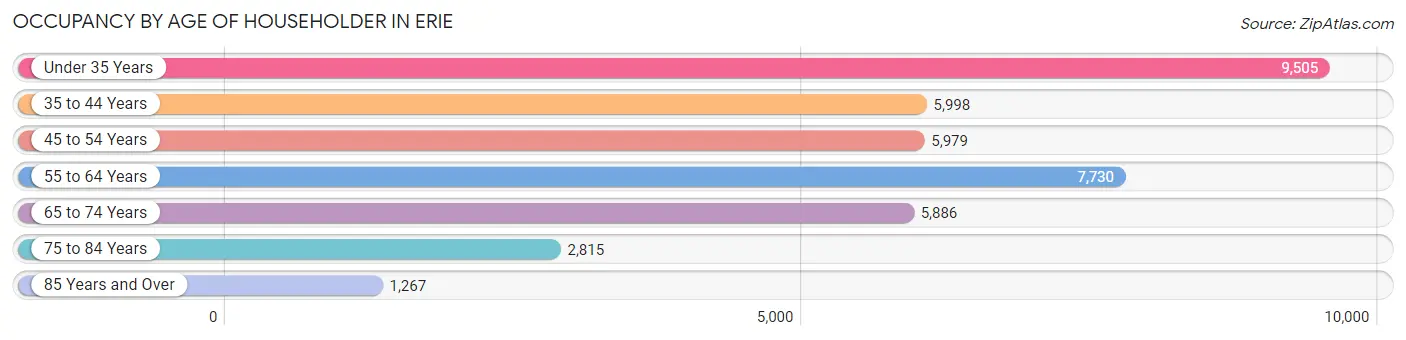
| Age Bracket | # Households | % Households |
| Under 35 Years | 9,505 | 24.3% |
| 35 to 44 Years | 5,998 | 15.3% |
| 45 to 54 Years | 5,979 | 15.3% |
| 55 to 64 Years | 7,730 | 19.7% |
| 65 to 74 Years | 5,886 | 15.0% |
| 75 to 84 Years | 2,815 | 7.2% |
| 85 Years and Over | 1,267 | 3.2% |
| Total | 39,180 | 100.0% |
Housing Finances in Erie
Median Income by Occupancy in Erie
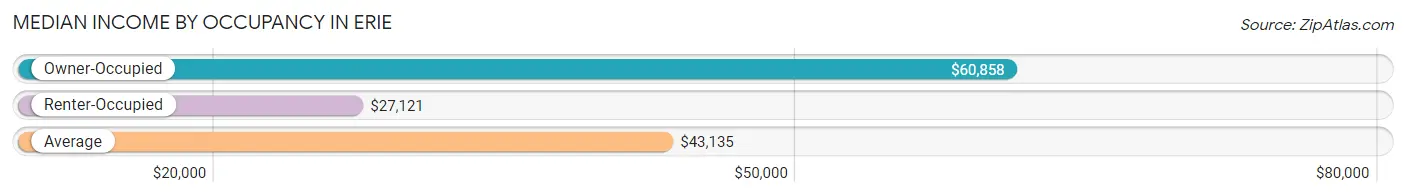
| Occupancy Type | # Households | Median Income |
| Owner-Occupied | 20,621 (52.6%) | $60,858 |
| Renter-Occupied | 18,559 (47.4%) | $27,121 |
| Average | 39,180 (100.0%) | $43,135 |
Occupancy by Householder Income Bracket in Erie
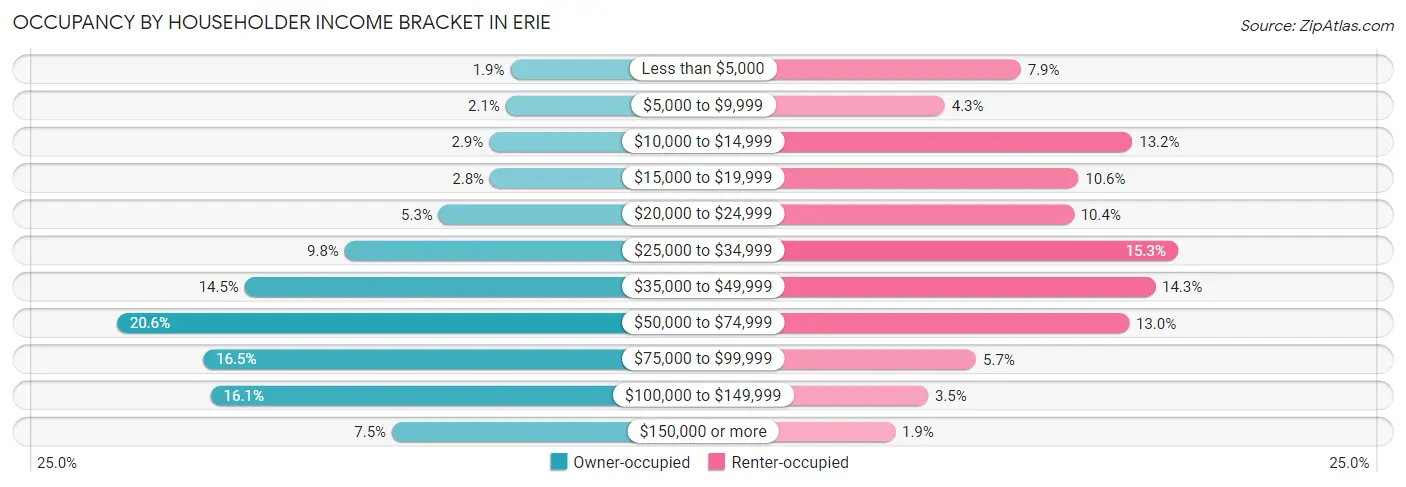
| Income Bracket | Owner-occupied | Renter-occupied |
| Less than $5,000 | 386 (1.9%) | 1,461 (7.9%) |
| $5,000 to $9,999 | 431 (2.1%) | 789 (4.3%) |
| $10,000 to $14,999 | 594 (2.9%) | 2,446 (13.2%) |
| $15,000 to $19,999 | 586 (2.8%) | 1,970 (10.6%) |
| $20,000 to $24,999 | 1,088 (5.3%) | 1,928 (10.4%) |
| $25,000 to $34,999 | 2,012 (9.8%) | 2,847 (15.3%) |
| $35,000 to $49,999 | 2,994 (14.5%) | 2,646 (14.3%) |
| $50,000 to $74,999 | 4,249 (20.6%) | 2,416 (13.0%) |
| $75,000 to $99,999 | 3,403 (16.5%) | 1,066 (5.7%) |
| $100,000 to $149,999 | 3,329 (16.1%) | 641 (3.5%) |
| $150,000 or more | 1,549 (7.5%) | 349 (1.9%) |
| Total | 20,621 (100.0%) | 18,559 (100.0%) |
Monthly Housing Cost Tiers in Erie
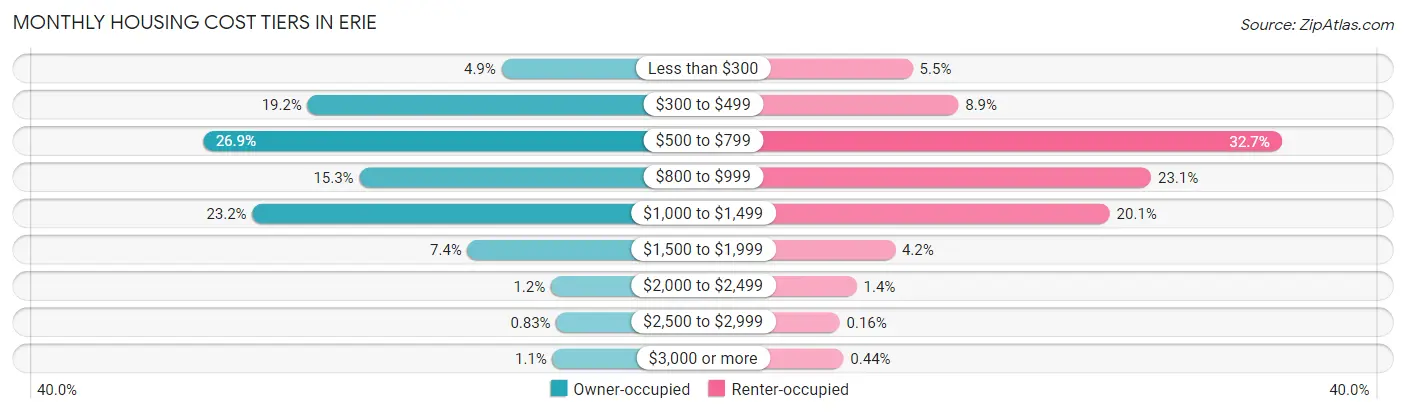
| Monthly Cost | Owner-occupied | Renter-occupied |
| Less than $300 | 1,004 (4.9%) | 1,029 (5.5%) |
| $300 to $499 | 3,949 (19.2%) | 1,652 (8.9%) |
| $500 to $799 | 5,543 (26.9%) | 6,070 (32.7%) |
| $800 to $999 | 3,164 (15.3%) | 4,288 (23.1%) |
| $1,000 to $1,499 | 4,788 (23.2%) | 3,721 (20.1%) |
| $1,500 to $1,999 | 1,519 (7.4%) | 787 (4.2%) |
| $2,000 to $2,499 | 253 (1.2%) | 262 (1.4%) |
| $2,500 to $2,999 | 172 (0.8%) | 30 (0.2%) |
| $3,000 or more | 229 (1.1%) | 82 (0.4%) |
| Total | 20,621 (100.0%) | 18,559 (100.0%) |
Physical Housing Characteristics in Erie
Housing Structures in Erie
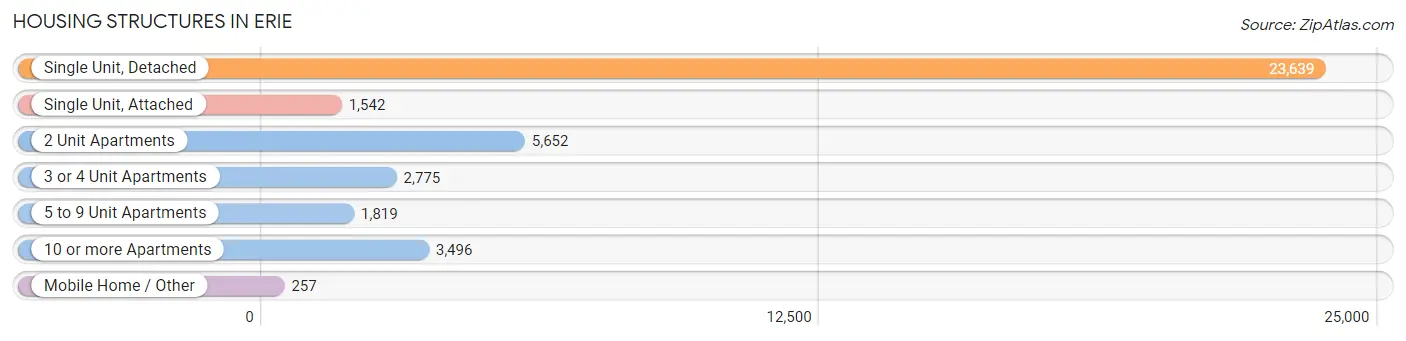
| Structure Type | # Housing Units | % Housing Units |
| Single Unit, Detached | 23,639 | 60.3% |
| Single Unit, Attached | 1,542 | 3.9% |
| 2 Unit Apartments | 5,652 | 14.4% |
| 3 or 4 Unit Apartments | 2,775 | 7.1% |
| 5 to 9 Unit Apartments | 1,819 | 4.6% |
| 10 or more Apartments | 3,496 | 8.9% |
| Mobile Home / Other | 257 | 0.7% |
| Total | 39,180 | 100.0% |
Housing Structures by Occupancy in Erie
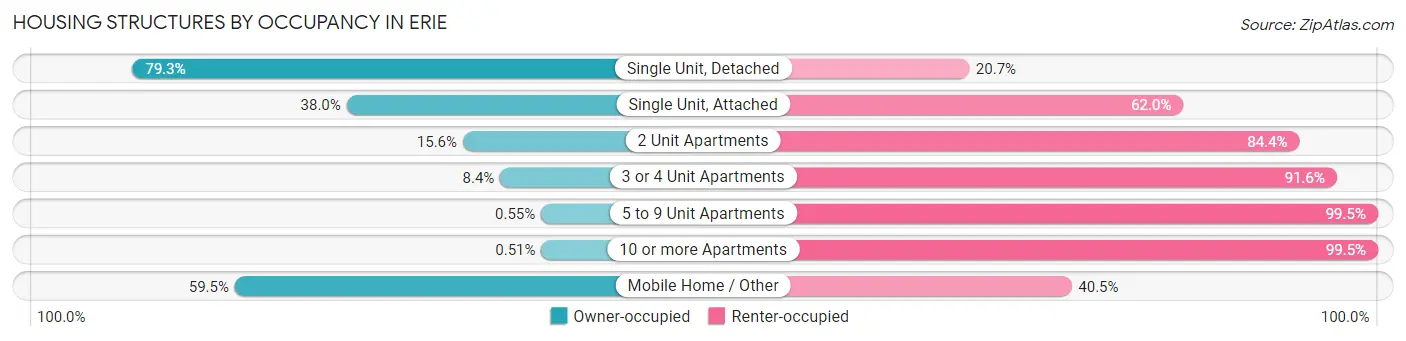
| Structure Type | Owner-occupied | Renter-occupied |
| Single Unit, Detached | 18,737 (79.3%) | 4,902 (20.7%) |
| Single Unit, Attached | 586 (38.0%) | 956 (62.0%) |
| 2 Unit Apartments | 883 (15.6%) | 4,769 (84.4%) |
| 3 or 4 Unit Apartments | 234 (8.4%) | 2,541 (91.6%) |
| 5 to 9 Unit Apartments | 10 (0.5%) | 1,809 (99.5%) |
| 10 or more Apartments | 18 (0.5%) | 3,478 (99.5%) |
| Mobile Home / Other | 153 (59.5%) | 104 (40.5%) |
| Total | 20,621 (52.6%) | 18,559 (47.4%) |
Housing Structures by Number of Rooms in Erie
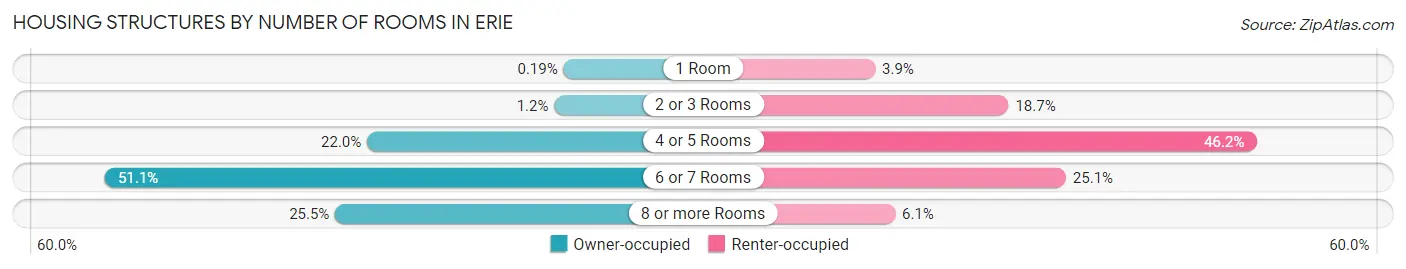
| Number of Rooms | Owner-occupied | Renter-occupied |
| 1 Room | 39 (0.2%) | 723 (3.9%) |
| 2 or 3 Rooms | 249 (1.2%) | 3,472 (18.7%) |
| 4 or 5 Rooms | 4,535 (22.0%) | 8,574 (46.2%) |
| 6 or 7 Rooms | 10,533 (51.1%) | 4,655 (25.1%) |
| 8 or more Rooms | 5,265 (25.5%) | 1,135 (6.1%) |
| Total | 20,621 (100.0%) | 18,559 (100.0%) |
Housing Structure by Heating Type in Erie
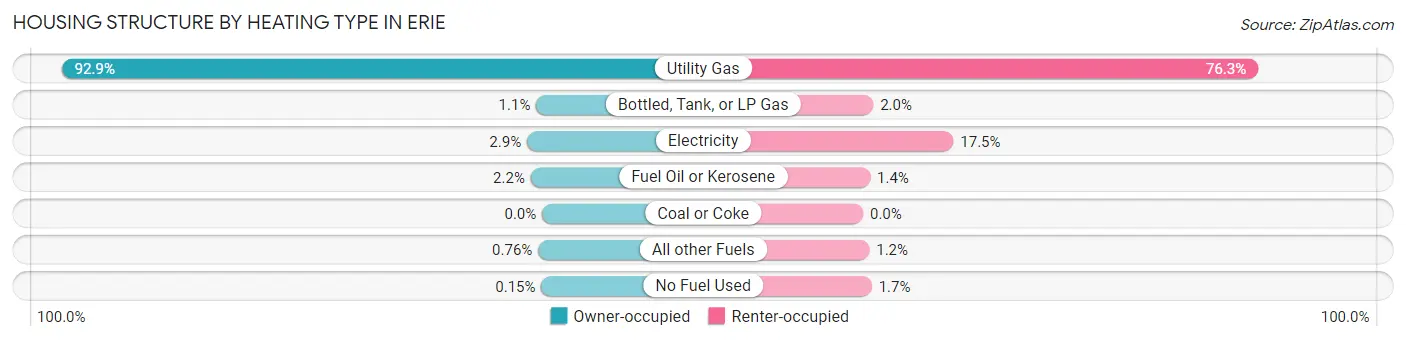
| Heating Type | Owner-occupied | Renter-occupied |
| Utility Gas | 19,146 (92.8%) | 14,165 (76.3%) |
| Bottled, Tank, or LP Gas | 232 (1.1%) | 366 (2.0%) |
| Electricity | 603 (2.9%) | 3,239 (17.4%) |
| Fuel Oil or Kerosene | 453 (2.2%) | 254 (1.4%) |
| Coal or Coke | 0 (0.0%) | 0 (0.0%) |
| All other Fuels | 157 (0.8%) | 224 (1.2%) |
| No Fuel Used | 30 (0.2%) | 311 (1.7%) |
| Total | 20,621 (100.0%) | 18,559 (100.0%) |
Household Vehicle Usage in Erie
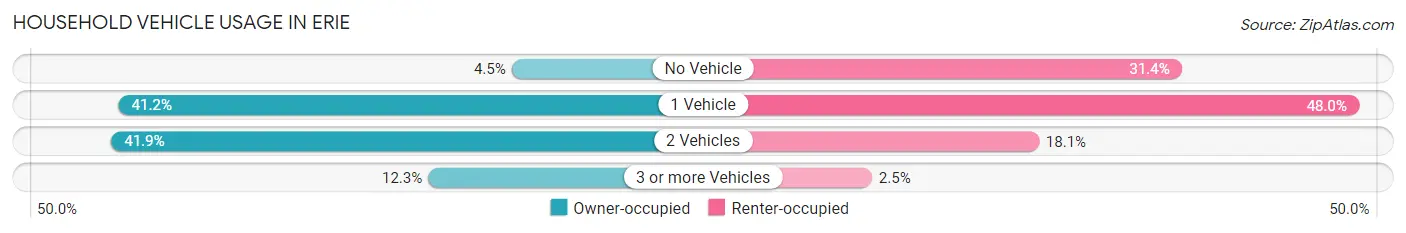
| Vehicles per Household | Owner-occupied | Renter-occupied |
| No Vehicle | 936 (4.5%) | 5,831 (31.4%) |
| 1 Vehicle | 8,500 (41.2%) | 8,900 (48.0%) |
| 2 Vehicles | 8,641 (41.9%) | 3,361 (18.1%) |
| 3 or more Vehicles | 2,544 (12.3%) | 467 (2.5%) |
| Total | 20,621 (100.0%) | 18,559 (100.0%) |
Real Estate & Mortgages in Erie
Real Estate and Mortgage Overview in Erie
| Characteristic | Without Mortgage | With Mortgage |
| Housing Units | 9,497 | 11,124 |
| Median Property Value | $95,500 | $107,000 |
| Median Household Income | $51,706 | $1,106 |
| Monthly Housing Costs | $497 | $216 |
| Real Estate Taxes | $2,324 | $304 |
Property Value by Mortgage Status in Erie
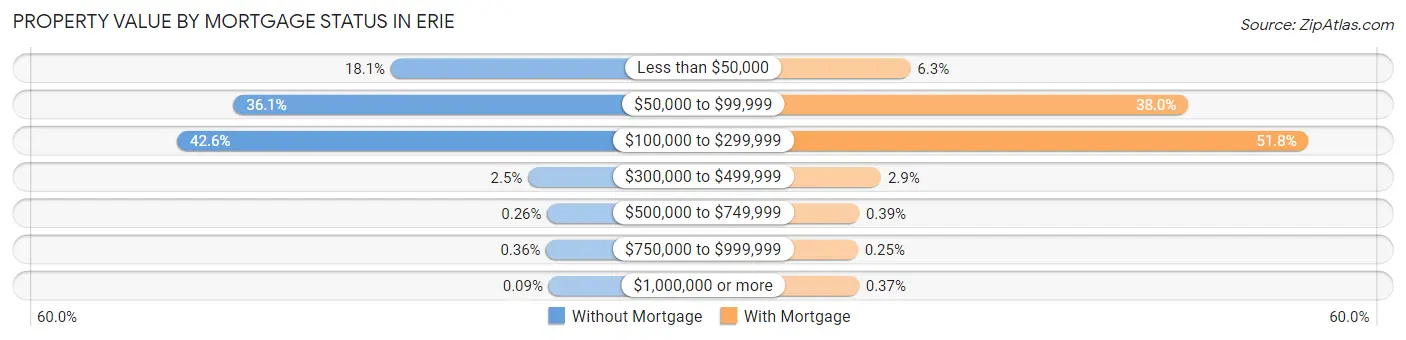
| Property Value | Without Mortgage | With Mortgage |
| Less than $50,000 | 1,722 (18.1%) | 698 (6.3%) |
| $50,000 to $99,999 | 3,432 (36.1%) | 4,231 (38.0%) |
| $100,000 to $299,999 | 4,042 (42.6%) | 5,759 (51.8%) |
| $300,000 to $499,999 | 233 (2.5%) | 324 (2.9%) |
| $500,000 to $749,999 | 25 (0.3%) | 43 (0.4%) |
| $750,000 to $999,999 | 34 (0.4%) | 28 (0.3%) |
| $1,000,000 or more | 9 (0.1%) | 41 (0.4%) |
| Total | 9,497 (100.0%) | 11,124 (100.0%) |
Household Income by Mortgage Status in Erie
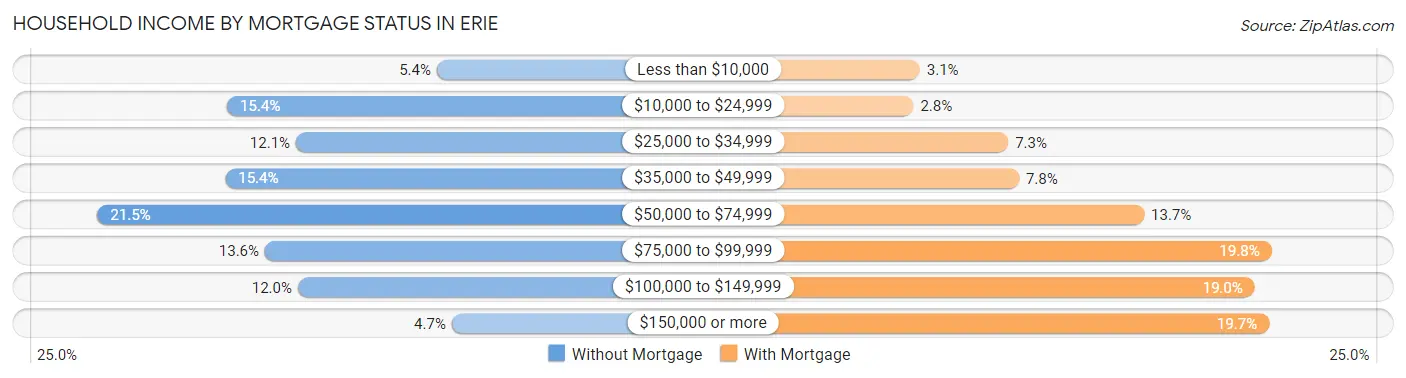
| Household Income | Without Mortgage | With Mortgage |
| Less than $10,000 | 510 (5.4%) | 340 (3.1%) |
| $10,000 to $24,999 | 1,459 (15.4%) | 307 (2.8%) |
| $25,000 to $34,999 | 1,147 (12.1%) | 809 (7.3%) |
| $35,000 to $49,999 | 1,466 (15.4%) | 865 (7.8%) |
| $50,000 to $74,999 | 2,045 (21.5%) | 1,528 (13.7%) |
| $75,000 to $99,999 | 1,288 (13.6%) | 2,204 (19.8%) |
| $100,000 to $149,999 | 1,139 (12.0%) | 2,115 (19.0%) |
| $150,000 or more | 443 (4.7%) | 2,190 (19.7%) |
| Total | 9,497 (100.0%) | 11,124 (100.0%) |
Property Value to Household Income Ratio in Erie
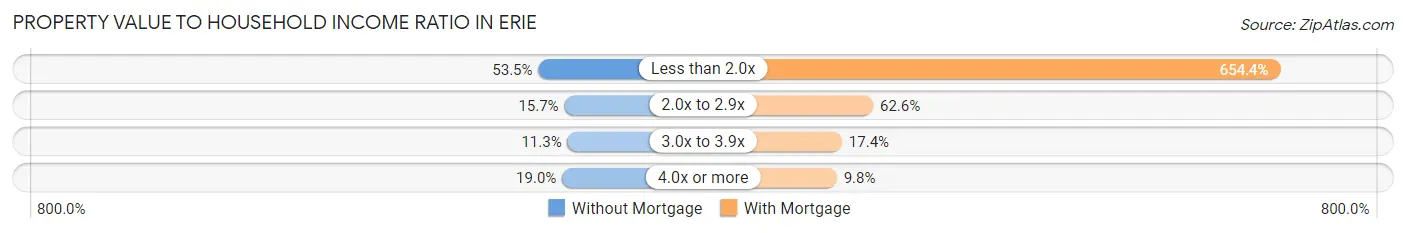
| Value-to-Income Ratio | Without Mortgage | With Mortgage |
| Less than 2.0x | 5,085 (53.5%) | 72,792 (654.4%) |
| 2.0x to 2.9x | 1,487 (15.7%) | 6,966 (62.6%) |
| 3.0x to 3.9x | 1,068 (11.3%) | 1,937 (17.4%) |
| 4.0x or more | 1,802 (19.0%) | 1,095 (9.8%) |
| Total | 9,497 (100.0%) | 11,124 (100.0%) |
Real Estate Taxes by Mortgage Status in Erie
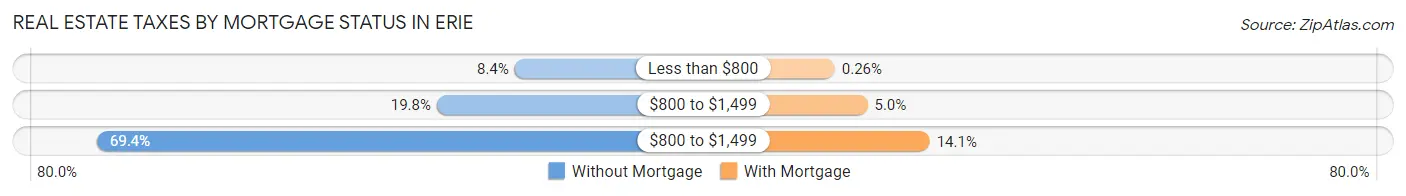
| Property Taxes | Without Mortgage | With Mortgage |
| Less than $800 | 798 (8.4%) | 29 (0.3%) |
| $800 to $1,499 | 1,878 (19.8%) | 561 (5.0%) |
| $800 to $1,499 | 6,595 (69.4%) | 1,572 (14.1%) |
| Total | 9,497 (100.0%) | 11,124 (100.0%) |
Health & Disability in Erie
Health Insurance Coverage by Age in Erie
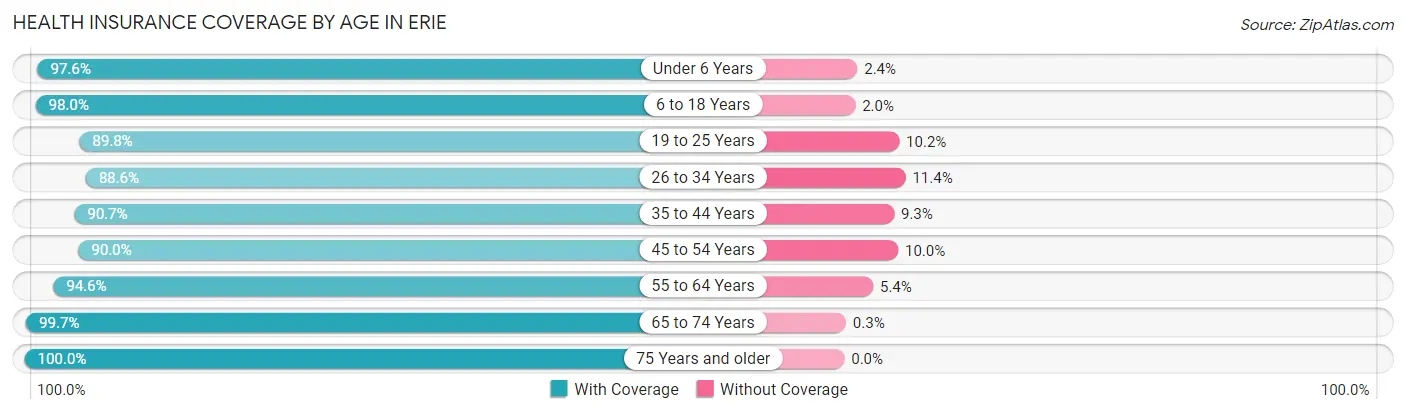
| Age Bracket | With Coverage | Without Coverage |
| Under 6 Years | 6,243 (97.6%) | 155 (2.4%) |
| 6 to 18 Years | 15,135 (98.0%) | 315 (2.0%) |
| 19 to 25 Years | 10,702 (89.8%) | 1,220 (10.2%) |
| 26 to 34 Years | 11,519 (88.6%) | 1,483 (11.4%) |
| 35 to 44 Years | 8,973 (90.7%) | 918 (9.3%) |
| 45 to 54 Years | 9,178 (90.0%) | 1,023 (10.0%) |
| 55 to 64 Years | 11,067 (94.6%) | 627 (5.4%) |
| 65 to 74 Years | 8,400 (99.7%) | 25 (0.3%) |
| 75 Years and older | 5,590 (100.0%) | 0 (0.0%) |
| Total | 86,807 (93.8%) | 5,766 (6.2%) |
Health Insurance Coverage by Citizenship Status in Erie
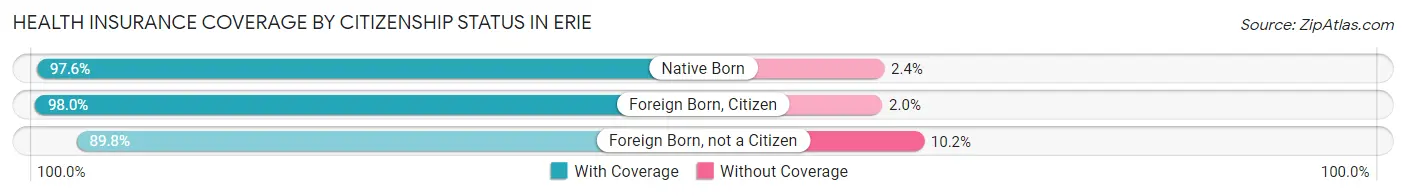
| Citizenship Status | With Coverage | Without Coverage |
| Native Born | 6,243 (97.6%) | 155 (2.4%) |
| Foreign Born, Citizen | 15,135 (98.0%) | 315 (2.0%) |
| Foreign Born, not a Citizen | 10,702 (89.8%) | 1,220 (10.2%) |
Health Insurance Coverage by Household Income in Erie
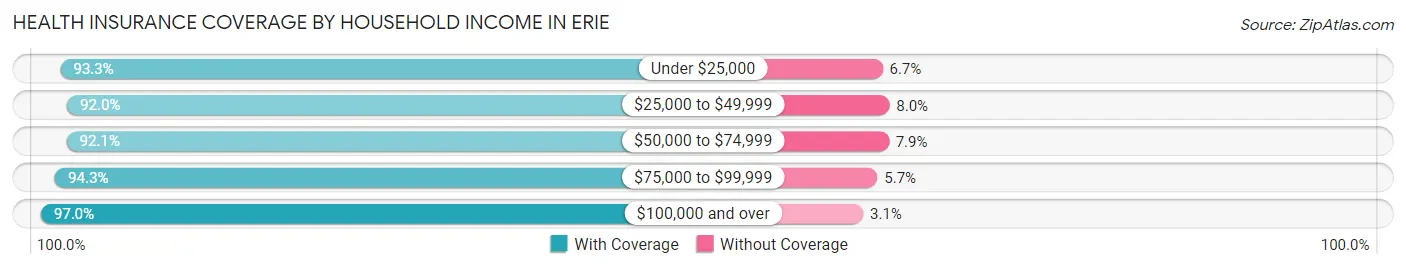
| Household Income | With Coverage | Without Coverage |
| Under $25,000 | 18,524 (93.3%) | 1,330 (6.7%) |
| $25,000 to $49,999 | 19,787 (92.0%) | 1,717 (8.0%) |
| $50,000 to $74,999 | 15,718 (92.1%) | 1,340 (7.9%) |
| $75,000 to $99,999 | 12,115 (94.3%) | 736 (5.7%) |
| $100,000 and over | 17,223 (97.0%) | 541 (3.0%) |
Public vs Private Health Insurance Coverage by Age in Erie
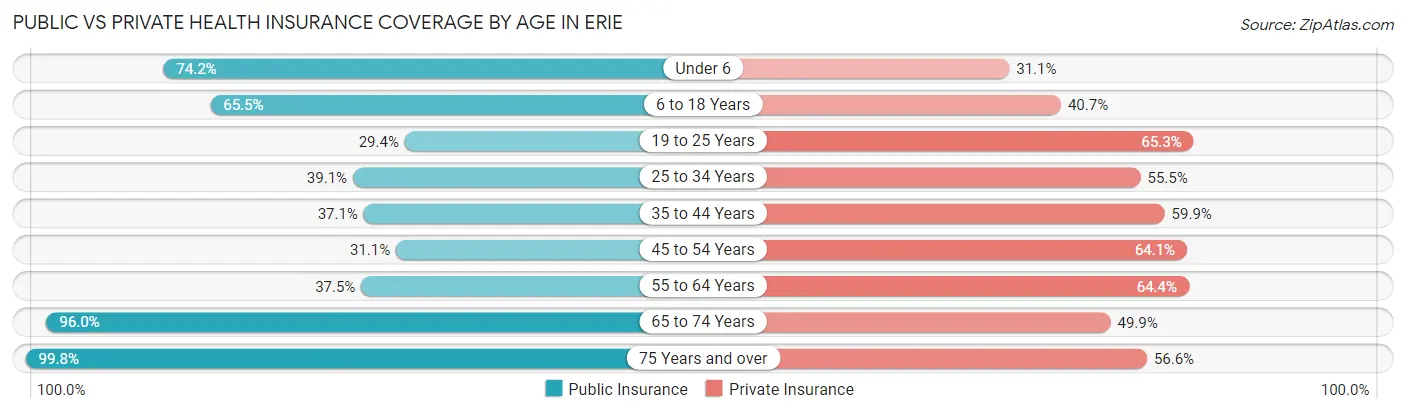
| Age Bracket | Public Insurance | Private Insurance |
| Under 6 | 4,749 (74.2%) | 1,989 (31.1%) |
| 6 to 18 Years | 10,123 (65.5%) | 6,286 (40.7%) |
| 19 to 25 Years | 3,510 (29.4%) | 7,783 (65.3%) |
| 25 to 34 Years | 5,078 (39.1%) | 7,210 (55.4%) |
| 35 to 44 Years | 3,666 (37.1%) | 5,928 (59.9%) |
| 45 to 54 Years | 3,167 (31.0%) | 6,535 (64.1%) |
| 55 to 64 Years | 4,388 (37.5%) | 7,532 (64.4%) |
| 65 to 74 Years | 8,084 (96.0%) | 4,202 (49.9%) |
| 75 Years and over | 5,579 (99.8%) | 3,166 (56.6%) |
| Total | 48,344 (52.2%) | 50,631 (54.7%) |
Disability Status by Sex by Age in Erie
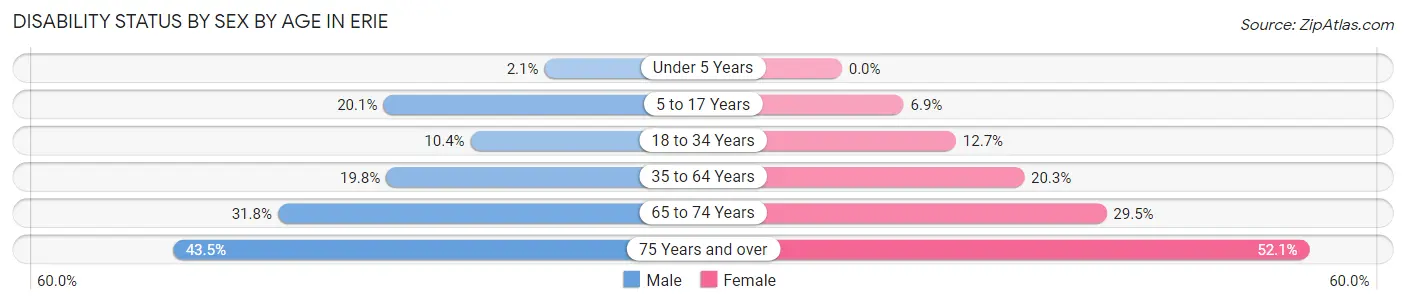
| Age Bracket | Male | Female |
| Under 5 Years | 60 (2.1%) | 0 (0.0%) |
| 5 to 17 Years | 1,593 (20.1%) | 477 (6.9%) |
| 18 to 34 Years | 1,355 (10.3%) | 1,703 (12.7%) |
| 35 to 64 Years | 3,054 (19.8%) | 3,313 (20.3%) |
| 65 to 74 Years | 1,215 (31.8%) | 1,357 (29.5%) |
| 75 Years and over | 873 (43.5%) | 1,866 (52.1%) |
Disability Class by Sex by Age in Erie
Disability Class: Hearing Difficulty
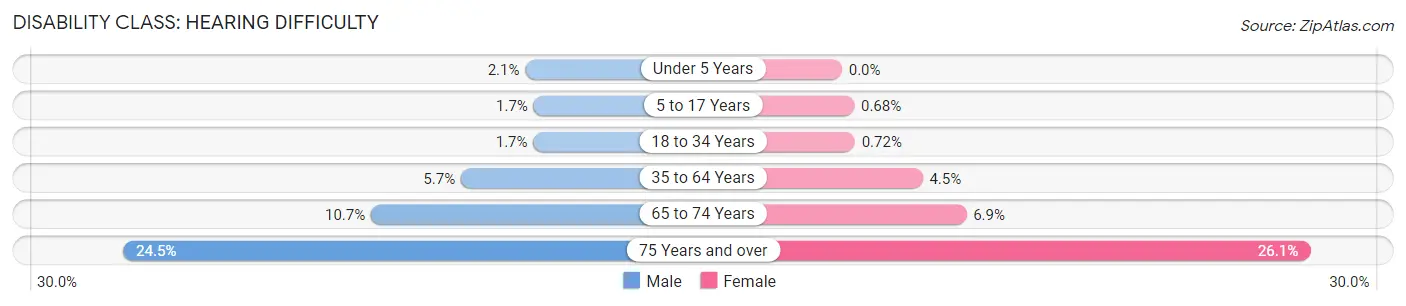
| Age Bracket | Male | Female |
| Under 5 Years | 60 (2.1%) | 0 (0.0%) |
| 5 to 17 Years | 131 (1.7%) | 47 (0.7%) |
| 18 to 34 Years | 218 (1.7%) | 97 (0.7%) |
| 35 to 64 Years | 881 (5.7%) | 733 (4.5%) |
| 65 to 74 Years | 409 (10.7%) | 319 (6.9%) |
| 75 Years and over | 492 (24.5%) | 934 (26.1%) |
Disability Class: Vision Difficulty
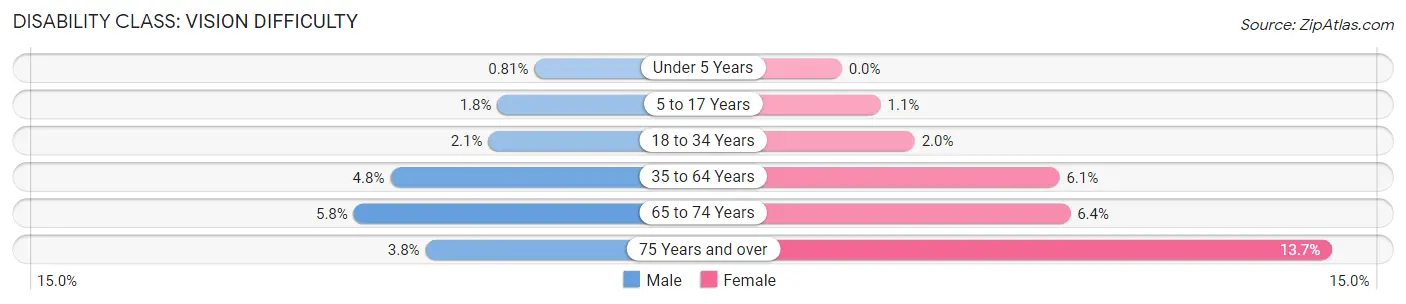
| Age Bracket | Male | Female |
| Under 5 Years | 23 (0.8%) | 0 (0.0%) |
| 5 to 17 Years | 146 (1.8%) | 75 (1.1%) |
| 18 to 34 Years | 273 (2.1%) | 272 (2.0%) |
| 35 to 64 Years | 745 (4.8%) | 990 (6.1%) |
| 65 to 74 Years | 223 (5.8%) | 293 (6.4%) |
| 75 Years and over | 77 (3.8%) | 489 (13.7%) |
Disability Class: Cognitive Difficulty
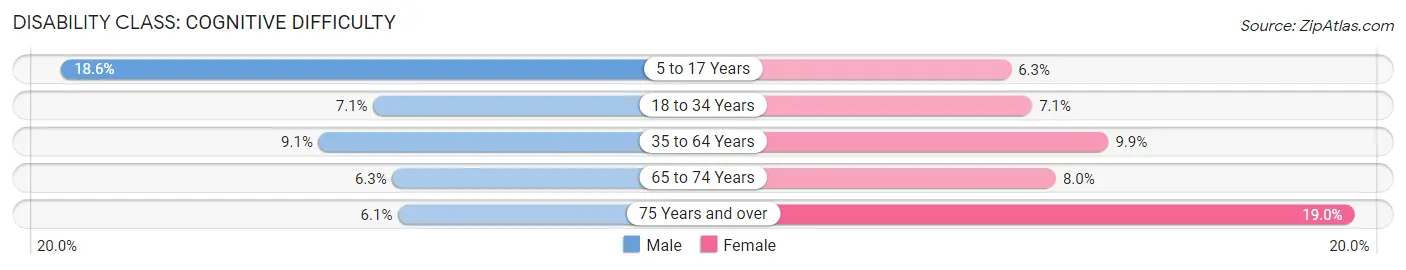
| Age Bracket | Male | Female |
| 5 to 17 Years | 1,480 (18.6%) | 436 (6.3%) |
| 18 to 34 Years | 923 (7.0%) | 948 (7.1%) |
| 35 to 64 Years | 1,404 (9.1%) | 1,616 (9.9%) |
| 65 to 74 Years | 242 (6.3%) | 366 (8.0%) |
| 75 Years and over | 123 (6.1%) | 682 (19.0%) |
Disability Class: Ambulatory Difficulty
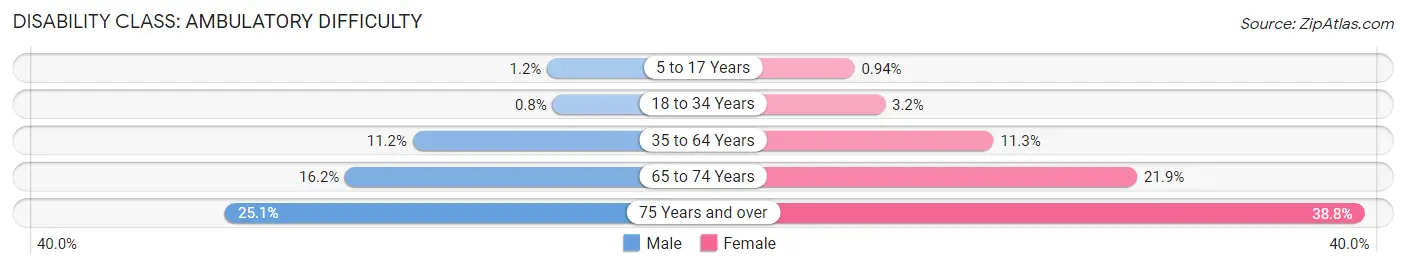
| Age Bracket | Male | Female |
| 5 to 17 Years | 95 (1.2%) | 65 (0.9%) |
| 18 to 34 Years | 105 (0.8%) | 430 (3.2%) |
| 35 to 64 Years | 1,729 (11.2%) | 1,840 (11.3%) |
| 65 to 74 Years | 619 (16.2%) | 1,010 (21.9%) |
| 75 Years and over | 504 (25.1%) | 1,390 (38.8%) |
Disability Class: Self-Care Difficulty
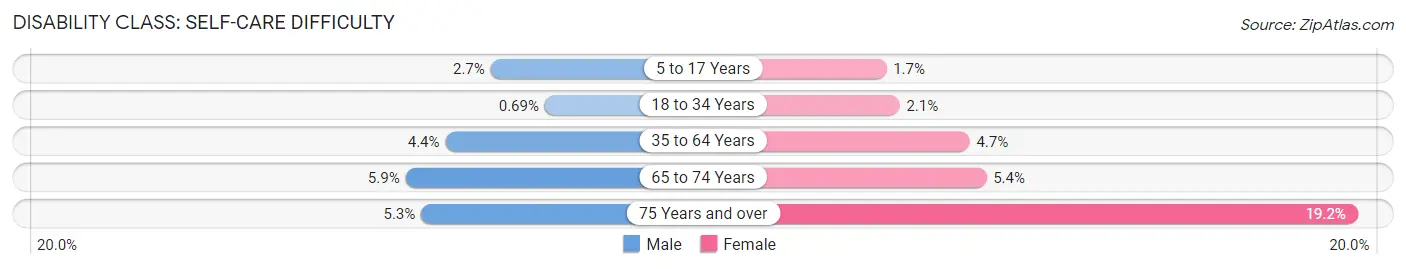
| Age Bracket | Male | Female |
| 5 to 17 Years | 214 (2.7%) | 114 (1.7%) |
| 18 to 34 Years | 90 (0.7%) | 287 (2.1%) |
| 35 to 64 Years | 677 (4.4%) | 773 (4.7%) |
| 65 to 74 Years | 224 (5.9%) | 247 (5.4%) |
| 75 Years and over | 106 (5.3%) | 686 (19.2%) |
Technology Access in Erie
Computing Device Access in Erie
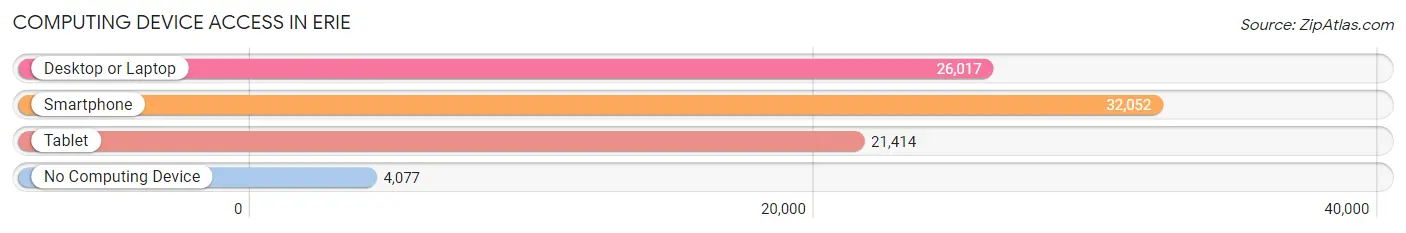
| Device Type | # Households | % Households |
| Desktop or Laptop | 26,017 | 66.4% |
| Smartphone | 32,052 | 81.8% |
| Tablet | 21,414 | 54.7% |
| No Computing Device | 4,077 | 10.4% |
| Total | 39,180 | 100.0% |
Internet Access in Erie
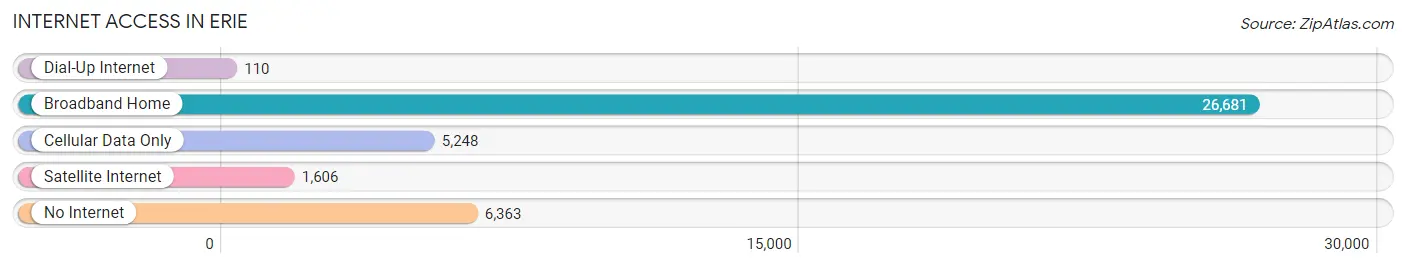
| Internet Type | # Households | % Households |
| Dial-Up Internet | 110 | 0.3% |
| Broadband Home | 26,681 | 68.1% |
| Cellular Data Only | 5,248 | 13.4% |
| Satellite Internet | 1,606 | 4.1% |
| No Internet | 6,363 | 16.2% |
| Total | 39,180 | 100.0% |
Erie Summary
Erie, Pennsylvania is a city located in the northwestern corner of the state, on the shores of Lake Erie. It is the fourth-largest city in Pennsylvania, with a population of approximately 101,786 as of the 2010 census. The city is the county seat of Erie County and is part of the Erie Metropolitan Statistical Area.
History
The area that is now Erie was originally inhabited by the Eriez Indians, a tribe of the Iroquois Confederacy. The first European settlers arrived in the area in the late 17th century, and the city was officially founded in 1795. The city was named after the Eriez Indians, and was initially a trading post and port.
In the early 19th century, the city became an important transportation hub, with the completion of the Erie Canal in 1825. The canal connected the Great Lakes to the Hudson River, and allowed for the transportation of goods and people between the two regions.
The city experienced rapid growth in the mid-19th century, with the completion of the Pennsylvania Railroad in 1852. This allowed for the transportation of goods and people to and from the city, and helped to further spur its growth.
In the late 19th century, the city became an important industrial center, with the establishment of several steel mills and other manufacturing plants. The city also became a major center for the oil and gas industry, with the discovery of oil in nearby Titusville in 1859.
Geography
Erie is located in the northwestern corner of Pennsylvania, on the shores of Lake Erie. The city is situated at the mouth of the Presque Isle Bay, and is bordered by the cities of Corry and Girard to the north, and the boroughs of Edinboro and Waterford to the south. The city covers an area of approximately 25.6 square miles, and has an elevation of 571 feet.
The city is located in a humid continental climate zone, with cold, snowy winters and warm, humid summers. The average annual temperature is approximately 46°F, and the average annual precipitation is approximately 37 inches.
Economy
Erie’s economy is largely based on manufacturing, healthcare, education, and tourism. The city is home to several large manufacturing companies, including GE Transportation, Hammermill Paper, and Lord Corporation. The city is also home to several healthcare facilities, including UPMC Hamot, Saint Vincent Hospital, and Millcreek Community Hospital.
The city is also home to several educational institutions, including Gannon University, Mercyhurst University, and Penn State Behrend. The city is also a popular tourist destination, with attractions such as Presque Isle State Park, Waldameer Park, and the Erie Zoo.
Demographics
As of the 2010 census, the population of Erie was 101,786. The racial makeup of the city was 79.2% White, 14.3% African American, 0.4% Native American, 1.2% Asian, 0.1% Pacific Islander, and 4.8% from other races. The median household income was $33,902, and the median family income was $41,945.
The city is home to a large number of immigrants, with approximately 10.3% of the population being foreign-born. The largest ethnic groups in the city are German (17.2%), Irish (14.2%), Italian (13.2%), and Polish (10.2%). The city also has a large population of African Americans, with approximately 14.3% of the population being African American.
Common Questions
What is Per Capita Income in Erie?
Per Capita income in Erie is $25,090.
What is the Median Family Income in Erie?
Median Family Income in Erie is $56,399.
What is the Median Household income in Erie?
Median Household Income in Erie is $43,135.
What is Income or Wage Gap in Erie?
Income or Wage Gap in Erie is 24.1%.
Women in Erie earn 75.9 cents for every dollar earned by a man.
What is Family Income Deficit in Erie?
Family Income Deficit in Erie is $10,902.
Families that are below poverty line in Erie earn $10,902 less on average than the poverty threshold level.
What is Inequality or Gini Index in Erie?
Inequality or Gini Index in Erie is 0.46.
What is the Total Population of Erie?
Total Population of Erie is 94,826.
What is the Total Male Population of Erie?
Total Male Population of Erie is 46,773.
What is the Total Female Population of Erie?
Total Female Population of Erie is 48,053.
What is the Ratio of Males per 100 Females in Erie?
There are 97.34 Males per 100 Females in Erie.
What is the Ratio of Females per 100 Males in Erie?
There are 102.74 Females per 100 Males in Erie.
What is the Median Population Age in Erie?
Median Population Age in Erie is 35.0 Years.
What is the Average Family Size in Erie
Average Family Size in Erie is 3.1 People.
What is the Average Household Size in Erie
Average Household Size in Erie is 2.3 People.
How Large is the Labor Force in Erie?
There are 45,458 People in the Labor Forcein in Erie.
What is the Percentage of People in the Labor Force in Erie?
59.2% of People are in the Labor Force in Erie.
What is the Unemployment Rate in Erie?
Unemployment Rate in Erie is 6.8%.