Ellicott City, MD Map & Demographics
Ellicott City Map
Ellicott City Overview
$66,029
PER CAPITA INCOME
$178,280
AVG FAMILY INCOME
$149,534
AVG HOUSEHOLD INCOME
36.1%
WAGE / INCOME GAP [ % ]
63.9¢/ $1
WAGE / INCOME GAP [ $ ]
$11,037
FAMILY INCOME DEFICIT
0.42
INEQUALITY / GINI INDEX
73,589
TOTAL POPULATION
36,368
MALE POPULATION
37,221
FEMALE POPULATION
97.71
MALES / 100 FEMALES
102.35
FEMALES / 100 MALES
42.1
MEDIAN AGE
3.2
AVG FAMILY SIZE
2.7
AVG HOUSEHOLD SIZE
38,182
LABOR FORCE [ PEOPLE ]
66.9%
PERCENT IN LABOR FORCE
3.3%
UNEMPLOYMENT RATE
Income in Ellicott City
Income Overview in Ellicott City
Per Capita Income in Ellicott City is $66,029, while median incomes of families and households are $178,280 and $149,534 respectively.
| Characteristic | Number | Measure |
| Per Capita Income | 73,589 | $66,029 |
| Median Family Income | 20,400 | $178,280 |
| Mean Family Income | 20,400 | $207,995 |
| Median Household Income | 26,879 | $149,534 |
| Mean Household Income | 26,879 | $179,368 |
| Income Deficit | 20,400 | $11,037 |
| Wage / Income Gap (%) | 73,589 | 36.11% |
| Wage / Income Gap ($) | 73,589 | 63.89¢ per $1 |
| Gini / Inequality Index | 73,589 | 0.42 |
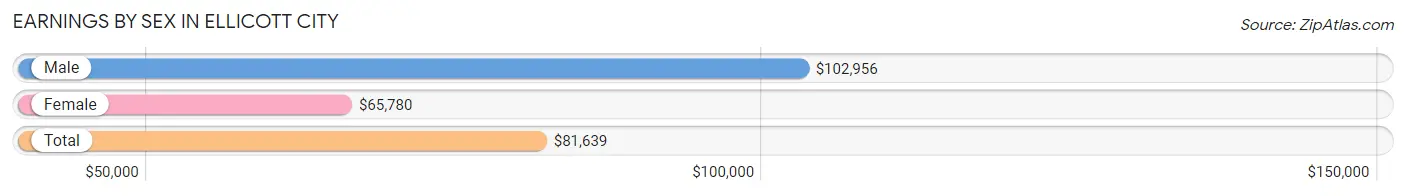
Earnings by Sex in Ellicott City
Average Earnings in Ellicott City are $81,639, $102,956 for men and $65,780 for women, a difference of 36.1%.
| Sex | Number | Average Earnings |
| Male | 21,459 (53.7%) | $102,956 |
| Female | 18,490 (46.3%) | $65,780 |
| Total | 39,949 (100.0%) | $81,639 |
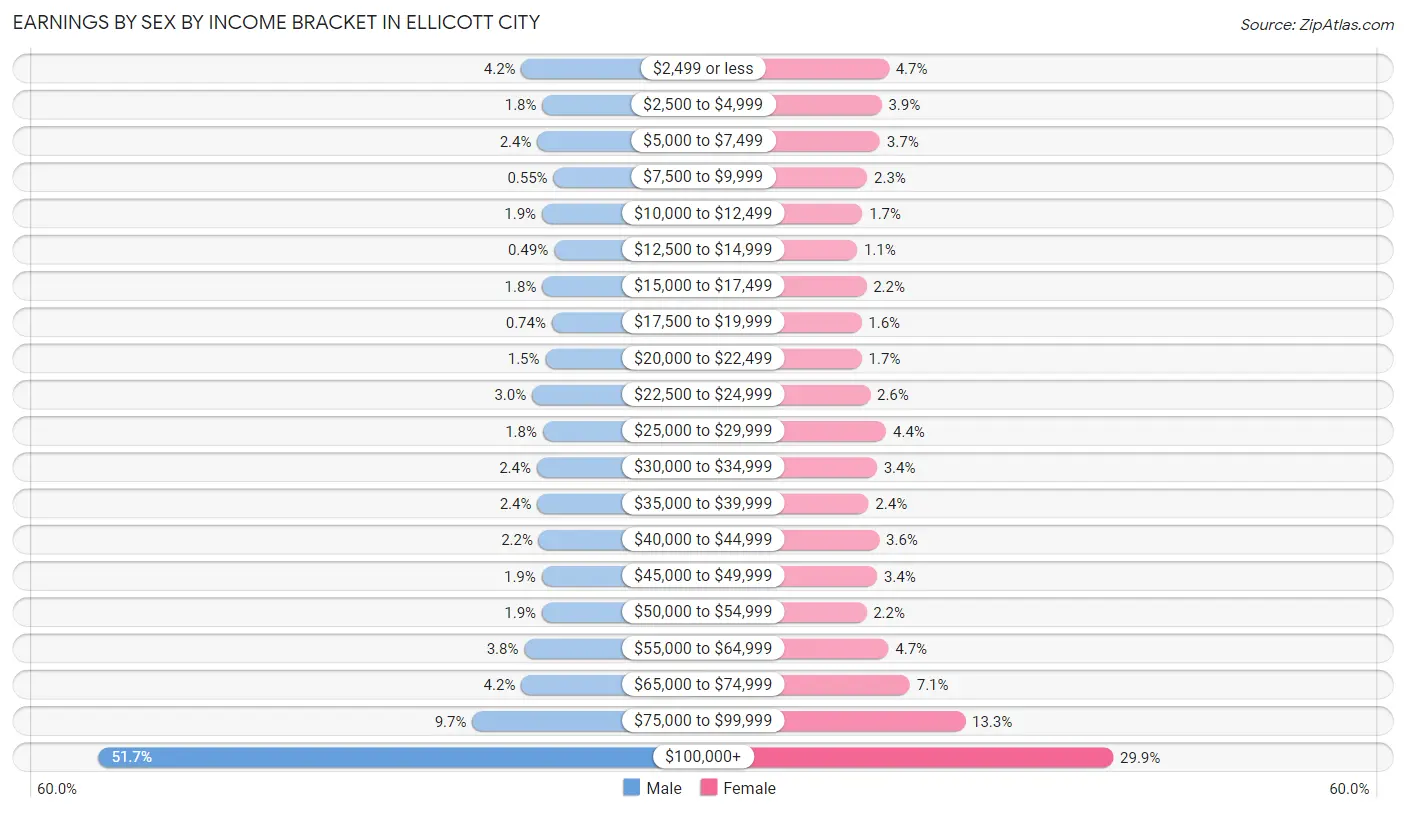
Earnings by Sex by Income Bracket in Ellicott City
The most common earnings brackets in Ellicott City are $100,000+ for men (11,091 | 51.7%) and $100,000+ for women (5,536 | 29.9%).
| Income | Male | Female |
| $2,499 or less | 890 (4.2%) | 870 (4.7%) |
| $2,500 to $4,999 | 387 (1.8%) | 722 (3.9%) |
| $5,000 to $7,499 | 508 (2.4%) | 688 (3.7%) |
| $7,500 to $9,999 | 117 (0.5%) | 422 (2.3%) |
| $10,000 to $12,499 | 398 (1.8%) | 321 (1.7%) |
| $12,500 to $14,999 | 105 (0.5%) | 210 (1.1%) |
| $15,000 to $17,499 | 388 (1.8%) | 404 (2.2%) |
| $17,500 to $19,999 | 159 (0.7%) | 303 (1.6%) |
| $20,000 to $22,499 | 314 (1.5%) | 308 (1.7%) |
| $22,500 to $24,999 | 635 (3.0%) | 483 (2.6%) |
| $25,000 to $29,999 | 375 (1.8%) | 818 (4.4%) |
| $30,000 to $34,999 | 519 (2.4%) | 621 (3.4%) |
| $35,000 to $39,999 | 509 (2.4%) | 450 (2.4%) |
| $40,000 to $44,999 | 472 (2.2%) | 672 (3.6%) |
| $45,000 to $49,999 | 404 (1.9%) | 627 (3.4%) |
| $50,000 to $54,999 | 396 (1.8%) | 403 (2.2%) |
| $55,000 to $64,999 | 821 (3.8%) | 864 (4.7%) |
| $65,000 to $74,999 | 895 (4.2%) | 1,310 (7.1%) |
| $75,000 to $99,999 | 2,076 (9.7%) | 2,458 (13.3%) |
| $100,000+ | 11,091 (51.7%) | 5,536 (29.9%) |
| Total | 21,459 (100.0%) | 18,490 (100.0%) |
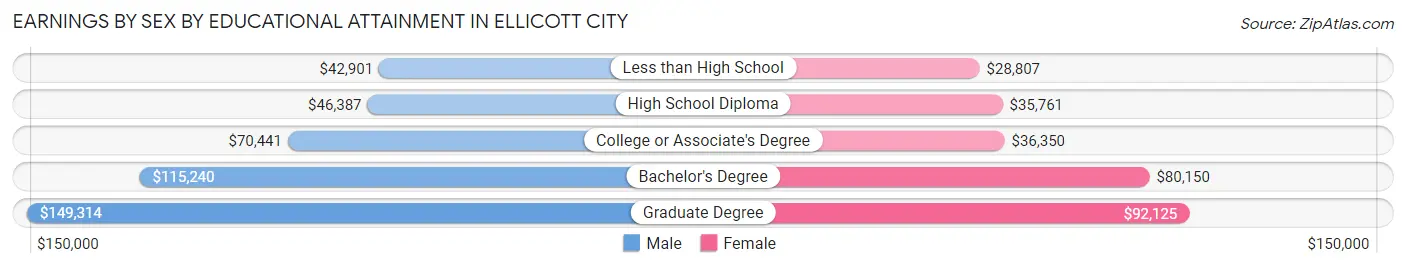
Earnings by Sex by Educational Attainment in Ellicott City
Average earnings in Ellicott City are $114,574 for men and $71,961 for women, a difference of 37.2%. Men with an educational attainment of graduate degree enjoy the highest average annual earnings of $149,314, while those with less than high school education earn the least with $42,901. Women with an educational attainment of graduate degree earn the most with the average annual earnings of $92,125, while those with less than high school education have the smallest earnings of $28,807.
| Educational Attainment | Male Income | Female Income |
| Less than High School | $42,901 | $28,807 |
| High School Diploma | $46,387 | $35,761 |
| College or Associate's Degree | $70,441 | $36,350 |
| Bachelor's Degree | $115,240 | $80,150 |
| Graduate Degree | $149,314 | $92,125 |
| Total | $114,574 | $71,961 |
Family Income in Ellicott City
Family Income Brackets in Ellicott City
According to the Ellicott City family income data, there are 8,752 families falling into the $200,000+ income range, which is the most common income bracket and makes up 42.9% of all families. Conversely, the $10,000 to $14,999 income bracket is the least frequent group with only 122 families (0.6%) belonging to this category.
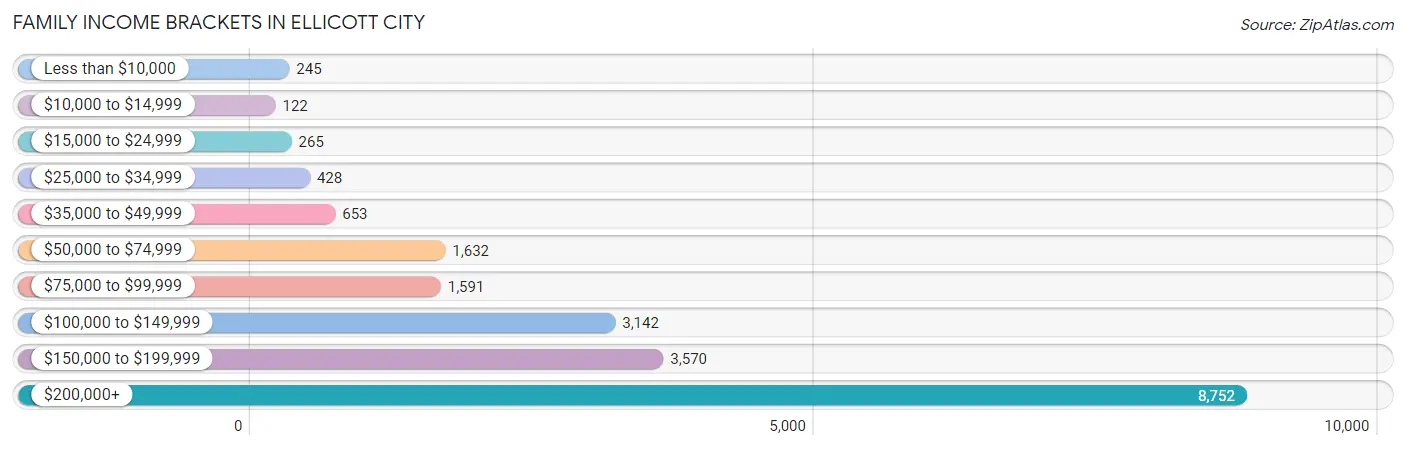
| Income Bracket | # Families | % Families |
| Less than $10,000 | 245 | 1.2% |
| $10,000 to $14,999 | 122 | 0.6% |
| $15,000 to $24,999 | 265 | 1.3% |
| $25,000 to $34,999 | 428 | 2.1% |
| $35,000 to $49,999 | 653 | 3.2% |
| $50,000 to $74,999 | 1,632 | 8.0% |
| $75,000 to $99,999 | 1,591 | 7.8% |
| $100,000 to $149,999 | 3,142 | 15.4% |
| $150,000 to $199,999 | 3,570 | 17.5% |
| $200,000+ | 8,752 | 42.9% |
Family Income by Famaliy Size in Ellicott City
7+ person families (314 | 1.5%) account for the highest median family income in Ellicott City with $250,001 per family, while 2-person families (7,953 | 39.0%) have the highest median income of $72,786 per family member.
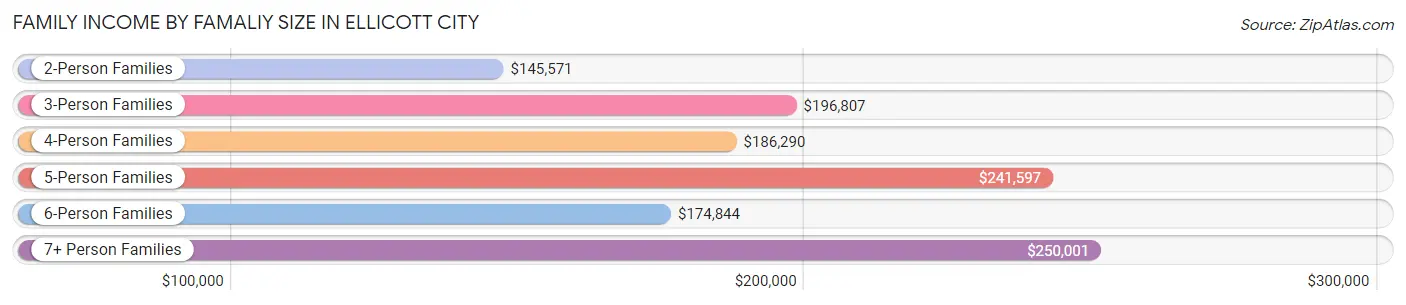
| Income Bracket | # Families | Median Income |
| 2-Person Families | 7,953 (39.0%) | $145,571 |
| 3-Person Families | 4,419 (21.7%) | $196,807 |
| 4-Person Families | 5,880 (28.8%) | $186,290 |
| 5-Person Families | 1,489 (7.3%) | $241,597 |
| 6-Person Families | 345 (1.7%) | $174,844 |
| 7+ Person Families | 314 (1.5%) | $250,001 |
| Total | 20,400 (100.0%) | $178,280 |
Family Income by Number of Earners in Ellicott City
The median family income in Ellicott City is $178,280, with families comprising 3+ earners (2,873) having the highest median family income of $250,001, while families with no earners (2,257) have the lowest median family income of $88,795, accounting for 14.1% and 11.1% of families, respectively.
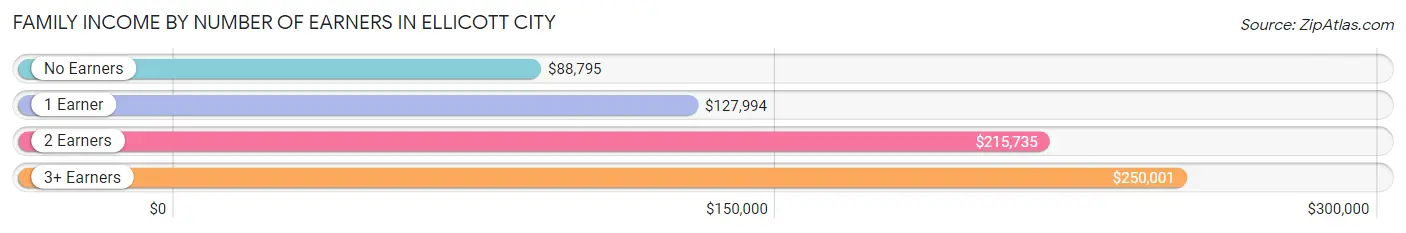
| Number of Earners | # Families | Median Income |
| No Earners | 2,257 (11.1%) | $88,795 |
| 1 Earner | 5,686 (27.9%) | $127,994 |
| 2 Earners | 9,584 (47.0%) | $215,735 |
| 3+ Earners | 2,873 (14.1%) | $250,001 |
| Total | 20,400 (100.0%) | $178,280 |
Household Income in Ellicott City
Household Income Brackets in Ellicott City
With 9,193 households falling in the category, the $200,000+ income range is the most frequent in Ellicott City, accounting for 34.2% of all households. In contrast, only 430 households (1.6%) fall into the $10,000 to $14,999 income bracket, making it the least populous group.
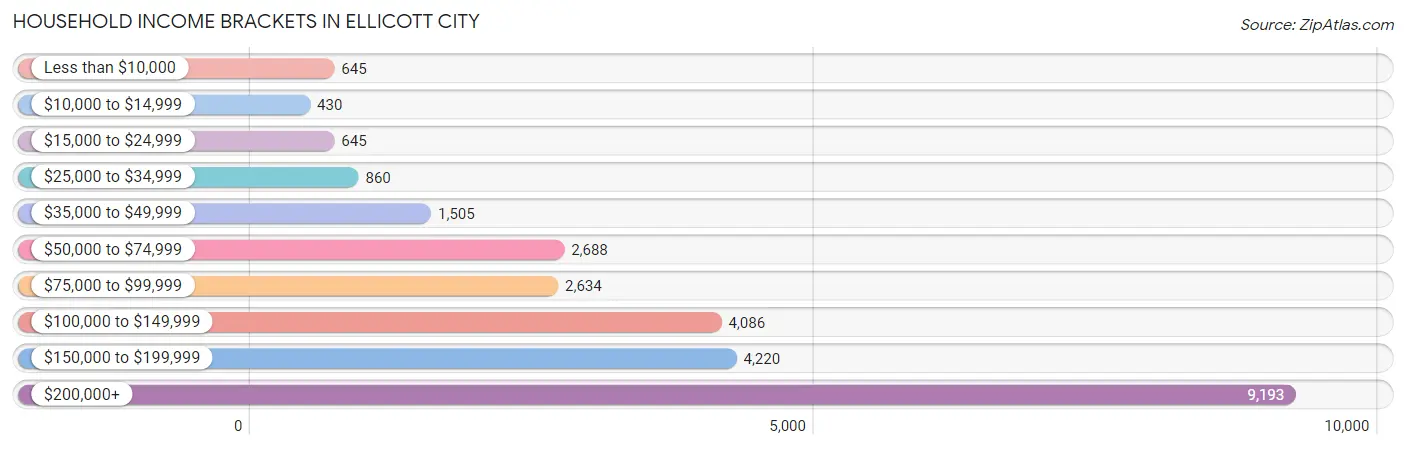
| Income Bracket | # Households | % Households |
| Less than $10,000 | 645 | 2.4% |
| $10,000 to $14,999 | 430 | 1.6% |
| $15,000 to $24,999 | 645 | 2.4% |
| $25,000 to $34,999 | 860 | 3.2% |
| $35,000 to $49,999 | 1,505 | 5.6% |
| $50,000 to $74,999 | 2,688 | 10.0% |
| $75,000 to $99,999 | 2,634 | 9.8% |
| $100,000 to $149,999 | 4,086 | 15.2% |
| $150,000 to $199,999 | 4,220 | 15.7% |
| $200,000+ | 9,193 | 34.2% |
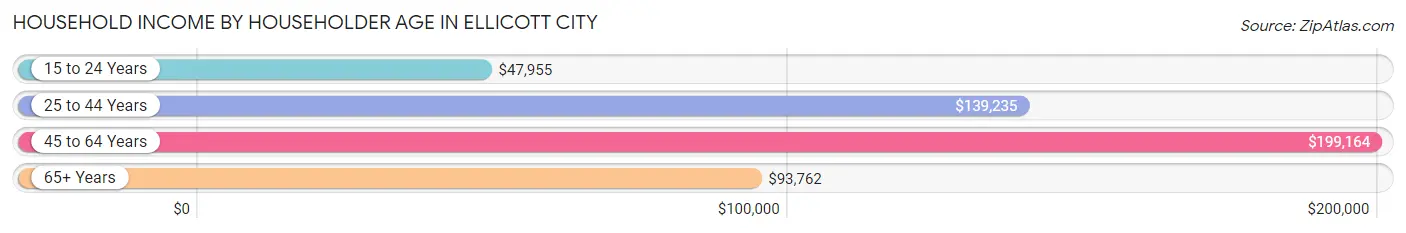
Household Income by Householder Age in Ellicott City
The median household income in Ellicott City is $149,534, with the highest median household income of $199,164 found in the 45 to 64 years age bracket for the primary householder. A total of 11,137 households (41.4%) fall into this category. Meanwhile, the 15 to 24 years age bracket for the primary householder has the lowest median household income of $47,955, with 448 households (1.7%) in this group.
| Income Bracket | # Households | Median Income |
| 15 to 24 Years | 448 (1.7%) | $47,955 |
| 25 to 44 Years | 7,526 (28.0%) | $139,235 |
| 45 to 64 Years | 11,137 (41.4%) | $199,164 |
| 65+ Years | 7,768 (28.9%) | $93,762 |
| Total | 26,879 (100.0%) | $149,534 |
Poverty in Ellicott City
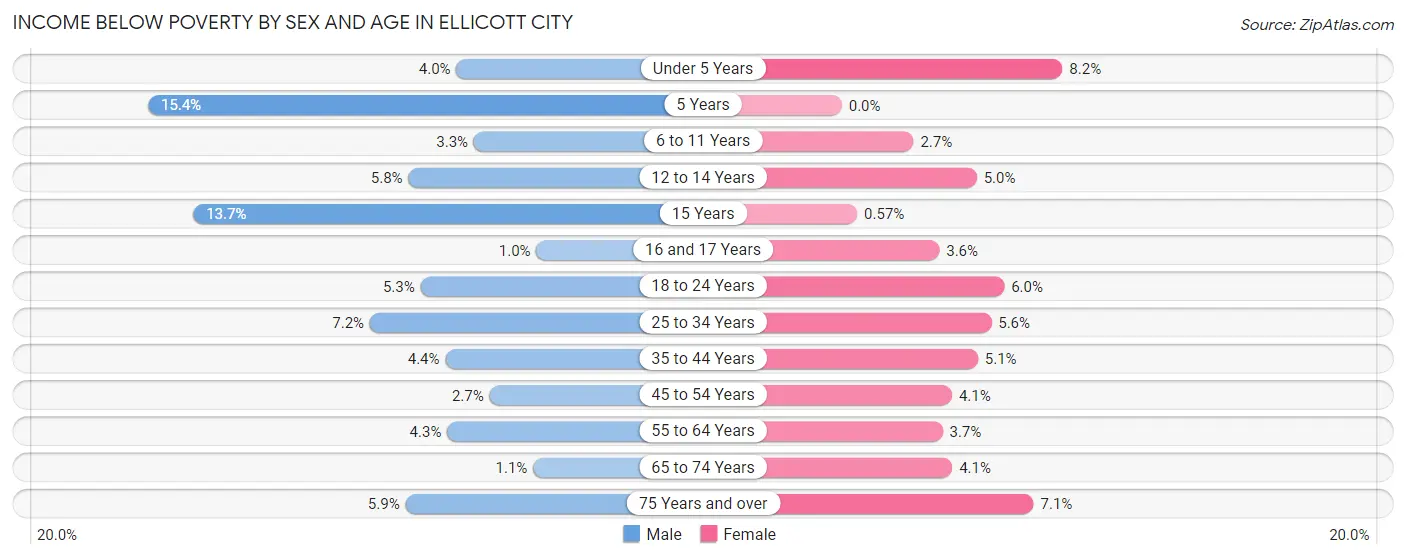
Income Below Poverty by Sex and Age in Ellicott City
With 4.4% poverty level for males and 4.6% for females among the residents of Ellicott City, 5 year old males and under 5 year old females are the most vulnerable to poverty, with 64 males (15.4%) and 143 females (8.2%) in their respective age groups living below the poverty level.
| Age Bracket | Male | Female |
| Under 5 Years | 69 (4.0%) | 143 (8.2%) |
| 5 Years | 64 (15.4%) | 0 (0.0%) |
| 6 to 11 Years | 115 (3.3%) | 90 (2.7%) |
| 12 to 14 Years | 99 (5.8%) | 109 (5.0%) |
| 15 Years | 101 (13.7%) | 4 (0.6%) |
| 16 and 17 Years | 12 (1.0%) | 43 (3.6%) |
| 18 to 24 Years | 144 (5.3%) | 131 (6.0%) |
| 25 to 34 Years | 206 (7.2%) | 165 (5.6%) |
| 35 to 44 Years | 225 (4.4%) | 284 (5.1%) |
| 45 to 54 Years | 155 (2.7%) | 222 (4.1%) |
| 55 to 64 Years | 212 (4.3%) | 165 (3.7%) |
| 65 to 74 Years | 36 (1.1%) | 170 (4.1%) |
| 75 Years and over | 140 (5.9%) | 190 (7.1%) |
| Total | 1,578 (4.4%) | 1,716 (4.6%) |
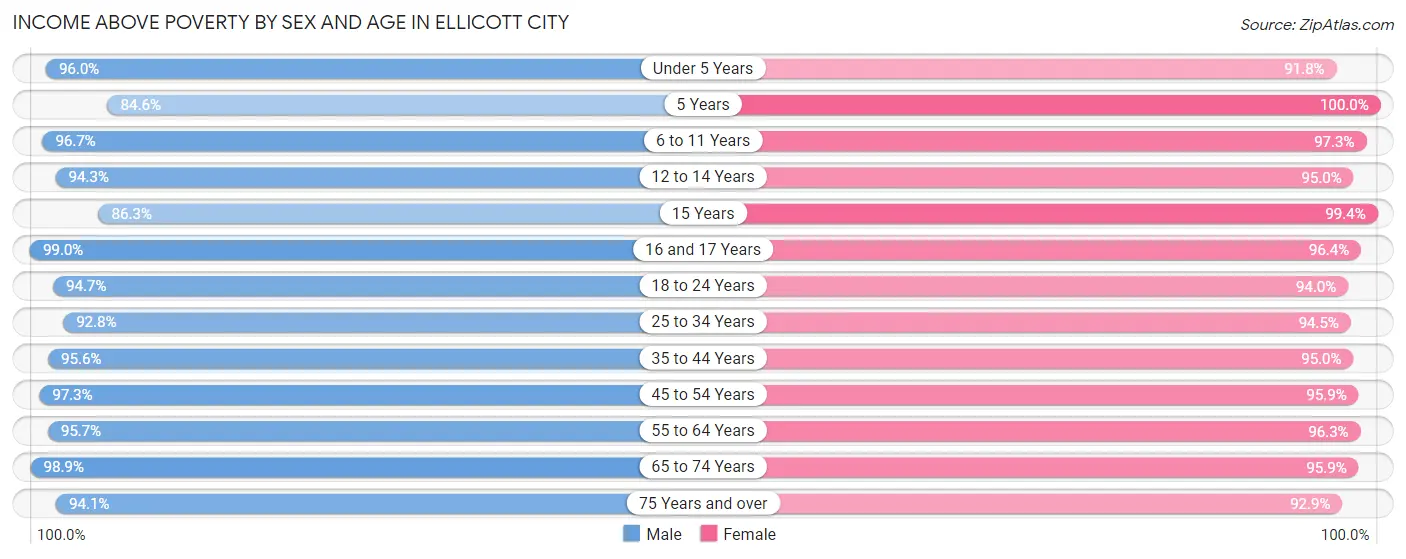
Income Above Poverty by Sex and Age in Ellicott City
According to the poverty statistics in Ellicott City, males aged 16 and 17 years and females aged 5 years are the age groups that are most secure financially, with 99.0% of males and 100.0% of females in these age groups living above the poverty line.
| Age Bracket | Male | Female |
| Under 5 Years | 1,670 (96.0%) | 1,603 (91.8%) |
| 5 Years | 351 (84.6%) | 316 (100.0%) |
| 6 to 11 Years | 3,345 (96.7%) | 3,296 (97.3%) |
| 12 to 14 Years | 1,624 (94.3%) | 2,068 (95.0%) |
| 15 Years | 634 (86.3%) | 692 (99.4%) |
| 16 and 17 Years | 1,184 (99.0%) | 1,145 (96.4%) |
| 18 to 24 Years | 2,572 (94.7%) | 2,041 (94.0%) |
| 25 to 34 Years | 2,665 (92.8%) | 2,809 (94.5%) |
| 35 to 44 Years | 4,907 (95.6%) | 5,343 (95.0%) |
| 45 to 54 Years | 5,509 (97.3%) | 5,211 (95.9%) |
| 55 to 64 Years | 4,710 (95.7%) | 4,246 (96.3%) |
| 65 to 74 Years | 3,186 (98.9%) | 3,977 (95.9%) |
| 75 Years and over | 2,251 (94.1%) | 2,478 (92.9%) |
| Total | 34,608 (95.6%) | 35,225 (95.4%) |
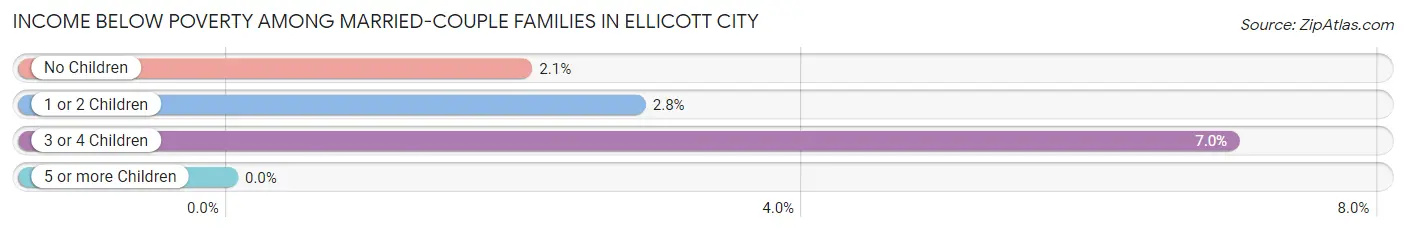
Income Below Poverty Among Married-Couple Families in Ellicott City
The poverty statistics for married-couple families in Ellicott City show that 2.7% or 465 of the total 17,315 families live below the poverty line. Families with 3 or 4 children have the highest poverty rate of 7.0%, comprising of 70 families. On the other hand, families with 5 or more children have the lowest poverty rate of 0.0%, which includes 0 families.
| Children | Above Poverty | Below Poverty |
| No Children | 8,064 (98.0%) | 169 (2.1%) |
| 1 or 2 Children | 7,726 (97.2%) | 226 (2.8%) |
| 3 or 4 Children | 935 (93.0%) | 70 (7.0%) |
| 5 or more Children | 125 (100.0%) | 0 (0.0%) |
| Total | 16,850 (97.3%) | 465 (2.7%) |
Income Below Poverty Among Single-Parent Households in Ellicott City
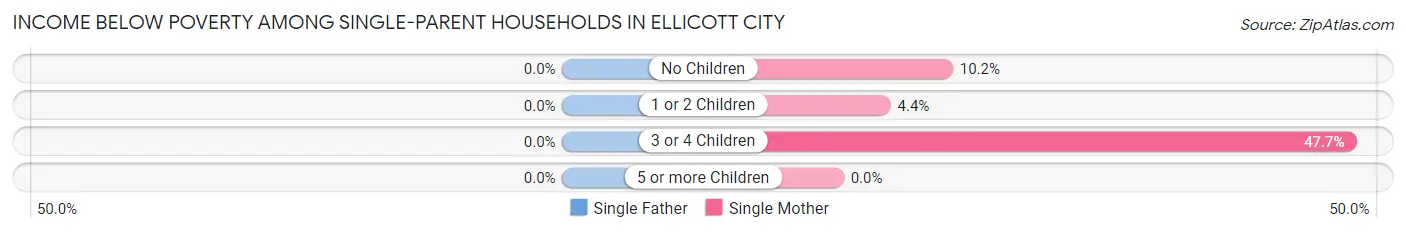
| Children | Single Father | Single Mother |
| No Children | 0 (0.0%) | 70 (10.2%) |
| 1 or 2 Children | 0 (0.0%) | 57 (4.4%) |
| 3 or 4 Children | 0 (0.0%) | 63 (47.7%) |
| 5 or more Children | 0 (0.0%) | 0 (0.0%) |
| Total | 0 (0.0%) | 190 (8.9%) |
Income Below Poverty Among Married-Couple vs Single-Parent Households in Ellicott City
The poverty data for Ellicott City shows that 465 of the married-couple family households (2.7%) and 190 of the single-parent households (6.2%) are living below the poverty level. Within the married-couple family households, those with 3 or 4 children have the highest poverty rate, with 70 households (7.0%) falling below the poverty line. Among the single-parent households, those with 3 or 4 children have the highest poverty rate, with 63 household (24.5%) living below poverty.
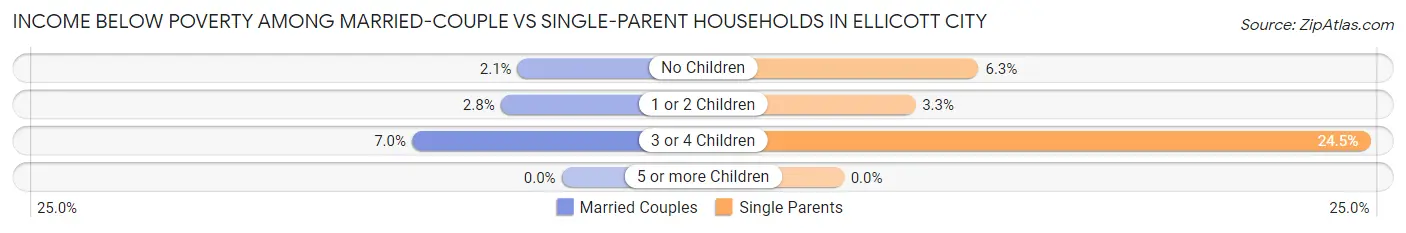
| Children | Married-Couple Families | Single-Parent Households |
| No Children | 169 (2.1%) | 70 (6.3%) |
| 1 or 2 Children | 226 (2.8%) | 57 (3.3%) |
| 3 or 4 Children | 70 (7.0%) | 63 (24.5%) |
| 5 or more Children | 0 (0.0%) | 0 (0.0%) |
| Total | 465 (2.7%) | 190 (6.2%) |
Race in Ellicott City
The most populous races in Ellicott City are White / Caucasian (38,980 | 53.0%), Asian (22,156 | 30.1%), and Black / African American (6,322 | 8.6%).
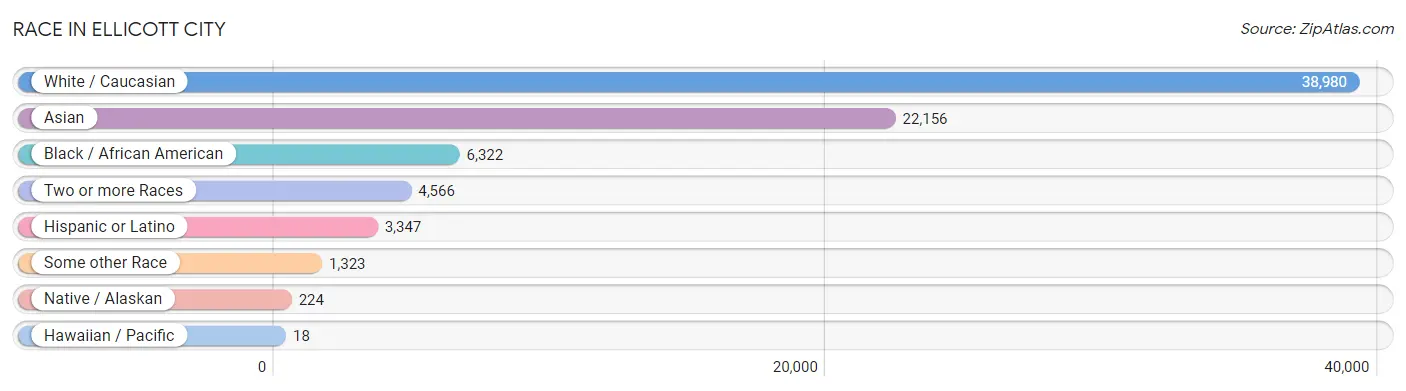
| Race | # Population | % Population |
| Asian | 22,156 | 30.1% |
| Black / African American | 6,322 | 8.6% |
| Hawaiian / Pacific | 18 | 0.0% |
| Hispanic or Latino | 3,347 | 4.5% |
| Native / Alaskan | 224 | 0.3% |
| White / Caucasian | 38,980 | 53.0% |
| Two or more Races | 4,566 | 6.2% |
| Some other Race | 1,323 | 1.8% |
| Total | 73,589 | 100.0% |
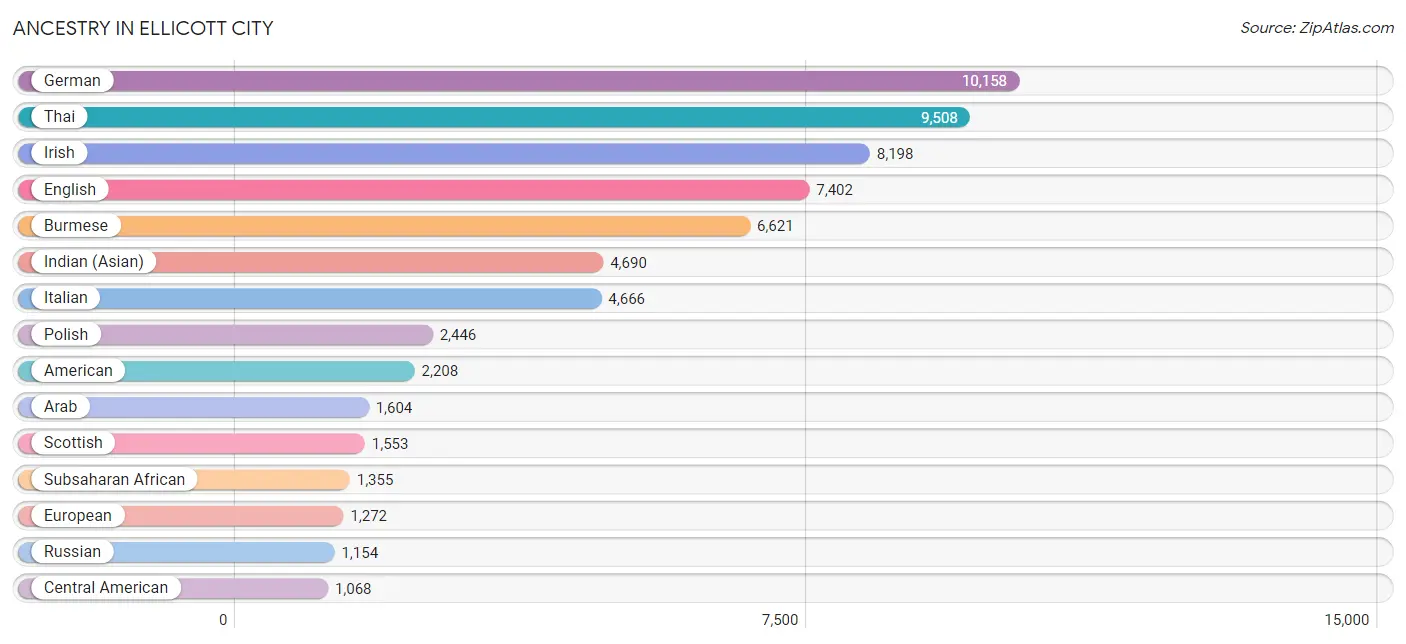
Ancestry in Ellicott City
The most populous ancestries reported in Ellicott City are German (10,158 | 13.8%), Thai (9,508 | 12.9%), Irish (8,198 | 11.1%), English (7,402 | 10.1%), and Burmese (6,621 | 9.0%), together accounting for 56.9% of all Ellicott City residents.
| Ancestry | # Population | % Population |
| African | 253 | 0.3% |
| American | 2,208 | 3.0% |
| Arab | 1,604 | 2.2% |
| Argentinean | 57 | 0.1% |
| Armenian | 16 | 0.0% |
| Australian | 38 | 0.1% |
| Austrian | 142 | 0.2% |
| Belgian | 8 | 0.0% |
| Bhutanese | 443 | 0.6% |
| Blackfeet | 42 | 0.1% |
| Brazilian | 64 | 0.1% |
| British | 553 | 0.7% |
| British West Indian | 84 | 0.1% |
| Bulgarian | 9 | 0.0% |
| Burmese | 6,621 | 9.0% |
| Cambodian | 75 | 0.1% |
| Canadian | 19 | 0.0% |
| Cape Verdean | 80 | 0.1% |
| Central American | 1,068 | 1.5% |
| Central American Indian | 13 | 0.0% |
| Cherokee | 120 | 0.2% |
| Chilean | 15 | 0.0% |
| Colombian | 31 | 0.0% |
| Costa Rican | 46 | 0.1% |
| Croatian | 91 | 0.1% |
| Cuban | 286 | 0.4% |
| Czech | 465 | 0.6% |
| Czechoslovakian | 150 | 0.2% |
| Danish | 204 | 0.3% |
| Dominican | 86 | 0.1% |
| Dutch | 408 | 0.5% |
| Eastern European | 610 | 0.8% |
| Ecuadorian | 56 | 0.1% |
| Egyptian | 62 | 0.1% |
| English | 7,402 | 10.1% |
| Estonian | 14 | 0.0% |
| Ethiopian | 368 | 0.5% |
| European | 1,272 | 1.7% |
| Filipino | 104 | 0.1% |
| Finnish | 72 | 0.1% |
| French | 912 | 1.2% |
| French Canadian | 239 | 0.3% |
| German | 10,158 | 13.8% |
| Ghanaian | 34 | 0.1% |
| Greek | 731 | 1.0% |
| Guatemalan | 29 | 0.0% |
| Haitian | 54 | 0.1% |
| Honduran | 433 | 0.6% |
| Hungarian | 158 | 0.2% |
| Icelander | 8 | 0.0% |
| Indian (Asian) | 4,690 | 6.4% |
| Iranian | 473 | 0.6% |
| Irish | 8,198 | 11.1% |
| Israeli | 463 | 0.6% |
| Italian | 4,666 | 6.3% |
| Jamaican | 265 | 0.4% |
| Jordanian | 73 | 0.1% |
| Kenyan | 49 | 0.1% |
| Korean | 761 | 1.0% |
| Laotian | 6 | 0.0% |
| Latvian | 121 | 0.2% |
| Lebanese | 86 | 0.1% |
| Lithuanian | 257 | 0.4% |
| Mexican | 725 | 1.0% |
| Moroccan | 33 | 0.0% |
| Native Hawaiian | 10 | 0.0% |
| Nicaraguan | 38 | 0.1% |
| Nigerian | 448 | 0.6% |
| Northern European | 43 | 0.1% |
| Norwegian | 625 | 0.9% |
| Pakistani | 63 | 0.1% |
| Palestinian | 233 | 0.3% |
| Panamanian | 12 | 0.0% |
| Pennsylvania German | 16 | 0.0% |
| Peruvian | 173 | 0.2% |
| Polish | 2,446 | 3.3% |
| Portuguese | 90 | 0.1% |
| Puerto Rican | 456 | 0.6% |
| Puget Sound Salish | 36 | 0.1% |
| Romanian | 205 | 0.3% |
| Russian | 1,154 | 1.6% |
| Salvadoran | 510 | 0.7% |
| Samoan | 8 | 0.0% |
| Scandinavian | 120 | 0.2% |
| Scotch-Irish | 533 | 0.7% |
| Scottish | 1,553 | 2.1% |
| Senegalese | 9 | 0.0% |
| Serbian | 29 | 0.0% |
| Sierra Leonean | 14 | 0.0% |
| Slavic | 53 | 0.1% |
| Slovak | 293 | 0.4% |
| Slovene | 30 | 0.0% |
| South African | 8 | 0.0% |
| South American | 566 | 0.8% |
| South American Indian | 64 | 0.1% |
| Spaniard | 125 | 0.2% |
| Spanish | 35 | 0.1% |
| Sri Lankan | 454 | 0.6% |
| Subsaharan African | 1,355 | 1.8% |
| Swedish | 580 | 0.8% |
| Swiss | 149 | 0.2% |
| Syrian | 26 | 0.0% |
| Thai | 9,508 | 12.9% |
| Trinidadian and Tobagonian | 35 | 0.1% |
| Turkish | 181 | 0.3% |
| Ukrainian | 211 | 0.3% |
| Uruguayan | 87 | 0.1% |
| Venezuelan | 147 | 0.2% |
| Vietnamese | 173 | 0.2% |
| Welsh | 412 | 0.6% |
| West Indian | 74 | 0.1% |
| Yugoslavian | 9 | 0.0% | View All 112 Rows |
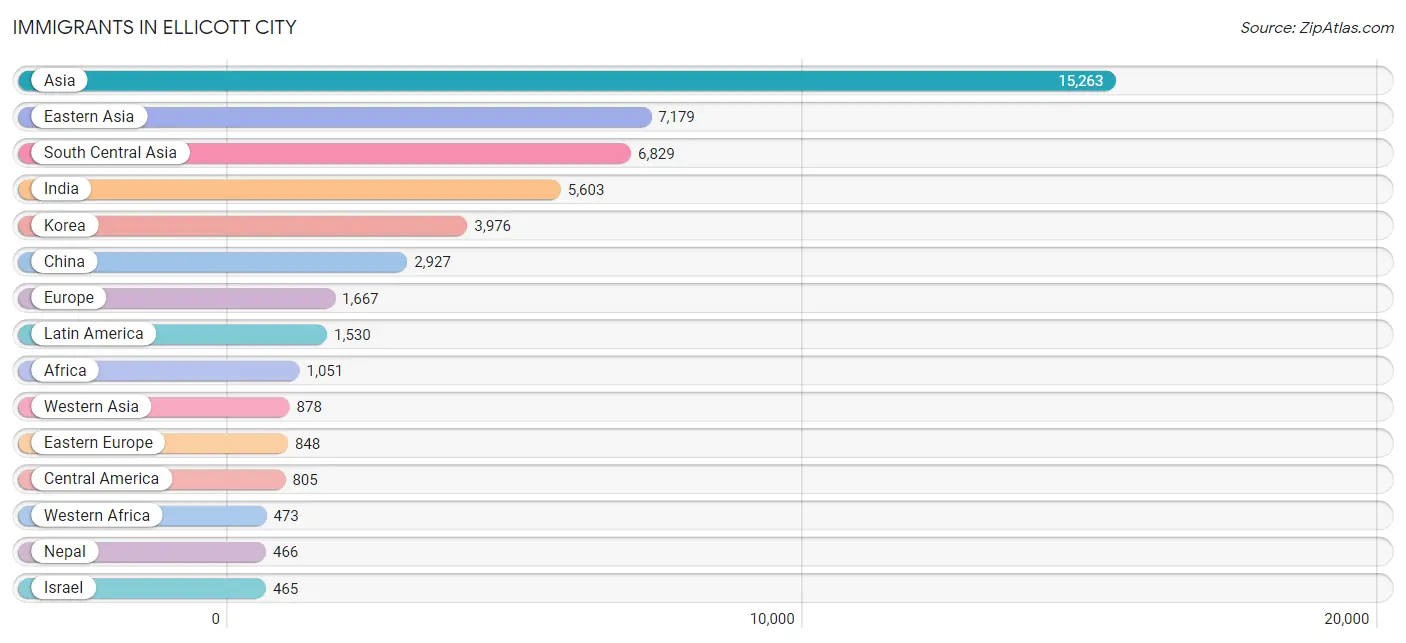
Immigrants in Ellicott City
The most numerous immigrant groups reported in Ellicott City came from Asia (15,263 | 20.7%), Eastern Asia (7,179 | 9.8%), South Central Asia (6,829 | 9.3%), India (5,603 | 7.6%), and Korea (3,976 | 5.4%), together accounting for 52.8% of all Ellicott City residents.
| Immigration Origin | # Population | % Population |
| Africa | 1,051 | 1.4% |
| Argentina | 20 | 0.0% |
| Asia | 15,263 | 20.7% |
| Australia | 34 | 0.1% |
| Austria | 8 | 0.0% |
| Bangladesh | 180 | 0.2% |
| Belarus | 83 | 0.1% |
| Brazil | 211 | 0.3% |
| Bulgaria | 9 | 0.0% |
| Cameroon | 86 | 0.1% |
| Canada | 123 | 0.2% |
| Caribbean | 350 | 0.5% |
| Central America | 805 | 1.1% |
| China | 2,927 | 4.0% |
| Colombia | 16 | 0.0% |
| Costa Rica | 28 | 0.0% |
| Croatia | 7 | 0.0% |
| Cuba | 56 | 0.1% |
| Czechoslovakia | 69 | 0.1% |
| Dominica | 15 | 0.0% |
| Dominican Republic | 43 | 0.1% |
| Eastern Africa | 273 | 0.4% |
| Eastern Asia | 7,179 | 9.8% |
| Eastern Europe | 848 | 1.1% |
| Ecuador | 12 | 0.0% |
| Egypt | 91 | 0.1% |
| El Salvador | 331 | 0.4% |
| England | 198 | 0.3% |
| Ethiopia | 210 | 0.3% |
| Europe | 1,667 | 2.3% |
| France | 49 | 0.1% |
| Germany | 181 | 0.3% |
| Ghana | 10 | 0.0% |
| Greece | 112 | 0.2% |
| Guatemala | 13 | 0.0% |
| Guyana | 1 | 0.0% |
| Haiti | 14 | 0.0% |
| Honduras | 312 | 0.4% |
| Hong Kong | 176 | 0.2% |
| Hungary | 15 | 0.0% |
| India | 5,603 | 7.6% |
| Iran | 259 | 0.4% |
| Ireland | 27 | 0.0% |
| Israel | 465 | 0.6% |
| Italy | 38 | 0.1% |
| Jamaica | 157 | 0.2% |
| Japan | 216 | 0.3% |
| Jordan | 272 | 0.4% |
| Kenya | 63 | 0.1% |
| Korea | 3,976 | 5.4% |
| Latin America | 1,530 | 2.1% |
| Latvia | 67 | 0.1% |
| Lebanon | 12 | 0.0% |
| Malaysia | 28 | 0.0% |
| Mexico | 84 | 0.1% |
| Middle Africa | 86 | 0.1% |
| Moldova | 12 | 0.0% |
| Morocco | 16 | 0.0% |
| Nepal | 466 | 0.6% |
| Nicaragua | 25 | 0.0% |
| Nigeria | 426 | 0.6% |
| Northern Africa | 160 | 0.2% |
| Northern Europe | 413 | 0.6% |
| Oceania | 42 | 0.1% |
| Pakistan | 292 | 0.4% |
| Panama | 12 | 0.0% |
| Peru | 56 | 0.1% |
| Philippines | 235 | 0.3% |
| Poland | 200 | 0.3% |
| Portugal | 18 | 0.0% |
| Romania | 27 | 0.0% |
| Russia | 123 | 0.2% |
| Scotland | 15 | 0.0% |
| Senegal | 9 | 0.0% |
| Serbia | 13 | 0.0% |
| Sierra Leone | 14 | 0.0% |
| Singapore | 8 | 0.0% |
| South Africa | 59 | 0.1% |
| South America | 375 | 0.5% |
| South Central Asia | 6,829 | 9.3% |
| South Eastern Asia | 377 | 0.5% |
| Southern Europe | 168 | 0.2% |
| Sri Lanka | 29 | 0.0% |
| Sudan | 32 | 0.0% |
| Sweden | 9 | 0.0% |
| Taiwan | 239 | 0.3% |
| Thailand | 17 | 0.0% |
| Trinidad and Tobago | 27 | 0.0% |
| Turkey | 64 | 0.1% |
| Ukraine | 72 | 0.1% |
| Uruguay | 14 | 0.0% |
| Venezuela | 45 | 0.1% |
| Vietnam | 89 | 0.1% |
| Western Africa | 473 | 0.6% |
| Western Asia | 878 | 1.2% |
| Western Europe | 238 | 0.3% |
| Yemen | 9 | 0.0% | View All 97 Rows |
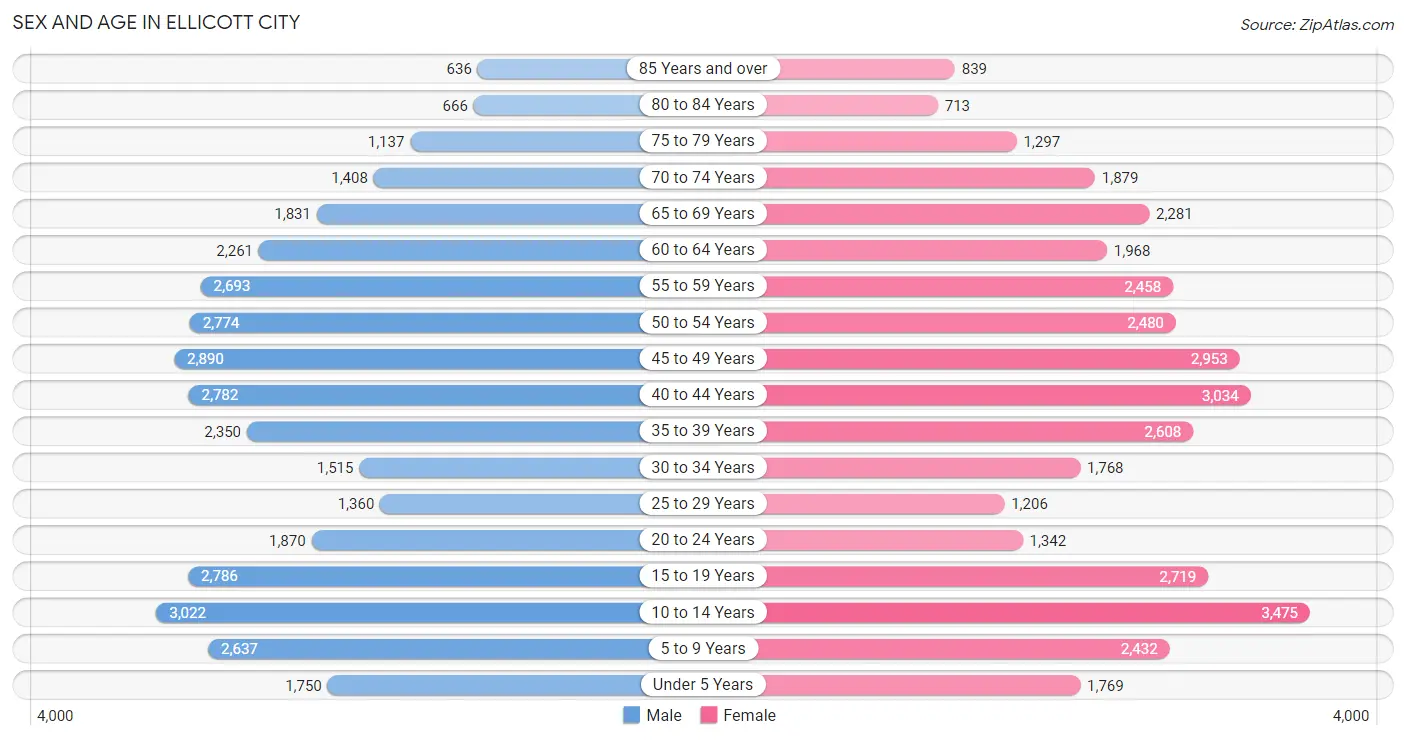
Sex and Age in Ellicott City
Sex and Age in Ellicott City
The most populous age groups in Ellicott City are 10 to 14 Years (3,022 | 8.3%) for men and 10 to 14 Years (3,475 | 9.3%) for women.
| Age Bracket | Male | Female |
| Under 5 Years | 1,750 (4.8%) | 1,769 (4.8%) |
| 5 to 9 Years | 2,637 (7.2%) | 2,432 (6.5%) |
| 10 to 14 Years | 3,022 (8.3%) | 3,475 (9.3%) |
| 15 to 19 Years | 2,786 (7.7%) | 2,719 (7.3%) |
| 20 to 24 Years | 1,870 (5.1%) | 1,342 (3.6%) |
| 25 to 29 Years | 1,360 (3.7%) | 1,206 (3.2%) |
| 30 to 34 Years | 1,515 (4.2%) | 1,768 (4.8%) |
| 35 to 39 Years | 2,350 (6.5%) | 2,608 (7.0%) |
| 40 to 44 Years | 2,782 (7.6%) | 3,034 (8.2%) |
| 45 to 49 Years | 2,890 (8.0%) | 2,953 (7.9%) |
| 50 to 54 Years | 2,774 (7.6%) | 2,480 (6.7%) |
| 55 to 59 Years | 2,693 (7.4%) | 2,458 (6.6%) |
| 60 to 64 Years | 2,261 (6.2%) | 1,968 (5.3%) |
| 65 to 69 Years | 1,831 (5.0%) | 2,281 (6.1%) |
| 70 to 74 Years | 1,408 (3.9%) | 1,879 (5.1%) |
| 75 to 79 Years | 1,137 (3.1%) | 1,297 (3.5%) |
| 80 to 84 Years | 666 (1.8%) | 713 (1.9%) |
| 85 Years and over | 636 (1.8%) | 839 (2.2%) |
| Total | 36,368 (100.0%) | 37,221 (100.0%) |
Families and Households in Ellicott City
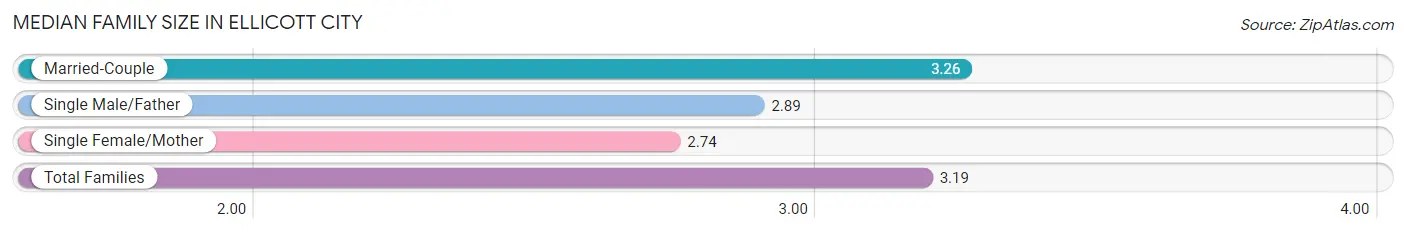
Median Family Size in Ellicott City
The median family size in Ellicott City is 3.19 persons per family, with married-couple families (17,315 | 84.9%) accounting for the largest median family size of 3.26 persons per family. On the other hand, single female/mother families (2,125 | 10.4%) represent the smallest median family size with 2.74 persons per family.
| Family Type | # Families | Family Size |
| Married-Couple | 17,315 (84.9%) | 3.26 |
| Single Male/Father | 960 (4.7%) | 2.89 |
| Single Female/Mother | 2,125 (10.4%) | 2.74 |
| Total Families | 20,400 (100.0%) | 3.19 |
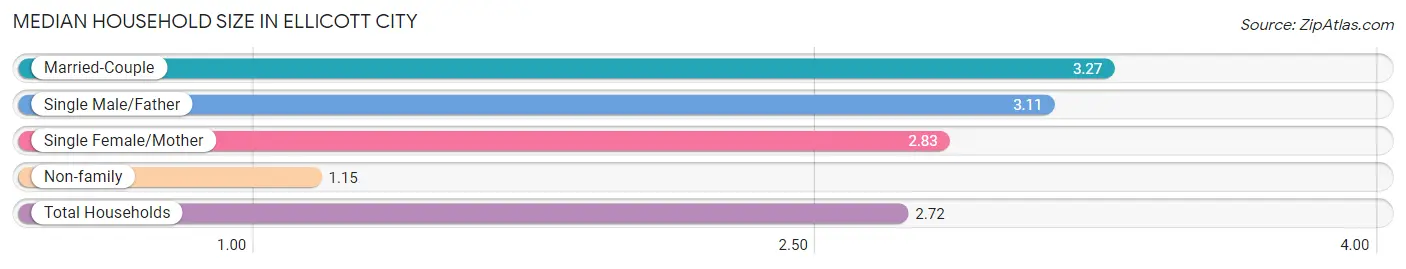
Median Household Size in Ellicott City
The median household size in Ellicott City is 2.72 persons per household, with married-couple households (17,315 | 64.4%) accounting for the largest median household size of 3.27 persons per household. non-family households (6,479 | 24.1%) represent the smallest median household size with 1.15 persons per household.
| Household Type | # Households | Household Size |
| Married-Couple | 17,315 (64.4%) | 3.27 |
| Single Male/Father | 960 (3.6%) | 3.11 |
| Single Female/Mother | 2,125 (7.9%) | 2.83 |
| Non-family | 6,479 (24.1%) | 1.15 |
| Total Households | 26,879 (100.0%) | 2.72 |
Household Size by Marriage Status in Ellicott City
Out of a total of 26,879 households in Ellicott City, 20,400 (75.9%) are family households, while 6,479 (24.1%) are nonfamily households. The most numerous type of family households are 2-person households, comprising 7,757, and the most common type of nonfamily households are 1-person households, comprising 5,684.
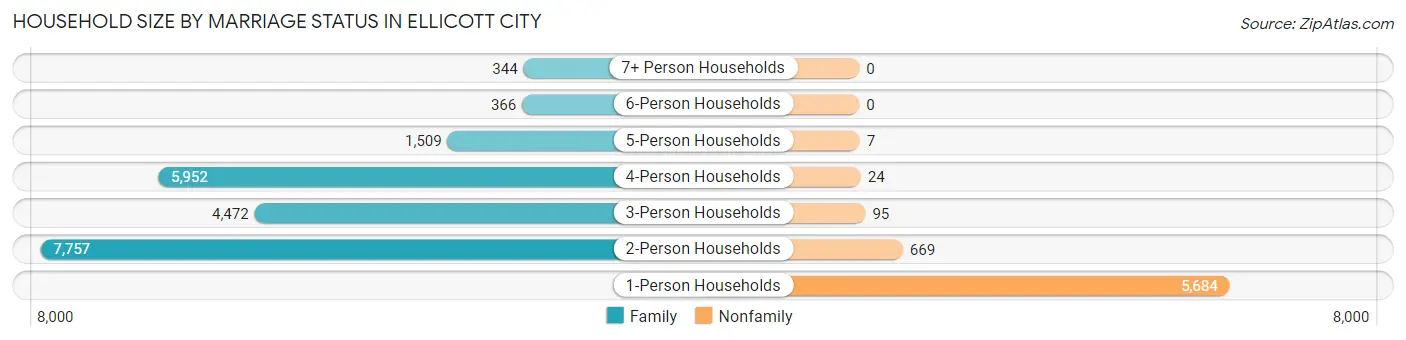
| Household Size | Family Households | Nonfamily Households |
| 1-Person Households | - | 5,684 (21.1%) |
| 2-Person Households | 7,757 (28.9%) | 669 (2.5%) |
| 3-Person Households | 4,472 (16.6%) | 95 (0.4%) |
| 4-Person Households | 5,952 (22.1%) | 24 (0.1%) |
| 5-Person Households | 1,509 (5.6%) | 7 (0.0%) |
| 6-Person Households | 366 (1.4%) | 0 (0.0%) |
| 7+ Person Households | 344 (1.3%) | 0 (0.0%) |
| Total | 20,400 (75.9%) | 6,479 (24.1%) |
Female Fertility in Ellicott City
Fertility by Age in Ellicott City
Average fertility rate in Ellicott City is 33.0 births per 1,000 women. Women in the age bracket of 20 to 34 years have the highest fertility rate with 87.0 births per 1,000 women. Women in the age bracket of 20 to 34 years acount for 70.2% of all women with births.
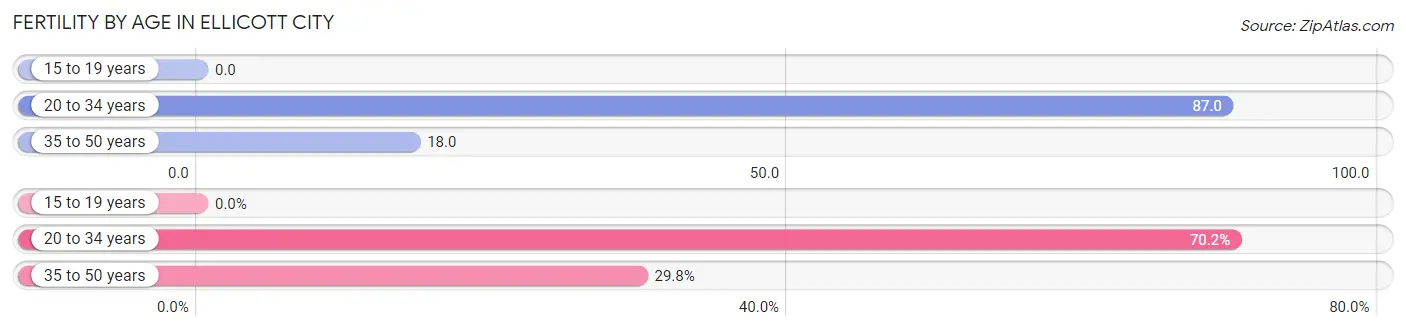
| Age Bracket | Women with Births | Births / 1,000 Women |
| 15 to 19 years | 0 (0.0%) | 0.0 |
| 20 to 34 years | 374 (70.2%) | 87.0 |
| 35 to 50 years | 159 (29.8%) | 18.0 |
| Total | 533 (100.0%) | 33.0 |
Fertility by Age by Marriage Status in Ellicott City
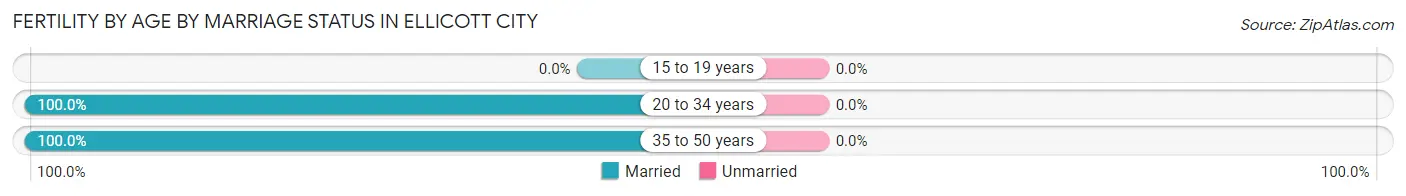
| Age Bracket | Married | Unmarried |
| 15 to 19 years | 0 (0.0%) | 0 (0.0%) |
| 20 to 34 years | 374 (100.0%) | 0 (0.0%) |
| 35 to 50 years | 159 (100.0%) | 0 (0.0%) |
| Total | 533 (100.0%) | 0 (0.0%) |
Fertility by Education in Ellicott City
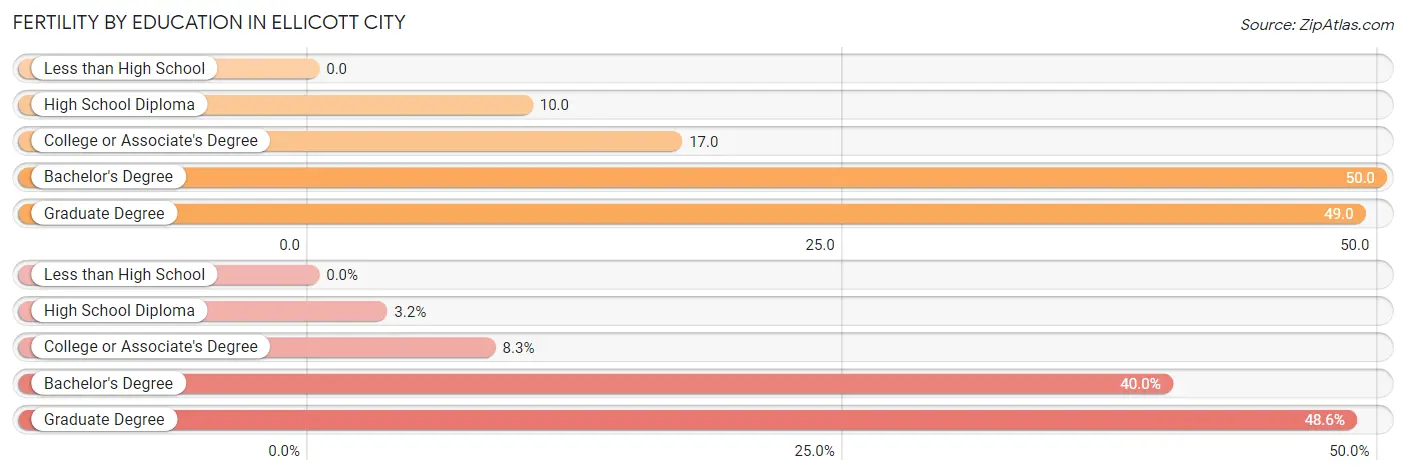
| Educational Attainment | Women with Births | Births / 1,000 Women |
| Less than High School | 0 (0.0%) | 0.0 |
| High School Diploma | 17 (3.2%) | 10.0 |
| College or Associate's Degree | 44 (8.3%) | 17.0 |
| Bachelor's Degree | 213 (40.0%) | 50.0 |
| Graduate Degree | 259 (48.6%) | 49.0 |
| Total | 533 (100.0%) | 33.0 |
Fertility by Education by Marriage Status in Ellicott City
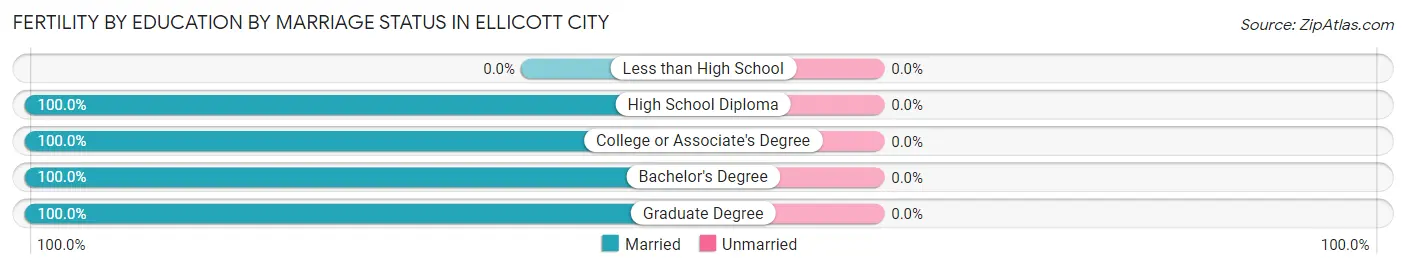
| Educational Attainment | Married | Unmarried |
| Less than High School | 0 (0.0%) | 0 (0.0%) |
| High School Diploma | 17 (100.0%) | 0 (0.0%) |
| College or Associate's Degree | 44 (100.0%) | 0 (0.0%) |
| Bachelor's Degree | 213 (100.0%) | 0 (0.0%) |
| Graduate Degree | 259 (100.0%) | 0 (0.0%) |
| Total | 533 (100.0%) | 0 (0.0%) |
Employment Characteristics in Ellicott City
Employment by Class of Employer in Ellicott City
Among the 36,369 employed individuals in Ellicott City, private company employees (19,996 | 55.0%), not-for-profit organizations (4,344 | 11.9%), and federal government employees (3,993 | 11.0%) make up the most common classes of employment.
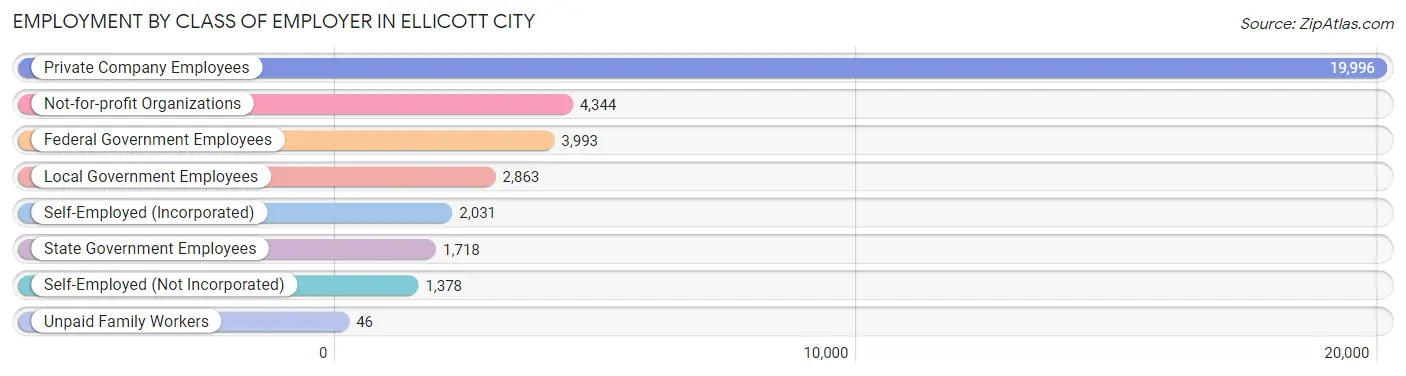
| Employer Class | # Employees | % Employees |
| Private Company Employees | 19,996 | 55.0% |
| Self-Employed (Incorporated) | 2,031 | 5.6% |
| Self-Employed (Not Incorporated) | 1,378 | 3.8% |
| Not-for-profit Organizations | 4,344 | 11.9% |
| Local Government Employees | 2,863 | 7.9% |
| State Government Employees | 1,718 | 4.7% |
| Federal Government Employees | 3,993 | 11.0% |
| Unpaid Family Workers | 46 | 0.1% |
| Total | 36,369 | 100.0% |
Employment Status by Age in Ellicott City
According to the labor force statistics for Ellicott City, out of the total population over 16 years of age (57,073), 66.9% or 38,182 individuals are in the labor force, with 3.3% or 1,260 of them unemployed. The age group with the highest labor force participation rate is 45 to 54 years, with 89.0% or 9,876 individuals in the labor force. Within the labor force, the 20 to 24 years age range has the highest percentage of unemployed individuals, with 14.6% or 332 of them being unemployed.
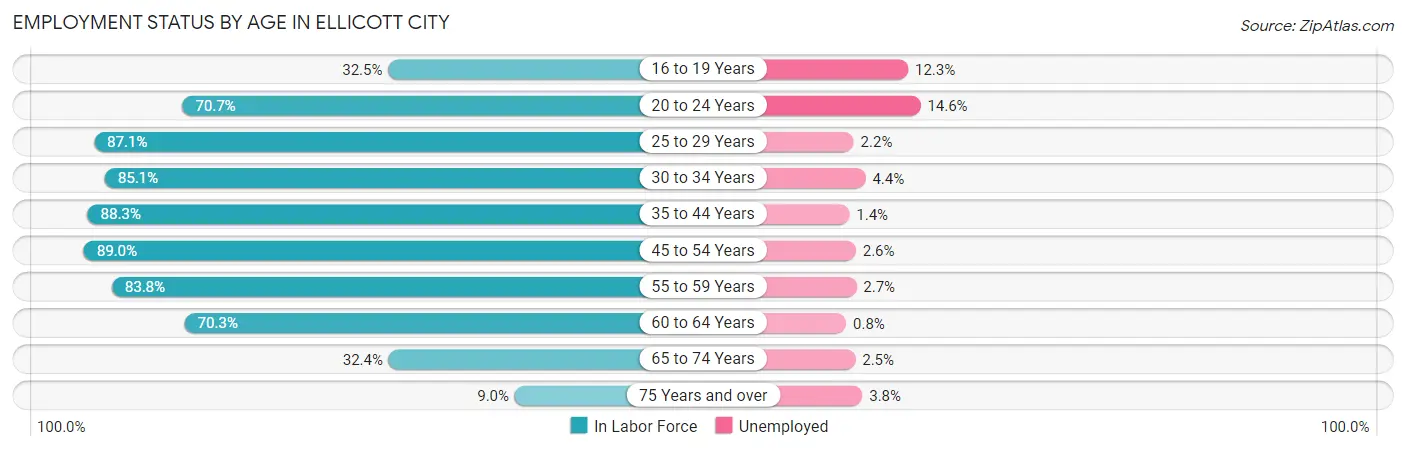
| Age Bracket | In Labor Force | Unemployed |
| 16 to 19 Years | 1,324 (32.5%) | 163 (12.3%) |
| 20 to 24 Years | 2,271 (70.7%) | 332 (14.6%) |
| 25 to 29 Years | 2,235 (87.1%) | 49 (2.2%) |
| 30 to 34 Years | 2,794 (85.1%) | 123 (4.4%) |
| 35 to 44 Years | 9,513 (88.3%) | 133 (1.4%) |
| 45 to 54 Years | 9,876 (89.0%) | 257 (2.6%) |
| 55 to 59 Years | 4,317 (83.8%) | 117 (2.7%) |
| 60 to 64 Years | 2,973 (70.3%) | 24 (0.8%) |
| 65 to 74 Years | 2,397 (32.4%) | 60 (2.5%) |
| 75 Years and over | 476 (9.0%) | 18 (3.8%) |
| Total | 38,182 (66.9%) | 1,260 (3.3%) |
Employment Status by Educational Attainment in Ellicott City
According to labor force statistics for Ellicott City, 85.5% of individuals (31,720) out of the total population between 25 and 64 years of age (37,100) are in the labor force, with 2.2% or 698 of them being unemployed. The group with the highest labor force participation rate are those with the educational attainment of bachelor's degree or higher, with 88.7% or 24,057 individuals in the labor force. Within the labor force, individuals with high school diploma education have the highest percentage of unemployment, with 5.4% or 138 of them being unemployed.
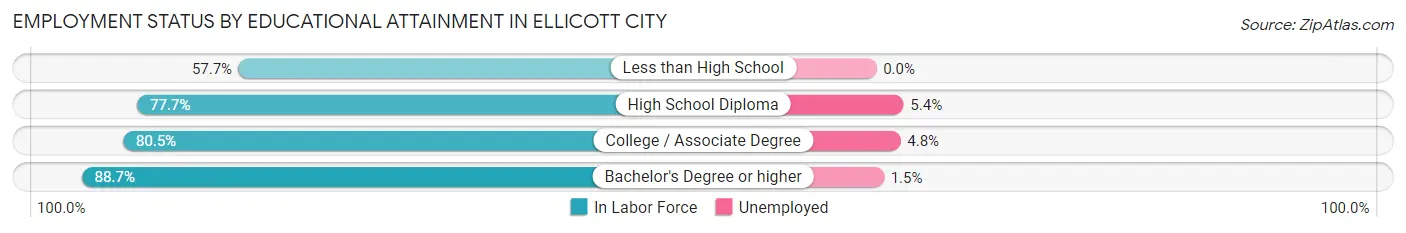
| Educational Attainment | In Labor Force | Unemployed |
| Less than High School | 725 (57.7%) | 0 (0.0%) |
| High School Diploma | 2,556 (77.7%) | 178 (5.4%) |
| College / Associate Degree | 4,373 (80.5%) | 261 (4.8%) |
| Bachelor's Degree or higher | 24,057 (88.7%) | 407 (1.5%) |
| Total | 31,720 (85.5%) | 816 (2.2%) |
Employment Occupations by Sex in Ellicott City
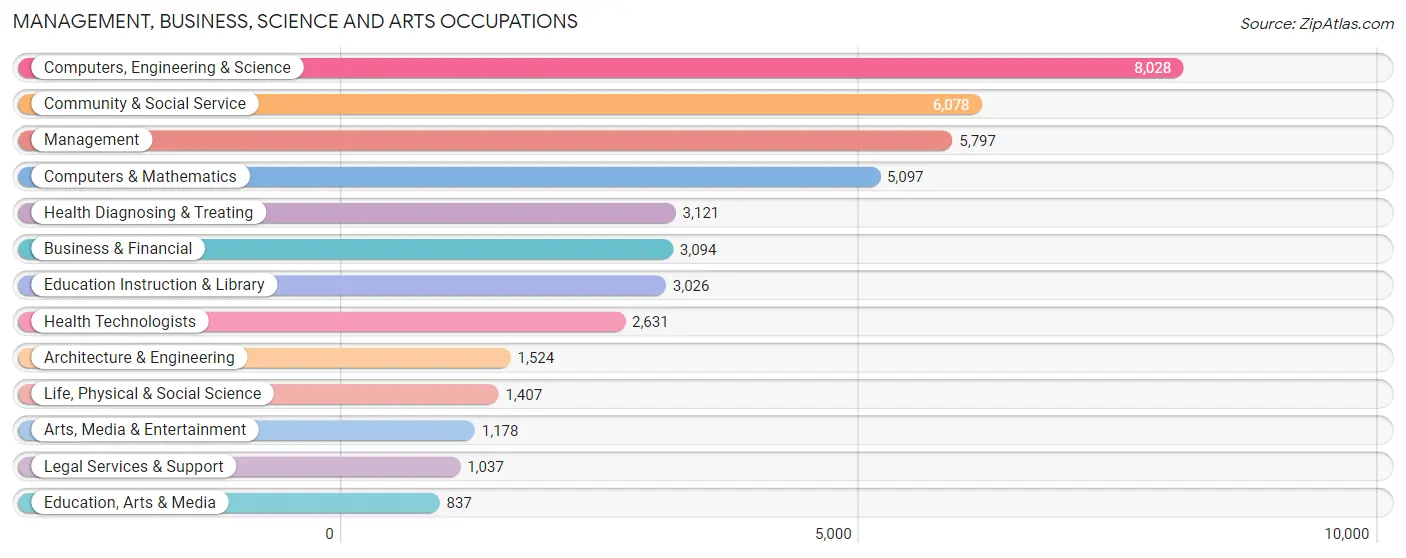
Management, Business, Science and Arts Occupations
The most common Management, Business, Science and Arts occupations in Ellicott City are Computers, Engineering & Science (8,028 | 21.9%), Community & Social Service (6,078 | 16.6%), Management (5,797 | 15.8%), Computers & Mathematics (5,097 | 13.9%), and Health Diagnosing & Treating (3,121 | 8.5%).
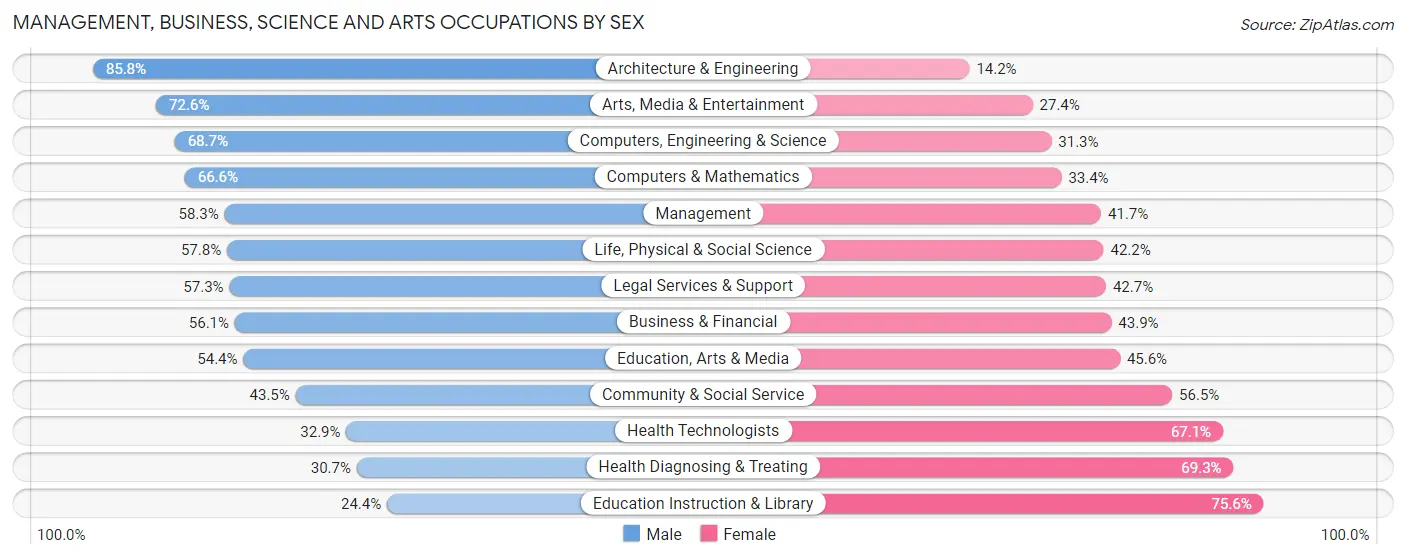
Management, Business, Science and Arts Occupations by Sex
Within the Management, Business, Science and Arts occupations in Ellicott City, the most male-oriented occupations are Architecture & Engineering (85.8%), Arts, Media & Entertainment (72.6%), and Computers, Engineering & Science (68.7%), while the most female-oriented occupations are Education Instruction & Library (75.6%), Health Diagnosing & Treating (69.3%), and Health Technologists (67.1%).
| Occupation | Male | Female |
| Management | 3,379 (58.3%) | 2,418 (41.7%) |
| Business & Financial | 1,737 (56.1%) | 1,357 (43.9%) |
| Computers, Engineering & Science | 5,513 (68.7%) | 2,515 (31.3%) |
| Computers & Mathematics | 3,393 (66.6%) | 1,704 (33.4%) |
| Architecture & Engineering | 1,307 (85.8%) | 217 (14.2%) |
| Life, Physical & Social Science | 813 (57.8%) | 594 (42.2%) |
| Community & Social Service | 2,642 (43.5%) | 3,436 (56.5%) |
| Education, Arts & Media | 455 (54.4%) | 382 (45.6%) |
| Legal Services & Support | 594 (57.3%) | 443 (42.7%) |
| Education Instruction & Library | 738 (24.4%) | 2,288 (75.6%) |
| Arts, Media & Entertainment | 855 (72.6%) | 323 (27.4%) |
| Health Diagnosing & Treating | 958 (30.7%) | 2,163 (69.3%) |
| Health Technologists | 865 (32.9%) | 1,766 (67.1%) |
| Total (Category) | 14,229 (54.5%) | 11,889 (45.5%) |
| Total (Overall) | 19,919 (54.4%) | 16,710 (45.6%) |
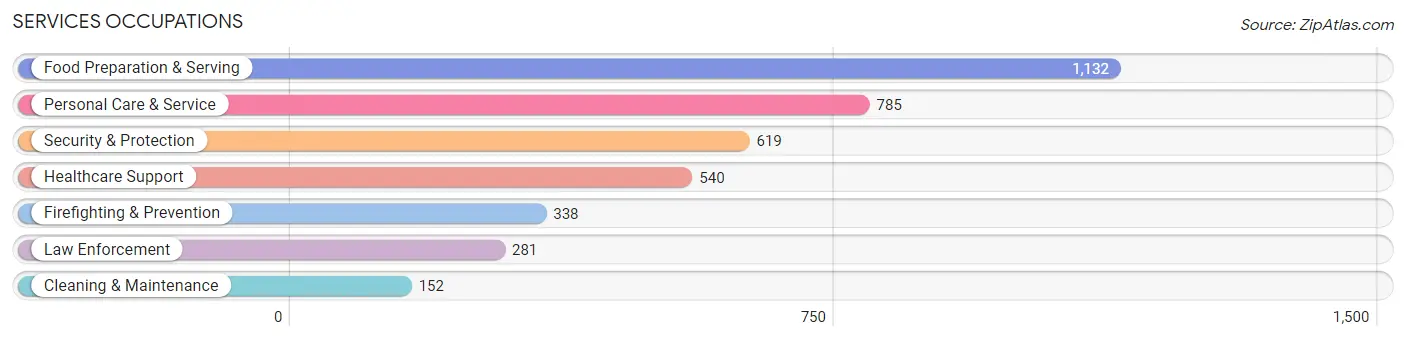
Services Occupations
The most common Services occupations in Ellicott City are Food Preparation & Serving (1,132 | 3.1%), Personal Care & Service (785 | 2.1%), Security & Protection (619 | 1.7%), Healthcare Support (540 | 1.5%), and Firefighting & Prevention (338 | 0.9%).
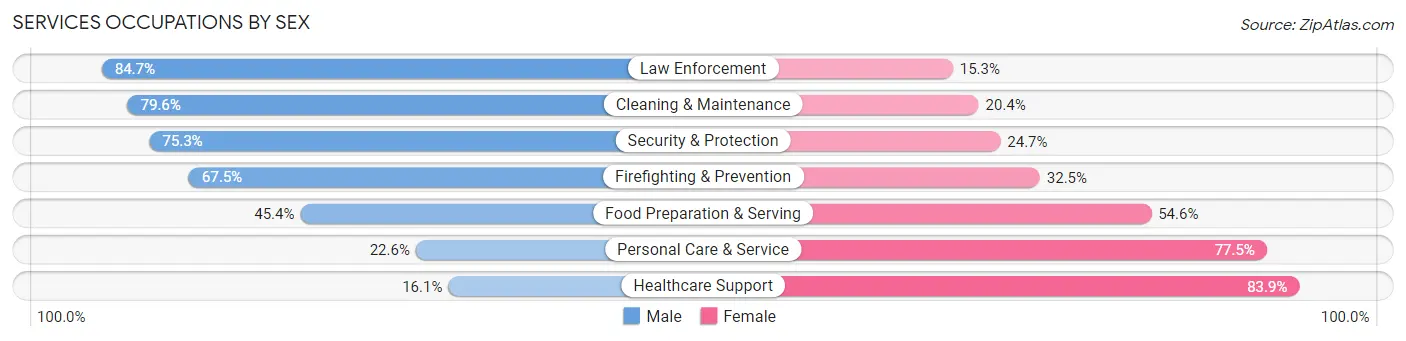
Services Occupations by Sex
Within the Services occupations in Ellicott City, the most male-oriented occupations are Law Enforcement (84.7%), Cleaning & Maintenance (79.6%), and Security & Protection (75.3%), while the most female-oriented occupations are Healthcare Support (83.9%), Personal Care & Service (77.4%), and Food Preparation & Serving (54.6%).
| Occupation | Male | Female |
| Healthcare Support | 87 (16.1%) | 453 (83.9%) |
| Security & Protection | 466 (75.3%) | 153 (24.7%) |
| Firefighting & Prevention | 228 (67.5%) | 110 (32.5%) |
| Law Enforcement | 238 (84.7%) | 43 (15.3%) |
| Food Preparation & Serving | 514 (45.4%) | 618 (54.6%) |
| Cleaning & Maintenance | 121 (79.6%) | 31 (20.4%) |
| Personal Care & Service | 177 (22.6%) | 608 (77.4%) |
| Total (Category) | 1,365 (42.3%) | 1,863 (57.7%) |
| Total (Overall) | 19,919 (54.4%) | 16,710 (45.6%) |
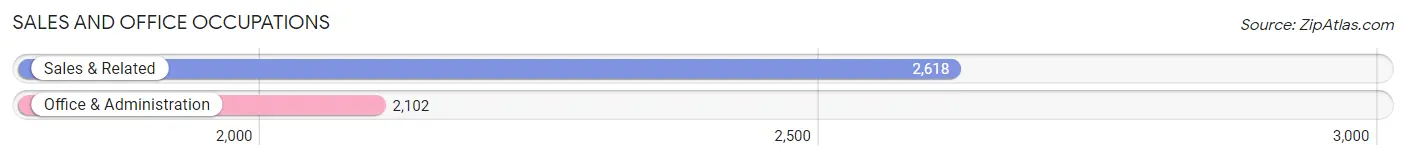
Sales and Office Occupations
The most common Sales and Office occupations in Ellicott City are Sales & Related (2,618 | 7.1%), and Office & Administration (2,102 | 5.7%).
Sales and Office Occupations by Sex
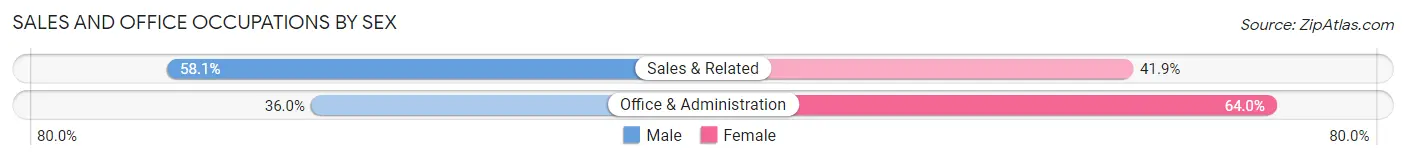
| Occupation | Male | Female |
| Sales & Related | 1,520 (58.1%) | 1,098 (41.9%) |
| Office & Administration | 756 (36.0%) | 1,346 (64.0%) |
| Total (Category) | 2,276 (48.2%) | 2,444 (51.8%) |
| Total (Overall) | 19,919 (54.4%) | 16,710 (45.6%) |
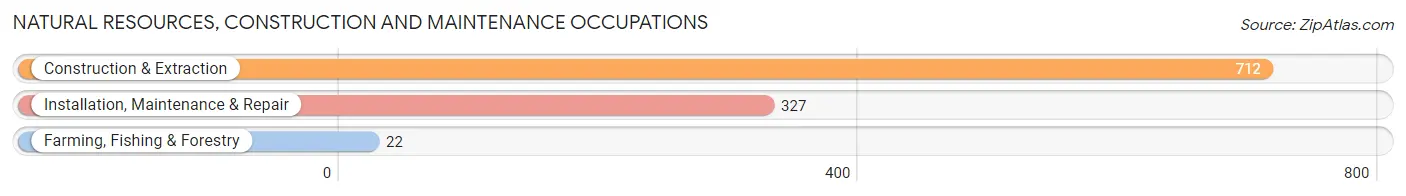
Natural Resources, Construction and Maintenance Occupations
The most common Natural Resources, Construction and Maintenance occupations in Ellicott City are Construction & Extraction (712 | 1.9%), Installation, Maintenance & Repair (327 | 0.9%), and Farming, Fishing & Forestry (22 | 0.1%).
Natural Resources, Construction and Maintenance Occupations by Sex
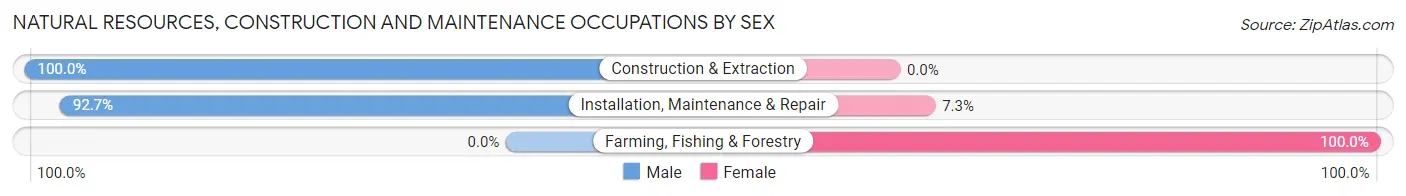
| Occupation | Male | Female |
| Farming, Fishing & Forestry | 0 (0.0%) | 22 (100.0%) |
| Construction & Extraction | 712 (100.0%) | 0 (0.0%) |
| Installation, Maintenance & Repair | 303 (92.7%) | 24 (7.3%) |
| Total (Category) | 1,015 (95.7%) | 46 (4.3%) |
| Total (Overall) | 19,919 (54.4%) | 16,710 (45.6%) |
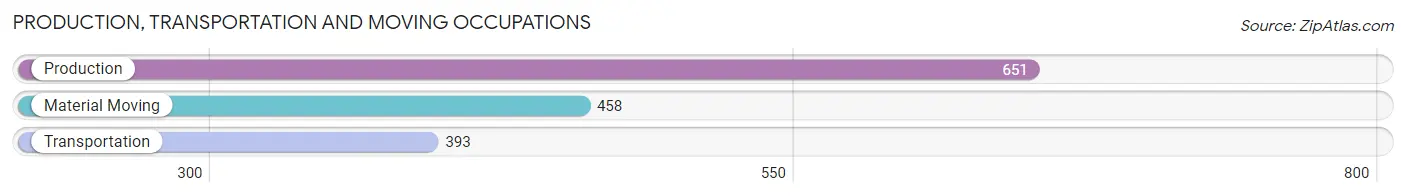
Production, Transportation and Moving Occupations
The most common Production, Transportation and Moving occupations in Ellicott City are Production (651 | 1.8%), Material Moving (458 | 1.3%), and Transportation (393 | 1.1%).
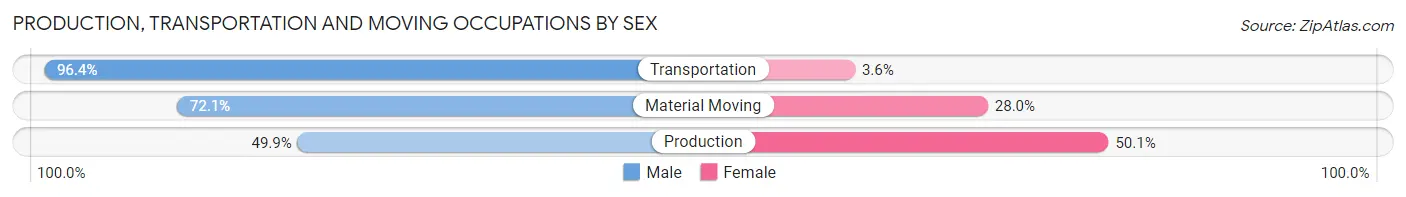
Production, Transportation and Moving Occupations by Sex
| Occupation | Male | Female |
| Production | 325 (49.9%) | 326 (50.1%) |
| Transportation | 379 (96.4%) | 14 (3.6%) |
| Material Moving | 330 (72.1%) | 128 (28.0%) |
| Total (Category) | 1,034 (68.8%) | 468 (31.2%) |
| Total (Overall) | 19,919 (54.4%) | 16,710 (45.6%) |
Employment Industries by Sex in Ellicott City
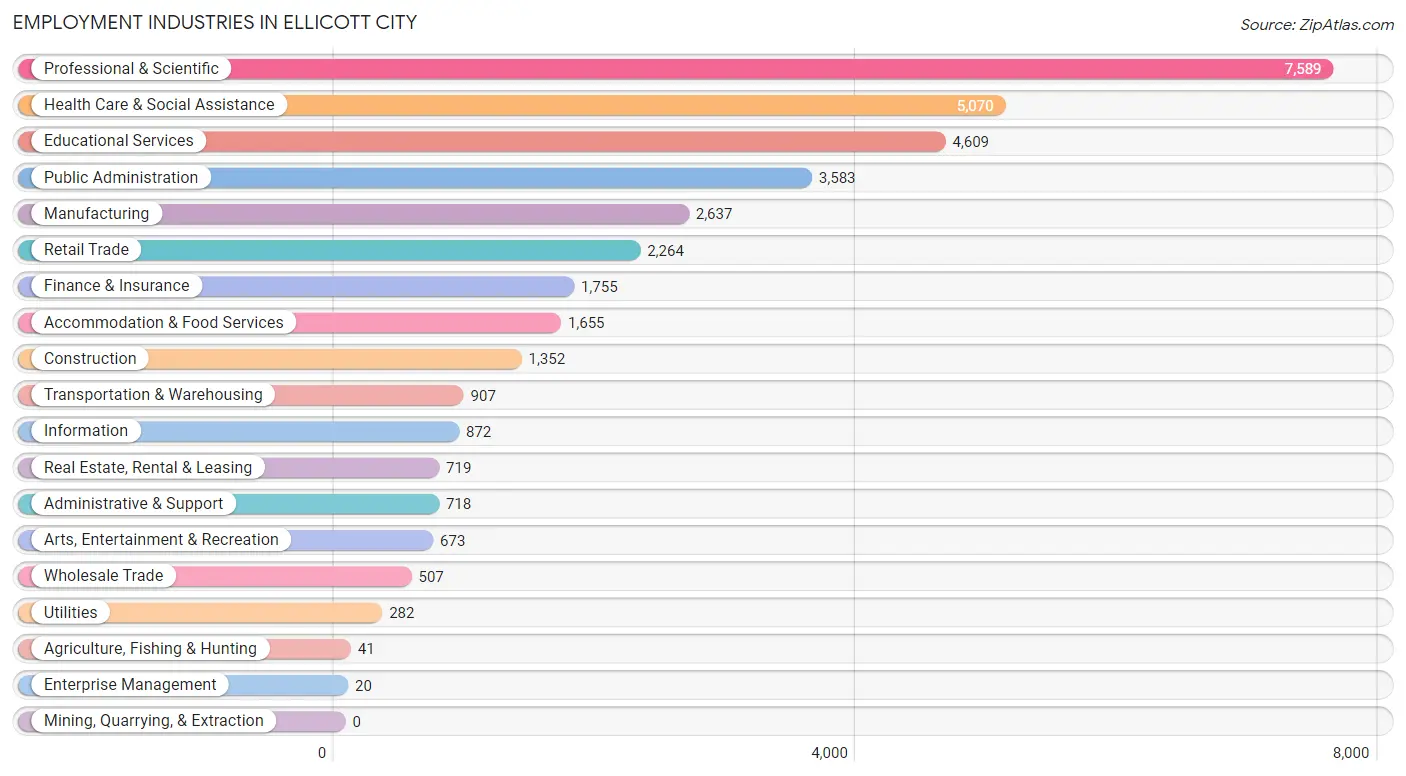
Employment Industries in Ellicott City
The major employment industries in Ellicott City include Professional & Scientific (7,589 | 20.7%), Health Care & Social Assistance (5,070 | 13.8%), Educational Services (4,609 | 12.6%), Public Administration (3,583 | 9.8%), and Manufacturing (2,637 | 7.2%).
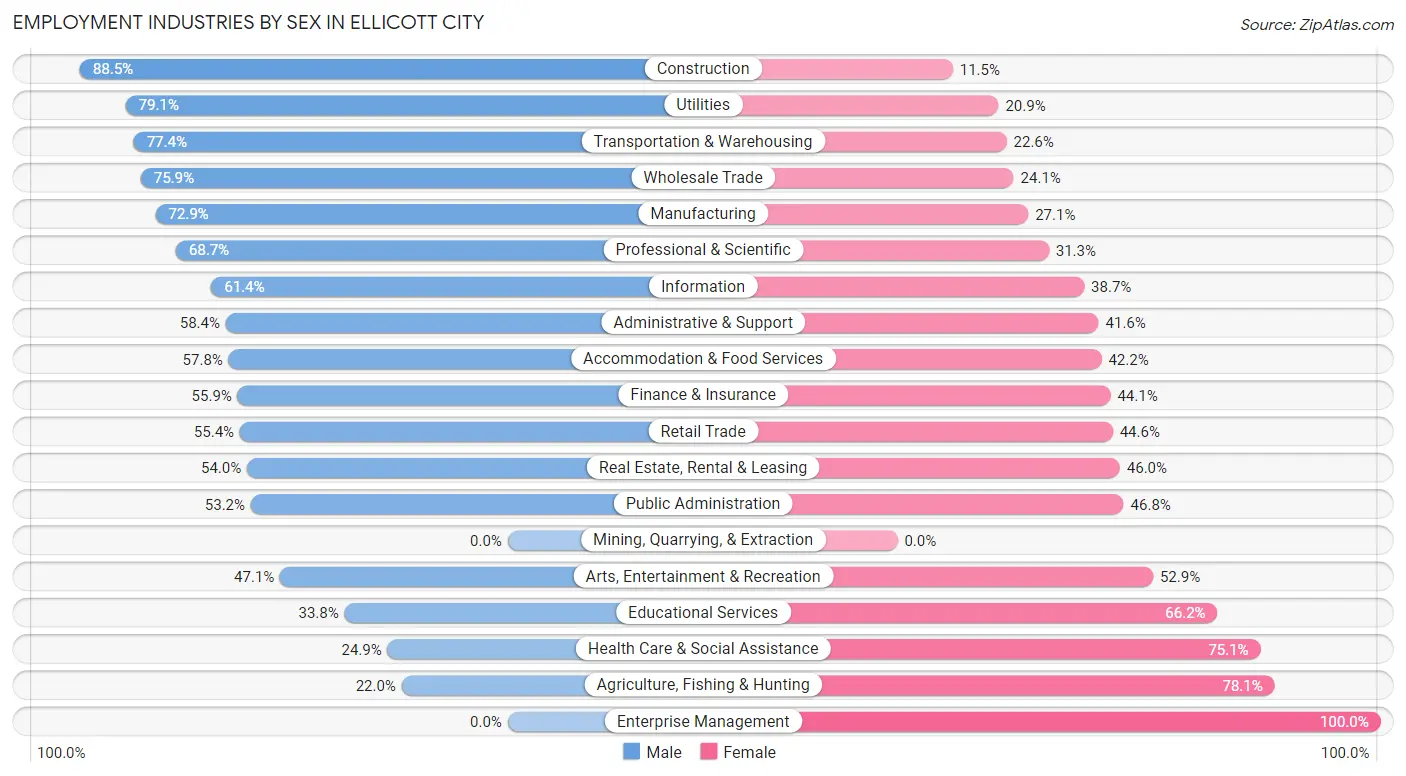
Employment Industries by Sex in Ellicott City
The Ellicott City industries that see more men than women are Construction (88.5%), Utilities (79.1%), and Transportation & Warehousing (77.4%), whereas the industries that tend to have a higher number of women are Enterprise Management (100.0%), Agriculture, Fishing & Hunting (78.0%), and Health Care & Social Assistance (75.1%).
| Industry | Male | Female |
| Agriculture, Fishing & Hunting | 9 (22.0%) | 32 (78.0%) |
| Mining, Quarrying, & Extraction | 0 (0.0%) | 0 (0.0%) |
| Construction | 1,197 (88.5%) | 155 (11.5%) |
| Manufacturing | 1,923 (72.9%) | 714 (27.1%) |
| Wholesale Trade | 385 (75.9%) | 122 (24.1%) |
| Retail Trade | 1,255 (55.4%) | 1,009 (44.6%) |
| Transportation & Warehousing | 702 (77.4%) | 205 (22.6%) |
| Utilities | 223 (79.1%) | 59 (20.9%) |
| Information | 535 (61.4%) | 337 (38.7%) |
| Finance & Insurance | 981 (55.9%) | 774 (44.1%) |
| Real Estate, Rental & Leasing | 388 (54.0%) | 331 (46.0%) |
| Professional & Scientific | 5,211 (68.7%) | 2,378 (31.3%) |
| Enterprise Management | 0 (0.0%) | 20 (100.0%) |
| Administrative & Support | 419 (58.4%) | 299 (41.6%) |
| Educational Services | 1,557 (33.8%) | 3,052 (66.2%) |
| Health Care & Social Assistance | 1,261 (24.9%) | 3,809 (75.1%) |
| Arts, Entertainment & Recreation | 317 (47.1%) | 356 (52.9%) |
| Accommodation & Food Services | 956 (57.8%) | 699 (42.2%) |
| Public Administration | 1,905 (53.2%) | 1,678 (46.8%) |
| Total | 19,919 (54.4%) | 16,710 (45.6%) |
Education in Ellicott City
School Enrollment in Ellicott City
The most common levels of schooling among the 21,405 students in Ellicott City are middle school (5,246 | 24.5%), high school (5,126 | 23.9%), and elementary school (4,215 | 19.7%).
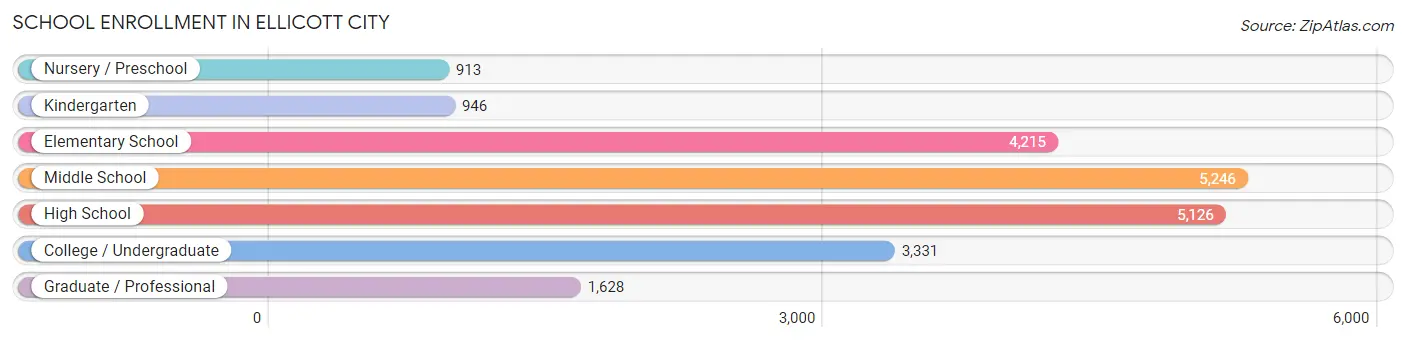
| School Level | # Students | % Students |
| Nursery / Preschool | 913 | 4.3% |
| Kindergarten | 946 | 4.4% |
| Elementary School | 4,215 | 19.7% |
| Middle School | 5,246 | 24.5% |
| High School | 5,126 | 23.9% |
| College / Undergraduate | 3,331 | 15.6% |
| Graduate / Professional | 1,628 | 7.6% |
| Total | 21,405 | 100.0% |
School Enrollment by Age by Funding Source in Ellicott City
Out of a total of 21,405 students who are enrolled in schools in Ellicott City, 2,954 (13.8%) attend a private institution, while the remaining 18,451 (86.2%) are enrolled in public schools. The age group of 3 to 4 year olds has the highest likelihood of being enrolled in private schools, with 690 (87.1% in the age bracket) enrolled. Conversely, the age group of 10 to 14 year olds has the lowest likelihood of being enrolled in a private school, with 6,001 (93.3% in the age bracket) attending a public institution.
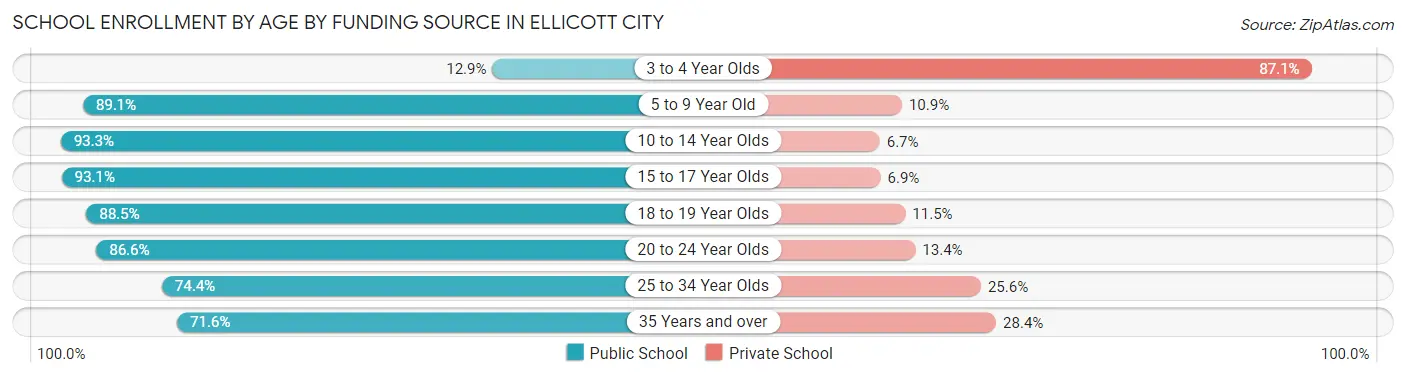
| Age Bracket | Public School | Private School |
| 3 to 4 Year Olds | 102 (12.9%) | 690 (87.1%) |
| 5 to 9 Year Old | 4,268 (89.1%) | 520 (10.9%) |
| 10 to 14 Year Olds | 6,001 (93.3%) | 433 (6.7%) |
| 15 to 17 Year Olds | 3,531 (93.1%) | 261 (6.9%) |
| 18 to 19 Year Olds | 1,270 (88.5%) | 165 (11.5%) |
| 20 to 24 Year Olds | 1,596 (86.6%) | 246 (13.4%) |
| 25 to 34 Year Olds | 672 (74.4%) | 231 (25.6%) |
| 35 Years and over | 1,016 (71.6%) | 403 (28.4%) |
| Total | 18,451 (86.2%) | 2,954 (13.8%) |
Educational Attainment by Field of Study in Ellicott City
Business (6,479 | 17.5%), engineering (5,203 | 14.1%), computers & mathematics (3,466 | 9.4%), science & technology (3,231 | 8.7%), and education (2,838 | 7.7%) are the most common fields of study among 36,950 individuals in Ellicott City who have obtained a bachelor's degree or higher.
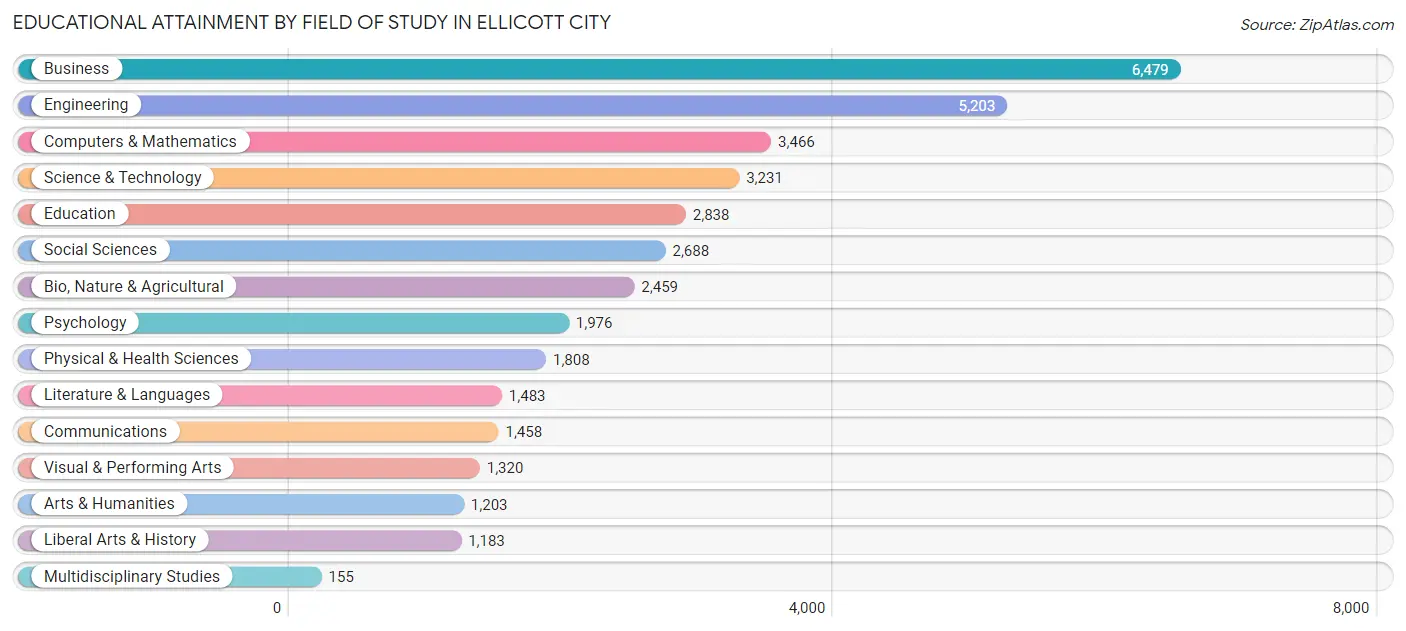
| Field of Study | # Graduates | % Graduates |
| Computers & Mathematics | 3,466 | 9.4% |
| Bio, Nature & Agricultural | 2,459 | 6.7% |
| Physical & Health Sciences | 1,808 | 4.9% |
| Psychology | 1,976 | 5.3% |
| Social Sciences | 2,688 | 7.3% |
| Engineering | 5,203 | 14.1% |
| Multidisciplinary Studies | 155 | 0.4% |
| Science & Technology | 3,231 | 8.7% |
| Business | 6,479 | 17.5% |
| Education | 2,838 | 7.7% |
| Literature & Languages | 1,483 | 4.0% |
| Liberal Arts & History | 1,183 | 3.2% |
| Visual & Performing Arts | 1,320 | 3.6% |
| Communications | 1,458 | 4.0% |
| Arts & Humanities | 1,203 | 3.3% |
| Total | 36,950 | 100.0% |
Transportation & Commute in Ellicott City
Vehicle Availability by Sex in Ellicott City
The most prevalent vehicle ownership categories in Ellicott City are males with 2 vehicles (9,147, accounting for 45.9%) and females with 2 vehicles (6,995, making up 55.7%).
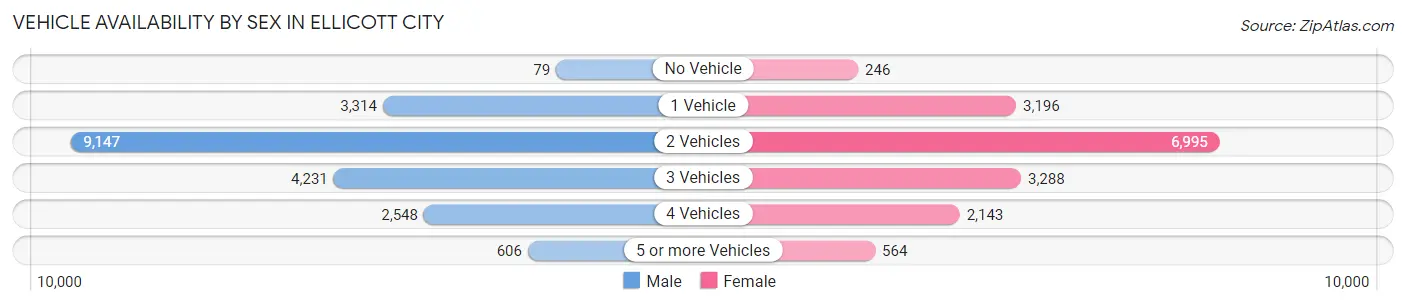
| Vehicles Available | Male | Female |
| No Vehicle | 79 (0.4%) | 246 (1.5%) |
| 1 Vehicle | 3,314 (16.6%) | 3,196 (19.5%) |
| 2 Vehicles | 9,147 (45.9%) | 6,995 (42.6%) |
| 3 Vehicles | 4,231 (21.2%) | 3,288 (20.0%) |
| 4 Vehicles | 2,548 (12.8%) | 2,143 (13.0%) |
| 5 or more Vehicles | 606 (3.0%) | 564 (3.4%) |
| Total | 19,925 (100.0%) | 16,432 (100.0%) |
Commute Time in Ellicott City
The most frequently occuring commute durations in Ellicott City are 30 to 34 minutes (4,597 commuters, 15.8%), 20 to 24 minutes (4,515 commuters, 15.5%), and 15 to 19 minutes (4,194 commuters, 14.4%).
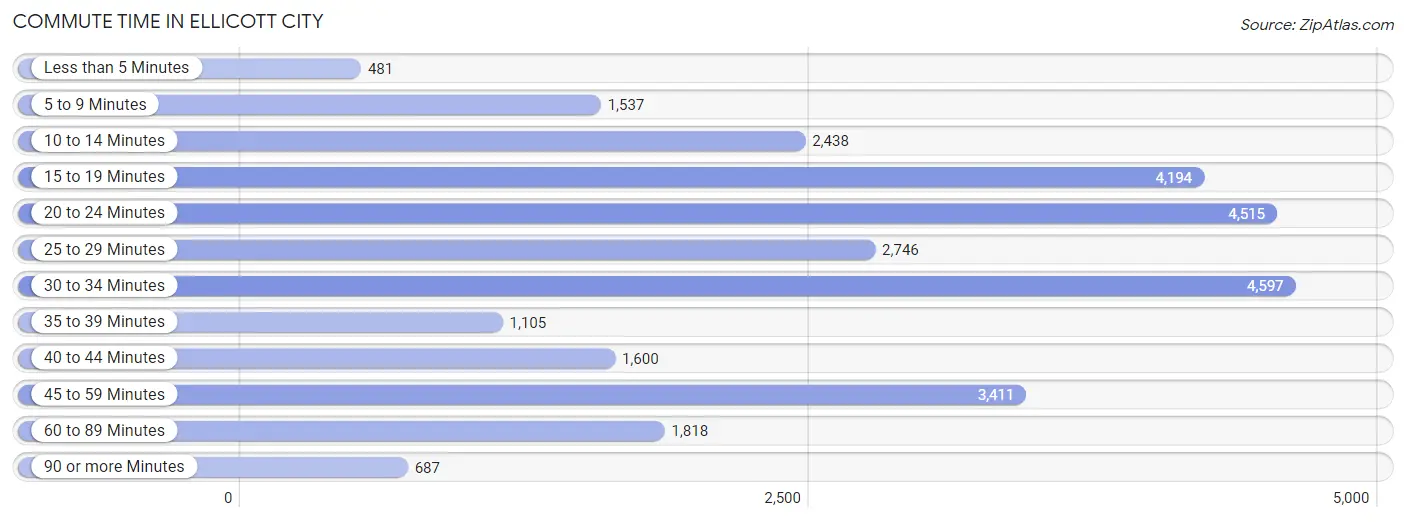
| Commute Time | # Commuters | % Commuters |
| Less than 5 Minutes | 481 | 1.7% |
| 5 to 9 Minutes | 1,537 | 5.3% |
| 10 to 14 Minutes | 2,438 | 8.4% |
| 15 to 19 Minutes | 4,194 | 14.4% |
| 20 to 24 Minutes | 4,515 | 15.5% |
| 25 to 29 Minutes | 2,746 | 9.4% |
| 30 to 34 Minutes | 4,597 | 15.8% |
| 35 to 39 Minutes | 1,105 | 3.8% |
| 40 to 44 Minutes | 1,600 | 5.5% |
| 45 to 59 Minutes | 3,411 | 11.7% |
| 60 to 89 Minutes | 1,818 | 6.2% |
| 90 or more Minutes | 687 | 2.4% |
Commute Time by Sex in Ellicott City
The most common commute times in Ellicott City are 30 to 34 minutes (2,719 commuters, 16.7%) for males and 15 to 19 minutes (2,263 commuters, 17.6%) for females.
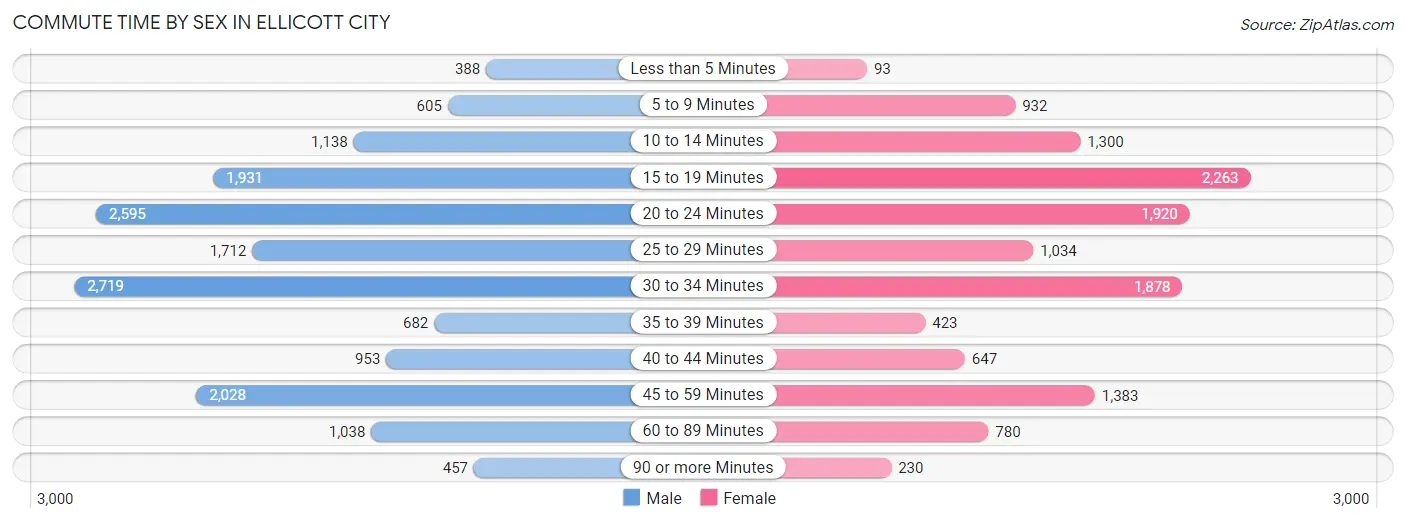
| Commute Time | Male | Female |
| Less than 5 Minutes | 388 (2.4%) | 93 (0.7%) |
| 5 to 9 Minutes | 605 (3.7%) | 932 (7.2%) |
| 10 to 14 Minutes | 1,138 (7.0%) | 1,300 (10.1%) |
| 15 to 19 Minutes | 1,931 (11.9%) | 2,263 (17.6%) |
| 20 to 24 Minutes | 2,595 (16.0%) | 1,920 (14.9%) |
| 25 to 29 Minutes | 1,712 (10.5%) | 1,034 (8.0%) |
| 30 to 34 Minutes | 2,719 (16.7%) | 1,878 (14.6%) |
| 35 to 39 Minutes | 682 (4.2%) | 423 (3.3%) |
| 40 to 44 Minutes | 953 (5.9%) | 647 (5.0%) |
| 45 to 59 Minutes | 2,028 (12.5%) | 1,383 (10.7%) |
| 60 to 89 Minutes | 1,038 (6.4%) | 780 (6.0%) |
| 90 or more Minutes | 457 (2.8%) | 230 (1.8%) |
Time of Departure to Work by Sex in Ellicott City
The most frequent times of departure to work in Ellicott City are 8:00 AM to 8:29 AM (2,503, 15.4%) for males and 8:00 AM to 8:29 AM (2,321, 18.0%) for females.
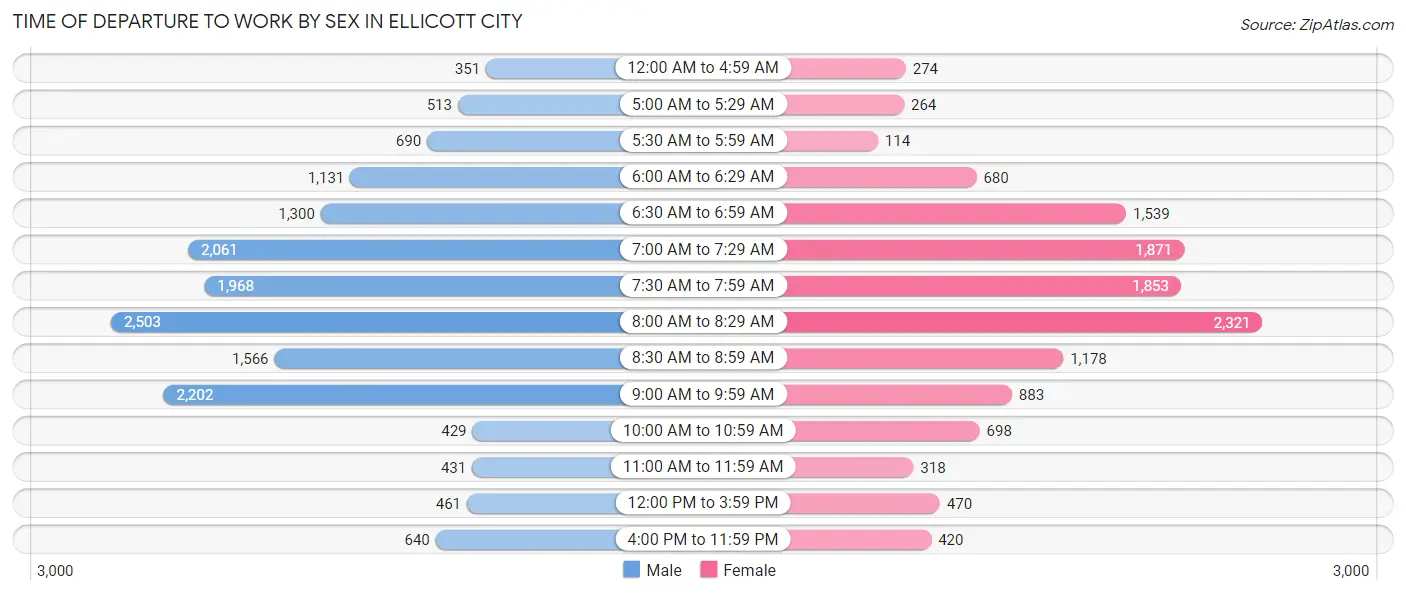
| Time of Departure | Male | Female |
| 12:00 AM to 4:59 AM | 351 (2.2%) | 274 (2.1%) |
| 5:00 AM to 5:29 AM | 513 (3.2%) | 264 (2.1%) |
| 5:30 AM to 5:59 AM | 690 (4.3%) | 114 (0.9%) |
| 6:00 AM to 6:29 AM | 1,131 (7.0%) | 680 (5.3%) |
| 6:30 AM to 6:59 AM | 1,300 (8.0%) | 1,539 (11.9%) |
| 7:00 AM to 7:29 AM | 2,061 (12.7%) | 1,871 (14.5%) |
| 7:30 AM to 7:59 AM | 1,968 (12.1%) | 1,853 (14.4%) |
| 8:00 AM to 8:29 AM | 2,503 (15.4%) | 2,321 (18.0%) |
| 8:30 AM to 8:59 AM | 1,566 (9.6%) | 1,178 (9.1%) |
| 9:00 AM to 9:59 AM | 2,202 (13.6%) | 883 (6.9%) |
| 10:00 AM to 10:59 AM | 429 (2.6%) | 698 (5.4%) |
| 11:00 AM to 11:59 AM | 431 (2.6%) | 318 (2.5%) |
| 12:00 PM to 3:59 PM | 461 (2.8%) | 470 (3.6%) |
| 4:00 PM to 11:59 PM | 640 (3.9%) | 420 (3.3%) |
| Total | 16,246 (100.0%) | 12,883 (100.0%) |
Housing Occupancy in Ellicott City
Occupancy by Ownership in Ellicott City
Of the total 26,879 dwellings in Ellicott City, owner-occupied units account for 19,361 (72.0%), while renter-occupied units make up 7,518 (28.0%).
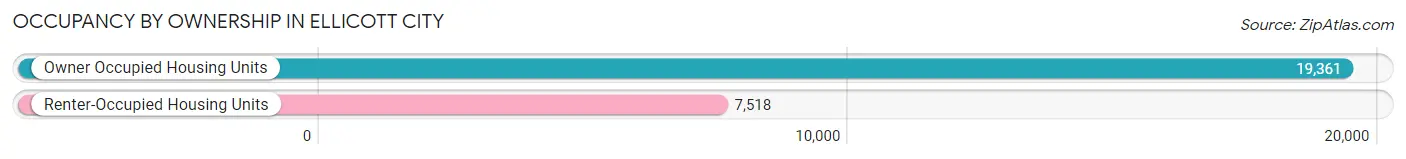
| Occupancy | # Housing Units | % Housing Units |
| Owner Occupied Housing Units | 19,361 | 72.0% |
| Renter-Occupied Housing Units | 7,518 | 28.0% |
| Total Occupied Housing Units | 26,879 | 100.0% |
Occupancy by Household Size in Ellicott City
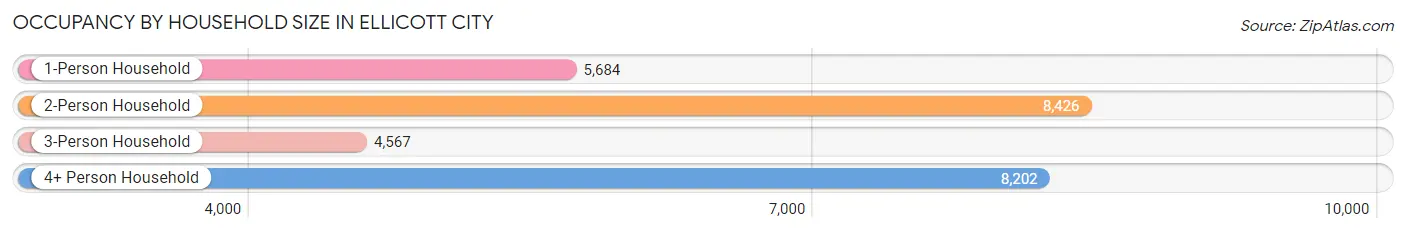
| Household Size | # Housing Units | % Housing Units |
| 1-Person Household | 5,684 | 21.1% |
| 2-Person Household | 8,426 | 31.4% |
| 3-Person Household | 4,567 | 17.0% |
| 4+ Person Household | 8,202 | 30.5% |
| Total Housing Units | 26,879 | 100.0% |
Occupancy by Ownership by Household Size in Ellicott City
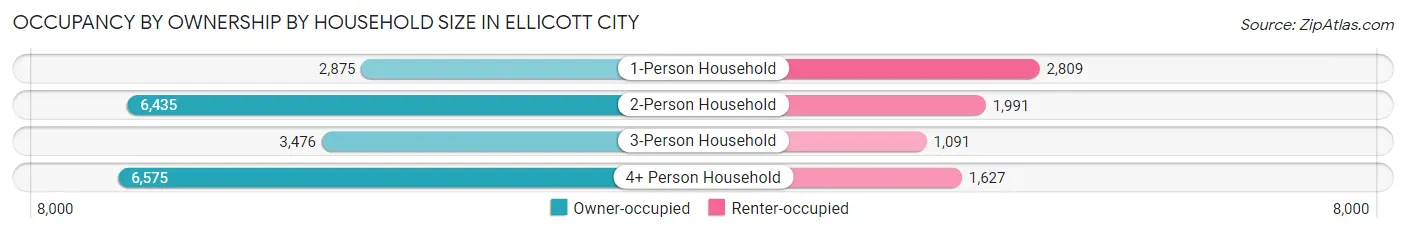
| Household Size | Owner-occupied | Renter-occupied |
| 1-Person Household | 2,875 (50.6%) | 2,809 (49.4%) |
| 2-Person Household | 6,435 (76.4%) | 1,991 (23.6%) |
| 3-Person Household | 3,476 (76.1%) | 1,091 (23.9%) |
| 4+ Person Household | 6,575 (80.2%) | 1,627 (19.8%) |
| Total Housing Units | 19,361 (72.0%) | 7,518 (28.0%) |
Occupancy by Educational Attainment in Ellicott City
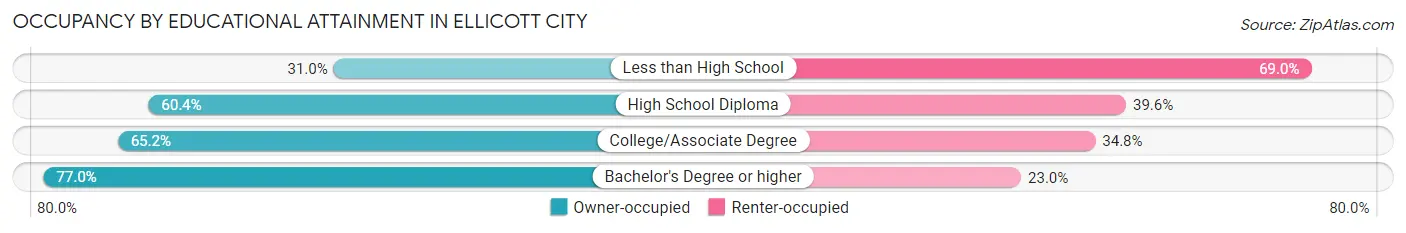
| Household Size | Owner-occupied | Renter-occupied |
| Less than High School | 257 (31.0%) | 572 (69.0%) |
| High School Diploma | 1,570 (60.4%) | 1,031 (39.6%) |
| College/Associate Degree | 2,896 (65.2%) | 1,544 (34.8%) |
| Bachelor's Degree or higher | 14,638 (77.0%) | 4,371 (23.0%) |
Occupancy by Age of Householder in Ellicott City
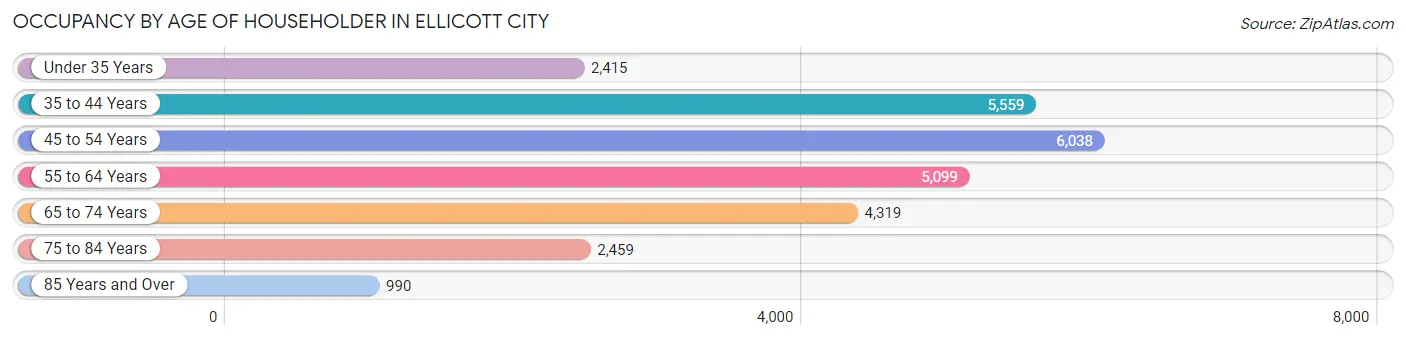
| Age Bracket | # Households | % Households |
| Under 35 Years | 2,415 | 9.0% |
| 35 to 44 Years | 5,559 | 20.7% |
| 45 to 54 Years | 6,038 | 22.5% |
| 55 to 64 Years | 5,099 | 19.0% |
| 65 to 74 Years | 4,319 | 16.1% |
| 75 to 84 Years | 2,459 | 9.1% |
| 85 Years and Over | 990 | 3.7% |
| Total | 26,879 | 100.0% |
Housing Finances in Ellicott City
Median Income by Occupancy in Ellicott City
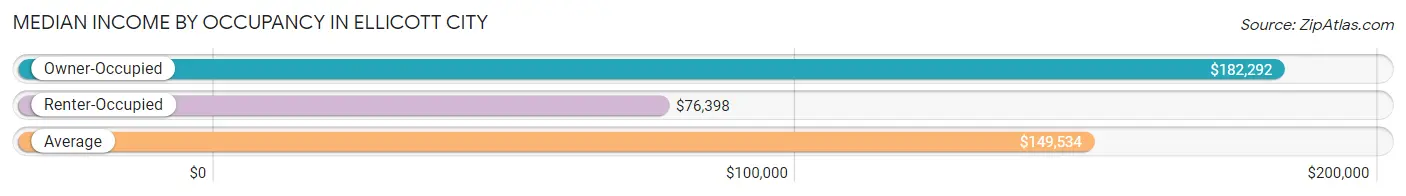
| Occupancy Type | # Households | Median Income |
| Owner-Occupied | 19,361 (72.0%) | $182,292 |
| Renter-Occupied | 7,518 (28.0%) | $76,398 |
| Average | 26,879 (100.0%) | $149,534 |
Occupancy by Householder Income Bracket in Ellicott City
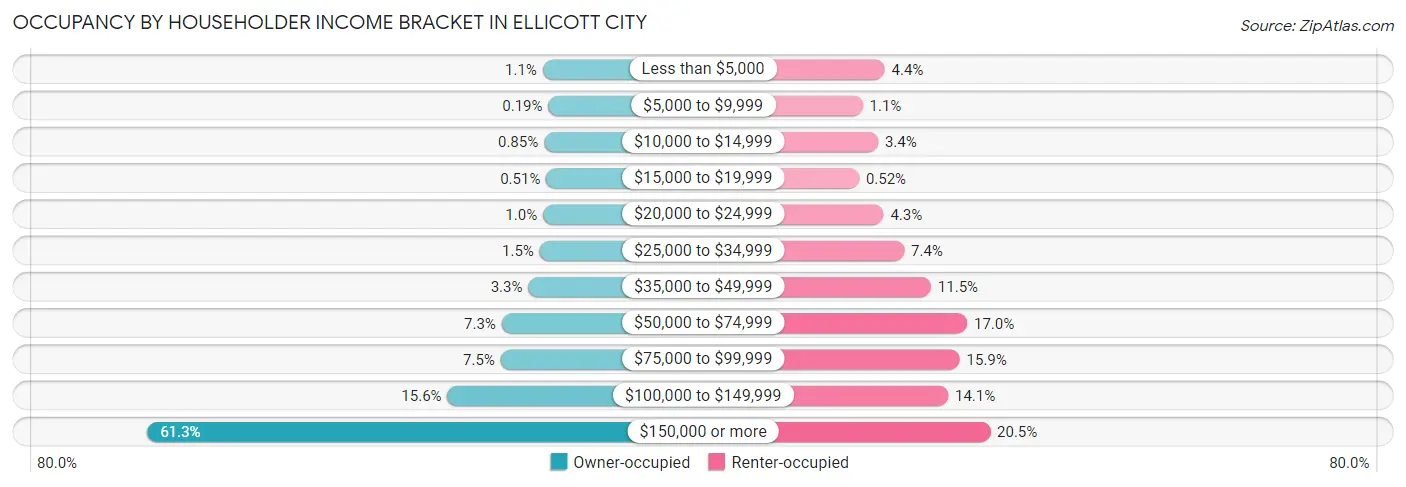
| Income Bracket | Owner-occupied | Renter-occupied |
| Less than $5,000 | 203 (1.1%) | 333 (4.4%) |
| $5,000 to $9,999 | 36 (0.2%) | 81 (1.1%) |
| $10,000 to $14,999 | 165 (0.9%) | 257 (3.4%) |
| $15,000 to $19,999 | 99 (0.5%) | 39 (0.5%) |
| $20,000 to $24,999 | 195 (1.0%) | 320 (4.3%) |
| $25,000 to $34,999 | 293 (1.5%) | 556 (7.4%) |
| $35,000 to $49,999 | 630 (3.3%) | 863 (11.5%) |
| $50,000 to $74,999 | 1,413 (7.3%) | 1,277 (17.0%) |
| $75,000 to $99,999 | 1,443 (7.4%) | 1,192 (15.9%) |
| $100,000 to $149,999 | 3,014 (15.6%) | 1,059 (14.1%) |
| $150,000 or more | 11,870 (61.3%) | 1,541 (20.5%) |
| Total | 19,361 (100.0%) | 7,518 (100.0%) |
Monthly Housing Cost Tiers in Ellicott City
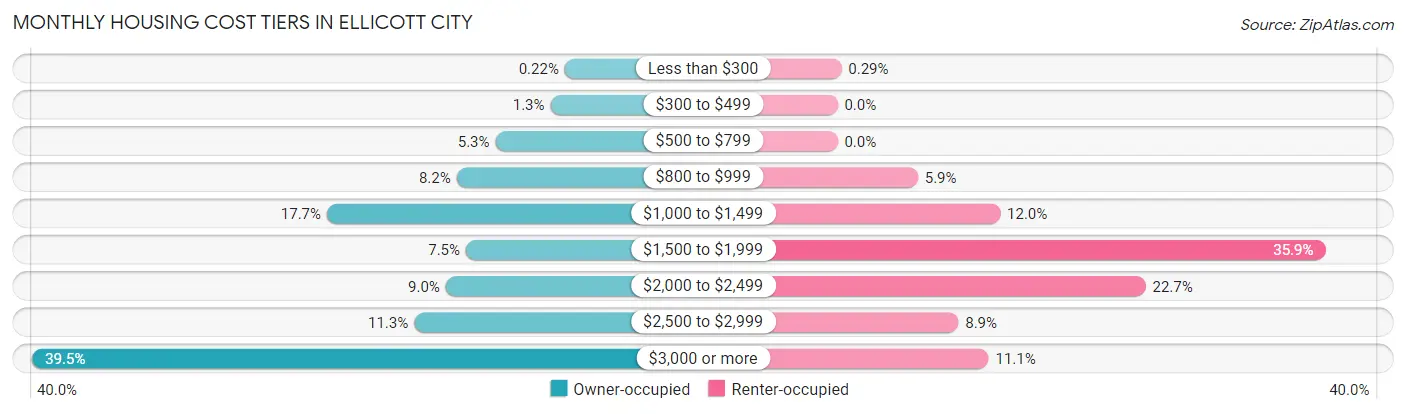
| Monthly Cost | Owner-occupied | Renter-occupied |
| Less than $300 | 42 (0.2%) | 22 (0.3%) |
| $300 to $499 | 247 (1.3%) | 0 (0.0%) |
| $500 to $799 | 1,031 (5.3%) | 0 (0.0%) |
| $800 to $999 | 1,585 (8.2%) | 445 (5.9%) |
| $1,000 to $1,499 | 3,435 (17.7%) | 901 (12.0%) |
| $1,500 to $1,999 | 1,452 (7.5%) | 2,701 (35.9%) |
| $2,000 to $2,499 | 1,741 (9.0%) | 1,706 (22.7%) |
| $2,500 to $2,999 | 2,191 (11.3%) | 669 (8.9%) |
| $3,000 or more | 7,637 (39.5%) | 837 (11.1%) |
| Total | 19,361 (100.0%) | 7,518 (100.0%) |
Physical Housing Characteristics in Ellicott City
Housing Structures in Ellicott City
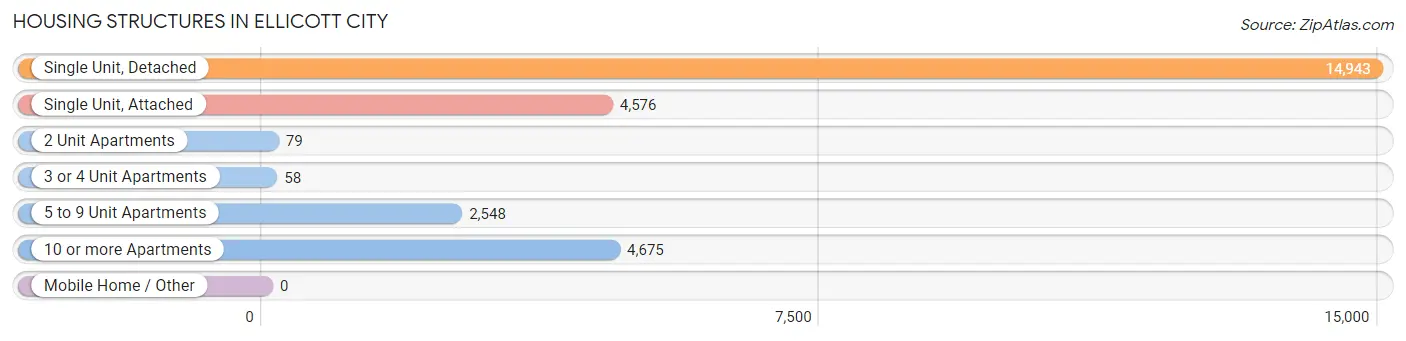
| Structure Type | # Housing Units | % Housing Units |
| Single Unit, Detached | 14,943 | 55.6% |
| Single Unit, Attached | 4,576 | 17.0% |
| 2 Unit Apartments | 79 | 0.3% |
| 3 or 4 Unit Apartments | 58 | 0.2% |
| 5 to 9 Unit Apartments | 2,548 | 9.5% |
| 10 or more Apartments | 4,675 | 17.4% |
| Mobile Home / Other | 0 | 0.0% |
| Total | 26,879 | 100.0% |
Housing Structures by Occupancy in Ellicott City
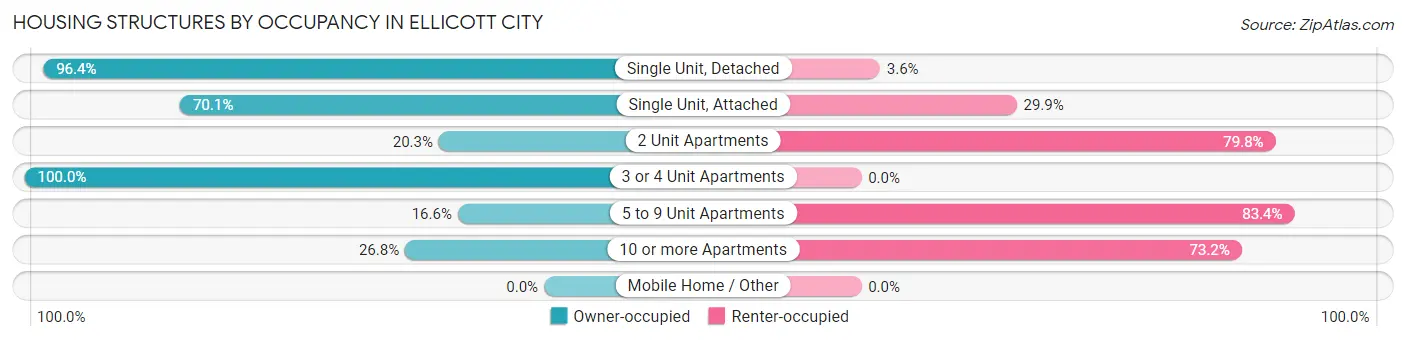
| Structure Type | Owner-occupied | Renter-occupied |
| Single Unit, Detached | 14,406 (96.4%) | 537 (3.6%) |
| Single Unit, Attached | 3,207 (70.1%) | 1,369 (29.9%) |
| 2 Unit Apartments | 16 (20.3%) | 63 (79.7%) |
| 3 or 4 Unit Apartments | 58 (100.0%) | 0 (0.0%) |
| 5 to 9 Unit Apartments | 423 (16.6%) | 2,125 (83.4%) |
| 10 or more Apartments | 1,251 (26.8%) | 3,424 (73.2%) |
| Mobile Home / Other | 0 (0.0%) | 0 (0.0%) |
| Total | 19,361 (72.0%) | 7,518 (28.0%) |
Housing Structures by Number of Rooms in Ellicott City
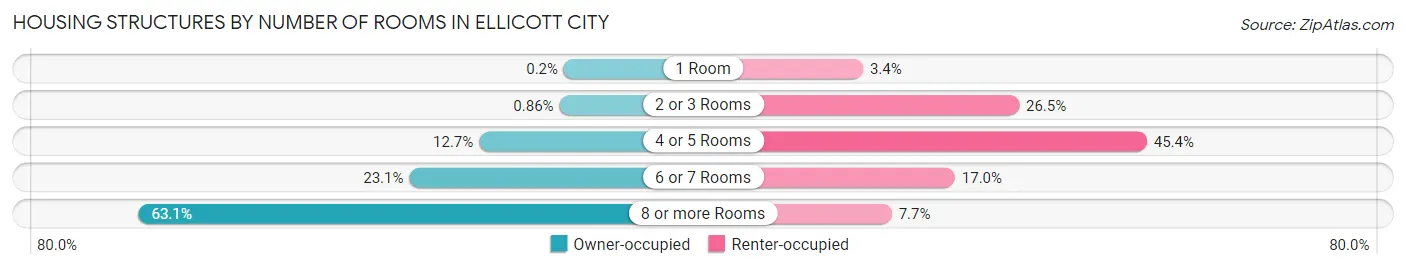
| Number of Rooms | Owner-occupied | Renter-occupied |
| 1 Room | 39 (0.2%) | 256 (3.4%) |
| 2 or 3 Rooms | 167 (0.9%) | 1,992 (26.5%) |
| 4 or 5 Rooms | 2,466 (12.7%) | 3,414 (45.4%) |
| 6 or 7 Rooms | 4,466 (23.1%) | 1,279 (17.0%) |
| 8 or more Rooms | 12,223 (63.1%) | 577 (7.7%) |
| Total | 19,361 (100.0%) | 7,518 (100.0%) |
Housing Structure by Heating Type in Ellicott City
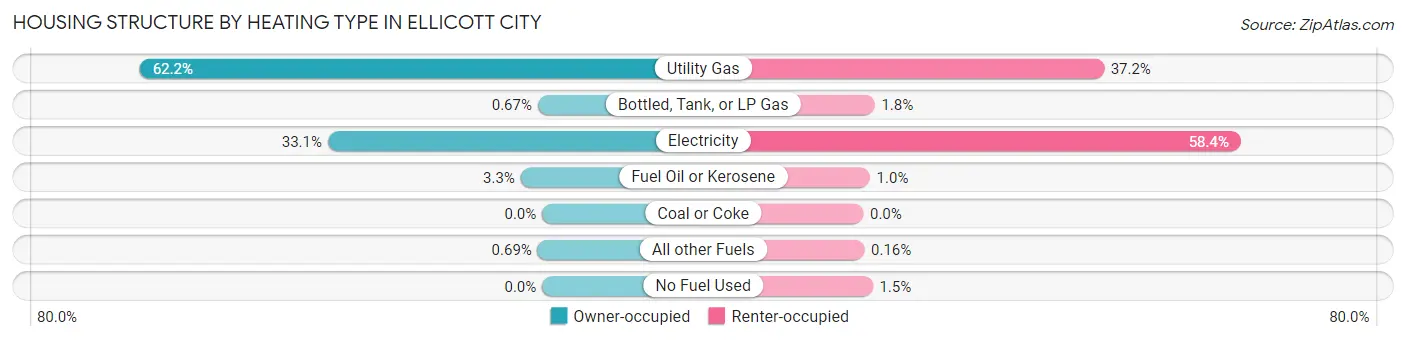
| Heating Type | Owner-occupied | Renter-occupied |
| Utility Gas | 12,042 (62.2%) | 2,797 (37.2%) |
| Bottled, Tank, or LP Gas | 130 (0.7%) | 133 (1.8%) |
| Electricity | 6,415 (33.1%) | 4,389 (58.4%) |
| Fuel Oil or Kerosene | 640 (3.3%) | 77 (1.0%) |
| Coal or Coke | 0 (0.0%) | 0 (0.0%) |
| All other Fuels | 134 (0.7%) | 12 (0.2%) |
| No Fuel Used | 0 (0.0%) | 110 (1.5%) |
| Total | 19,361 (100.0%) | 7,518 (100.0%) |
Household Vehicle Usage in Ellicott City
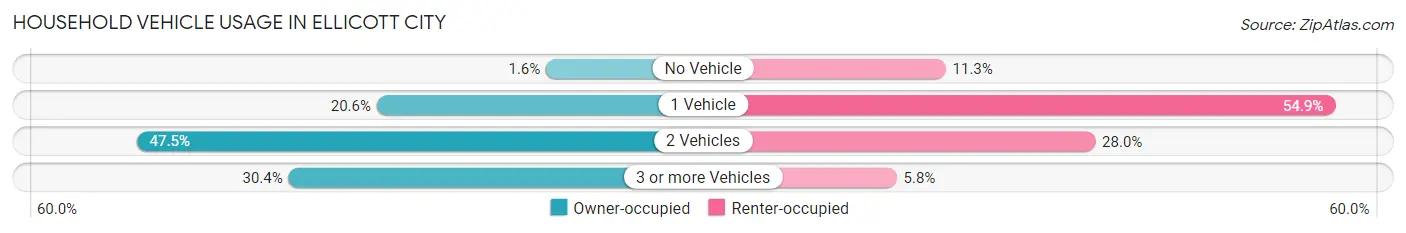
| Vehicles per Household | Owner-occupied | Renter-occupied |
| No Vehicle | 305 (1.6%) | 848 (11.3%) |
| 1 Vehicle | 3,978 (20.5%) | 4,128 (54.9%) |
| 2 Vehicles | 9,186 (47.4%) | 2,107 (28.0%) |
| 3 or more Vehicles | 5,892 (30.4%) | 435 (5.8%) |
| Total | 19,361 (100.0%) | 7,518 (100.0%) |
Real Estate & Mortgages in Ellicott City
Real Estate and Mortgage Overview in Ellicott City
| Characteristic | Without Mortgage | With Mortgage |
| Housing Units | 5,788 | 13,573 |
| Median Property Value | $594,200 | $626,800 |
| Median Household Income | $136,931 | $9,146 |
| Monthly Housing Costs | $1,031 | $7,604 |
| Real Estate Taxes | $7,249 | $84 |
Property Value by Mortgage Status in Ellicott City
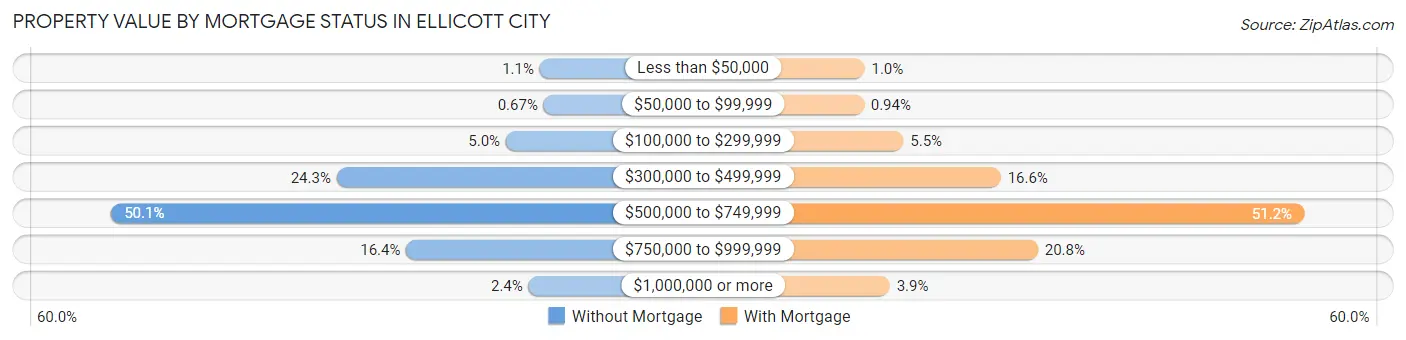
| Property Value | Without Mortgage | With Mortgage |
| Less than $50,000 | 65 (1.1%) | 140 (1.0%) |
| $50,000 to $99,999 | 39 (0.7%) | 127 (0.9%) |
| $100,000 to $299,999 | 289 (5.0%) | 741 (5.5%) |
| $300,000 to $499,999 | 1,408 (24.3%) | 2,252 (16.6%) |
| $500,000 to $749,999 | 2,900 (50.1%) | 6,955 (51.2%) |
| $750,000 to $999,999 | 948 (16.4%) | 2,827 (20.8%) |
| $1,000,000 or more | 139 (2.4%) | 531 (3.9%) |
| Total | 5,788 (100.0%) | 13,573 (100.0%) |
Household Income by Mortgage Status in Ellicott City
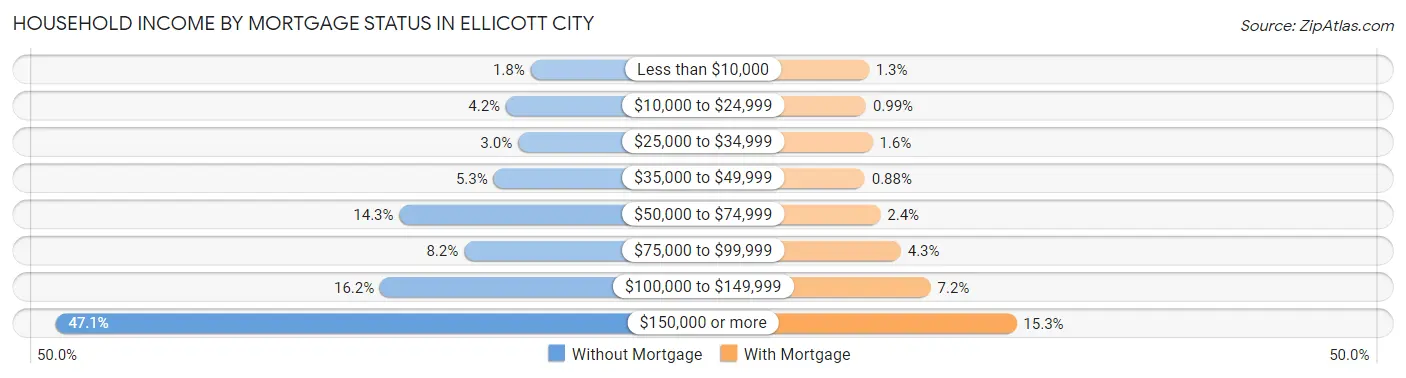
| Household Income | Without Mortgage | With Mortgage |
| Less than $10,000 | 105 (1.8%) | 171 (1.3%) |
| $10,000 to $24,999 | 241 (4.2%) | 134 (1.0%) |
| $25,000 to $34,999 | 174 (3.0%) | 218 (1.6%) |
| $35,000 to $49,999 | 309 (5.3%) | 119 (0.9%) |
| $50,000 to $74,999 | 828 (14.3%) | 321 (2.4%) |
| $75,000 to $99,999 | 472 (8.2%) | 585 (4.3%) |
| $100,000 to $149,999 | 935 (16.2%) | 971 (7.1%) |
| $150,000 or more | 2,724 (47.1%) | 2,079 (15.3%) |
| Total | 5,788 (100.0%) | 13,573 (100.0%) |
Property Value to Household Income Ratio in Ellicott City
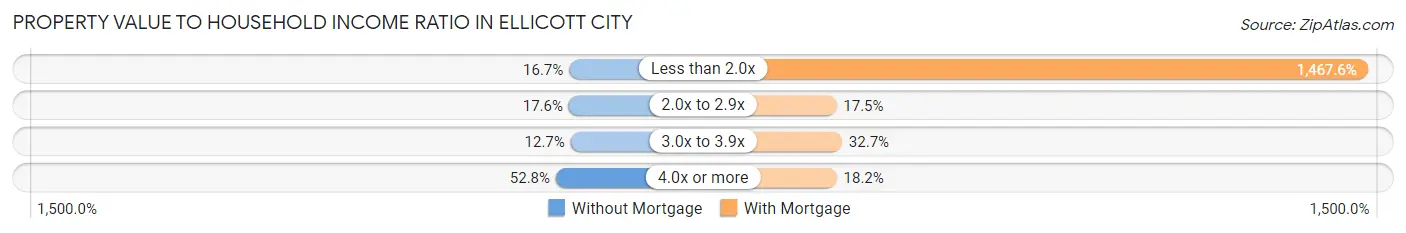
| Value-to-Income Ratio | Without Mortgage | With Mortgage |
| Less than 2.0x | 965 (16.7%) | 199,203 (1,467.6%) |
| 2.0x to 2.9x | 1,017 (17.6%) | 2,374 (17.5%) |
| 3.0x to 3.9x | 733 (12.7%) | 4,431 (32.7%) |
| 4.0x or more | 3,053 (52.7%) | 2,465 (18.2%) |
| Total | 5,788 (100.0%) | 13,573 (100.0%) |
Real Estate Taxes by Mortgage Status in Ellicott City
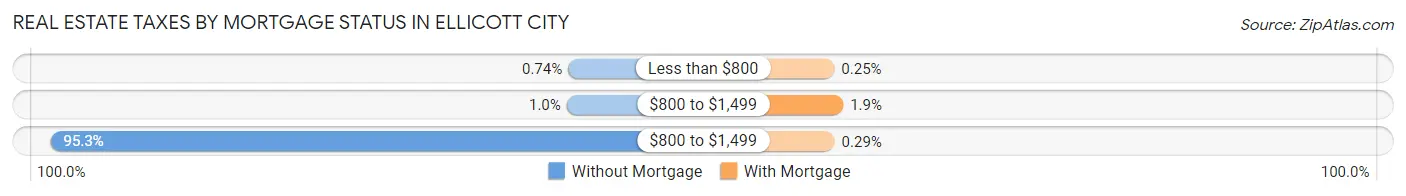
| Property Taxes | Without Mortgage | With Mortgage |
| Less than $800 | 43 (0.7%) | 34 (0.3%) |
| $800 to $1,499 | 58 (1.0%) | 252 (1.9%) |
| $800 to $1,499 | 5,515 (95.3%) | 39 (0.3%) |
| Total | 5,788 (100.0%) | 13,573 (100.0%) |
Health & Disability in Ellicott City
Health Insurance Coverage by Age in Ellicott City
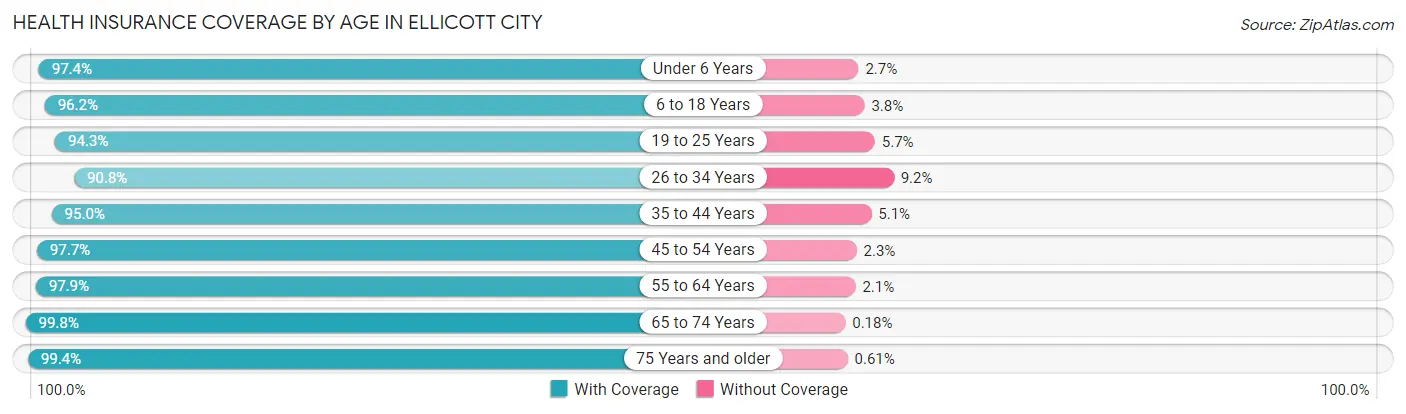
| Age Bracket | With Coverage | Without Coverage |
| Under 6 Years | 4,180 (97.4%) | 114 (2.6%) |
| 6 to 18 Years | 15,004 (96.2%) | 586 (3.8%) |
| 19 to 25 Years | 3,970 (94.3%) | 240 (5.7%) |
| 26 to 34 Years | 4,830 (90.8%) | 490 (9.2%) |
| 35 to 44 Years | 10,152 (95.0%) | 540 (5.1%) |
| 45 to 54 Years | 10,833 (97.7%) | 255 (2.3%) |
| 55 to 64 Years | 9,138 (97.9%) | 195 (2.1%) |
| 65 to 74 Years | 7,356 (99.8%) | 13 (0.2%) |
| 75 Years and older | 5,028 (99.4%) | 31 (0.6%) |
| Total | 70,491 (96.6%) | 2,464 (3.4%) |
Health Insurance Coverage by Citizenship Status in Ellicott City
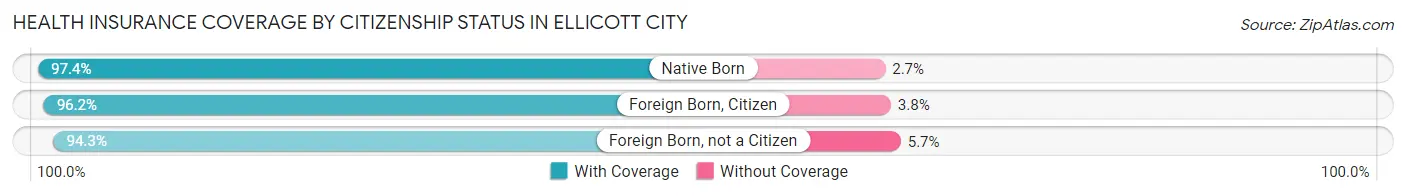
| Citizenship Status | With Coverage | Without Coverage |
| Native Born | 4,180 (97.4%) | 114 (2.6%) |
| Foreign Born, Citizen | 15,004 (96.2%) | 586 (3.8%) |
| Foreign Born, not a Citizen | 3,970 (94.3%) | 240 (5.7%) |
Health Insurance Coverage by Household Income in Ellicott City
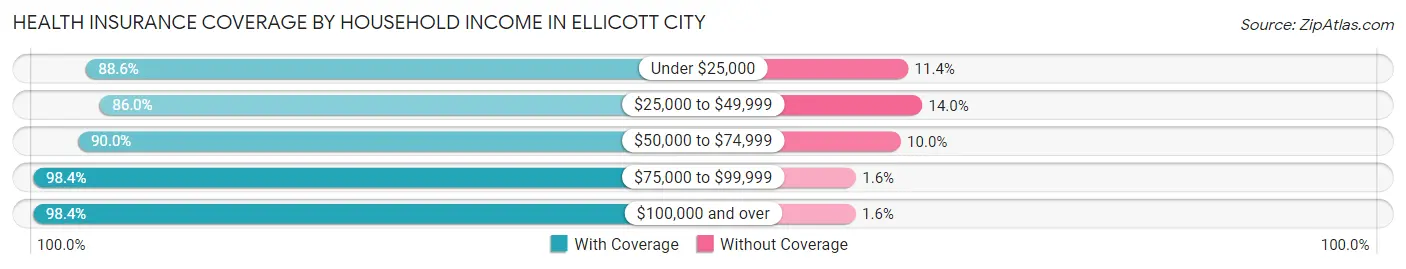
| Household Income | With Coverage | Without Coverage |
| Under $25,000 | 2,542 (88.6%) | 327 (11.4%) |
| $25,000 to $49,999 | 4,081 (86.0%) | 665 (14.0%) |
| $50,000 to $74,999 | 4,760 (90.0%) | 529 (10.0%) |
| $75,000 to $99,999 | 5,604 (98.4%) | 91 (1.6%) |
| $100,000 and over | 53,352 (98.4%) | 847 (1.6%) |
Public vs Private Health Insurance Coverage by Age in Ellicott City
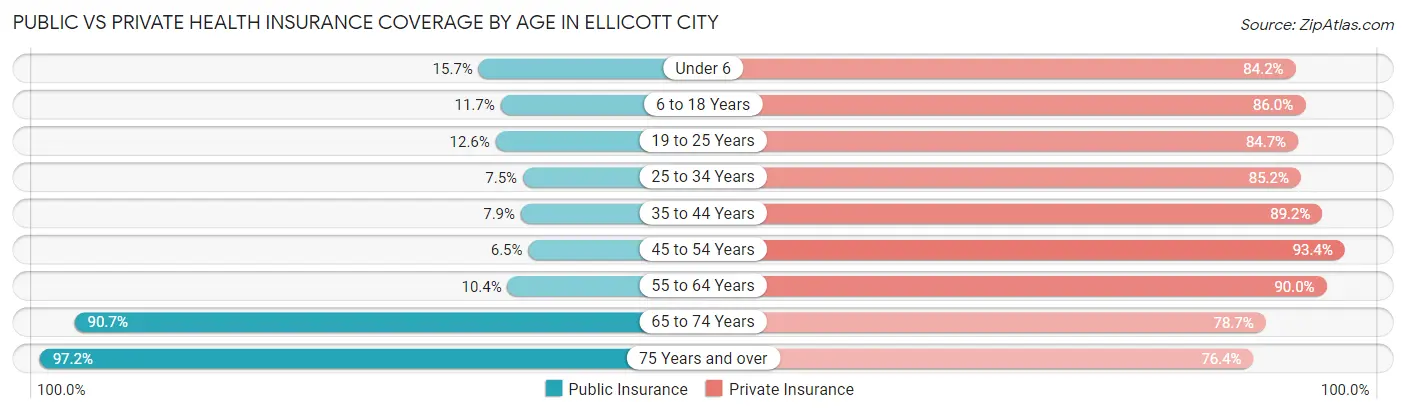
| Age Bracket | Public Insurance | Private Insurance |
| Under 6 | 675 (15.7%) | 3,615 (84.2%) |
| 6 to 18 Years | 1,818 (11.7%) | 13,405 (86.0%) |
| 19 to 25 Years | 529 (12.6%) | 3,564 (84.7%) |
| 25 to 34 Years | 399 (7.5%) | 4,532 (85.2%) |
| 35 to 44 Years | 844 (7.9%) | 9,535 (89.2%) |
| 45 to 54 Years | 721 (6.5%) | 10,351 (93.3%) |
| 55 to 64 Years | 967 (10.4%) | 8,395 (89.9%) |
| 65 to 74 Years | 6,685 (90.7%) | 5,796 (78.6%) |
| 75 Years and over | 4,917 (97.2%) | 3,865 (76.4%) |
| Total | 17,555 (24.1%) | 63,058 (86.4%) |
Disability Status by Sex by Age in Ellicott City
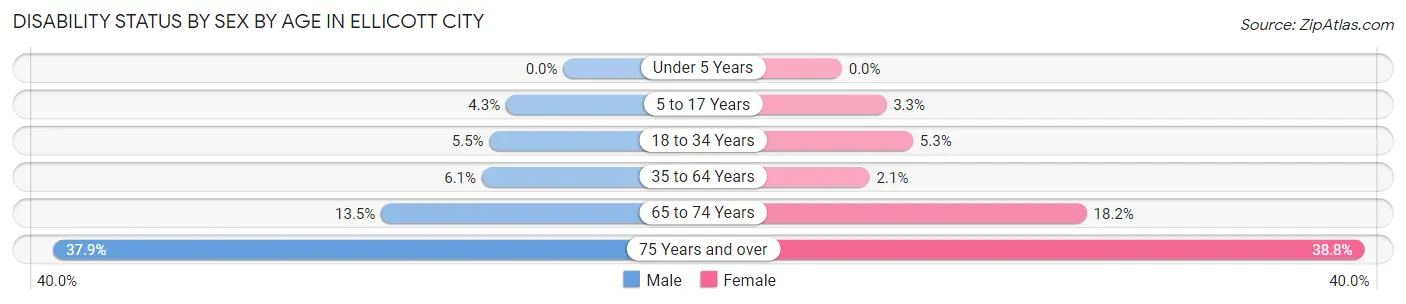
| Age Bracket | Male | Female |
| Under 5 Years | 0 (0.0%) | 0 (0.0%) |
| 5 to 17 Years | 323 (4.3%) | 257 (3.3%) |
| 18 to 34 Years | 301 (5.5%) | 266 (5.3%) |
| 35 to 64 Years | 947 (6.0%) | 320 (2.1%) |
| 65 to 74 Years | 436 (13.5%) | 754 (18.2%) |
| 75 Years and over | 906 (37.9%) | 1,035 (38.8%) |
Disability Class by Sex by Age in Ellicott City
Disability Class: Hearing Difficulty
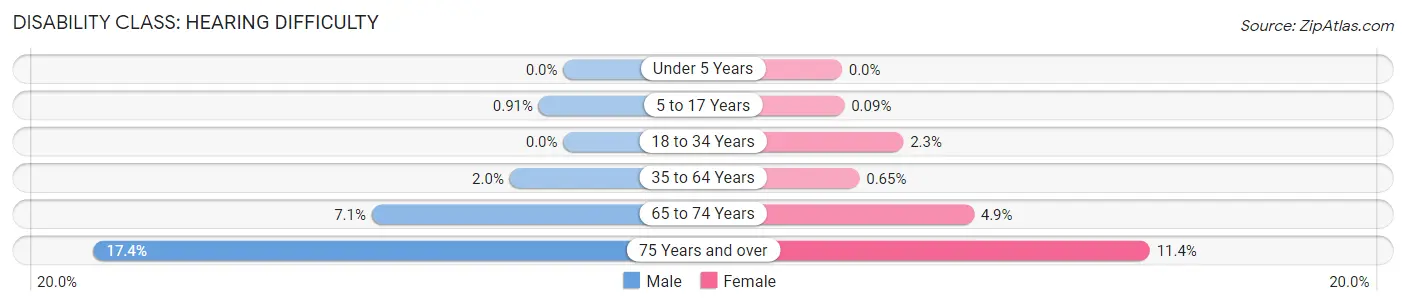
| Age Bracket | Male | Female |
| Under 5 Years | 0 (0.0%) | 0 (0.0%) |
| 5 to 17 Years | 69 (0.9%) | 7 (0.1%) |
| 18 to 34 Years | 0 (0.0%) | 115 (2.3%) |
| 35 to 64 Years | 311 (2.0%) | 101 (0.6%) |
| 65 to 74 Years | 229 (7.1%) | 203 (4.9%) |
| 75 Years and over | 417 (17.4%) | 305 (11.4%) |
Disability Class: Vision Difficulty
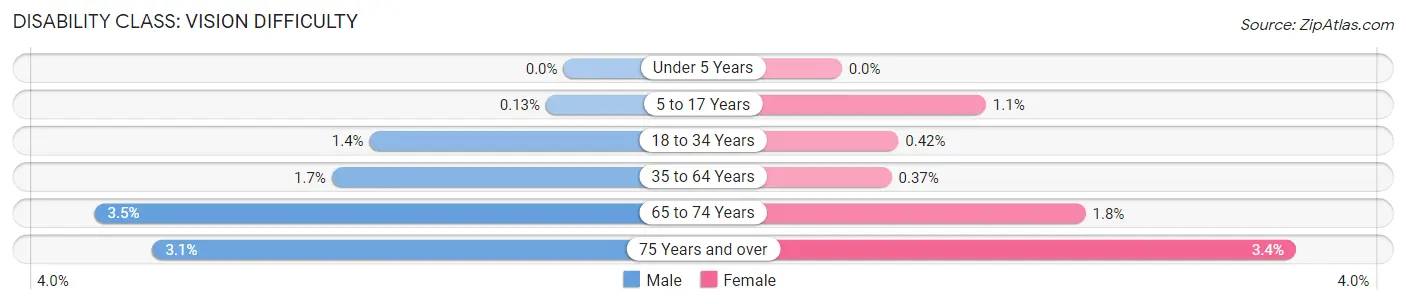
| Age Bracket | Male | Female |
| Under 5 Years | 0 (0.0%) | 0 (0.0%) |
| 5 to 17 Years | 10 (0.1%) | 83 (1.1%) |
| 18 to 34 Years | 79 (1.4%) | 21 (0.4%) |
| 35 to 64 Years | 269 (1.7%) | 57 (0.4%) |
| 65 to 74 Years | 112 (3.5%) | 75 (1.8%) |
| 75 Years and over | 73 (3.0%) | 90 (3.4%) |
Disability Class: Cognitive Difficulty
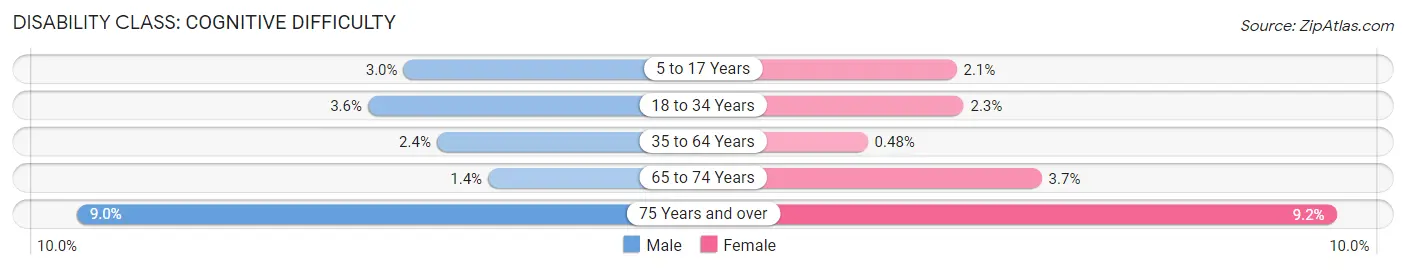
| Age Bracket | Male | Female |
| 5 to 17 Years | 225 (3.0%) | 166 (2.1%) |
| 18 to 34 Years | 199 (3.6%) | 114 (2.3%) |
| 35 to 64 Years | 367 (2.4%) | 74 (0.5%) |
| 65 to 74 Years | 45 (1.4%) | 154 (3.7%) |
| 75 Years and over | 216 (9.0%) | 245 (9.2%) |
Disability Class: Ambulatory Difficulty
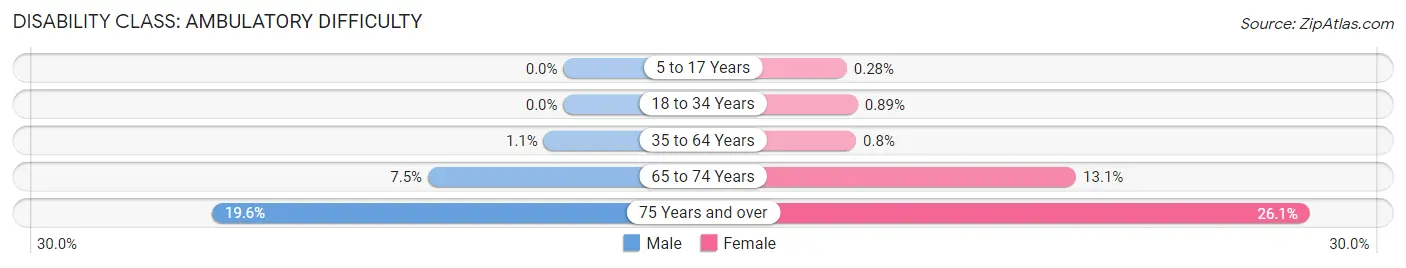
| Age Bracket | Male | Female |
| 5 to 17 Years | 0 (0.0%) | 22 (0.3%) |
| 18 to 34 Years | 0 (0.0%) | 45 (0.9%) |
| 35 to 64 Years | 172 (1.1%) | 124 (0.8%) |
| 65 to 74 Years | 243 (7.5%) | 541 (13.1%) |
| 75 Years and over | 468 (19.6%) | 695 (26.1%) |
Disability Class: Self-Care Difficulty
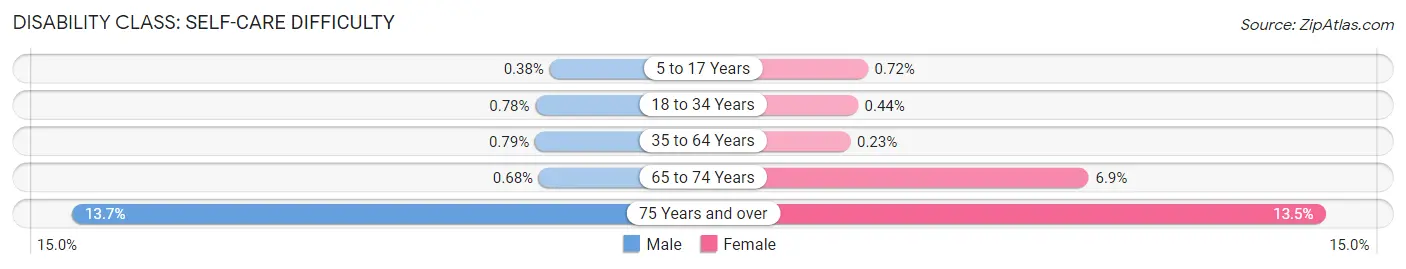
| Age Bracket | Male | Female |
| 5 to 17 Years | 29 (0.4%) | 56 (0.7%) |
| 18 to 34 Years | 43 (0.8%) | 22 (0.4%) |
| 35 to 64 Years | 124 (0.8%) | 36 (0.2%) |
| 65 to 74 Years | 22 (0.7%) | 285 (6.9%) |
| 75 Years and over | 327 (13.7%) | 359 (13.5%) |
Technology Access in Ellicott City
Computing Device Access in Ellicott City
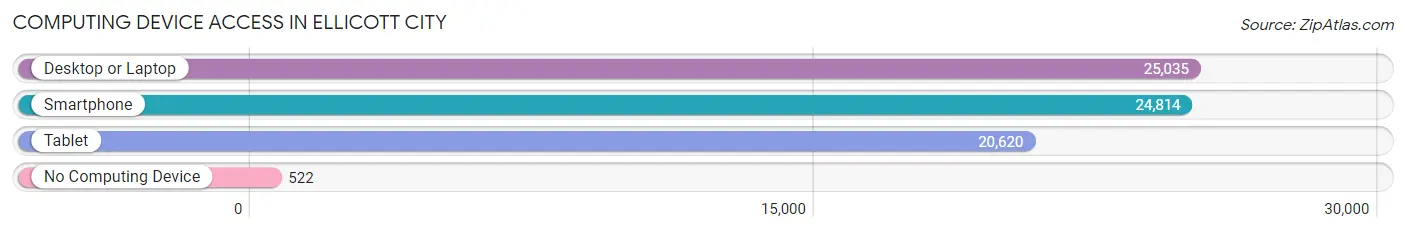
| Device Type | # Households | % Households |
| Desktop or Laptop | 25,035 | 93.1% |
| Smartphone | 24,814 | 92.3% |
| Tablet | 20,620 | 76.7% |
| No Computing Device | 522 | 1.9% |
| Total | 26,879 | 100.0% |
Internet Access in Ellicott City
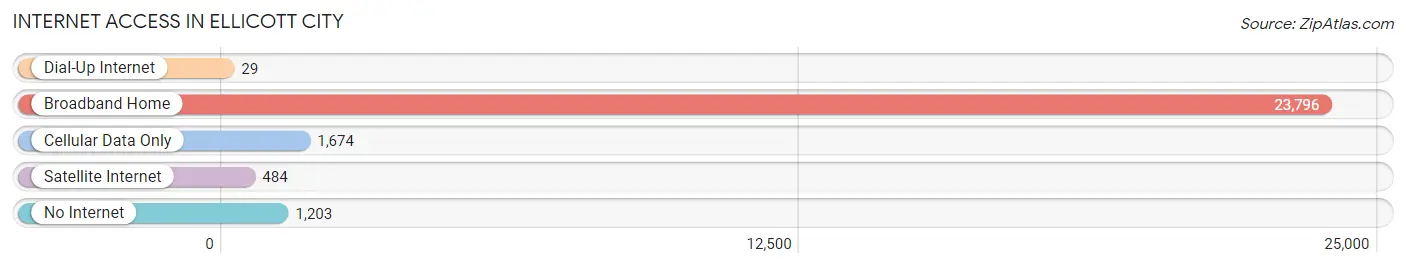
| Internet Type | # Households | % Households |
| Dial-Up Internet | 29 | 0.1% |
| Broadband Home | 23,796 | 88.5% |
| Cellular Data Only | 1,674 | 6.2% |
| Satellite Internet | 484 | 1.8% |
| No Internet | 1,203 | 4.5% |
| Total | 26,879 | 100.0% |
Ellicott City Summary
Ellicott City, Maryland is a small town located in Howard County, Maryland, just outside of Baltimore. It is a historic town with a rich history and a vibrant economy.
History
Ellicott City was founded in 1772 by three Quaker brothers, John, Andrew, and Joseph Ellicott. The brothers purchased the land from the Piscataway Indians and named the town after themselves. The town quickly grew and became a major trading center for the area. In 1867, the Baltimore and Ohio Railroad arrived in Ellicott City, connecting the town to the rest of the country. This allowed for the growth of industry and commerce in the area.
In the late 19th century, Ellicott City was a popular tourist destination. It was known for its picturesque scenery and its many historic buildings. The town was also home to a number of prominent citizens, including the first African-American mayor of a major city, William H. Murphy.
In the 20th century, Ellicott City continued to grow and prosper. The town was home to a number of businesses, including a large textile mill and a number of other factories. The town also became a popular destination for tourists, who came to visit the many historic sites in the area.
Geography
Ellicott City is located in Howard County, Maryland, just outside of Baltimore. The town is situated on the Patapsco River, which flows through the area. The town is surrounded by rolling hills and is located in a valley. The town is located at an elevation of about 500 feet above sea level.
The climate in Ellicott City is humid subtropical, with hot, humid summers and mild winters. The average annual temperature is around 60 degrees Fahrenheit. The town receives an average of 40 inches of precipitation per year.
Economy
Ellicott City has a vibrant economy. The town is home to a number of businesses, including a large textile mill and a number of other factories. The town is also home to a number of retail stores, restaurants, and other businesses.
The town is also home to a number of technology companies, including a number of software companies. The town is also home to a number of government agencies, including the National Security Agency and the National Institutes of Health.
Demographics
As of the 2010 census, Ellicott City had a population of 65,834. The town has a diverse population, with a mix of races and ethnicities. The town is predominantly white, with about 75% of the population being white. The town also has a large Asian population, with about 10% of the population being Asian. The town also has a small African-American population, with about 5% of the population being African-American.
The median household income in Ellicott City is $90,000, which is higher than the national average. The town also has a high rate of homeownership, with about 75% of the population owning their own homes. The town also has a high rate of college graduates, with about 40% of the population having a college degree.
Common Questions
What is Per Capita Income in Ellicott City?
Per Capita income in Ellicott City is $66,029.
What is the Median Family Income in Ellicott City?
Median Family Income in Ellicott City is $178,280.
What is the Median Household income in Ellicott City?
Median Household Income in Ellicott City is $149,534.
What is Income or Wage Gap in Ellicott City?
Income or Wage Gap in Ellicott City is 36.1%.
Women in Ellicott City earn 63.9 cents for every dollar earned by a man.
What is Family Income Deficit in Ellicott City?
Family Income Deficit in Ellicott City is $11,037.
Families that are below poverty line in Ellicott City earn $11,037 less on average than the poverty threshold level.
What is Inequality or Gini Index in Ellicott City?
Inequality or Gini Index in Ellicott City is 0.42.
What is the Total Population of Ellicott City?
Total Population of Ellicott City is 73,589.
What is the Total Male Population of Ellicott City?
Total Male Population of Ellicott City is 36,368.
What is the Total Female Population of Ellicott City?
Total Female Population of Ellicott City is 37,221.
What is the Ratio of Males per 100 Females in Ellicott City?
There are 97.71 Males per 100 Females in Ellicott City.
What is the Ratio of Females per 100 Males in Ellicott City?
There are 102.35 Females per 100 Males in Ellicott City.
What is the Median Population Age in Ellicott City?
Median Population Age in Ellicott City is 42.1 Years.
What is the Average Family Size in Ellicott City
Average Family Size in Ellicott City is 3.2 People.
What is the Average Household Size in Ellicott City
Average Household Size in Ellicott City is 2.7 People.
How Large is the Labor Force in Ellicott City?
There are 38,182 People in the Labor Forcein in Ellicott City.
What is the Percentage of People in the Labor Force in Ellicott City?
66.9% of People are in the Labor Force in Ellicott City.
What is the Unemployment Rate in Ellicott City?
Unemployment Rate in Ellicott City is 3.3%.