Vernon Hills, IL Map & Demographics
Vernon Hills Map
Vernon Hills Overview
$58,875
PER CAPITA INCOME
$136,475
AVG FAMILY INCOME
$117,253
AVG HOUSEHOLD INCOME
41.2%
WAGE / INCOME GAP [ % ]
58.8¢/ $1
WAGE / INCOME GAP [ $ ]
0.42
INEQUALITY / GINI INDEX
26,750
TOTAL POPULATION
13,273
MALE POPULATION
13,477
FEMALE POPULATION
98.49
MALES / 100 FEMALES
101.54
FEMALES / 100 MALES
40.6
MEDIAN AGE
3.1
AVG FAMILY SIZE
2.6
AVG HOUSEHOLD SIZE
14,617
LABOR FORCE [ PEOPLE ]
68.9%
PERCENT IN LABOR FORCE
3.7%
UNEMPLOYMENT RATE
Vernon Hills Zip Codes
Income in Vernon Hills
Income Overview in Vernon Hills
Per Capita Income in Vernon Hills is $58,875, while median incomes of families and households are $136,475 and $117,253 respectively.
| Characteristic | Number | Measure |
| Per Capita Income | 26,750 | $58,875 |
| Median Family Income | 7,462 | $136,475 |
| Mean Family Income | 7,462 | $172,241 |
| Median Household Income | 10,366 | $117,253 |
| Mean Household Income | 10,366 | $150,003 |
| Income Deficit | 7,462 | $0 |
| Wage / Income Gap (%) | 26,750 | 41.23% |
| Wage / Income Gap ($) | 26,750 | 58.77¢ per $1 |
| Gini / Inequality Index | 26,750 | 0.42 |
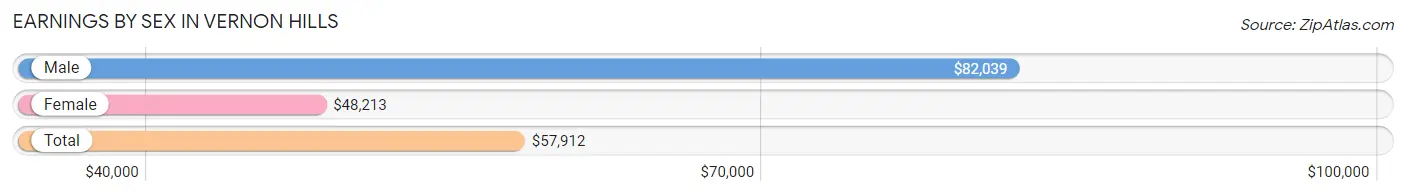
Earnings by Sex in Vernon Hills
Average Earnings in Vernon Hills are $57,912, $82,039 for men and $48,213 for women, a difference of 41.2%.
| Sex | Number | Average Earnings |
| Male | 8,116 (53.0%) | $82,039 |
| Female | 7,192 (47.0%) | $48,213 |
| Total | 15,308 (100.0%) | $57,912 |
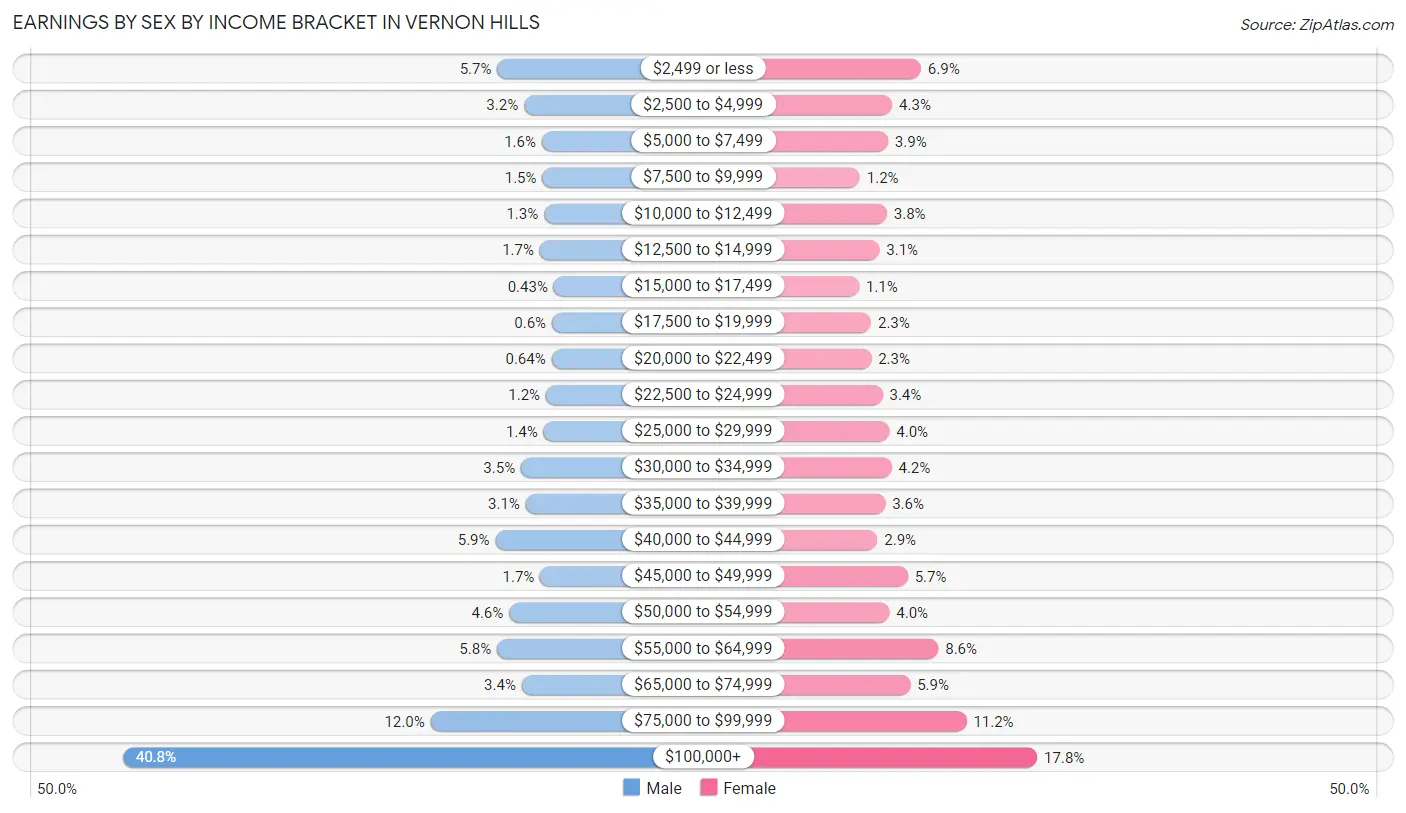
Earnings by Sex by Income Bracket in Vernon Hills
The most common earnings brackets in Vernon Hills are $100,000+ for men (3,311 | 40.8%) and $100,000+ for women (1,282 | 17.8%).
| Income | Male | Female |
| $2,499 or less | 464 (5.7%) | 499 (6.9%) |
| $2,500 to $4,999 | 261 (3.2%) | 306 (4.3%) |
| $5,000 to $7,499 | 126 (1.5%) | 277 (3.8%) |
| $7,500 to $9,999 | 122 (1.5%) | 88 (1.2%) |
| $10,000 to $12,499 | 109 (1.3%) | 270 (3.7%) |
| $12,500 to $14,999 | 141 (1.7%) | 219 (3.0%) |
| $15,000 to $17,499 | 35 (0.4%) | 82 (1.1%) |
| $17,500 to $19,999 | 49 (0.6%) | 163 (2.3%) |
| $20,000 to $22,499 | 52 (0.6%) | 165 (2.3%) |
| $22,500 to $24,999 | 94 (1.2%) | 241 (3.4%) |
| $25,000 to $29,999 | 112 (1.4%) | 287 (4.0%) |
| $30,000 to $34,999 | 284 (3.5%) | 301 (4.2%) |
| $35,000 to $39,999 | 248 (3.1%) | 259 (3.6%) |
| $40,000 to $44,999 | 479 (5.9%) | 206 (2.9%) |
| $45,000 to $49,999 | 138 (1.7%) | 411 (5.7%) |
| $50,000 to $54,999 | 374 (4.6%) | 287 (4.0%) |
| $55,000 to $64,999 | 467 (5.8%) | 616 (8.6%) |
| $65,000 to $74,999 | 278 (3.4%) | 427 (5.9%) |
| $75,000 to $99,999 | 972 (12.0%) | 806 (11.2%) |
| $100,000+ | 3,311 (40.8%) | 1,282 (17.8%) |
| Total | 8,116 (100.0%) | 7,192 (100.0%) |
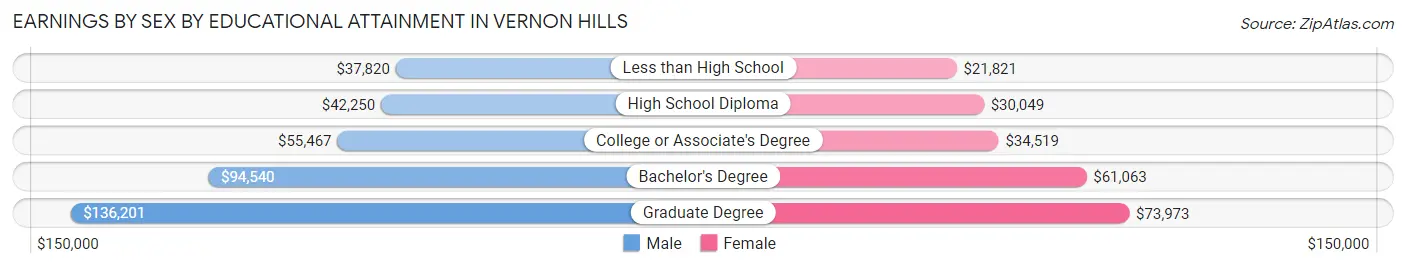
Earnings by Sex by Educational Attainment in Vernon Hills
Average earnings in Vernon Hills are $93,709 for men and $54,748 for women, a difference of 41.6%. Men with an educational attainment of graduate degree enjoy the highest average annual earnings of $136,201, while those with less than high school education earn the least with $37,820. Women with an educational attainment of graduate degree earn the most with the average annual earnings of $73,973, while those with less than high school education have the smallest earnings of $21,821.
| Educational Attainment | Male Income | Female Income |
| Less than High School | $37,820 | $21,821 |
| High School Diploma | $42,250 | $30,049 |
| College or Associate's Degree | $55,467 | $34,519 |
| Bachelor's Degree | $94,540 | $61,063 |
| Graduate Degree | $136,201 | $73,973 |
| Total | $93,709 | $54,748 |
Family Income in Vernon Hills
Family Income Brackets in Vernon Hills
According to the Vernon Hills family income data, there are 2,268 families falling into the $200,000+ income range, which is the most common income bracket and makes up 30.4% of all families. Conversely, the $10,000 to $14,999 income bracket is the least frequent group with only 37 families (0.5%) belonging to this category.
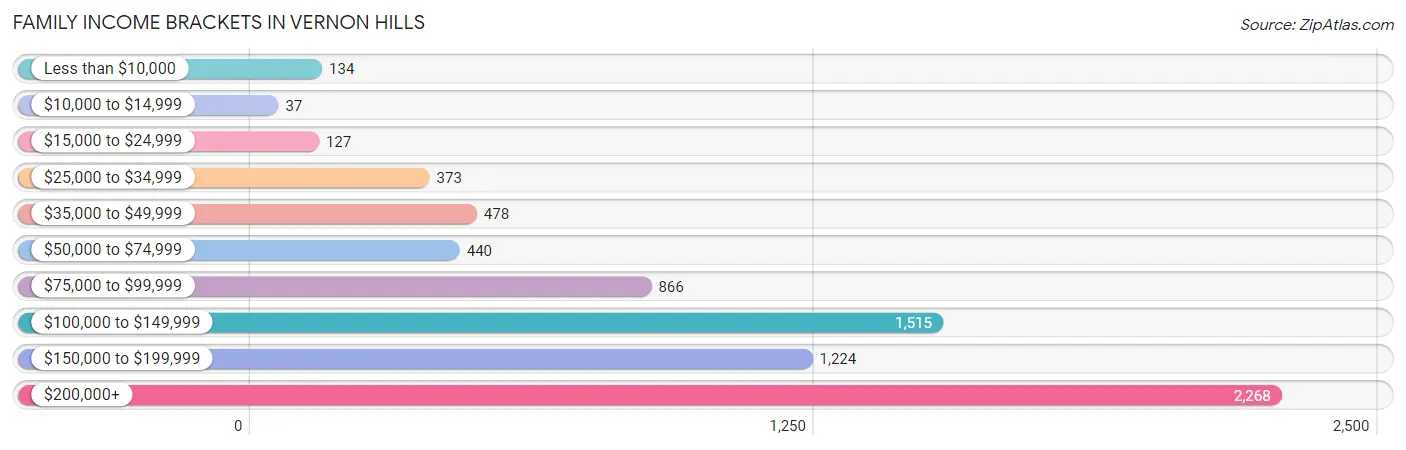
| Income Bracket | # Families | % Families |
| Less than $10,000 | 134 | 1.8% |
| $10,000 to $14,999 | 37 | 0.5% |
| $15,000 to $24,999 | 127 | 1.7% |
| $25,000 to $34,999 | 373 | 5.0% |
| $35,000 to $49,999 | 478 | 6.4% |
| $50,000 to $74,999 | 440 | 5.9% |
| $75,000 to $99,999 | 866 | 11.6% |
| $100,000 to $149,999 | 1,515 | 20.3% |
| $150,000 to $199,999 | 1,224 | 16.4% |
| $200,000+ | 2,268 | 30.4% |
Family Income by Famaliy Size in Vernon Hills
7+ person families (28 | 0.4%) account for the highest median family income in Vernon Hills with $250,001 per family, while 2-person families (3,140 | 42.1%) have the highest median income of $64,754 per family member.
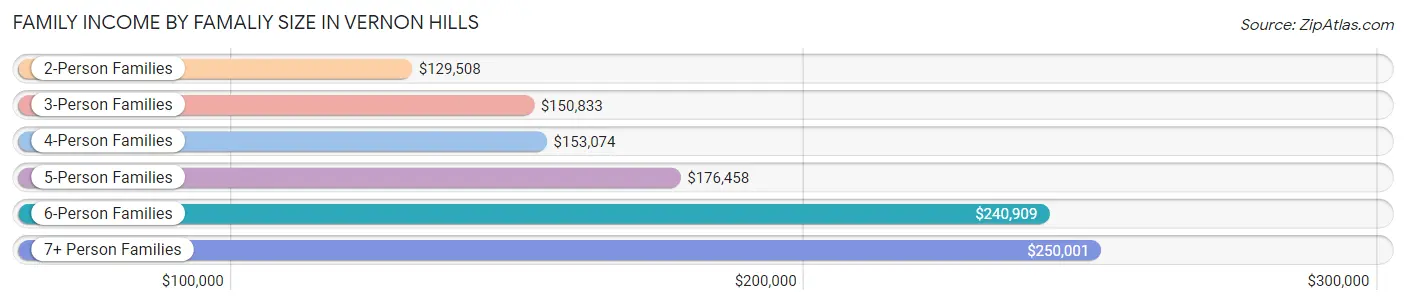
| Income Bracket | # Families | Median Income |
| 2-Person Families | 3,140 (42.1%) | $129,508 |
| 3-Person Families | 1,820 (24.4%) | $150,833 |
| 4-Person Families | 1,931 (25.9%) | $153,074 |
| 5-Person Families | 443 (5.9%) | $176,458 |
| 6-Person Families | 100 (1.3%) | $240,909 |
| 7+ Person Families | 28 (0.4%) | $250,001 |
| Total | 7,462 (100.0%) | $136,475 |
Family Income by Number of Earners in Vernon Hills
The median family income in Vernon Hills is $136,475, with families comprising 3+ earners (860) having the highest median family income of $213,125, while families with no earners (957) have the lowest median family income of $87,704, accounting for 11.5% and 12.8% of families, respectively.
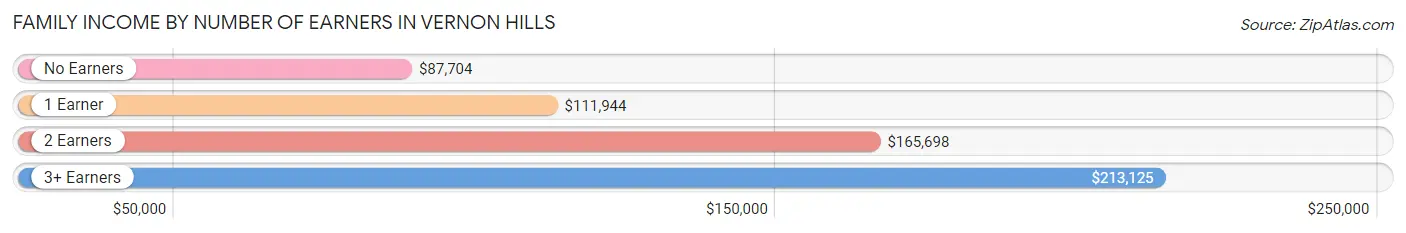
| Number of Earners | # Families | Median Income |
| No Earners | 957 (12.8%) | $87,704 |
| 1 Earner | 1,922 (25.8%) | $111,944 |
| 2 Earners | 3,723 (49.9%) | $165,698 |
| 3+ Earners | 860 (11.5%) | $213,125 |
| Total | 7,462 (100.0%) | $136,475 |
Household Income in Vernon Hills
Household Income Brackets in Vernon Hills
With 2,436 households falling in the category, the $200,000+ income range is the most frequent in Vernon Hills, accounting for 23.5% of all households. In contrast, only 135 households (1.3%) fall into the $10,000 to $14,999 income bracket, making it the least populous group.
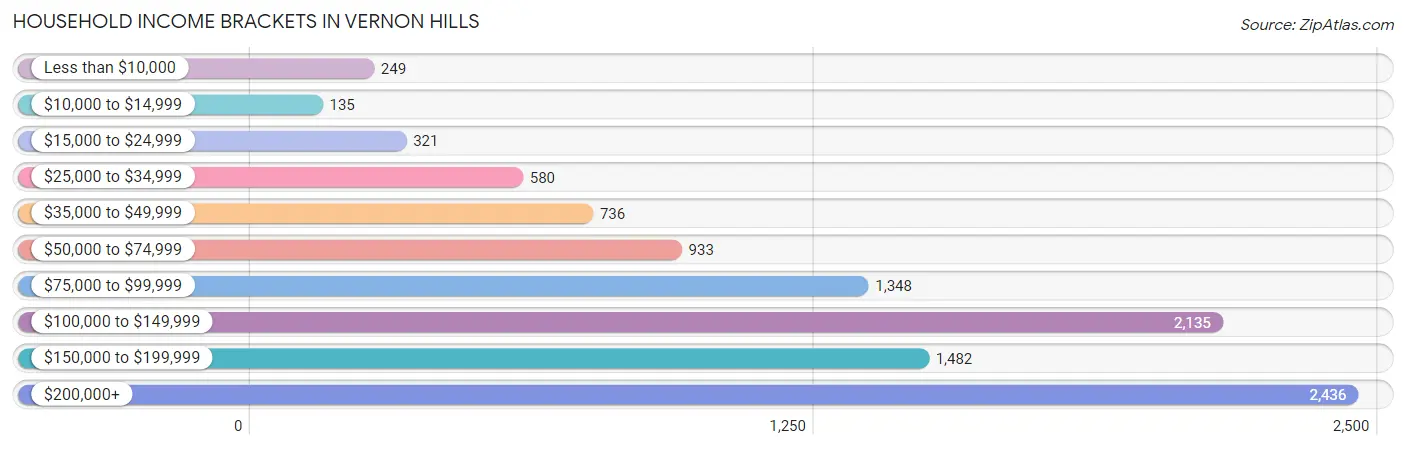
| Income Bracket | # Households | % Households |
| Less than $10,000 | 249 | 2.4% |
| $10,000 to $14,999 | 135 | 1.3% |
| $15,000 to $24,999 | 321 | 3.1% |
| $25,000 to $34,999 | 580 | 5.6% |
| $35,000 to $49,999 | 736 | 7.1% |
| $50,000 to $74,999 | 933 | 9.0% |
| $75,000 to $99,999 | 1,348 | 13.0% |
| $100,000 to $149,999 | 2,135 | 20.6% |
| $150,000 to $199,999 | 1,482 | 14.3% |
| $200,000+ | 2,436 | 23.5% |
Household Income by Householder Age in Vernon Hills
The median household income in Vernon Hills is $117,253, with the highest median household income of $158,086 found in the 45 to 64 years age bracket for the primary householder. A total of 4,051 households (39.1%) fall into this category. Meanwhile, the 15 to 24 years age bracket for the primary householder has the lowest median household income of $0, with 118 households (1.1%) in this group.
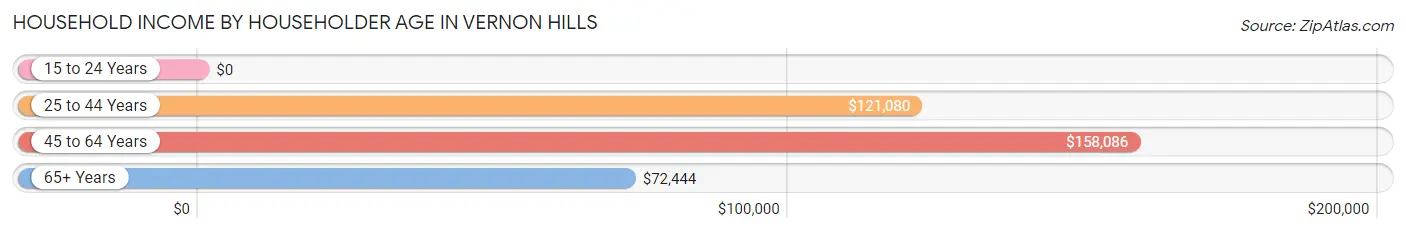
| Income Bracket | # Households | Median Income |
| 15 to 24 Years | 118 (1.1%) | $0 |
| 25 to 44 Years | 3,411 (32.9%) | $121,080 |
| 45 to 64 Years | 4,051 (39.1%) | $158,086 |
| 65+ Years | 2,786 (26.9%) | $72,444 |
| Total | 10,366 (100.0%) | $117,253 |
Poverty in Vernon Hills
Income Below Poverty by Sex and Age in Vernon Hills
With 4.0% poverty level for males and 5.0% for females among the residents of Vernon Hills, 75 year old and over males and 16 and 17 year old females are the most vulnerable to poverty, with 96 males (14.4%) and 63 females (11.6%) in their respective age groups living below the poverty level.
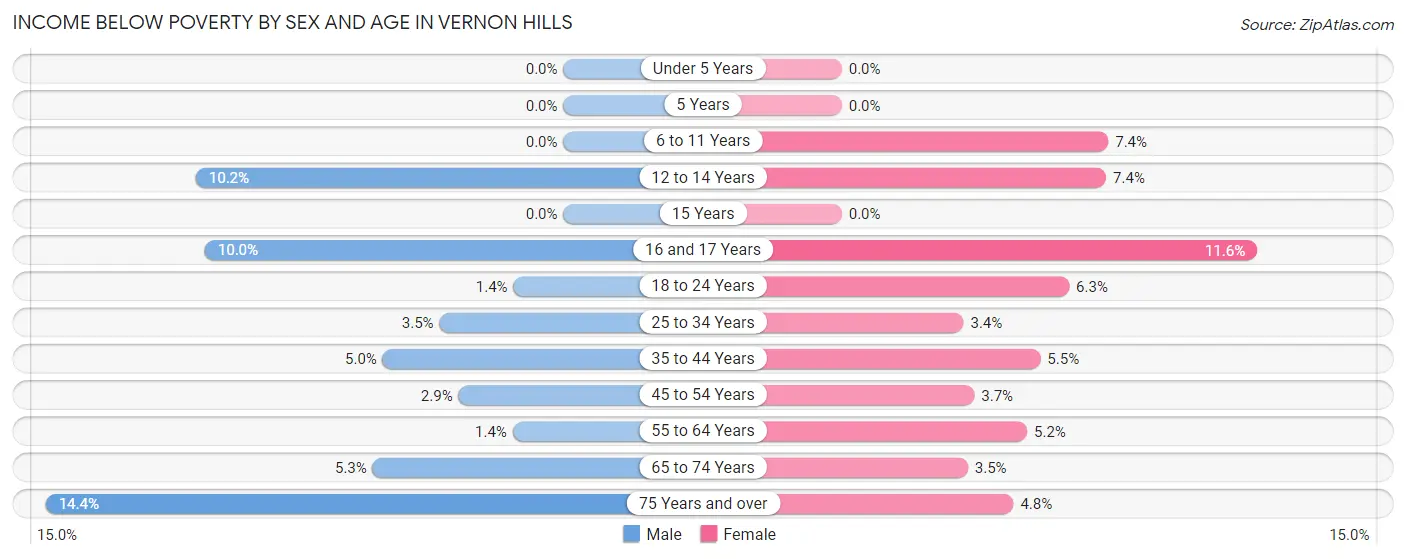
| Age Bracket | Male | Female |
| Under 5 Years | 0 (0.0%) | 0 (0.0%) |
| 5 Years | 0 (0.0%) | 0 (0.0%) |
| 6 to 11 Years | 0 (0.0%) | 72 (7.4%) |
| 12 to 14 Years | 75 (10.2%) | 54 (7.4%) |
| 15 Years | 0 (0.0%) | 0 (0.0%) |
| 16 and 17 Years | 56 (10.0%) | 63 (11.6%) |
| 18 to 24 Years | 12 (1.4%) | 62 (6.3%) |
| 25 to 34 Years | 44 (3.5%) | 38 (3.4%) |
| 35 to 44 Years | 102 (5.0%) | 123 (5.5%) |
| 45 to 54 Years | 62 (2.9%) | 70 (3.7%) |
| 55 to 64 Years | 22 (1.4%) | 92 (5.2%) |
| 65 to 74 Years | 60 (5.3%) | 39 (3.5%) |
| 75 Years and over | 96 (14.4%) | 63 (4.8%) |
| Total | 529 (4.0%) | 676 (5.0%) |
Income Above Poverty by Sex and Age in Vernon Hills
According to the poverty statistics in Vernon Hills, males aged under 5 years and females aged under 5 years are the age groups that are most secure financially, with 100.0% of males and 100.0% of females in these age groups living above the poverty line.
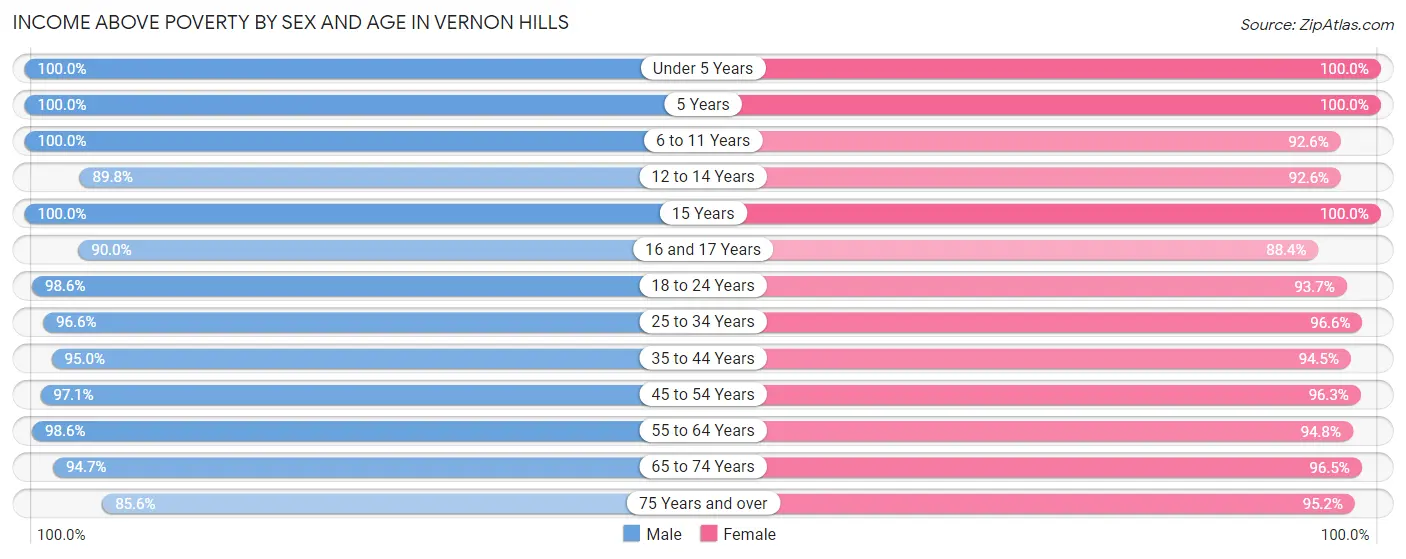
| Age Bracket | Male | Female |
| Under 5 Years | 815 (100.0%) | 390 (100.0%) |
| 5 Years | 95 (100.0%) | 154 (100.0%) |
| 6 to 11 Years | 1,261 (100.0%) | 898 (92.6%) |
| 12 to 14 Years | 658 (89.8%) | 680 (92.6%) |
| 15 Years | 142 (100.0%) | 206 (100.0%) |
| 16 and 17 Years | 505 (90.0%) | 482 (88.4%) |
| 18 to 24 Years | 849 (98.6%) | 917 (93.7%) |
| 25 to 34 Years | 1,232 (96.6%) | 1,082 (96.6%) |
| 35 to 44 Years | 1,926 (95.0%) | 2,103 (94.5%) |
| 45 to 54 Years | 2,060 (97.1%) | 1,828 (96.3%) |
| 55 to 64 Years | 1,533 (98.6%) | 1,692 (94.8%) |
| 65 to 74 Years | 1,070 (94.7%) | 1,071 (96.5%) |
| 75 Years and over | 570 (85.6%) | 1,254 (95.2%) |
| Total | 12,716 (96.0%) | 12,757 (95.0%) |
Income Below Poverty Among Married-Couple Families in Vernon Hills
The poverty statistics for married-couple families in Vernon Hills show that 2.1% or 127 of the total 5,944 families live below the poverty line. Families with no children have the highest poverty rate of 2.2%, comprising of 65 families. On the other hand, families with 3 or 4 children have the lowest poverty rate of 0.0%, which includes 0 families.
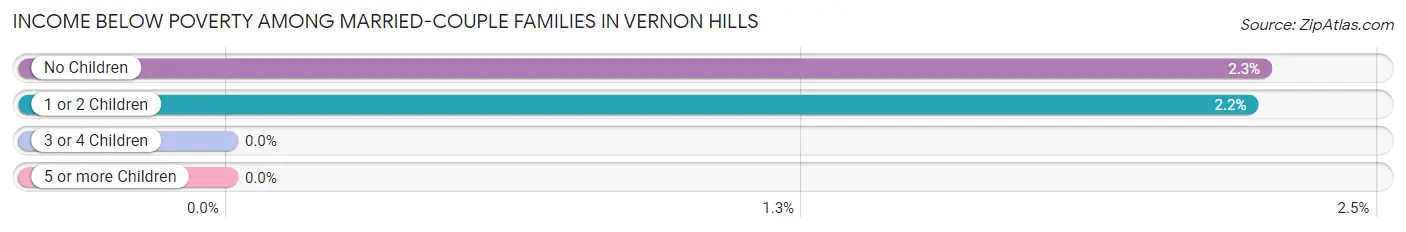
| Children | Above Poverty | Below Poverty |
| No Children | 2,830 (97.8%) | 65 (2.2%) |
| 1 or 2 Children | 2,735 (97.8%) | 62 (2.2%) |
| 3 or 4 Children | 241 (100.0%) | 0 (0.0%) |
| 5 or more Children | 11 (100.0%) | 0 (0.0%) |
| Total | 5,817 (97.9%) | 127 (2.1%) |
Income Below Poverty Among Single-Parent Households in Vernon Hills
According to the poverty data in Vernon Hills, 2.4% or 9 single-father households and 10.8% or 124 single-mother households are living below the poverty line. Among single-father households, those with no children have the highest poverty rate, with 9 households (6.2%) experiencing poverty. Likewise, among single-mother households, those with 3 or 4 children have the highest poverty rate, with 60 households (55.6%) falling below the poverty line.
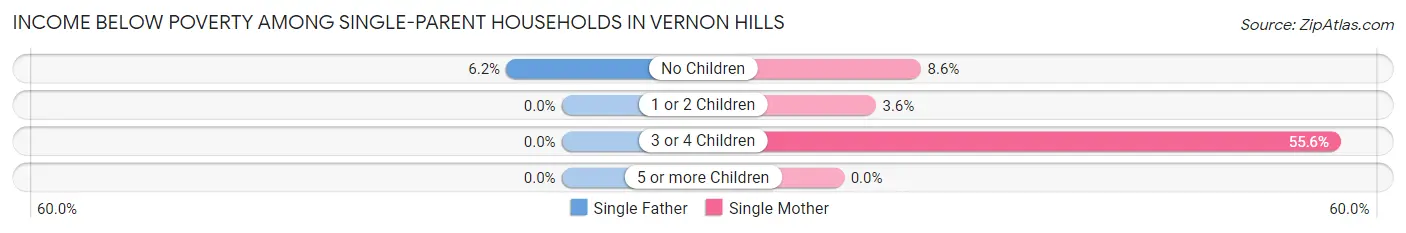
| Children | Single Father | Single Mother |
| No Children | 9 (6.2%) | 46 (8.6%) |
| 1 or 2 Children | 0 (0.0%) | 18 (3.6%) |
| 3 or 4 Children | 0 (0.0%) | 60 (55.6%) |
| 5 or more Children | 0 (0.0%) | 0 (0.0%) |
| Total | 9 (2.4%) | 124 (10.8%) |
Income Below Poverty Among Married-Couple vs Single-Parent Households in Vernon Hills
The poverty data for Vernon Hills shows that 127 of the married-couple family households (2.1%) and 133 of the single-parent households (8.8%) are living below the poverty level. Within the married-couple family households, those with no children have the highest poverty rate, with 65 households (2.2%) falling below the poverty line. Among the single-parent households, those with 3 or 4 children have the highest poverty rate, with 60 household (42.9%) living below poverty.
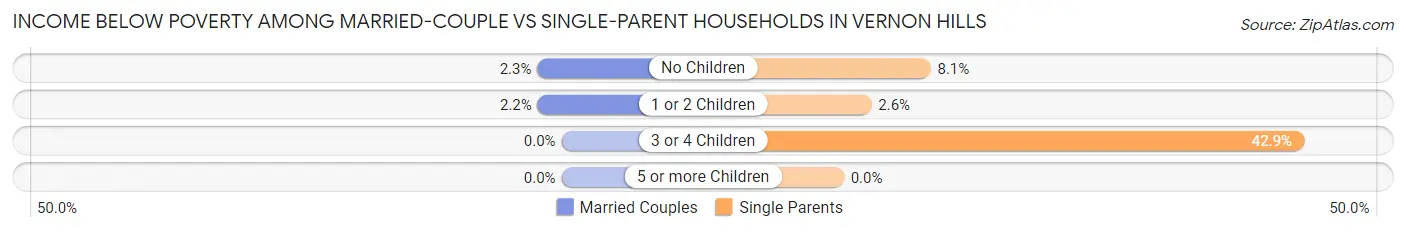
| Children | Married-Couple Families | Single-Parent Households |
| No Children | 65 (2.2%) | 55 (8.1%) |
| 1 or 2 Children | 62 (2.2%) | 18 (2.6%) |
| 3 or 4 Children | 0 (0.0%) | 60 (42.9%) |
| 5 or more Children | 0 (0.0%) | 0 (0.0%) |
| Total | 127 (2.1%) | 133 (8.8%) |
Race in Vernon Hills
The most populous races in Vernon Hills are White / Caucasian (17,077 | 63.8%), Asian (6,818 | 25.5%), and Hispanic or Latino (3,195 | 11.9%).
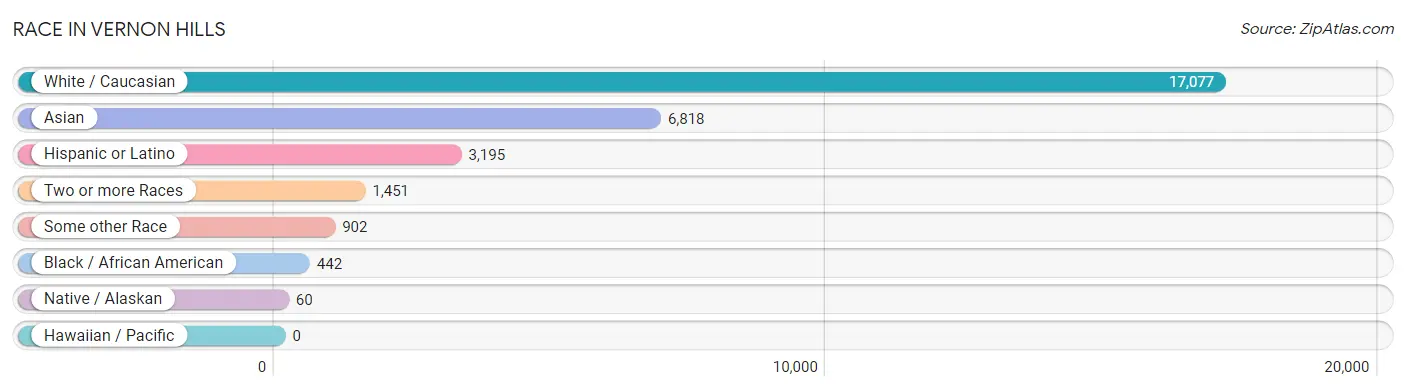
| Race | # Population | % Population |
| Asian | 6,818 | 25.5% |
| Black / African American | 442 | 1.7% |
| Hawaiian / Pacific | 0 | 0.0% |
| Hispanic or Latino | 3,195 | 11.9% |
| Native / Alaskan | 60 | 0.2% |
| White / Caucasian | 17,077 | 63.8% |
| Two or more Races | 1,451 | 5.4% |
| Some other Race | 902 | 3.4% |
| Total | 26,750 | 100.0% |
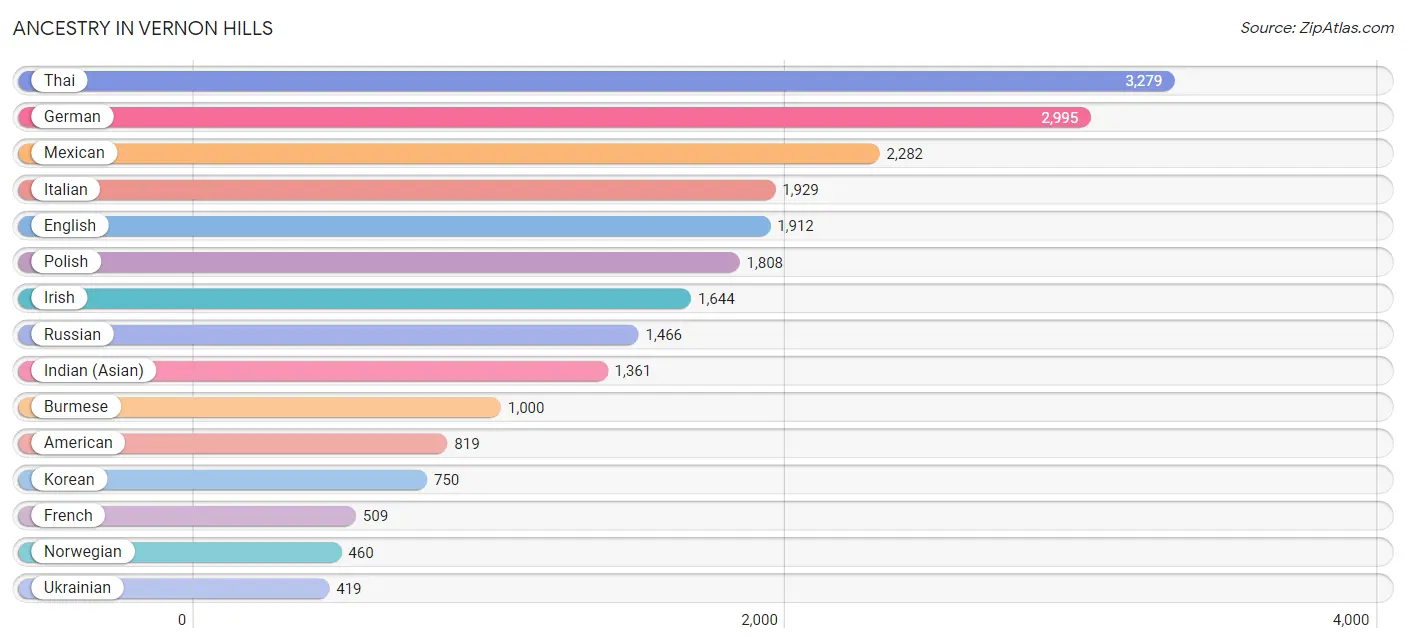
Ancestry in Vernon Hills
The most populous ancestries reported in Vernon Hills are Thai (3,279 | 12.3%), German (2,995 | 11.2%), Mexican (2,282 | 8.5%), Italian (1,929 | 7.2%), and English (1,912 | 7.1%), together accounting for 46.4% of all Vernon Hills residents.
| Ancestry | # Population | % Population |
| American | 819 | 3.1% |
| Arab | 95 | 0.4% |
| Argentinean | 35 | 0.1% |
| Armenian | 38 | 0.1% |
| Assyrian / Chaldean / Syriac | 4 | 0.0% |
| Austrian | 127 | 0.5% |
| Belgian | 7 | 0.0% |
| Bhutanese | 119 | 0.4% |
| Blackfeet | 8 | 0.0% |
| British | 110 | 0.4% |
| Bulgarian | 32 | 0.1% |
| Burmese | 1,000 | 3.7% |
| Cambodian | 180 | 0.7% |
| Canadian | 54 | 0.2% |
| Central American | 200 | 0.7% |
| Central American Indian | 18 | 0.1% |
| Cherokee | 59 | 0.2% |
| Colombian | 57 | 0.2% |
| Croatian | 23 | 0.1% |
| Cuban | 16 | 0.1% |
| Czech | 273 | 1.0% |
| Czechoslovakian | 35 | 0.1% |
| Danish | 66 | 0.3% |
| Dominican | 73 | 0.3% |
| Dutch | 160 | 0.6% |
| Eastern European | 309 | 1.2% |
| Ecuadorian | 88 | 0.3% |
| English | 1,912 | 7.1% |
| Ethiopian | 13 | 0.1% |
| European | 240 | 0.9% |
| Filipino | 147 | 0.5% |
| Finnish | 43 | 0.2% |
| French | 509 | 1.9% |
| French Canadian | 3 | 0.0% |
| German | 2,995 | 11.2% |
| Greek | 220 | 0.8% |
| Guatemalan | 123 | 0.5% |
| Haitian | 62 | 0.2% |
| Honduran | 52 | 0.2% |
| Hungarian | 273 | 1.0% |
| Indian (Asian) | 1,361 | 5.1% |
| Iranian | 46 | 0.2% |
| Iraqi | 28 | 0.1% |
| Irish | 1,644 | 6.1% |
| Israeli | 11 | 0.0% |
| Italian | 1,929 | 7.2% |
| Kenyan | 92 | 0.3% |
| Korean | 750 | 2.8% |
| Latvian | 82 | 0.3% |
| Lebanese | 33 | 0.1% |
| Lithuanian | 163 | 0.6% |
| Mexican | 2,282 | 8.5% |
| Mexican American Indian | 141 | 0.5% |
| Nigerian | 111 | 0.4% |
| Northern European | 4 | 0.0% |
| Norwegian | 460 | 1.7% |
| Pakistani | 24 | 0.1% |
| Peruvian | 10 | 0.0% |
| Polish | 1,808 | 6.8% |
| Portuguese | 22 | 0.1% |
| Potawatomi | 51 | 0.2% |
| Puerto Rican | 297 | 1.1% |
| Romanian | 185 | 0.7% |
| Russian | 1,466 | 5.5% |
| Salvadoran | 25 | 0.1% |
| Scandinavian | 145 | 0.5% |
| Scotch-Irish | 65 | 0.2% |
| Scottish | 133 | 0.5% |
| Serbian | 8 | 0.0% |
| Slavic | 325 | 1.2% |
| Slovak | 52 | 0.2% |
| Slovene | 9 | 0.0% |
| South American | 255 | 0.9% |
| Spaniard | 20 | 0.1% |
| Spanish | 40 | 0.2% |
| Sri Lankan | 19 | 0.1% |
| Subsaharan African | 216 | 0.8% |
| Swedish | 289 | 1.1% |
| Swiss | 98 | 0.4% |
| Thai | 3,279 | 12.3% |
| Turkish | 100 | 0.4% |
| Ukrainian | 419 | 1.6% |
| Venezuelan | 65 | 0.2% |
| Vietnamese | 30 | 0.1% |
| Welsh | 79 | 0.3% |
| Yugoslavian | 66 | 0.3% | View All 86 Rows |
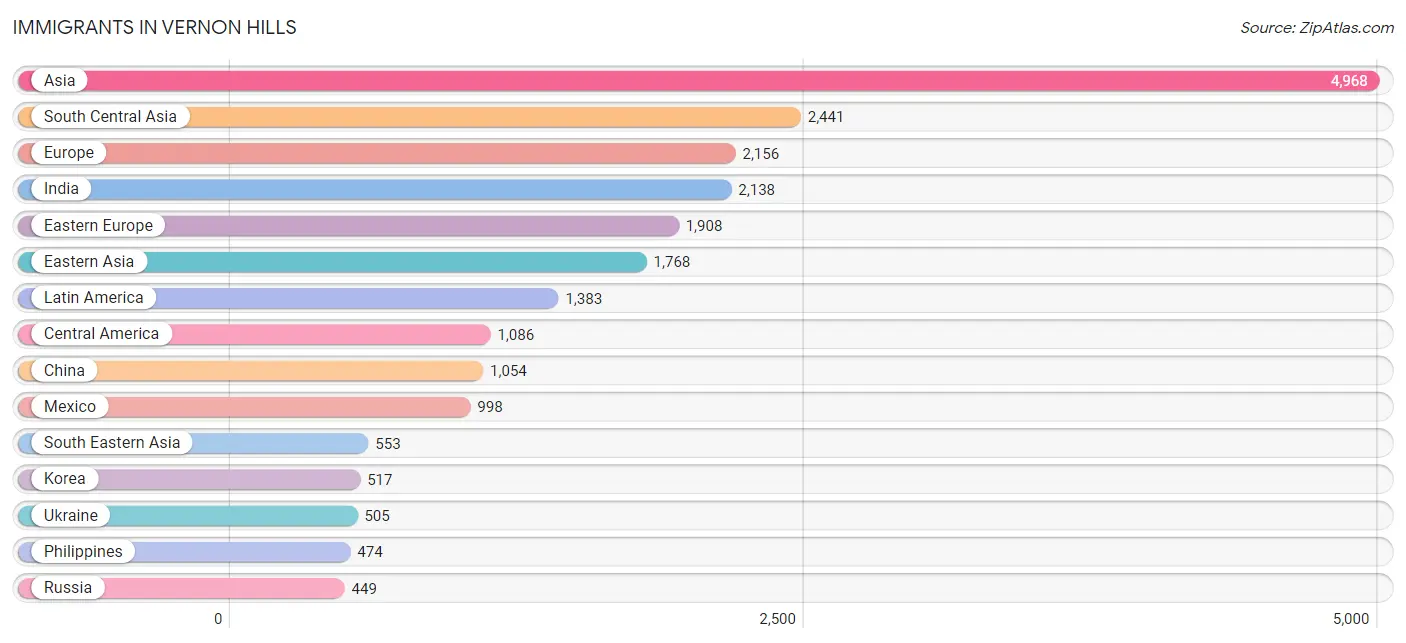
Immigrants in Vernon Hills
The most numerous immigrant groups reported in Vernon Hills came from Asia (4,968 | 18.6%), South Central Asia (2,441 | 9.1%), Europe (2,156 | 8.1%), India (2,138 | 8.0%), and Eastern Europe (1,908 | 7.1%), together accounting for 50.9% of all Vernon Hills residents.
| Immigration Origin | # Population | % Population |
| Africa | 104 | 0.4% |
| Argentina | 34 | 0.1% |
| Asia | 4,968 | 18.6% |
| Belarus | 363 | 1.4% |
| Brazil | 125 | 0.5% |
| Bulgaria | 32 | 0.1% |
| Canada | 91 | 0.3% |
| Caribbean | 47 | 0.2% |
| Central America | 1,086 | 4.1% |
| China | 1,054 | 3.9% |
| Colombia | 32 | 0.1% |
| Cuba | 9 | 0.0% |
| Dominican Republic | 38 | 0.1% |
| Eastern Africa | 70 | 0.3% |
| Eastern Asia | 1,768 | 6.6% |
| Eastern Europe | 1,908 | 7.1% |
| Ecuador | 31 | 0.1% |
| Egypt | 34 | 0.1% |
| El Salvador | 25 | 0.1% |
| England | 17 | 0.1% |
| Ethiopia | 26 | 0.1% |
| Europe | 2,156 | 8.1% |
| France | 24 | 0.1% |
| Germany | 100 | 0.4% |
| Greece | 4 | 0.0% |
| Guatemala | 21 | 0.1% |
| Honduras | 42 | 0.2% |
| Hong Kong | 8 | 0.0% |
| India | 2,138 | 8.0% |
| Indonesia | 23 | 0.1% |
| Iran | 48 | 0.2% |
| Iraq | 28 | 0.1% |
| Israel | 51 | 0.2% |
| Italy | 34 | 0.1% |
| Japan | 57 | 0.2% |
| Kenya | 39 | 0.2% |
| Korea | 517 | 1.9% |
| Kuwait | 18 | 0.1% |
| Latin America | 1,383 | 5.2% |
| Latvia | 113 | 0.4% |
| Lithuania | 64 | 0.2% |
| Mexico | 998 | 3.7% |
| Moldova | 16 | 0.1% |
| Northern Africa | 34 | 0.1% |
| Northern Europe | 79 | 0.3% |
| Pakistan | 245 | 0.9% |
| Peru | 10 | 0.0% |
| Philippines | 474 | 1.8% |
| Poland | 244 | 0.9% |
| Portugal | 7 | 0.0% |
| Romania | 39 | 0.2% |
| Russia | 449 | 1.7% |
| Saudi Arabia | 38 | 0.1% |
| Serbia | 23 | 0.1% |
| South America | 250 | 0.9% |
| South Central Asia | 2,441 | 9.1% |
| South Eastern Asia | 553 | 2.1% |
| Southern Europe | 45 | 0.2% |
| Taiwan | 246 | 0.9% |
| Thailand | 37 | 0.1% |
| Turkey | 44 | 0.2% |
| Ukraine | 505 | 1.9% |
| Uzbekistan | 10 | 0.0% |
| Venezuela | 18 | 0.1% |
| Vietnam | 19 | 0.1% |
| Western Asia | 206 | 0.8% |
| Western Europe | 124 | 0.5% | View All 67 Rows |
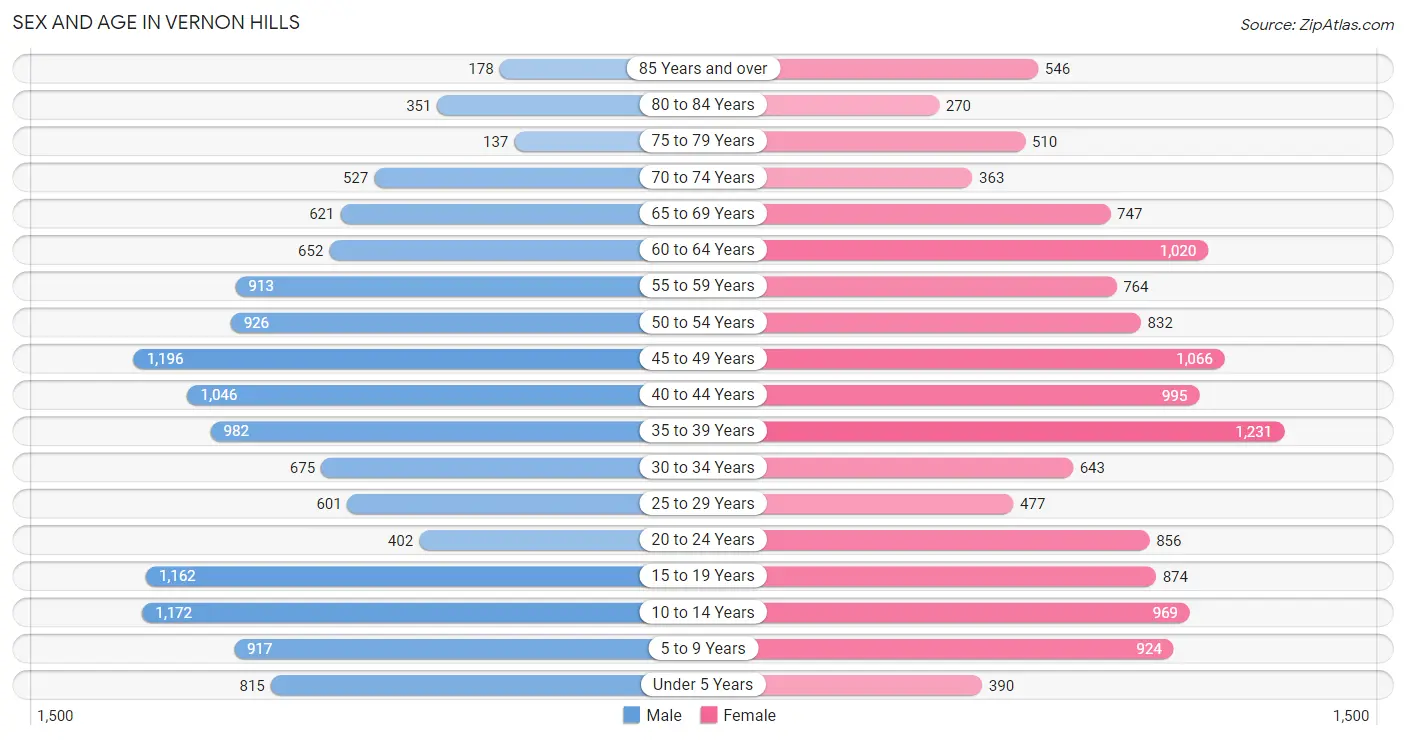
Sex and Age in Vernon Hills
Sex and Age in Vernon Hills
The most populous age groups in Vernon Hills are 45 to 49 Years (1,196 | 9.0%) for men and 35 to 39 Years (1,231 | 9.1%) for women.
| Age Bracket | Male | Female |
| Under 5 Years | 815 (6.1%) | 390 (2.9%) |
| 5 to 9 Years | 917 (6.9%) | 924 (6.9%) |
| 10 to 14 Years | 1,172 (8.8%) | 969 (7.2%) |
| 15 to 19 Years | 1,162 (8.7%) | 874 (6.5%) |
| 20 to 24 Years | 402 (3.0%) | 856 (6.4%) |
| 25 to 29 Years | 601 (4.5%) | 477 (3.5%) |
| 30 to 34 Years | 675 (5.1%) | 643 (4.8%) |
| 35 to 39 Years | 982 (7.4%) | 1,231 (9.1%) |
| 40 to 44 Years | 1,046 (7.9%) | 995 (7.4%) |
| 45 to 49 Years | 1,196 (9.0%) | 1,066 (7.9%) |
| 50 to 54 Years | 926 (7.0%) | 832 (6.2%) |
| 55 to 59 Years | 913 (6.9%) | 764 (5.7%) |
| 60 to 64 Years | 652 (4.9%) | 1,020 (7.6%) |
| 65 to 69 Years | 621 (4.7%) | 747 (5.5%) |
| 70 to 74 Years | 527 (4.0%) | 363 (2.7%) |
| 75 to 79 Years | 137 (1.0%) | 510 (3.8%) |
| 80 to 84 Years | 351 (2.6%) | 270 (2.0%) |
| 85 Years and over | 178 (1.3%) | 546 (4.1%) |
| Total | 13,273 (100.0%) | 13,477 (100.0%) |
Families and Households in Vernon Hills
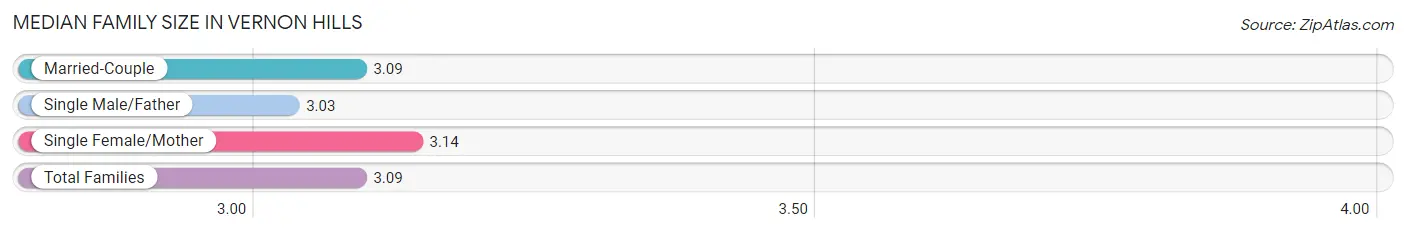
Median Family Size in Vernon Hills
The median family size in Vernon Hills is 3.09 persons per family, with single female/mother families (1,149 | 15.4%) accounting for the largest median family size of 3.14 persons per family. On the other hand, single male/father families (369 | 5.0%) represent the smallest median family size with 3.03 persons per family.
| Family Type | # Families | Family Size |
| Married-Couple | 5,944 (79.7%) | 3.09 |
| Single Male/Father | 369 (5.0%) | 3.03 |
| Single Female/Mother | 1,149 (15.4%) | 3.14 |
| Total Families | 7,462 (100.0%) | 3.09 |
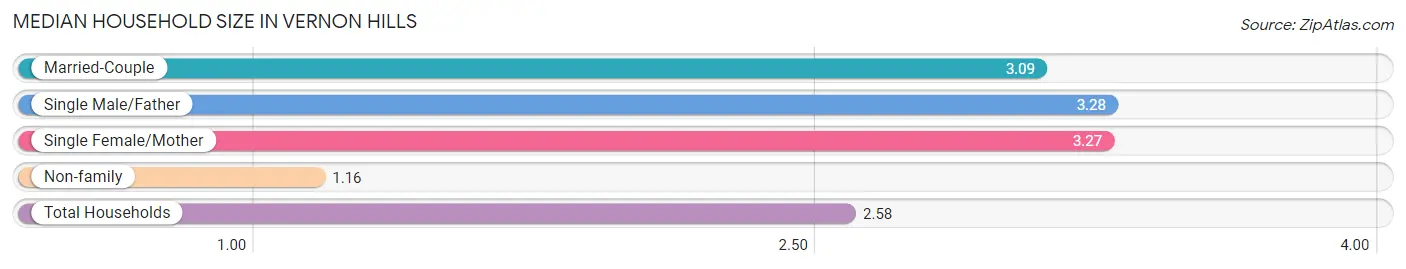
Median Household Size in Vernon Hills
The median household size in Vernon Hills is 2.58 persons per household, with single male/father households (369 | 3.6%) accounting for the largest median household size of 3.28 persons per household. non-family households (2,904 | 28.0%) represent the smallest median household size with 1.16 persons per household.
| Household Type | # Households | Household Size |
| Married-Couple | 5,944 (57.3%) | 3.09 |
| Single Male/Father | 369 (3.6%) | 3.28 |
| Single Female/Mother | 1,149 (11.1%) | 3.27 |
| Non-family | 2,904 (28.0%) | 1.16 |
| Total Households | 10,366 (100.0%) | 2.58 |
Household Size by Marriage Status in Vernon Hills
Out of a total of 10,366 households in Vernon Hills, 7,462 (72.0%) are family households, while 2,904 (28.0%) are nonfamily households. The most numerous type of family households are 2-person households, comprising 3,056, and the most common type of nonfamily households are 1-person households, comprising 2,474.
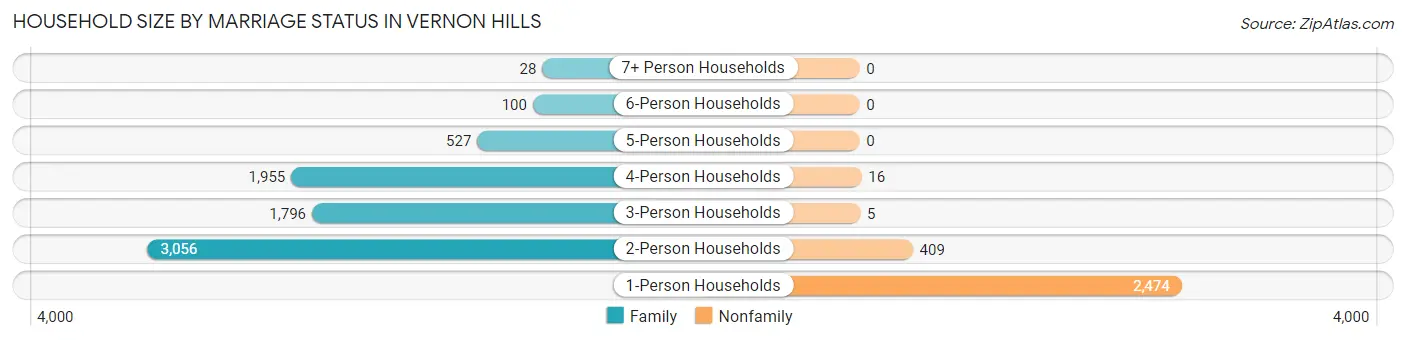
| Household Size | Family Households | Nonfamily Households |
| 1-Person Households | - | 2,474 (23.9%) |
| 2-Person Households | 3,056 (29.5%) | 409 (4.0%) |
| 3-Person Households | 1,796 (17.3%) | 5 (0.1%) |
| 4-Person Households | 1,955 (18.9%) | 16 (0.2%) |
| 5-Person Households | 527 (5.1%) | 0 (0.0%) |
| 6-Person Households | 100 (1.0%) | 0 (0.0%) |
| 7+ Person Households | 28 (0.3%) | 0 (0.0%) |
| Total | 7,462 (72.0%) | 2,904 (28.0%) |
Female Fertility in Vernon Hills
Fertility by Age in Vernon Hills
Average fertility rate in Vernon Hills is 40.0 births per 1,000 women. Women in the age bracket of 20 to 34 years have the highest fertility rate with 70.0 births per 1,000 women. Women in the age bracket of 20 to 34 years acount for 55.2% of all women with births.
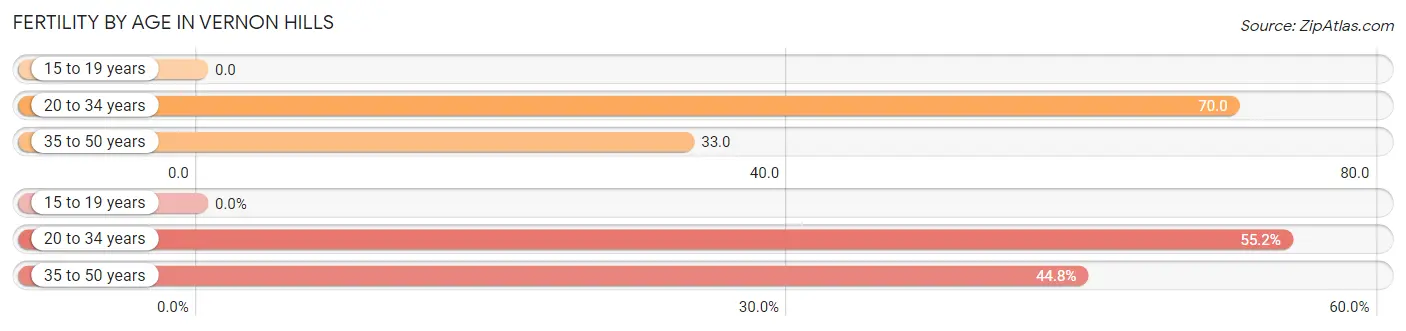
| Age Bracket | Women with Births | Births / 1,000 Women |
| 15 to 19 years | 0 (0.0%) | 0.0 |
| 20 to 34 years | 138 (55.2%) | 70.0 |
| 35 to 50 years | 112 (44.8%) | 33.0 |
| Total | 250 (100.0%) | 40.0 |
Fertility by Age by Marriage Status in Vernon Hills
94.4% of women with births (250) in Vernon Hills are married. The highest percentage of unmarried women with births falls into 20 to 34 years age bracket with 10.1% of them unmarried at the time of birth, while the lowest percentage of unmarried women with births belong to 35 to 50 years age bracket with 0.0% of them unmarried.
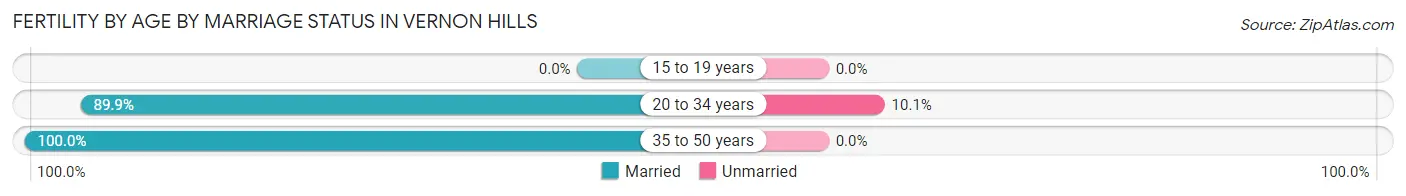
| Age Bracket | Married | Unmarried |
| 15 to 19 years | 0 (0.0%) | 0 (0.0%) |
| 20 to 34 years | 124 (89.9%) | 14 (10.1%) |
| 35 to 50 years | 112 (100.0%) | 0 (0.0%) |
| Total | 236 (94.4%) | 14 (5.6%) |
Fertility by Education in Vernon Hills
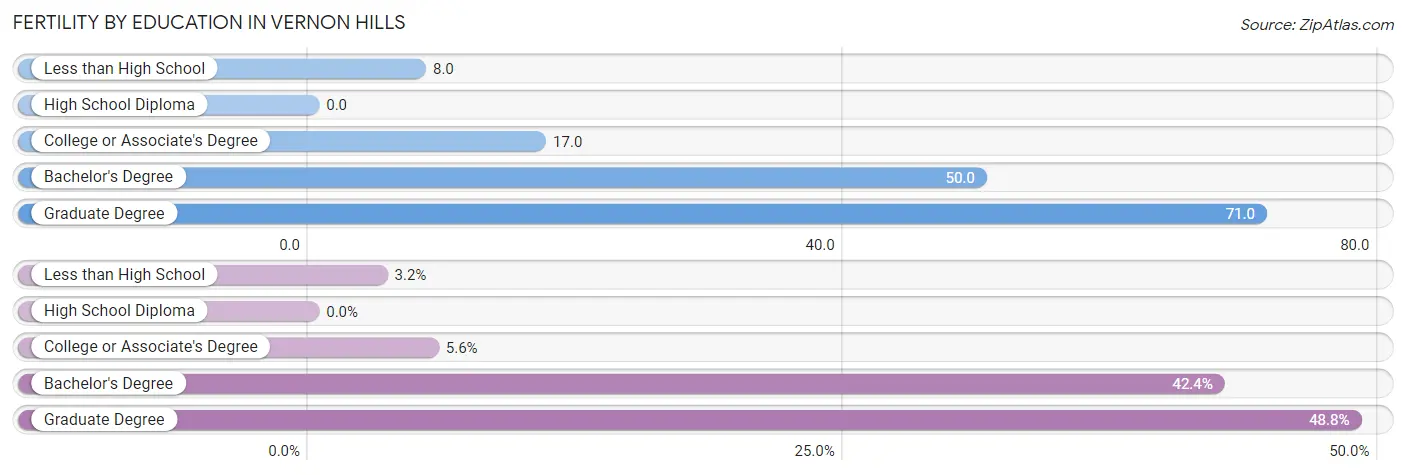
| Educational Attainment | Women with Births | Births / 1,000 Women |
| Less than High School | 8 (3.2%) | 8.0 |
| High School Diploma | 0 (0.0%) | 0.0 |
| College or Associate's Degree | 14 (5.6%) | 17.0 |
| Bachelor's Degree | 106 (42.4%) | 50.0 |
| Graduate Degree | 122 (48.8%) | 71.0 |
| Total | 250 (100.0%) | 40.0 |
Fertility by Education by Marriage Status in Vernon Hills
5.6% of women with births in Vernon Hills are unmarried. Women with the educational attainment of less than high school are most likely to be married with 100.0% of them married at childbirth, while women with the educational attainment of college or associate's degree are least likely to be married with 100.0% of them unmarried at childbirth.
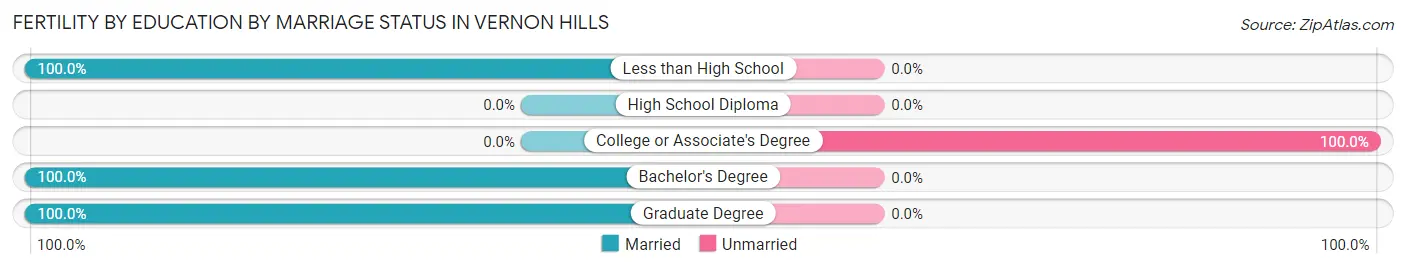
| Educational Attainment | Married | Unmarried |
| Less than High School | 8 (100.0%) | 0 (0.0%) |
| High School Diploma | 0 (0.0%) | 0 (0.0%) |
| College or Associate's Degree | 0 (0.0%) | 14 (100.0%) |
| Bachelor's Degree | 106 (100.0%) | 0 (0.0%) |
| Graduate Degree | 122 (100.0%) | 0 (0.0%) |
| Total | 236 (94.4%) | 14 (5.6%) |
Employment Characteristics in Vernon Hills
Employment by Class of Employer in Vernon Hills
Among the 13,741 employed individuals in Vernon Hills, private company employees (10,528 | 76.6%), not-for-profit organizations (943 | 6.9%), and local government employees (777 | 5.7%) make up the most common classes of employment.
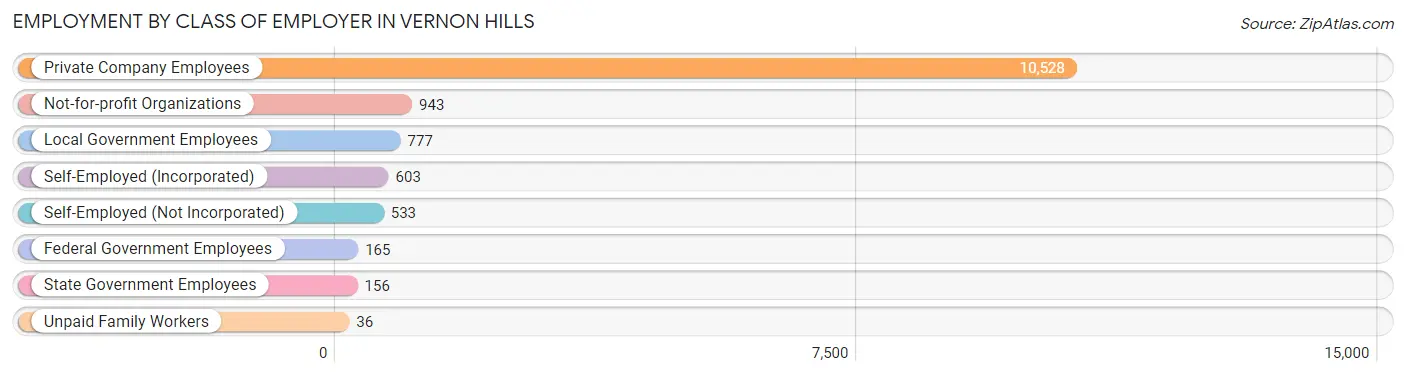
| Employer Class | # Employees | % Employees |
| Private Company Employees | 10,528 | 76.6% |
| Self-Employed (Incorporated) | 603 | 4.4% |
| Self-Employed (Not Incorporated) | 533 | 3.9% |
| Not-for-profit Organizations | 943 | 6.9% |
| Local Government Employees | 777 | 5.7% |
| State Government Employees | 156 | 1.1% |
| Federal Government Employees | 165 | 1.2% |
| Unpaid Family Workers | 36 | 0.3% |
| Total | 13,741 | 100.0% |
Employment Status by Age in Vernon Hills
According to the labor force statistics for Vernon Hills, out of the total population over 16 years of age (21,215), 68.9% or 14,617 individuals are in the labor force, with 3.7% or 541 of them unemployed. The age group with the highest labor force participation rate is 45 to 54 years, with 89.1% or 3,582 individuals in the labor force. Within the labor force, the 75 years and over age range has the highest percentage of unemployed individuals, with 11.9% or 12 of them being unemployed.
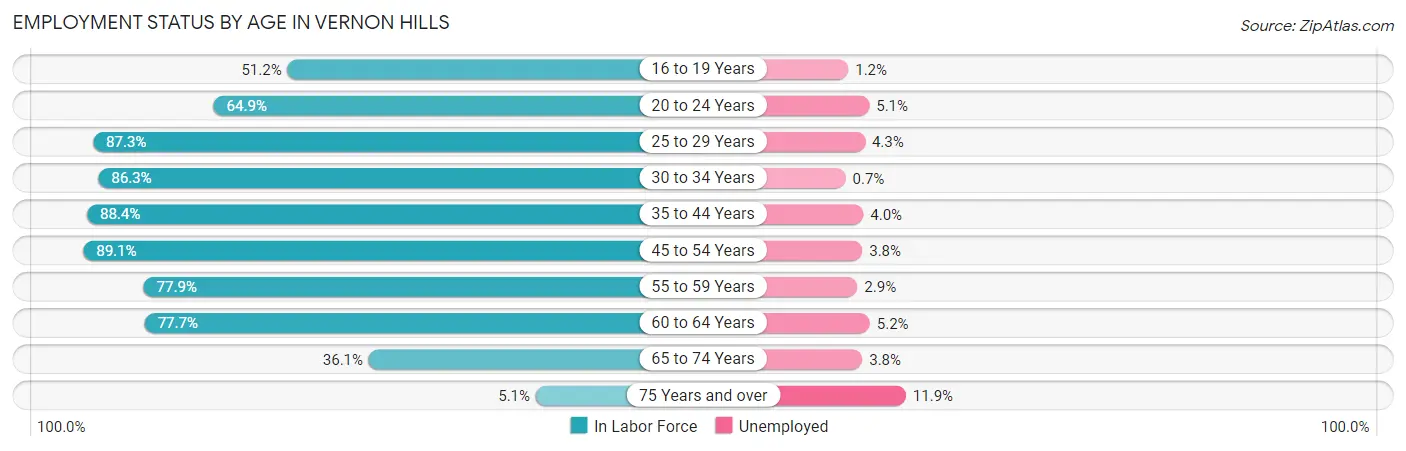
| Age Bracket | In Labor Force | Unemployed |
| 16 to 19 Years | 864 (51.2%) | 10 (1.2%) |
| 20 to 24 Years | 816 (64.9%) | 42 (5.1%) |
| 25 to 29 Years | 941 (87.3%) | 40 (4.3%) |
| 30 to 34 Years | 1,137 (86.3%) | 8 (0.7%) |
| 35 to 44 Years | 3,761 (88.4%) | 150 (4.0%) |
| 45 to 54 Years | 3,582 (89.1%) | 136 (3.8%) |
| 55 to 59 Years | 1,306 (77.9%) | 38 (2.9%) |
| 60 to 64 Years | 1,299 (77.7%) | 68 (5.2%) |
| 65 to 74 Years | 815 (36.1%) | 31 (3.8%) |
| 75 Years and over | 102 (5.1%) | 12 (11.9%) |
| Total | 14,617 (68.9%) | 541 (3.7%) |
Employment Status by Educational Attainment in Vernon Hills
According to labor force statistics for Vernon Hills, 85.8% of individuals (12,028) out of the total population between 25 and 64 years of age (14,019) are in the labor force, with 3.7% or 445 of them being unemployed. The group with the highest labor force participation rate are those with the educational attainment of bachelor's degree or higher, with 88.7% or 8,817 individuals in the labor force. Within the labor force, individuals with less than high school education have the highest percentage of unemployment, with 6.4% or 32 of them being unemployed.
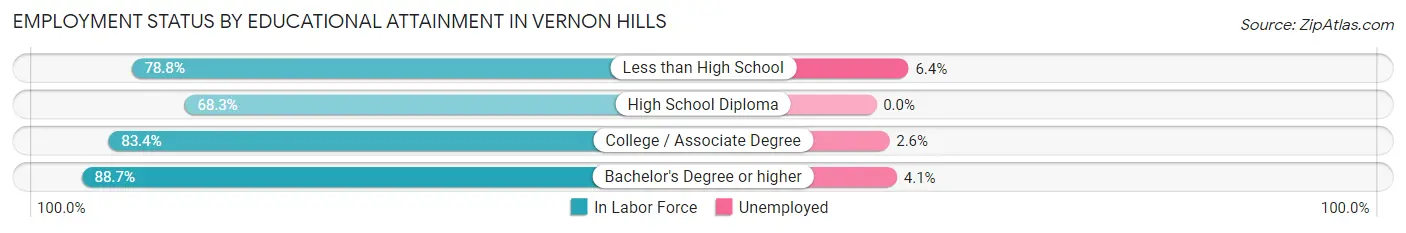
| Educational Attainment | In Labor Force | Unemployed |
| Less than High School | 501 (78.8%) | 41 (6.4%) |
| High School Diploma | 753 (68.3%) | 0 (0.0%) |
| College / Associate Degree | 1,952 (83.4%) | 61 (2.6%) |
| Bachelor's Degree or higher | 8,817 (88.7%) | 408 (4.1%) |
| Total | 12,028 (85.8%) | 519 (3.7%) |
Employment Occupations by Sex in Vernon Hills
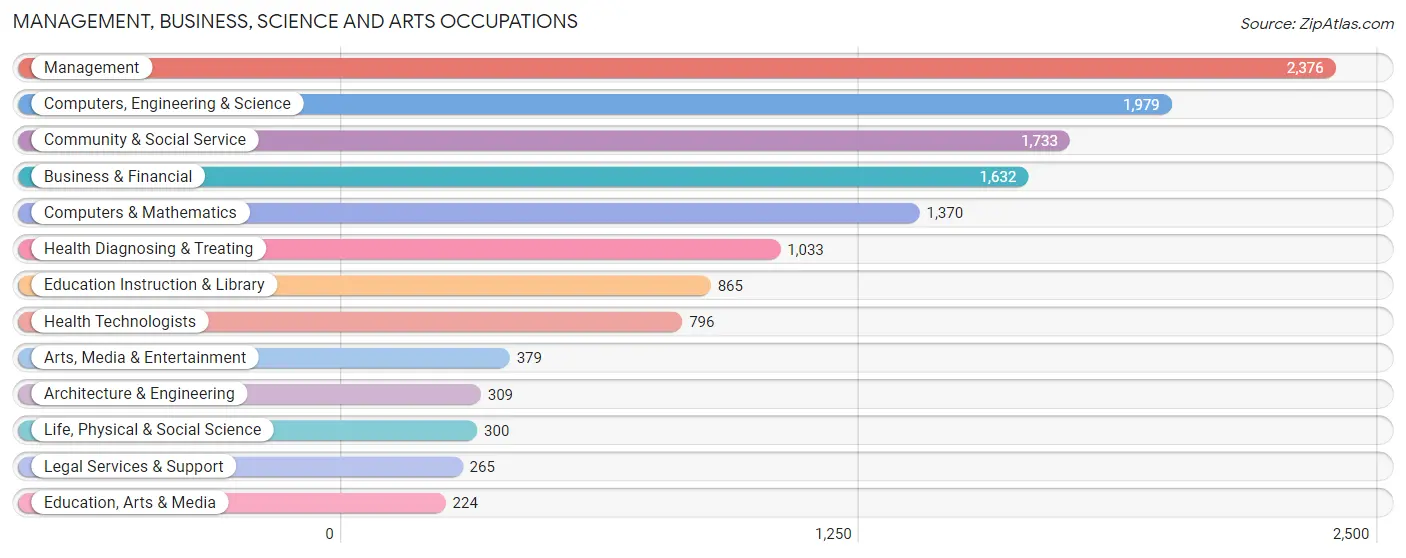
Management, Business, Science and Arts Occupations
The most common Management, Business, Science and Arts occupations in Vernon Hills are Management (2,376 | 17.0%), Computers, Engineering & Science (1,979 | 14.1%), Community & Social Service (1,733 | 12.4%), Business & Financial (1,632 | 11.7%), and Computers & Mathematics (1,370 | 9.8%).
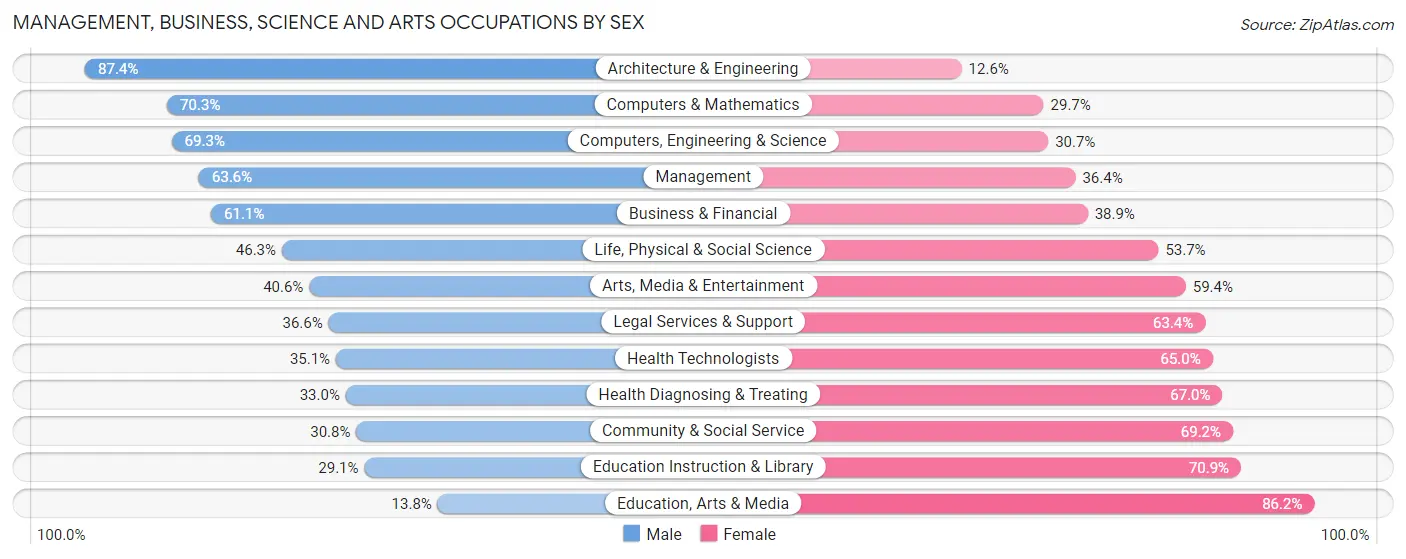
Management, Business, Science and Arts Occupations by Sex
Within the Management, Business, Science and Arts occupations in Vernon Hills, the most male-oriented occupations are Architecture & Engineering (87.4%), Computers & Mathematics (70.3%), and Computers, Engineering & Science (69.3%), while the most female-oriented occupations are Education, Arts & Media (86.2%), Education Instruction & Library (70.9%), and Community & Social Service (69.2%).
| Occupation | Male | Female |
| Management | 1,512 (63.6%) | 864 (36.4%) |
| Business & Financial | 997 (61.1%) | 635 (38.9%) |
| Computers, Engineering & Science | 1,372 (69.3%) | 607 (30.7%) |
| Computers & Mathematics | 963 (70.3%) | 407 (29.7%) |
| Architecture & Engineering | 270 (87.4%) | 39 (12.6%) |
| Life, Physical & Social Science | 139 (46.3%) | 161 (53.7%) |
| Community & Social Service | 534 (30.8%) | 1,199 (69.2%) |
| Education, Arts & Media | 31 (13.8%) | 193 (86.2%) |
| Legal Services & Support | 97 (36.6%) | 168 (63.4%) |
| Education Instruction & Library | 252 (29.1%) | 613 (70.9%) |
| Arts, Media & Entertainment | 154 (40.6%) | 225 (59.4%) |
| Health Diagnosing & Treating | 341 (33.0%) | 692 (67.0%) |
| Health Technologists | 279 (35.0%) | 517 (64.9%) |
| Total (Category) | 4,756 (54.3%) | 3,997 (45.7%) |
| Total (Overall) | 7,521 (53.7%) | 6,486 (46.3%) |
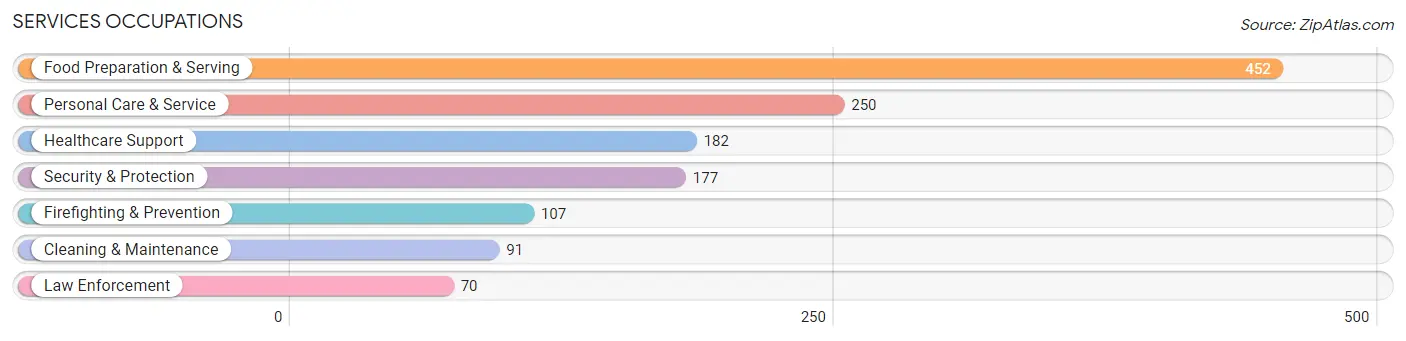
Services Occupations
The most common Services occupations in Vernon Hills are Food Preparation & Serving (452 | 3.2%), Personal Care & Service (250 | 1.8%), Healthcare Support (182 | 1.3%), Security & Protection (177 | 1.3%), and Firefighting & Prevention (107 | 0.8%).
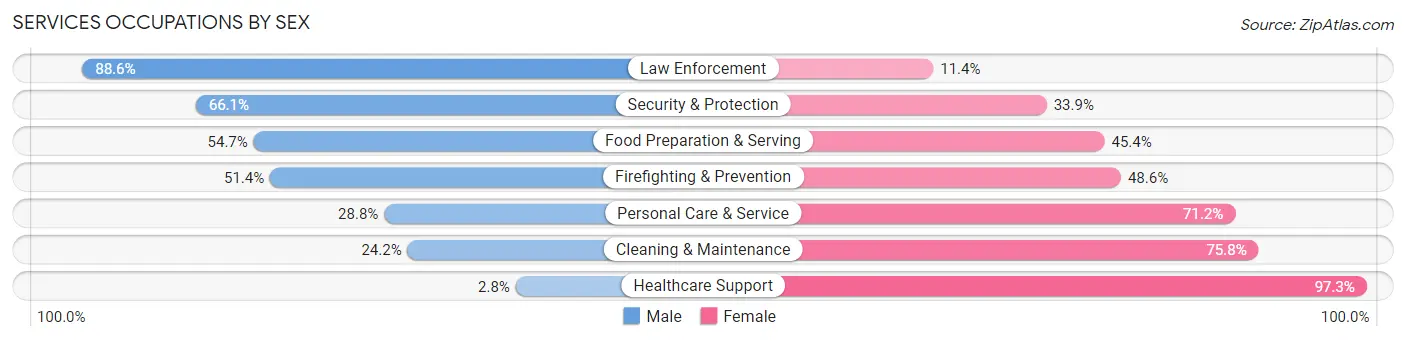
Services Occupations by Sex
Within the Services occupations in Vernon Hills, the most male-oriented occupations are Law Enforcement (88.6%), Security & Protection (66.1%), and Food Preparation & Serving (54.6%), while the most female-oriented occupations are Healthcare Support (97.3%), Cleaning & Maintenance (75.8%), and Personal Care & Service (71.2%).
| Occupation | Male | Female |
| Healthcare Support | 5 (2.8%) | 177 (97.3%) |
| Security & Protection | 117 (66.1%) | 60 (33.9%) |
| Firefighting & Prevention | 55 (51.4%) | 52 (48.6%) |
| Law Enforcement | 62 (88.6%) | 8 (11.4%) |
| Food Preparation & Serving | 247 (54.6%) | 205 (45.4%) |
| Cleaning & Maintenance | 22 (24.2%) | 69 (75.8%) |
| Personal Care & Service | 72 (28.8%) | 178 (71.2%) |
| Total (Category) | 463 (40.2%) | 689 (59.8%) |
| Total (Overall) | 7,521 (53.7%) | 6,486 (46.3%) |
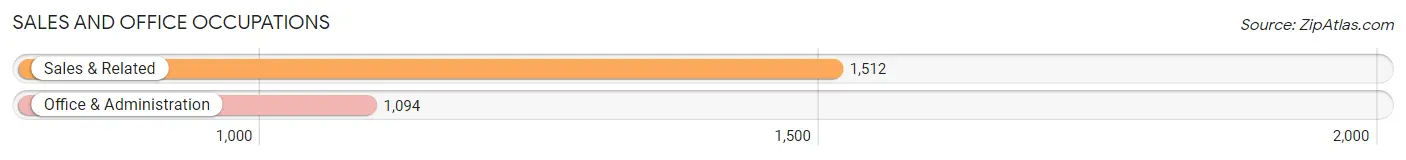
Sales and Office Occupations
The most common Sales and Office occupations in Vernon Hills are Sales & Related (1,512 | 10.8%), and Office & Administration (1,094 | 7.8%).
Sales and Office Occupations by Sex
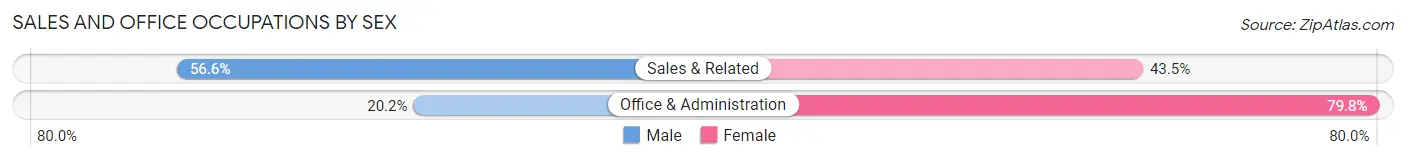
| Occupation | Male | Female |
| Sales & Related | 855 (56.6%) | 657 (43.4%) |
| Office & Administration | 221 (20.2%) | 873 (79.8%) |
| Total (Category) | 1,076 (41.3%) | 1,530 (58.7%) |
| Total (Overall) | 7,521 (53.7%) | 6,486 (46.3%) |
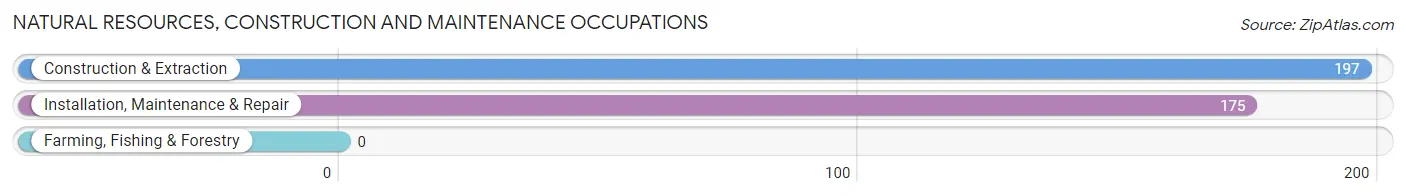
Natural Resources, Construction and Maintenance Occupations
The most common Natural Resources, Construction and Maintenance occupations in Vernon Hills are Construction & Extraction (197 | 1.4%), and Installation, Maintenance & Repair (175 | 1.3%).
Natural Resources, Construction and Maintenance Occupations by Sex
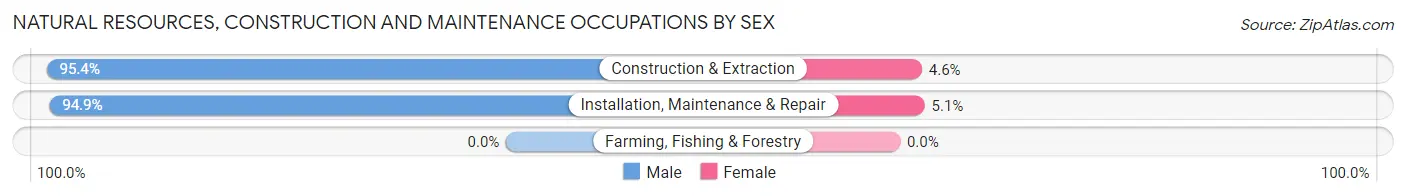
| Occupation | Male | Female |
| Farming, Fishing & Forestry | 0 (0.0%) | 0 (0.0%) |
| Construction & Extraction | 188 (95.4%) | 9 (4.6%) |
| Installation, Maintenance & Repair | 166 (94.9%) | 9 (5.1%) |
| Total (Category) | 354 (95.2%) | 18 (4.8%) |
| Total (Overall) | 7,521 (53.7%) | 6,486 (46.3%) |
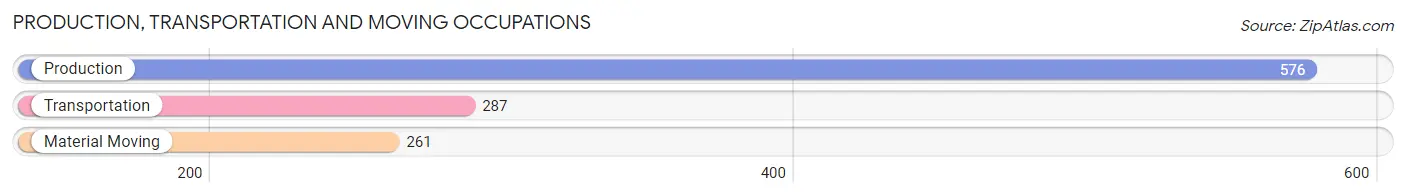
Production, Transportation and Moving Occupations
The most common Production, Transportation and Moving occupations in Vernon Hills are Production (576 | 4.1%), Transportation (287 | 2.1%), and Material Moving (261 | 1.9%).
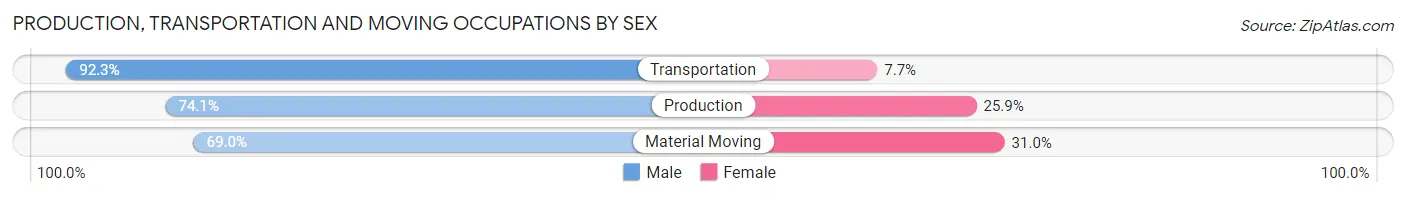
Production, Transportation and Moving Occupations by Sex
| Occupation | Male | Female |
| Production | 427 (74.1%) | 149 (25.9%) |
| Transportation | 265 (92.3%) | 22 (7.7%) |
| Material Moving | 180 (69.0%) | 81 (31.0%) |
| Total (Category) | 872 (77.6%) | 252 (22.4%) |
| Total (Overall) | 7,521 (53.7%) | 6,486 (46.3%) |
Employment Industries by Sex in Vernon Hills
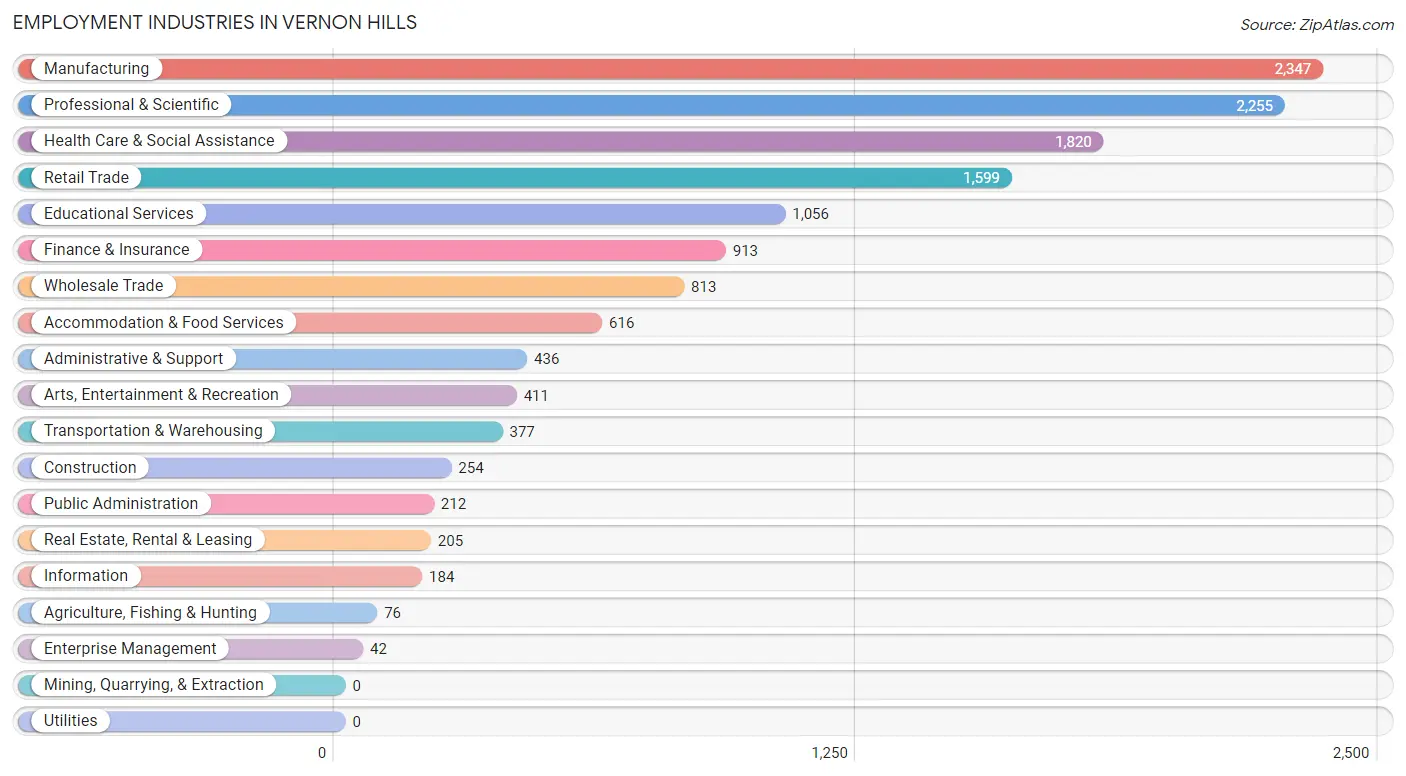
Employment Industries in Vernon Hills
The major employment industries in Vernon Hills include Manufacturing (2,347 | 16.8%), Professional & Scientific (2,255 | 16.1%), Health Care & Social Assistance (1,820 | 13.0%), Retail Trade (1,599 | 11.4%), and Educational Services (1,056 | 7.5%).
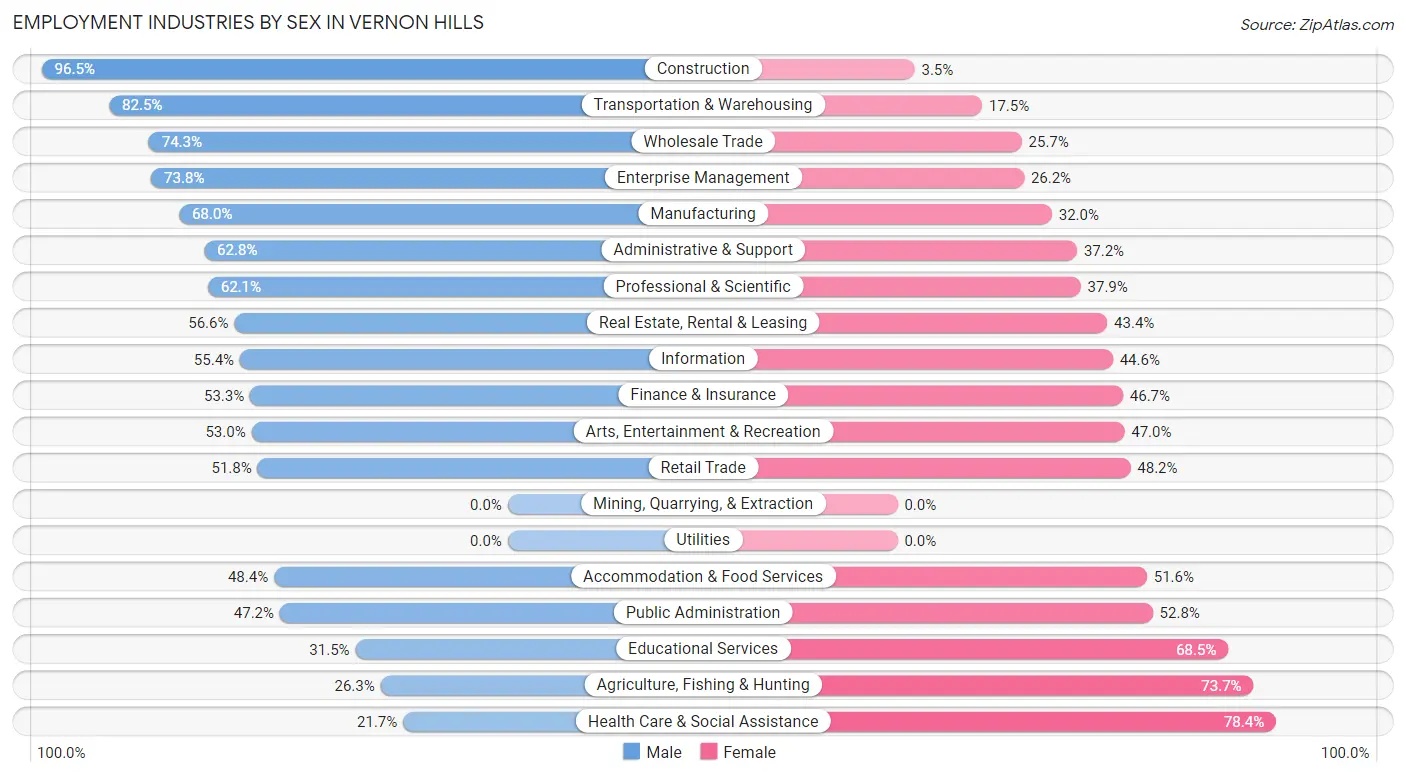
Employment Industries by Sex in Vernon Hills
The Vernon Hills industries that see more men than women are Construction (96.5%), Transportation & Warehousing (82.5%), and Wholesale Trade (74.3%), whereas the industries that tend to have a higher number of women are Health Care & Social Assistance (78.3%), Agriculture, Fishing & Hunting (73.7%), and Educational Services (68.5%).
| Industry | Male | Female |
| Agriculture, Fishing & Hunting | 20 (26.3%) | 56 (73.7%) |
| Mining, Quarrying, & Extraction | 0 (0.0%) | 0 (0.0%) |
| Construction | 245 (96.5%) | 9 (3.5%) |
| Manufacturing | 1,597 (68.0%) | 750 (32.0%) |
| Wholesale Trade | 604 (74.3%) | 209 (25.7%) |
| Retail Trade | 828 (51.8%) | 771 (48.2%) |
| Transportation & Warehousing | 311 (82.5%) | 66 (17.5%) |
| Utilities | 0 (0.0%) | 0 (0.0%) |
| Information | 102 (55.4%) | 82 (44.6%) |
| Finance & Insurance | 487 (53.3%) | 426 (46.7%) |
| Real Estate, Rental & Leasing | 116 (56.6%) | 89 (43.4%) |
| Professional & Scientific | 1,400 (62.1%) | 855 (37.9%) |
| Enterprise Management | 31 (73.8%) | 11 (26.2%) |
| Administrative & Support | 274 (62.8%) | 162 (37.2%) |
| Educational Services | 333 (31.5%) | 723 (68.5%) |
| Health Care & Social Assistance | 394 (21.6%) | 1,426 (78.3%) |
| Arts, Entertainment & Recreation | 218 (53.0%) | 193 (47.0%) |
| Accommodation & Food Services | 298 (48.4%) | 318 (51.6%) |
| Public Administration | 100 (47.2%) | 112 (52.8%) |
| Total | 7,521 (53.7%) | 6,486 (46.3%) |
Education in Vernon Hills
School Enrollment in Vernon Hills
The most common levels of schooling among the 7,527 students in Vernon Hills are high school (1,786 | 23.7%), middle school (1,715 | 22.8%), and elementary school (1,531 | 20.3%).
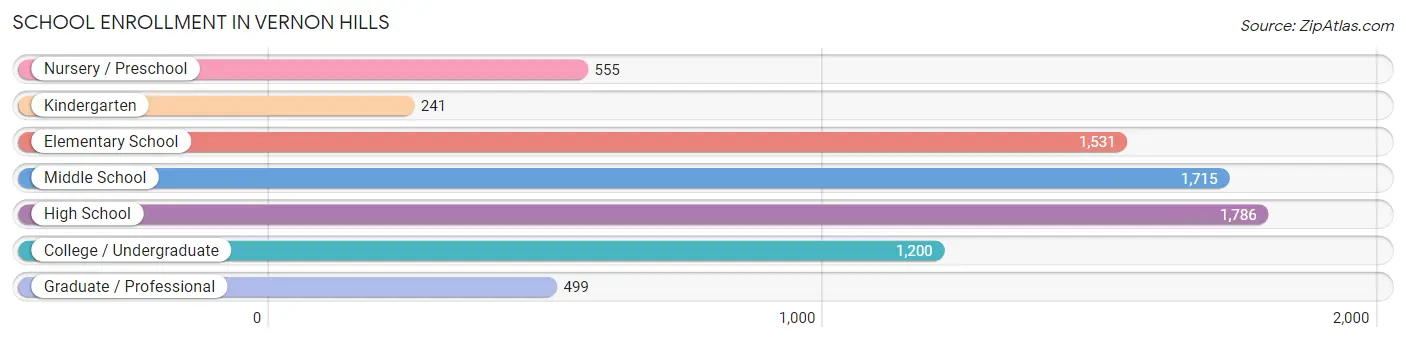
| School Level | # Students | % Students |
| Nursery / Preschool | 555 | 7.4% |
| Kindergarten | 241 | 3.2% |
| Elementary School | 1,531 | 20.3% |
| Middle School | 1,715 | 22.8% |
| High School | 1,786 | 23.7% |
| College / Undergraduate | 1,200 | 15.9% |
| Graduate / Professional | 499 | 6.6% |
| Total | 7,527 | 100.0% |
School Enrollment by Age by Funding Source in Vernon Hills
Out of a total of 7,527 students who are enrolled in schools in Vernon Hills, 1,212 (16.1%) attend a private institution, while the remaining 6,315 (83.9%) are enrolled in public schools. The age group of 25 to 34 year olds has the highest likelihood of being enrolled in private schools, with 207 (59.0% in the age bracket) enrolled. Conversely, the age group of 15 to 17 year olds has the lowest likelihood of being enrolled in a private school, with 1,428 (98.8% in the age bracket) attending a public institution.
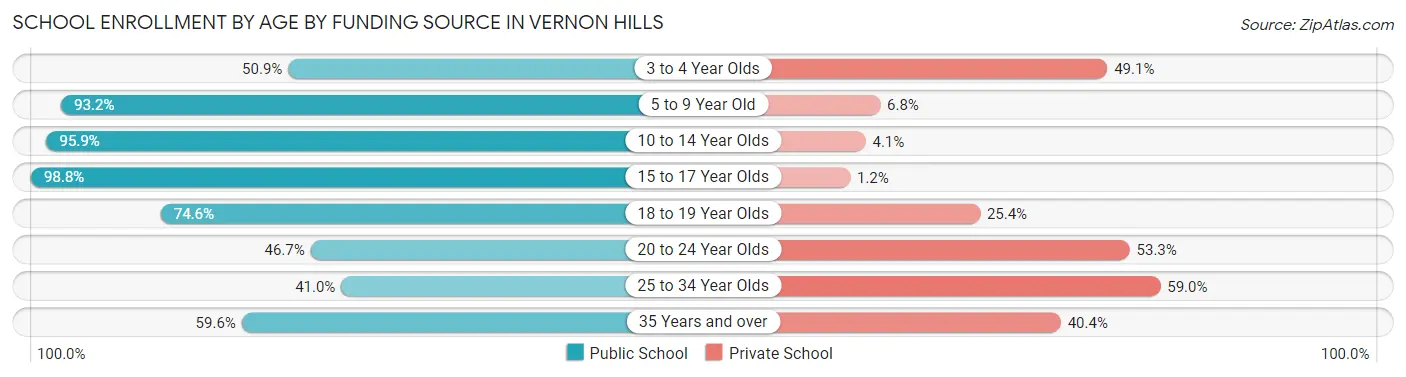
| Age Bracket | Public School | Private School |
| 3 to 4 Year Olds | 223 (50.9%) | 215 (49.1%) |
| 5 to 9 Year Old | 1,688 (93.2%) | 123 (6.8%) |
| 10 to 14 Year Olds | 2,001 (95.9%) | 85 (4.1%) |
| 15 to 17 Year Olds | 1,428 (98.8%) | 17 (1.2%) |
| 18 to 19 Year Olds | 388 (74.6%) | 132 (25.4%) |
| 20 to 24 Year Olds | 280 (46.7%) | 319 (53.3%) |
| 25 to 34 Year Olds | 144 (41.0%) | 207 (59.0%) |
| 35 Years and over | 165 (59.6%) | 112 (40.4%) |
| Total | 6,315 (83.9%) | 1,212 (16.1%) |
Educational Attainment by Field of Study in Vernon Hills
Business (2,541 | 19.7%), engineering (1,648 | 12.8%), computers & mathematics (1,332 | 10.3%), education (1,085 | 8.4%), and science & technology (1,023 | 7.9%) are the most common fields of study among 12,890 individuals in Vernon Hills who have obtained a bachelor's degree or higher.
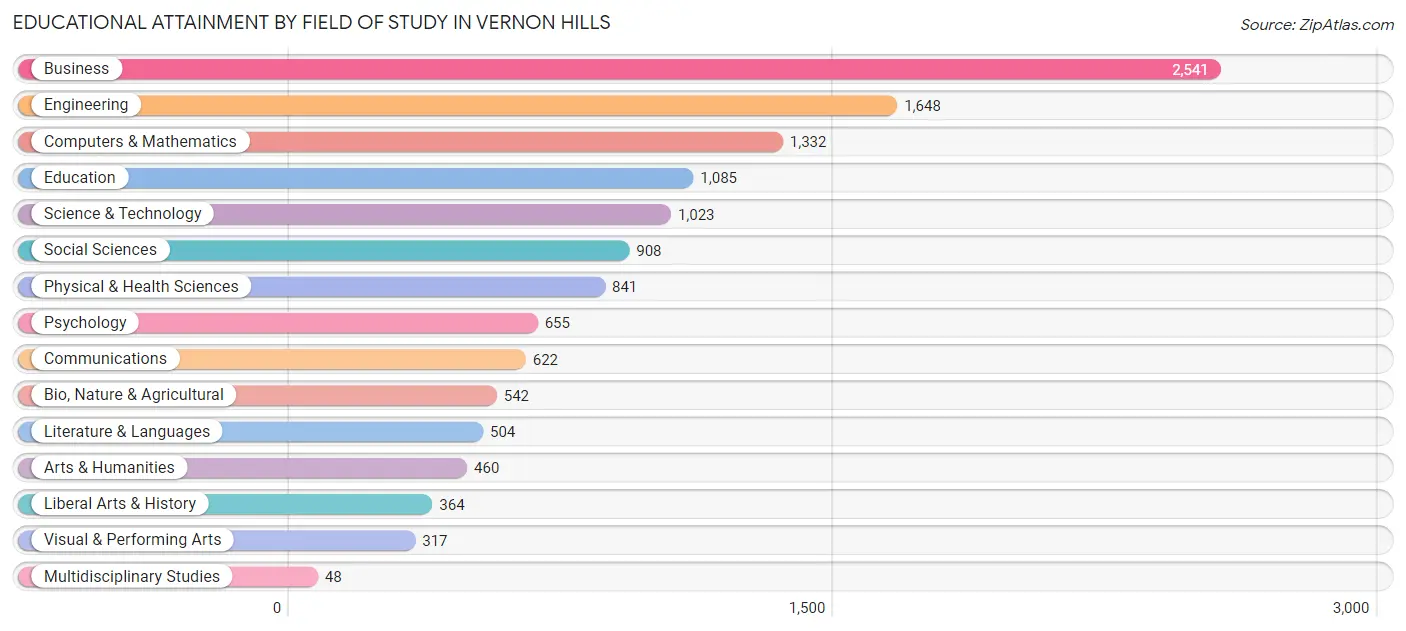
| Field of Study | # Graduates | % Graduates |
| Computers & Mathematics | 1,332 | 10.3% |
| Bio, Nature & Agricultural | 542 | 4.2% |
| Physical & Health Sciences | 841 | 6.5% |
| Psychology | 655 | 5.1% |
| Social Sciences | 908 | 7.0% |
| Engineering | 1,648 | 12.8% |
| Multidisciplinary Studies | 48 | 0.4% |
| Science & Technology | 1,023 | 7.9% |
| Business | 2,541 | 19.7% |
| Education | 1,085 | 8.4% |
| Literature & Languages | 504 | 3.9% |
| Liberal Arts & History | 364 | 2.8% |
| Visual & Performing Arts | 317 | 2.5% |
| Communications | 622 | 4.8% |
| Arts & Humanities | 460 | 3.6% |
| Total | 12,890 | 100.0% |
Transportation & Commute in Vernon Hills
Vehicle Availability by Sex in Vernon Hills
The most prevalent vehicle ownership categories in Vernon Hills are males with 2 vehicles (4,317, accounting for 58.5%) and females with 2 vehicles (3,374, making up 67.9%).
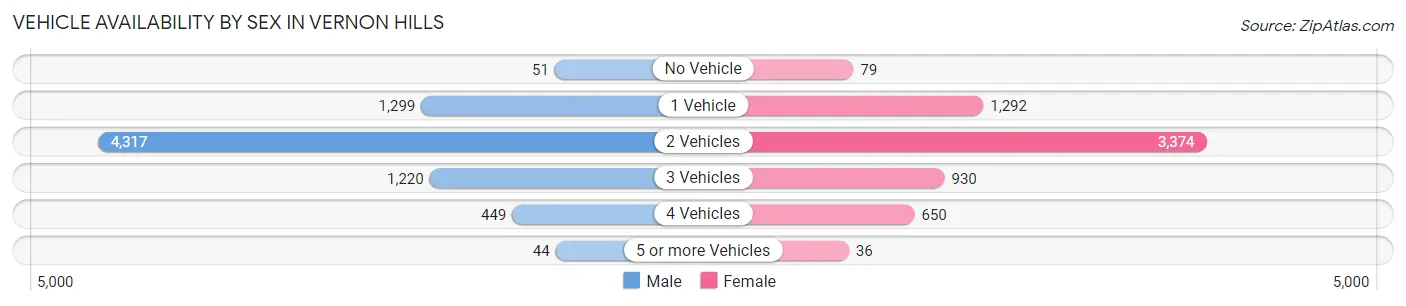
| Vehicles Available | Male | Female |
| No Vehicle | 51 (0.7%) | 79 (1.2%) |
| 1 Vehicle | 1,299 (17.6%) | 1,292 (20.3%) |
| 2 Vehicles | 4,317 (58.5%) | 3,374 (53.0%) |
| 3 Vehicles | 1,220 (16.5%) | 930 (14.6%) |
| 4 Vehicles | 449 (6.1%) | 650 (10.2%) |
| 5 or more Vehicles | 44 (0.6%) | 36 (0.6%) |
| Total | 7,380 (100.0%) | 6,361 (100.0%) |
Commute Time in Vernon Hills
The most frequently occuring commute durations in Vernon Hills are 15 to 19 minutes (1,647 commuters, 15.5%), 30 to 34 minutes (1,603 commuters, 15.1%), and 10 to 14 minutes (1,591 commuters, 15.0%).
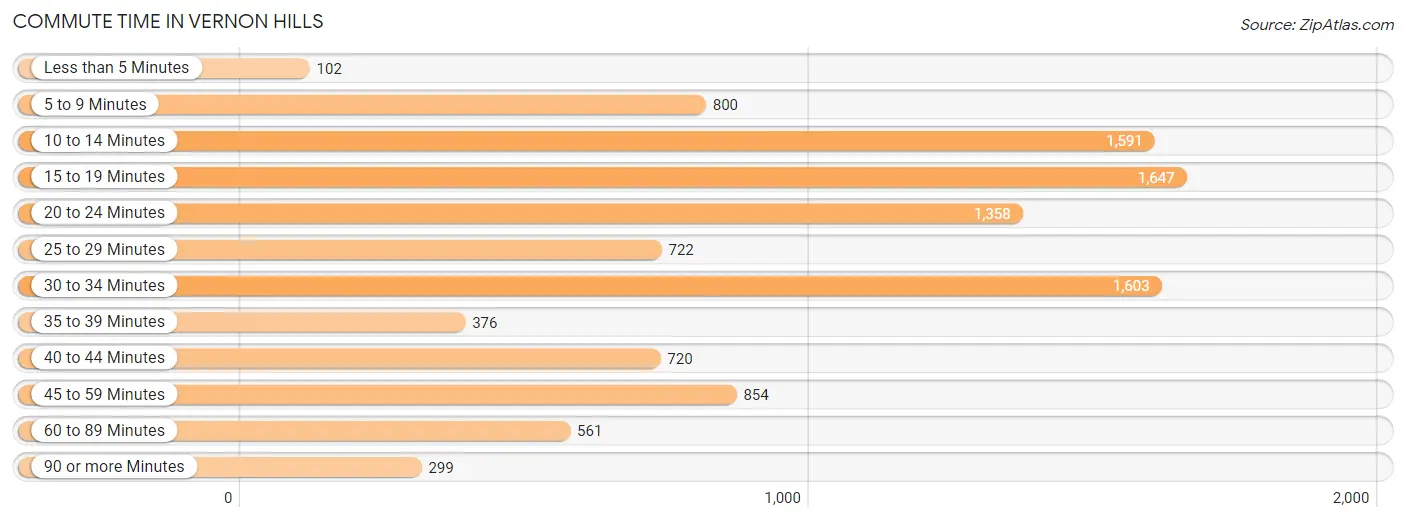
| Commute Time | # Commuters | % Commuters |
| Less than 5 Minutes | 102 | 1.0% |
| 5 to 9 Minutes | 800 | 7.5% |
| 10 to 14 Minutes | 1,591 | 15.0% |
| 15 to 19 Minutes | 1,647 | 15.5% |
| 20 to 24 Minutes | 1,358 | 12.8% |
| 25 to 29 Minutes | 722 | 6.8% |
| 30 to 34 Minutes | 1,603 | 15.1% |
| 35 to 39 Minutes | 376 | 3.5% |
| 40 to 44 Minutes | 720 | 6.8% |
| 45 to 59 Minutes | 854 | 8.0% |
| 60 to 89 Minutes | 561 | 5.3% |
| 90 or more Minutes | 299 | 2.8% |
Commute Time by Sex in Vernon Hills
The most common commute times in Vernon Hills are 10 to 14 minutes (855 commuters, 14.7%) for males and 15 to 19 minutes (826 commuters, 17.1%) for females.
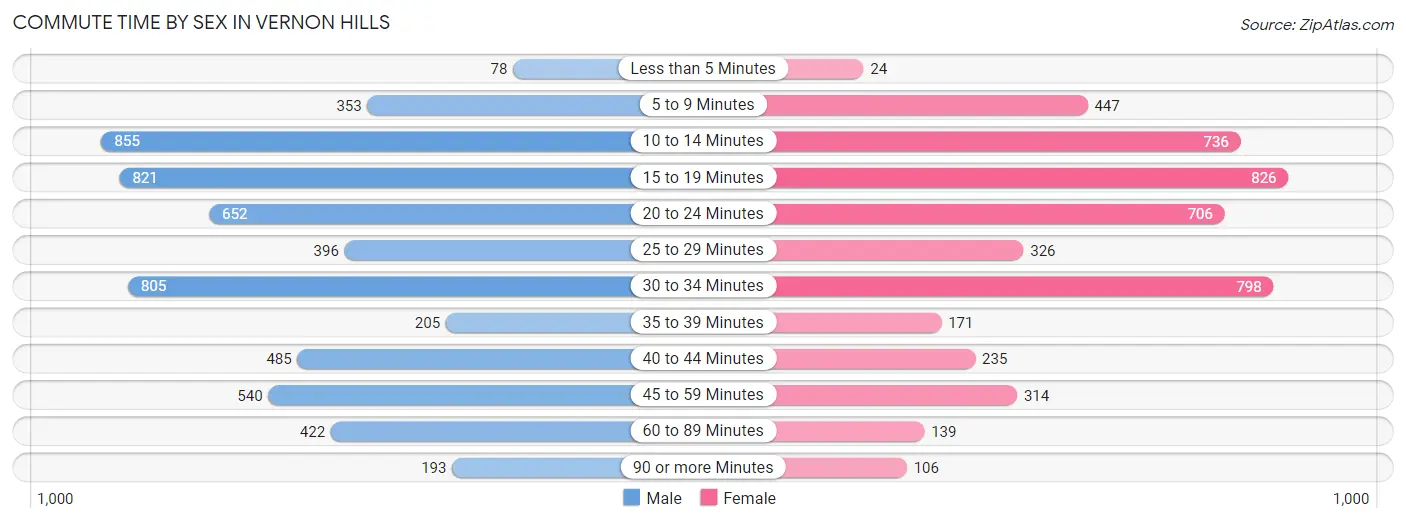
| Commute Time | Male | Female |
| Less than 5 Minutes | 78 (1.3%) | 24 (0.5%) |
| 5 to 9 Minutes | 353 (6.1%) | 447 (9.3%) |
| 10 to 14 Minutes | 855 (14.7%) | 736 (15.2%) |
| 15 to 19 Minutes | 821 (14.1%) | 826 (17.1%) |
| 20 to 24 Minutes | 652 (11.2%) | 706 (14.6%) |
| 25 to 29 Minutes | 396 (6.8%) | 326 (6.8%) |
| 30 to 34 Minutes | 805 (13.9%) | 798 (16.5%) |
| 35 to 39 Minutes | 205 (3.5%) | 171 (3.5%) |
| 40 to 44 Minutes | 485 (8.4%) | 235 (4.9%) |
| 45 to 59 Minutes | 540 (9.3%) | 314 (6.5%) |
| 60 to 89 Minutes | 422 (7.3%) | 139 (2.9%) |
| 90 or more Minutes | 193 (3.3%) | 106 (2.2%) |
Time of Departure to Work by Sex in Vernon Hills
The most frequent times of departure to work in Vernon Hills are 7:00 AM to 7:29 AM (956, 16.5%) for males and 8:00 AM to 8:29 AM (990, 20.5%) for females.
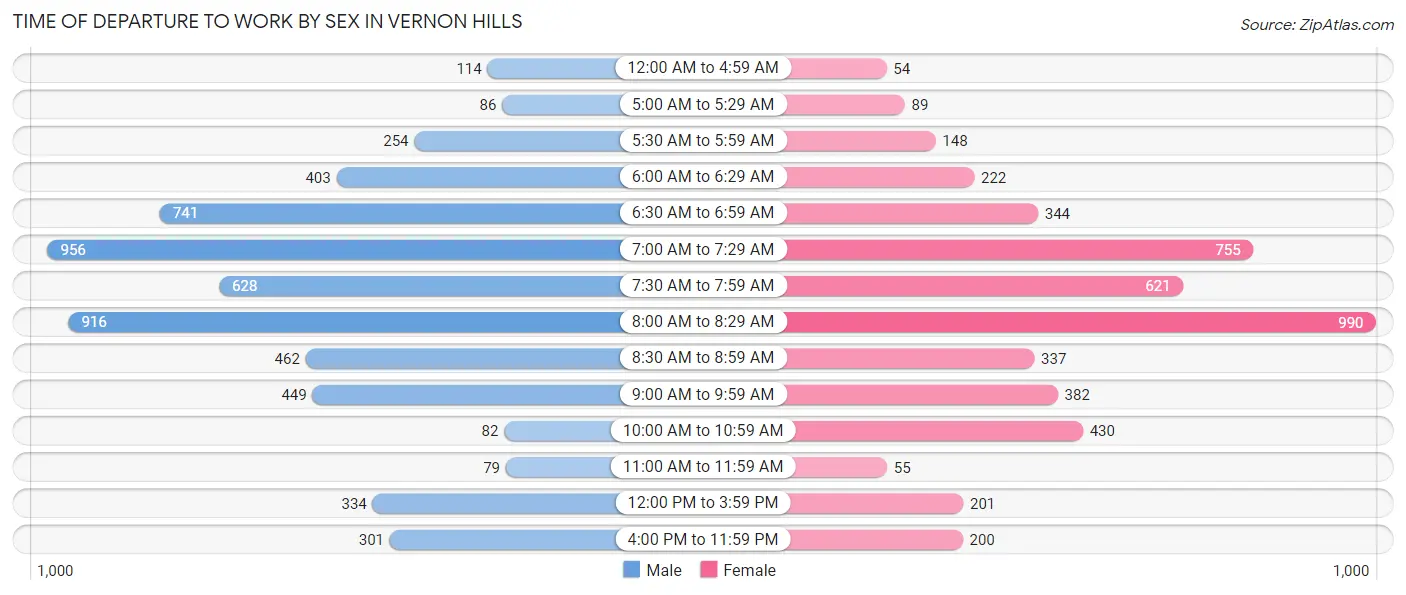
| Time of Departure | Male | Female |
| 12:00 AM to 4:59 AM | 114 (2.0%) | 54 (1.1%) |
| 5:00 AM to 5:29 AM | 86 (1.5%) | 89 (1.8%) |
| 5:30 AM to 5:59 AM | 254 (4.4%) | 148 (3.1%) |
| 6:00 AM to 6:29 AM | 403 (6.9%) | 222 (4.6%) |
| 6:30 AM to 6:59 AM | 741 (12.8%) | 344 (7.1%) |
| 7:00 AM to 7:29 AM | 956 (16.5%) | 755 (15.6%) |
| 7:30 AM to 7:59 AM | 628 (10.8%) | 621 (12.9%) |
| 8:00 AM to 8:29 AM | 916 (15.8%) | 990 (20.5%) |
| 8:30 AM to 8:59 AM | 462 (8.0%) | 337 (7.0%) |
| 9:00 AM to 9:59 AM | 449 (7.7%) | 382 (7.9%) |
| 10:00 AM to 10:59 AM | 82 (1.4%) | 430 (8.9%) |
| 11:00 AM to 11:59 AM | 79 (1.4%) | 55 (1.1%) |
| 12:00 PM to 3:59 PM | 334 (5.8%) | 201 (4.2%) |
| 4:00 PM to 11:59 PM | 301 (5.2%) | 200 (4.1%) |
| Total | 5,805 (100.0%) | 4,828 (100.0%) |
Housing Occupancy in Vernon Hills
Occupancy by Ownership in Vernon Hills
Of the total 10,366 dwellings in Vernon Hills, owner-occupied units account for 6,850 (66.1%), while renter-occupied units make up 3,516 (33.9%).
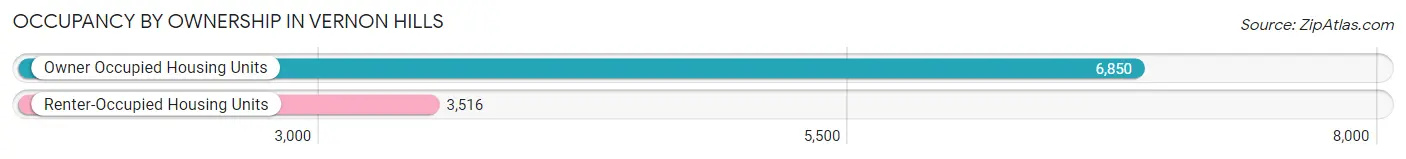
| Occupancy | # Housing Units | % Housing Units |
| Owner Occupied Housing Units | 6,850 | 66.1% |
| Renter-Occupied Housing Units | 3,516 | 33.9% |
| Total Occupied Housing Units | 10,366 | 100.0% |
Occupancy by Household Size in Vernon Hills
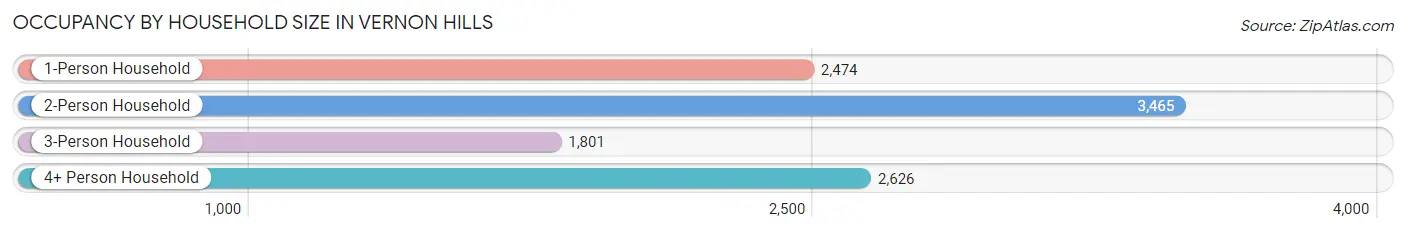
| Household Size | # Housing Units | % Housing Units |
| 1-Person Household | 2,474 | 23.9% |
| 2-Person Household | 3,465 | 33.4% |
| 3-Person Household | 1,801 | 17.4% |
| 4+ Person Household | 2,626 | 25.3% |
| Total Housing Units | 10,366 | 100.0% |
Occupancy by Ownership by Household Size in Vernon Hills
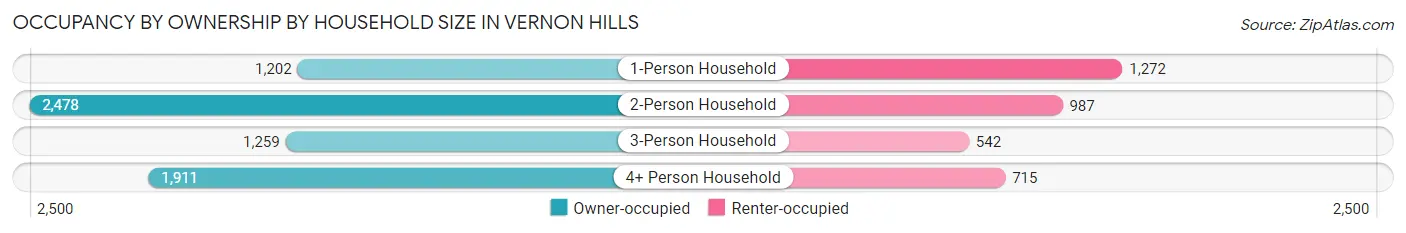
| Household Size | Owner-occupied | Renter-occupied |
| 1-Person Household | 1,202 (48.6%) | 1,272 (51.4%) |
| 2-Person Household | 2,478 (71.5%) | 987 (28.5%) |
| 3-Person Household | 1,259 (69.9%) | 542 (30.1%) |
| 4+ Person Household | 1,911 (72.8%) | 715 (27.2%) |
| Total Housing Units | 6,850 (66.1%) | 3,516 (33.9%) |
Occupancy by Educational Attainment in Vernon Hills
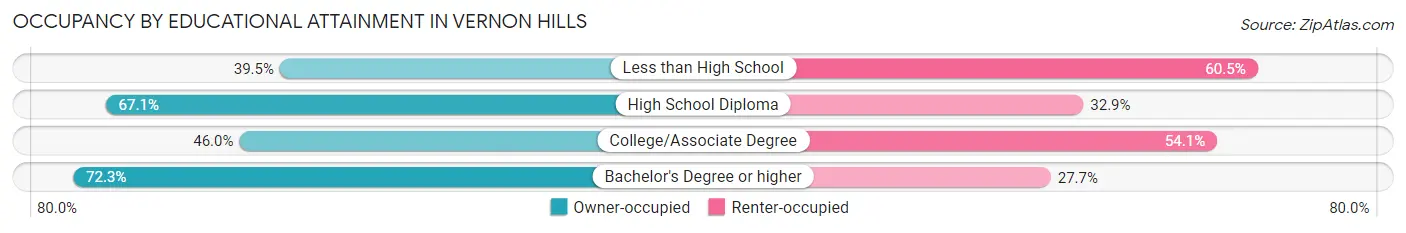
| Household Size | Owner-occupied | Renter-occupied |
| Less than High School | 166 (39.5%) | 254 (60.5%) |
| High School Diploma | 752 (67.1%) | 368 (32.9%) |
| College/Associate Degree | 783 (46.0%) | 921 (54.0%) |
| Bachelor's Degree or higher | 5,149 (72.3%) | 1,973 (27.7%) |
Occupancy by Age of Householder in Vernon Hills
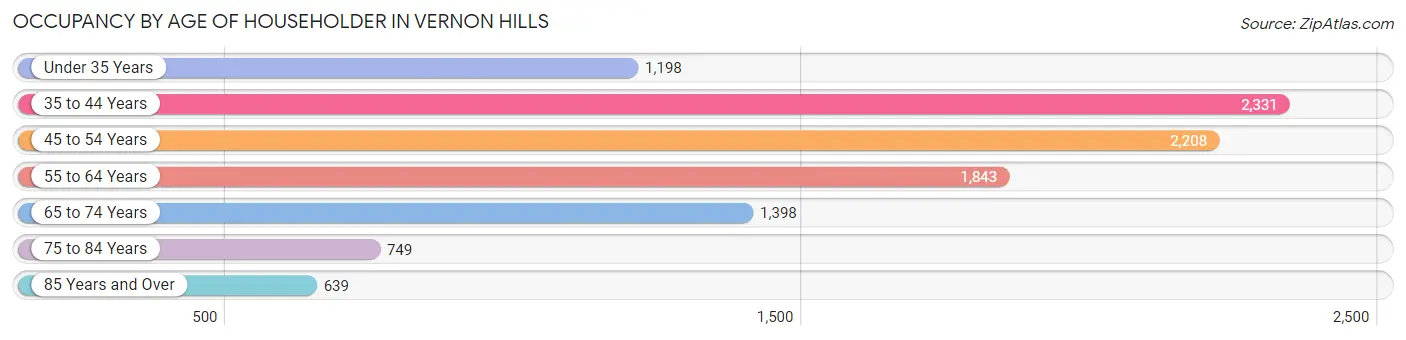
| Age Bracket | # Households | % Households |
| Under 35 Years | 1,198 | 11.6% |
| 35 to 44 Years | 2,331 | 22.5% |
| 45 to 54 Years | 2,208 | 21.3% |
| 55 to 64 Years | 1,843 | 17.8% |
| 65 to 74 Years | 1,398 | 13.5% |
| 75 to 84 Years | 749 | 7.2% |
| 85 Years and Over | 639 | 6.2% |
| Total | 10,366 | 100.0% |
Housing Finances in Vernon Hills
Median Income by Occupancy in Vernon Hills
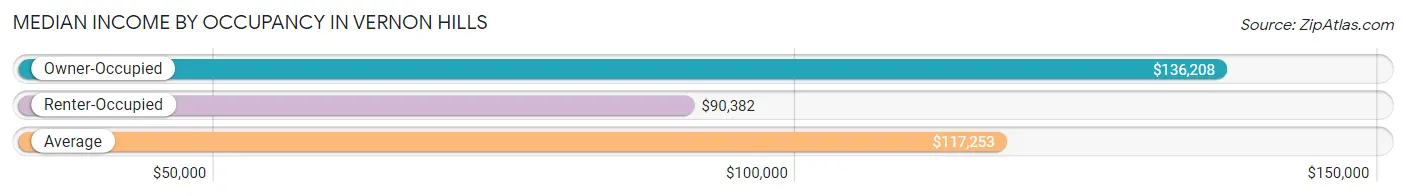
| Occupancy Type | # Households | Median Income |
| Owner-Occupied | 6,850 (66.1%) | $136,208 |
| Renter-Occupied | 3,516 (33.9%) | $90,382 |
| Average | 10,366 (100.0%) | $117,253 |
Occupancy by Householder Income Bracket in Vernon Hills
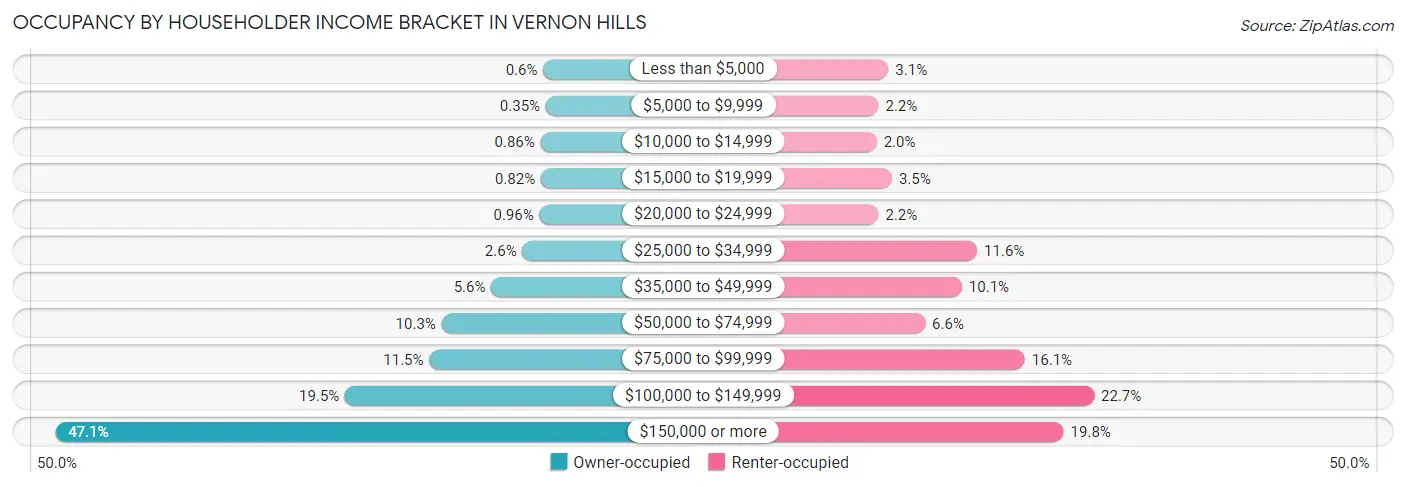
| Income Bracket | Owner-occupied | Renter-occupied |
| Less than $5,000 | 41 (0.6%) | 110 (3.1%) |
| $5,000 to $9,999 | 24 (0.4%) | 77 (2.2%) |
| $10,000 to $14,999 | 59 (0.9%) | 71 (2.0%) |
| $15,000 to $19,999 | 56 (0.8%) | 122 (3.5%) |
| $20,000 to $24,999 | 66 (1.0%) | 77 (2.2%) |
| $25,000 to $34,999 | 177 (2.6%) | 407 (11.6%) |
| $35,000 to $49,999 | 380 (5.6%) | 356 (10.1%) |
| $50,000 to $74,999 | 704 (10.3%) | 233 (6.6%) |
| $75,000 to $99,999 | 784 (11.5%) | 567 (16.1%) |
| $100,000 to $149,999 | 1,334 (19.5%) | 799 (22.7%) |
| $150,000 or more | 3,225 (47.1%) | 697 (19.8%) |
| Total | 6,850 (100.0%) | 3,516 (100.0%) |
Monthly Housing Cost Tiers in Vernon Hills
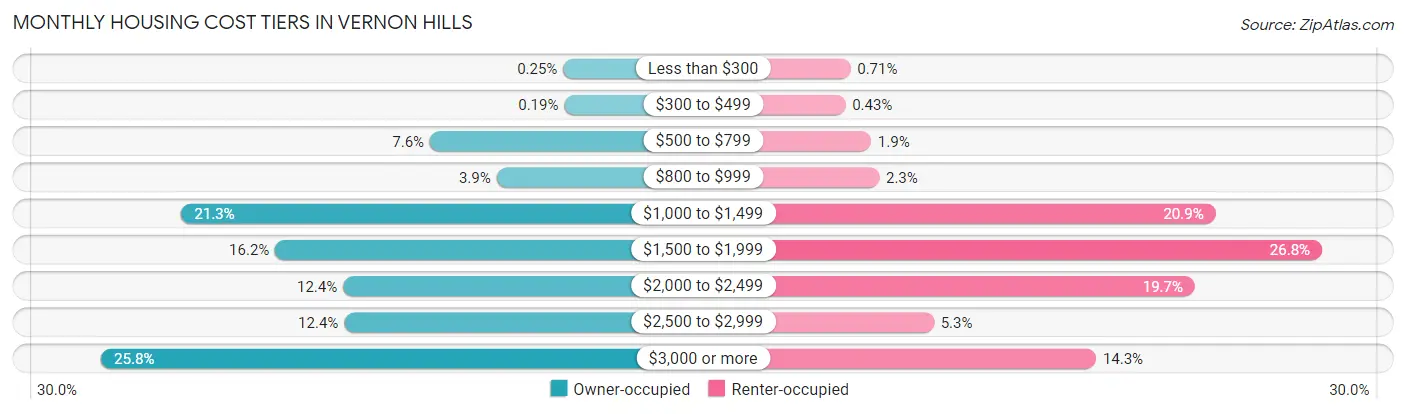
| Monthly Cost | Owner-occupied | Renter-occupied |
| Less than $300 | 17 (0.3%) | 25 (0.7%) |
| $300 to $499 | 13 (0.2%) | 15 (0.4%) |
| $500 to $799 | 521 (7.6%) | 65 (1.8%) |
| $800 to $999 | 269 (3.9%) | 81 (2.3%) |
| $1,000 to $1,499 | 1,462 (21.3%) | 734 (20.9%) |
| $1,500 to $1,999 | 1,107 (16.2%) | 941 (26.8%) |
| $2,000 to $2,499 | 850 (12.4%) | 694 (19.7%) |
| $2,500 to $2,999 | 846 (12.3%) | 187 (5.3%) |
| $3,000 or more | 1,765 (25.8%) | 502 (14.3%) |
| Total | 6,850 (100.0%) | 3,516 (100.0%) |
Physical Housing Characteristics in Vernon Hills
Housing Structures in Vernon Hills
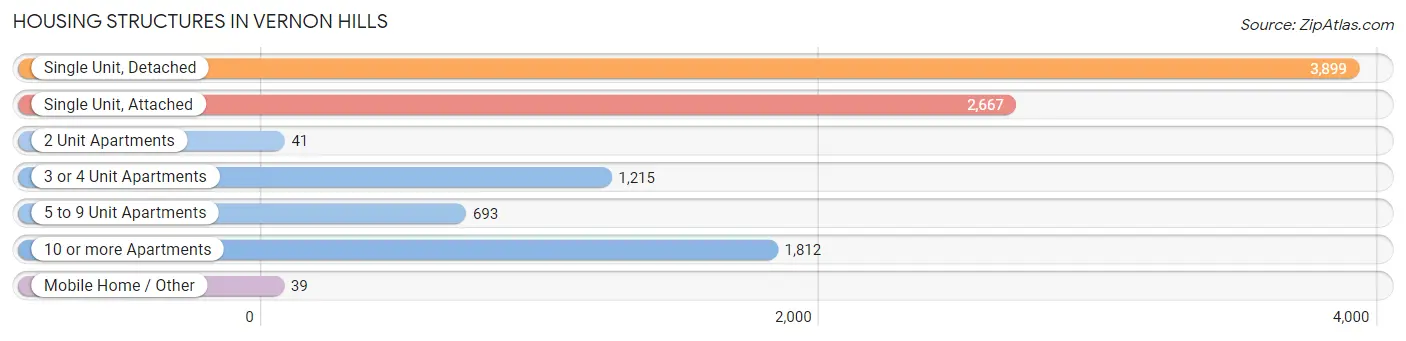
| Structure Type | # Housing Units | % Housing Units |
| Single Unit, Detached | 3,899 | 37.6% |
| Single Unit, Attached | 2,667 | 25.7% |
| 2 Unit Apartments | 41 | 0.4% |
| 3 or 4 Unit Apartments | 1,215 | 11.7% |
| 5 to 9 Unit Apartments | 693 | 6.7% |
| 10 or more Apartments | 1,812 | 17.5% |
| Mobile Home / Other | 39 | 0.4% |
| Total | 10,366 | 100.0% |
Housing Structures by Occupancy in Vernon Hills
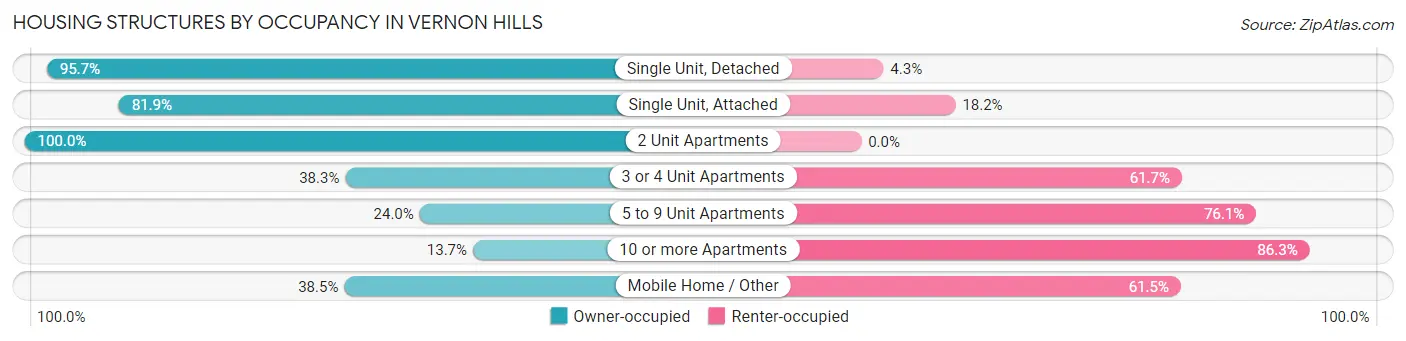
| Structure Type | Owner-occupied | Renter-occupied |
| Single Unit, Detached | 3,732 (95.7%) | 167 (4.3%) |
| Single Unit, Attached | 2,183 (81.9%) | 484 (18.1%) |
| 2 Unit Apartments | 41 (100.0%) | 0 (0.0%) |
| 3 or 4 Unit Apartments | 465 (38.3%) | 750 (61.7%) |
| 5 to 9 Unit Apartments | 166 (23.9%) | 527 (76.0%) |
| 10 or more Apartments | 248 (13.7%) | 1,564 (86.3%) |
| Mobile Home / Other | 15 (38.5%) | 24 (61.5%) |
| Total | 6,850 (66.1%) | 3,516 (33.9%) |
Housing Structures by Number of Rooms in Vernon Hills
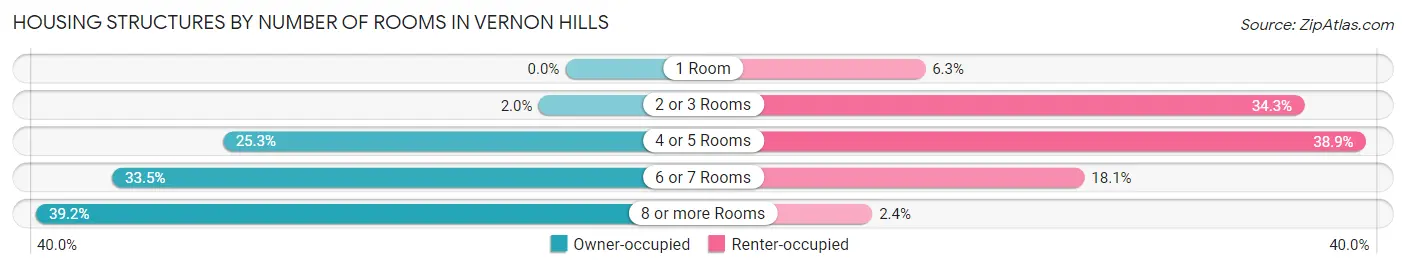
| Number of Rooms | Owner-occupied | Renter-occupied |
| 1 Room | 0 (0.0%) | 222 (6.3%) |
| 2 or 3 Rooms | 136 (2.0%) | 1,207 (34.3%) |
| 4 or 5 Rooms | 1,736 (25.3%) | 1,367 (38.9%) |
| 6 or 7 Rooms | 2,296 (33.5%) | 636 (18.1%) |
| 8 or more Rooms | 2,682 (39.2%) | 84 (2.4%) |
| Total | 6,850 (100.0%) | 3,516 (100.0%) |
Housing Structure by Heating Type in Vernon Hills
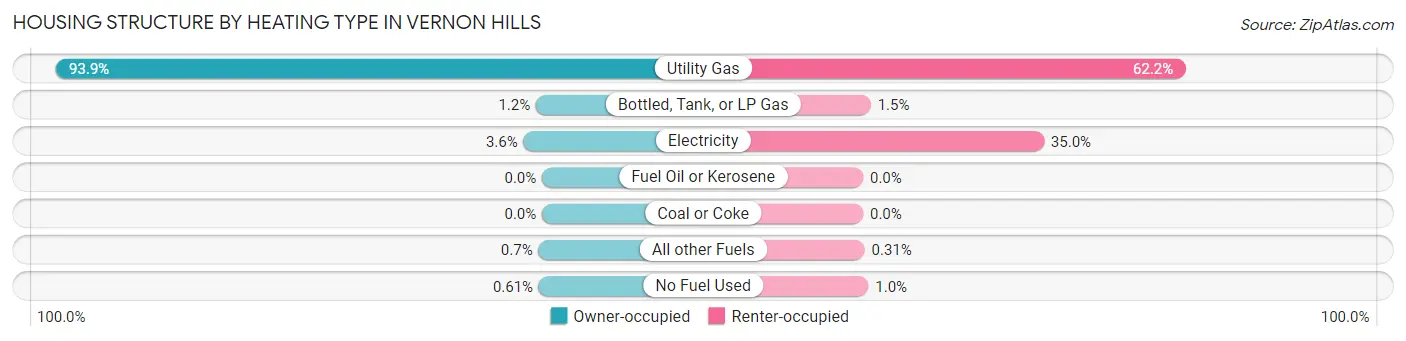
| Heating Type | Owner-occupied | Renter-occupied |
| Utility Gas | 6,435 (93.9%) | 2,188 (62.2%) |
| Bottled, Tank, or LP Gas | 80 (1.2%) | 52 (1.5%) |
| Electricity | 245 (3.6%) | 1,229 (34.9%) |
| Fuel Oil or Kerosene | 0 (0.0%) | 0 (0.0%) |
| Coal or Coke | 0 (0.0%) | 0 (0.0%) |
| All other Fuels | 48 (0.7%) | 11 (0.3%) |
| No Fuel Used | 42 (0.6%) | 36 (1.0%) |
| Total | 6,850 (100.0%) | 3,516 (100.0%) |
Household Vehicle Usage in Vernon Hills
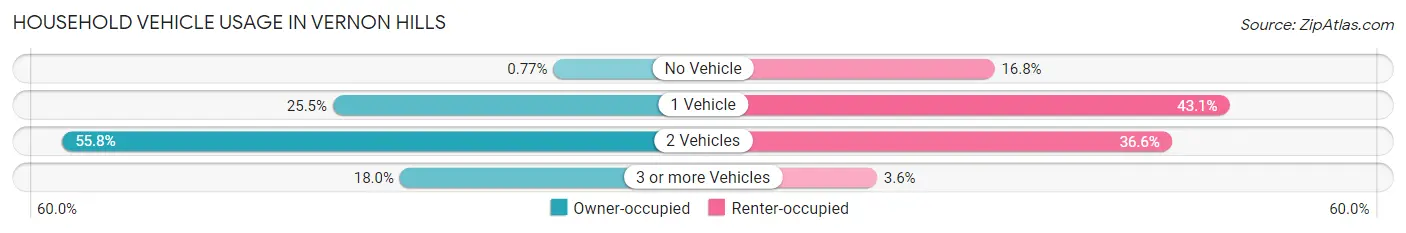
| Vehicles per Household | Owner-occupied | Renter-occupied |
| No Vehicle | 53 (0.8%) | 589 (16.8%) |
| 1 Vehicle | 1,745 (25.5%) | 1,514 (43.1%) |
| 2 Vehicles | 3,821 (55.8%) | 1,287 (36.6%) |
| 3 or more Vehicles | 1,231 (18.0%) | 126 (3.6%) |
| Total | 6,850 (100.0%) | 3,516 (100.0%) |
Real Estate & Mortgages in Vernon Hills
Real Estate and Mortgage Overview in Vernon Hills
| Characteristic | Without Mortgage | With Mortgage |
| Housing Units | 2,313 | 4,537 |
| Median Property Value | $359,800 | $376,400 |
| Median Household Income | $106,696 | $2,412 |
| Monthly Housing Costs | $1,280 | $1,765 |
| Real Estate Taxes | $8,930 | $22 |
Property Value by Mortgage Status in Vernon Hills
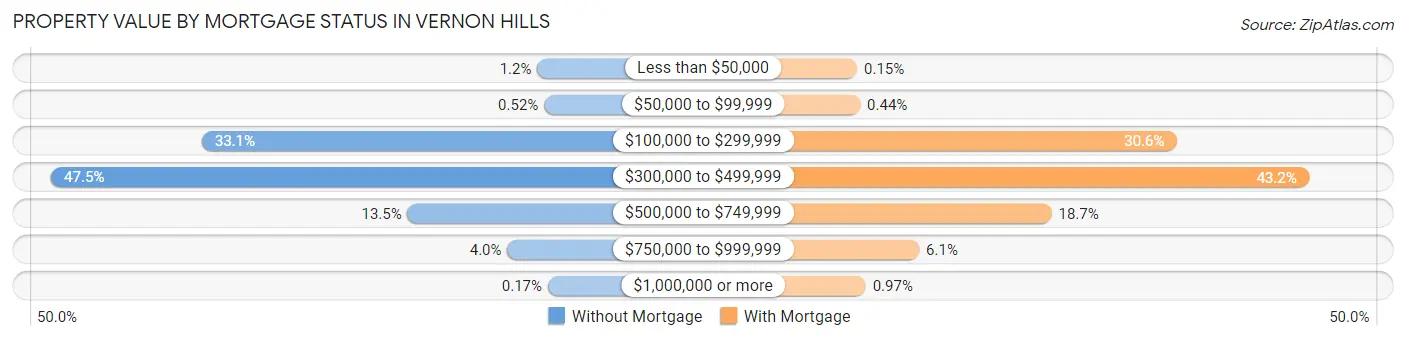
| Property Value | Without Mortgage | With Mortgage |
| Less than $50,000 | 27 (1.2%) | 7 (0.2%) |
| $50,000 to $99,999 | 12 (0.5%) | 20 (0.4%) |
| $100,000 to $299,999 | 766 (33.1%) | 1,386 (30.5%) |
| $300,000 to $499,999 | 1,098 (47.5%) | 1,958 (43.2%) |
| $500,000 to $749,999 | 313 (13.5%) | 847 (18.7%) |
| $750,000 to $999,999 | 93 (4.0%) | 275 (6.1%) |
| $1,000,000 or more | 4 (0.2%) | 44 (1.0%) |
| Total | 2,313 (100.0%) | 4,537 (100.0%) |
Household Income by Mortgage Status in Vernon Hills
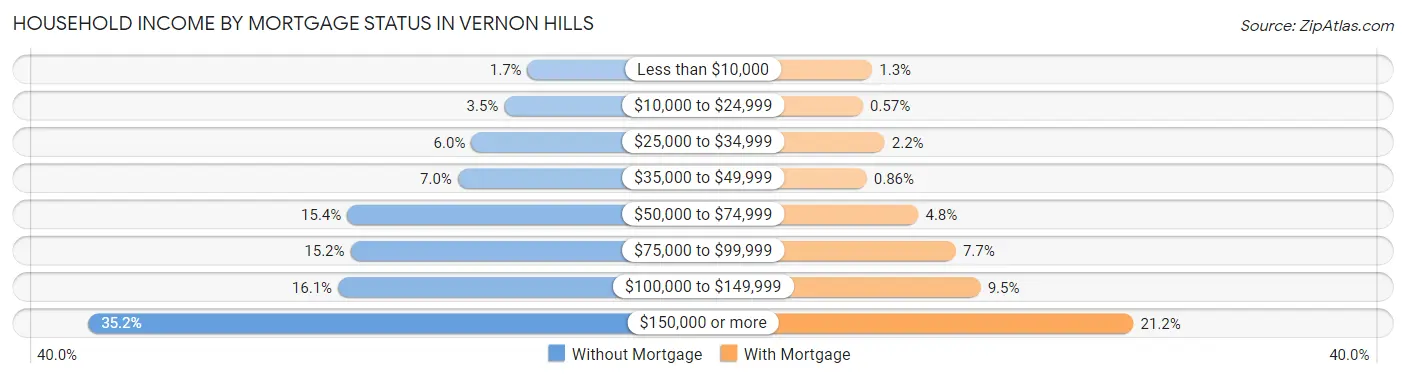
| Household Income | Without Mortgage | With Mortgage |
| Less than $10,000 | 39 (1.7%) | 58 (1.3%) |
| $10,000 to $24,999 | 80 (3.5%) | 26 (0.6%) |
| $25,000 to $34,999 | 138 (6.0%) | 101 (2.2%) |
| $35,000 to $49,999 | 162 (7.0%) | 39 (0.9%) |
| $50,000 to $74,999 | 357 (15.4%) | 218 (4.8%) |
| $75,000 to $99,999 | 351 (15.2%) | 347 (7.6%) |
| $100,000 to $149,999 | 373 (16.1%) | 433 (9.5%) |
| $150,000 or more | 813 (35.1%) | 961 (21.2%) |
| Total | 2,313 (100.0%) | 4,537 (100.0%) |
Property Value to Household Income Ratio in Vernon Hills
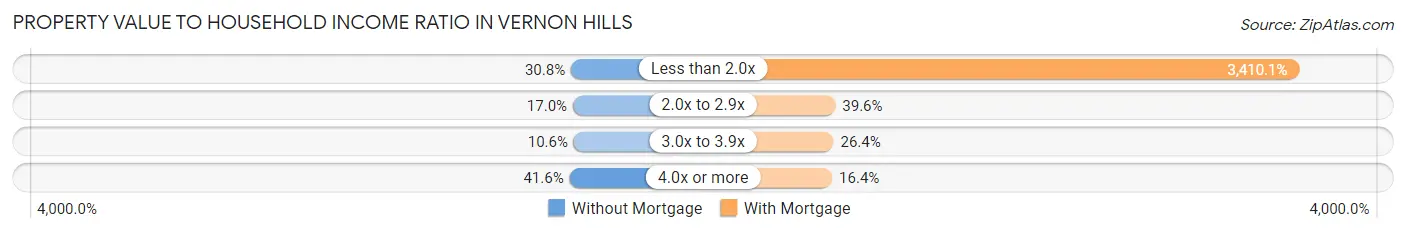
| Value-to-Income Ratio | Without Mortgage | With Mortgage |
| Less than 2.0x | 713 (30.8%) | 154,717 (3,410.1%) |
| 2.0x to 2.9x | 393 (17.0%) | 1,795 (39.6%) |
| 3.0x to 3.9x | 244 (10.5%) | 1,196 (26.4%) |
| 4.0x or more | 963 (41.6%) | 745 (16.4%) |
| Total | 2,313 (100.0%) | 4,537 (100.0%) |
Real Estate Taxes by Mortgage Status in Vernon Hills
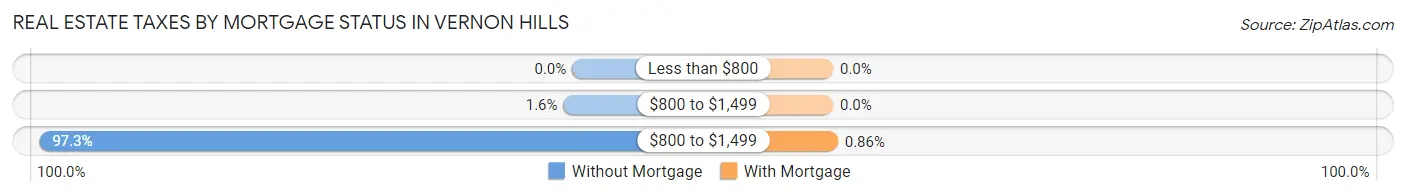
| Property Taxes | Without Mortgage | With Mortgage |
| Less than $800 | 0 (0.0%) | 0 (0.0%) |
| $800 to $1,499 | 37 (1.6%) | 0 (0.0%) |
| $800 to $1,499 | 2,251 (97.3%) | 39 (0.9%) |
| Total | 2,313 (100.0%) | 4,537 (100.0%) |
Health & Disability in Vernon Hills
Health Insurance Coverage by Age in Vernon Hills
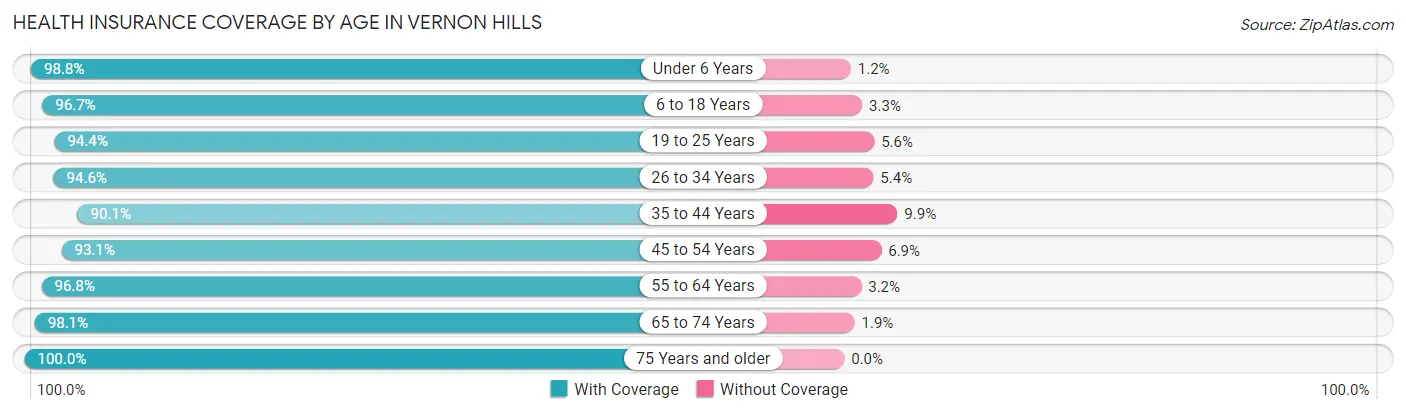
| Age Bracket | With Coverage | Without Coverage |
| Under 6 Years | 1,454 (98.8%) | 18 (1.2%) |
| 6 to 18 Years | 5,318 (96.7%) | 183 (3.3%) |
| 19 to 25 Years | 1,625 (94.4%) | 96 (5.6%) |
| 26 to 34 Years | 2,037 (94.6%) | 117 (5.4%) |
| 35 to 44 Years | 3,803 (90.1%) | 418 (9.9%) |
| 45 to 54 Years | 3,725 (93.1%) | 276 (6.9%) |
| 55 to 64 Years | 3,233 (96.8%) | 106 (3.2%) |
| 65 to 74 Years | 2,197 (98.1%) | 43 (1.9%) |
| 75 Years and older | 1,983 (100.0%) | 0 (0.0%) |
| Total | 25,375 (95.3%) | 1,257 (4.7%) |
Health Insurance Coverage by Citizenship Status in Vernon Hills
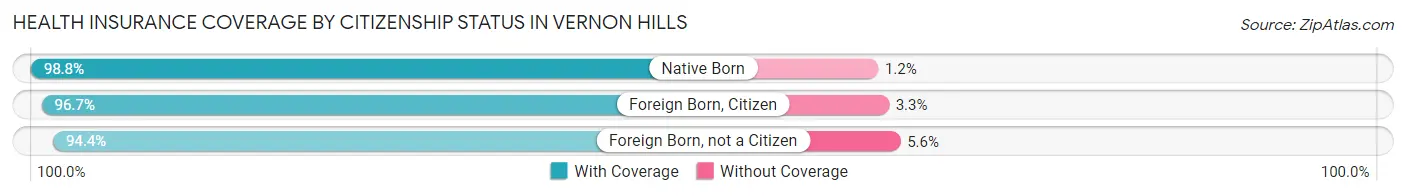
| Citizenship Status | With Coverage | Without Coverage |
| Native Born | 1,454 (98.8%) | 18 (1.2%) |
| Foreign Born, Citizen | 5,318 (96.7%) | 183 (3.3%) |
| Foreign Born, not a Citizen | 1,625 (94.4%) | 96 (5.6%) |
Health Insurance Coverage by Household Income in Vernon Hills
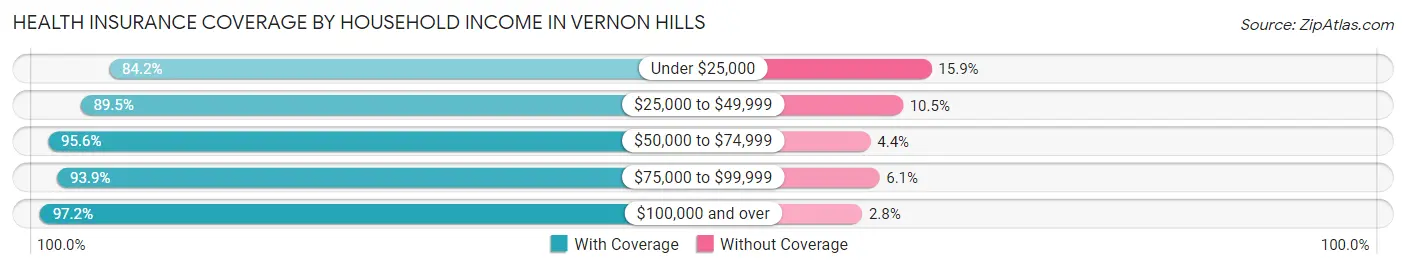
| Household Income | With Coverage | Without Coverage |
| Under $25,000 | 956 (84.2%) | 180 (15.9%) |
| $25,000 to $49,999 | 2,503 (89.5%) | 293 (10.5%) |
| $50,000 to $74,999 | 2,014 (95.6%) | 93 (4.4%) |
| $75,000 to $99,999 | 3,085 (93.9%) | 200 (6.1%) |
| $100,000 and over | 16,813 (97.2%) | 491 (2.8%) |
Public vs Private Health Insurance Coverage by Age in Vernon Hills
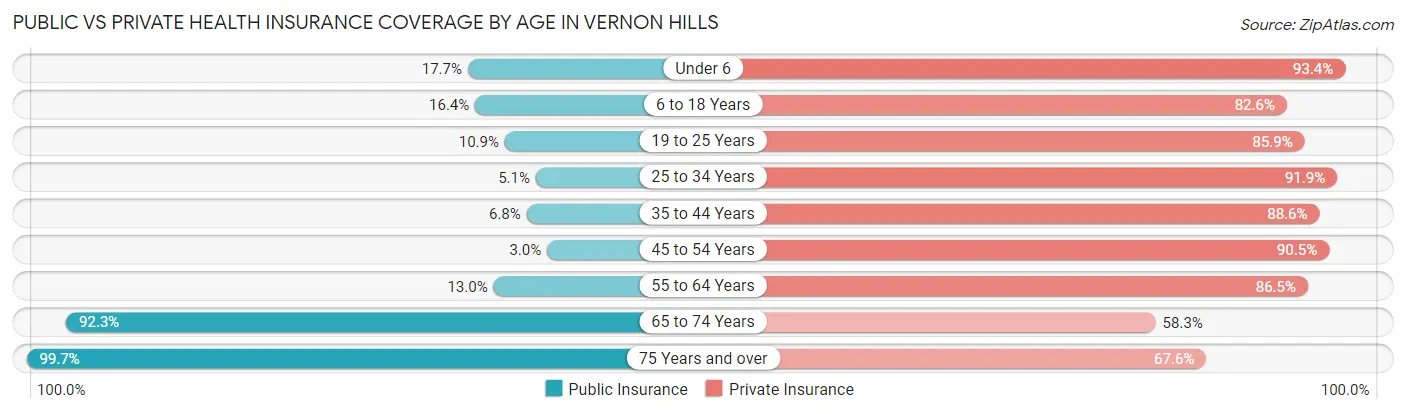
| Age Bracket | Public Insurance | Private Insurance |
| Under 6 | 261 (17.7%) | 1,375 (93.4%) |
| 6 to 18 Years | 901 (16.4%) | 4,543 (82.6%) |
| 19 to 25 Years | 187 (10.9%) | 1,478 (85.9%) |
| 25 to 34 Years | 110 (5.1%) | 1,980 (91.9%) |
| 35 to 44 Years | 288 (6.8%) | 3,741 (88.6%) |
| 45 to 54 Years | 121 (3.0%) | 3,619 (90.4%) |
| 55 to 64 Years | 433 (13.0%) | 2,888 (86.5%) |
| 65 to 74 Years | 2,068 (92.3%) | 1,305 (58.3%) |
| 75 Years and over | 1,976 (99.7%) | 1,341 (67.6%) |
| Total | 6,345 (23.8%) | 22,270 (83.6%) |
Disability Status by Sex by Age in Vernon Hills
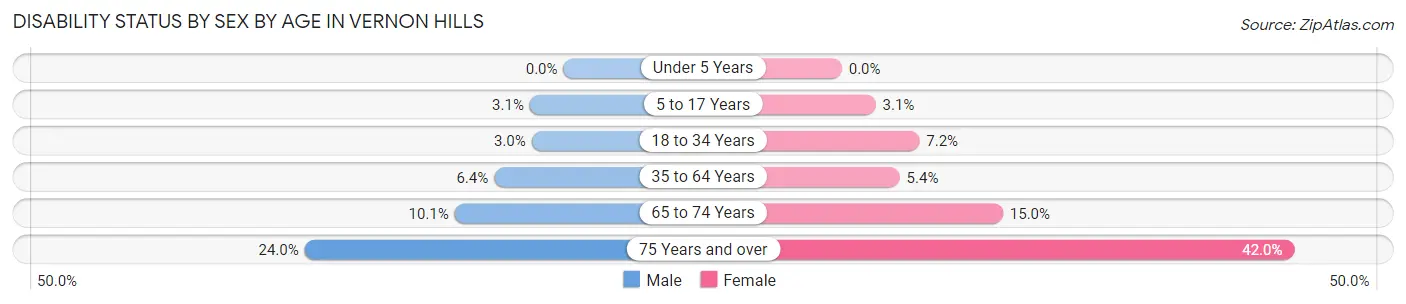
| Age Bracket | Male | Female |
| Under 5 Years | 0 (0.0%) | 0 (0.0%) |
| 5 to 17 Years | 87 (3.1%) | 83 (3.1%) |
| 18 to 34 Years | 63 (2.9%) | 149 (7.2%) |
| 35 to 64 Years | 364 (6.4%) | 317 (5.4%) |
| 65 to 74 Years | 114 (10.1%) | 166 (14.9%) |
| 75 Years and over | 160 (24.0%) | 553 (42.0%) |
Disability Class by Sex by Age in Vernon Hills
Disability Class: Hearing Difficulty
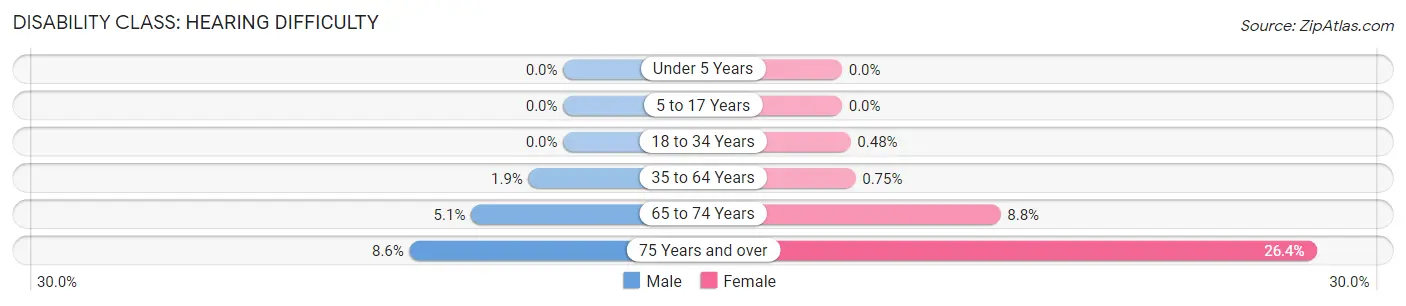
| Age Bracket | Male | Female |
| Under 5 Years | 0 (0.0%) | 0 (0.0%) |
| 5 to 17 Years | 0 (0.0%) | 0 (0.0%) |
| 18 to 34 Years | 0 (0.0%) | 10 (0.5%) |
| 35 to 64 Years | 109 (1.9%) | 44 (0.7%) |
| 65 to 74 Years | 58 (5.1%) | 98 (8.8%) |
| 75 Years and over | 57 (8.6%) | 348 (26.4%) |
Disability Class: Vision Difficulty
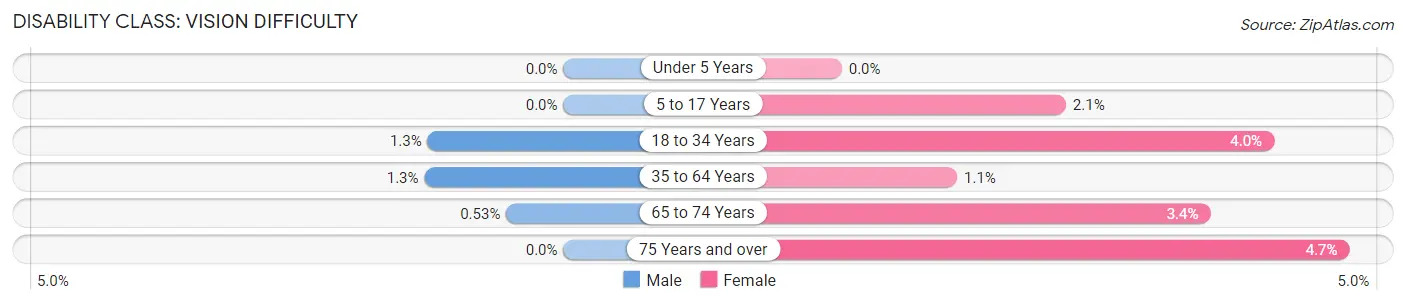
| Age Bracket | Male | Female |
| Under 5 Years | 0 (0.0%) | 0 (0.0%) |
| 5 to 17 Years | 0 (0.0%) | 55 (2.1%) |
| 18 to 34 Years | 27 (1.3%) | 83 (4.0%) |
| 35 to 64 Years | 73 (1.3%) | 63 (1.1%) |
| 65 to 74 Years | 6 (0.5%) | 38 (3.4%) |
| 75 Years and over | 0 (0.0%) | 62 (4.7%) |
Disability Class: Cognitive Difficulty
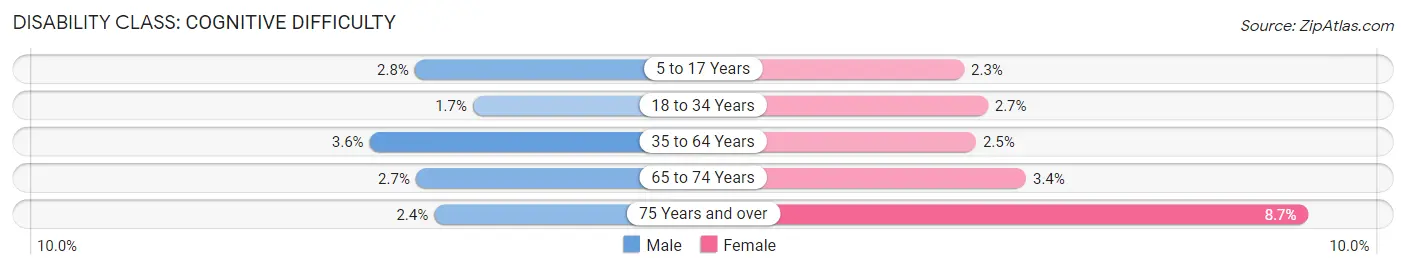
| Age Bracket | Male | Female |
| 5 to 17 Years | 77 (2.8%) | 60 (2.3%) |
| 18 to 34 Years | 36 (1.7%) | 56 (2.7%) |
| 35 to 64 Years | 204 (3.6%) | 147 (2.5%) |
| 65 to 74 Years | 31 (2.7%) | 38 (3.4%) |
| 75 Years and over | 16 (2.4%) | 114 (8.7%) |
Disability Class: Ambulatory Difficulty
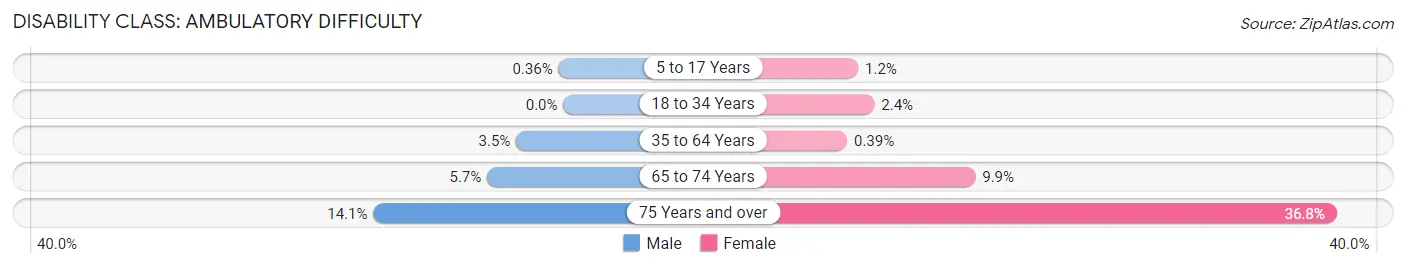
| Age Bracket | Male | Female |
| 5 to 17 Years | 10 (0.4%) | 32 (1.2%) |
| 18 to 34 Years | 0 (0.0%) | 50 (2.4%) |
| 35 to 64 Years | 198 (3.5%) | 23 (0.4%) |
| 65 to 74 Years | 64 (5.7%) | 110 (9.9%) |
| 75 Years and over | 94 (14.1%) | 484 (36.7%) |
Disability Class: Self-Care Difficulty
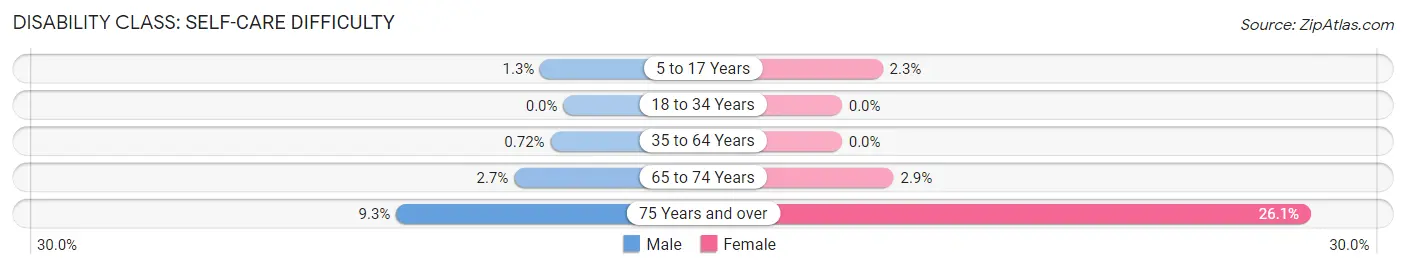
| Age Bracket | Male | Female |
| 5 to 17 Years | 36 (1.3%) | 60 (2.3%) |
| 18 to 34 Years | 0 (0.0%) | 0 (0.0%) |
| 35 to 64 Years | 41 (0.7%) | 0 (0.0%) |
| 65 to 74 Years | 31 (2.7%) | 32 (2.9%) |
| 75 Years and over | 62 (9.3%) | 344 (26.1%) |
Technology Access in Vernon Hills
Computing Device Access in Vernon Hills
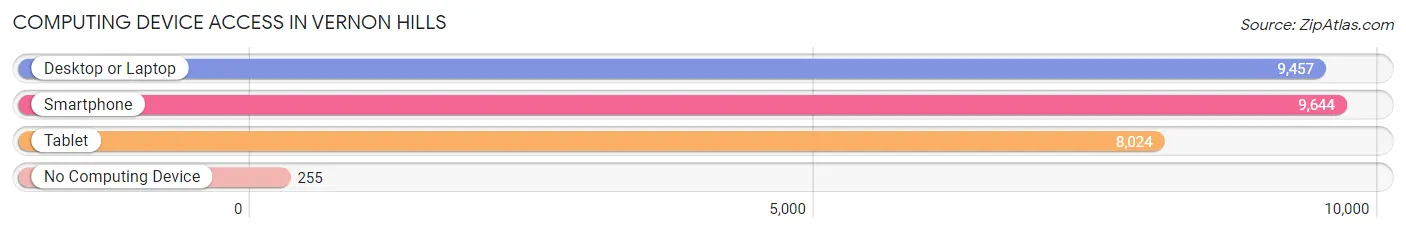
| Device Type | # Households | % Households |
| Desktop or Laptop | 9,457 | 91.2% |
| Smartphone | 9,644 | 93.0% |
| Tablet | 8,024 | 77.4% |
| No Computing Device | 255 | 2.5% |
| Total | 10,366 | 100.0% |
Internet Access in Vernon Hills
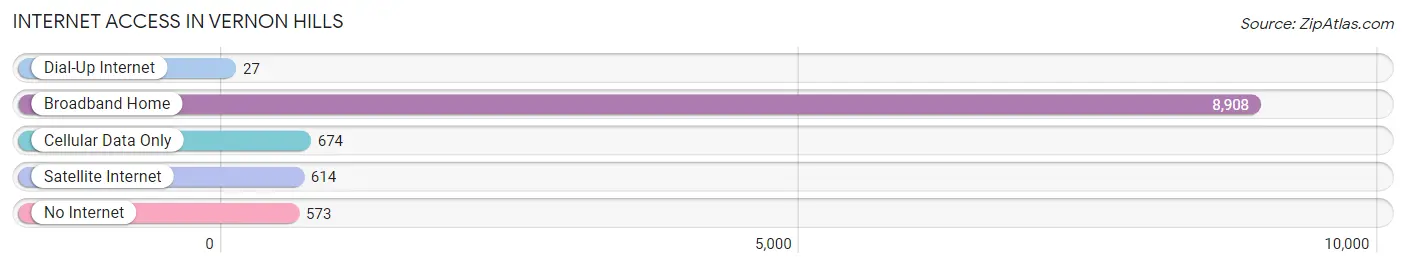
| Internet Type | # Households | % Households |
| Dial-Up Internet | 27 | 0.3% |
| Broadband Home | 8,908 | 85.9% |
| Cellular Data Only | 674 | 6.5% |
| Satellite Internet | 614 | 5.9% |
| No Internet | 573 | 5.5% |
| Total | 10,366 | 100.0% |
Vernon Hills Summary
Vernon Hills is a village located in Lake County, Illinois, United States. The population was 20,120 at the 2010 census, and estimated to be 24,837 in 2019. Vernon Hills is a northern suburb of Chicago and is located in the Chicago metropolitan area.
History
Vernon Hills was first settled in the mid-1800s by farmers from England, Germany, and Ireland. The area was originally known as "Vernon" and was part of the larger town of Half Day, which was named after a Potawatomi chief. In the 1950s, the area began to develop as a residential community, and in 1958, the village of Vernon Hills was incorporated.
Geography
Vernon Hills is located in Lake County, Illinois, at 42°14'45" North, 87°58'45" West (42.245833, -87.979167). It is bordered by the villages of Libertyville to the north, Mundelein to the west, Long Grove to the east, and Lincolnshire to the south. The village is located approximately 40 miles north of downtown Chicago.
The village is situated on rolling hills and is home to several lakes, including Lake Charles, Lake Louise, and Lake Mary. The village is also home to several parks, including the Vernon Hills Park District, which offers a variety of recreational activities.
Economy
Vernon Hills is home to a variety of businesses, including retail stores, restaurants, and professional services. The village is also home to several corporate headquarters, including CDW Corporation, Motorola Solutions, and Zebra Technologies.
The village is also home to several shopping centers, including the Hawthorn Mall, which is the largest shopping center in Lake County. The mall features over 150 stores and restaurants, as well as a movie theater.
Demographics
As of the 2010 census, the population of Vernon Hills was 20,120. The racial makeup of the village was 79.2% White, 5.2% African American, 0.2% Native American, 11.2% Asian, 0.1% Pacific Islander, 1.7% from other races, and 2.5% from two or more races. Hispanic or Latino of any race were 5.3% of the population.
The median household income in Vernon Hills was $97,845 in 2019, and the median home value was $400,000. The village has a highly educated population, with over 80% of residents having a bachelor's degree or higher.
Conclusion
Vernon Hills is a village located in Lake County, Illinois, United States. The village has a rich history, dating back to the mid-1800s, and is home to a variety of businesses, shopping centers, and parks. The population of Vernon Hills is diverse, with a median household income of $97,845 and a median home value of $400,000. The village is also home to a highly educated population, with over 80% of residents having a bachelor's degree or higher.
Common Questions
What is Per Capita Income in Vernon Hills?
Per Capita income in Vernon Hills is $58,875.
What is the Median Family Income in Vernon Hills?
Median Family Income in Vernon Hills is $136,475.
What is the Median Household income in Vernon Hills?
Median Household Income in Vernon Hills is $117,253.
What is Income or Wage Gap in Vernon Hills?
Income or Wage Gap in Vernon Hills is 41.2%.
Women in Vernon Hills earn 58.8 cents for every dollar earned by a man.
What is Inequality or Gini Index in Vernon Hills?
Inequality or Gini Index in Vernon Hills is 0.42.
What is the Total Population of Vernon Hills?
Total Population of Vernon Hills is 26,750.
What is the Total Male Population of Vernon Hills?
Total Male Population of Vernon Hills is 13,273.
What is the Total Female Population of Vernon Hills?
Total Female Population of Vernon Hills is 13,477.
What is the Ratio of Males per 100 Females in Vernon Hills?
There are 98.49 Males per 100 Females in Vernon Hills.
What is the Ratio of Females per 100 Males in Vernon Hills?
There are 101.54 Females per 100 Males in Vernon Hills.
What is the Median Population Age in Vernon Hills?
Median Population Age in Vernon Hills is 40.6 Years.
What is the Average Family Size in Vernon Hills
Average Family Size in Vernon Hills is 3.1 People.
What is the Average Household Size in Vernon Hills
Average Household Size in Vernon Hills is 2.6 People.
How Large is the Labor Force in Vernon Hills?
There are 14,617 People in the Labor Forcein in Vernon Hills.
What is the Percentage of People in the Labor Force in Vernon Hills?
68.9% of People are in the Labor Force in Vernon Hills.
What is the Unemployment Rate in Vernon Hills?
Unemployment Rate in Vernon Hills is 3.7%.