States with the Largest Cambodian Community
RELATED REPORTS & OPTIONS
Cambodian
United States
Compare States
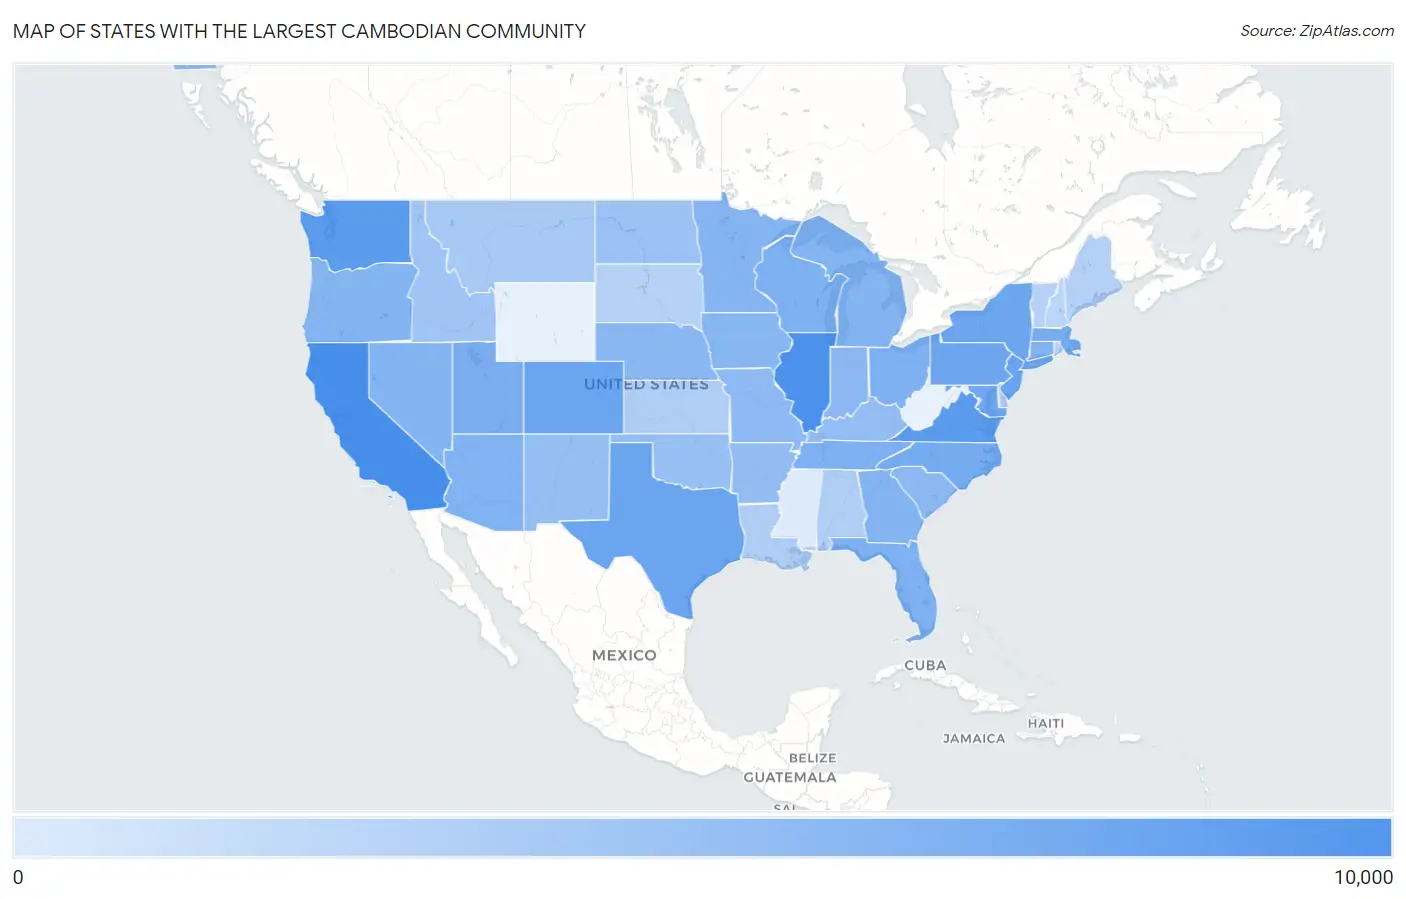
Map of States with the Largest Cambodian Community
0
10,000
States with the Largest Cambodian Community in the United States
| State | Cambodian | vs State Median | vs National | |
| 1. | California | 8,150 | 276 (+7.87k) | 33,559(24.29%) |
| 2. | Illinois | 6,404 | 276 (+6.13k) | 33,559(19.08%) |
| 3. | Virginia | 2,791 | 276 (+2.52k) | 33,559(8.32%) |
| 4. | Washington | 2,565 | 276 (+2.29k) | 33,559(7.64%) |
| 5. | New Jersey | 1,274 | 276 (+998) | 33,559(3.80%) |
| 6. | Colorado | 1,071 | 276 (+796) | 33,559(3.19%) |
| 7. | Texas | 1,061 | 276 (+786) | 33,559(3.16%) |
| 8. | Pennsylvania | 930 | 276 (+654) | 33,559(2.77%) |
| 9. | New York | 885 | 276 (+610) | 33,559(2.64%) |
| 10. | Maryland | 842 | 276 (+566) | 33,559(2.51%) |
| 11. | Massachusetts | 665 | 276 (+390) | 33,559(1.98%) |
| 12. | North Carolina | 645 | 276 (+370) | 33,559(1.92%) |
| 13. | Utah | 499 | 276 (+224) | 33,559(1.49%) |
| 14. | Wisconsin | 402 | 276 (+126) | 33,559(1.20%) |
| 15. | Florida | 390 | 276 (+114) | 33,559(1.16%) |
| 16. | Tennessee | 367 | 276 (+91.5) | 33,559(1.09%) |
| 17. | Ohio | 359 | 276 (+83.5) | 33,559(1.07%) |
| 18. | Connecticut | 342 | 276 (+66.5) | 33,559(1.02%) |
| 19. | Arizona | 341 | 276 (+65.5) | 33,559(1.02%) |
| 20. | Nevada | 309 | 276 (+33.5) | 33,559(0.92%) |
| 21. | Georgia | 303 | 276 (+27.5) | 33,559(0.90%) |
| 22. | Hawaii | 293 | 276 (+17.5) | 33,559(0.87%) |
| 23. | Michigan | 282 | 276 (+6.50) | 33,559(0.84%) |
| 24. | Oregon | 281 | 276 (+5.50) | 33,559(0.84%) |
| 25. | Minnesota | 270 | 276 (-5.50) | 33,559(0.80%) |
| 26. | Iowa | 219 | 276 (-56.5) | 33,559(0.65%) |
| 27. | Nebraska | 195 | 276 (-80.5) | 33,559(0.58%) |
| 28. | Indiana | 183 | 276 (-92.5) | 33,559(0.55%) |
| 29. | South Carolina | 166 | 276 (-110) | 33,559(0.49%) |
| 30. | Missouri | 153 | 276 (-122) | 33,559(0.46%) |
| 31. | Arkansas | 126 | 276 (-150) | 33,559(0.38%) |
| 32. | Kentucky | 114 | 276 (-162) | 33,559(0.34%) |
| 33. | New Mexico | 103 | 276 (-172) | 33,559(0.31%) |
| 34. | Oklahoma | 92 | 276 (-184) | 33,559(0.27%) |
| 35. | Alaska | 81 | 276 (-194) | 33,559(0.24%) |
| 36. | North Dakota | 80 | 276 (-196) | 33,559(0.24%) |
| 37. | Idaho | 52 | 276 (-224) | 33,559(0.15%) |
| 38. | Montana | 39 | 276 (-236) | 33,559(0.12%) |
| 39. | Delaware | 37 | 276 (-238) | 33,559(0.11%) |
| 40. | Louisiana | 26 | 276 (-250) | 33,559(0.08%) |
| 41. | Kansas | 24 | 276 (-252) | 33,559(0.07%) |
| 42. | Alabama | 22 | 276 (-254) | 33,559(0.07%) |
| 43. | Maine | 20 | 276 (-256) | 33,559(0.06%) |
| 44. | South Dakota | 16 | 276 (-260) | 33,559(0.05%) |
| 45. | Rhode Island | 15 | 276 (-260) | 33,559(0.04%) |
| 46. | Vermont | 14 | 276 (-262) | 33,559(0.04%) |
| 47. | New Hampshire | 12 | 276 (-264) | 33,559(0.04%) |
| 48. | Mississippi | 1 | 276 (-274) | 33,559(0.00%) |
1
Common Questions
What are the Top 10 States with the Largest Cambodian Community in the United States?
Top 10 States with the Largest Cambodian Community in the United States are:
#1
8,150
#2
6,404
#3
2,791
#4
2,565
#5
1,274
#6
1,071
#7
1,061
#8
930
#9
885
#10
842
What state has the Largest Cambodian Community in the United States?
California has the Largest Cambodian Community in the United States with 8,150.
What is the Total Cambodian Population in the United States?
Total Cambodian Population in the United States is 33,559.