Fairfield, IA Map & Demographics
Fairfield Map
Fairfield Overview
$38,109
PER CAPITA INCOME
$60,164
AVG FAMILY INCOME
$44,277
AVG HOUSEHOLD INCOME
21.6%
WAGE / INCOME GAP [ % ]
78.4¢/ $1
WAGE / INCOME GAP [ $ ]
0.59
INEQUALITY / GINI INDEX
9,474
TOTAL POPULATION
5,181
MALE POPULATION
4,293
FEMALE POPULATION
120.68
MALES / 100 FEMALES
82.86
FEMALES / 100 MALES
43.0
MEDIAN AGE
2.7
AVG FAMILY SIZE
2.1
AVG HOUSEHOLD SIZE
4,722
LABOR FORCE [ PEOPLE ]
58.2%
PERCENT IN LABOR FORCE
6.5%
UNEMPLOYMENT RATE
Fairfield Area Codes
Income in Fairfield
Income Overview in Fairfield
Per Capita Income in Fairfield is $38,109, while median incomes of families and households are $60,164 and $44,277 respectively.
| Characteristic | Number | Measure |
| Per Capita Income | 9,474 | $38,109 |
| Median Family Income | 2,076 | $60,164 |
| Mean Family Income | 2,076 | $119,075 |
| Median Household Income | 4,139 | $44,277 |
| Mean Household Income | 4,139 | $83,727 |
| Income Deficit | 2,076 | $0 |
| Wage / Income Gap (%) | 9,474 | 21.65% |
| Wage / Income Gap ($) | 9,474 | 78.35¢ per $1 |
| Gini / Inequality Index | 9,474 | 0.59 |
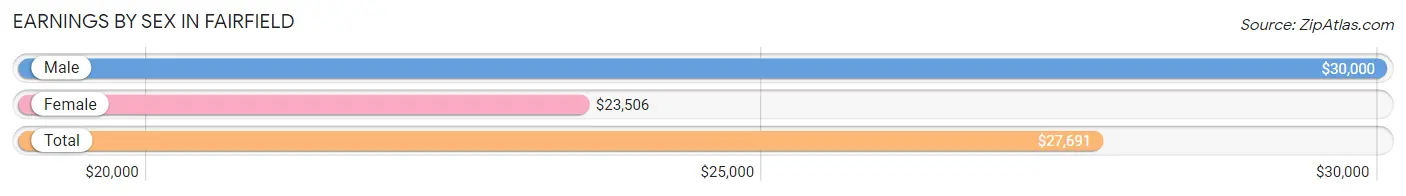
Earnings by Sex in Fairfield
Average Earnings in Fairfield are $27,691, $30,000 for men and $23,506 for women, a difference of 21.6%.
| Sex | Number | Average Earnings |
| Male | 2,848 (56.6%) | $30,000 |
| Female | 2,186 (43.4%) | $23,506 |
| Total | 5,034 (100.0%) | $27,691 |
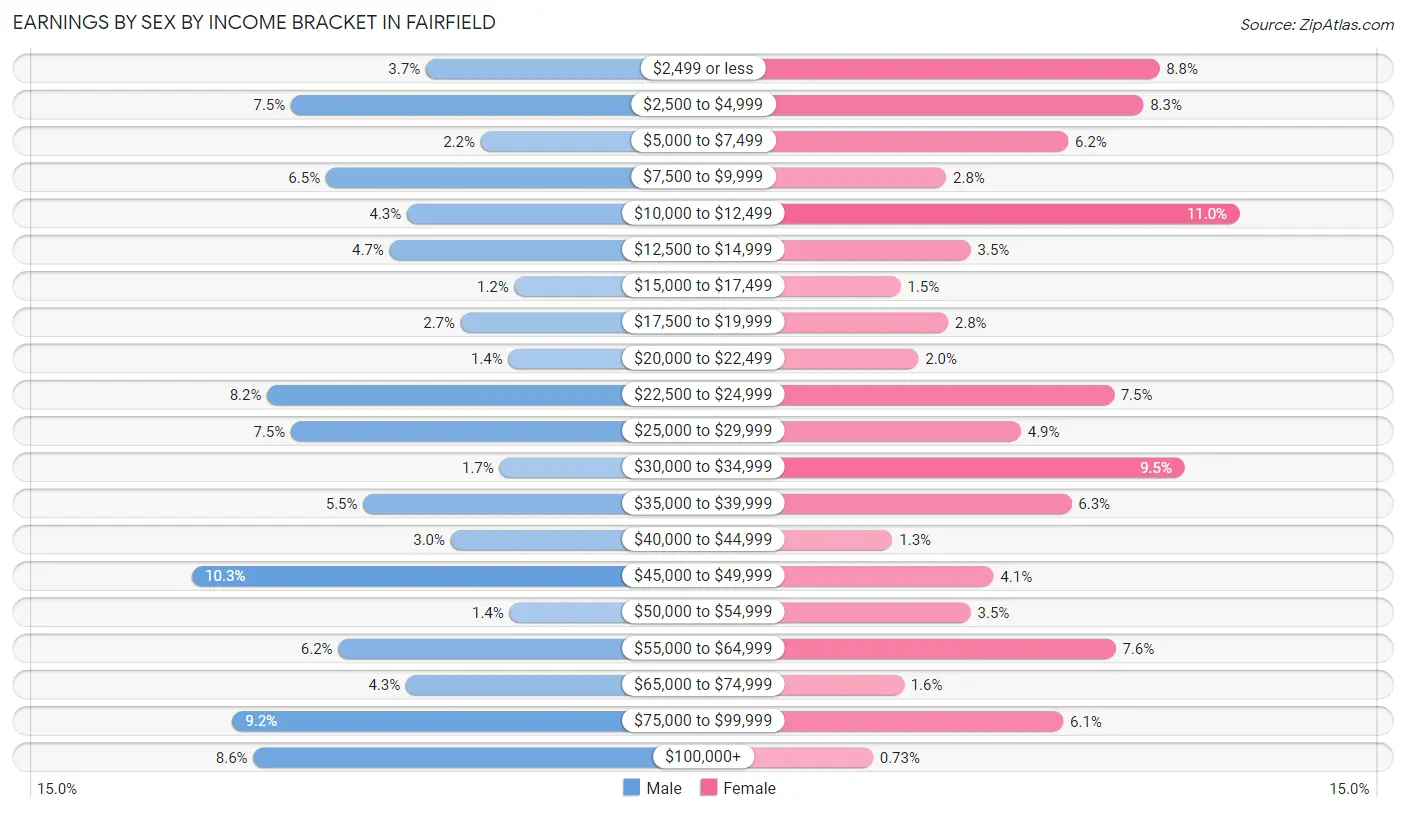
Earnings by Sex by Income Bracket in Fairfield
The most common earnings brackets in Fairfield are $45,000 to $49,999 for men (293 | 10.3%) and $10,000 to $12,499 for women (241 | 11.0%).
| Income | Male | Female |
| $2,499 or less | 106 (3.7%) | 192 (8.8%) |
| $2,500 to $4,999 | 214 (7.5%) | 182 (8.3%) |
| $5,000 to $7,499 | 62 (2.2%) | 136 (6.2%) |
| $7,500 to $9,999 | 186 (6.5%) | 61 (2.8%) |
| $10,000 to $12,499 | 121 (4.3%) | 241 (11.0%) |
| $12,500 to $14,999 | 135 (4.7%) | 76 (3.5%) |
| $15,000 to $17,499 | 35 (1.2%) | 33 (1.5%) |
| $17,500 to $19,999 | 78 (2.7%) | 62 (2.8%) |
| $20,000 to $22,499 | 40 (1.4%) | 44 (2.0%) |
| $22,500 to $24,999 | 233 (8.2%) | 164 (7.5%) |
| $25,000 to $29,999 | 214 (7.5%) | 107 (4.9%) |
| $30,000 to $34,999 | 47 (1.7%) | 207 (9.5%) |
| $35,000 to $39,999 | 156 (5.5%) | 138 (6.3%) |
| $40,000 to $44,999 | 86 (3.0%) | 28 (1.3%) |
| $45,000 to $49,999 | 293 (10.3%) | 90 (4.1%) |
| $50,000 to $54,999 | 39 (1.4%) | 76 (3.5%) |
| $55,000 to $64,999 | 176 (6.2%) | 165 (7.5%) |
| $65,000 to $74,999 | 122 (4.3%) | 35 (1.6%) |
| $75,000 to $99,999 | 261 (9.2%) | 133 (6.1%) |
| $100,000+ | 244 (8.6%) | 16 (0.7%) |
| Total | 2,848 (100.0%) | 2,186 (100.0%) |
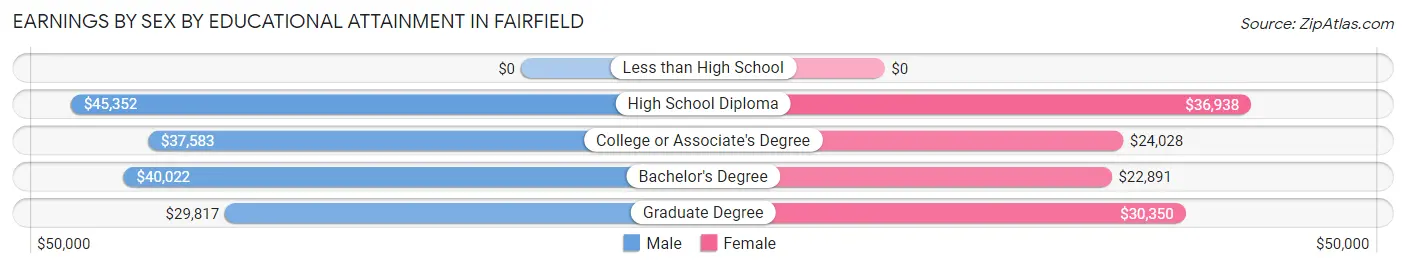
Earnings by Sex by Educational Attainment in Fairfield
Average earnings in Fairfield are $37,176 for men and $26,094 for women, a difference of 29.8%. Men with an educational attainment of high school diploma enjoy the highest average annual earnings of $45,352, while those with graduate degree education earn the least with $29,817. Women with an educational attainment of high school diploma earn the most with the average annual earnings of $36,938, while those with bachelor's degree education have the smallest earnings of $22,891.
| Educational Attainment | Male Income | Female Income |
| Less than High School | - | - |
| High School Diploma | $45,352 | $36,938 |
| College or Associate's Degree | $37,583 | $24,028 |
| Bachelor's Degree | $40,022 | $22,891 |
| Graduate Degree | $29,817 | $30,350 |
| Total | $37,176 | $26,094 |
Family Income in Fairfield
Family Income Brackets in Fairfield
According to the Fairfield family income data, there are 538 families falling into the $35,000 to $49,999 income range, which is the most common income bracket and makes up 25.9% of all families. Conversely, the $10,000 to $14,999 income bracket is the least frequent group with only 25 families (1.2%) belonging to this category.
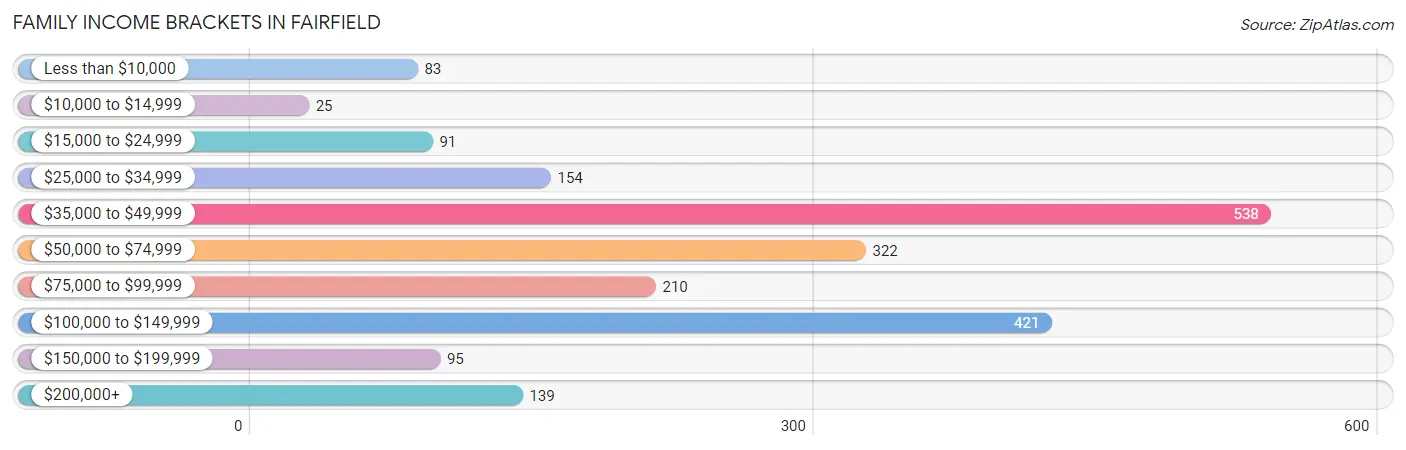
| Income Bracket | # Families | % Families |
| Less than $10,000 | 83 | 4.0% |
| $10,000 to $14,999 | 25 | 1.2% |
| $15,000 to $24,999 | 91 | 4.4% |
| $25,000 to $34,999 | 154 | 7.4% |
| $35,000 to $49,999 | 538 | 25.9% |
| $50,000 to $74,999 | 322 | 15.5% |
| $75,000 to $99,999 | 210 | 10.1% |
| $100,000 to $149,999 | 421 | 20.3% |
| $150,000 to $199,999 | 95 | 4.6% |
| $200,000+ | 139 | 6.7% |
Family Income by Famaliy Size in Fairfield
2-person families (1,202 | 57.9%) account for the highest median family income in Fairfield with $66,824 per family, while 2-person families (1,202 | 57.9%) have the highest median income of $33,412 per family member.
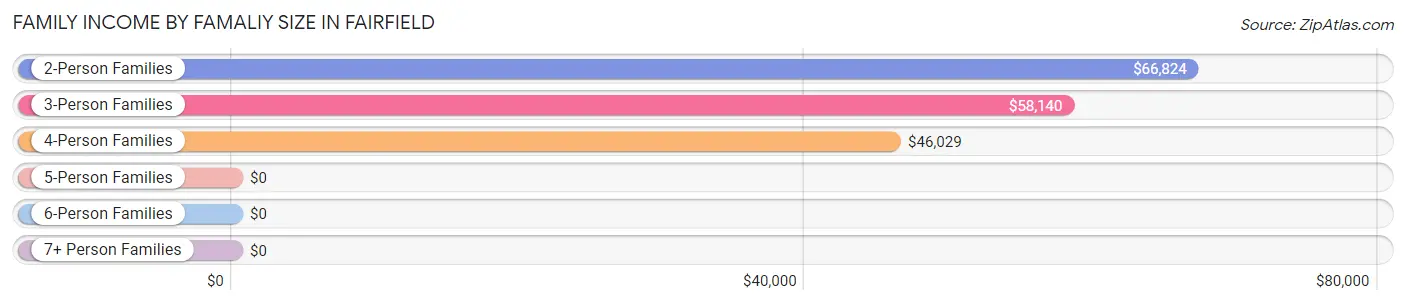
| Income Bracket | # Families | Median Income |
| 2-Person Families | 1,202 (57.9%) | $66,824 |
| 3-Person Families | 457 (22.0%) | $58,140 |
| 4-Person Families | 320 (15.4%) | $46,029 |
| 5-Person Families | 97 (4.7%) | $0 |
| 6-Person Families | 0 (0.0%) | $0 |
| 7+ Person Families | 0 (0.0%) | $0 |
| Total | 2,076 (100.0%) | $60,164 |
Family Income by Number of Earners in Fairfield
The median family income in Fairfield is $60,164, with families comprising 2 earners (767) having the highest median family income of $105,299, while families with 1 earner (922) have the lowest median family income of $37,800, accounting for 36.9% and 44.4% of families, respectively.
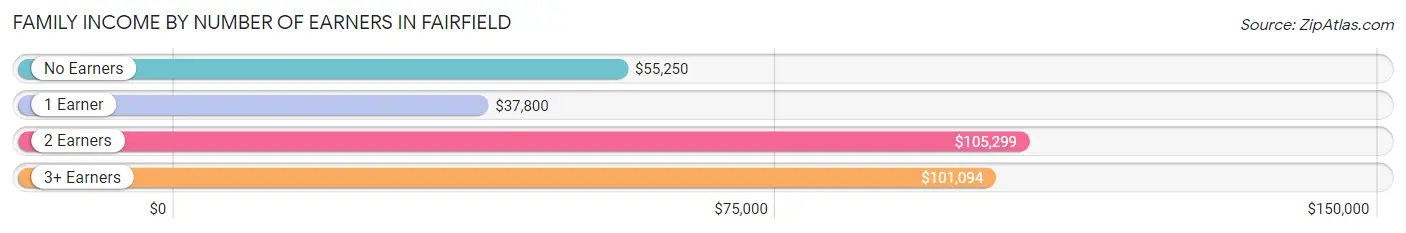
| Number of Earners | # Families | Median Income |
| No Earners | 292 (14.1%) | $55,250 |
| 1 Earner | 922 (44.4%) | $37,800 |
| 2 Earners | 767 (36.9%) | $105,299 |
| 3+ Earners | 95 (4.6%) | $101,094 |
| Total | 2,076 (100.0%) | $60,164 |
Household Income in Fairfield
Household Income Brackets in Fairfield
With 621 households falling in the category, the $50,000 to $74,999 income range is the most frequent in Fairfield, accounting for 15.0% of all households. In contrast, only 108 households (2.6%) fall into the $150,000 to $199,999 income bracket, making it the least populous group.
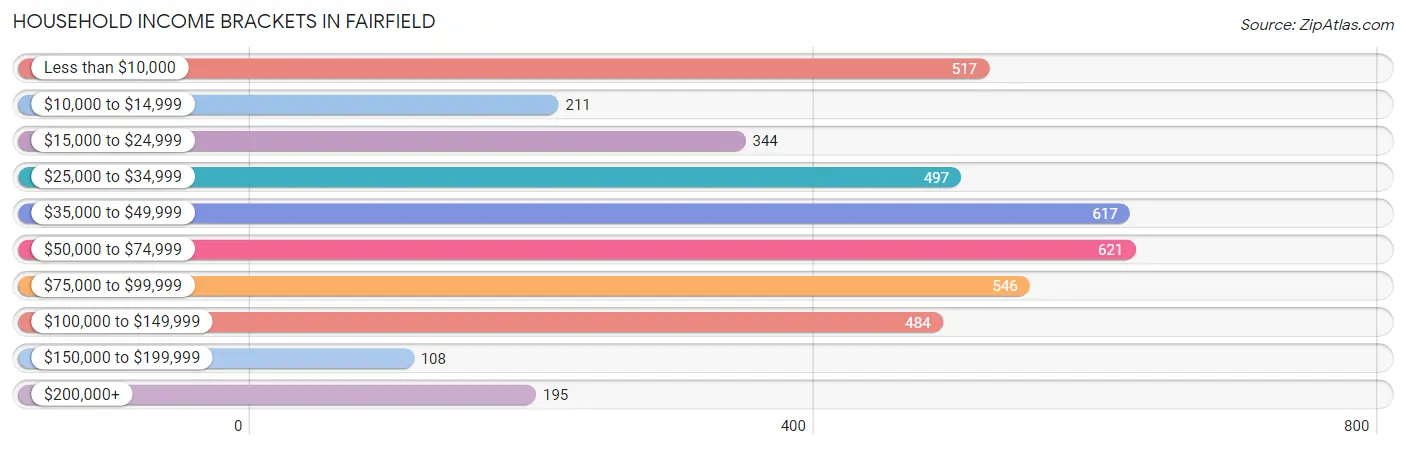
| Income Bracket | # Households | % Households |
| Less than $10,000 | 517 | 12.5% |
| $10,000 to $14,999 | 211 | 5.1% |
| $15,000 to $24,999 | 344 | 8.3% |
| $25,000 to $34,999 | 497 | 12.0% |
| $35,000 to $49,999 | 617 | 14.9% |
| $50,000 to $74,999 | 621 | 15.0% |
| $75,000 to $99,999 | 546 | 13.2% |
| $100,000 to $149,999 | 484 | 11.7% |
| $150,000 to $199,999 | 108 | 2.6% |
| $200,000+ | 195 | 4.7% |
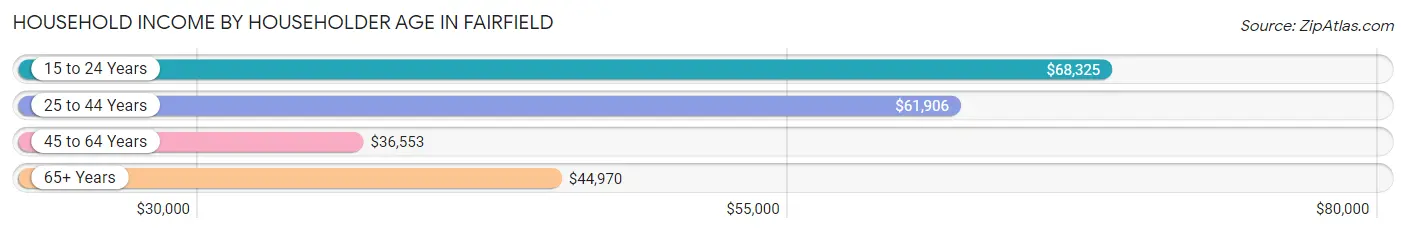
Household Income by Householder Age in Fairfield
The median household income in Fairfield is $44,277, with the highest median household income of $68,325 found in the 15 to 24 years age bracket for the primary householder. A total of 170 households (4.1%) fall into this category. Meanwhile, the 45 to 64 years age bracket for the primary householder has the lowest median household income of $36,553, with 1,437 households (34.7%) in this group.
| Income Bracket | # Households | Median Income |
| 15 to 24 Years | 170 (4.1%) | $68,325 |
| 25 to 44 Years | 987 (23.8%) | $61,906 |
| 45 to 64 Years | 1,437 (34.7%) | $36,553 |
| 65+ Years | 1,545 (37.3%) | $44,970 |
| Total | 4,139 (100.0%) | $44,277 |
Poverty in Fairfield
Income Below Poverty by Sex and Age in Fairfield
With 16.7% poverty level for males and 17.5% for females among the residents of Fairfield, 25 to 34 year old males and 18 to 24 year old females are the most vulnerable to poverty, with 199 males (36.2%) and 99 females (38.7%) in their respective age groups living below the poverty level.
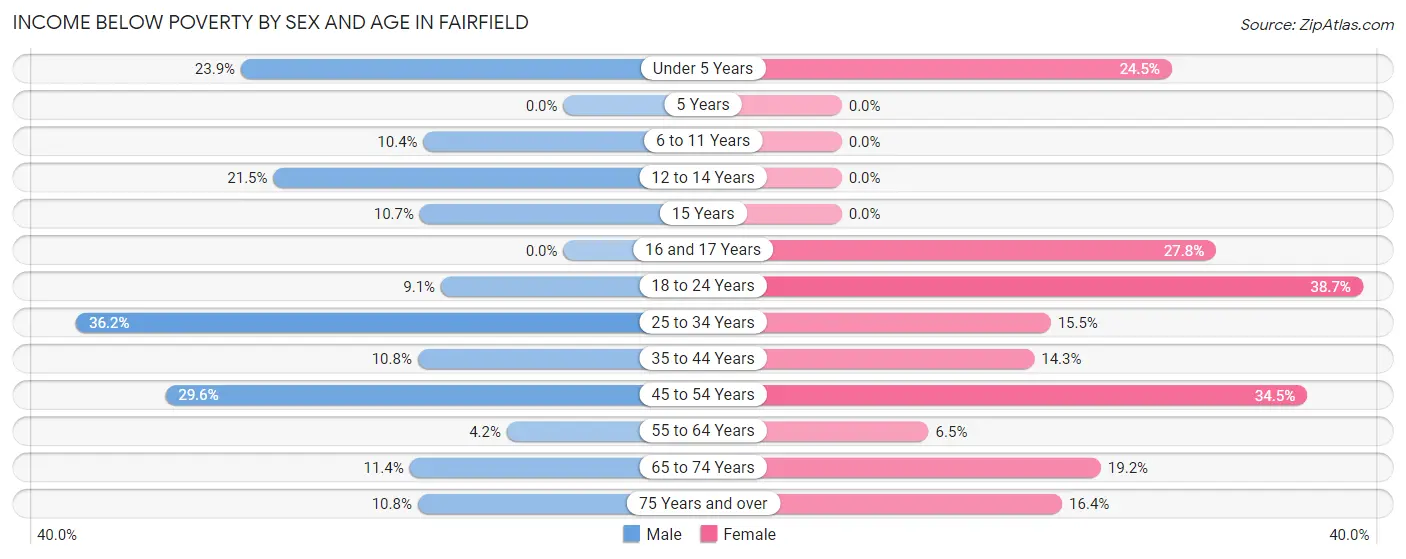
| Age Bracket | Male | Female |
| Under 5 Years | 51 (23.9%) | 36 (24.5%) |
| 5 Years | 0 (0.0%) | 0 (0.0%) |
| 6 to 11 Years | 29 (10.4%) | 0 (0.0%) |
| 12 to 14 Years | 31 (21.5%) | 0 (0.0%) |
| 15 Years | 13 (10.7%) | 0 (0.0%) |
| 16 and 17 Years | 0 (0.0%) | 10 (27.8%) |
| 18 to 24 Years | 28 (9.1%) | 99 (38.7%) |
| 25 to 34 Years | 199 (36.2%) | 98 (15.5%) |
| 35 to 44 Years | 73 (10.8%) | 60 (14.3%) |
| 45 to 54 Years | 177 (29.5%) | 172 (34.5%) |
| 55 to 64 Years | 18 (4.2%) | 33 (6.5%) |
| 65 to 74 Years | 87 (11.4%) | 136 (19.2%) |
| 75 Years and over | 36 (10.8%) | 79 (16.4%) |
| Total | 742 (16.7%) | 723 (17.5%) |
Income Above Poverty by Sex and Age in Fairfield
According to the poverty statistics in Fairfield, males aged 5 years and females aged 5 years are the age groups that are most secure financially, with 100.0% of males and 100.0% of females in these age groups living above the poverty line.
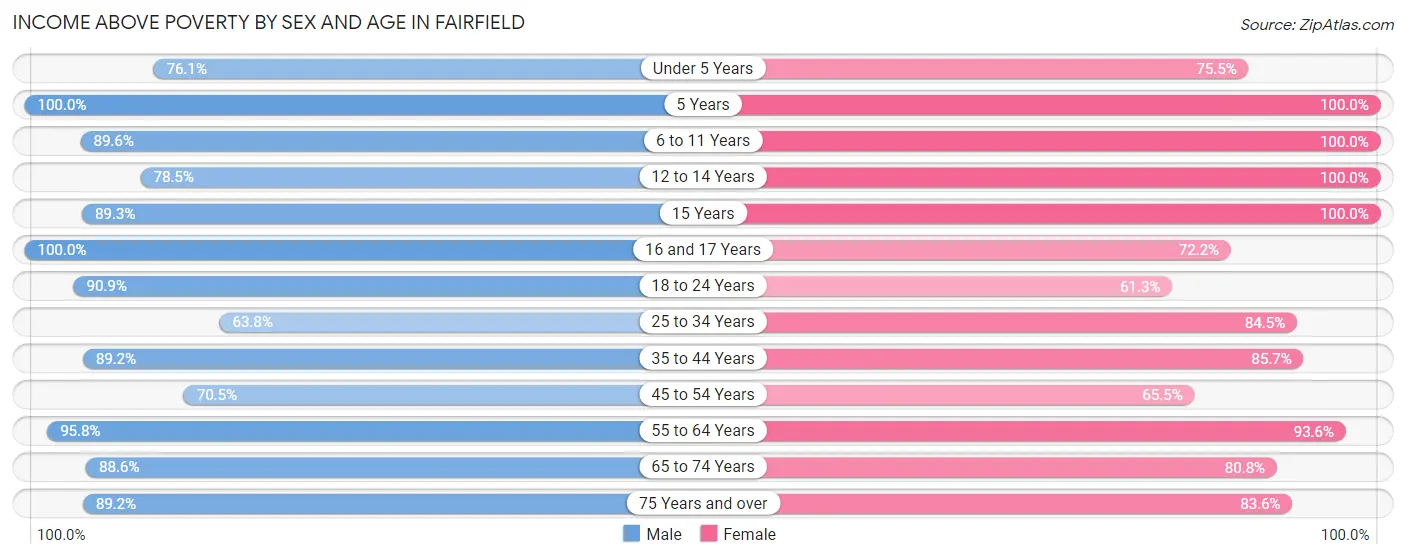
| Age Bracket | Male | Female |
| Under 5 Years | 162 (76.1%) | 111 (75.5%) |
| 5 Years | 8 (100.0%) | 101 (100.0%) |
| 6 to 11 Years | 250 (89.6%) | 193 (100.0%) |
| 12 to 14 Years | 113 (78.5%) | 89 (100.0%) |
| 15 Years | 109 (89.3%) | 64 (100.0%) |
| 16 and 17 Years | 21 (100.0%) | 26 (72.2%) |
| 18 to 24 Years | 280 (90.9%) | 157 (61.3%) |
| 25 to 34 Years | 351 (63.8%) | 534 (84.5%) |
| 35 to 44 Years | 602 (89.2%) | 360 (85.7%) |
| 45 to 54 Years | 422 (70.5%) | 326 (65.5%) |
| 55 to 64 Years | 411 (95.8%) | 479 (93.5%) |
| 65 to 74 Years | 675 (88.6%) | 571 (80.8%) |
| 75 Years and over | 297 (89.2%) | 404 (83.6%) |
| Total | 3,701 (83.3%) | 3,415 (82.5%) |
Income Below Poverty Among Married-Couple Families in Fairfield
The poverty statistics for married-couple families in Fairfield show that 8.3% or 118 of the total 1,417 families live below the poverty line. Families with 1 or 2 children have the highest poverty rate of 16.1%, comprising of 70 families. On the other hand, families with 3 or 4 children have the lowest poverty rate of 0.0%, which includes 0 families.
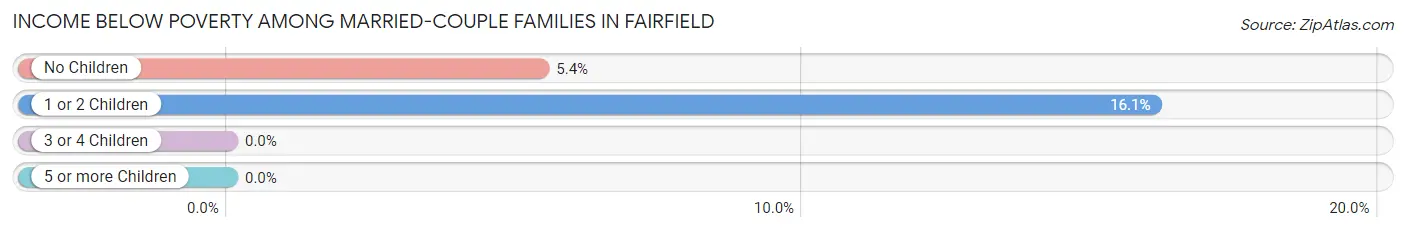
| Children | Above Poverty | Below Poverty |
| No Children | 837 (94.6%) | 48 (5.4%) |
| 1 or 2 Children | 365 (83.9%) | 70 (16.1%) |
| 3 or 4 Children | 97 (100.0%) | 0 (0.0%) |
| 5 or more Children | 0 (0.0%) | 0 (0.0%) |
| Total | 1,299 (91.7%) | 118 (8.3%) |
Income Below Poverty Among Single-Parent Households in Fairfield
According to the poverty data in Fairfield, 11.4% or 37 single-father households and 4.5% or 15 single-mother households are living below the poverty line. Among single-father households, those with 1 or 2 children have the highest poverty rate, with 37 households (19.5%) experiencing poverty. Likewise, among single-mother households, those with 1 or 2 children have the highest poverty rate, with 15 households (6.3%) falling below the poverty line.
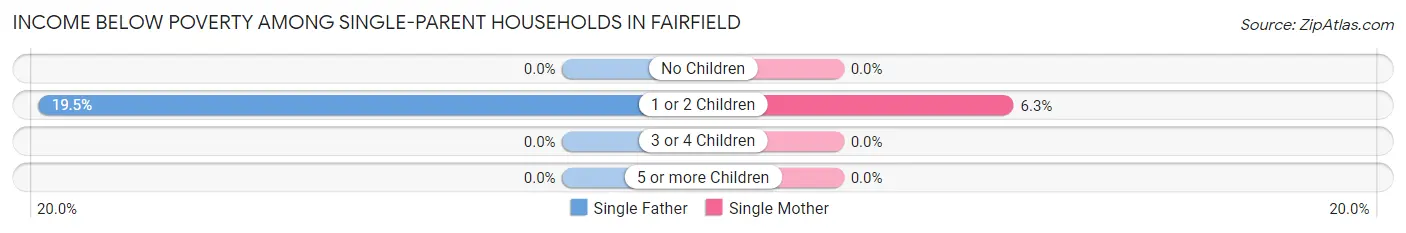
| Children | Single Father | Single Mother |
| No Children | 0 (0.0%) | 0 (0.0%) |
| 1 or 2 Children | 37 (19.5%) | 15 (6.3%) |
| 3 or 4 Children | 0 (0.0%) | 0 (0.0%) |
| 5 or more Children | 0 (0.0%) | 0 (0.0%) |
| Total | 37 (11.4%) | 15 (4.5%) |
Income Below Poverty Among Married-Couple vs Single-Parent Households in Fairfield
The poverty data for Fairfield shows that 118 of the married-couple family households (8.3%) and 52 of the single-parent households (7.9%) are living below the poverty level. Within the married-couple family households, those with 1 or 2 children have the highest poverty rate, with 70 households (16.1%) falling below the poverty line. Among the single-parent households, those with 1 or 2 children have the highest poverty rate, with 52 household (12.2%) living below poverty.
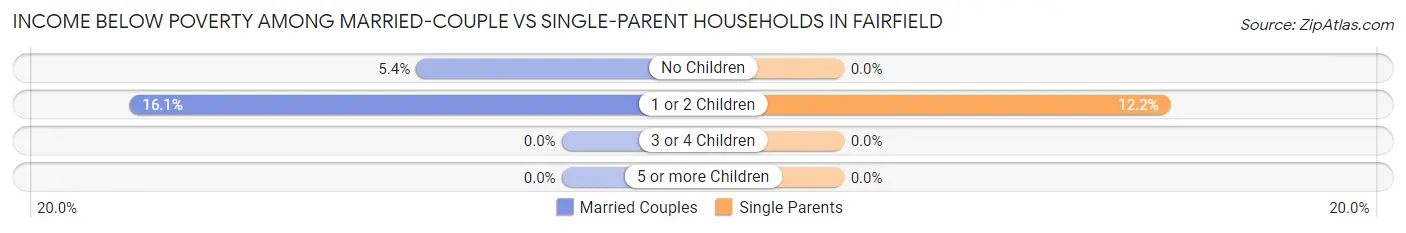
| Children | Married-Couple Families | Single-Parent Households |
| No Children | 48 (5.4%) | 0 (0.0%) |
| 1 or 2 Children | 70 (16.1%) | 52 (12.2%) |
| 3 or 4 Children | 0 (0.0%) | 0 (0.0%) |
| 5 or more Children | 0 (0.0%) | 0 (0.0%) |
| Total | 118 (8.3%) | 52 (7.9%) |
Race in Fairfield
The most populous races in Fairfield are White / Caucasian (7,394 | 78.0%), Asian (824 | 8.7%), and Black / African American (748 | 7.9%).
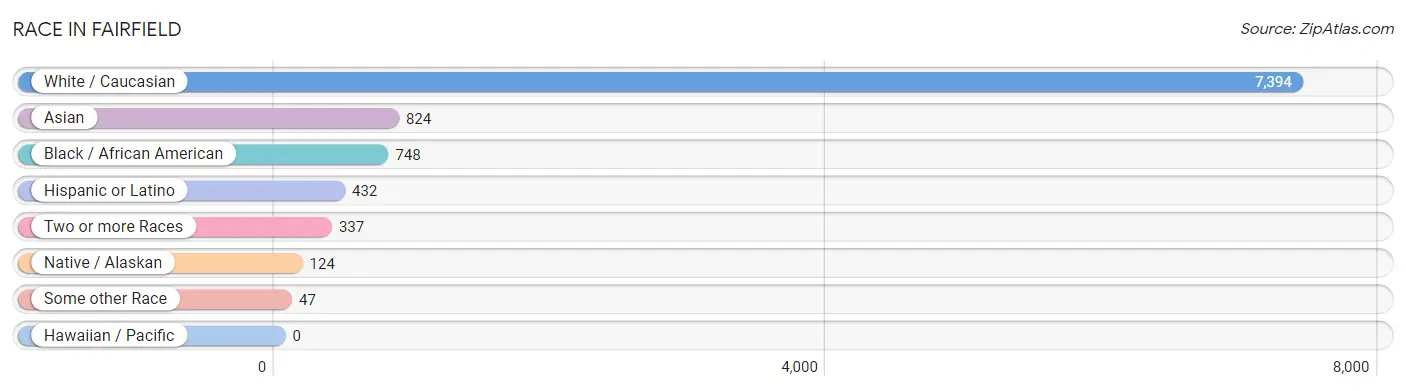
| Race | # Population | % Population |
| Asian | 824 | 8.7% |
| Black / African American | 748 | 7.9% |
| Hawaiian / Pacific | 0 | 0.0% |
| Hispanic or Latino | 432 | 4.6% |
| Native / Alaskan | 124 | 1.3% |
| White / Caucasian | 7,394 | 78.0% |
| Two or more Races | 337 | 3.6% |
| Some other Race | 47 | 0.5% |
| Total | 9,474 | 100.0% |
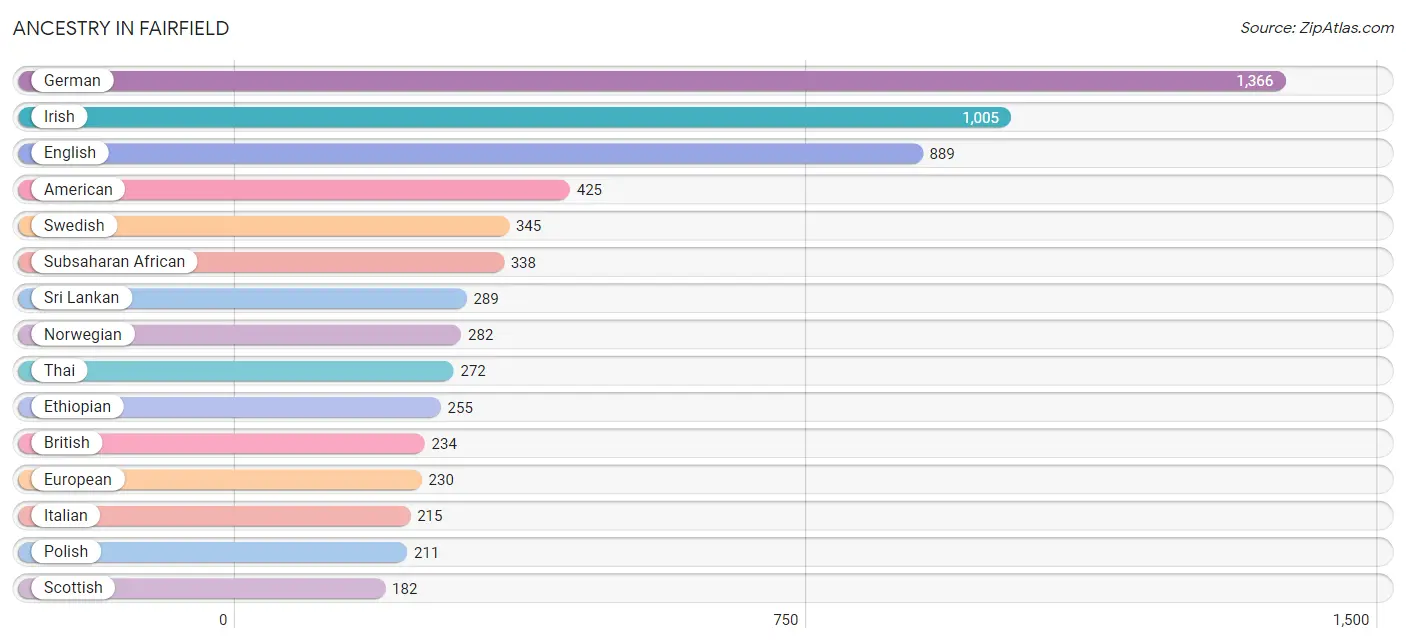
Ancestry in Fairfield
The most populous ancestries reported in Fairfield are German (1,366 | 14.4%), Irish (1,005 | 10.6%), English (889 | 9.4%), American (425 | 4.5%), and Swedish (345 | 3.6%), together accounting for 42.5% of all Fairfield residents.
| Ancestry | # Population | % Population |
| African | 63 | 0.7% |
| American | 425 | 4.5% |
| Arab | 65 | 0.7% |
| British | 234 | 2.5% |
| Cambodian | 101 | 1.1% |
| Canadian | 54 | 0.6% |
| Central American Indian | 92 | 1.0% |
| Choctaw | 56 | 0.6% |
| Colombian | 82 | 0.9% |
| Croatian | 12 | 0.1% |
| Czech | 21 | 0.2% |
| Czechoslovakian | 13 | 0.1% |
| Danish | 53 | 0.6% |
| Dutch | 94 | 1.0% |
| Eastern European | 18 | 0.2% |
| Egyptian | 64 | 0.7% |
| English | 889 | 9.4% |
| Ethiopian | 255 | 2.7% |
| European | 230 | 2.4% |
| Finnish | 7 | 0.1% |
| French | 147 | 1.5% |
| French Canadian | 49 | 0.5% |
| German | 1,366 | 14.4% |
| Greek | 117 | 1.2% |
| Haitian | 6 | 0.1% |
| Hungarian | 23 | 0.2% |
| Indian (Asian) | 131 | 1.4% |
| Irish | 1,005 | 10.6% |
| Israeli | 1 | 0.0% |
| Italian | 215 | 2.3% |
| Japanese | 16 | 0.2% |
| Korean | 55 | 0.6% |
| Laotian | 12 | 0.1% |
| Macedonian | 61 | 0.6% |
| Mexican | 180 | 1.9% |
| Mexican American Indian | 118 | 1.3% |
| Norwegian | 282 | 3.0% |
| Palestinian | 1 | 0.0% |
| Polish | 211 | 2.2% |
| Puerto Rican | 132 | 1.4% |
| Romanian | 44 | 0.5% |
| Russian | 90 | 0.9% |
| Scandinavian | 16 | 0.2% |
| Scottish | 182 | 1.9% |
| Slovak | 21 | 0.2% |
| South African | 16 | 0.2% |
| South American | 87 | 0.9% |
| Spanish | 29 | 0.3% |
| Sri Lankan | 289 | 3.0% |
| Subsaharan African | 338 | 3.6% |
| Swedish | 345 | 3.6% |
| Swiss | 71 | 0.7% |
| Thai | 272 | 2.9% |
| Turkish | 35 | 0.4% |
| Welsh | 22 | 0.2% | View All 55 Rows |
Immigrants in Fairfield
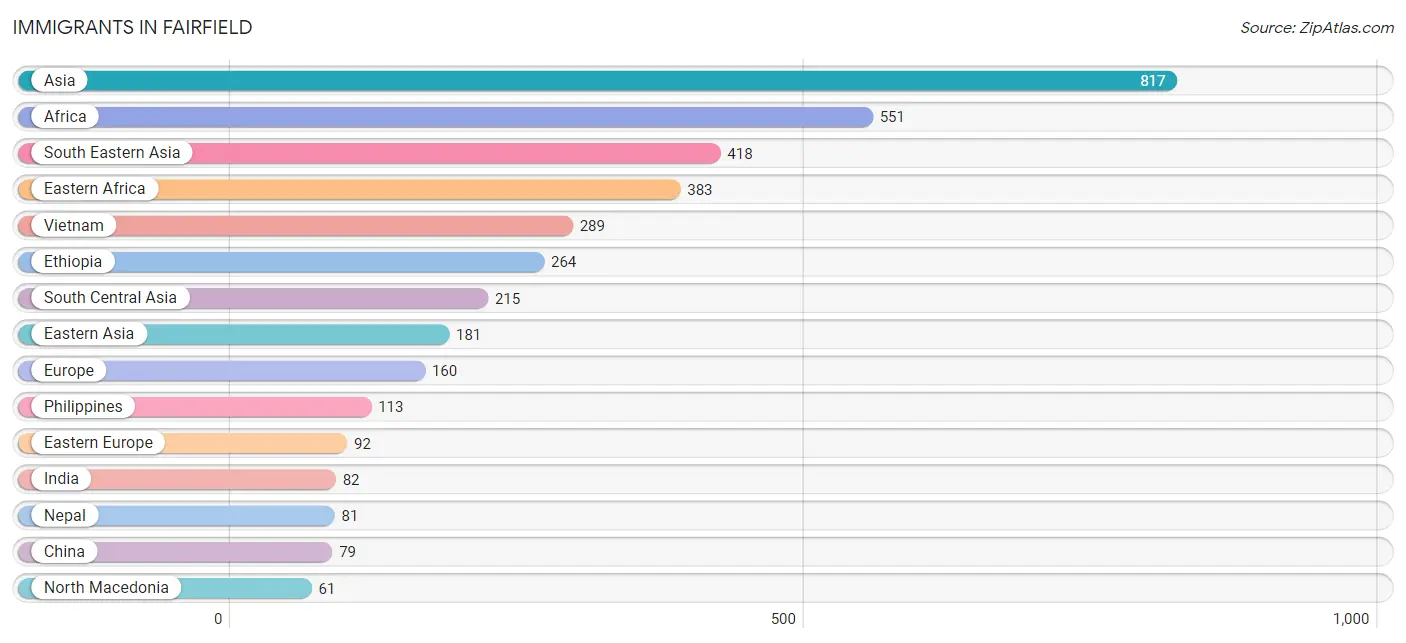
The most numerous immigrant groups reported in Fairfield came from Asia (817 | 8.6%), Africa (551 | 5.8%), South Eastern Asia (418 | 4.4%), Eastern Africa (383 | 4.0%), and Vietnam (289 | 3.0%), together accounting for 25.9% of all Fairfield residents.
| Immigration Origin | # Population | % Population |
| Africa | 551 | 5.8% |
| Asia | 817 | 8.6% |
| Australia | 12 | 0.1% |
| Cambodia | 16 | 0.2% |
| Canada | 29 | 0.3% |
| Caribbean | 6 | 0.1% |
| Central America | 25 | 0.3% |
| China | 79 | 0.8% |
| Congo | 11 | 0.1% |
| Eastern Africa | 383 | 4.0% |
| Eastern Asia | 181 | 1.9% |
| Eastern Europe | 92 | 1.0% |
| Egypt | 53 | 0.6% |
| El Salvador | 15 | 0.2% |
| England | 1 | 0.0% |
| Eritrea | 36 | 0.4% |
| Ethiopia | 264 | 2.8% |
| Europe | 160 | 1.7% |
| Germany | 32 | 0.3% |
| Haiti | 6 | 0.1% |
| Hong Kong | 25 | 0.3% |
| India | 82 | 0.9% |
| Israel | 1 | 0.0% |
| Kenya | 42 | 0.4% |
| Latin America | 36 | 0.4% |
| Mexico | 10 | 0.1% |
| Middle Africa | 11 | 0.1% |
| Nepal | 81 | 0.9% |
| Netherlands | 12 | 0.1% |
| Nigeria | 1 | 0.0% |
| North Macedonia | 61 | 0.6% |
| Northern Africa | 53 | 0.6% |
| Northern Europe | 24 | 0.3% |
| Oceania | 12 | 0.1% |
| Pakistan | 52 | 0.5% |
| Peru | 5 | 0.1% |
| Philippines | 113 | 1.2% |
| Russia | 31 | 0.3% |
| South Africa | 16 | 0.2% |
| South America | 5 | 0.1% |
| South Central Asia | 215 | 2.3% |
| South Eastern Asia | 418 | 4.4% |
| Sweden | 23 | 0.2% |
| Taiwan | 17 | 0.2% |
| Vietnam | 289 | 3.0% |
| Western Africa | 1 | 0.0% |
| Western Asia | 1 | 0.0% |
| Western Europe | 44 | 0.5% |
| Zimbabwe | 16 | 0.2% | View All 49 Rows |
Sex and Age in Fairfield
Sex and Age in Fairfield
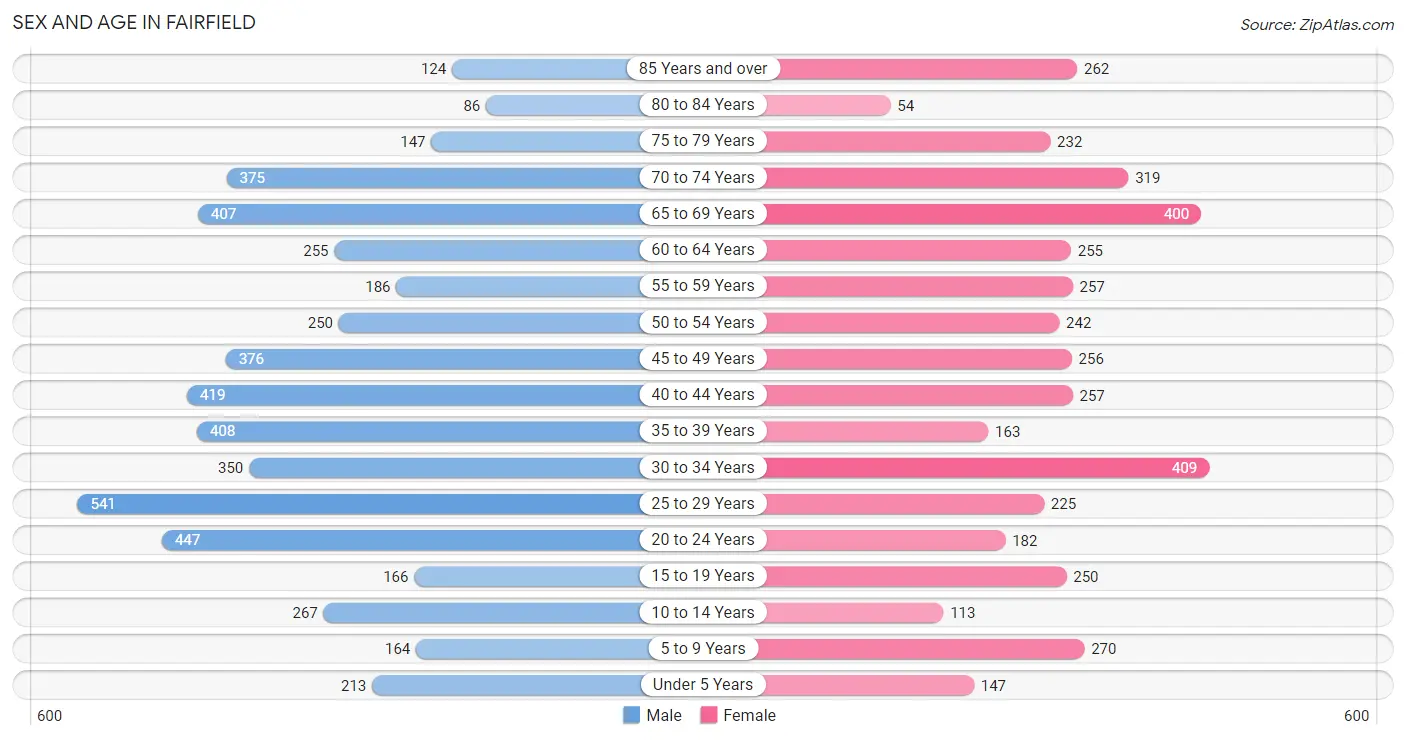
The most populous age groups in Fairfield are 25 to 29 Years (541 | 10.4%) for men and 30 to 34 Years (409 | 9.5%) for women.
| Age Bracket | Male | Female |
| Under 5 Years | 213 (4.1%) | 147 (3.4%) |
| 5 to 9 Years | 164 (3.2%) | 270 (6.3%) |
| 10 to 14 Years | 267 (5.1%) | 113 (2.6%) |
| 15 to 19 Years | 166 (3.2%) | 250 (5.8%) |
| 20 to 24 Years | 447 (8.6%) | 182 (4.2%) |
| 25 to 29 Years | 541 (10.4%) | 225 (5.2%) |
| 30 to 34 Years | 350 (6.8%) | 409 (9.5%) |
| 35 to 39 Years | 408 (7.9%) | 163 (3.8%) |
| 40 to 44 Years | 419 (8.1%) | 257 (6.0%) |
| 45 to 49 Years | 376 (7.3%) | 256 (6.0%) |
| 50 to 54 Years | 250 (4.8%) | 242 (5.6%) |
| 55 to 59 Years | 186 (3.6%) | 257 (6.0%) |
| 60 to 64 Years | 255 (4.9%) | 255 (5.9%) |
| 65 to 69 Years | 407 (7.9%) | 400 (9.3%) |
| 70 to 74 Years | 375 (7.2%) | 319 (7.4%) |
| 75 to 79 Years | 147 (2.8%) | 232 (5.4%) |
| 80 to 84 Years | 86 (1.7%) | 54 (1.3%) |
| 85 Years and over | 124 (2.4%) | 262 (6.1%) |
| Total | 5,181 (100.0%) | 4,293 (100.0%) |
Families and Households in Fairfield
Median Family Size in Fairfield
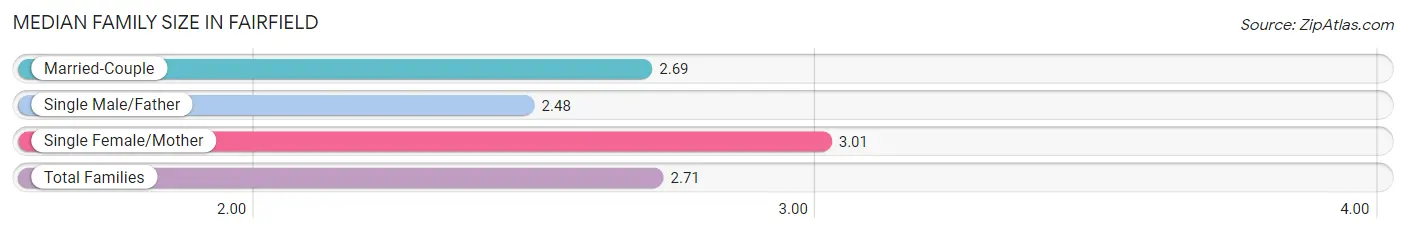
The median family size in Fairfield is 2.71 persons per family, with single female/mother families (334 | 16.1%) accounting for the largest median family size of 3.01 persons per family. On the other hand, single male/father families (325 | 15.7%) represent the smallest median family size with 2.48 persons per family.
| Family Type | # Families | Family Size |
| Married-Couple | 1,417 (68.3%) | 2.69 |
| Single Male/Father | 325 (15.7%) | 2.48 |
| Single Female/Mother | 334 (16.1%) | 3.01 |
| Total Families | 2,076 (100.0%) | 2.71 |
Median Household Size in Fairfield
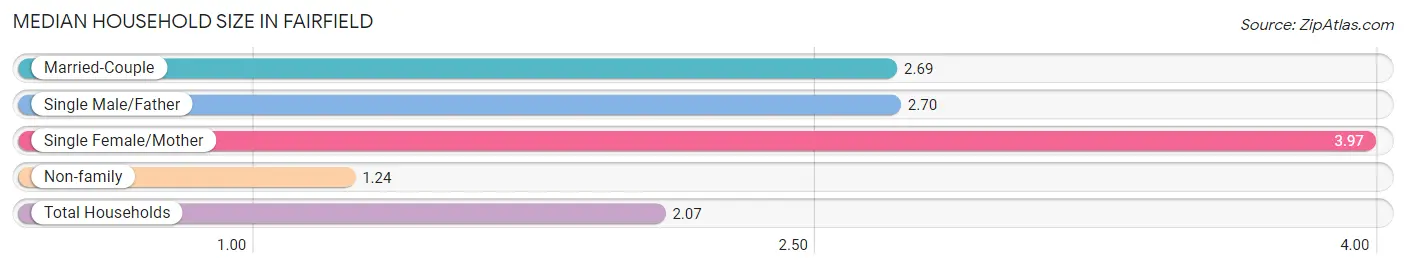
The median household size in Fairfield is 2.07 persons per household, with single female/mother households (334 | 8.1%) accounting for the largest median household size of 3.97 persons per household. non-family households (2,063 | 49.8%) represent the smallest median household size with 1.24 persons per household.
| Household Type | # Households | Household Size |
| Married-Couple | 1,417 (34.2%) | 2.69 |
| Single Male/Father | 325 (7.9%) | 2.70 |
| Single Female/Mother | 334 (8.1%) | 3.97 |
| Non-family | 2,063 (49.8%) | 1.24 |
| Total Households | 4,139 (100.0%) | 2.07 |
Household Size by Marriage Status in Fairfield
Out of a total of 4,139 households in Fairfield, 2,076 (50.2%) are family households, while 2,063 (49.8%) are nonfamily households. The most numerous type of family households are 2-person households, comprising 1,109, and the most common type of nonfamily households are 1-person households, comprising 1,788.
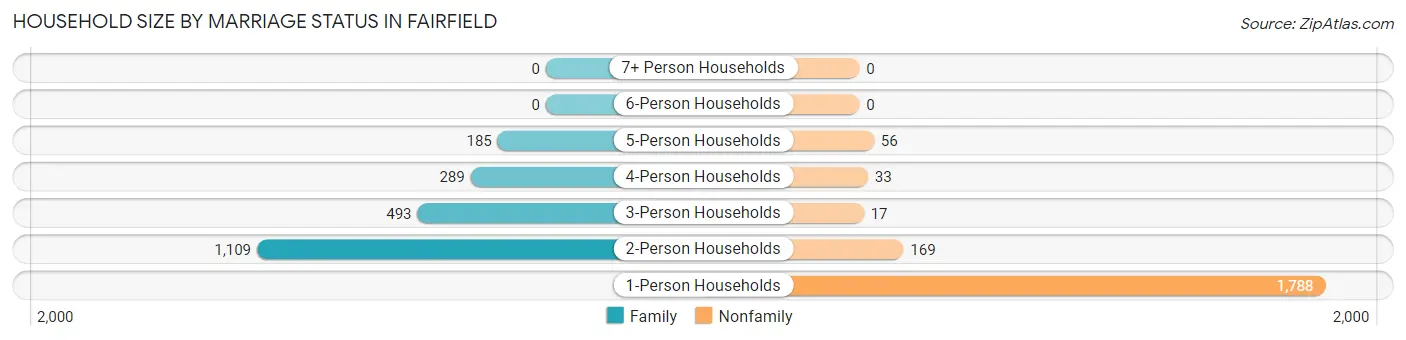
| Household Size | Family Households | Nonfamily Households |
| 1-Person Households | - | 1,788 (43.2%) |
| 2-Person Households | 1,109 (26.8%) | 169 (4.1%) |
| 3-Person Households | 493 (11.9%) | 17 (0.4%) |
| 4-Person Households | 289 (7.0%) | 33 (0.8%) |
| 5-Person Households | 185 (4.5%) | 56 (1.3%) |
| 6-Person Households | 0 (0.0%) | 0 (0.0%) |
| 7+ Person Households | 0 (0.0%) | 0 (0.0%) |
| Total | 2,076 (50.2%) | 2,063 (49.8%) |
Female Fertility in Fairfield
Fertility by Age in Fairfield
Average fertility rate in Fairfield is 61.0 births per 1,000 women. Women in the age bracket of 15 to 19 years have the highest fertility rate with 184.0 births per 1,000 women. Women in the age bracket of 15 to 19 years acount for 40.4% of all women with births.
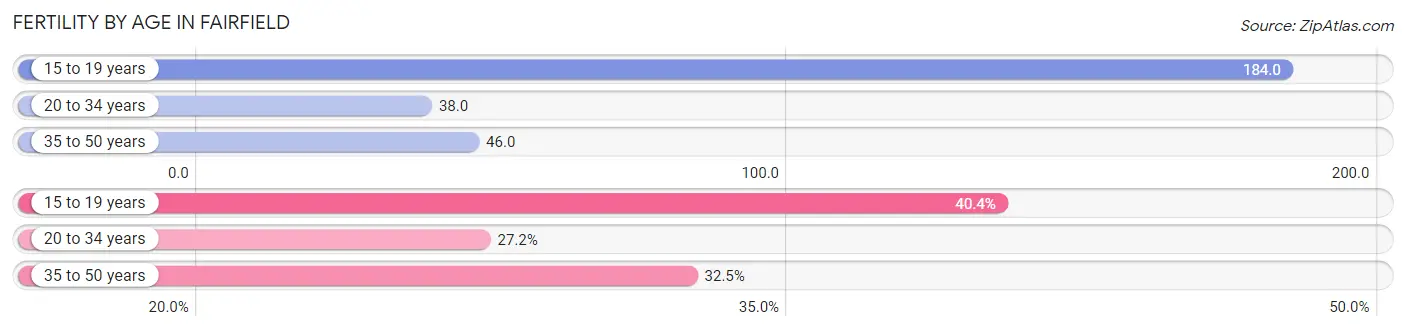
| Age Bracket | Women with Births | Births / 1,000 Women |
| 15 to 19 years | 46 (40.4%) | 184.0 |
| 20 to 34 years | 31 (27.2%) | 38.0 |
| 35 to 50 years | 37 (32.5%) | 46.0 |
| Total | 114 (100.0%) | 61.0 |
Fertility by Age by Marriage Status in Fairfield
27.2% of women with births (114) in Fairfield are married. The highest percentage of unmarried women with births falls into 15 to 19 years age bracket with 100.0% of them unmarried at the time of birth, while the lowest percentage of unmarried women with births belong to 20 to 34 years age bracket with 0.0% of them unmarried.
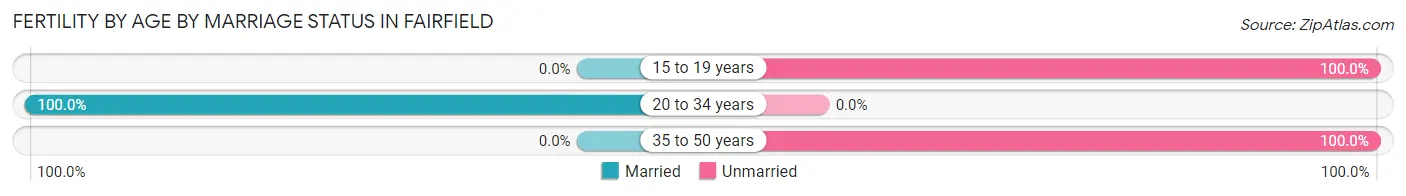
| Age Bracket | Married | Unmarried |
| 15 to 19 years | 0 (0.0%) | 46 (100.0%) |
| 20 to 34 years | 31 (100.0%) | 0 (0.0%) |
| 35 to 50 years | 0 (0.0%) | 37 (100.0%) |
| Total | 31 (27.2%) | 83 (72.8%) |
Fertility by Education in Fairfield
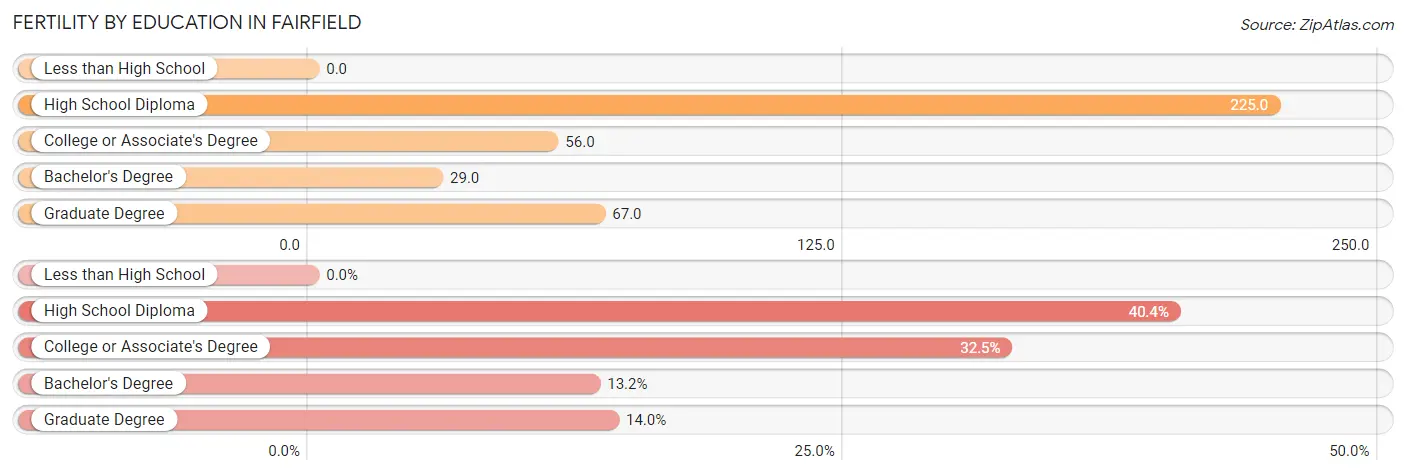
| Educational Attainment | Women with Births | Births / 1,000 Women |
| Less than High School | 0 (0.0%) | 0.0 |
| High School Diploma | 46 (40.4%) | 225.0 |
| College or Associate's Degree | 37 (32.5%) | 56.0 |
| Bachelor's Degree | 15 (13.2%) | 29.0 |
| Graduate Degree | 16 (14.0%) | 67.0 |
| Total | 114 (100.0%) | 61.0 |
Fertility by Education by Marriage Status in Fairfield
72.8% of women with births in Fairfield are unmarried. Women with the educational attainment of bachelor's degree are most likely to be married with 100.0% of them married at childbirth, while women with the educational attainment of high school diploma are least likely to be married with 100.0% of them unmarried at childbirth.
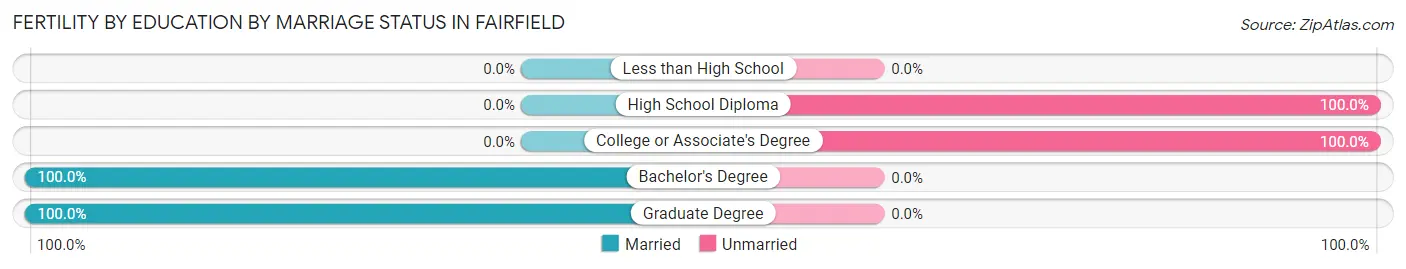
| Educational Attainment | Married | Unmarried |
| Less than High School | 0 (0.0%) | 0 (0.0%) |
| High School Diploma | 0 (0.0%) | 46 (100.0%) |
| College or Associate's Degree | 0 (0.0%) | 37 (100.0%) |
| Bachelor's Degree | 15 (100.0%) | 0 (0.0%) |
| Graduate Degree | 16 (100.0%) | 0 (0.0%) |
| Total | 31 (27.2%) | 83 (72.8%) |
Employment Characteristics in Fairfield
Employment by Class of Employer in Fairfield
Among the 4,342 employed individuals in Fairfield, private company employees (2,526 | 58.2%), not-for-profit organizations (656 | 15.1%), and self-employed (incorporated) (433 | 10.0%) make up the most common classes of employment.
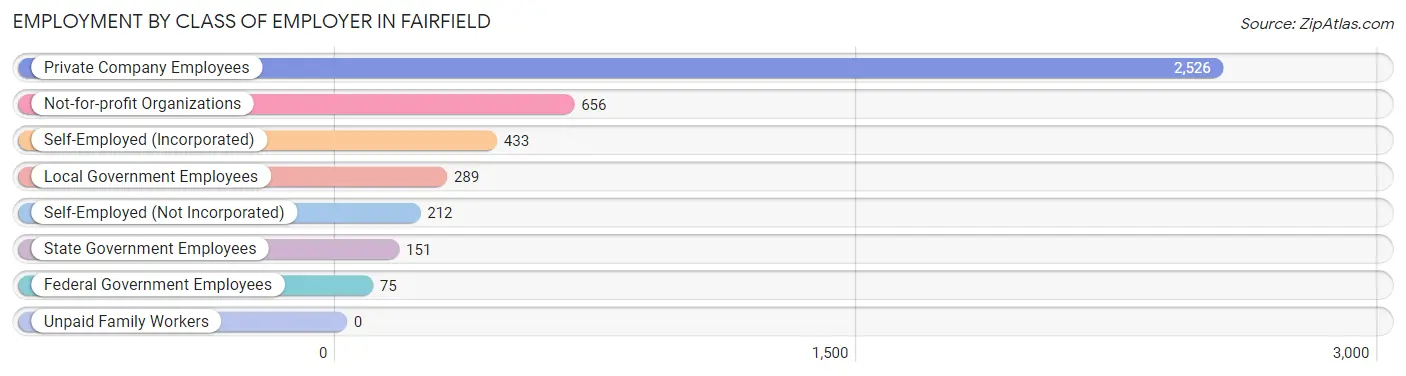
| Employer Class | # Employees | % Employees |
| Private Company Employees | 2,526 | 58.2% |
| Self-Employed (Incorporated) | 433 | 10.0% |
| Self-Employed (Not Incorporated) | 212 | 4.9% |
| Not-for-profit Organizations | 656 | 15.1% |
| Local Government Employees | 289 | 6.7% |
| State Government Employees | 151 | 3.5% |
| Federal Government Employees | 75 | 1.7% |
| Unpaid Family Workers | 0 | 0.0% |
| Total | 4,342 | 100.0% |
Employment Status by Age in Fairfield
According to the labor force statistics for Fairfield, out of the total population over 16 years of age (8,114), 58.2% or 4,722 individuals are in the labor force, with 6.5% or 307 of them unemployed. The age group with the highest labor force participation rate is 55 to 59 years, with 78.1% or 346 individuals in the labor force. Within the labor force, the 65 to 74 years age range has the highest percentage of unemployed individuals, with 18.6% or 106 of them being unemployed.
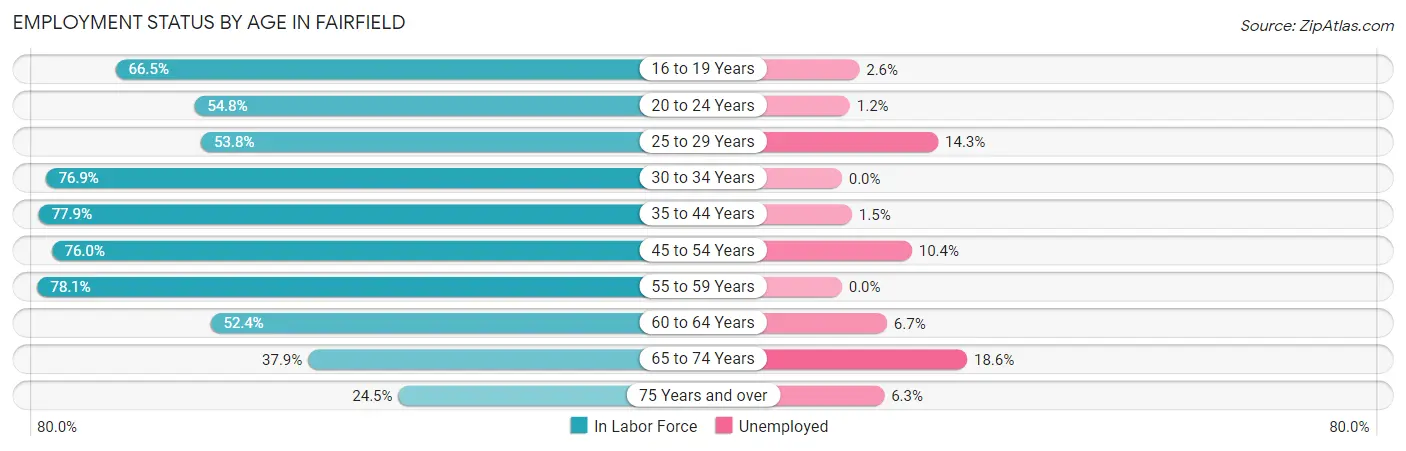
| Age Bracket | In Labor Force | Unemployed |
| 16 to 19 Years | 153 (66.5%) | 4 (2.6%) |
| 20 to 24 Years | 345 (54.8%) | 4 (1.2%) |
| 25 to 29 Years | 412 (53.8%) | 59 (14.3%) |
| 30 to 34 Years | 584 (76.9%) | 0 (0.0%) |
| 35 to 44 Years | 971 (77.9%) | 15 (1.5%) |
| 45 to 54 Years | 854 (76.0%) | 89 (10.4%) |
| 55 to 59 Years | 346 (78.1%) | 0 (0.0%) |
| 60 to 64 Years | 267 (52.4%) | 18 (6.7%) |
| 65 to 74 Years | 569 (37.9%) | 106 (18.6%) |
| 75 Years and over | 222 (24.5%) | 14 (6.3%) |
| Total | 4,722 (58.2%) | 307 (6.5%) |
Employment Status by Educational Attainment in Fairfield
According to labor force statistics for Fairfield, 70.8% of individuals (3,433) out of the total population between 25 and 64 years of age (4,849) are in the labor force, with 5.3% or 182 of them being unemployed. The group with the highest labor force participation rate are those with the educational attainment of college / associate degree, with 77.7% or 1,136 individuals in the labor force. Within the labor force, individuals with high school diploma education have the highest percentage of unemployment, with 8.8% or 63 of them being unemployed.
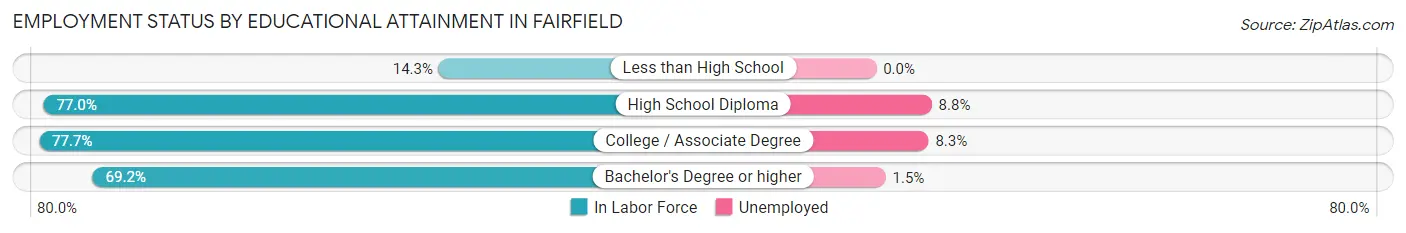
| Educational Attainment | In Labor Force | Unemployed |
| Less than High School | 31 (14.3%) | 0 (0.0%) |
| High School Diploma | 717 (77.0%) | 82 (8.8%) |
| College / Associate Degree | 1,136 (77.7%) | 121 (8.3%) |
| Bachelor's Degree or higher | 1,549 (69.2%) | 34 (1.5%) |
| Total | 3,433 (70.8%) | 257 (5.3%) |
Employment Occupations by Sex in Fairfield
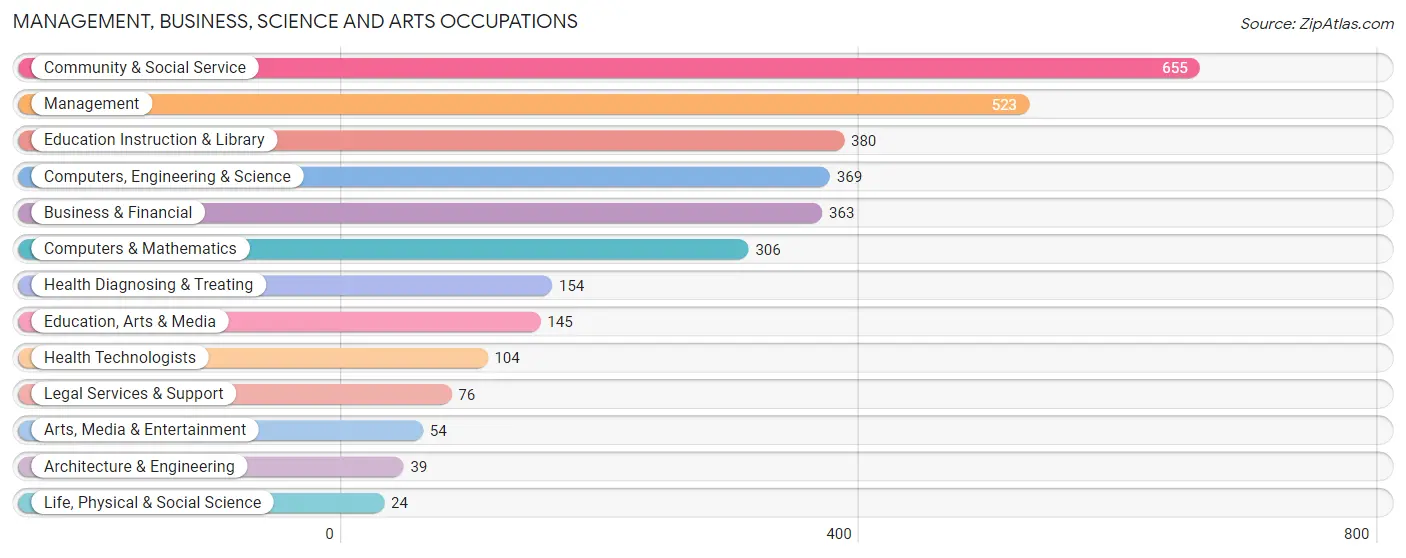
Management, Business, Science and Arts Occupations
The most common Management, Business, Science and Arts occupations in Fairfield are Community & Social Service (655 | 14.8%), Management (523 | 11.8%), Education Instruction & Library (380 | 8.6%), Computers, Engineering & Science (369 | 8.4%), and Business & Financial (363 | 8.2%).
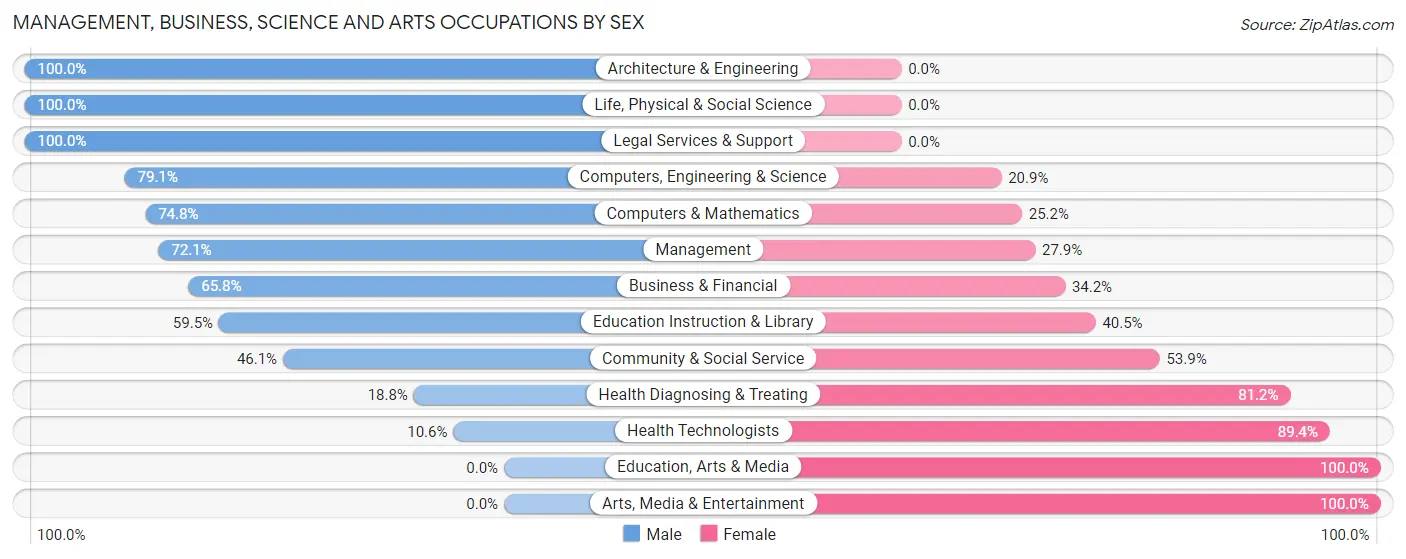
Management, Business, Science and Arts Occupations by Sex
Within the Management, Business, Science and Arts occupations in Fairfield, the most male-oriented occupations are Architecture & Engineering (100.0%), Life, Physical & Social Science (100.0%), and Legal Services & Support (100.0%), while the most female-oriented occupations are Education, Arts & Media (100.0%), Arts, Media & Entertainment (100.0%), and Health Technologists (89.4%).
| Occupation | Male | Female |
| Management | 377 (72.1%) | 146 (27.9%) |
| Business & Financial | 239 (65.8%) | 124 (34.2%) |
| Computers, Engineering & Science | 292 (79.1%) | 77 (20.9%) |
| Computers & Mathematics | 229 (74.8%) | 77 (25.2%) |
| Architecture & Engineering | 39 (100.0%) | 0 (0.0%) |
| Life, Physical & Social Science | 24 (100.0%) | 0 (0.0%) |
| Community & Social Service | 302 (46.1%) | 353 (53.9%) |
| Education, Arts & Media | 0 (0.0%) | 145 (100.0%) |
| Legal Services & Support | 76 (100.0%) | 0 (0.0%) |
| Education Instruction & Library | 226 (59.5%) | 154 (40.5%) |
| Arts, Media & Entertainment | 0 (0.0%) | 54 (100.0%) |
| Health Diagnosing & Treating | 29 (18.8%) | 125 (81.2%) |
| Health Technologists | 11 (10.6%) | 93 (89.4%) |
| Total (Category) | 1,239 (60.0%) | 825 (40.0%) |
| Total (Overall) | 2,462 (55.8%) | 1,952 (44.2%) |
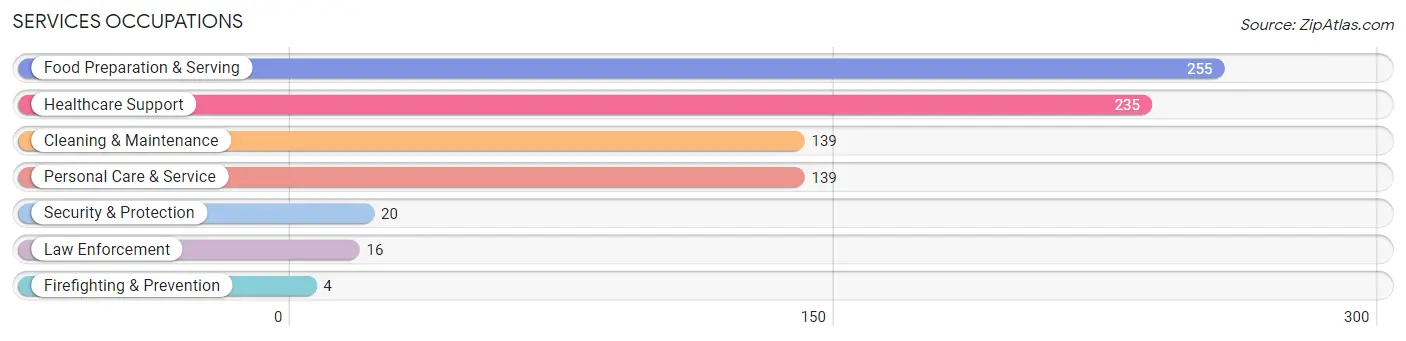
Services Occupations
The most common Services occupations in Fairfield are Food Preparation & Serving (255 | 5.8%), Healthcare Support (235 | 5.3%), Cleaning & Maintenance (139 | 3.2%), Personal Care & Service (139 | 3.2%), and Security & Protection (20 | 0.4%).
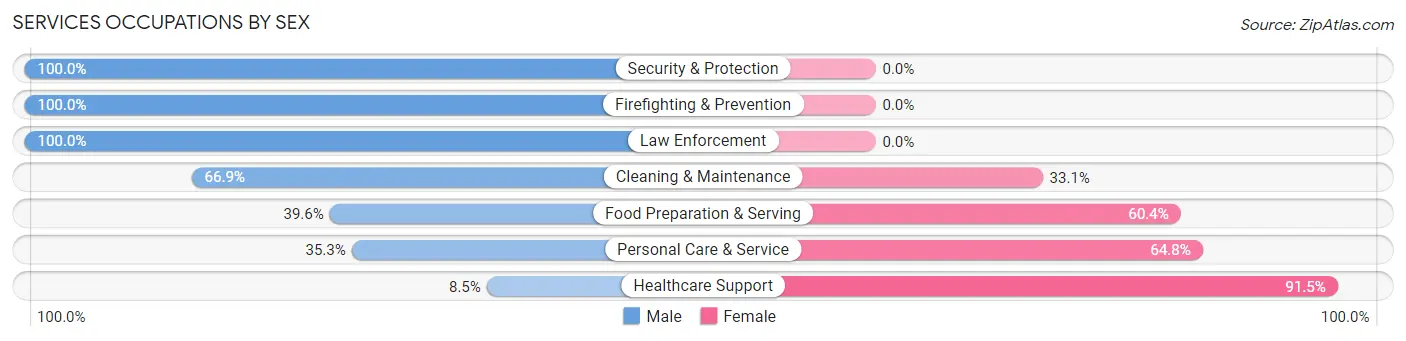
Services Occupations by Sex
Within the Services occupations in Fairfield, the most male-oriented occupations are Security & Protection (100.0%), Firefighting & Prevention (100.0%), and Law Enforcement (100.0%), while the most female-oriented occupations are Healthcare Support (91.5%), Personal Care & Service (64.7%), and Food Preparation & Serving (60.4%).
| Occupation | Male | Female |
| Healthcare Support | 20 (8.5%) | 215 (91.5%) |
| Security & Protection | 20 (100.0%) | 0 (0.0%) |
| Firefighting & Prevention | 4 (100.0%) | 0 (0.0%) |
| Law Enforcement | 16 (100.0%) | 0 (0.0%) |
| Food Preparation & Serving | 101 (39.6%) | 154 (60.4%) |
| Cleaning & Maintenance | 93 (66.9%) | 46 (33.1%) |
| Personal Care & Service | 49 (35.2%) | 90 (64.7%) |
| Total (Category) | 283 (35.9%) | 505 (64.1%) |
| Total (Overall) | 2,462 (55.8%) | 1,952 (44.2%) |
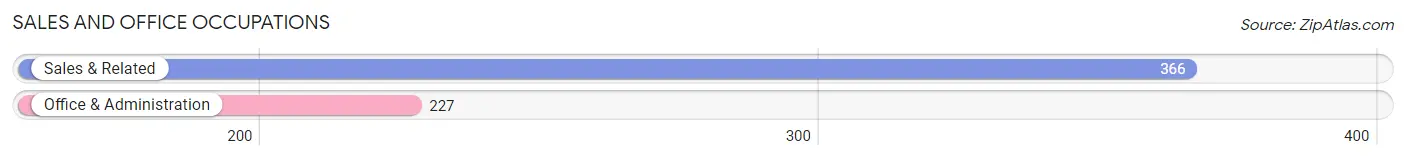
Sales and Office Occupations
The most common Sales and Office occupations in Fairfield are Sales & Related (366 | 8.3%), and Office & Administration (227 | 5.1%).
Sales and Office Occupations by Sex
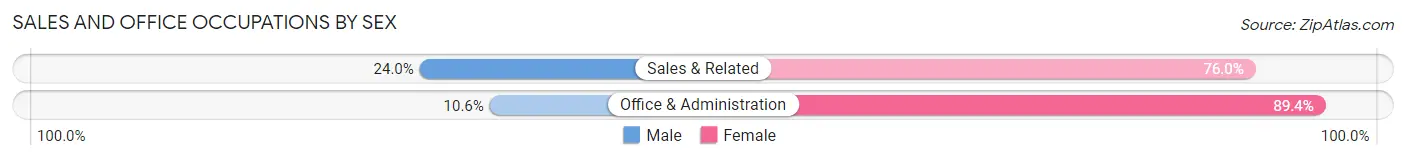
| Occupation | Male | Female |
| Sales & Related | 88 (24.0%) | 278 (76.0%) |
| Office & Administration | 24 (10.6%) | 203 (89.4%) |
| Total (Category) | 112 (18.9%) | 481 (81.1%) |
| Total (Overall) | 2,462 (55.8%) | 1,952 (44.2%) |
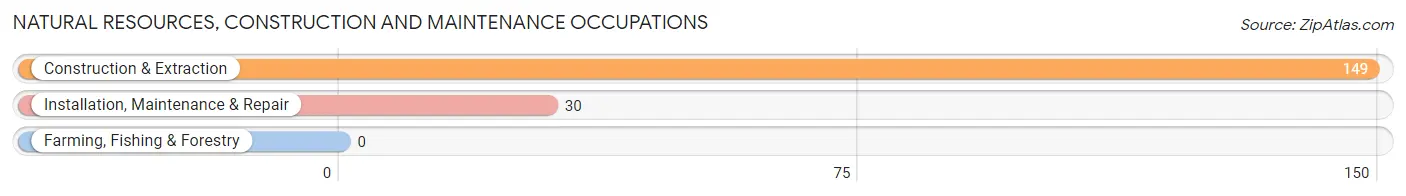
Natural Resources, Construction and Maintenance Occupations
The most common Natural Resources, Construction and Maintenance occupations in Fairfield are Construction & Extraction (149 | 3.4%), and Installation, Maintenance & Repair (30 | 0.7%).
Natural Resources, Construction and Maintenance Occupations by Sex
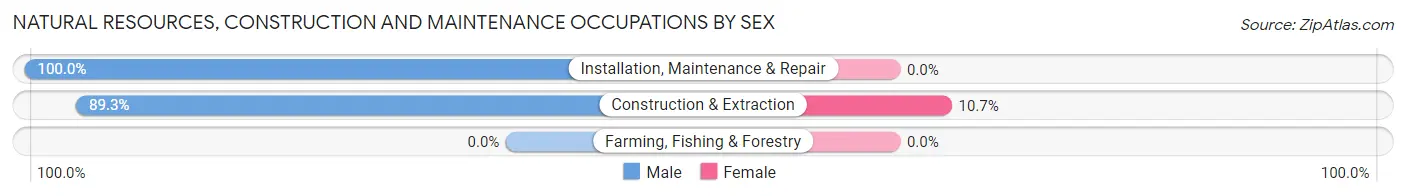
| Occupation | Male | Female |
| Farming, Fishing & Forestry | 0 (0.0%) | 0 (0.0%) |
| Construction & Extraction | 133 (89.3%) | 16 (10.7%) |
| Installation, Maintenance & Repair | 30 (100.0%) | 0 (0.0%) |
| Total (Category) | 163 (91.1%) | 16 (8.9%) |
| Total (Overall) | 2,462 (55.8%) | 1,952 (44.2%) |
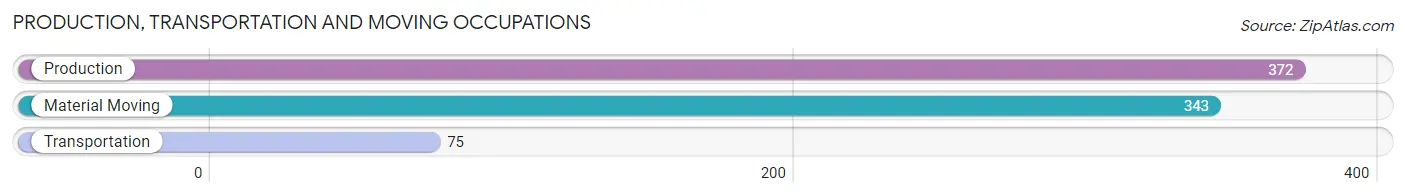
Production, Transportation and Moving Occupations
The most common Production, Transportation and Moving occupations in Fairfield are Production (372 | 8.4%), Material Moving (343 | 7.8%), and Transportation (75 | 1.7%).
Production, Transportation and Moving Occupations by Sex
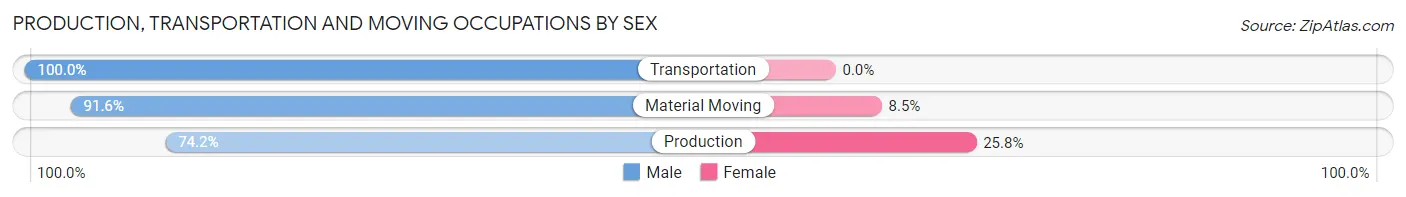
| Occupation | Male | Female |
| Production | 276 (74.2%) | 96 (25.8%) |
| Transportation | 75 (100.0%) | 0 (0.0%) |
| Material Moving | 314 (91.5%) | 29 (8.5%) |
| Total (Category) | 665 (84.2%) | 125 (15.8%) |
| Total (Overall) | 2,462 (55.8%) | 1,952 (44.2%) |
Employment Industries by Sex in Fairfield
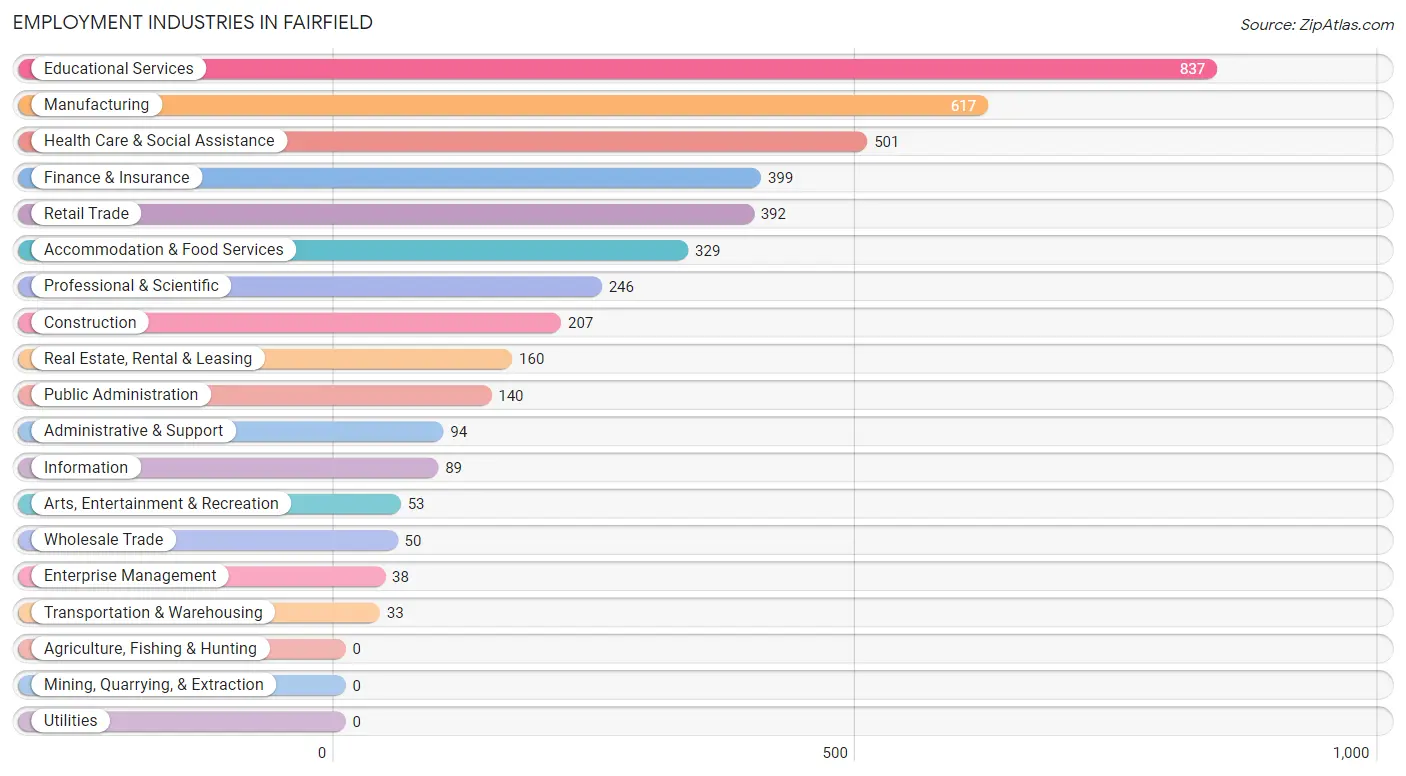
Employment Industries in Fairfield
The major employment industries in Fairfield include Educational Services (837 | 19.0%), Manufacturing (617 | 14.0%), Health Care & Social Assistance (501 | 11.4%), Finance & Insurance (399 | 9.0%), and Retail Trade (392 | 8.9%).
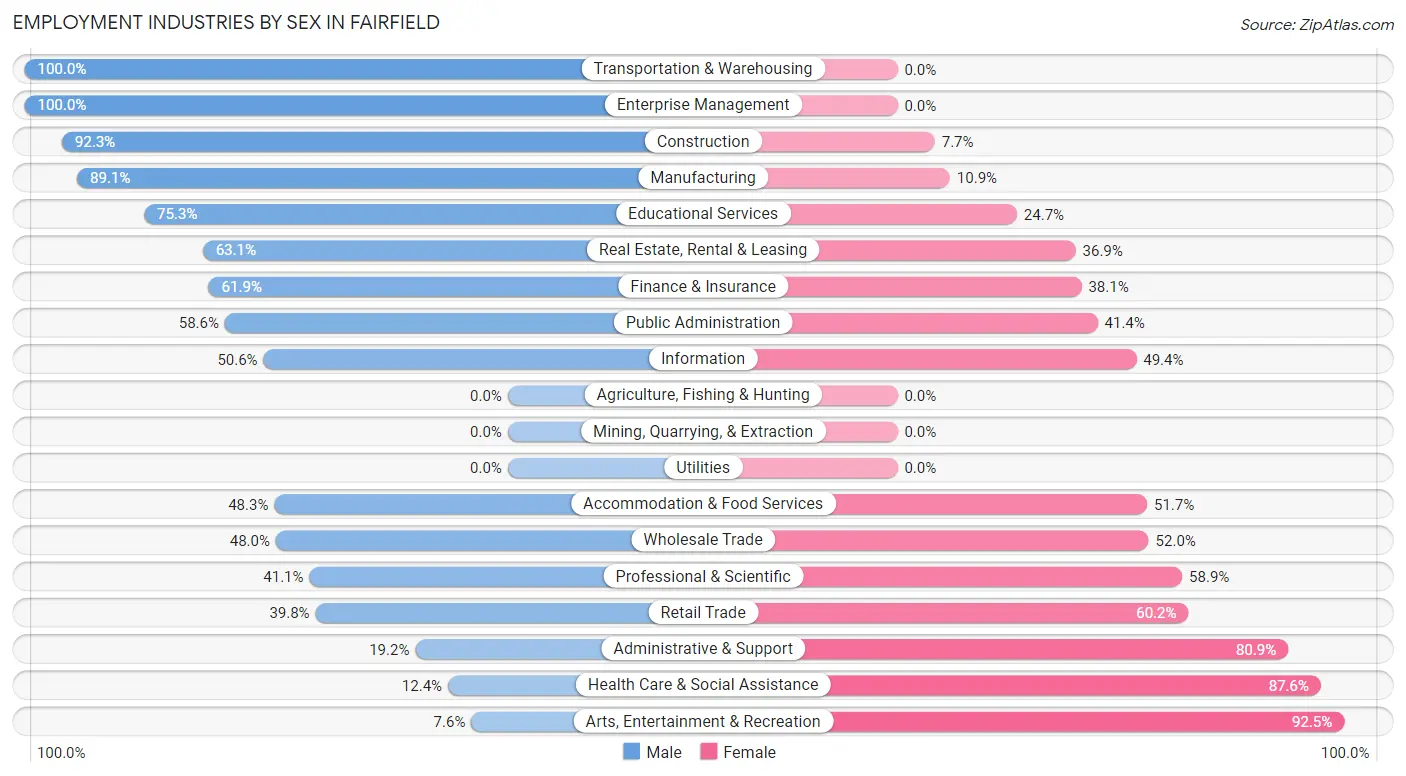
Employment Industries by Sex in Fairfield
The Fairfield industries that see more men than women are Transportation & Warehousing (100.0%), Enterprise Management (100.0%), and Construction (92.3%), whereas the industries that tend to have a higher number of women are Arts, Entertainment & Recreation (92.4%), Health Care & Social Assistance (87.6%), and Administrative & Support (80.8%).
| Industry | Male | Female |
| Agriculture, Fishing & Hunting | 0 (0.0%) | 0 (0.0%) |
| Mining, Quarrying, & Extraction | 0 (0.0%) | 0 (0.0%) |
| Construction | 191 (92.3%) | 16 (7.7%) |
| Manufacturing | 550 (89.1%) | 67 (10.9%) |
| Wholesale Trade | 24 (48.0%) | 26 (52.0%) |
| Retail Trade | 156 (39.8%) | 236 (60.2%) |
| Transportation & Warehousing | 33 (100.0%) | 0 (0.0%) |
| Utilities | 0 (0.0%) | 0 (0.0%) |
| Information | 45 (50.6%) | 44 (49.4%) |
| Finance & Insurance | 247 (61.9%) | 152 (38.1%) |
| Real Estate, Rental & Leasing | 101 (63.1%) | 59 (36.9%) |
| Professional & Scientific | 101 (41.1%) | 145 (58.9%) |
| Enterprise Management | 38 (100.0%) | 0 (0.0%) |
| Administrative & Support | 18 (19.2%) | 76 (80.8%) |
| Educational Services | 630 (75.3%) | 207 (24.7%) |
| Health Care & Social Assistance | 62 (12.4%) | 439 (87.6%) |
| Arts, Entertainment & Recreation | 4 (7.5%) | 49 (92.4%) |
| Accommodation & Food Services | 159 (48.3%) | 170 (51.7%) |
| Public Administration | 82 (58.6%) | 58 (41.4%) |
| Total | 2,462 (55.8%) | 1,952 (44.2%) |
Education in Fairfield
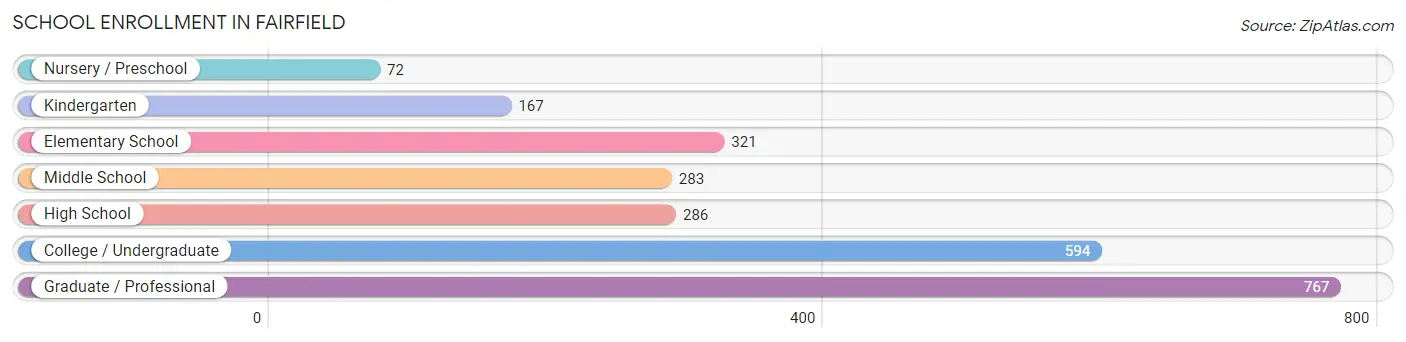
School Enrollment in Fairfield
The most common levels of schooling among the 2,490 students in Fairfield are graduate / professional (767 | 30.8%), college / undergraduate (594 | 23.9%), and elementary school (321 | 12.9%).
| School Level | # Students | % Students |
| Nursery / Preschool | 72 | 2.9% |
| Kindergarten | 167 | 6.7% |
| Elementary School | 321 | 12.9% |
| Middle School | 283 | 11.4% |
| High School | 286 | 11.5% |
| College / Undergraduate | 594 | 23.9% |
| Graduate / Professional | 767 | 30.8% |
| Total | 2,490 | 100.0% |
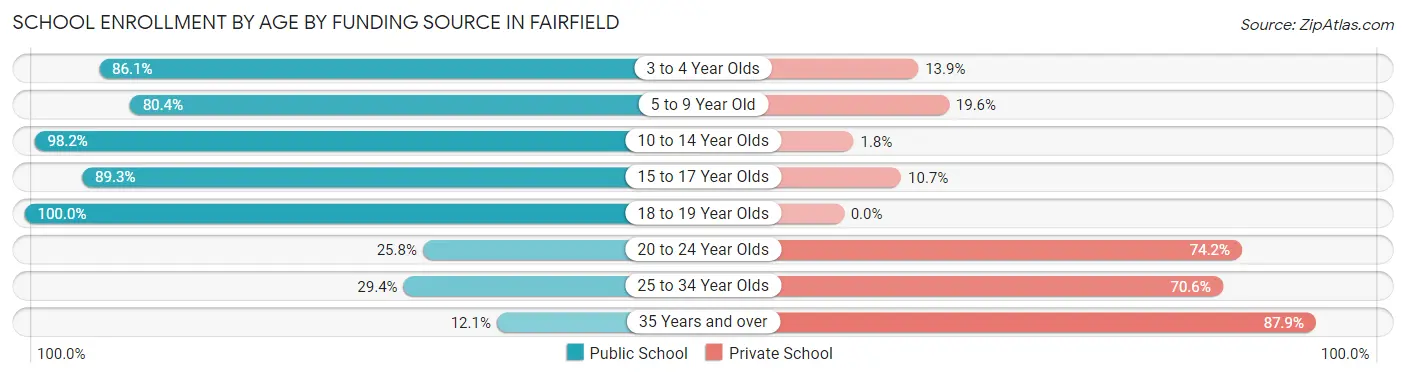
School Enrollment by Age by Funding Source in Fairfield
Out of a total of 2,490 students who are enrolled in schools in Fairfield, 1,123 (45.1%) attend a private institution, while the remaining 1,367 (54.9%) are enrolled in public schools. The age group of 35 years and over has the highest likelihood of being enrolled in private schools, with 379 (87.9% in the age bracket) enrolled. Conversely, the age group of 18 to 19 year olds has the lowest likelihood of being enrolled in a private school, with 72 (100.0% in the age bracket) attending a public institution.
| Age Bracket | Public School | Private School |
| 3 to 4 Year Olds | 62 (86.1%) | 10 (13.9%) |
| 5 to 9 Year Old | 349 (80.4%) | 85 (19.6%) |
| 10 to 14 Year Olds | 373 (98.2%) | 7 (1.8%) |
| 15 to 17 Year Olds | 217 (89.3%) | 26 (10.7%) |
| 18 to 19 Year Olds | 72 (100.0%) | 0 (0.0%) |
| 20 to 24 Year Olds | 69 (25.8%) | 198 (74.2%) |
| 25 to 34 Year Olds | 174 (29.4%) | 417 (70.6%) |
| 35 Years and over | 52 (12.1%) | 379 (87.9%) |
| Total | 1,367 (54.9%) | 1,123 (45.1%) |
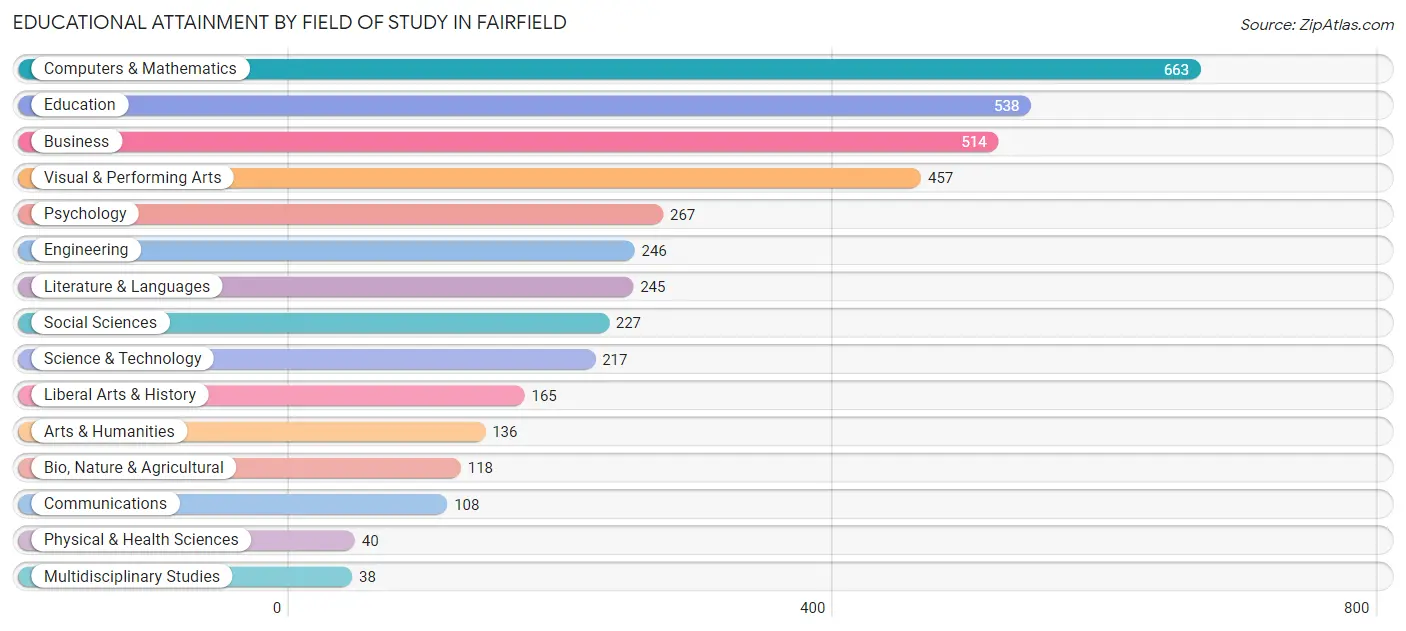
Educational Attainment by Field of Study in Fairfield
Computers & mathematics (663 | 16.7%), education (538 | 13.5%), business (514 | 12.9%), visual & performing arts (457 | 11.5%), and psychology (267 | 6.7%) are the most common fields of study among 3,979 individuals in Fairfield who have obtained a bachelor's degree or higher.
| Field of Study | # Graduates | % Graduates |
| Computers & Mathematics | 663 | 16.7% |
| Bio, Nature & Agricultural | 118 | 3.0% |
| Physical & Health Sciences | 40 | 1.0% |
| Psychology | 267 | 6.7% |
| Social Sciences | 227 | 5.7% |
| Engineering | 246 | 6.2% |
| Multidisciplinary Studies | 38 | 1.0% |
| Science & Technology | 217 | 5.4% |
| Business | 514 | 12.9% |
| Education | 538 | 13.5% |
| Literature & Languages | 245 | 6.2% |
| Liberal Arts & History | 165 | 4.2% |
| Visual & Performing Arts | 457 | 11.5% |
| Communications | 108 | 2.7% |
| Arts & Humanities | 136 | 3.4% |
| Total | 3,979 | 100.0% |
Transportation & Commute in Fairfield
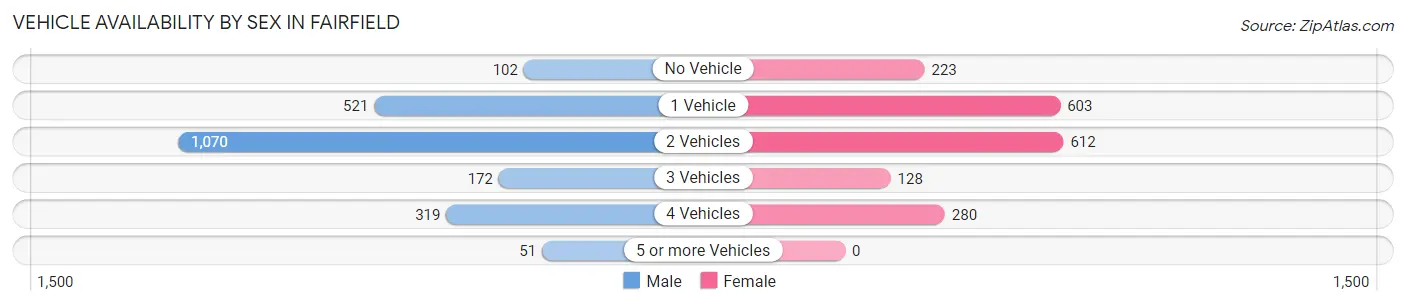
Vehicle Availability by Sex in Fairfield
The most prevalent vehicle ownership categories in Fairfield are males with 2 vehicles (1,070, accounting for 47.9%) and females with 2 vehicles (612, making up 58.0%).
| Vehicles Available | Male | Female |
| No Vehicle | 102 (4.6%) | 223 (12.1%) |
| 1 Vehicle | 521 (23.3%) | 603 (32.7%) |
| 2 Vehicles | 1,070 (47.9%) | 612 (33.2%) |
| 3 Vehicles | 172 (7.7%) | 128 (6.9%) |
| 4 Vehicles | 319 (14.3%) | 280 (15.2%) |
| 5 or more Vehicles | 51 (2.3%) | 0 (0.0%) |
| Total | 2,235 (100.0%) | 1,846 (100.0%) |
Commute Time in Fairfield
The most frequently occuring commute durations in Fairfield are 10 to 14 minutes (1,196 commuters, 34.7%), 5 to 9 minutes (1,071 commuters, 31.0%), and 15 to 19 minutes (401 commuters, 11.6%).
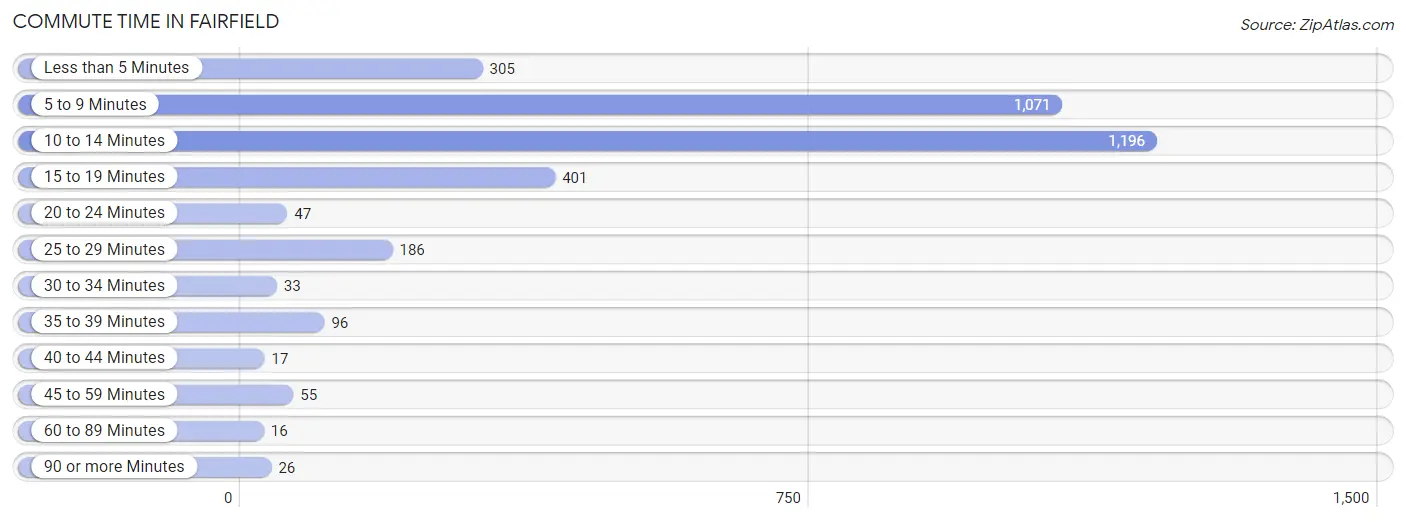
| Commute Time | # Commuters | % Commuters |
| Less than 5 Minutes | 305 | 8.8% |
| 5 to 9 Minutes | 1,071 | 31.0% |
| 10 to 14 Minutes | 1,196 | 34.7% |
| 15 to 19 Minutes | 401 | 11.6% |
| 20 to 24 Minutes | 47 | 1.4% |
| 25 to 29 Minutes | 186 | 5.4% |
| 30 to 34 Minutes | 33 | 1.0% |
| 35 to 39 Minutes | 96 | 2.8% |
| 40 to 44 Minutes | 17 | 0.5% |
| 45 to 59 Minutes | 55 | 1.6% |
| 60 to 89 Minutes | 16 | 0.5% |
| 90 or more Minutes | 26 | 0.7% |
Commute Time by Sex in Fairfield
The most common commute times in Fairfield are 10 to 14 minutes (720 commuters, 36.7%) for males and 10 to 14 minutes (476 commuters, 32.1%) for females.
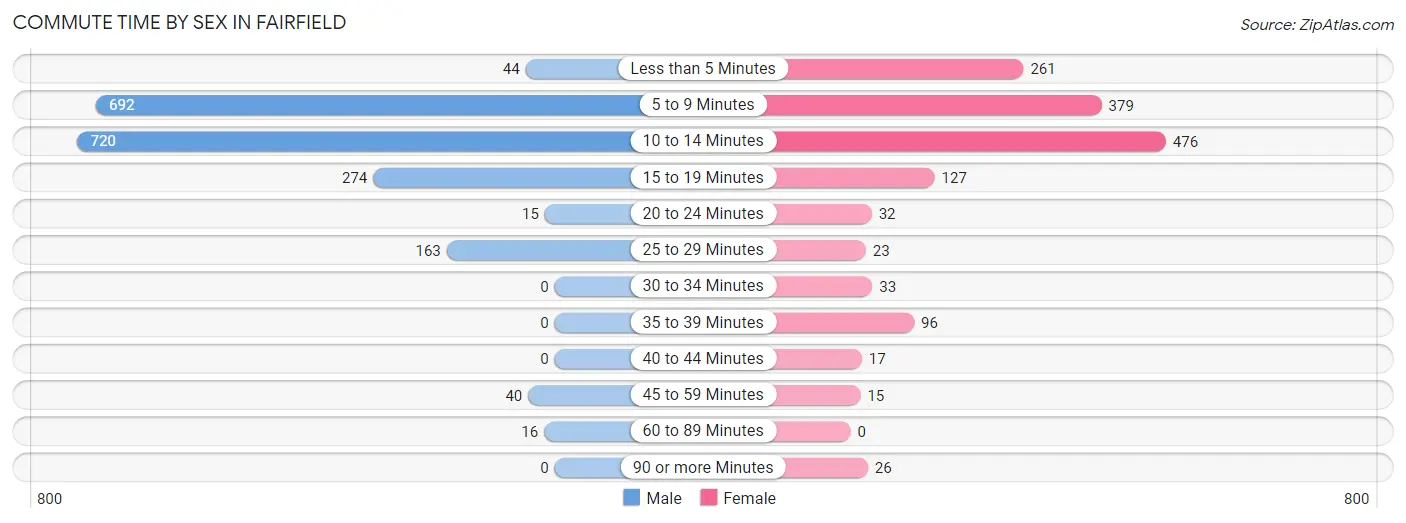
| Commute Time | Male | Female |
| Less than 5 Minutes | 44 (2.2%) | 261 (17.6%) |
| 5 to 9 Minutes | 692 (35.2%) | 379 (25.5%) |
| 10 to 14 Minutes | 720 (36.7%) | 476 (32.1%) |
| 15 to 19 Minutes | 274 (14.0%) | 127 (8.6%) |
| 20 to 24 Minutes | 15 (0.8%) | 32 (2.1%) |
| 25 to 29 Minutes | 163 (8.3%) | 23 (1.5%) |
| 30 to 34 Minutes | 0 (0.0%) | 33 (2.2%) |
| 35 to 39 Minutes | 0 (0.0%) | 96 (6.5%) |
| 40 to 44 Minutes | 0 (0.0%) | 17 (1.1%) |
| 45 to 59 Minutes | 40 (2.0%) | 15 (1.0%) |
| 60 to 89 Minutes | 16 (0.8%) | 0 (0.0%) |
| 90 or more Minutes | 0 (0.0%) | 26 (1.8%) |
Time of Departure to Work by Sex in Fairfield
The most frequent times of departure to work in Fairfield are 7:30 AM to 7:59 AM (517, 26.3%) for males and 12:00 PM to 3:59 PM (303, 20.4%) for females.
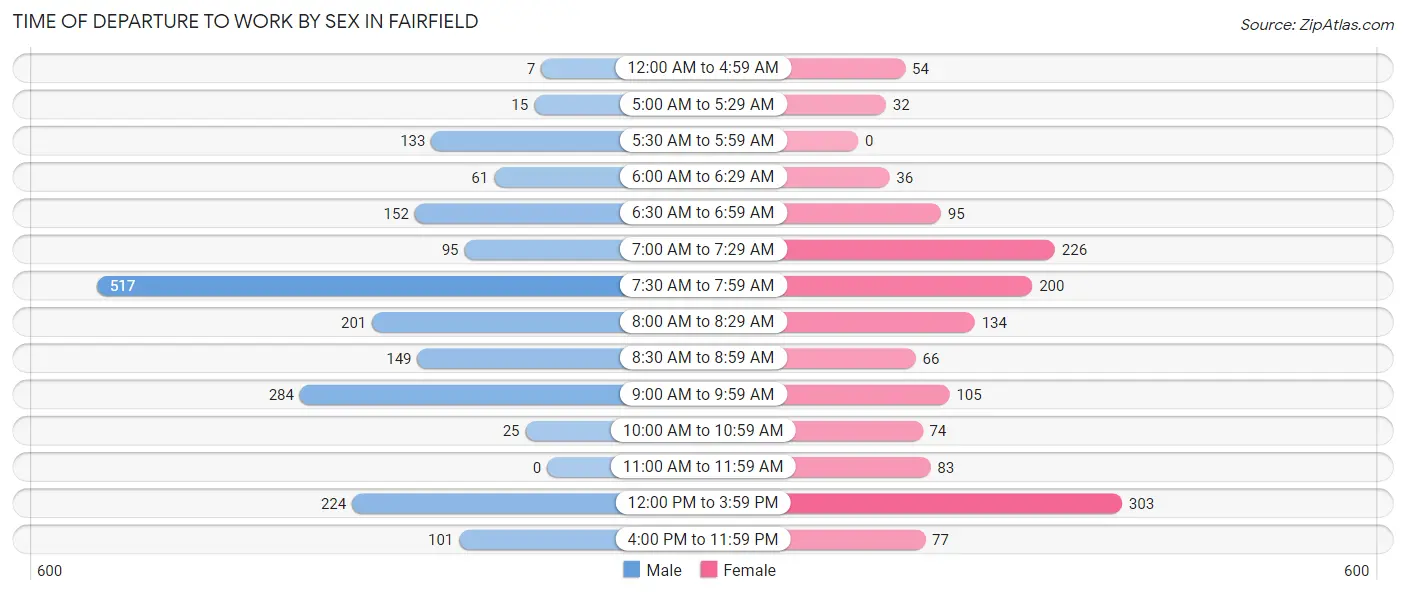
| Time of Departure | Male | Female |
| 12:00 AM to 4:59 AM | 7 (0.4%) | 54 (3.6%) |
| 5:00 AM to 5:29 AM | 15 (0.8%) | 32 (2.1%) |
| 5:30 AM to 5:59 AM | 133 (6.8%) | 0 (0.0%) |
| 6:00 AM to 6:29 AM | 61 (3.1%) | 36 (2.4%) |
| 6:30 AM to 6:59 AM | 152 (7.7%) | 95 (6.4%) |
| 7:00 AM to 7:29 AM | 95 (4.8%) | 226 (15.2%) |
| 7:30 AM to 7:59 AM | 517 (26.3%) | 200 (13.5%) |
| 8:00 AM to 8:29 AM | 201 (10.2%) | 134 (9.0%) |
| 8:30 AM to 8:59 AM | 149 (7.6%) | 66 (4.4%) |
| 9:00 AM to 9:59 AM | 284 (14.5%) | 105 (7.1%) |
| 10:00 AM to 10:59 AM | 25 (1.3%) | 74 (5.0%) |
| 11:00 AM to 11:59 AM | 0 (0.0%) | 83 (5.6%) |
| 12:00 PM to 3:59 PM | 224 (11.4%) | 303 (20.4%) |
| 4:00 PM to 11:59 PM | 101 (5.1%) | 77 (5.2%) |
| Total | 1,964 (100.0%) | 1,485 (100.0%) |
Housing Occupancy in Fairfield
Occupancy by Ownership in Fairfield
Of the total 4,139 dwellings in Fairfield, owner-occupied units account for 2,373 (57.3%), while renter-occupied units make up 1,766 (42.7%).
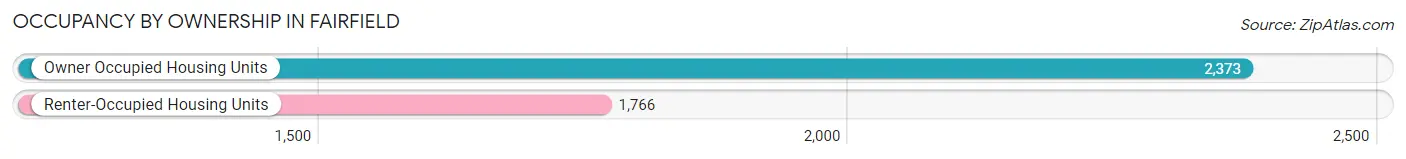
| Occupancy | # Housing Units | % Housing Units |
| Owner Occupied Housing Units | 2,373 | 57.3% |
| Renter-Occupied Housing Units | 1,766 | 42.7% |
| Total Occupied Housing Units | 4,139 | 100.0% |
Occupancy by Household Size in Fairfield
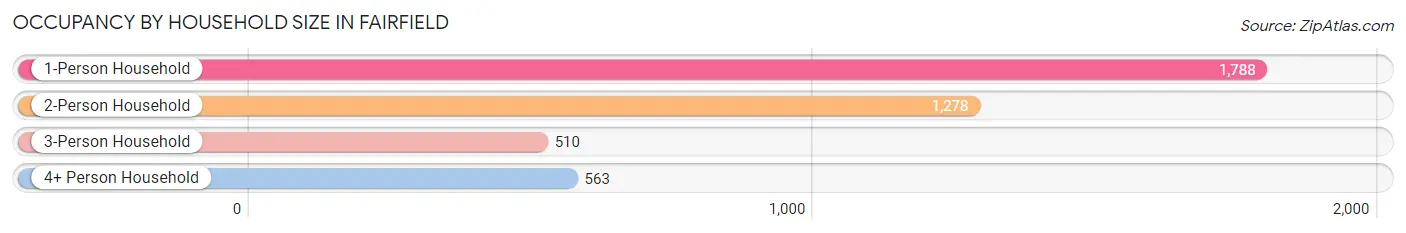
| Household Size | # Housing Units | % Housing Units |
| 1-Person Household | 1,788 | 43.2% |
| 2-Person Household | 1,278 | 30.9% |
| 3-Person Household | 510 | 12.3% |
| 4+ Person Household | 563 | 13.6% |
| Total Housing Units | 4,139 | 100.0% |
Occupancy by Ownership by Household Size in Fairfield
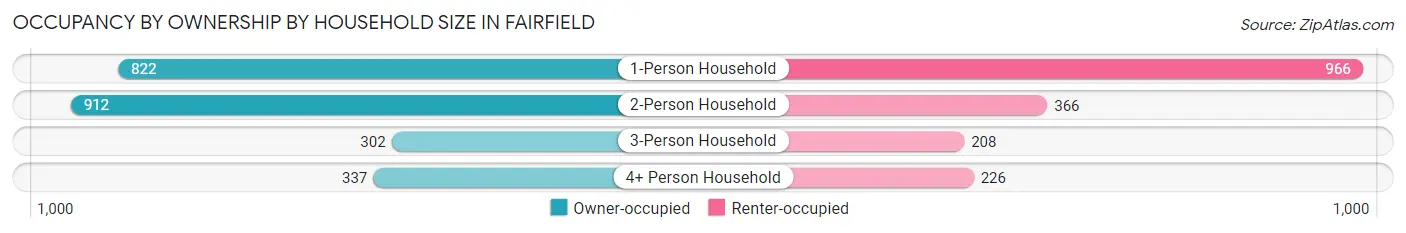
| Household Size | Owner-occupied | Renter-occupied |
| 1-Person Household | 822 (46.0%) | 966 (54.0%) |
| 2-Person Household | 912 (71.4%) | 366 (28.6%) |
| 3-Person Household | 302 (59.2%) | 208 (40.8%) |
| 4+ Person Household | 337 (59.9%) | 226 (40.1%) |
| Total Housing Units | 2,373 (57.3%) | 1,766 (42.7%) |
Occupancy by Educational Attainment in Fairfield
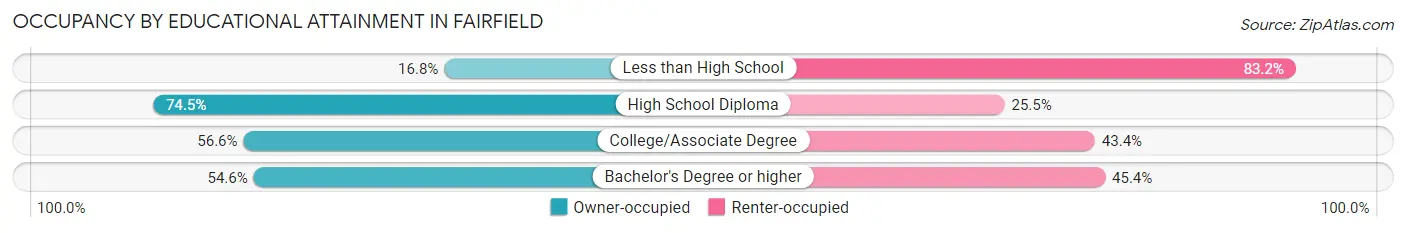
| Household Size | Owner-occupied | Renter-occupied |
| Less than High School | 18 (16.8%) | 89 (83.2%) |
| High School Diploma | 483 (74.5%) | 165 (25.5%) |
| College/Associate Degree | 675 (56.6%) | 517 (43.4%) |
| Bachelor's Degree or higher | 1,197 (54.6%) | 995 (45.4%) |
Occupancy by Age of Householder in Fairfield
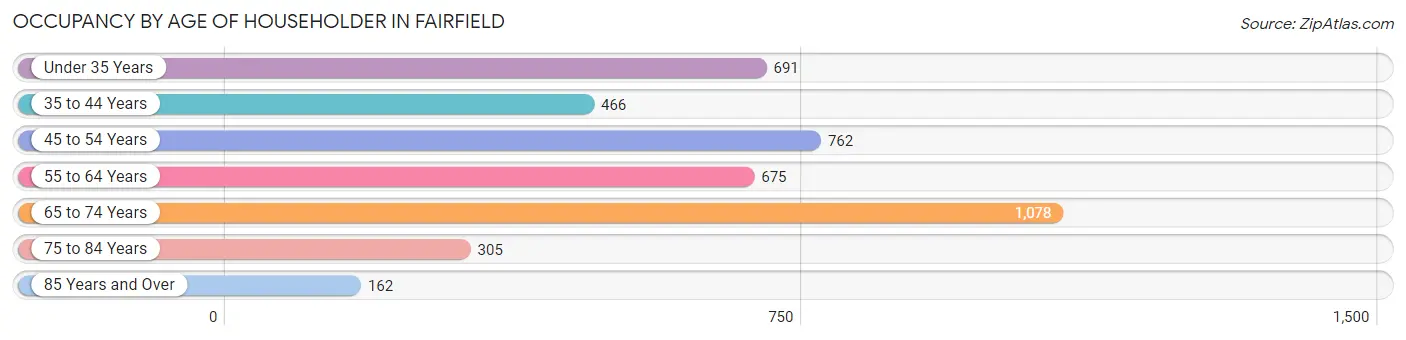
| Age Bracket | # Households | % Households |
| Under 35 Years | 691 | 16.7% |
| 35 to 44 Years | 466 | 11.3% |
| 45 to 54 Years | 762 | 18.4% |
| 55 to 64 Years | 675 | 16.3% |
| 65 to 74 Years | 1,078 | 26.0% |
| 75 to 84 Years | 305 | 7.4% |
| 85 Years and Over | 162 | 3.9% |
| Total | 4,139 | 100.0% |
Housing Finances in Fairfield
Median Income by Occupancy in Fairfield
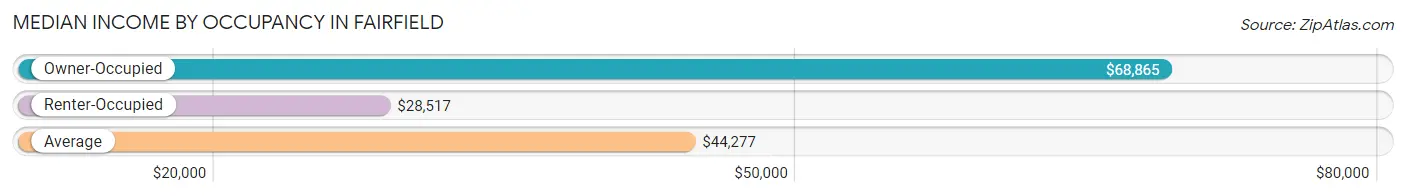
| Occupancy Type | # Households | Median Income |
| Owner-Occupied | 2,373 (57.3%) | $68,865 |
| Renter-Occupied | 1,766 (42.7%) | $28,517 |
| Average | 4,139 (100.0%) | $44,277 |
Occupancy by Householder Income Bracket in Fairfield
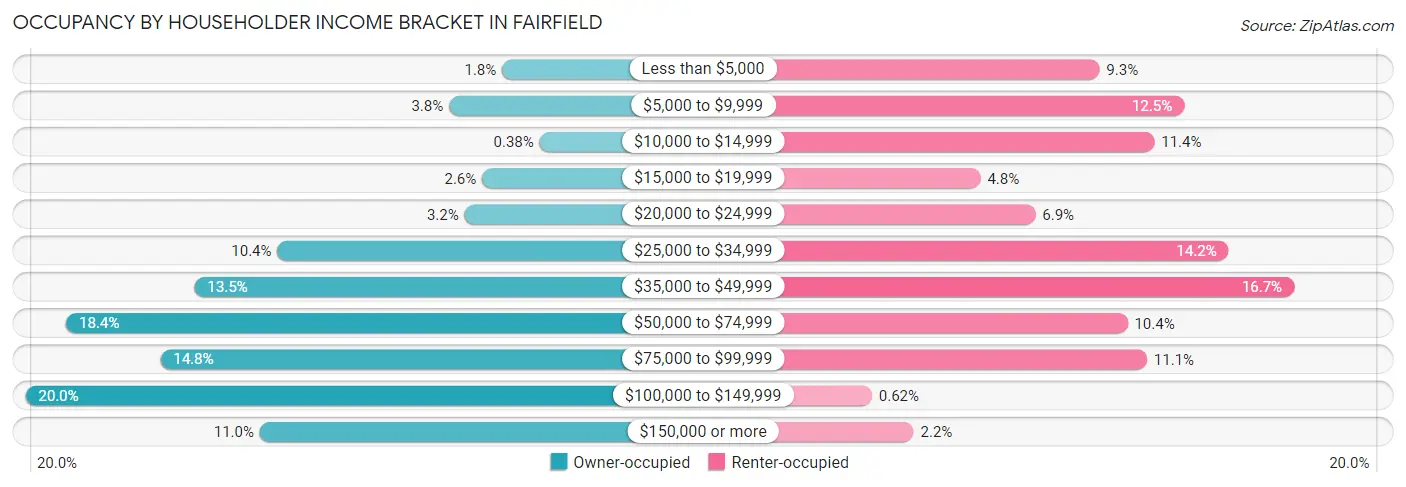
| Income Bracket | Owner-occupied | Renter-occupied |
| Less than $5,000 | 43 (1.8%) | 164 (9.3%) |
| $5,000 to $9,999 | 91 (3.8%) | 221 (12.5%) |
| $10,000 to $14,999 | 9 (0.4%) | 201 (11.4%) |
| $15,000 to $19,999 | 61 (2.6%) | 84 (4.8%) |
| $20,000 to $24,999 | 77 (3.2%) | 121 (6.9%) |
| $25,000 to $34,999 | 246 (10.4%) | 251 (14.2%) |
| $35,000 to $49,999 | 321 (13.5%) | 295 (16.7%) |
| $50,000 to $74,999 | 437 (18.4%) | 183 (10.4%) |
| $75,000 to $99,999 | 352 (14.8%) | 196 (11.1%) |
| $100,000 to $149,999 | 474 (20.0%) | 11 (0.6%) |
| $150,000 or more | 262 (11.0%) | 39 (2.2%) |
| Total | 2,373 (100.0%) | 1,766 (100.0%) |
Monthly Housing Cost Tiers in Fairfield
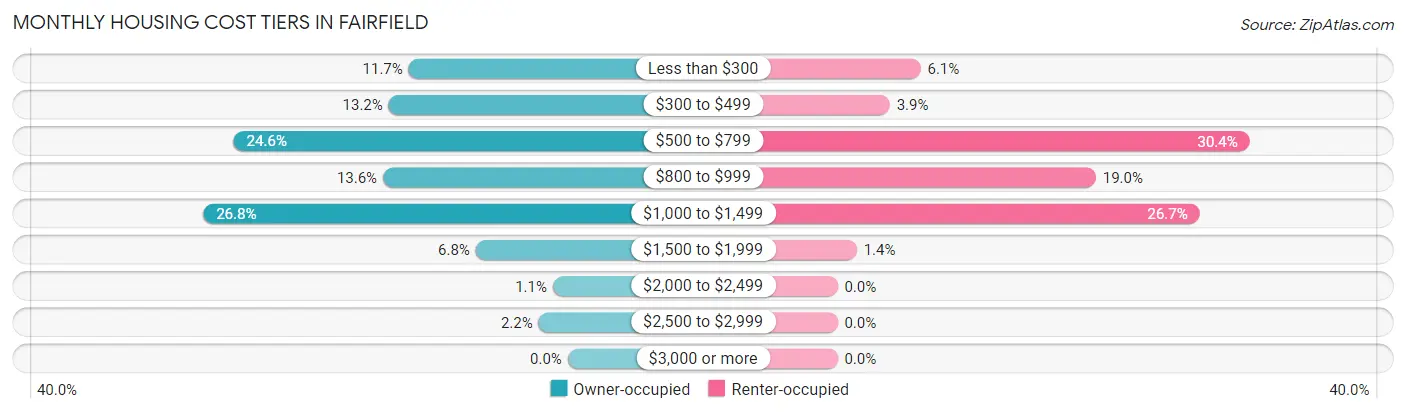
| Monthly Cost | Owner-occupied | Renter-occupied |
| Less than $300 | 278 (11.7%) | 108 (6.1%) |
| $300 to $499 | 313 (13.2%) | 68 (3.8%) |
| $500 to $799 | 584 (24.6%) | 536 (30.3%) |
| $800 to $999 | 323 (13.6%) | 336 (19.0%) |
| $1,000 to $1,499 | 637 (26.8%) | 471 (26.7%) |
| $1,500 to $1,999 | 161 (6.8%) | 25 (1.4%) |
| $2,000 to $2,499 | 26 (1.1%) | 0 (0.0%) |
| $2,500 to $2,999 | 51 (2.1%) | 0 (0.0%) |
| $3,000 or more | 0 (0.0%) | 0 (0.0%) |
| Total | 2,373 (100.0%) | 1,766 (100.0%) |
Physical Housing Characteristics in Fairfield
Housing Structures in Fairfield
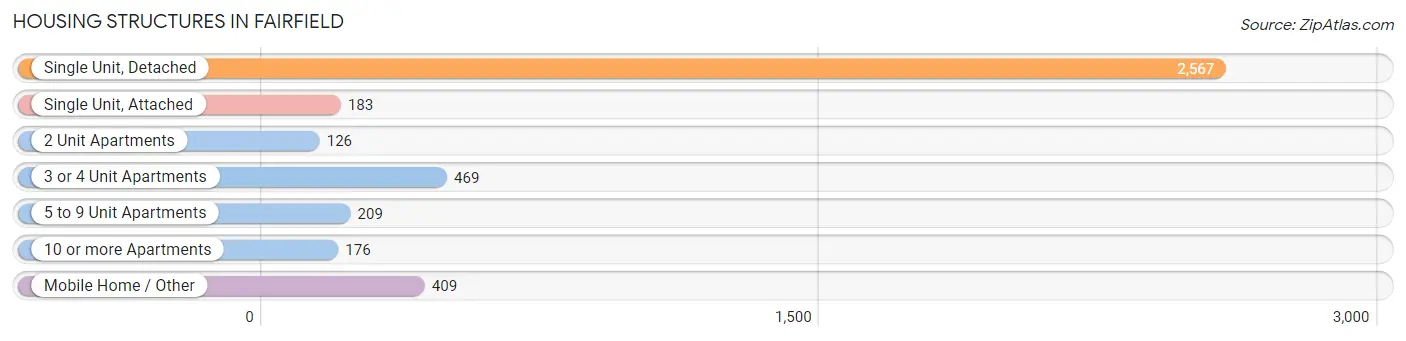
| Structure Type | # Housing Units | % Housing Units |
| Single Unit, Detached | 2,567 | 62.0% |
| Single Unit, Attached | 183 | 4.4% |
| 2 Unit Apartments | 126 | 3.0% |
| 3 or 4 Unit Apartments | 469 | 11.3% |
| 5 to 9 Unit Apartments | 209 | 5.1% |
| 10 or more Apartments | 176 | 4.3% |
| Mobile Home / Other | 409 | 9.9% |
| Total | 4,139 | 100.0% |
Housing Structures by Occupancy in Fairfield
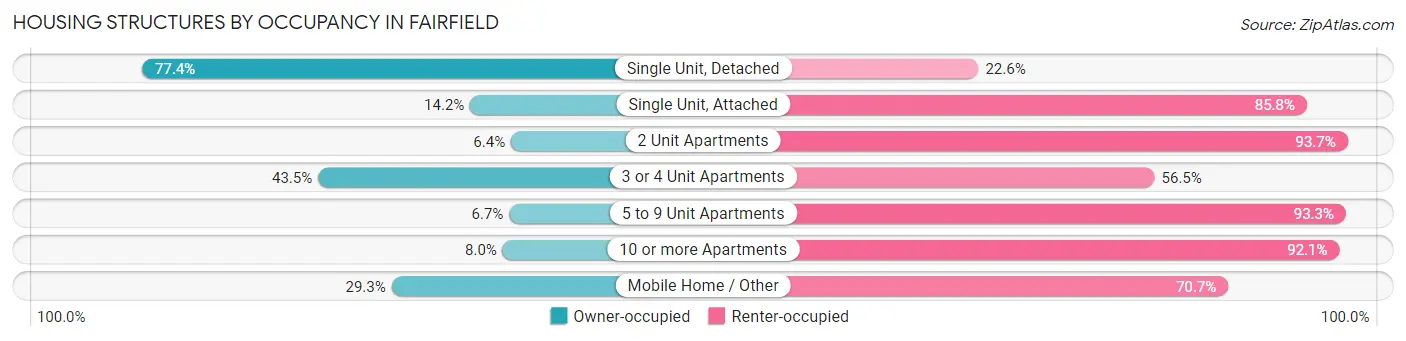
| Structure Type | Owner-occupied | Renter-occupied |
| Single Unit, Detached | 1,987 (77.4%) | 580 (22.6%) |
| Single Unit, Attached | 26 (14.2%) | 157 (85.8%) |
| 2 Unit Apartments | 8 (6.4%) | 118 (93.6%) |
| 3 or 4 Unit Apartments | 204 (43.5%) | 265 (56.5%) |
| 5 to 9 Unit Apartments | 14 (6.7%) | 195 (93.3%) |
| 10 or more Apartments | 14 (8.0%) | 162 (92.0%) |
| Mobile Home / Other | 120 (29.3%) | 289 (70.7%) |
| Total | 2,373 (57.3%) | 1,766 (42.7%) |
Housing Structures by Number of Rooms in Fairfield
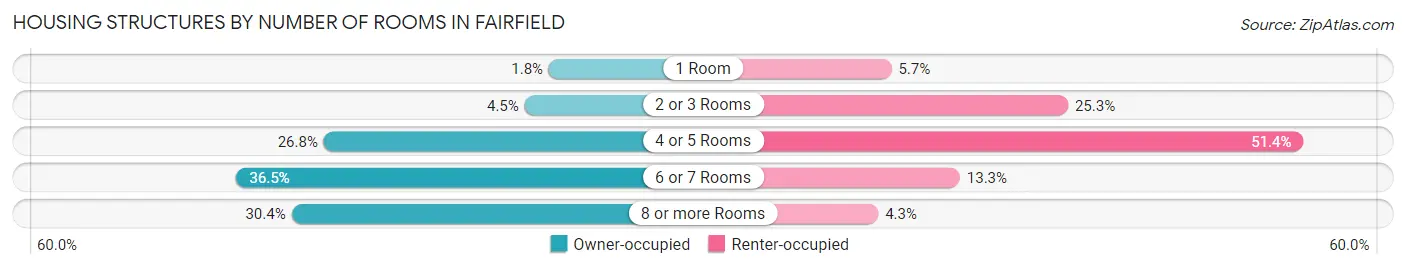
| Number of Rooms | Owner-occupied | Renter-occupied |
| 1 Room | 43 (1.8%) | 101 (5.7%) |
| 2 or 3 Rooms | 107 (4.5%) | 447 (25.3%) |
| 4 or 5 Rooms | 636 (26.8%) | 908 (51.4%) |
| 6 or 7 Rooms | 866 (36.5%) | 235 (13.3%) |
| 8 or more Rooms | 721 (30.4%) | 75 (4.3%) |
| Total | 2,373 (100.0%) | 1,766 (100.0%) |
Housing Structure by Heating Type in Fairfield
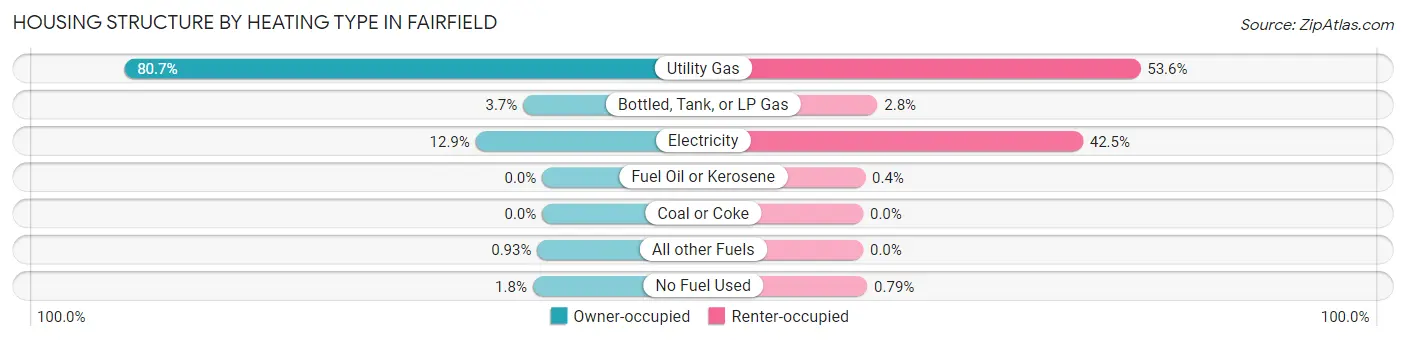
| Heating Type | Owner-occupied | Renter-occupied |
| Utility Gas | 1,916 (80.7%) | 946 (53.6%) |
| Bottled, Tank, or LP Gas | 87 (3.7%) | 49 (2.8%) |
| Electricity | 305 (12.9%) | 750 (42.5%) |
| Fuel Oil or Kerosene | 0 (0.0%) | 7 (0.4%) |
| Coal or Coke | 0 (0.0%) | 0 (0.0%) |
| All other Fuels | 22 (0.9%) | 0 (0.0%) |
| No Fuel Used | 43 (1.8%) | 14 (0.8%) |
| Total | 2,373 (100.0%) | 1,766 (100.0%) |
Household Vehicle Usage in Fairfield
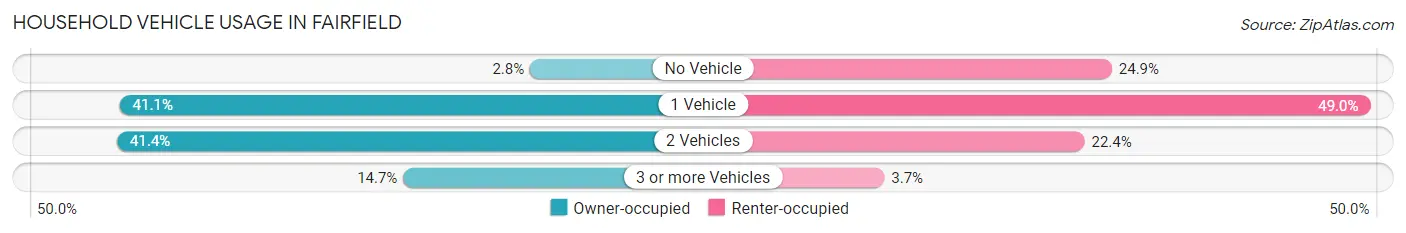
| Vehicles per Household | Owner-occupied | Renter-occupied |
| No Vehicle | 67 (2.8%) | 440 (24.9%) |
| 1 Vehicle | 976 (41.1%) | 866 (49.0%) |
| 2 Vehicles | 982 (41.4%) | 395 (22.4%) |
| 3 or more Vehicles | 348 (14.7%) | 65 (3.7%) |
| Total | 2,373 (100.0%) | 1,766 (100.0%) |
Real Estate & Mortgages in Fairfield
Real Estate and Mortgage Overview in Fairfield
| Characteristic | Without Mortgage | With Mortgage |
| Housing Units | 1,394 | 979 |
| Median Property Value | $125,300 | $150,200 |
| Median Household Income | $57,417 | $85 |
| Monthly Housing Costs | $566 | $0 |
| Real Estate Taxes | $2,376 | $0 |
Property Value by Mortgage Status in Fairfield
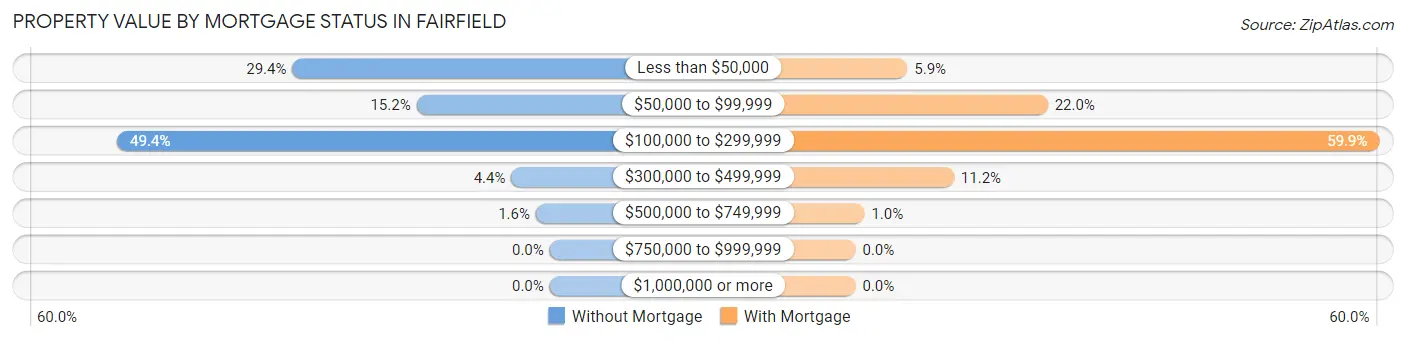
| Property Value | Without Mortgage | With Mortgage |
| Less than $50,000 | 410 (29.4%) | 58 (5.9%) |
| $50,000 to $99,999 | 212 (15.2%) | 215 (22.0%) |
| $100,000 to $299,999 | 689 (49.4%) | 586 (59.9%) |
| $300,000 to $499,999 | 61 (4.4%) | 110 (11.2%) |
| $500,000 to $749,999 | 22 (1.6%) | 10 (1.0%) |
| $750,000 to $999,999 | 0 (0.0%) | 0 (0.0%) |
| $1,000,000 or more | 0 (0.0%) | 0 (0.0%) |
| Total | 1,394 (100.0%) | 979 (100.0%) |
Household Income by Mortgage Status in Fairfield
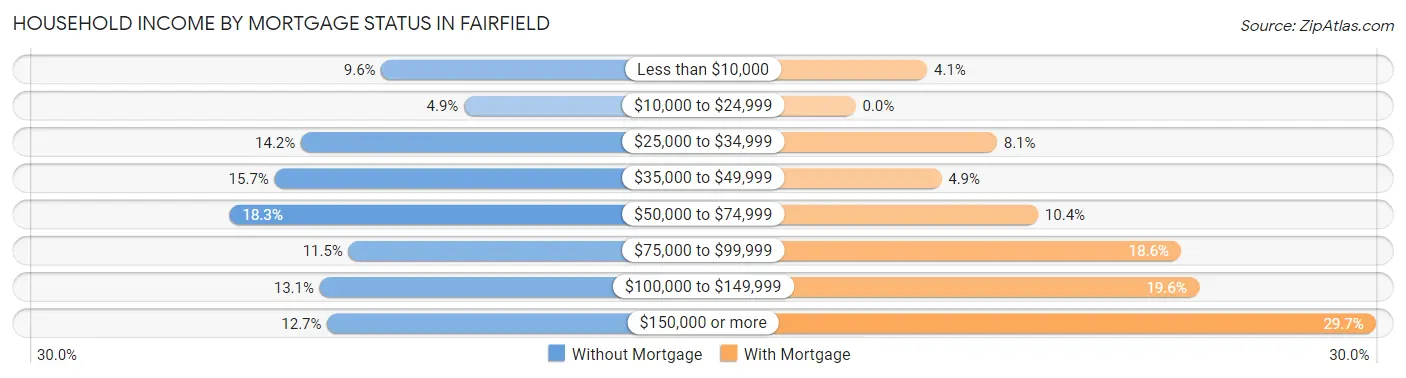
| Household Income | Without Mortgage | With Mortgage |
| Less than $10,000 | 134 (9.6%) | 40 (4.1%) |
| $10,000 to $24,999 | 68 (4.9%) | 0 (0.0%) |
| $25,000 to $34,999 | 198 (14.2%) | 79 (8.1%) |
| $35,000 to $49,999 | 219 (15.7%) | 48 (4.9%) |
| $50,000 to $74,999 | 255 (18.3%) | 102 (10.4%) |
| $75,000 to $99,999 | 160 (11.5%) | 182 (18.6%) |
| $100,000 to $149,999 | 183 (13.1%) | 192 (19.6%) |
| $150,000 or more | 177 (12.7%) | 291 (29.7%) |
| Total | 1,394 (100.0%) | 979 (100.0%) |
Property Value to Household Income Ratio in Fairfield
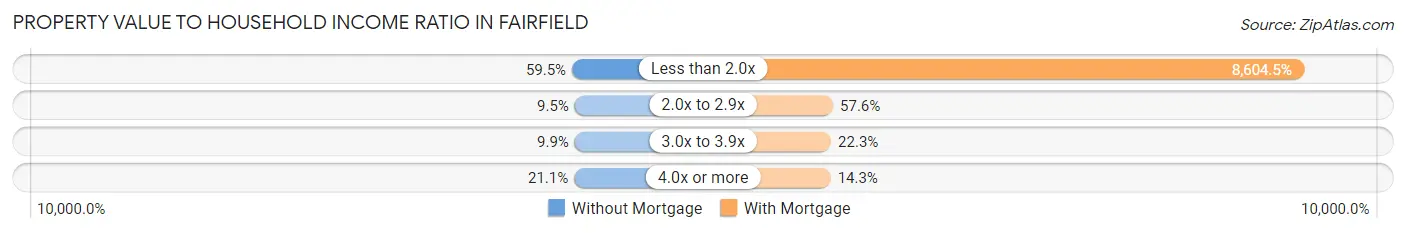
| Value-to-Income Ratio | Without Mortgage | With Mortgage |
| Less than 2.0x | 829 (59.5%) | 84,238 (8,604.5%) |
| 2.0x to 2.9x | 133 (9.5%) | 564 (57.6%) |
| 3.0x to 3.9x | 138 (9.9%) | 218 (22.3%) |
| 4.0x or more | 294 (21.1%) | 140 (14.3%) |
| Total | 1,394 (100.0%) | 979 (100.0%) |
Real Estate Taxes by Mortgage Status in Fairfield
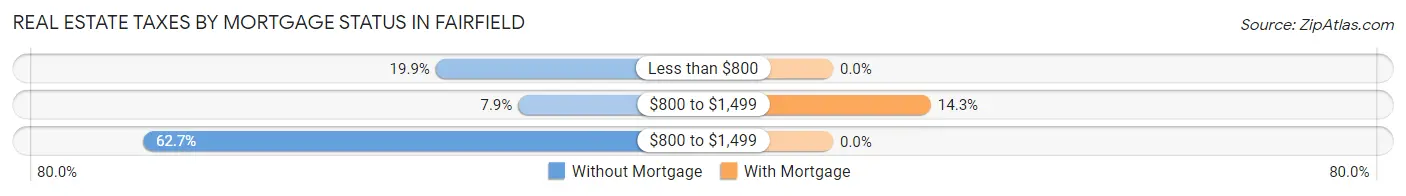
| Property Taxes | Without Mortgage | With Mortgage |
| Less than $800 | 278 (19.9%) | 0 (0.0%) |
| $800 to $1,499 | 110 (7.9%) | 140 (14.3%) |
| $800 to $1,499 | 874 (62.7%) | 0 (0.0%) |
| Total | 1,394 (100.0%) | 979 (100.0%) |
Health & Disability in Fairfield
Health Insurance Coverage by Age in Fairfield
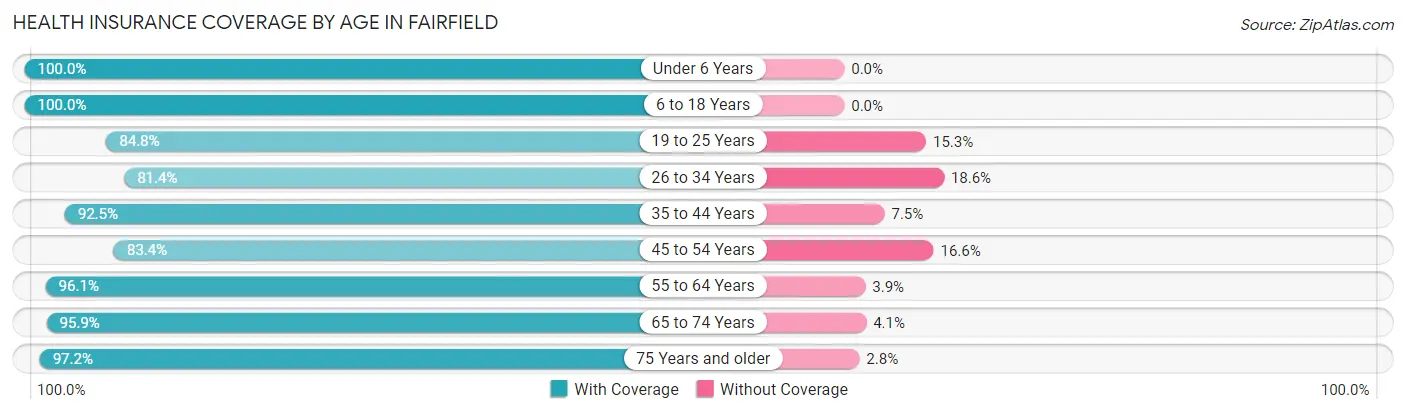
| Age Bracket | With Coverage | Without Coverage |
| Under 6 Years | 469 (100.0%) | 0 (0.0%) |
| 6 to 18 Years | 1,006 (100.0%) | 0 (0.0%) |
| 19 to 25 Years | 767 (84.8%) | 138 (15.2%) |
| 26 to 34 Years | 1,100 (81.4%) | 251 (18.6%) |
| 35 to 44 Years | 1,146 (92.5%) | 93 (7.5%) |
| 45 to 54 Years | 932 (83.4%) | 186 (16.6%) |
| 55 to 64 Years | 904 (96.1%) | 37 (3.9%) |
| 65 to 74 Years | 1,409 (95.9%) | 60 (4.1%) |
| 75 Years and older | 793 (97.2%) | 23 (2.8%) |
| Total | 8,526 (91.5%) | 788 (8.5%) |
Health Insurance Coverage by Citizenship Status in Fairfield
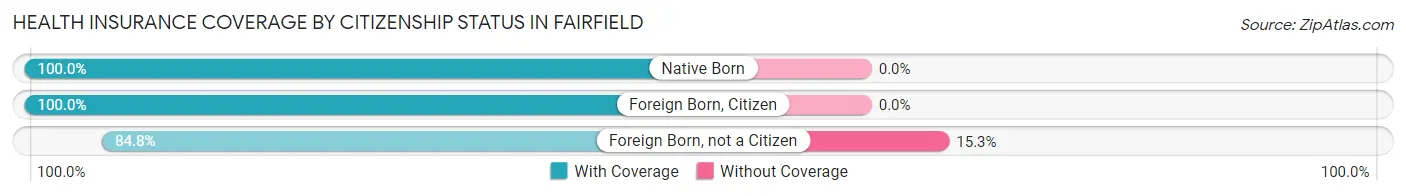
| Citizenship Status | With Coverage | Without Coverage |
| Native Born | 469 (100.0%) | 0 (0.0%) |
| Foreign Born, Citizen | 1,006 (100.0%) | 0 (0.0%) |
| Foreign Born, not a Citizen | 767 (84.8%) | 138 (15.2%) |
Health Insurance Coverage by Household Income in Fairfield
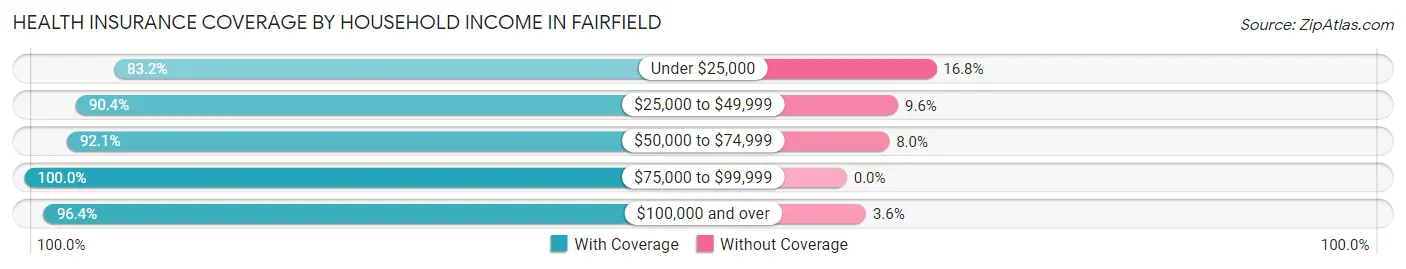
| Household Income | With Coverage | Without Coverage |
| Under $25,000 | 1,260 (83.2%) | 254 (16.8%) |
| $25,000 to $49,999 | 1,948 (90.4%) | 207 (9.6%) |
| $50,000 to $74,999 | 1,192 (92.0%) | 103 (8.0%) |
| $75,000 to $99,999 | 1,388 (100.0%) | 0 (0.0%) |
| $100,000 and over | 2,141 (96.4%) | 80 (3.6%) |
Public vs Private Health Insurance Coverage by Age in Fairfield
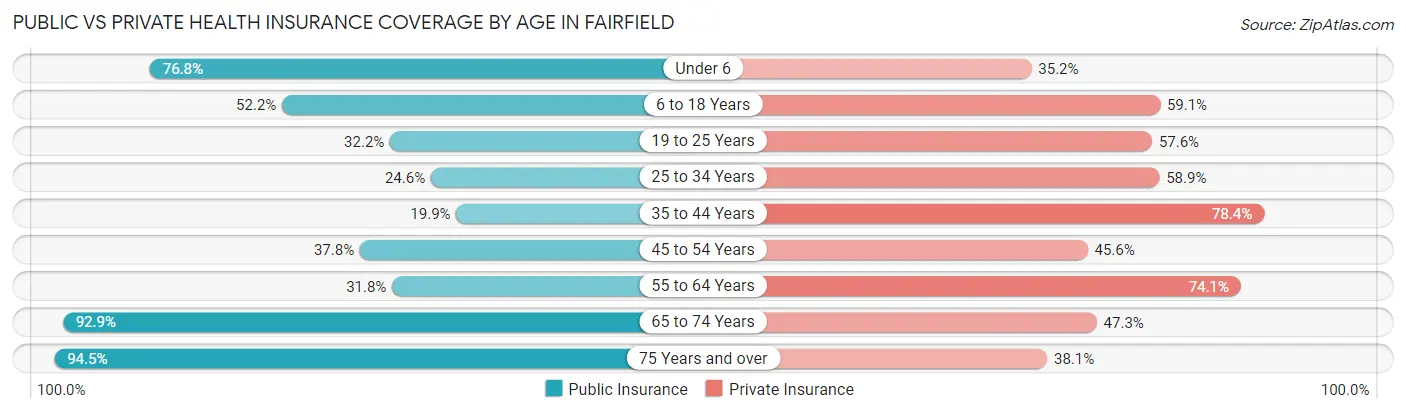
| Age Bracket | Public Insurance | Private Insurance |
| Under 6 | 360 (76.8%) | 165 (35.2%) |
| 6 to 18 Years | 525 (52.2%) | 594 (59.1%) |
| 19 to 25 Years | 291 (32.2%) | 521 (57.6%) |
| 25 to 34 Years | 332 (24.6%) | 796 (58.9%) |
| 35 to 44 Years | 246 (19.9%) | 971 (78.4%) |
| 45 to 54 Years | 422 (37.8%) | 510 (45.6%) |
| 55 to 64 Years | 299 (31.8%) | 697 (74.1%) |
| 65 to 74 Years | 1,365 (92.9%) | 695 (47.3%) |
| 75 Years and over | 771 (94.5%) | 311 (38.1%) |
| Total | 4,611 (49.5%) | 5,260 (56.5%) |
Disability Status by Sex by Age in Fairfield
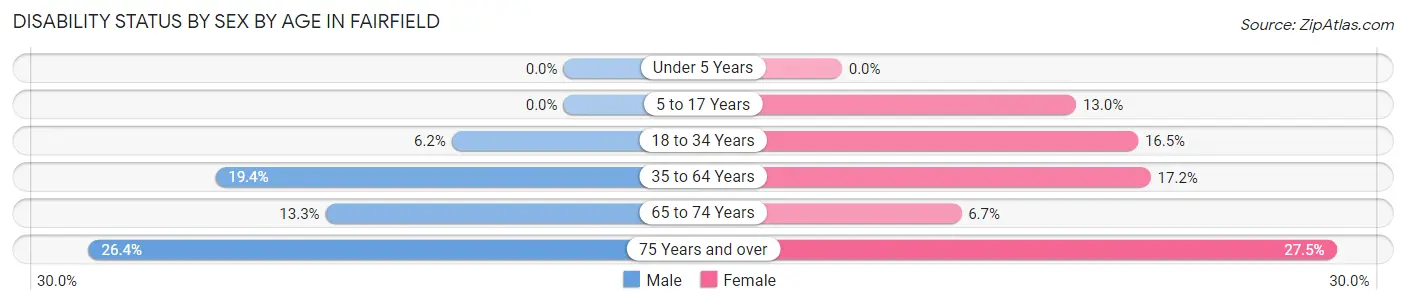
| Age Bracket | Male | Female |
| Under 5 Years | 0 (0.0%) | 0 (0.0%) |
| 5 to 17 Years | 0 (0.0%) | 63 (13.0%) |
| 18 to 34 Years | 84 (6.2%) | 159 (16.5%) |
| 35 to 64 Years | 362 (19.4%) | 246 (17.2%) |
| 65 to 74 Years | 101 (13.3%) | 47 (6.7%) |
| 75 Years and over | 88 (26.4%) | 133 (27.5%) |
Disability Class by Sex by Age in Fairfield
Disability Class: Hearing Difficulty
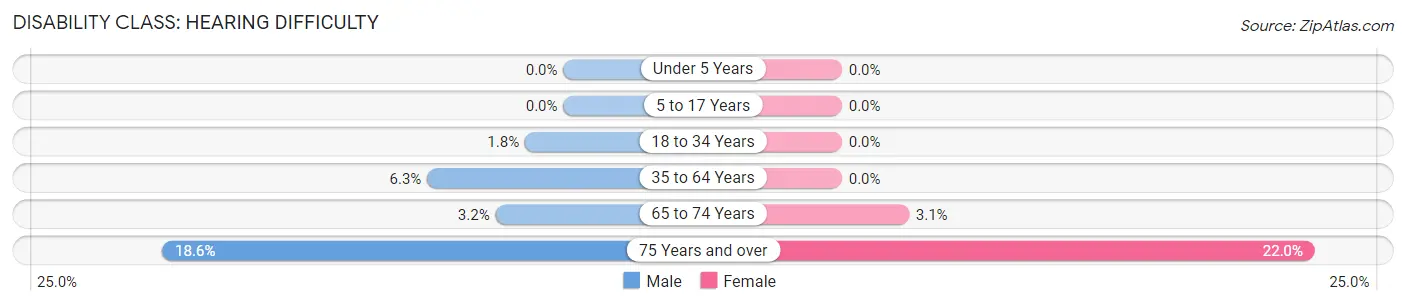
| Age Bracket | Male | Female |
| Under 5 Years | 0 (0.0%) | 0 (0.0%) |
| 5 to 17 Years | 0 (0.0%) | 0 (0.0%) |
| 18 to 34 Years | 24 (1.8%) | 0 (0.0%) |
| 35 to 64 Years | 118 (6.3%) | 0 (0.0%) |
| 65 to 74 Years | 24 (3.2%) | 22 (3.1%) |
| 75 Years and over | 62 (18.6%) | 106 (22.0%) |
Disability Class: Vision Difficulty
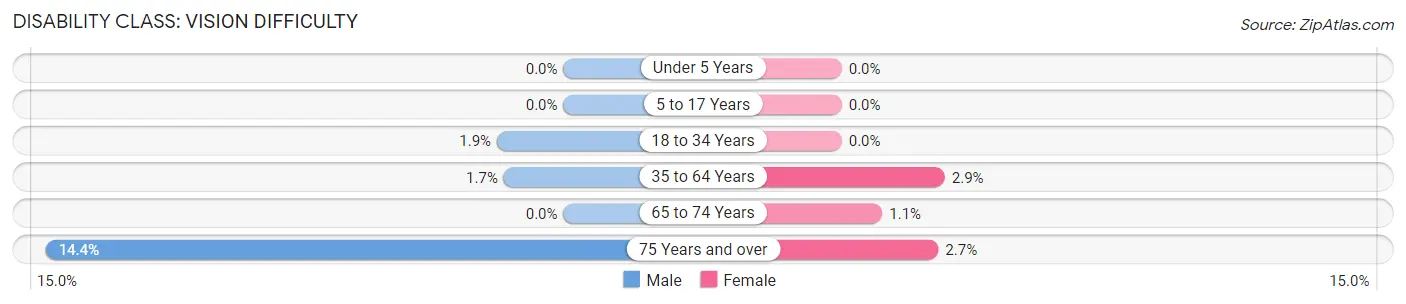
| Age Bracket | Male | Female |
| Under 5 Years | 0 (0.0%) | 0 (0.0%) |
| 5 to 17 Years | 0 (0.0%) | 0 (0.0%) |
| 18 to 34 Years | 25 (1.8%) | 0 (0.0%) |
| 35 to 64 Years | 31 (1.7%) | 41 (2.9%) |
| 65 to 74 Years | 0 (0.0%) | 8 (1.1%) |
| 75 Years and over | 48 (14.4%) | 13 (2.7%) |
Disability Class: Cognitive Difficulty
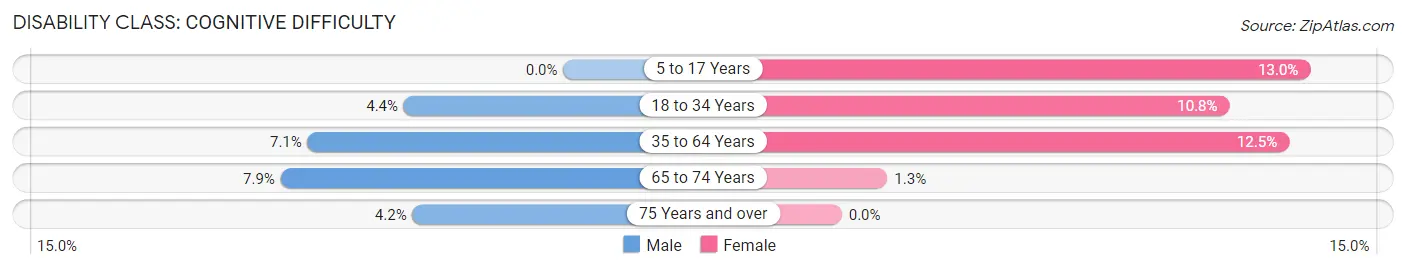
| Age Bracket | Male | Female |
| 5 to 17 Years | 0 (0.0%) | 63 (13.0%) |
| 18 to 34 Years | 60 (4.4%) | 104 (10.8%) |
| 35 to 64 Years | 133 (7.1%) | 178 (12.4%) |
| 65 to 74 Years | 60 (7.9%) | 9 (1.3%) |
| 75 Years and over | 14 (4.2%) | 0 (0.0%) |
Disability Class: Ambulatory Difficulty
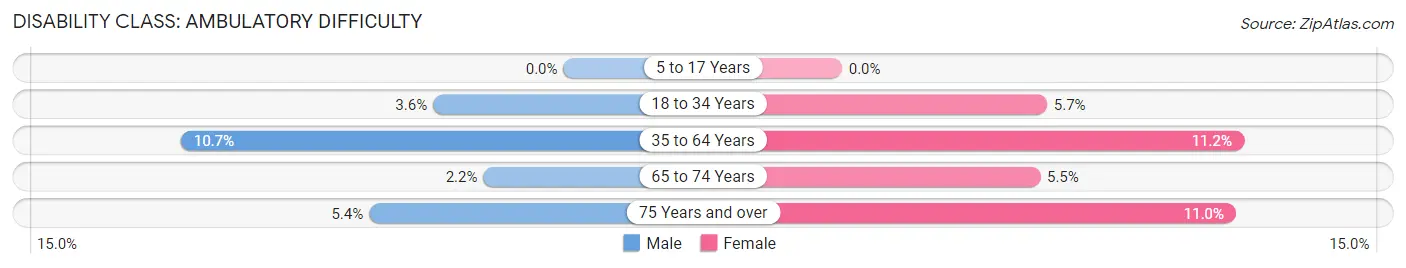
| Age Bracket | Male | Female |
| 5 to 17 Years | 0 (0.0%) | 0 (0.0%) |
| 18 to 34 Years | 49 (3.6%) | 55 (5.7%) |
| 35 to 64 Years | 199 (10.6%) | 160 (11.2%) |
| 65 to 74 Years | 17 (2.2%) | 39 (5.5%) |
| 75 Years and over | 18 (5.4%) | 53 (11.0%) |
Disability Class: Self-Care Difficulty
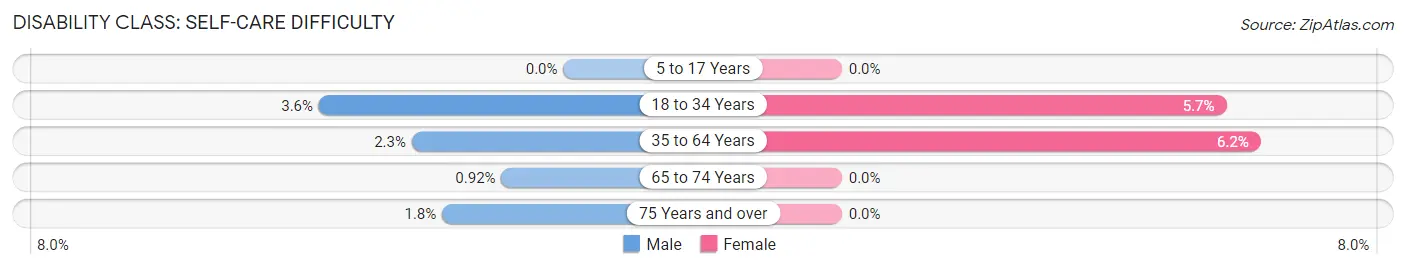
| Age Bracket | Male | Female |
| 5 to 17 Years | 0 (0.0%) | 0 (0.0%) |
| 18 to 34 Years | 49 (3.6%) | 55 (5.7%) |
| 35 to 64 Years | 42 (2.2%) | 89 (6.2%) |
| 65 to 74 Years | 7 (0.9%) | 0 (0.0%) |
| 75 Years and over | 6 (1.8%) | 0 (0.0%) |
Technology Access in Fairfield
Computing Device Access in Fairfield
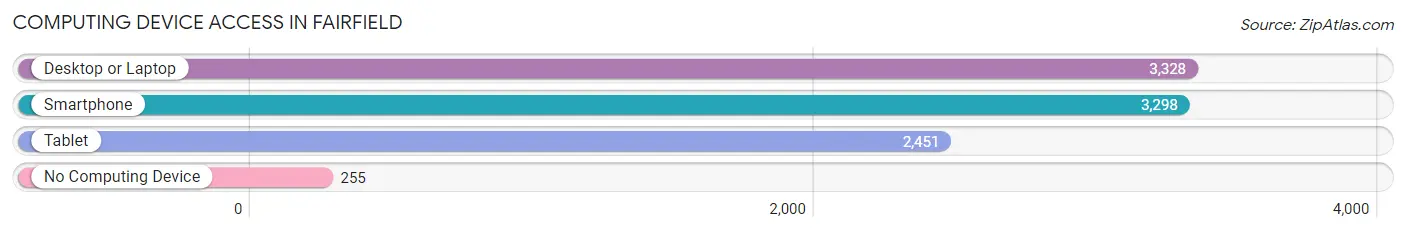
| Device Type | # Households | % Households |
| Desktop or Laptop | 3,328 | 80.4% |
| Smartphone | 3,298 | 79.7% |
| Tablet | 2,451 | 59.2% |
| No Computing Device | 255 | 6.2% |
| Total | 4,139 | 100.0% |
Internet Access in Fairfield
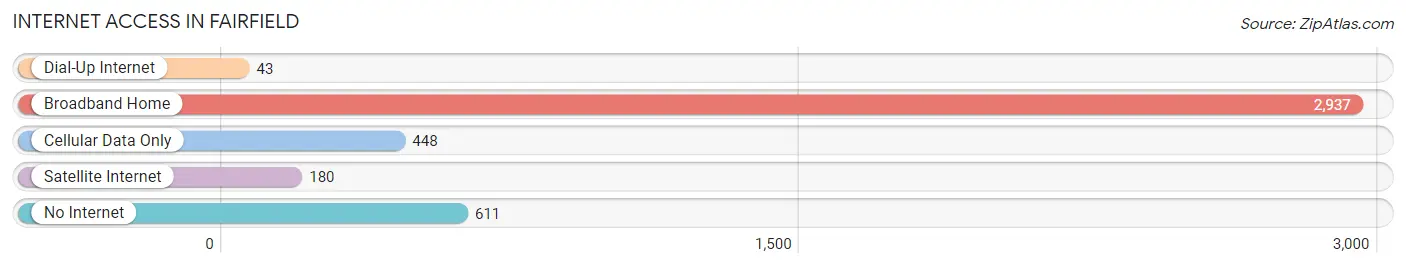
| Internet Type | # Households | % Households |
| Dial-Up Internet | 43 | 1.0% |
| Broadband Home | 2,937 | 71.0% |
| Cellular Data Only | 448 | 10.8% |
| Satellite Internet | 180 | 4.3% |
| No Internet | 611 | 14.8% |
| Total | 4,139 | 100.0% |
Fairfield Summary
Fairfield, Iowa is a city located in the southeastern corner of the state, in Jefferson County. It is the county seat and the largest city in the county. The city is situated on the banks of the Skunk River and is home to a population of approximately 10,000 people.
History
Fairfield was founded in 1839 by settlers from Ohio, Pennsylvania, and Virginia. The city was named after Fairfield, Ohio, the hometown of one of the settlers. The city was incorporated in 1855 and was the first city in the state to be incorporated by an act of the legislature.
The city was an important stop on the Underground Railroad, with many of the city's residents helping to provide shelter and assistance to escaped slaves. During the Civil War, the city was the site of a major battle between Union and Confederate forces.
In the late 19th century, Fairfield became an important center for the arts, with many of the city's residents becoming involved in the arts and culture scene. The city was also home to a number of prominent writers, including Mark Twain, who wrote his famous novel, The Adventures of Tom Sawyer, while living in Fairfield.
Geography
Fairfield is located in the southeastern corner of Iowa, in Jefferson County. The city is situated on the banks of the Skunk River and is surrounded by rolling hills and farmland. The city is located approximately 50 miles south of Des Moines and is part of the Des Moines-West Des Moines Metropolitan Statistical Area.
The city has a total area of 8.3 square miles, of which 8.2 square miles is land and 0.1 square miles is water. The city has a humid continental climate, with hot, humid summers and cold, snowy winters.
Economy
Fairfield has a diverse economy, with a number of industries represented in the city. The city is home to a number of manufacturing companies, including a large furniture manufacturer, a plastics manufacturer, and a number of food processing companies. The city is also home to a number of technology companies, including a software development company and a number of web design firms.
The city is also home to a number of educational institutions, including Maharishi University of Management, a private university that focuses on the study of consciousness-based education. The city is also home to a number of cultural attractions, including the Fairfield Arts and Convention Center, which hosts a variety of events throughout the year.
Demographics
As of the 2010 census, the population of Fairfield was 9,464. The racial makeup of the city was 92.3% White, 2.3% African American, 0.3% Native American, 1.2% Asian, 0.1% Pacific Islander, 1.7% from other races, and 2.3% from two or more races. Hispanic or Latino of any race were 4.2% of the population.
The median income for a household in the city was $41,945, and the median income for a family was $50,945. The per capita income for the city was $22,845. About 8.3% of families and 11.2% of the population were below the poverty line, including 15.2% of those under age 18 and 6.2% of those age 65 or over.
Common Questions
What is Per Capita Income in Fairfield?
Per Capita income in Fairfield is $38,109.
What is the Median Family Income in Fairfield?
Median Family Income in Fairfield is $60,164.
What is the Median Household income in Fairfield?
Median Household Income in Fairfield is $44,277.
What is Income or Wage Gap in Fairfield?
Income or Wage Gap in Fairfield is 21.6%.
Women in Fairfield earn 78.4 cents for every dollar earned by a man.
What is Inequality or Gini Index in Fairfield?
Inequality or Gini Index in Fairfield is 0.59.
What is the Total Population of Fairfield?
Total Population of Fairfield is 9,474.
What is the Total Male Population of Fairfield?
Total Male Population of Fairfield is 5,181.
What is the Total Female Population of Fairfield?
Total Female Population of Fairfield is 4,293.
What is the Ratio of Males per 100 Females in Fairfield?
There are 120.68 Males per 100 Females in Fairfield.
What is the Ratio of Females per 100 Males in Fairfield?
There are 82.86 Females per 100 Males in Fairfield.
What is the Median Population Age in Fairfield?
Median Population Age in Fairfield is 43.0 Years.
What is the Average Family Size in Fairfield
Average Family Size in Fairfield is 2.7 People.
What is the Average Household Size in Fairfield
Average Household Size in Fairfield is 2.1 People.
How Large is the Labor Force in Fairfield?
There are 4,722 People in the Labor Forcein in Fairfield.
What is the Percentage of People in the Labor Force in Fairfield?
58.2% of People are in the Labor Force in Fairfield.
What is the Unemployment Rate in Fairfield?
Unemployment Rate in Fairfield is 6.5%.