Lumbee vs Palestinian Married-Couple Family Poverty
COMPARE
Lumbee
Palestinian
Married-Couple Family Poverty
Married-Couple Family Poverty Comparison
Lumbee
Palestinians
8.3%
MARRIED-COUPLE FAMILY POVERTY
0.0/ 100
METRIC RATING
333rd/ 347
METRIC RANK
4.9%
MARRIED-COUPLE FAMILY POVERTY
91.2/ 100
METRIC RATING
128th/ 347
METRIC RANK
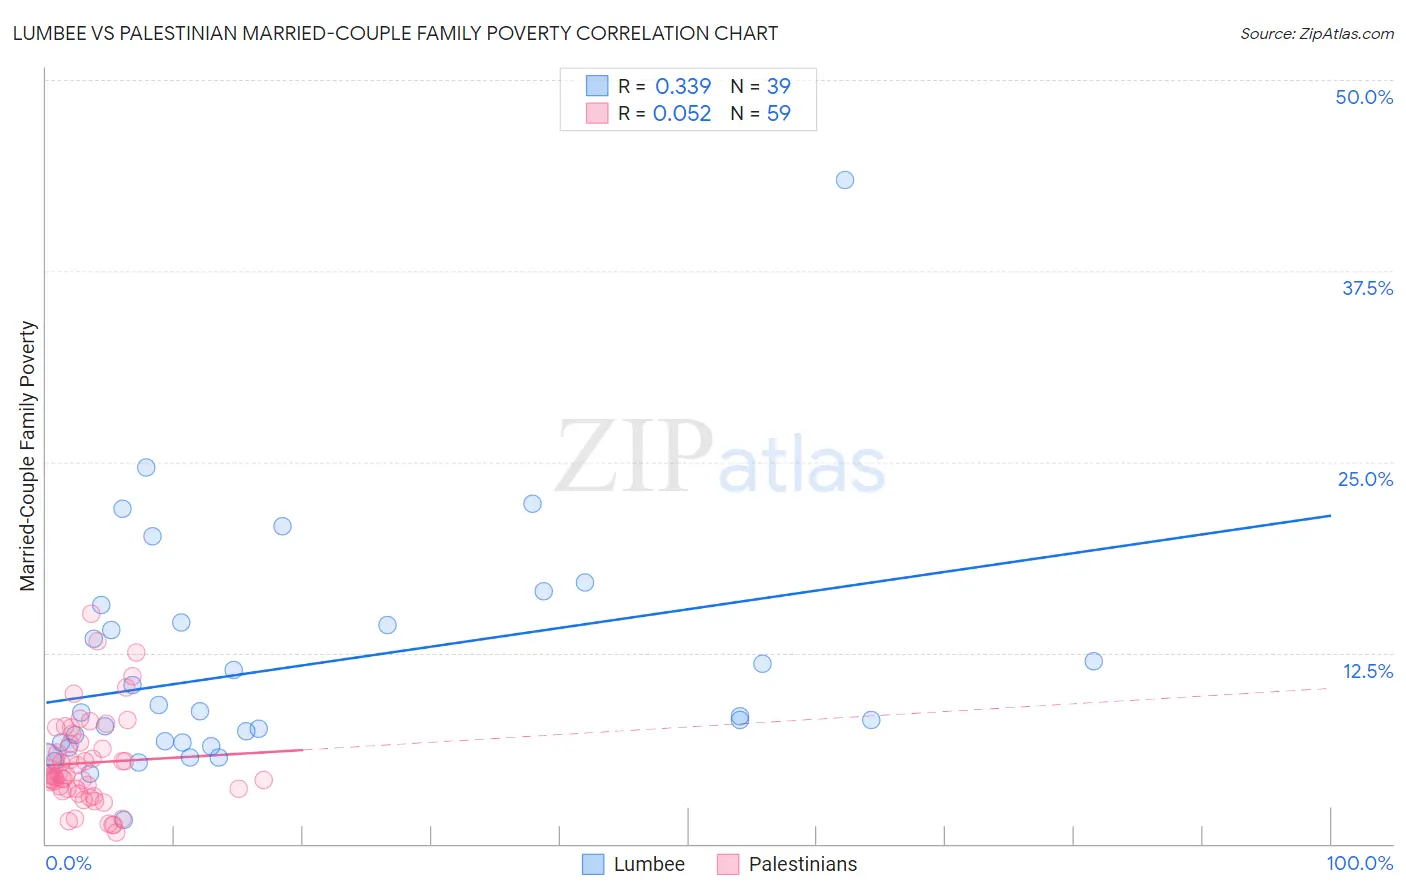
Lumbee vs Palestinian Married-Couple Family Poverty Correlation Chart
The statistical analysis conducted on geographies consisting of 92,019,006 people shows a mild positive correlation between the proportion of Lumbee and poverty level among married-couple families in the United States with a correlation coefficient (R) of 0.339 and weighted average of 8.3%. Similarly, the statistical analysis conducted on geographies consisting of 215,628,863 people shows a slight positive correlation between the proportion of Palestinians and poverty level among married-couple families in the United States with a correlation coefficient (R) of 0.052 and weighted average of 4.9%, a difference of 71.5%.
Married-Couple Family Poverty Correlation Summary
| Measurement | Lumbee | Palestinian |
| Minimum | 1.5% | 0.73% |
| Maximum | 43.5% | 15.1% |
| Range | 41.9% | 14.3% |
| Mean | 11.6% | 5.3% |
| Median | 8.6% | 4.4% |
| Interquartile 25% (IQ1) | 6.6% | 3.6% |
| Interquartile 75% (IQ3) | 14.5% | 6.6% |
| Interquartile Range (IQR) | 7.9% | 3.0% |
| Standard Deviation (Sample) | 7.7% | 3.0% |
| Standard Deviation (Population) | 7.6% | 3.0% |
Similar Demographics by Married-Couple Family Poverty
Demographics Similar to Lumbee by Married-Couple Family Poverty
In terms of married-couple family poverty, the demographic groups most similar to Lumbee are Dominican (8.3%, a difference of 0.47%), Central American Indian (8.3%, a difference of 0.53%), Paiute (8.3%, a difference of 0.59%), Immigrants from Dominican Republic (8.4%, a difference of 0.68%), and Native/Alaskan (8.2%, a difference of 1.9%).
| Demographics | Rating | Rank | Married-Couple Family Poverty |
| Immigrants | Bangladesh | 0.0 /100 | #326 | Tragic 7.5% |
| Hispanics or Latinos | 0.0 /100 | #327 | Tragic 7.5% |
| Immigrants | Mexico | 0.0 /100 | #328 | Tragic 7.6% |
| Natives/Alaskans | 0.0 /100 | #329 | Tragic 8.2% |
| Paiute | 0.0 /100 | #330 | Tragic 8.3% |
| Central American Indians | 0.0 /100 | #331 | Tragic 8.3% |
| Dominicans | 0.0 /100 | #332 | Tragic 8.3% |
| Lumbee | 0.0 /100 | #333 | Tragic 8.3% |
| Immigrants | Dominican Republic | 0.0 /100 | #334 | Tragic 8.4% |
| Sioux | 0.0 /100 | #335 | Tragic 8.7% |
| Apache | 0.0 /100 | #336 | Tragic 9.0% |
| Yakama | 0.0 /100 | #337 | Tragic 9.0% |
| Cheyenne | 0.0 /100 | #338 | Tragic 9.4% |
| Crow | 0.0 /100 | #339 | Tragic 9.6% |
| Yuman | 0.0 /100 | #340 | Tragic 9.7% |
Demographics Similar to Palestinians by Married-Couple Family Poverty
In terms of married-couple family poverty, the demographic groups most similar to Palestinians are Immigrants from Pakistan (4.9%, a difference of 0.20%), Soviet Union (4.9%, a difference of 0.21%), Immigrants from Eastern Europe (4.9%, a difference of 0.28%), Puget Sound Salish (4.9%, a difference of 0.29%), and Egyptian (4.8%, a difference of 0.32%).
| Demographics | Rating | Rank | Married-Couple Family Poverty |
| Indians (Asian) | 93.2 /100 | #121 | Exceptional 4.8% |
| Whites/Caucasians | 93.1 /100 | #122 | Exceptional 4.8% |
| Jordanians | 93.1 /100 | #123 | Exceptional 4.8% |
| Romanians | 92.5 /100 | #124 | Exceptional 4.8% |
| Immigrants | Bosnia and Herzegovina | 92.5 /100 | #125 | Exceptional 4.8% |
| Immigrants | Asia | 92.3 /100 | #126 | Exceptional 4.8% |
| Egyptians | 92.0 /100 | #127 | Exceptional 4.8% |
| Palestinians | 91.2 /100 | #128 | Exceptional 4.9% |
| Immigrants | Pakistan | 90.7 /100 | #129 | Exceptional 4.9% |
| Soviet Union | 90.7 /100 | #130 | Exceptional 4.9% |
| Immigrants | Eastern Europe | 90.5 /100 | #131 | Exceptional 4.9% |
| Puget Sound Salish | 90.4 /100 | #132 | Exceptional 4.9% |
| Immigrants | Kenya | 90.2 /100 | #133 | Exceptional 4.9% |
| Samoans | 90.2 /100 | #134 | Exceptional 4.9% |
| Assyrians/Chaldeans/Syriacs | 89.4 /100 | #135 | Excellent 4.9% |