Lumbee vs Nepalese Married-Couple Family Poverty
COMPARE
Lumbee
Nepalese
Married-Couple Family Poverty
Married-Couple Family Poverty Comparison
Lumbee
Nepalese
8.3%
MARRIED-COUPLE FAMILY POVERTY
0.0/ 100
METRIC RATING
333rd/ 347
METRIC RANK
6.5%
MARRIED-COUPLE FAMILY POVERTY
0.0/ 100
METRIC RATING
289th/ 347
METRIC RANK
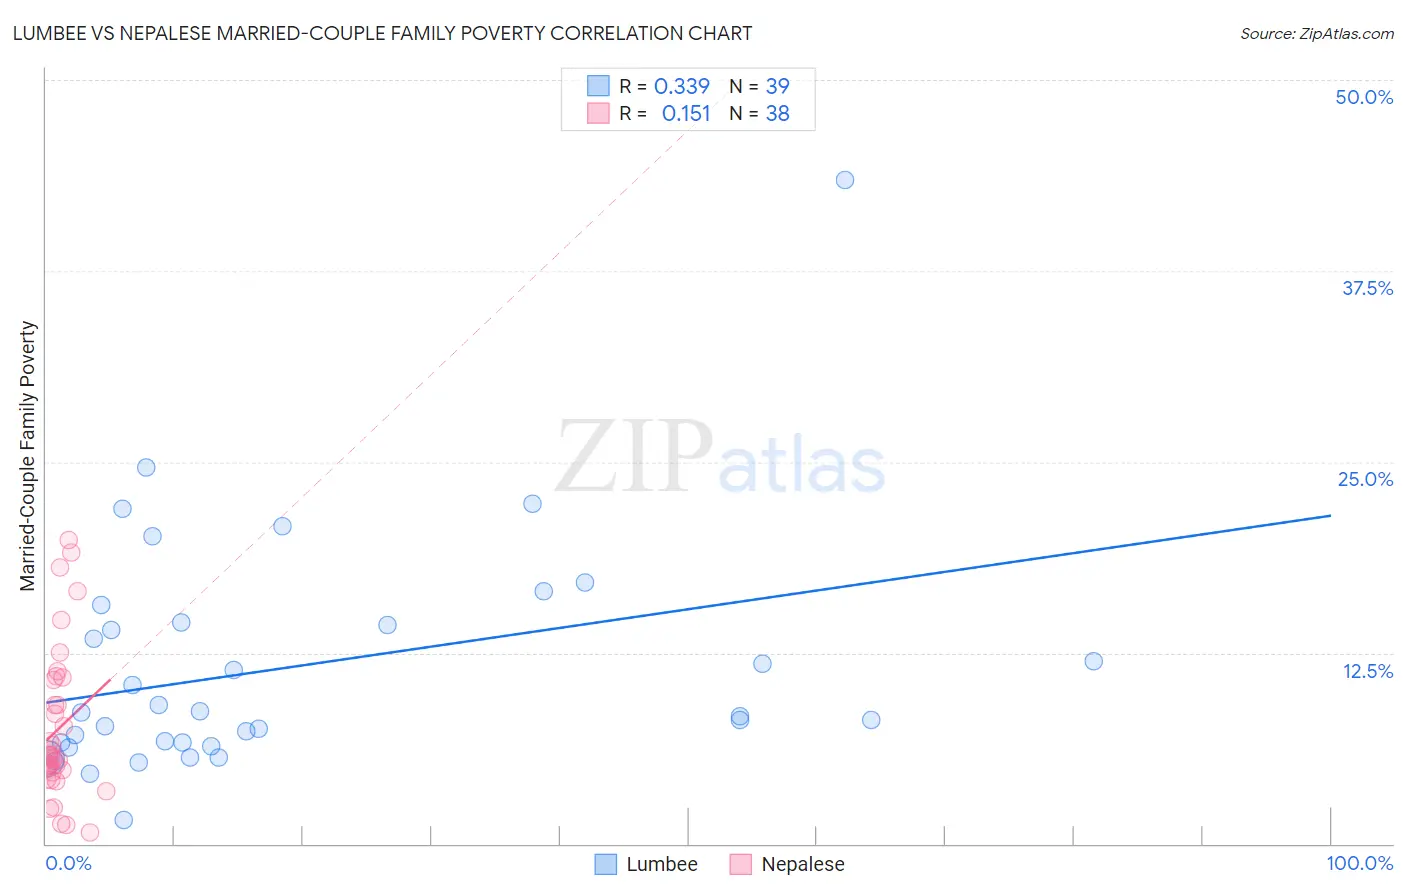
Lumbee vs Nepalese Married-Couple Family Poverty Correlation Chart
The statistical analysis conducted on geographies consisting of 92,019,006 people shows a mild positive correlation between the proportion of Lumbee and poverty level among married-couple families in the United States with a correlation coefficient (R) of 0.339 and weighted average of 8.3%. Similarly, the statistical analysis conducted on geographies consisting of 24,514,690 people shows a poor positive correlation between the proportion of Nepalese and poverty level among married-couple families in the United States with a correlation coefficient (R) of 0.151 and weighted average of 6.5%, a difference of 27.7%.
Married-Couple Family Poverty Correlation Summary
| Measurement | Lumbee | Nepalese |
| Minimum | 1.5% | 0.73% |
| Maximum | 43.5% | 19.9% |
| Range | 41.9% | 19.2% |
| Mean | 11.6% | 7.5% |
| Median | 8.6% | 5.8% |
| Interquartile 25% (IQ1) | 6.6% | 4.7% |
| Interquartile 75% (IQ3) | 14.5% | 10.7% |
| Interquartile Range (IQR) | 7.9% | 6.1% |
| Standard Deviation (Sample) | 7.7% | 4.9% |
| Standard Deviation (Population) | 7.6% | 4.9% |
Similar Demographics by Married-Couple Family Poverty
Demographics Similar to Lumbee by Married-Couple Family Poverty
In terms of married-couple family poverty, the demographic groups most similar to Lumbee are Dominican (8.3%, a difference of 0.47%), Central American Indian (8.3%, a difference of 0.53%), Paiute (8.3%, a difference of 0.59%), Immigrants from Dominican Republic (8.4%, a difference of 0.68%), and Native/Alaskan (8.2%, a difference of 1.9%).
| Demographics | Rating | Rank | Married-Couple Family Poverty |
| Immigrants | Bangladesh | 0.0 /100 | #326 | Tragic 7.5% |
| Hispanics or Latinos | 0.0 /100 | #327 | Tragic 7.5% |
| Immigrants | Mexico | 0.0 /100 | #328 | Tragic 7.6% |
| Natives/Alaskans | 0.0 /100 | #329 | Tragic 8.2% |
| Paiute | 0.0 /100 | #330 | Tragic 8.3% |
| Central American Indians | 0.0 /100 | #331 | Tragic 8.3% |
| Dominicans | 0.0 /100 | #332 | Tragic 8.3% |
| Lumbee | 0.0 /100 | #333 | Tragic 8.3% |
| Immigrants | Dominican Republic | 0.0 /100 | #334 | Tragic 8.4% |
| Sioux | 0.0 /100 | #335 | Tragic 8.7% |
| Apache | 0.0 /100 | #336 | Tragic 9.0% |
| Yakama | 0.0 /100 | #337 | Tragic 9.0% |
| Cheyenne | 0.0 /100 | #338 | Tragic 9.4% |
| Crow | 0.0 /100 | #339 | Tragic 9.6% |
| Yuman | 0.0 /100 | #340 | Tragic 9.7% |
Demographics Similar to Nepalese by Married-Couple Family Poverty
In terms of married-couple family poverty, the demographic groups most similar to Nepalese are Salvadoran (6.5%, a difference of 0.17%), Immigrants from Barbados (6.5%, a difference of 0.23%), Belizean (6.5%, a difference of 0.26%), Ecuadorian (6.5%, a difference of 0.36%), and Immigrants from Lebanon (6.6%, a difference of 0.44%).
| Demographics | Rating | Rank | Married-Couple Family Poverty |
| Seminole | 0.0 /100 | #282 | Tragic 6.4% |
| Ute | 0.0 /100 | #283 | Tragic 6.4% |
| Dutch West Indians | 0.0 /100 | #284 | Tragic 6.4% |
| Blacks/African Americans | 0.0 /100 | #285 | Tragic 6.5% |
| Guyanese | 0.0 /100 | #286 | Tragic 6.5% |
| Ecuadorians | 0.0 /100 | #287 | Tragic 6.5% |
| Salvadorans | 0.0 /100 | #288 | Tragic 6.5% |
| Nepalese | 0.0 /100 | #289 | Tragic 6.5% |
| Immigrants | Barbados | 0.0 /100 | #290 | Tragic 6.5% |
| Belizeans | 0.0 /100 | #291 | Tragic 6.5% |
| Immigrants | Lebanon | 0.0 /100 | #292 | Tragic 6.6% |
| Arapaho | 0.0 /100 | #293 | Tragic 6.6% |
| Bahamians | 0.0 /100 | #294 | Tragic 6.6% |
| Immigrants | Uzbekistan | 0.0 /100 | #295 | Tragic 6.6% |
| U.S. Virgin Islanders | 0.0 /100 | #296 | Tragic 6.6% |