Lumbee vs Immigrants from Syria Married-Couple Family Poverty
COMPARE
Lumbee
Immigrants from Syria
Married-Couple Family Poverty
Married-Couple Family Poverty Comparison
Lumbee
Immigrants from Syria
8.3%
MARRIED-COUPLE FAMILY POVERTY
0.0/ 100
METRIC RATING
333rd/ 347
METRIC RANK
5.5%
MARRIED-COUPLE FAMILY POVERTY
15.4/ 100
METRIC RATING
209th/ 347
METRIC RANK
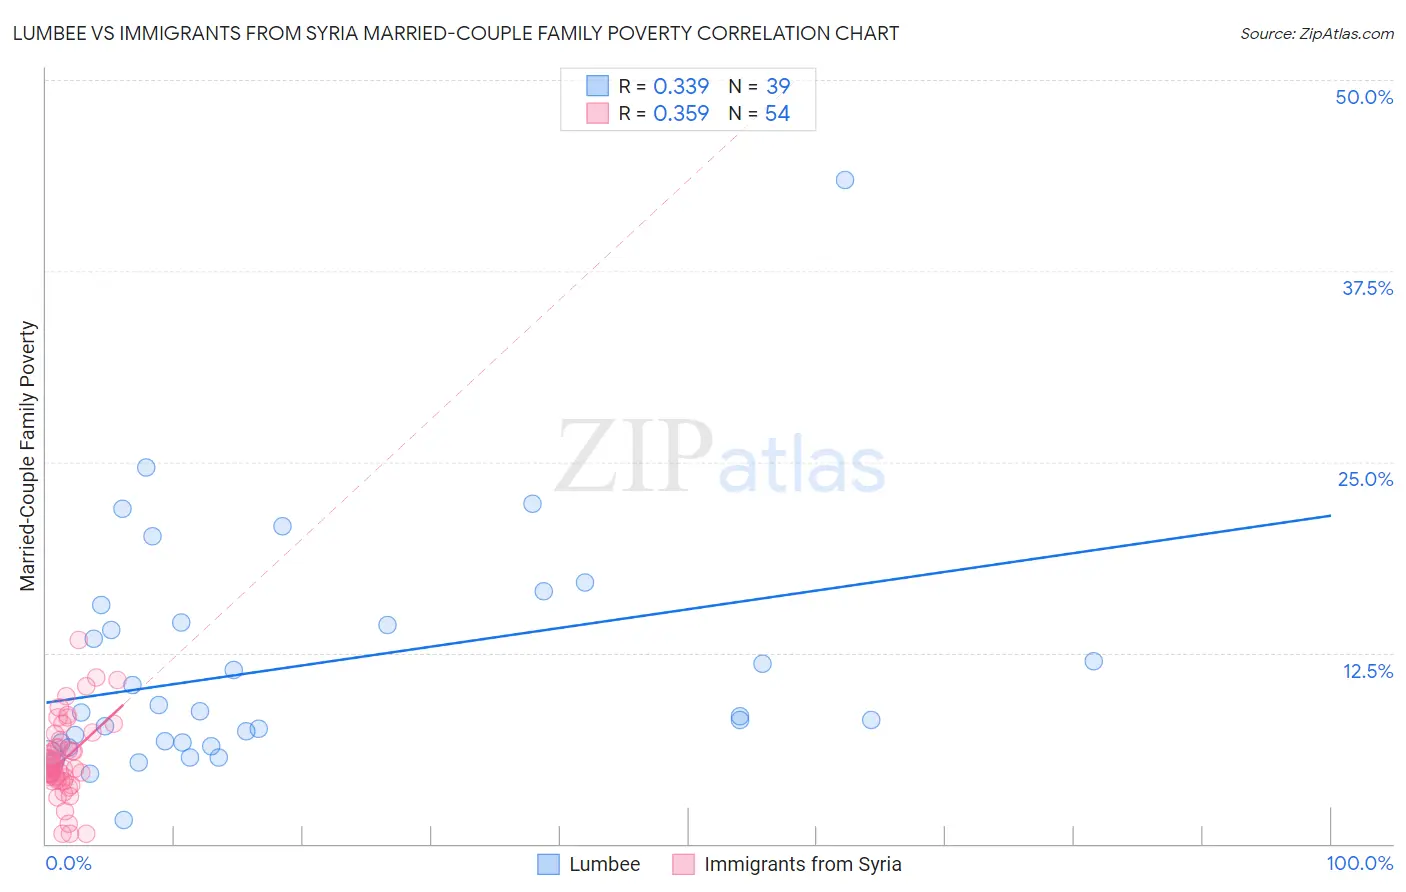
Lumbee vs Immigrants from Syria Married-Couple Family Poverty Correlation Chart
The statistical analysis conducted on geographies consisting of 92,019,006 people shows a mild positive correlation between the proportion of Lumbee and poverty level among married-couple families in the United States with a correlation coefficient (R) of 0.339 and weighted average of 8.3%. Similarly, the statistical analysis conducted on geographies consisting of 173,511,056 people shows a mild positive correlation between the proportion of Immigrants from Syria and poverty level among married-couple families in the United States with a correlation coefficient (R) of 0.359 and weighted average of 5.5%, a difference of 52.3%.
Married-Couple Family Poverty Correlation Summary
| Measurement | Lumbee | Immigrants from Syria |
| Minimum | 1.5% | 0.62% |
| Maximum | 43.5% | 13.3% |
| Range | 41.9% | 12.7% |
| Mean | 11.6% | 5.5% |
| Median | 8.6% | 5.0% |
| Interquartile 25% (IQ1) | 6.6% | 4.2% |
| Interquartile 75% (IQ3) | 14.5% | 6.8% |
| Interquartile Range (IQR) | 7.9% | 2.6% |
| Standard Deviation (Sample) | 7.7% | 2.6% |
| Standard Deviation (Population) | 7.6% | 2.6% |
Similar Demographics by Married-Couple Family Poverty
Demographics Similar to Lumbee by Married-Couple Family Poverty
In terms of married-couple family poverty, the demographic groups most similar to Lumbee are Dominican (8.3%, a difference of 0.47%), Central American Indian (8.3%, a difference of 0.53%), Paiute (8.3%, a difference of 0.59%), Immigrants from Dominican Republic (8.4%, a difference of 0.68%), and Native/Alaskan (8.2%, a difference of 1.9%).
| Demographics | Rating | Rank | Married-Couple Family Poverty |
| Immigrants | Bangladesh | 0.0 /100 | #326 | Tragic 7.5% |
| Hispanics or Latinos | 0.0 /100 | #327 | Tragic 7.5% |
| Immigrants | Mexico | 0.0 /100 | #328 | Tragic 7.6% |
| Natives/Alaskans | 0.0 /100 | #329 | Tragic 8.2% |
| Paiute | 0.0 /100 | #330 | Tragic 8.3% |
| Central American Indians | 0.0 /100 | #331 | Tragic 8.3% |
| Dominicans | 0.0 /100 | #332 | Tragic 8.3% |
| Lumbee | 0.0 /100 | #333 | Tragic 8.3% |
| Immigrants | Dominican Republic | 0.0 /100 | #334 | Tragic 8.4% |
| Sioux | 0.0 /100 | #335 | Tragic 8.7% |
| Apache | 0.0 /100 | #336 | Tragic 9.0% |
| Yakama | 0.0 /100 | #337 | Tragic 9.0% |
| Cheyenne | 0.0 /100 | #338 | Tragic 9.4% |
| Crow | 0.0 /100 | #339 | Tragic 9.6% |
| Yuman | 0.0 /100 | #340 | Tragic 9.7% |
Demographics Similar to Immigrants from Syria by Married-Couple Family Poverty
In terms of married-couple family poverty, the demographic groups most similar to Immigrants from Syria are French American Indian (5.5%, a difference of 0.14%), Immigrants from Micronesia (5.5%, a difference of 0.21%), Nigerian (5.5%, a difference of 0.23%), Immigrants from Thailand (5.5%, a difference of 0.30%), and Immigrants from Africa (5.5%, a difference of 0.46%).
| Demographics | Rating | Rank | Married-Couple Family Poverty |
| Immigrants | Middle Africa | 23.8 /100 | #202 | Fair 5.4% |
| Immigrants | Peru | 21.8 /100 | #203 | Fair 5.4% |
| Immigrants | Costa Rica | 19.4 /100 | #204 | Poor 5.4% |
| Chippewa | 18.9 /100 | #205 | Poor 5.4% |
| Osage | 18.4 /100 | #206 | Poor 5.4% |
| Immigrants | Africa | 17.6 /100 | #207 | Poor 5.5% |
| French American Indians | 16.1 /100 | #208 | Poor 5.5% |
| Immigrants | Syria | 15.4 /100 | #209 | Poor 5.5% |
| Immigrants | Micronesia | 14.4 /100 | #210 | Poor 5.5% |
| Nigerians | 14.3 /100 | #211 | Poor 5.5% |
| Immigrants | Thailand | 14.0 /100 | #212 | Poor 5.5% |
| Immigrants | Liberia | 13.3 /100 | #213 | Poor 5.5% |
| Iroquois | 13.1 /100 | #214 | Poor 5.5% |
| Armenians | 12.8 /100 | #215 | Poor 5.5% |
| Potawatomi | 12.4 /100 | #216 | Poor 5.5% |