Lumbee vs Ottawa Married-Couple Family Poverty
COMPARE
Lumbee
Ottawa
Married-Couple Family Poverty
Married-Couple Family Poverty Comparison
Lumbee
Ottawa
8.3%
MARRIED-COUPLE FAMILY POVERTY
0.0/ 100
METRIC RATING
333rd/ 347
METRIC RANK
5.2%
MARRIED-COUPLE FAMILY POVERTY
54.5/ 100
METRIC RATING
169th/ 347
METRIC RANK
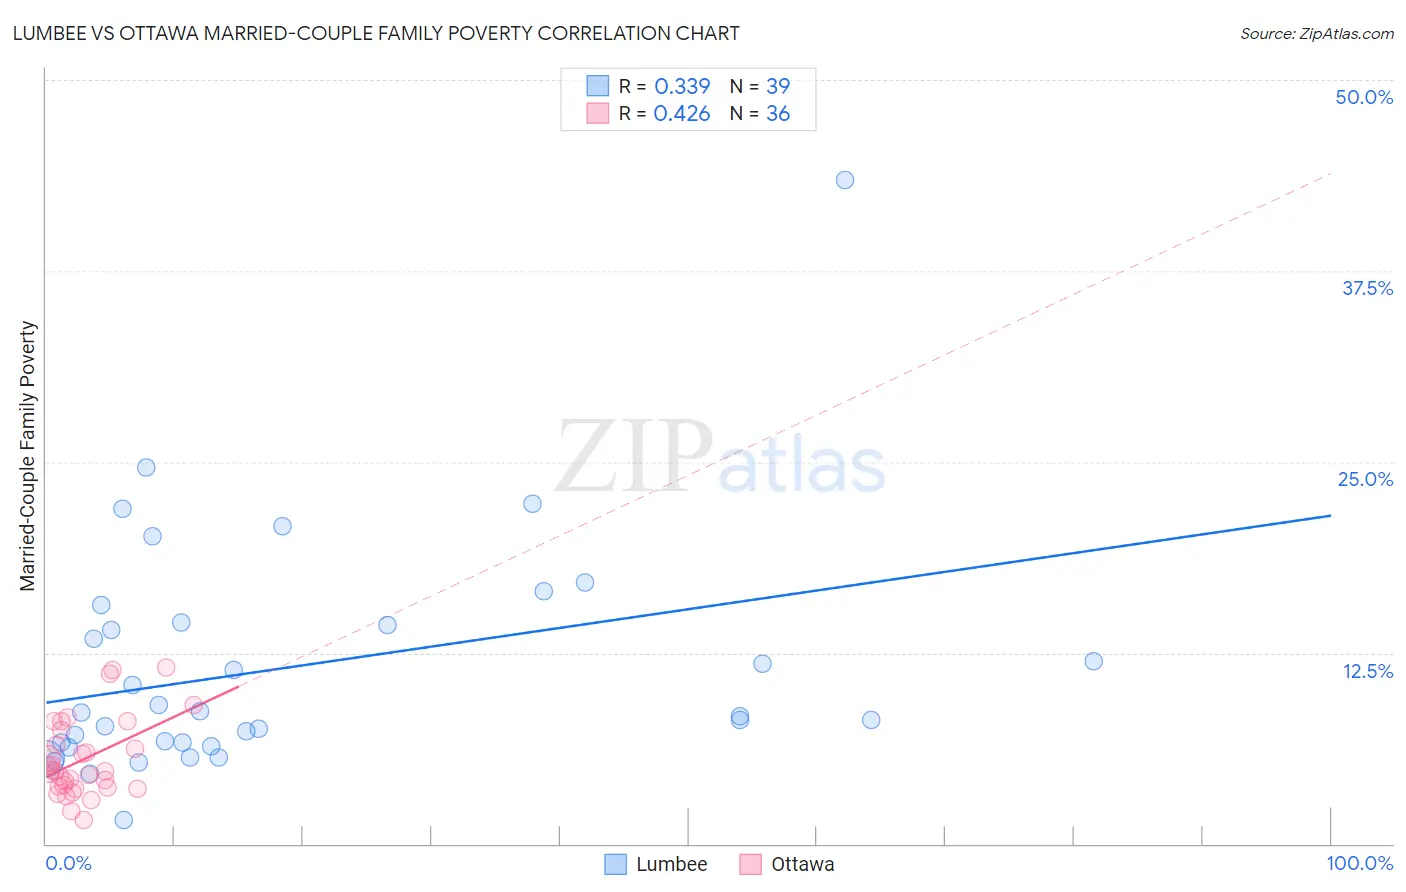
Lumbee vs Ottawa Married-Couple Family Poverty Correlation Chart
The statistical analysis conducted on geographies consisting of 92,019,006 people shows a mild positive correlation between the proportion of Lumbee and poverty level among married-couple families in the United States with a correlation coefficient (R) of 0.339 and weighted average of 8.3%. Similarly, the statistical analysis conducted on geographies consisting of 49,836,436 people shows a moderate positive correlation between the proportion of Ottawa and poverty level among married-couple families in the United States with a correlation coefficient (R) of 0.426 and weighted average of 5.2%, a difference of 60.7%.
Married-Couple Family Poverty Correlation Summary
| Measurement | Lumbee | Ottawa |
| Minimum | 1.5% | 1.6% |
| Maximum | 43.5% | 11.5% |
| Range | 41.9% | 10.0% |
| Mean | 11.6% | 5.5% |
| Median | 8.6% | 4.8% |
| Interquartile 25% (IQ1) | 6.6% | 3.7% |
| Interquartile 75% (IQ3) | 14.5% | 7.0% |
| Interquartile Range (IQR) | 7.9% | 3.3% |
| Standard Deviation (Sample) | 7.7% | 2.5% |
| Standard Deviation (Population) | 7.6% | 2.5% |
Similar Demographics by Married-Couple Family Poverty
Demographics Similar to Lumbee by Married-Couple Family Poverty
In terms of married-couple family poverty, the demographic groups most similar to Lumbee are Dominican (8.3%, a difference of 0.47%), Central American Indian (8.3%, a difference of 0.53%), Paiute (8.3%, a difference of 0.59%), Immigrants from Dominican Republic (8.4%, a difference of 0.68%), and Native/Alaskan (8.2%, a difference of 1.9%).
| Demographics | Rating | Rank | Married-Couple Family Poverty |
| Immigrants | Bangladesh | 0.0 /100 | #326 | Tragic 7.5% |
| Hispanics or Latinos | 0.0 /100 | #327 | Tragic 7.5% |
| Immigrants | Mexico | 0.0 /100 | #328 | Tragic 7.6% |
| Natives/Alaskans | 0.0 /100 | #329 | Tragic 8.2% |
| Paiute | 0.0 /100 | #330 | Tragic 8.3% |
| Central American Indians | 0.0 /100 | #331 | Tragic 8.3% |
| Dominicans | 0.0 /100 | #332 | Tragic 8.3% |
| Lumbee | 0.0 /100 | #333 | Tragic 8.3% |
| Immigrants | Dominican Republic | 0.0 /100 | #334 | Tragic 8.4% |
| Sioux | 0.0 /100 | #335 | Tragic 8.7% |
| Apache | 0.0 /100 | #336 | Tragic 9.0% |
| Yakama | 0.0 /100 | #337 | Tragic 9.0% |
| Cheyenne | 0.0 /100 | #338 | Tragic 9.4% |
| Crow | 0.0 /100 | #339 | Tragic 9.6% |
| Yuman | 0.0 /100 | #340 | Tragic 9.7% |
Demographics Similar to Ottawa by Married-Couple Family Poverty
In terms of married-couple family poverty, the demographic groups most similar to Ottawa are Immigrants from Argentina (5.2%, a difference of 0.010%), Immigrants from Uganda (5.2%, a difference of 0.040%), Bermudan (5.2%, a difference of 0.19%), Immigrants from Northern Africa (5.2%, a difference of 0.37%), and Alsatian (5.2%, a difference of 0.39%).
| Demographics | Rating | Rank | Married-Couple Family Poverty |
| Immigrants | Jordan | 66.5 /100 | #162 | Good 5.1% |
| Sierra Leoneans | 64.1 /100 | #163 | Good 5.1% |
| Hawaiians | 62.3 /100 | #164 | Good 5.1% |
| Immigrants | Malaysia | 62.2 /100 | #165 | Good 5.1% |
| Paraguayans | 61.5 /100 | #166 | Good 5.1% |
| Costa Ricans | 61.5 /100 | #167 | Good 5.1% |
| Immigrants | Uganda | 54.9 /100 | #168 | Average 5.2% |
| Ottawa | 54.5 /100 | #169 | Average 5.2% |
| Immigrants | Argentina | 54.4 /100 | #170 | Average 5.2% |
| Bermudans | 52.9 /100 | #171 | Average 5.2% |
| Immigrants | Northern Africa | 51.3 /100 | #172 | Average 5.2% |
| Alsatians | 51.2 /100 | #173 | Average 5.2% |
| Immigrants | Eastern Africa | 50.0 /100 | #174 | Average 5.2% |
| Marshallese | 47.9 /100 | #175 | Average 5.2% |
| Menominee | 47.8 /100 | #176 | Average 5.2% |