Lumbee vs Immigrants from Laos Married-Couple Family Poverty
COMPARE
Lumbee
Immigrants from Laos
Married-Couple Family Poverty
Married-Couple Family Poverty Comparison
Lumbee
Immigrants from Laos
8.3%
MARRIED-COUPLE FAMILY POVERTY
0.0/ 100
METRIC RATING
333rd/ 347
METRIC RANK
5.7%
MARRIED-COUPLE FAMILY POVERTY
4.4/ 100
METRIC RATING
232nd/ 347
METRIC RANK
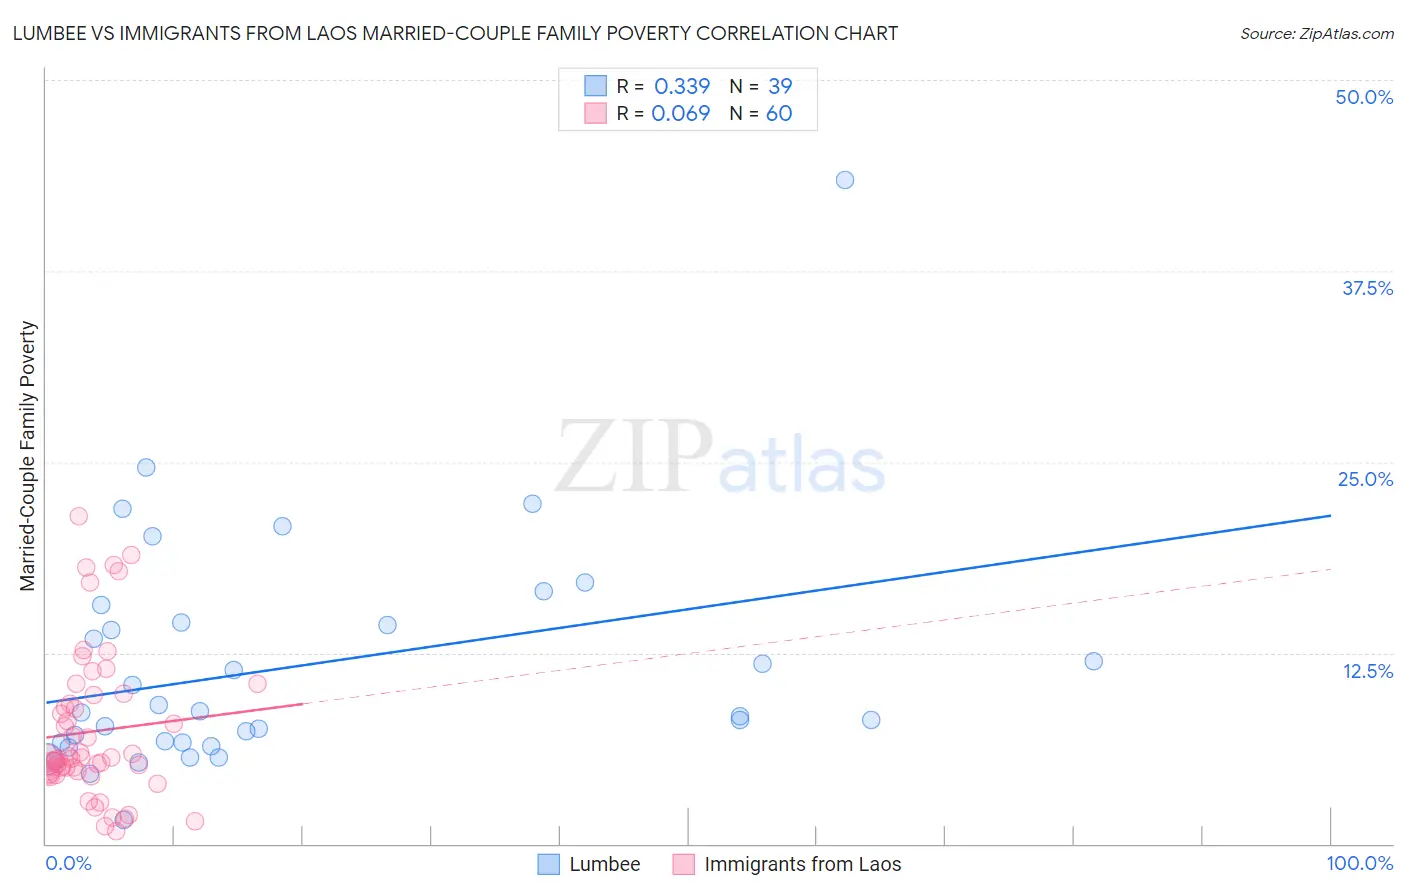
Lumbee vs Immigrants from Laos Married-Couple Family Poverty Correlation Chart
The statistical analysis conducted on geographies consisting of 92,019,006 people shows a mild positive correlation between the proportion of Lumbee and poverty level among married-couple families in the United States with a correlation coefficient (R) of 0.339 and weighted average of 8.3%. Similarly, the statistical analysis conducted on geographies consisting of 200,657,338 people shows a slight positive correlation between the proportion of Immigrants from Laos and poverty level among married-couple families in the United States with a correlation coefficient (R) of 0.069 and weighted average of 5.7%, a difference of 46.7%.
Married-Couple Family Poverty Correlation Summary
| Measurement | Lumbee | Immigrants from Laos |
| Minimum | 1.5% | 0.85% |
| Maximum | 43.5% | 21.4% |
| Range | 41.9% | 20.6% |
| Mean | 11.6% | 7.3% |
| Median | 8.6% | 5.5% |
| Interquartile 25% (IQ1) | 6.6% | 4.7% |
| Interquartile 75% (IQ3) | 14.5% | 9.5% |
| Interquartile Range (IQR) | 7.9% | 4.8% |
| Standard Deviation (Sample) | 7.7% | 4.8% |
| Standard Deviation (Population) | 7.6% | 4.7% |
Similar Demographics by Married-Couple Family Poverty
Demographics Similar to Lumbee by Married-Couple Family Poverty
In terms of married-couple family poverty, the demographic groups most similar to Lumbee are Dominican (8.3%, a difference of 0.47%), Central American Indian (8.3%, a difference of 0.53%), Paiute (8.3%, a difference of 0.59%), Immigrants from Dominican Republic (8.4%, a difference of 0.68%), and Native/Alaskan (8.2%, a difference of 1.9%).
| Demographics | Rating | Rank | Married-Couple Family Poverty |
| Immigrants | Bangladesh | 0.0 /100 | #326 | Tragic 7.5% |
| Hispanics or Latinos | 0.0 /100 | #327 | Tragic 7.5% |
| Immigrants | Mexico | 0.0 /100 | #328 | Tragic 7.6% |
| Natives/Alaskans | 0.0 /100 | #329 | Tragic 8.2% |
| Paiute | 0.0 /100 | #330 | Tragic 8.3% |
| Central American Indians | 0.0 /100 | #331 | Tragic 8.3% |
| Dominicans | 0.0 /100 | #332 | Tragic 8.3% |
| Lumbee | 0.0 /100 | #333 | Tragic 8.3% |
| Immigrants | Dominican Republic | 0.0 /100 | #334 | Tragic 8.4% |
| Sioux | 0.0 /100 | #335 | Tragic 8.7% |
| Apache | 0.0 /100 | #336 | Tragic 9.0% |
| Yakama | 0.0 /100 | #337 | Tragic 9.0% |
| Cheyenne | 0.0 /100 | #338 | Tragic 9.4% |
| Crow | 0.0 /100 | #339 | Tragic 9.6% |
| Yuman | 0.0 /100 | #340 | Tragic 9.7% |
Demographics Similar to Immigrants from Laos by Married-Couple Family Poverty
In terms of married-couple family poverty, the demographic groups most similar to Immigrants from Laos are Immigrants from Iraq (5.7%, a difference of 0.060%), Moroccan (5.7%, a difference of 0.32%), Subsaharan African (5.7%, a difference of 0.35%), Immigrants from Colombia (5.7%, a difference of 0.44%), and Immigrants from Uruguay (5.7%, a difference of 0.44%).
| Demographics | Rating | Rank | Married-Couple Family Poverty |
| Immigrants | Cambodia | 6.1 /100 | #225 | Tragic 5.6% |
| South Americans | 5.7 /100 | #226 | Tragic 5.6% |
| Immigrants | Zaire | 5.6 /100 | #227 | Tragic 5.6% |
| Arabs | 5.4 /100 | #228 | Tragic 5.7% |
| Sub-Saharan Africans | 4.9 /100 | #229 | Tragic 5.7% |
| Moroccans | 4.9 /100 | #230 | Tragic 5.7% |
| Immigrants | Iraq | 4.4 /100 | #231 | Tragic 5.7% |
| Immigrants | Laos | 4.4 /100 | #232 | Tragic 5.7% |
| Immigrants | Colombia | 3.7 /100 | #233 | Tragic 5.7% |
| Immigrants | Uruguay | 3.7 /100 | #234 | Tragic 5.7% |
| Immigrants | Sudan | 3.5 /100 | #235 | Tragic 5.7% |
| Ghanaians | 3.3 /100 | #236 | Tragic 5.7% |
| Immigrants | South America | 3.1 /100 | #237 | Tragic 5.7% |
| Cherokee | 2.7 /100 | #238 | Tragic 5.8% |
| Venezuelans | 2.7 /100 | #239 | Tragic 5.8% |