Lumbee 2 or more Vehicles in Household
COMPARE
Lumbee
Select to Compare
2 or more Vehicles in Household
Lumbee 2 or more Vehicles in Household
55.9%
2+ VEHICLES AVAILABLE
71.9/ 100
METRIC RATING
153rd/ 347
METRIC RANK
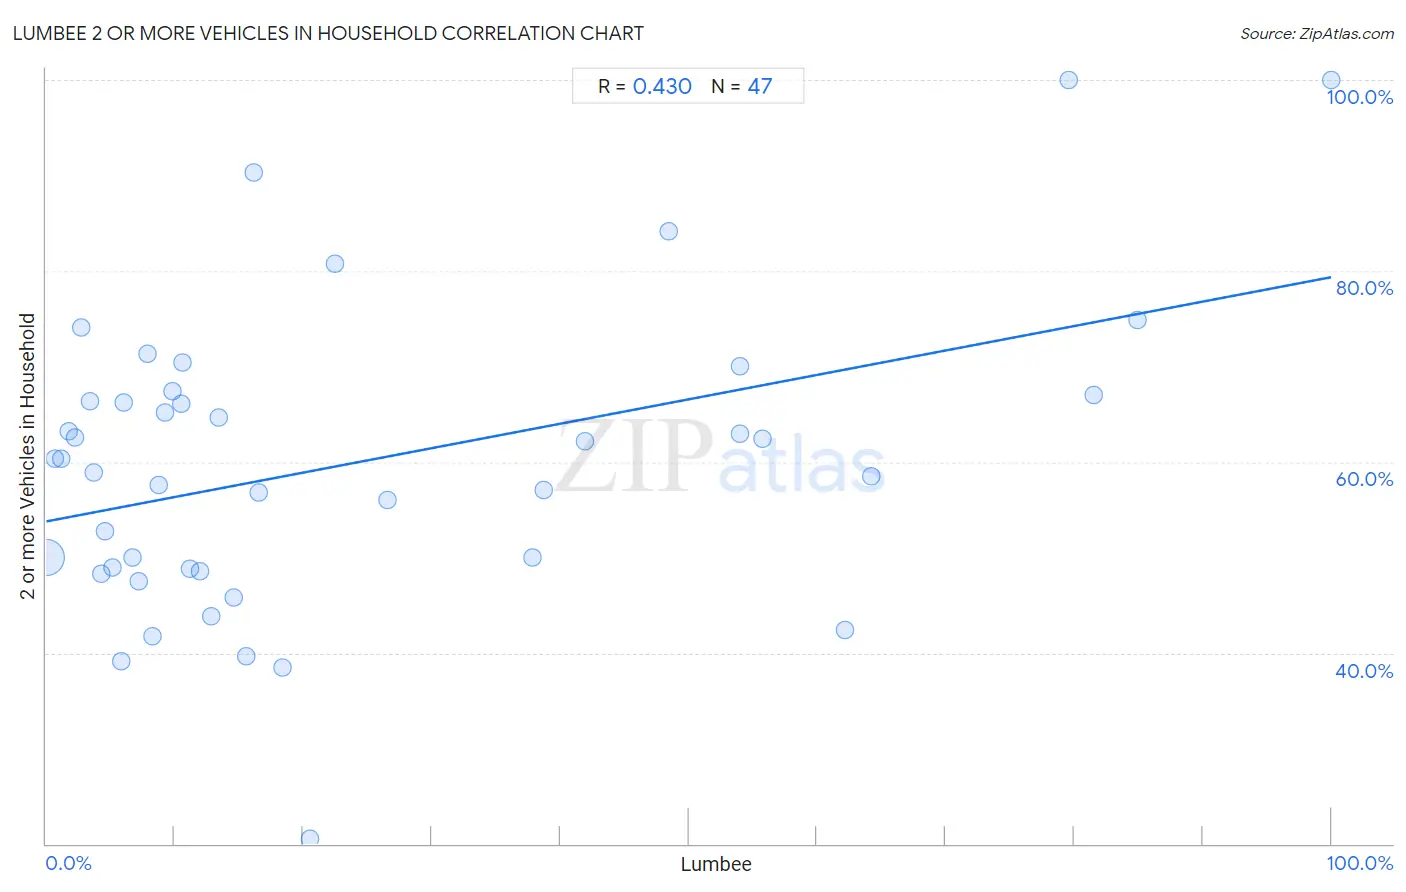
Lumbee 2 or more Vehicles in Household Correlation Chart
The statistical analysis conducted on geographies consisting of 92,265,071 people shows a moderate positive correlation between the proportion of Lumbee and percentage of households with 2 or more vehicles available in the United States with a correlation coefficient (R) of 0.430 and weighted average of 55.9%. On average, for every 1% (one percent) increase in Lumbee within a typical geography, there is an increase of 0.26% in percentage of households with 2 or more vehicles available.
It is essential to understand that the correlation between the percentage of Lumbee and percentage of households with 2 or more vehicles available does not imply a direct cause-and-effect relationship. It remains uncertain whether the presence of Lumbee influences an upward or downward trend in the level of percentage of households with 2 or more vehicles available within an area, or if Lumbee simply ended up residing in those areas with higher or lower levels of percentage of households with 2 or more vehicles available due to other factors.
Demographics Similar to Lumbee by 2 or more Vehicles in Household
In terms of 2 or more vehicles in household, the demographic groups most similar to Lumbee are Ukrainian (55.8%, a difference of 0.060%), Immigrants from Venezuela (55.8%, a difference of 0.060%), Immigrants from Lithuania (55.8%, a difference of 0.070%), Immigrants from Kuwait (55.8%, a difference of 0.080%), and Tlingit-Haida (55.8%, a difference of 0.16%).
| Demographics | Rating | Rank | 2 or more Vehicles in Household |
| Venezuelans | 80.7 /100 | #146 | Excellent 56.1% |
| Serbians | 80.3 /100 | #147 | Excellent 56.1% |
| Immigrants from Moldova | 80.2 /100 | #148 | Excellent 56.1% |
| Chileans | 80.2 /100 | #149 | Excellent 56.1% |
| Nicaraguans | 79.9 /100 | #150 | Good 56.1% |
| Immigrants from Northern Europe | 78.7 /100 | #151 | Good 56.1% |
| Immigrants from Pakistan | 78.1 /100 | #152 | Good 56.1% |
| Lumbee | 71.9 /100 | #153 | Good 55.9% |
| Ukrainians | 70.8 /100 | #154 | Good 55.8% |
| Immigrants from Venezuela | 70.7 /100 | #155 | Good 55.8% |
| Immigrants from Lithuania | 70.4 /100 | #156 | Good 55.8% |
| Immigrants from Kuwait | 70.2 /100 | #157 | Good 55.8% |
| Tlingit-Haida | 68.5 /100 | #158 | Good 55.8% |
| Paiute | 68.0 /100 | #159 | Good 55.8% |
| Crow | 67.0 /100 | #160 | Good 55.7% |
Lumbee 2 or more Vehicles in Household Correlation Summary
| Measurement | Lumbee Data | 2 or more Vehicles in Household Data |
| Minimum | 0.041% | 20.5% |
| Maximum | 100.0% | 100.0% |
| Range | 100.0% | 79.5% |
| Mean | 23.9% | 59.9% |
| Median | 11.9% | 60.3% |
| Interquartile 25% (IQ1) | 5.9% | 48.9% |
| Interquartile 75% (IQ3) | 38.7% | 67.0% |
| Interquartile Range (IQR) | 32.8% | 18.1% |
| Standard Deviation (Sample) | 26.3% | 15.6% |
| Standard Deviation (Population) | 26.0% | 15.5% |
Correlation Details
| Lumbee Percentile | Sample Size | 2 or more Vehicles in Household |
[ 0.0% - 0.5% ] 0.041% | 90,451,759 | 50.0% |
[ 0.5% - 1.0% ] 0.65% | 1,119,807 | 60.4% |
[ 1.0% - 1.5% ] 1.20% | 220,793 | 60.3% |
[ 1.5% - 2.0% ] 1.79% | 120,266 | 63.2% |
[ 2.0% - 2.5% ] 2.25% | 81,868 | 62.6% |
[ 2.5% - 3.0% ] 2.71% | 10,026 | 74.0% |
[ 3.0% - 3.5% ] 3.43% | 9,255 | 66.4% |
[ 3.5% - 4.0% ] 3.68% | 9,759 | 58.9% |
[ 4.0% - 4.5% ] 4.27% | 5,527 | 48.3% |
[ 4.5% - 5.0% ] 4.61% | 8,847 | 52.7% |
[ 5.0% - 5.5% ] 5.11% | 6,276 | 48.9% |
[ 5.5% - 6.0% ] 5.88% | 391 | 39.1% |
[ 6.0% - 6.5% ] 6.05% | 2,016 | 66.2% |
[ 6.5% - 7.0% ] 6.70% | 1,418 | 50.0% |
[ 7.0% - 7.5% ] 7.24% | 18,893 | 47.5% |
[ 7.5% - 8.0% ] 7.83% | 1,417 | 71.3% |
[ 8.0% - 8.5% ] 8.27% | 1,548 | 41.8% |
[ 8.5% - 9.0% ] 8.72% | 3,177 | 57.6% |
[ 9.0% - 9.5% ] 9.22% | 965 | 65.1% |
[ 9.5% - 10.0% ] 9.82% | 906 | 67.4% |
[ 10.0% - 10.5% ] 10.47% | 10,588 | 66.1% |
[ 10.5% - 11.0% ] 10.57% | 946 | 70.4% |
[ 11.0% - 11.5% ] 11.24% | 27,494 | 48.9% |
[ 11.5% - 12.0% ] 11.95% | 25,783 | 48.6% |
[ 12.5% - 13.0% ] 12.84% | 4,385 | 43.9% |
[ 13.0% - 13.5% ] 13.47% | 2,272 | 64.7% |
[ 14.5% - 15.0% ] 14.61% | 869 | 45.8% |
[ 15.5% - 16.0% ] 15.52% | 2,519 | 39.6% |
[ 16.0% - 16.5% ] 16.12% | 769 | 90.3% |
[ 16.5% - 17.0% ] 16.58% | 34,093 | 56.8% |
[ 18.0% - 18.5% ] 18.38% | 3,118 | 38.4% |
[ 20.5% - 21.0% ] 20.57% | 316 | 20.5% |
[ 22.0% - 22.5% ] 22.45% | 245 | 80.8% |
[ 26.5% - 27.0% ] 26.53% | 9,790 | 56.0% |
[ 37.5% - 38.0% ] 37.84% | 37 | 50.0% |
[ 38.5% - 39.0% ] 38.67% | 11,548 | 57.1% |
[ 41.5% - 42.0% ] 41.93% | 5,065 | 62.1% |
[ 48.0% - 48.5% ] 48.45% | 97 | 84.2% |
[ 54.0% - 54.5% ] 54.00% | 300 | 70.0% |
[ 54.0% - 54.5% ] 54.01% | 6,499 | 63.0% |
[ 55.5% - 56.0% ] 55.71% | 29,670 | 62.5% |
[ 62.0% - 62.5% ] 62.12% | 264 | 42.3% |
[ 64.0% - 64.5% ] 64.19% | 12,346 | 58.5% |
[ 79.5% - 80.0% ] 79.59% | 147 | 100.0% |
[ 81.5% - 82.0% ] 81.54% | 650 | 67.0% |
[ 84.5% - 85.0% ] 84.92% | 305 | 74.8% |
[ 99.5% - 100.0% ] 100.00% | 42 | 100.0% |