Lumbee vs Immigrants from Afghanistan Married-Couple Family Poverty
COMPARE
Lumbee
Immigrants from Afghanistan
Married-Couple Family Poverty
Married-Couple Family Poverty Comparison
Lumbee
Immigrants from Afghanistan
8.3%
MARRIED-COUPLE FAMILY POVERTY
0.0/ 100
METRIC RATING
333rd/ 347
METRIC RANK
5.8%
MARRIED-COUPLE FAMILY POVERTY
2.1/ 100
METRIC RATING
245th/ 347
METRIC RANK
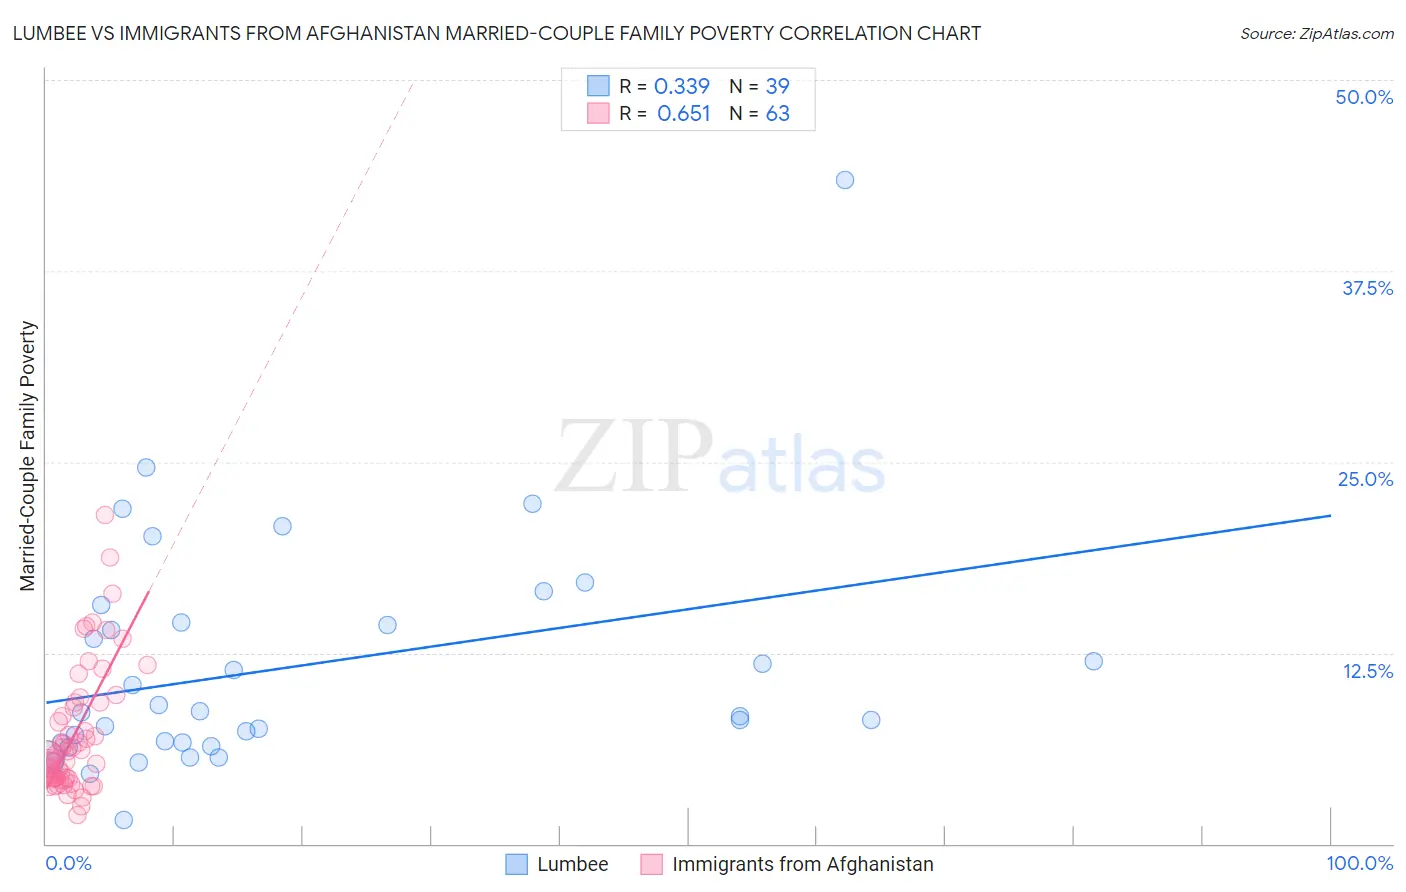
Lumbee vs Immigrants from Afghanistan Married-Couple Family Poverty Correlation Chart
The statistical analysis conducted on geographies consisting of 92,019,006 people shows a mild positive correlation between the proportion of Lumbee and poverty level among married-couple families in the United States with a correlation coefficient (R) of 0.339 and weighted average of 8.3%. Similarly, the statistical analysis conducted on geographies consisting of 147,133,206 people shows a significant positive correlation between the proportion of Immigrants from Afghanistan and poverty level among married-couple families in the United States with a correlation coefficient (R) of 0.651 and weighted average of 5.8%, a difference of 43.9%.
Married-Couple Family Poverty Correlation Summary
| Measurement | Lumbee | Immigrants from Afghanistan |
| Minimum | 1.5% | 1.9% |
| Maximum | 43.5% | 21.6% |
| Range | 41.9% | 19.6% |
| Mean | 11.6% | 7.2% |
| Median | 8.6% | 5.6% |
| Interquartile 25% (IQ1) | 6.6% | 4.3% |
| Interquartile 75% (IQ3) | 14.5% | 9.2% |
| Interquartile Range (IQR) | 7.9% | 4.9% |
| Standard Deviation (Sample) | 7.7% | 4.1% |
| Standard Deviation (Population) | 7.6% | 4.1% |
Similar Demographics by Married-Couple Family Poverty
Demographics Similar to Lumbee by Married-Couple Family Poverty
In terms of married-couple family poverty, the demographic groups most similar to Lumbee are Dominican (8.3%, a difference of 0.47%), Central American Indian (8.3%, a difference of 0.53%), Paiute (8.3%, a difference of 0.59%), Immigrants from Dominican Republic (8.4%, a difference of 0.68%), and Native/Alaskan (8.2%, a difference of 1.9%).
| Demographics | Rating | Rank | Married-Couple Family Poverty |
| Immigrants | Bangladesh | 0.0 /100 | #326 | Tragic 7.5% |
| Hispanics or Latinos | 0.0 /100 | #327 | Tragic 7.5% |
| Immigrants | Mexico | 0.0 /100 | #328 | Tragic 7.6% |
| Natives/Alaskans | 0.0 /100 | #329 | Tragic 8.2% |
| Paiute | 0.0 /100 | #330 | Tragic 8.3% |
| Central American Indians | 0.0 /100 | #331 | Tragic 8.3% |
| Dominicans | 0.0 /100 | #332 | Tragic 8.3% |
| Lumbee | 0.0 /100 | #333 | Tragic 8.3% |
| Immigrants | Dominican Republic | 0.0 /100 | #334 | Tragic 8.4% |
| Sioux | 0.0 /100 | #335 | Tragic 8.7% |
| Apache | 0.0 /100 | #336 | Tragic 9.0% |
| Yakama | 0.0 /100 | #337 | Tragic 9.0% |
| Cheyenne | 0.0 /100 | #338 | Tragic 9.4% |
| Crow | 0.0 /100 | #339 | Tragic 9.6% |
| Yuman | 0.0 /100 | #340 | Tragic 9.7% |
Demographics Similar to Immigrants from Afghanistan by Married-Couple Family Poverty
In terms of married-couple family poverty, the demographic groups most similar to Immigrants from Afghanistan are Chickasaw (5.8%, a difference of 0.15%), Somali (5.8%, a difference of 0.16%), Immigrants from Western Africa (5.8%, a difference of 0.31%), Immigrants from Panama (5.8%, a difference of 0.40%), and Fijian (5.8%, a difference of 0.43%).
| Demographics | Rating | Rank | Married-Couple Family Poverty |
| Cherokee | 2.7 /100 | #238 | Tragic 5.8% |
| Venezuelans | 2.7 /100 | #239 | Tragic 5.8% |
| Fijians | 2.5 /100 | #240 | Tragic 5.8% |
| Immigrants | Panama | 2.5 /100 | #241 | Tragic 5.8% |
| Immigrants | Western Africa | 2.4 /100 | #242 | Tragic 5.8% |
| Somalis | 2.3 /100 | #243 | Tragic 5.8% |
| Chickasaw | 2.3 /100 | #244 | Tragic 5.8% |
| Immigrants | Afghanistan | 2.1 /100 | #245 | Tragic 5.8% |
| Immigrants | Venezuela | 1.8 /100 | #246 | Tragic 5.8% |
| Iraqis | 1.4 /100 | #247 | Tragic 5.9% |
| Cree | 1.2 /100 | #248 | Tragic 5.9% |
| Tsimshian | 1.1 /100 | #249 | Tragic 5.9% |
| Immigrants | Eritrea | 1.1 /100 | #250 | Tragic 5.9% |
| Immigrants | Ghana | 1.0 /100 | #251 | Tragic 5.9% |
| Immigrants | Western Asia | 0.7 /100 | #252 | Tragic 6.0% |