Cove Creek, NC Map & Demographics
Cove Creek Map
Cove Creek Overview
$36,203
PER CAPITA INCOME
$72,177
AVG FAMILY INCOME
$51,812
AVG HOUSEHOLD INCOME
48.8%
WAGE / INCOME GAP [ % ]
51.2¢/ $1
WAGE / INCOME GAP [ $ ]
0.43
INEQUALITY / GINI INDEX
1,354
TOTAL POPULATION
720
MALE POPULATION
634
FEMALE POPULATION
113.56
MALES / 100 FEMALES
88.06
FEMALES / 100 MALES
52.5
MEDIAN AGE
2.7
AVG FAMILY SIZE
2.3
AVG HOUSEHOLD SIZE
907
LABOR FORCE [ PEOPLE ]
74.4%
PERCENT IN LABOR FORCE
1.1%
UNEMPLOYMENT RATE
Income in Cove Creek
Income Overview in Cove Creek
Per Capita Income in Cove Creek is $36,203, while median incomes of families and households are $72,177 and $51,812 respectively.
| Characteristic | Number | Measure |
| Per Capita Income | 1,354 | $36,203 |
| Median Family Income | 412 | $72,177 |
| Mean Family Income | 412 | $100,326 |
| Median Household Income | 584 | $51,812 |
| Mean Household Income | 584 | $81,584 |
| Income Deficit | 412 | $0 |
| Wage / Income Gap (%) | 1,354 | 48.82% |
| Wage / Income Gap ($) | 1,354 | 51.18¢ per $1 |
| Gini / Inequality Index | 1,354 | 0.43 |
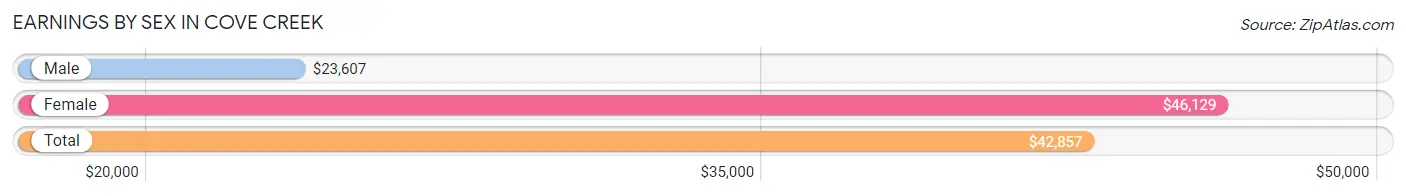
Earnings by Sex in Cove Creek
Average Earnings in Cove Creek are $42,857, $23,607 for men and $46,129 for women, a difference of 48.8%.
| Sex | Number | Average Earnings |
| Male | 466 (51.0%) | $23,607 |
| Female | 448 (49.0%) | $46,129 |
| Total | 914 (100.0%) | $42,857 |
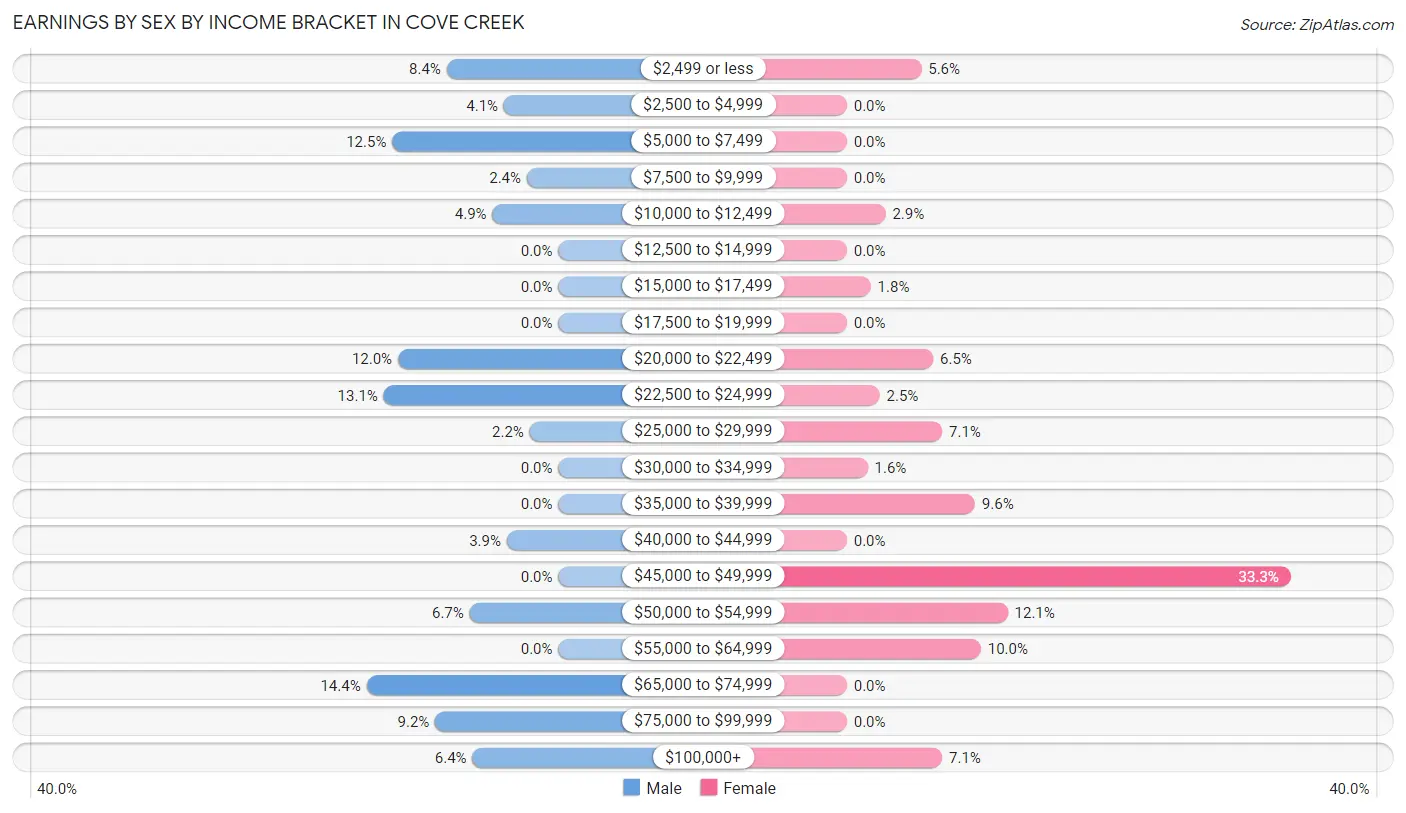
Earnings by Sex by Income Bracket in Cove Creek
The most common earnings brackets in Cove Creek are $65,000 to $74,999 for men (67 | 14.4%) and $45,000 to $49,999 for women (149 | 33.3%).
| Income | Male | Female |
| $2,499 or less | 39 (8.4%) | 25 (5.6%) |
| $2,500 to $4,999 | 19 (4.1%) | 0 (0.0%) |
| $5,000 to $7,499 | 58 (12.4%) | 0 (0.0%) |
| $7,500 to $9,999 | 11 (2.4%) | 0 (0.0%) |
| $10,000 to $12,499 | 23 (4.9%) | 13 (2.9%) |
| $12,500 to $14,999 | 0 (0.0%) | 0 (0.0%) |
| $15,000 to $17,499 | 0 (0.0%) | 8 (1.8%) |
| $17,500 to $19,999 | 0 (0.0%) | 0 (0.0%) |
| $20,000 to $22,499 | 56 (12.0%) | 29 (6.5%) |
| $22,500 to $24,999 | 61 (13.1%) | 11 (2.5%) |
| $25,000 to $29,999 | 10 (2.1%) | 32 (7.1%) |
| $30,000 to $34,999 | 0 (0.0%) | 7 (1.6%) |
| $35,000 to $39,999 | 0 (0.0%) | 43 (9.6%) |
| $40,000 to $44,999 | 18 (3.9%) | 0 (0.0%) |
| $45,000 to $49,999 | 0 (0.0%) | 149 (33.3%) |
| $50,000 to $54,999 | 31 (6.7%) | 54 (12.0%) |
| $55,000 to $64,999 | 0 (0.0%) | 45 (10.0%) |
| $65,000 to $74,999 | 67 (14.4%) | 0 (0.0%) |
| $75,000 to $99,999 | 43 (9.2%) | 0 (0.0%) |
| $100,000+ | 30 (6.4%) | 32 (7.1%) |
| Total | 466 (100.0%) | 448 (100.0%) |
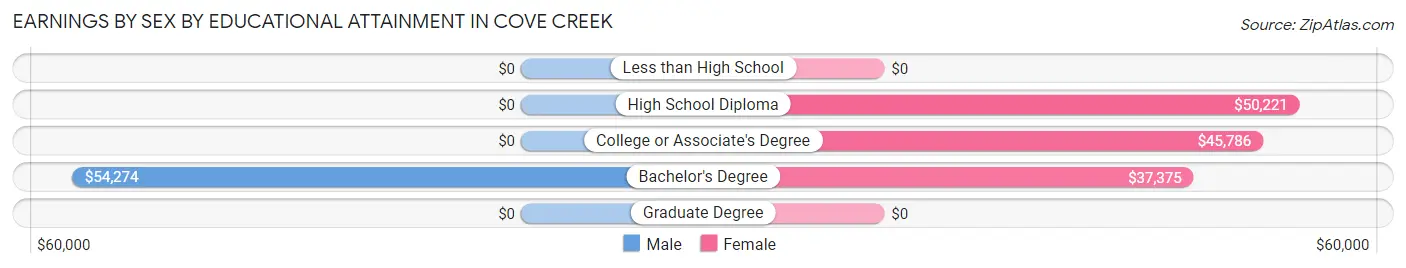
Earnings by Sex by Educational Attainment in Cove Creek
| Educational Attainment | Male Income | Female Income |
| Less than High School | - | - |
| High School Diploma | - | - |
| College or Associate's Degree | - | - |
| Bachelor's Degree | $54,274 | $37,375 |
| Graduate Degree | - | - |
| Total | - | - |
Family Income in Cove Creek
Family Income Brackets in Cove Creek
According to the Cove Creek family income data, there are 151 families falling into the $50,000 to $74,999 income range, which is the most common income bracket and makes up 36.6% of all families.
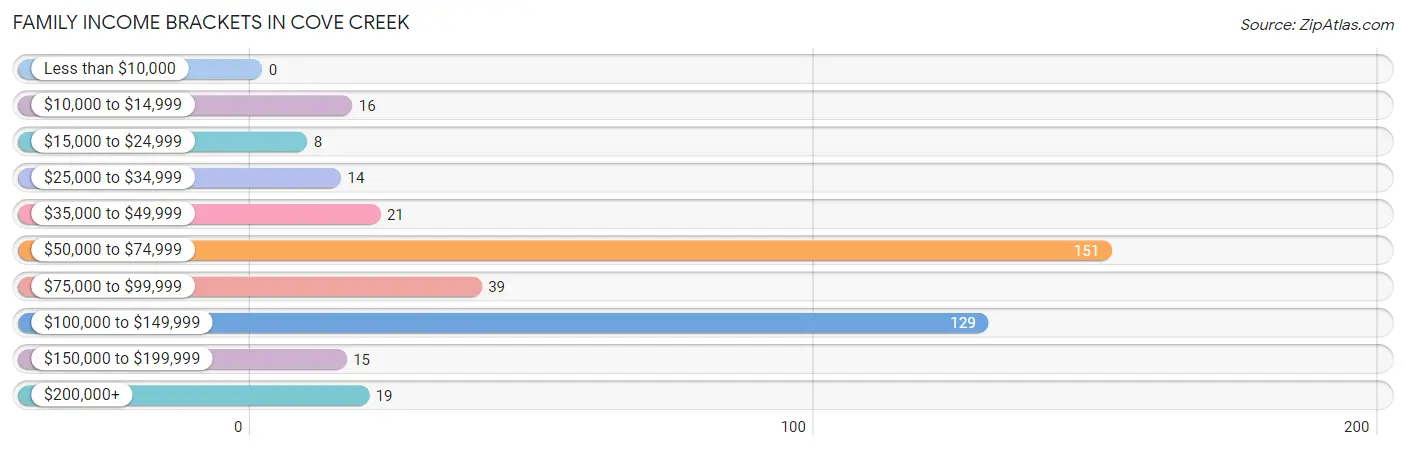
| Income Bracket | # Families | % Families |
| Less than $10,000 | 0 | 0.0% |
| $10,000 to $14,999 | 16 | 3.9% |
| $15,000 to $24,999 | 8 | 1.9% |
| $25,000 to $34,999 | 14 | 3.4% |
| $35,000 to $49,999 | 21 | 5.1% |
| $50,000 to $74,999 | 151 | 36.7% |
| $75,000 to $99,999 | 39 | 9.5% |
| $100,000 to $149,999 | 129 | 31.3% |
| $150,000 to $199,999 | 15 | 3.6% |
| $200,000+ | 19 | 4.6% |
Family Income by Famaliy Size in Cove Creek
3-person families (84 | 20.4%) account for the highest median family income in Cove Creek with $134,674 per family, while 3-person families (84 | 20.4%) have the highest median income of $44,891 per family member.
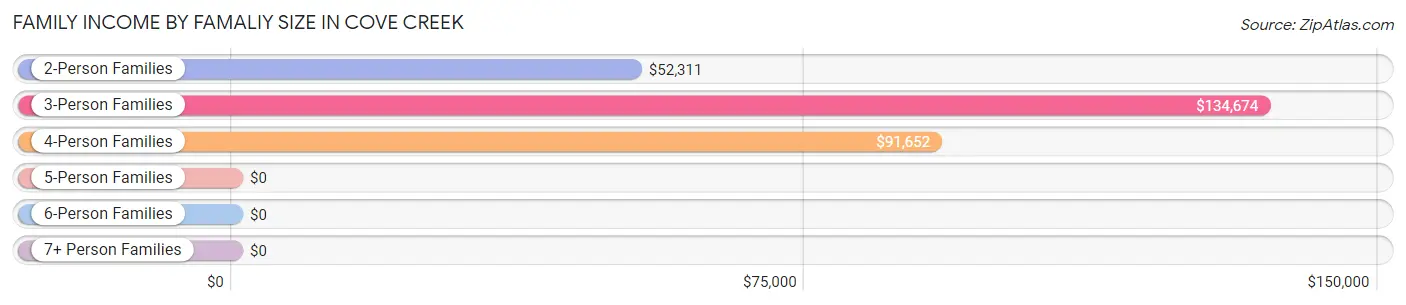
| Income Bracket | # Families | Median Income |
| 2-Person Families | 259 (62.9%) | $52,311 |
| 3-Person Families | 84 (20.4%) | $134,674 |
| 4-Person Families | 69 (16.8%) | $91,652 |
| 5-Person Families | 0 (0.0%) | $0 |
| 6-Person Families | 0 (0.0%) | $0 |
| 7+ Person Families | 0 (0.0%) | $0 |
| Total | 412 (100.0%) | $72,177 |
Family Income by Number of Earners in Cove Creek
The median family income in Cove Creek is $72,177, with families comprising 2 earners (184) having the highest median family income of $119,324, while families with no earners (37) have the lowest median family income of $29,375, accounting for 44.7% and 9.0% of families, respectively.
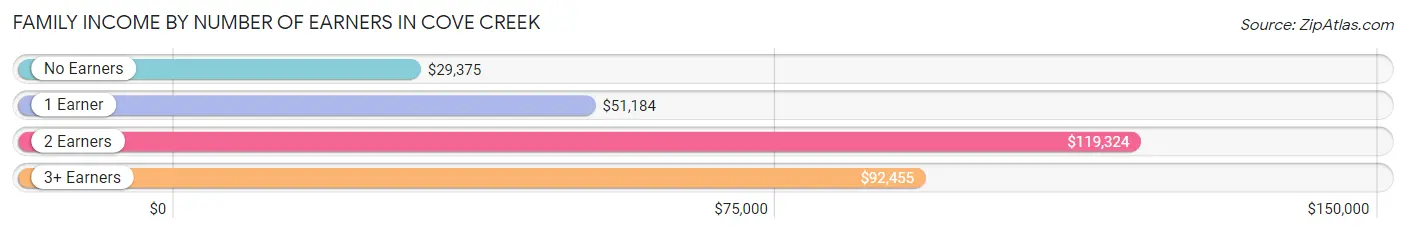
| Number of Earners | # Families | Median Income |
| No Earners | 37 (9.0%) | $29,375 |
| 1 Earner | 114 (27.7%) | $51,184 |
| 2 Earners | 184 (44.7%) | $119,324 |
| 3+ Earners | 77 (18.7%) | $92,455 |
| Total | 412 (100.0%) | $72,177 |
Household Income in Cove Creek
Household Income Brackets in Cove Creek
With 163 households falling in the category, the $50,000 to $74,999 income range is the most frequent in Cove Creek, accounting for 27.9% of all households.
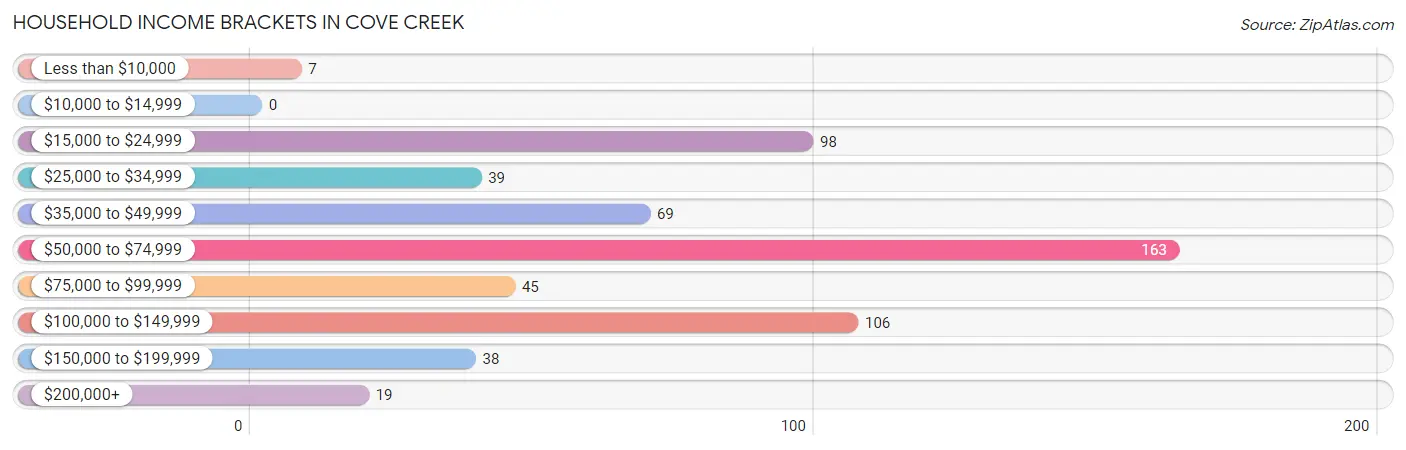
| Income Bracket | # Households | % Households |
| Less than $10,000 | 7 | 1.2% |
| $10,000 to $14,999 | 0 | 0.0% |
| $15,000 to $24,999 | 98 | 16.8% |
| $25,000 to $34,999 | 39 | 6.7% |
| $35,000 to $49,999 | 69 | 11.8% |
| $50,000 to $74,999 | 163 | 27.9% |
| $75,000 to $99,999 | 45 | 7.7% |
| $100,000 to $149,999 | 106 | 18.2% |
| $150,000 to $199,999 | 38 | 6.5% |
| $200,000+ | 19 | 3.3% |
Household Income by Householder Age in Cove Creek
The median household income in Cove Creek is $51,812, with the highest median household income of $92,455 found in the 25 to 44 years age bracket for the primary householder. A total of 155 households (26.5%) fall into this category.
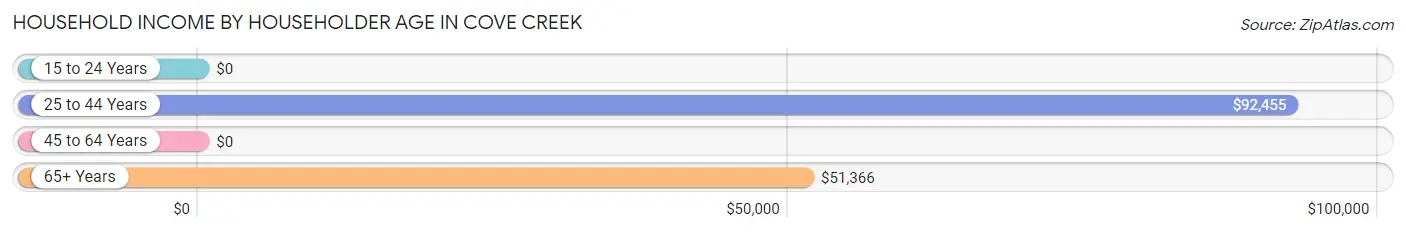
| Income Bracket | # Households | Median Income |
| 15 to 24 Years | 0 (0.0%) | $0 |
| 25 to 44 Years | 155 (26.5%) | $92,455 |
| 45 to 64 Years | 181 (31.0%) | $0 |
| 65+ Years | 248 (42.5%) | $51,366 |
| Total | 584 (100.0%) | $51,812 |
Poverty in Cove Creek
Income Below Poverty by Sex and Age in Cove Creek
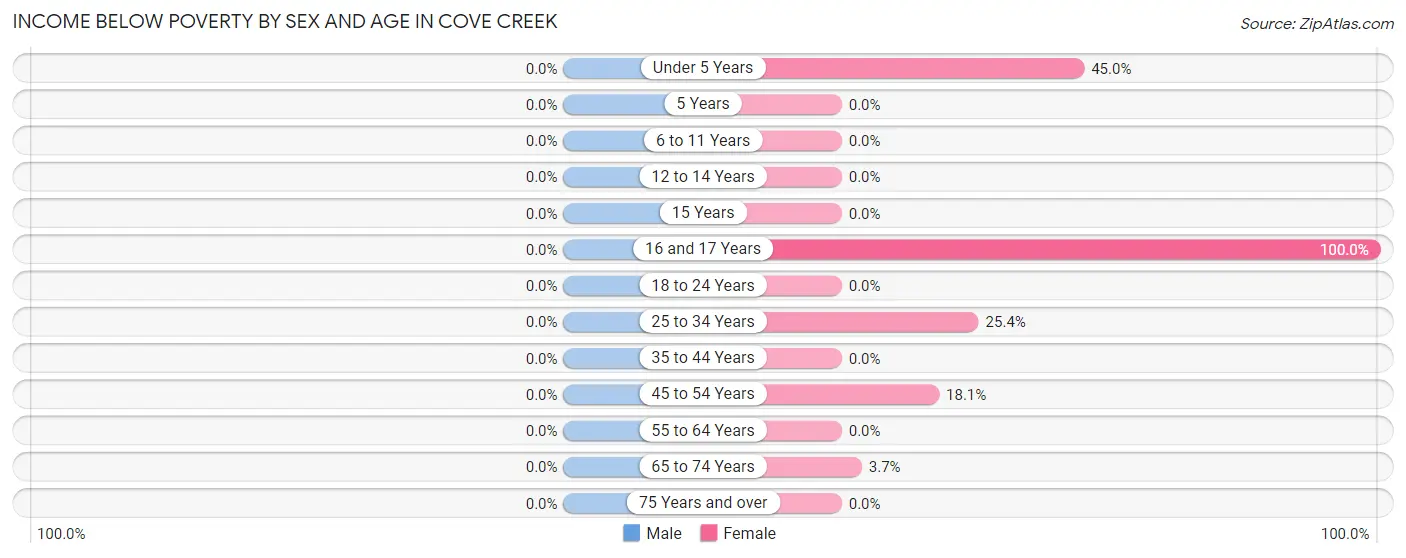
| Age Bracket | Male | Female |
| Under 5 Years | 0 (0.0%) | 18 (45.0%) |
| 5 Years | 0 (0.0%) | 0 (0.0%) |
| 6 to 11 Years | 0 (0.0%) | 0 (0.0%) |
| 12 to 14 Years | 0 (0.0%) | 0 (0.0%) |
| 15 Years | 0 (0.0%) | 0 (0.0%) |
| 16 and 17 Years | 0 (0.0%) | 20 (100.0%) |
| 18 to 24 Years | 0 (0.0%) | 0 (0.0%) |
| 25 to 34 Years | 0 (0.0%) | 16 (25.4%) |
| 35 to 44 Years | 0 (0.0%) | 0 (0.0%) |
| 45 to 54 Years | 0 (0.0%) | 13 (18.1%) |
| 55 to 64 Years | 0 (0.0%) | 0 (0.0%) |
| 65 to 74 Years | 0 (0.0%) | 7 (3.7%) |
| 75 Years and over | 0 (0.0%) | 0 (0.0%) |
| Total | 0 (0.0%) | 74 (11.7%) |
Income Above Poverty by Sex and Age in Cove Creek
According to the poverty statistics in Cove Creek, males aged under 5 years and females aged 6 to 11 years are the age groups that are most secure financially, with 100.0% of males and 100.0% of females in these age groups living above the poverty line.
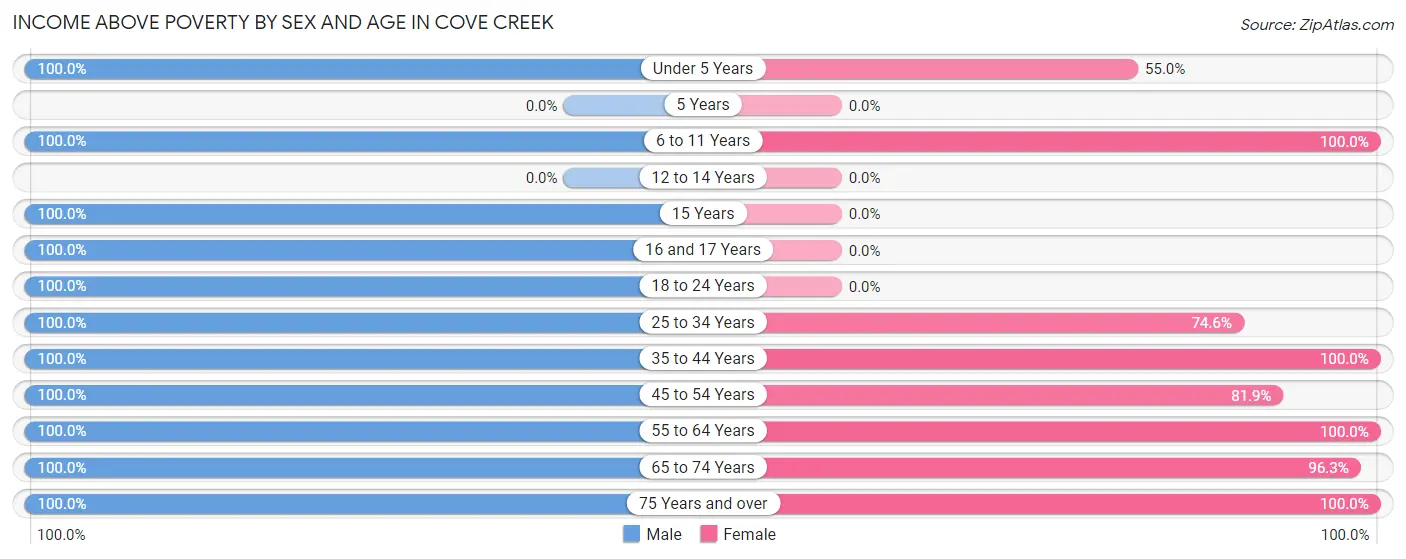
| Age Bracket | Male | Female |
| Under 5 Years | 33 (100.0%) | 22 (55.0%) |
| 5 Years | 0 (0.0%) | 0 (0.0%) |
| 6 to 11 Years | 28 (100.0%) | 5 (100.0%) |
| 12 to 14 Years | 0 (0.0%) | 0 (0.0%) |
| 15 Years | 29 (100.0%) | 0 (0.0%) |
| 16 and 17 Years | 16 (100.0%) | 0 (0.0%) |
| 18 to 24 Years | 47 (100.0%) | 0 (0.0%) |
| 25 to 34 Years | 45 (100.0%) | 47 (74.6%) |
| 35 to 44 Years | 132 (100.0%) | 109 (100.0%) |
| 45 to 54 Years | 112 (100.0%) | 59 (81.9%) |
| 55 to 64 Years | 64 (100.0%) | 113 (100.0%) |
| 65 to 74 Years | 177 (100.0%) | 181 (96.3%) |
| 75 Years and over | 37 (100.0%) | 24 (100.0%) |
| Total | 720 (100.0%) | 560 (88.3%) |
Income Below Poverty Among Married-Couple Families in Cove Creek
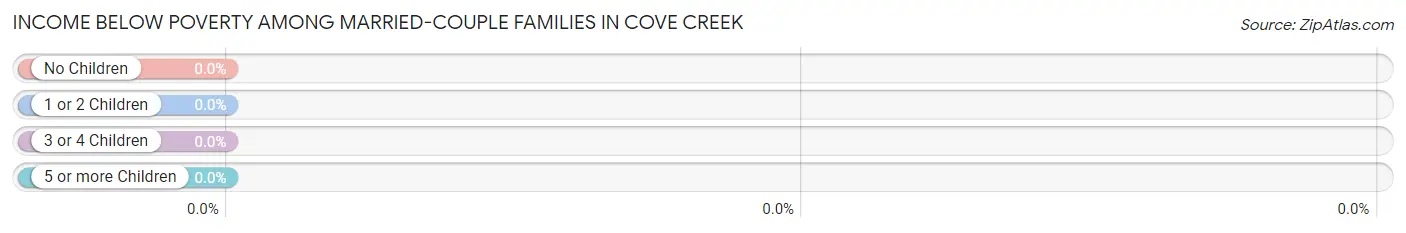
| Children | Above Poverty | Below Poverty |
| No Children | 273 (100.0%) | 0 (0.0%) |
| 1 or 2 Children | 94 (100.0%) | 0 (0.0%) |
| 3 or 4 Children | 0 (0.0%) | 0 (0.0%) |
| 5 or more Children | 0 (0.0%) | 0 (0.0%) |
| Total | 367 (100.0%) | 0 (0.0%) |
Income Below Poverty Among Single-Parent Households in Cove Creek
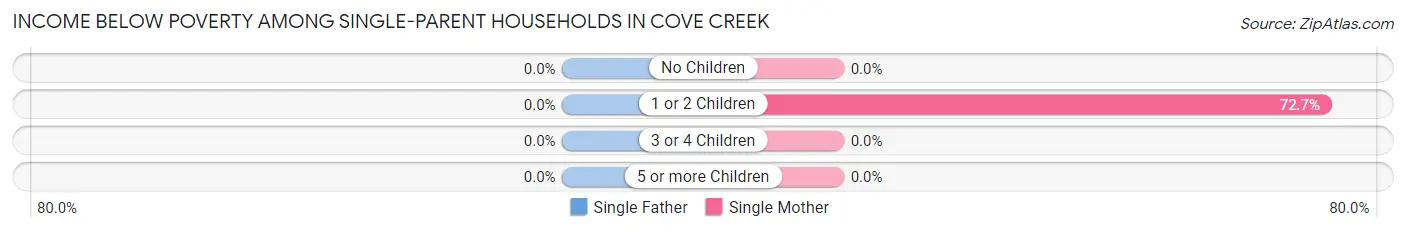
| Children | Single Father | Single Mother |
| No Children | 0 (0.0%) | 0 (0.0%) |
| 1 or 2 Children | 0 (0.0%) | 16 (72.7%) |
| 3 or 4 Children | 0 (0.0%) | 0 (0.0%) |
| 5 or more Children | 0 (0.0%) | 0 (0.0%) |
| Total | 0 (0.0%) | 16 (72.7%) |
Income Below Poverty Among Married-Couple vs Single-Parent Households in Cove Creek
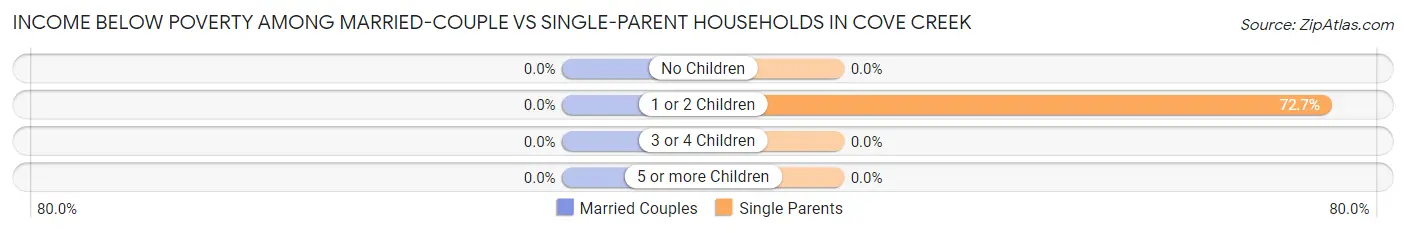
| Children | Married-Couple Families | Single-Parent Households |
| No Children | 0 (0.0%) | 0 (0.0%) |
| 1 or 2 Children | 0 (0.0%) | 16 (72.7%) |
| 3 or 4 Children | 0 (0.0%) | 0 (0.0%) |
| 5 or more Children | 0 (0.0%) | 0 (0.0%) |
| Total | 0 (0.0%) | 16 (35.6%) |
Race in Cove Creek
The most populous races in Cove Creek are White / Caucasian (1,241 | 91.6%), Hispanic or Latino (122 | 9.0%), and Some other Race (103 | 7.6%).
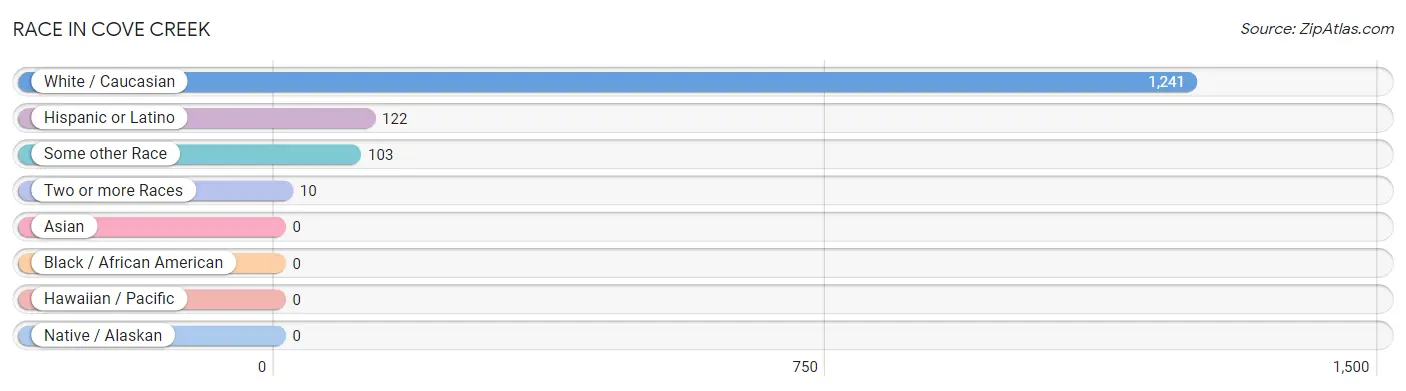
| Race | # Population | % Population |
| Asian | 0 | 0.0% |
| Black / African American | 0 | 0.0% |
| Hawaiian / Pacific | 0 | 0.0% |
| Hispanic or Latino | 122 | 9.0% |
| Native / Alaskan | 0 | 0.0% |
| White / Caucasian | 1,241 | 91.6% |
| Two or more Races | 10 | 0.7% |
| Some other Race | 103 | 7.6% |
| Total | 1,354 | 100.0% |
Ancestry in Cove Creek
The most populous ancestries reported in Cove Creek are English (327 | 24.1%), American (217 | 16.0%), German (207 | 15.3%), Scotch-Irish (127 | 9.4%), and Mexican (103 | 7.6%), together accounting for 72.5% of all Cove Creek residents.
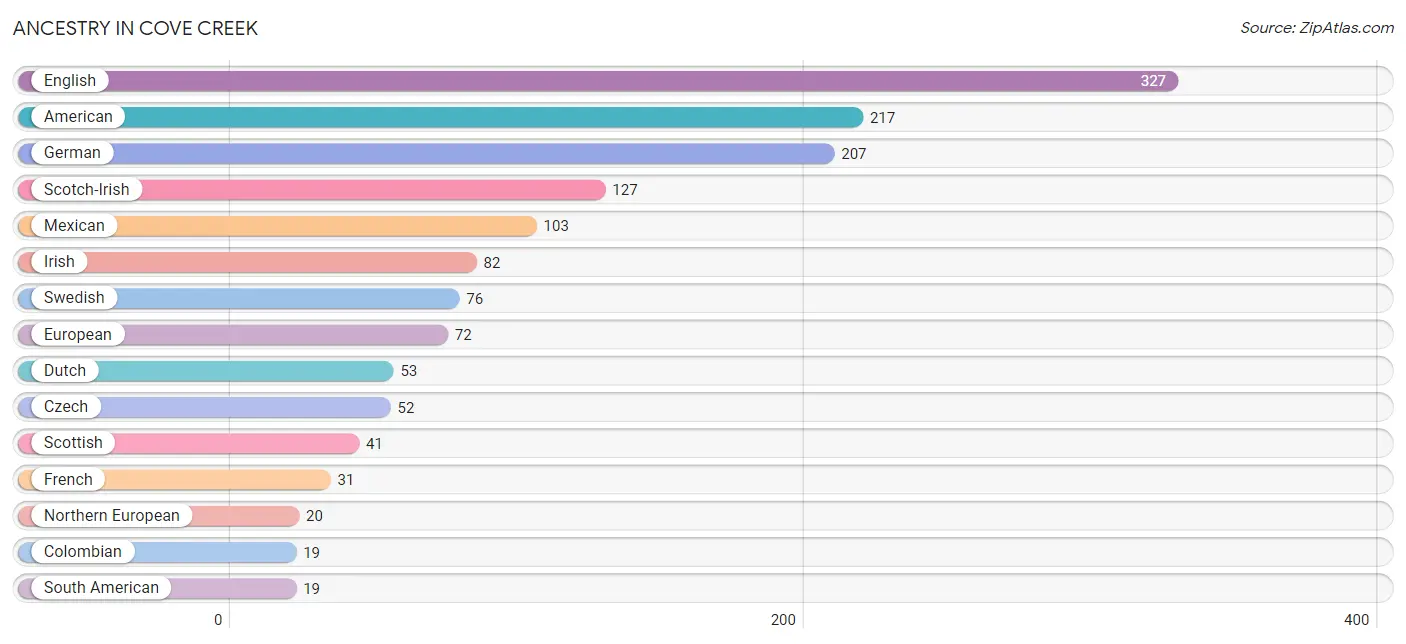
| Ancestry | # Population | % Population |
| American | 217 | 16.0% |
| British | 9 | 0.7% |
| Cherokee | 10 | 0.7% |
| Colombian | 19 | 1.4% |
| Czech | 52 | 3.8% |
| Dutch | 53 | 3.9% |
| English | 327 | 24.1% |
| European | 72 | 5.3% |
| French | 31 | 2.3% |
| German | 207 | 15.3% |
| Greek | 9 | 0.7% |
| Irish | 82 | 6.1% |
| Italian | 14 | 1.0% |
| Latvian | 6 | 0.4% |
| Mexican | 103 | 7.6% |
| Northern European | 20 | 1.5% |
| Scandinavian | 6 | 0.4% |
| Scotch-Irish | 127 | 9.4% |
| Scottish | 41 | 3.0% |
| South American | 19 | 1.4% |
| Swedish | 76 | 5.6% | View All 21 Rows |
Immigrants in Cove Creek
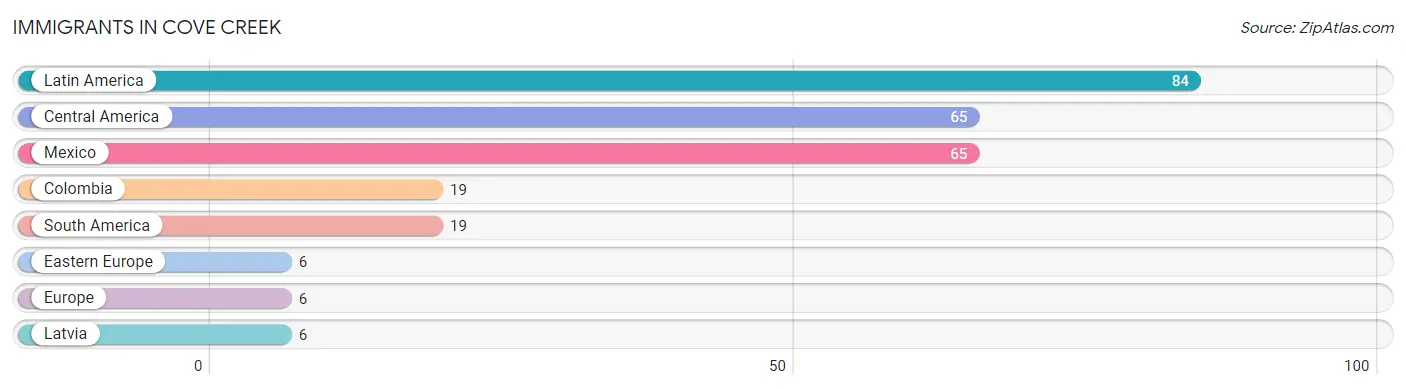
The most numerous immigrant groups reported in Cove Creek came from Latin America (84 | 6.2%), Central America (65 | 4.8%), Mexico (65 | 4.8%), Colombia (19 | 1.4%), and South America (19 | 1.4%), together accounting for 18.6% of all Cove Creek residents.
| Immigration Origin | # Population | % Population |
| Central America | 65 | 4.8% |
| Colombia | 19 | 1.4% |
| Eastern Europe | 6 | 0.4% |
| Europe | 6 | 0.4% |
| Latin America | 84 | 6.2% |
| Latvia | 6 | 0.4% |
| Mexico | 65 | 4.8% |
| South America | 19 | 1.4% | View All 8 Rows |
Sex and Age in Cove Creek
Sex and Age in Cove Creek
The most populous age groups in Cove Creek are 65 to 69 Years (134 | 18.6%) for men and 65 to 69 Years (139 | 21.9%) for women.
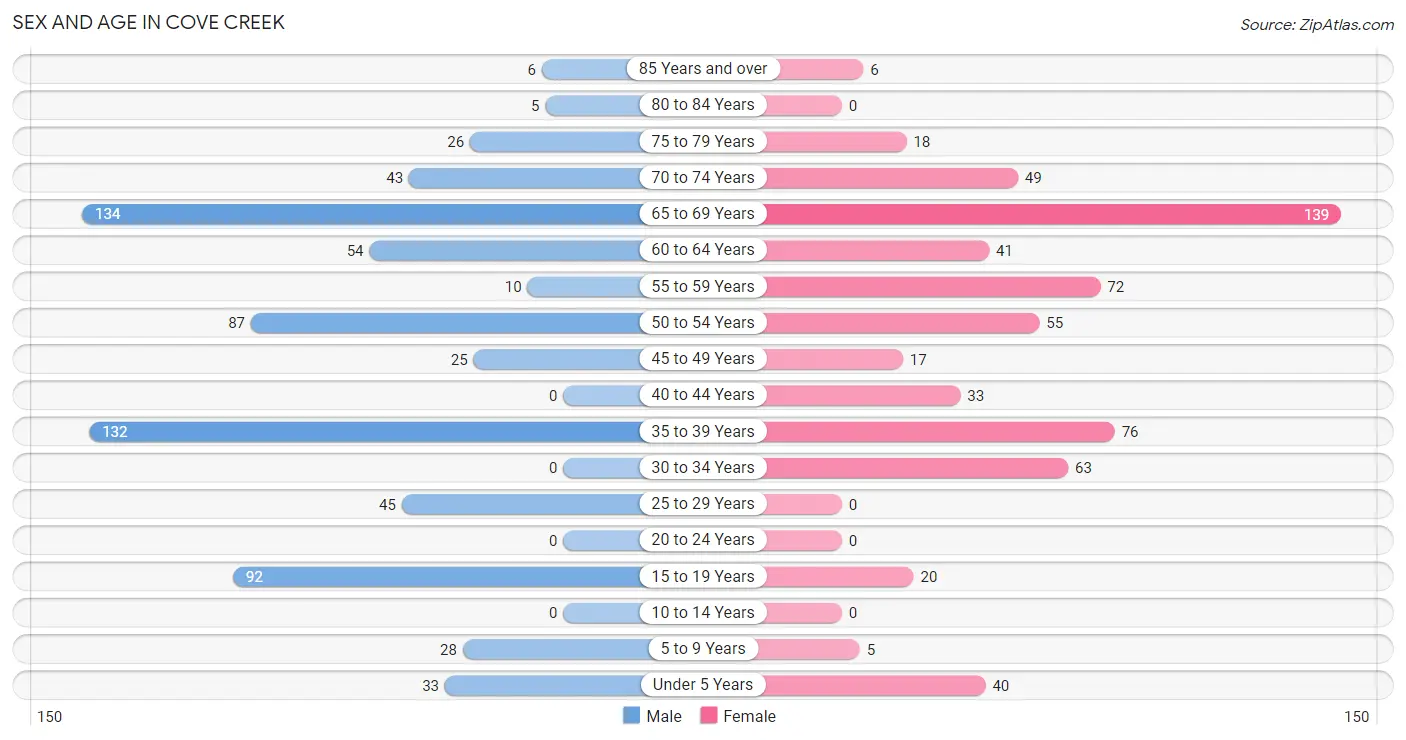
| Age Bracket | Male | Female |
| Under 5 Years | 33 (4.6%) | 40 (6.3%) |
| 5 to 9 Years | 28 (3.9%) | 5 (0.8%) |
| 10 to 14 Years | 0 (0.0%) | 0 (0.0%) |
| 15 to 19 Years | 92 (12.8%) | 20 (3.2%) |
| 20 to 24 Years | 0 (0.0%) | 0 (0.0%) |
| 25 to 29 Years | 45 (6.2%) | 0 (0.0%) |
| 30 to 34 Years | 0 (0.0%) | 63 (9.9%) |
| 35 to 39 Years | 132 (18.3%) | 76 (12.0%) |
| 40 to 44 Years | 0 (0.0%) | 33 (5.2%) |
| 45 to 49 Years | 25 (3.5%) | 17 (2.7%) |
| 50 to 54 Years | 87 (12.1%) | 55 (8.7%) |
| 55 to 59 Years | 10 (1.4%) | 72 (11.4%) |
| 60 to 64 Years | 54 (7.5%) | 41 (6.5%) |
| 65 to 69 Years | 134 (18.6%) | 139 (21.9%) |
| 70 to 74 Years | 43 (6.0%) | 49 (7.7%) |
| 75 to 79 Years | 26 (3.6%) | 18 (2.8%) |
| 80 to 84 Years | 5 (0.7%) | 0 (0.0%) |
| 85 Years and over | 6 (0.8%) | 6 (0.9%) |
| Total | 720 (100.0%) | 634 (100.0%) |
Families and Households in Cove Creek
Median Family Size in Cove Creek
The median family size in Cove Creek is 2.71 persons per family, with single female/mother families (22 | 5.3%) accounting for the largest median family size of 3.86 persons per family. On the other hand, married-couple families (367 | 89.1%) represent the smallest median family size with 2.61 persons per family.
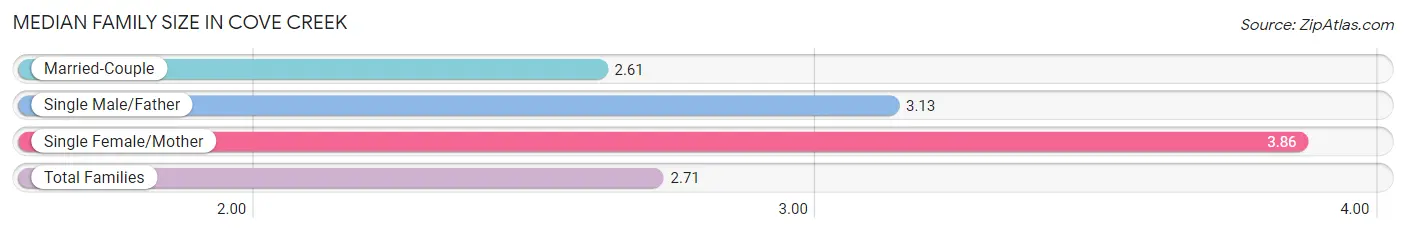
| Family Type | # Families | Family Size |
| Married-Couple | 367 (89.1%) | 2.61 |
| Single Male/Father | 23 (5.6%) | 3.13 |
| Single Female/Mother | 22 (5.3%) | 3.86 |
| Total Families | 412 (100.0%) | 2.71 |
Median Household Size in Cove Creek
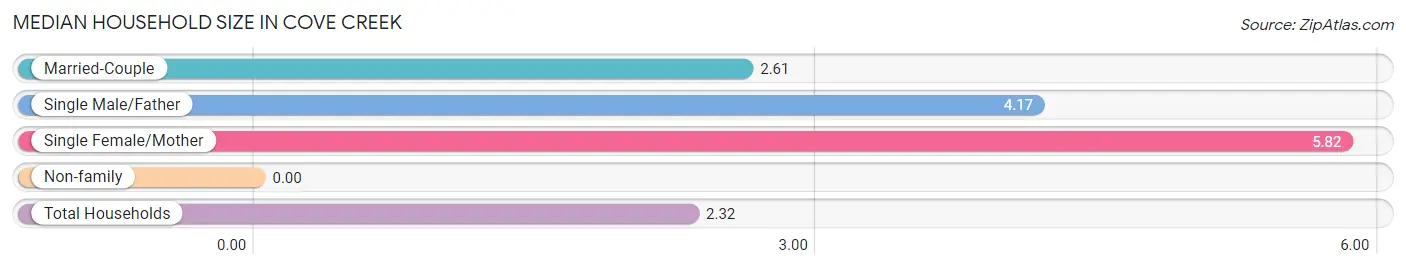
| Household Type | # Households | Household Size |
| Married-Couple | 367 (62.8%) | 2.61 |
| Single Male/Father | 23 (3.9%) | 4.17 |
| Single Female/Mother | 22 (3.8%) | 5.82 |
| Non-family | 172 (29.4%) | - |
| Total Households | 584 (100.0%) | 2.32 |
Household Size by Marriage Status in Cove Creek
Out of a total of 584 households in Cove Creek, 412 (70.6%) are family households, while 172 (29.4%) are nonfamily households. The most numerous type of family households are 2-person households, comprising 259, and the most common type of nonfamily households are 1-person households, comprising 172.
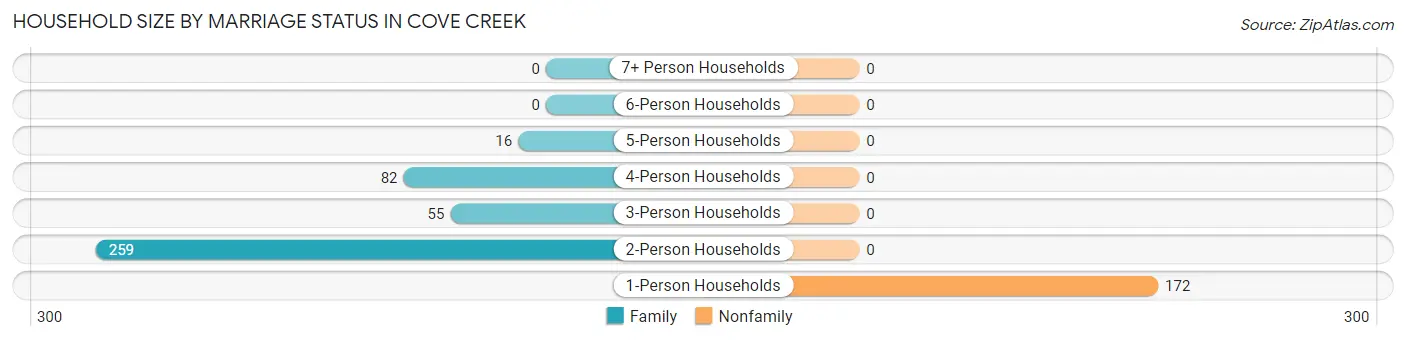
| Household Size | Family Households | Nonfamily Households |
| 1-Person Households | - | 172 (29.4%) |
| 2-Person Households | 259 (44.4%) | 0 (0.0%) |
| 3-Person Households | 55 (9.4%) | 0 (0.0%) |
| 4-Person Households | 82 (14.0%) | 0 (0.0%) |
| 5-Person Households | 16 (2.7%) | 0 (0.0%) |
| 6-Person Households | 0 (0.0%) | 0 (0.0%) |
| 7+ Person Households | 0 (0.0%) | 0 (0.0%) |
| Total | 412 (70.6%) | 172 (29.4%) |
Female Fertility in Cove Creek
Fertility by Age in Cove Creek
Average fertility rate in Cove Creek is 92.0 births per 1,000 women. Women in the age bracket of 20 to 34 years have the highest fertility rate with 349.0 births per 1,000 women. Women in the age bracket of 20 to 34 years acount for 100.0% of all women with births.
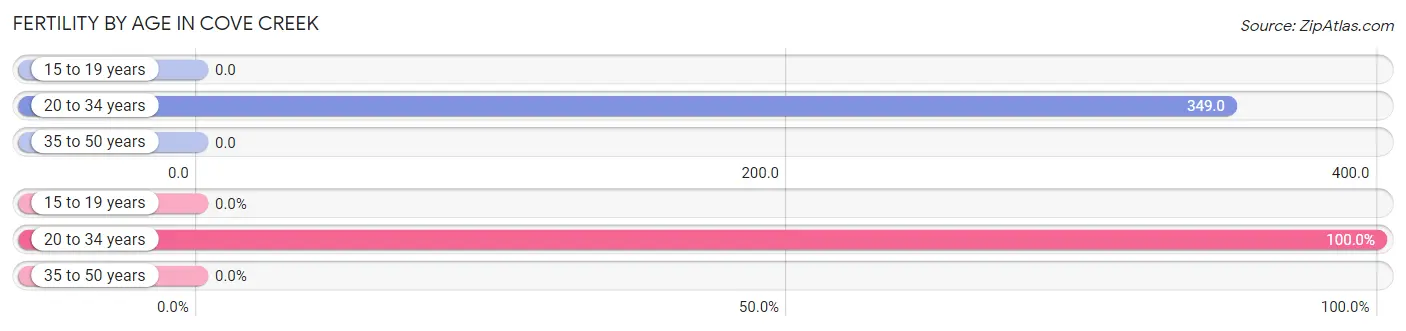
| Age Bracket | Women with Births | Births / 1,000 Women |
| 15 to 19 years | 0 (0.0%) | 0.0 |
| 20 to 34 years | 22 (100.0%) | 349.0 |
| 35 to 50 years | 0 (0.0%) | 0.0 |
| Total | 22 (100.0%) | 92.0 |
Fertility by Age by Marriage Status in Cove Creek
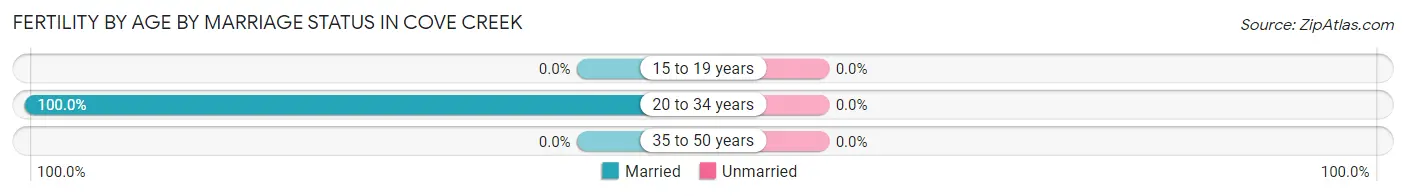
| Age Bracket | Married | Unmarried |
| 15 to 19 years | 0 (0.0%) | 0 (0.0%) |
| 20 to 34 years | 22 (100.0%) | 0 (0.0%) |
| 35 to 50 years | 0 (0.0%) | 0 (0.0%) |
| Total | 22 (100.0%) | 0 (0.0%) |
Fertility by Education in Cove Creek
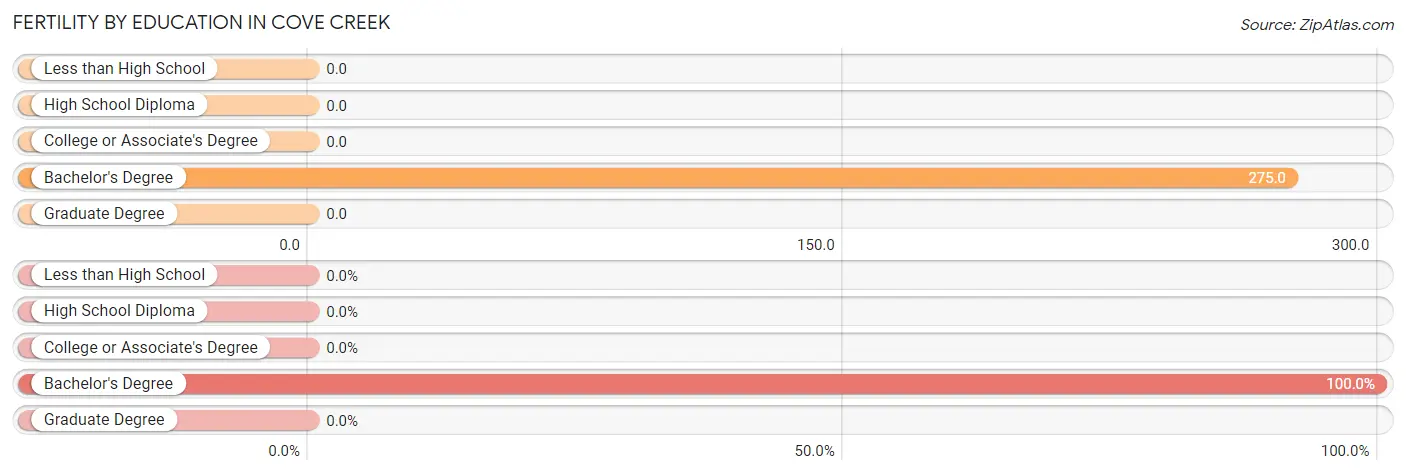
| Educational Attainment | Women with Births | Births / 1,000 Women |
| Less than High School | 0 (0.0%) | 0.0 |
| High School Diploma | 0 (0.0%) | 0.0 |
| College or Associate's Degree | 0 (0.0%) | 0.0 |
| Bachelor's Degree | 22 (100.0%) | 275.0 |
| Graduate Degree | 0 (0.0%) | 0.0 |
| Total | 22 (100.0%) | 92.0 |
Fertility by Education by Marriage Status in Cove Creek
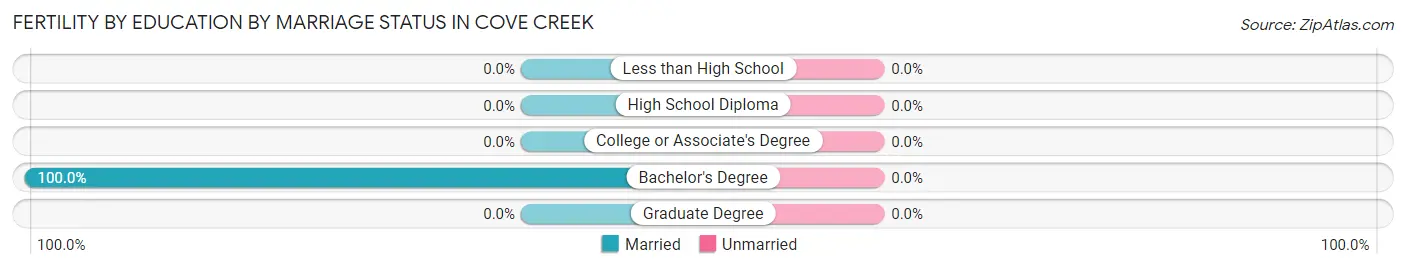
| Educational Attainment | Married | Unmarried |
| Less than High School | 0 (0.0%) | 0 (0.0%) |
| High School Diploma | 0 (0.0%) | 0 (0.0%) |
| College or Associate's Degree | 0 (0.0%) | 0 (0.0%) |
| Bachelor's Degree | 22 (100.0%) | 0 (0.0%) |
| Graduate Degree | 0 (0.0%) | 0 (0.0%) |
| Total | 22 (100.0%) | 0 (0.0%) |
Employment Characteristics in Cove Creek
Employment by Class of Employer in Cove Creek
Among the 773 employed individuals in Cove Creek, private company employees (377 | 48.8%), not-for-profit organizations (149 | 19.3%), and state government employees (79 | 10.2%) make up the most common classes of employment.
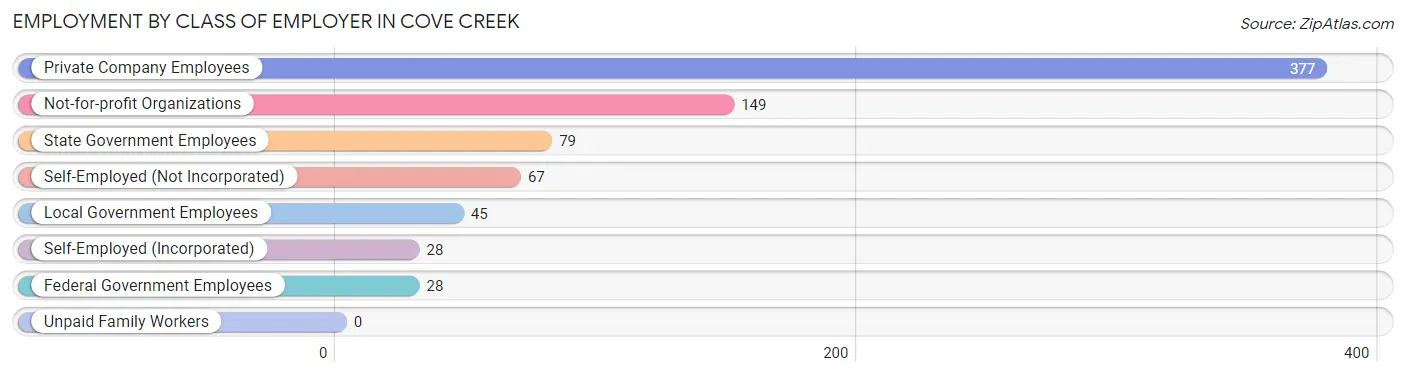
| Employer Class | # Employees | % Employees |
| Private Company Employees | 377 | 48.8% |
| Self-Employed (Incorporated) | 28 | 3.6% |
| Self-Employed (Not Incorporated) | 67 | 8.7% |
| Not-for-profit Organizations | 149 | 19.3% |
| Local Government Employees | 45 | 5.8% |
| State Government Employees | 79 | 10.2% |
| Federal Government Employees | 28 | 3.6% |
| Unpaid Family Workers | 0 | 0.0% |
| Total | 773 | 100.0% |
Employment Status by Age in Cove Creek
According to the labor force statistics for Cove Creek, out of the total population over 16 years of age (1,219), 74.4% or 907 individuals are in the labor force, with 1.1% or 10 of them unemployed. The age group with the highest labor force participation rate is 25 to 29 years, with 100.0% or 45 individuals in the labor force. Within the labor force, the 25 to 29 years age range has the highest percentage of unemployed individuals, with 22.2% or 10 of them being unemployed.
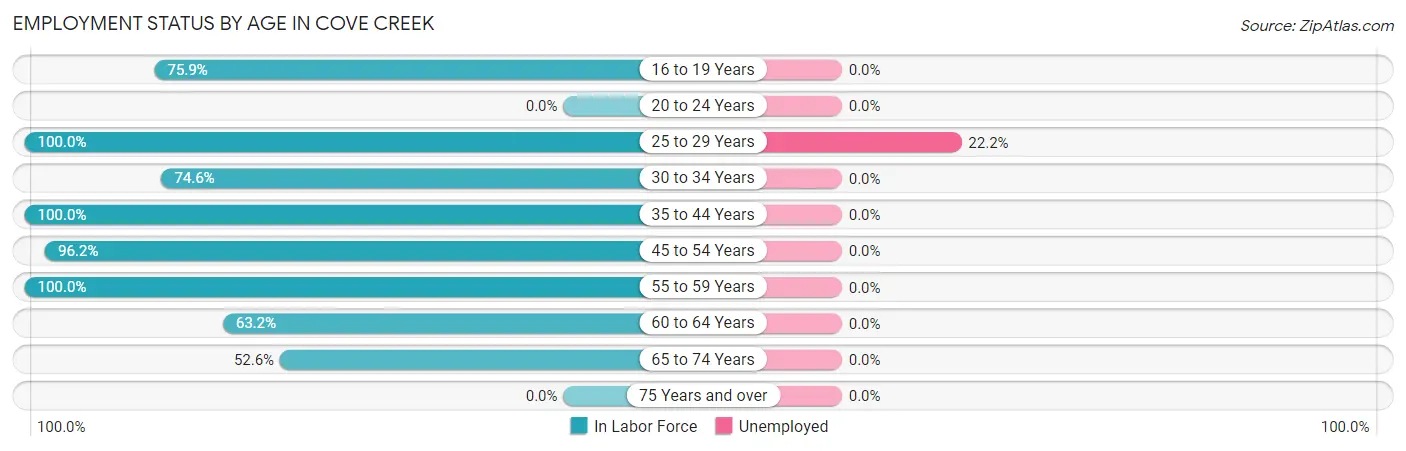
| Age Bracket | In Labor Force | Unemployed |
| 16 to 19 Years | 63 (75.9%) | 0 (0.0%) |
| 20 to 24 Years | 0 (0.0%) | 0 (0.0%) |
| 25 to 29 Years | 45 (100.0%) | 10 (22.2%) |
| 30 to 34 Years | 47 (74.6%) | 0 (0.0%) |
| 35 to 44 Years | 241 (100.0%) | 0 (0.0%) |
| 45 to 54 Years | 177 (96.2%) | 0 (0.0%) |
| 55 to 59 Years | 82 (100.0%) | 0 (0.0%) |
| 60 to 64 Years | 60 (63.2%) | 0 (0.0%) |
| 65 to 74 Years | 192 (52.6%) | 0 (0.0%) |
| 75 Years and over | 0 (0.0%) | 0 (0.0%) |
| Total | 907 (74.4%) | 10 (1.1%) |
Employment Status by Educational Attainment in Cove Creek
According to labor force statistics for Cove Creek, 91.8% of individuals (652) out of the total population between 25 and 64 years of age (710) are in the labor force, with 1.5% or 10 of them being unemployed. The group with the highest labor force participation rate are those with the educational attainment of less than high school, with 100.0% or 49 individuals in the labor force. Within the labor force, individuals with bachelor's degree or higher education have the highest percentage of unemployment, with 3.0% or 10 of them being unemployed.
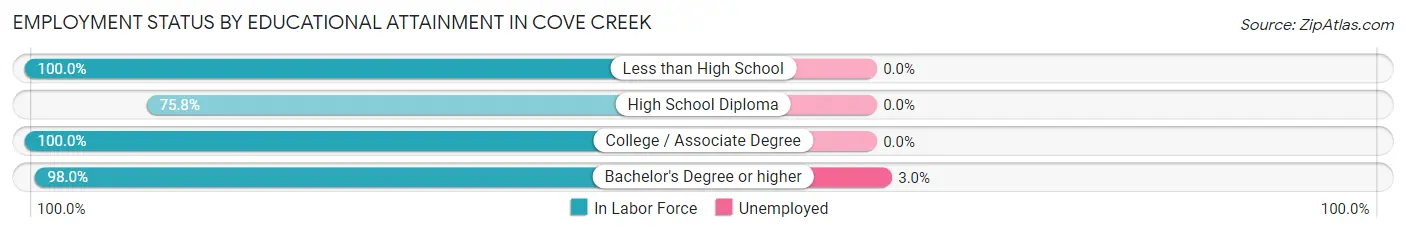
| Educational Attainment | In Labor Force | Unemployed |
| Less than High School | 49 (100.0%) | 0 (0.0%) |
| High School Diploma | 160 (75.8%) | 0 (0.0%) |
| College / Associate Degree | 106 (100.0%) | 0 (0.0%) |
| Bachelor's Degree or higher | 337 (98.0%) | 10 (3.0%) |
| Total | 652 (91.8%) | 11 (1.5%) |
Employment Occupations by Sex in Cove Creek
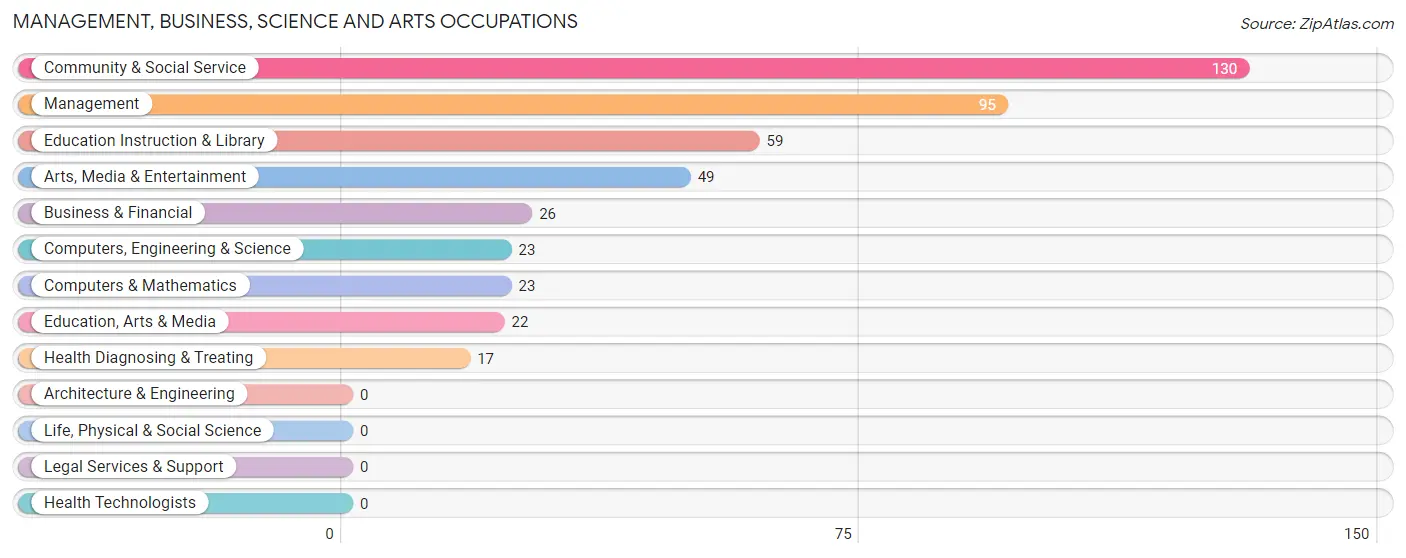
Management, Business, Science and Arts Occupations
The most common Management, Business, Science and Arts occupations in Cove Creek are Community & Social Service (130 | 14.5%), Management (95 | 10.6%), Education Instruction & Library (59 | 6.6%), Arts, Media & Entertainment (49 | 5.5%), and Business & Financial (26 | 2.9%).
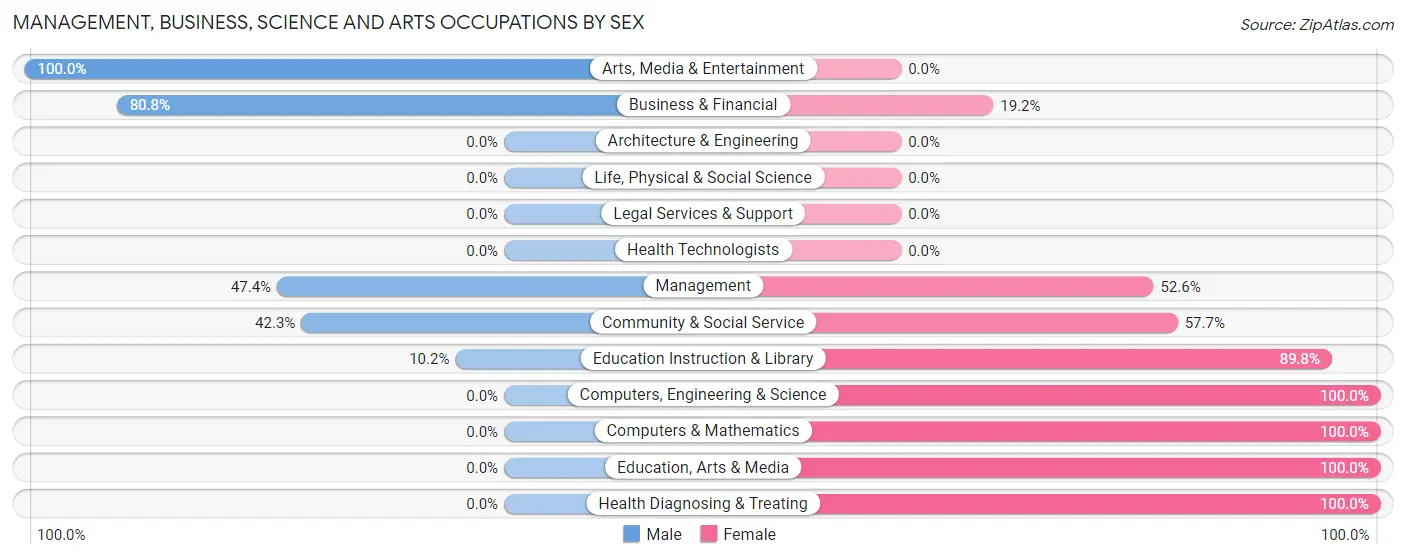
Management, Business, Science and Arts Occupations by Sex
Within the Management, Business, Science and Arts occupations in Cove Creek, the most male-oriented occupations are Arts, Media & Entertainment (100.0%), Business & Financial (80.8%), and Management (47.4%), while the most female-oriented occupations are Computers, Engineering & Science (100.0%), Computers & Mathematics (100.0%), and Education, Arts & Media (100.0%).
| Occupation | Male | Female |
| Management | 45 (47.4%) | 50 (52.6%) |
| Business & Financial | 21 (80.8%) | 5 (19.2%) |
| Computers, Engineering & Science | 0 (0.0%) | 23 (100.0%) |
| Computers & Mathematics | 0 (0.0%) | 23 (100.0%) |
| Architecture & Engineering | 0 (0.0%) | 0 (0.0%) |
| Life, Physical & Social Science | 0 (0.0%) | 0 (0.0%) |
| Community & Social Service | 55 (42.3%) | 75 (57.7%) |
| Education, Arts & Media | 0 (0.0%) | 22 (100.0%) |
| Legal Services & Support | 0 (0.0%) | 0 (0.0%) |
| Education Instruction & Library | 6 (10.2%) | 53 (89.8%) |
| Arts, Media & Entertainment | 49 (100.0%) | 0 (0.0%) |
| Health Diagnosing & Treating | 0 (0.0%) | 17 (100.0%) |
| Health Technologists | 0 (0.0%) | 0 (0.0%) |
| Total (Category) | 121 (41.6%) | 170 (58.4%) |
| Total (Overall) | 456 (50.8%) | 441 (49.2%) |
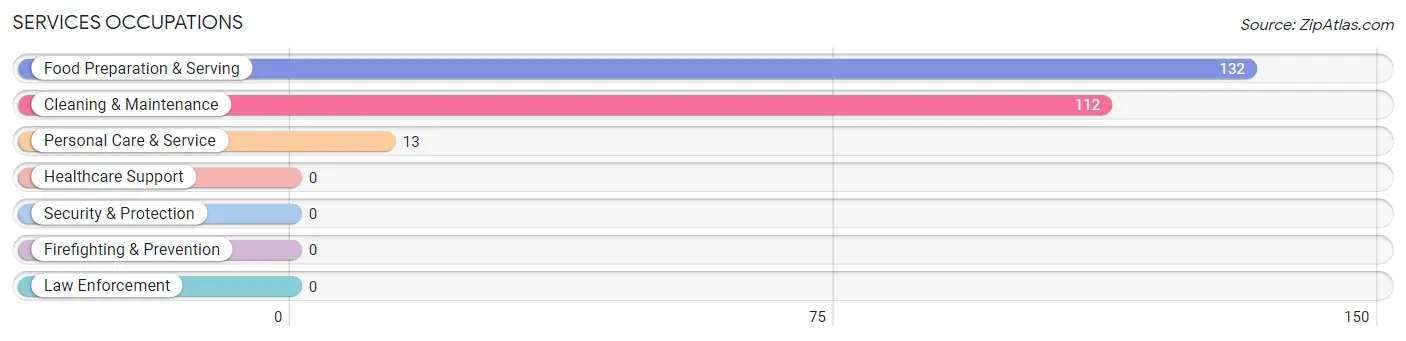
Services Occupations
The most common Services occupations in Cove Creek are Food Preparation & Serving (132 | 14.7%), Cleaning & Maintenance (112 | 12.5%), and Personal Care & Service (13 | 1.5%).
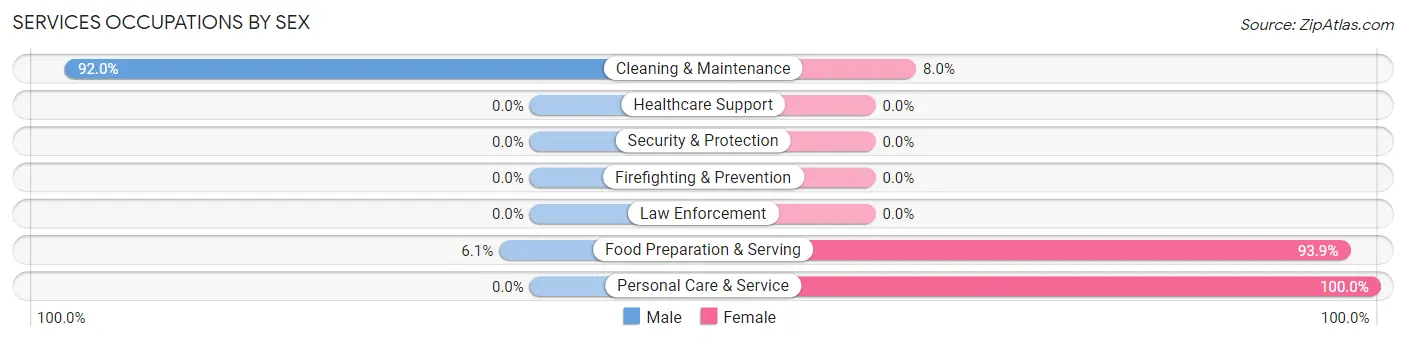
Services Occupations by Sex
Within the Services occupations in Cove Creek, the most male-oriented occupations are Cleaning & Maintenance (92.0%), and Food Preparation & Serving (6.1%), while the most female-oriented occupations are Personal Care & Service (100.0%), Food Preparation & Serving (93.9%), and Cleaning & Maintenance (8.0%).
| Occupation | Male | Female |
| Healthcare Support | 0 (0.0%) | 0 (0.0%) |
| Security & Protection | 0 (0.0%) | 0 (0.0%) |
| Firefighting & Prevention | 0 (0.0%) | 0 (0.0%) |
| Law Enforcement | 0 (0.0%) | 0 (0.0%) |
| Food Preparation & Serving | 8 (6.1%) | 124 (93.9%) |
| Cleaning & Maintenance | 103 (92.0%) | 9 (8.0%) |
| Personal Care & Service | 0 (0.0%) | 13 (100.0%) |
| Total (Category) | 111 (43.2%) | 146 (56.8%) |
| Total (Overall) | 456 (50.8%) | 441 (49.2%) |
Sales and Office Occupations
The most common Sales and Office occupations in Cove Creek are Office & Administration (108 | 12.0%), and Sales & Related (80 | 8.9%).

Sales and Office Occupations by Sex

| Occupation | Male | Female |
| Sales & Related | 80 (100.0%) | 0 (0.0%) |
| Office & Administration | 6 (5.6%) | 102 (94.4%) |
| Total (Category) | 86 (45.7%) | 102 (54.3%) |
| Total (Overall) | 456 (50.8%) | 441 (49.2%) |
Natural Resources, Construction and Maintenance Occupations
The most common Natural Resources, Construction and Maintenance occupations in Cove Creek are Installation, Maintenance & Repair (23 | 2.6%), and Construction & Extraction (6 | 0.7%).
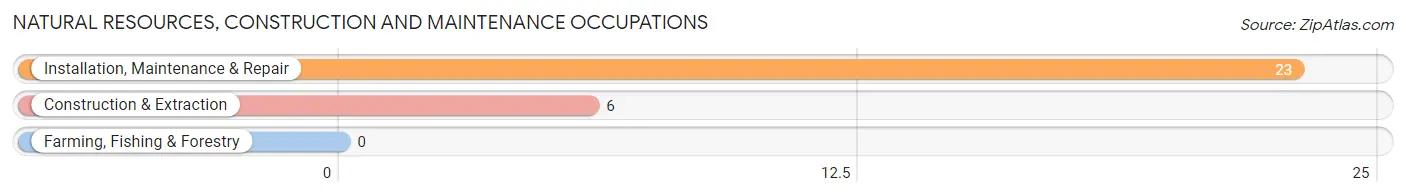
Natural Resources, Construction and Maintenance Occupations by Sex
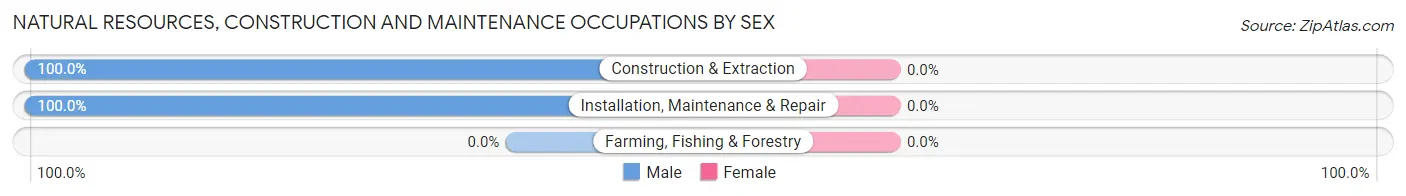
| Occupation | Male | Female |
| Farming, Fishing & Forestry | 0 (0.0%) | 0 (0.0%) |
| Construction & Extraction | 6 (100.0%) | 0 (0.0%) |
| Installation, Maintenance & Repair | 23 (100.0%) | 0 (0.0%) |
| Total (Category) | 29 (100.0%) | 0 (0.0%) |
| Total (Overall) | 456 (50.8%) | 441 (49.2%) |
Production, Transportation and Moving Occupations
The most common Production, Transportation and Moving occupations in Cove Creek are Production (48 | 5.3%), Transportation (46 | 5.1%), and Material Moving (38 | 4.2%).
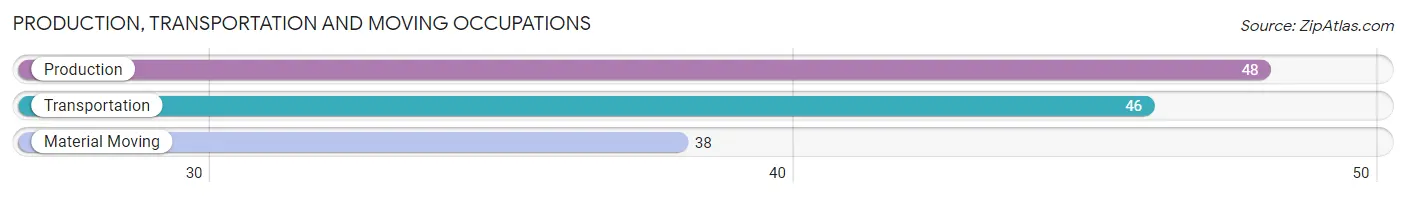
Production, Transportation and Moving Occupations by Sex
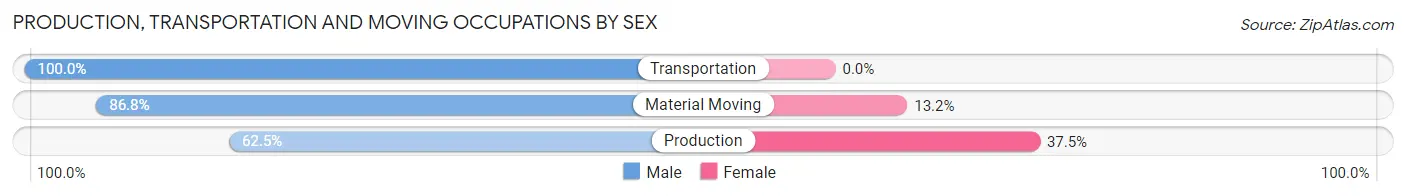
| Occupation | Male | Female |
| Production | 30 (62.5%) | 18 (37.5%) |
| Transportation | 46 (100.0%) | 0 (0.0%) |
| Material Moving | 33 (86.8%) | 5 (13.2%) |
| Total (Category) | 109 (82.6%) | 23 (17.4%) |
| Total (Overall) | 456 (50.8%) | 441 (49.2%) |
Employment Industries by Sex in Cove Creek
Employment Industries in Cove Creek
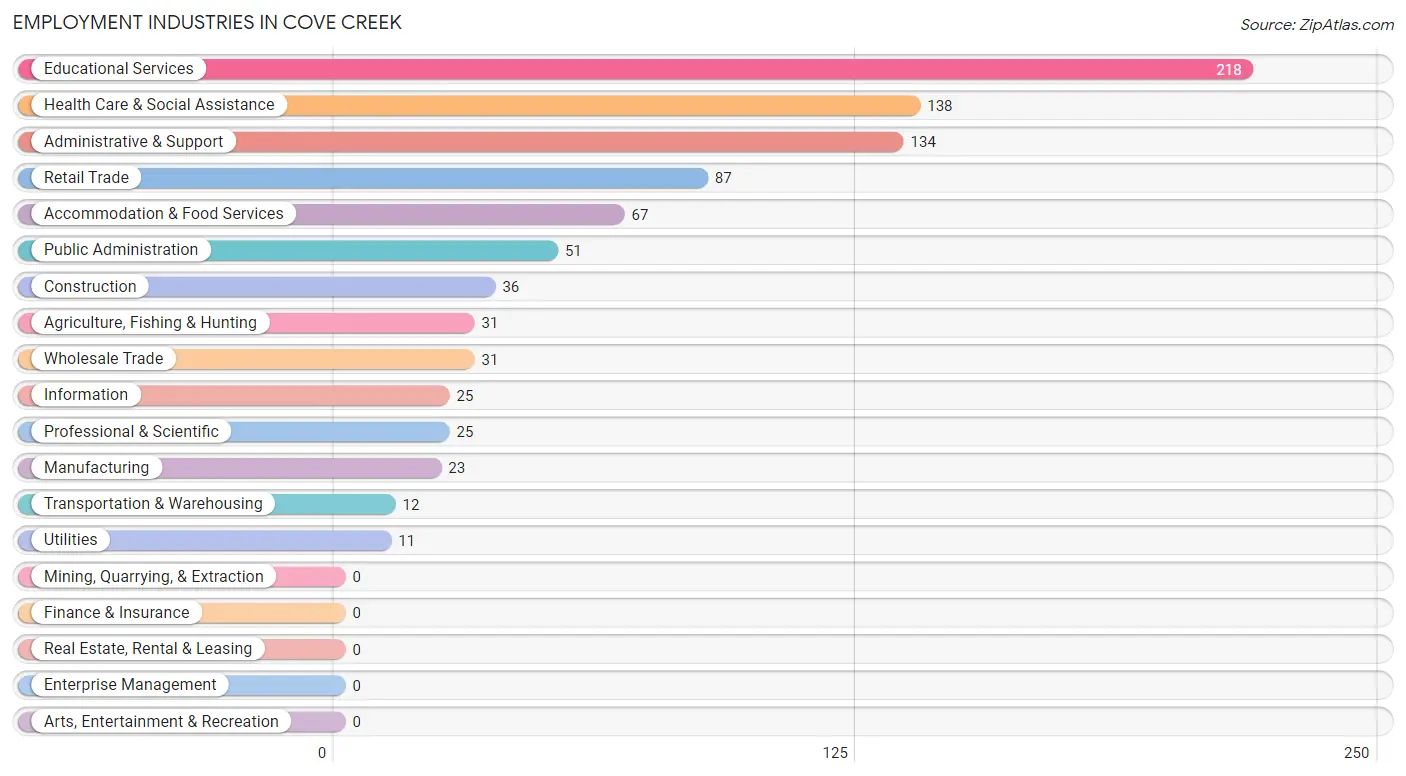
The major employment industries in Cove Creek include Educational Services (218 | 24.3%), Health Care & Social Assistance (138 | 15.4%), Administrative & Support (134 | 14.9%), Retail Trade (87 | 9.7%), and Accommodation & Food Services (67 | 7.5%).
Employment Industries by Sex in Cove Creek
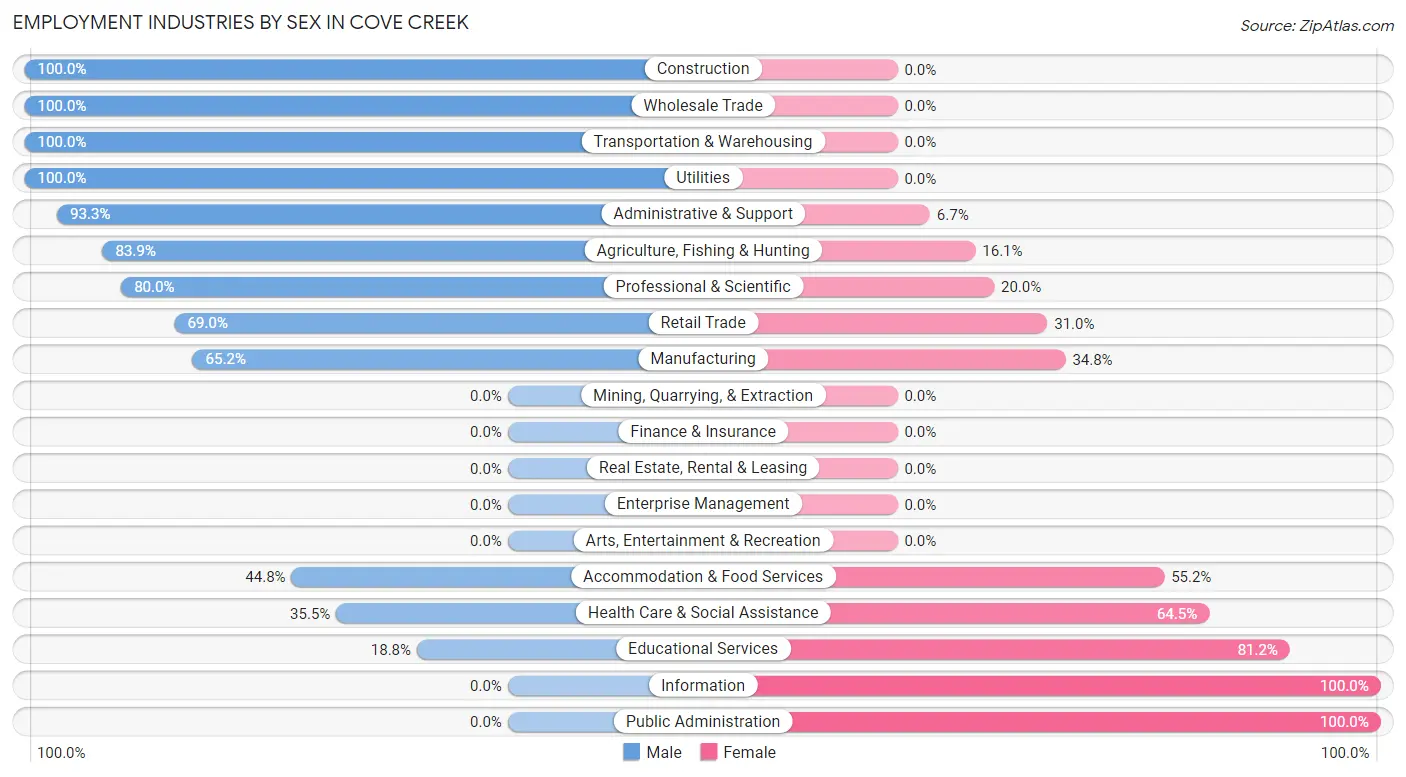
The Cove Creek industries that see more men than women are Construction (100.0%), Wholesale Trade (100.0%), and Transportation & Warehousing (100.0%), whereas the industries that tend to have a higher number of women are Information (100.0%), Public Administration (100.0%), and Educational Services (81.2%).
| Industry | Male | Female |
| Agriculture, Fishing & Hunting | 26 (83.9%) | 5 (16.1%) |
| Mining, Quarrying, & Extraction | 0 (0.0%) | 0 (0.0%) |
| Construction | 36 (100.0%) | 0 (0.0%) |
| Manufacturing | 15 (65.2%) | 8 (34.8%) |
| Wholesale Trade | 31 (100.0%) | 0 (0.0%) |
| Retail Trade | 60 (69.0%) | 27 (31.0%) |
| Transportation & Warehousing | 12 (100.0%) | 0 (0.0%) |
| Utilities | 11 (100.0%) | 0 (0.0%) |
| Information | 0 (0.0%) | 25 (100.0%) |
| Finance & Insurance | 0 (0.0%) | 0 (0.0%) |
| Real Estate, Rental & Leasing | 0 (0.0%) | 0 (0.0%) |
| Professional & Scientific | 20 (80.0%) | 5 (20.0%) |
| Enterprise Management | 0 (0.0%) | 0 (0.0%) |
| Administrative & Support | 125 (93.3%) | 9 (6.7%) |
| Educational Services | 41 (18.8%) | 177 (81.2%) |
| Health Care & Social Assistance | 49 (35.5%) | 89 (64.5%) |
| Arts, Entertainment & Recreation | 0 (0.0%) | 0 (0.0%) |
| Accommodation & Food Services | 30 (44.8%) | 37 (55.2%) |
| Public Administration | 0 (0.0%) | 51 (100.0%) |
| Total | 456 (50.8%) | 441 (49.2%) |
Education in Cove Creek
School Enrollment in Cove Creek
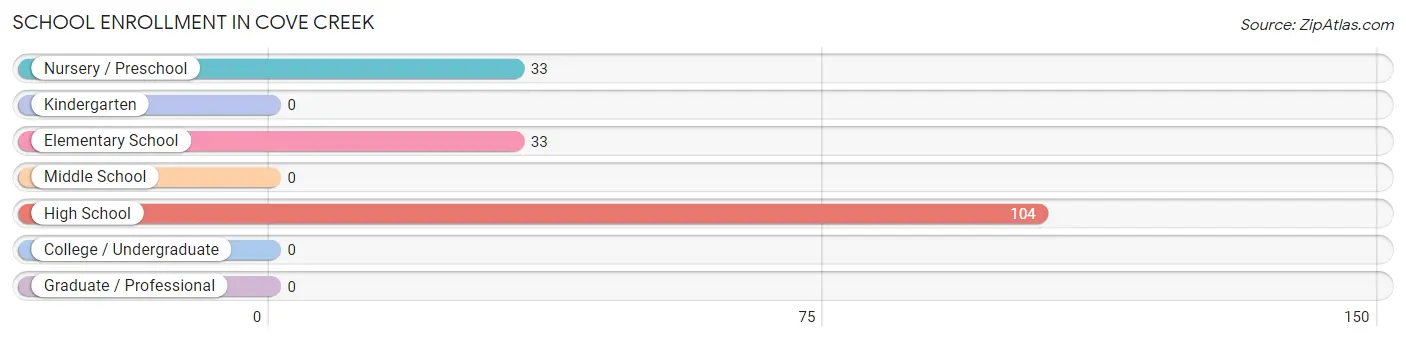
The most common levels of schooling among the 170 students in Cove Creek are high school (104 | 61.2%), nursery / preschool (33 | 19.4%), and elementary school (33 | 19.4%).
| School Level | # Students | % Students |
| Nursery / Preschool | 33 | 19.4% |
| Kindergarten | 0 | 0.0% |
| Elementary School | 33 | 19.4% |
| Middle School | 0 | 0.0% |
| High School | 104 | 61.2% |
| College / Undergraduate | 0 | 0.0% |
| Graduate / Professional | 0 | 0.0% |
| Total | 170 | 100.0% |
School Enrollment by Age by Funding Source in Cove Creek
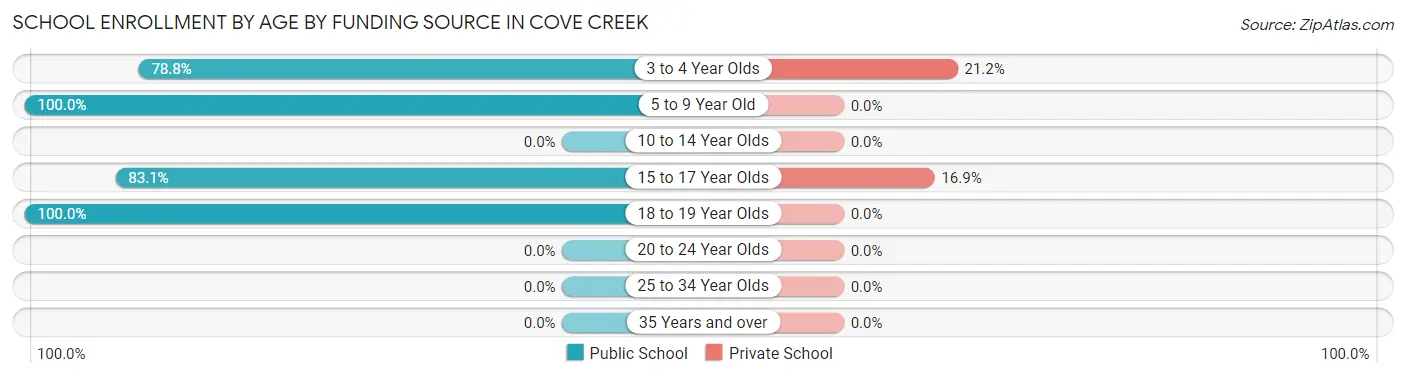
Out of a total of 170 students who are enrolled in schools in Cove Creek, 18 (10.6%) attend a private institution, while the remaining 152 (89.4%) are enrolled in public schools. The age group of 3 to 4 year olds has the highest likelihood of being enrolled in private schools, with 7 (21.2% in the age bracket) enrolled. Conversely, the age group of 5 to 9 year old has the lowest likelihood of being enrolled in a private school, with 33 (100.0% in the age bracket) attending a public institution.
| Age Bracket | Public School | Private School |
| 3 to 4 Year Olds | 26 (78.8%) | 7 (21.2%) |
| 5 to 9 Year Old | 33 (100.0%) | 0 (0.0%) |
| 10 to 14 Year Olds | 0 (0.0%) | 0 (0.0%) |
| 15 to 17 Year Olds | 54 (83.1%) | 11 (16.9%) |
| 18 to 19 Year Olds | 39 (100.0%) | 0 (0.0%) |
| 20 to 24 Year Olds | 0 (0.0%) | 0 (0.0%) |
| 25 to 34 Year Olds | 0 (0.0%) | 0 (0.0%) |
| 35 Years and over | 0 (0.0%) | 0 (0.0%) |
| Total | 152 (89.4%) | 18 (10.6%) |
Educational Attainment by Field of Study in Cove Creek
Education (92 | 18.1%), social sciences (77 | 15.1%), visual & performing arts (55 | 10.8%), literature & languages (54 | 10.6%), and computers & mathematics (48 | 9.4%) are the most common fields of study among 509 individuals in Cove Creek who have obtained a bachelor's degree or higher.
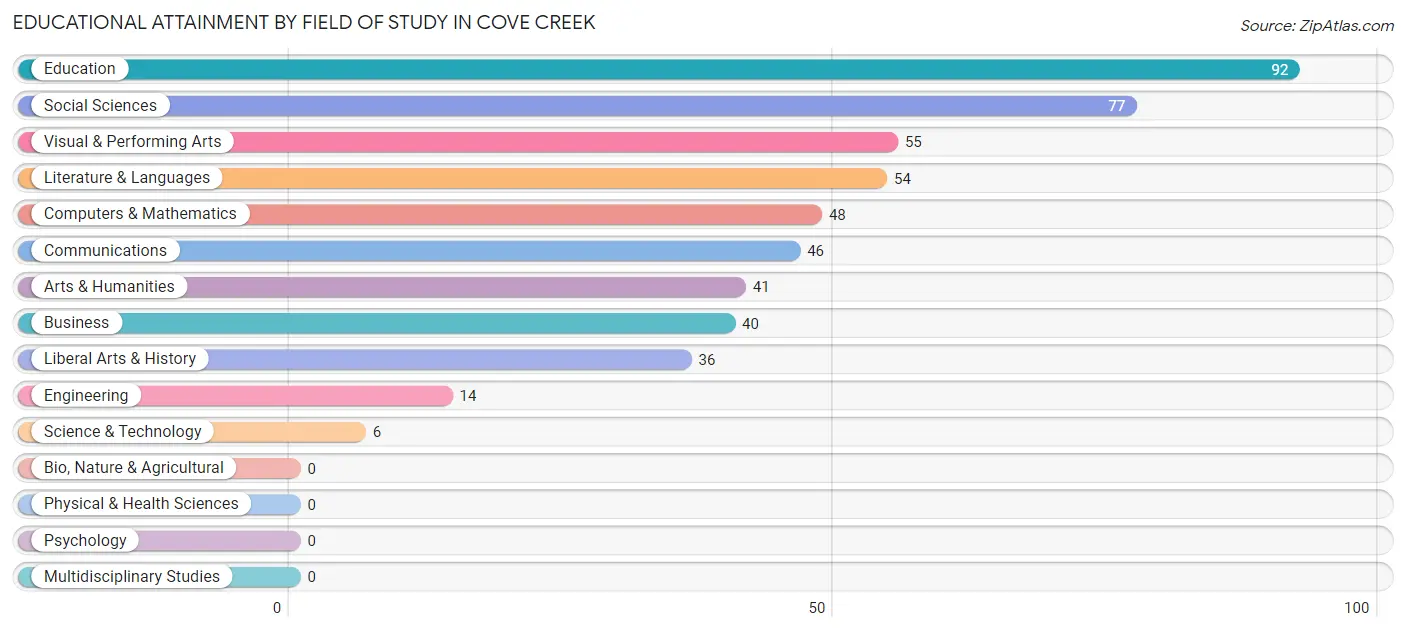
| Field of Study | # Graduates | % Graduates |
| Computers & Mathematics | 48 | 9.4% |
| Bio, Nature & Agricultural | 0 | 0.0% |
| Physical & Health Sciences | 0 | 0.0% |
| Psychology | 0 | 0.0% |
| Social Sciences | 77 | 15.1% |
| Engineering | 14 | 2.8% |
| Multidisciplinary Studies | 0 | 0.0% |
| Science & Technology | 6 | 1.2% |
| Business | 40 | 7.9% |
| Education | 92 | 18.1% |
| Literature & Languages | 54 | 10.6% |
| Liberal Arts & History | 36 | 7.1% |
| Visual & Performing Arts | 55 | 10.8% |
| Communications | 46 | 9.0% |
| Arts & Humanities | 41 | 8.1% |
| Total | 509 | 100.0% |
Transportation & Commute in Cove Creek
Vehicle Availability by Sex in Cove Creek
The most prevalent vehicle ownership categories in Cove Creek are males with 3 vehicles (221, accounting for 48.5%) and females with 3 vehicles (81, making up 69.7%).
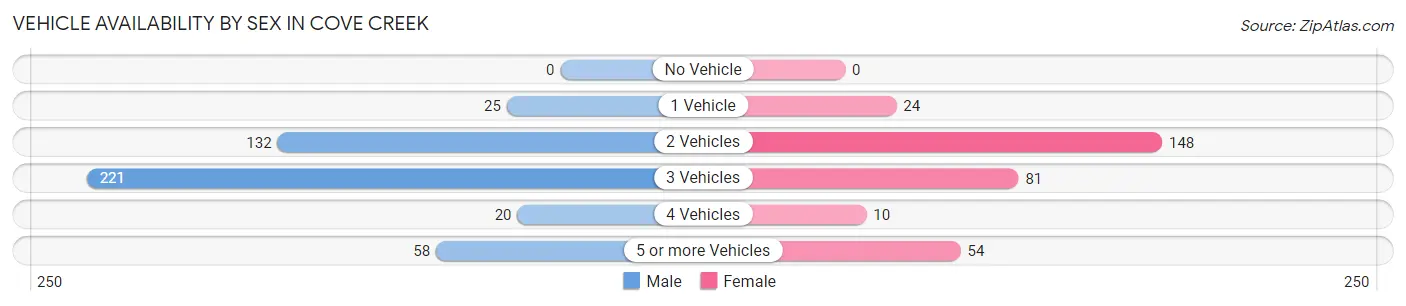
| Vehicles Available | Male | Female |
| No Vehicle | 0 (0.0%) | 0 (0.0%) |
| 1 Vehicle | 25 (5.5%) | 24 (7.6%) |
| 2 Vehicles | 132 (28.9%) | 148 (46.7%) |
| 3 Vehicles | 221 (48.5%) | 81 (25.6%) |
| 4 Vehicles | 20 (4.4%) | 10 (3.2%) |
| 5 or more Vehicles | 58 (12.7%) | 54 (17.0%) |
| Total | 456 (100.0%) | 317 (100.0%) |
Commute Time in Cove Creek
The most frequently occuring commute durations in Cove Creek are 15 to 19 minutes (165 commuters, 25.3%), 20 to 24 minutes (81 commuters, 12.4%), and 10 to 14 minutes (73 commuters, 11.2%).
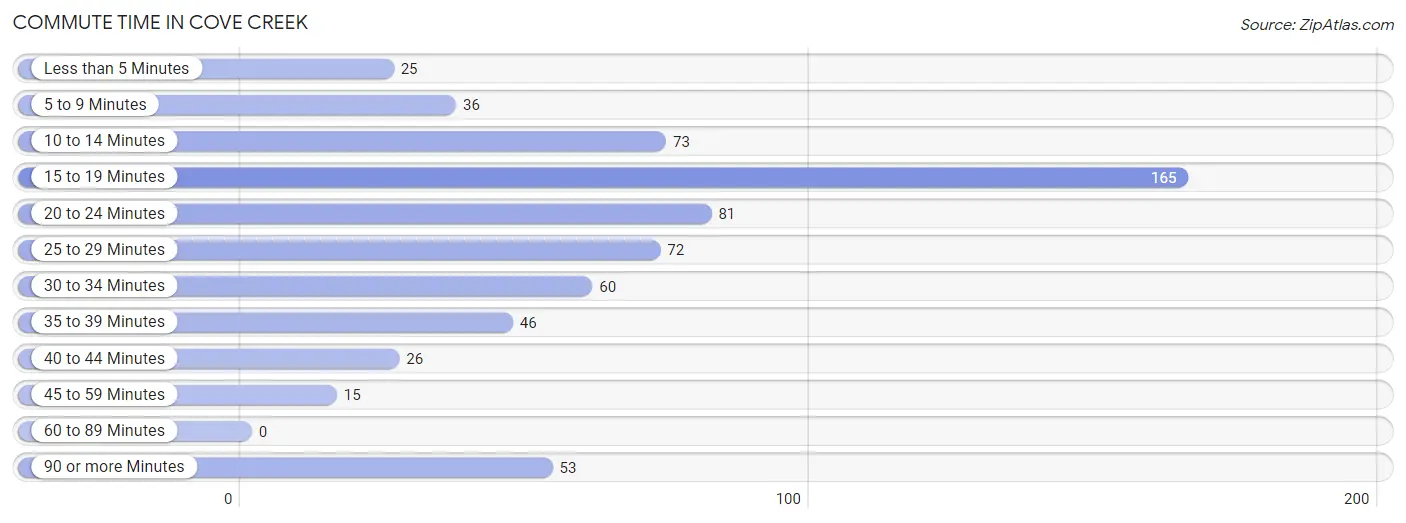
| Commute Time | # Commuters | % Commuters |
| Less than 5 Minutes | 25 | 3.8% |
| 5 to 9 Minutes | 36 | 5.5% |
| 10 to 14 Minutes | 73 | 11.2% |
| 15 to 19 Minutes | 165 | 25.3% |
| 20 to 24 Minutes | 81 | 12.4% |
| 25 to 29 Minutes | 72 | 11.0% |
| 30 to 34 Minutes | 60 | 9.2% |
| 35 to 39 Minutes | 46 | 7.1% |
| 40 to 44 Minutes | 26 | 4.0% |
| 45 to 59 Minutes | 15 | 2.3% |
| 60 to 89 Minutes | 0 | 0.0% |
| 90 or more Minutes | 53 | 8.1% |
Commute Time by Sex in Cove Creek
The most common commute times in Cove Creek are 15 to 19 minutes (122 commuters, 29.8%) for males and 25 to 29 minutes (55 commuters, 22.7%) for females.
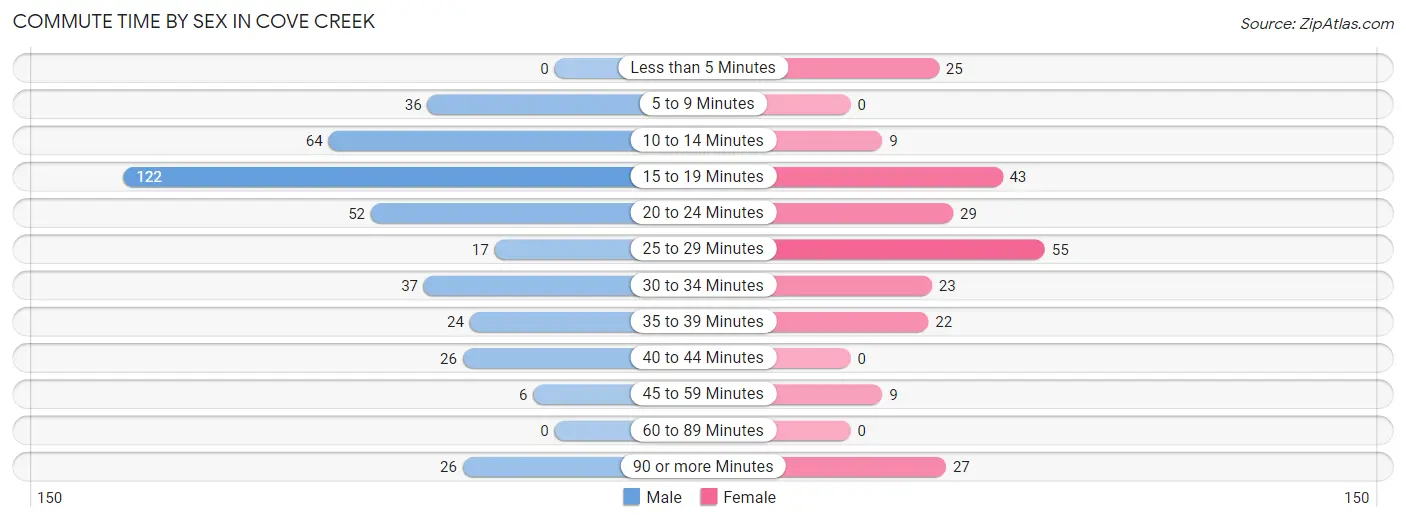
| Commute Time | Male | Female |
| Less than 5 Minutes | 0 (0.0%) | 25 (10.3%) |
| 5 to 9 Minutes | 36 (8.8%) | 0 (0.0%) |
| 10 to 14 Minutes | 64 (15.6%) | 9 (3.7%) |
| 15 to 19 Minutes | 122 (29.8%) | 43 (17.8%) |
| 20 to 24 Minutes | 52 (12.7%) | 29 (12.0%) |
| 25 to 29 Minutes | 17 (4.2%) | 55 (22.7%) |
| 30 to 34 Minutes | 37 (9.0%) | 23 (9.5%) |
| 35 to 39 Minutes | 24 (5.9%) | 22 (9.1%) |
| 40 to 44 Minutes | 26 (6.3%) | 0 (0.0%) |
| 45 to 59 Minutes | 6 (1.5%) | 9 (3.7%) |
| 60 to 89 Minutes | 0 (0.0%) | 0 (0.0%) |
| 90 or more Minutes | 26 (6.3%) | 27 (11.2%) |
Time of Departure to Work by Sex in Cove Creek
The most frequent times of departure to work in Cove Creek are 7:00 AM to 7:29 AM (109, 26.6%) for males and 7:00 AM to 7:29 AM (95, 39.3%) for females.
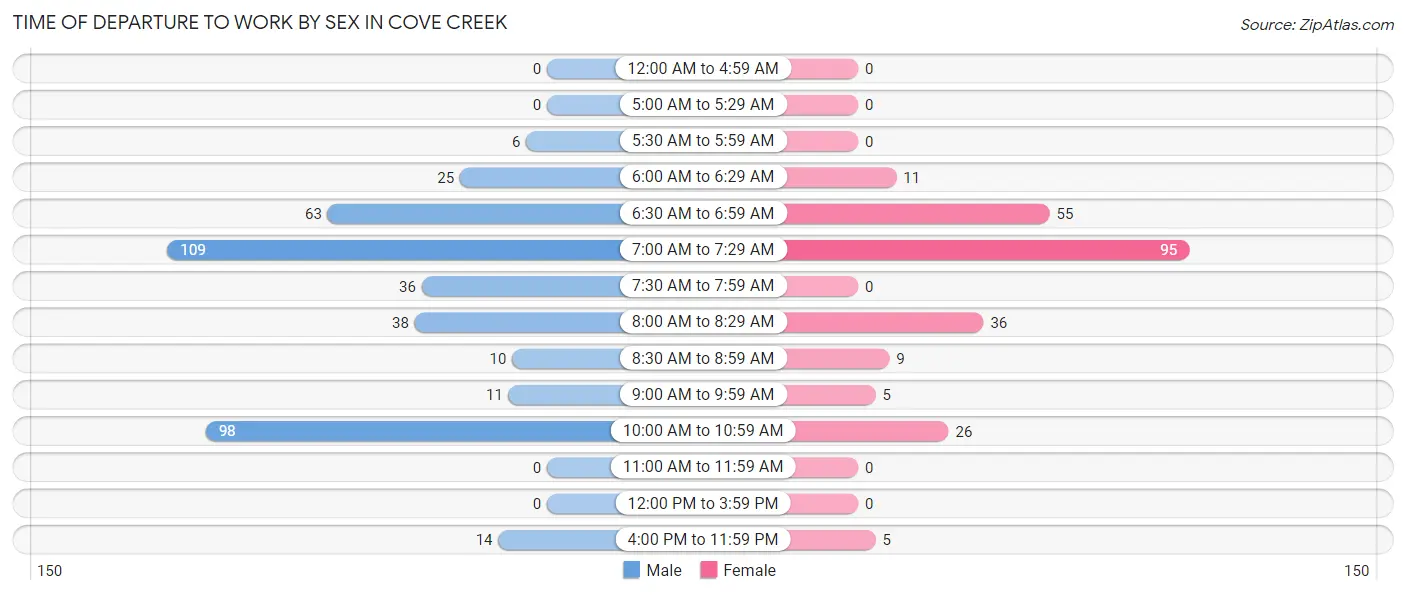
| Time of Departure | Male | Female |
| 12:00 AM to 4:59 AM | 0 (0.0%) | 0 (0.0%) |
| 5:00 AM to 5:29 AM | 0 (0.0%) | 0 (0.0%) |
| 5:30 AM to 5:59 AM | 6 (1.5%) | 0 (0.0%) |
| 6:00 AM to 6:29 AM | 25 (6.1%) | 11 (4.5%) |
| 6:30 AM to 6:59 AM | 63 (15.4%) | 55 (22.7%) |
| 7:00 AM to 7:29 AM | 109 (26.6%) | 95 (39.3%) |
| 7:30 AM to 7:59 AM | 36 (8.8%) | 0 (0.0%) |
| 8:00 AM to 8:29 AM | 38 (9.3%) | 36 (14.9%) |
| 8:30 AM to 8:59 AM | 10 (2.4%) | 9 (3.7%) |
| 9:00 AM to 9:59 AM | 11 (2.7%) | 5 (2.1%) |
| 10:00 AM to 10:59 AM | 98 (23.9%) | 26 (10.7%) |
| 11:00 AM to 11:59 AM | 0 (0.0%) | 0 (0.0%) |
| 12:00 PM to 3:59 PM | 0 (0.0%) | 0 (0.0%) |
| 4:00 PM to 11:59 PM | 14 (3.4%) | 5 (2.1%) |
| Total | 410 (100.0%) | 242 (100.0%) |
Housing Occupancy in Cove Creek
Occupancy by Ownership in Cove Creek
Of the total 584 dwellings in Cove Creek, owner-occupied units account for 544 (93.1%), while renter-occupied units make up 40 (6.9%).
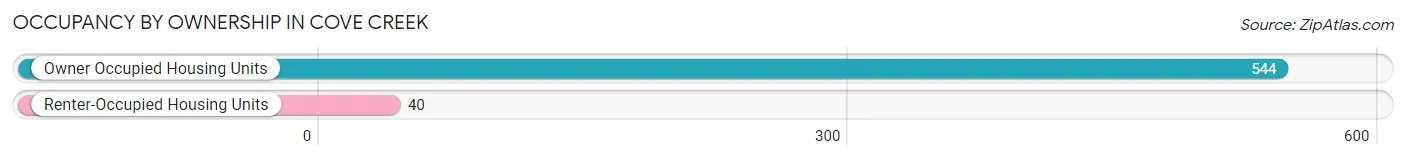
| Occupancy | # Housing Units | % Housing Units |
| Owner Occupied Housing Units | 544 | 93.1% |
| Renter-Occupied Housing Units | 40 | 6.9% |
| Total Occupied Housing Units | 584 | 100.0% |
Occupancy by Household Size in Cove Creek
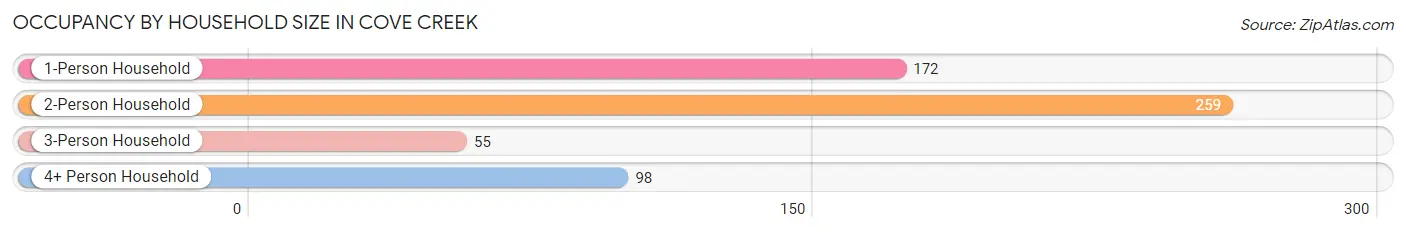
| Household Size | # Housing Units | % Housing Units |
| 1-Person Household | 172 | 29.4% |
| 2-Person Household | 259 | 44.4% |
| 3-Person Household | 55 | 9.4% |
| 4+ Person Household | 98 | 16.8% |
| Total Housing Units | 584 | 100.0% |
Occupancy by Ownership by Household Size in Cove Creek
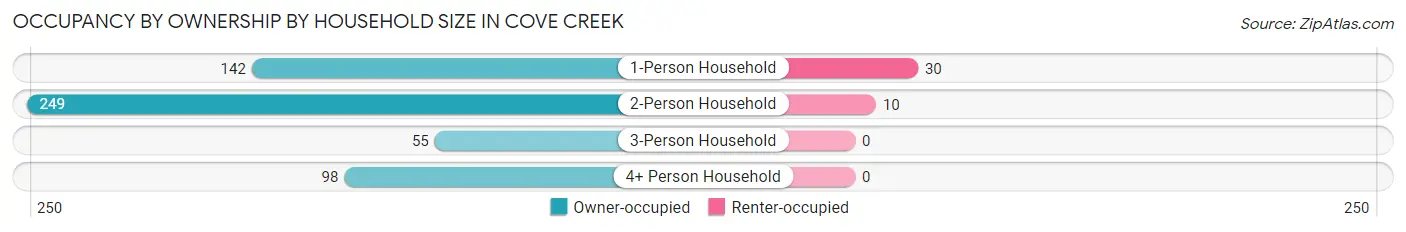
| Household Size | Owner-occupied | Renter-occupied |
| 1-Person Household | 142 (82.6%) | 30 (17.4%) |
| 2-Person Household | 249 (96.1%) | 10 (3.9%) |
| 3-Person Household | 55 (100.0%) | 0 (0.0%) |
| 4+ Person Household | 98 (100.0%) | 0 (0.0%) |
| Total Housing Units | 544 (93.1%) | 40 (6.9%) |
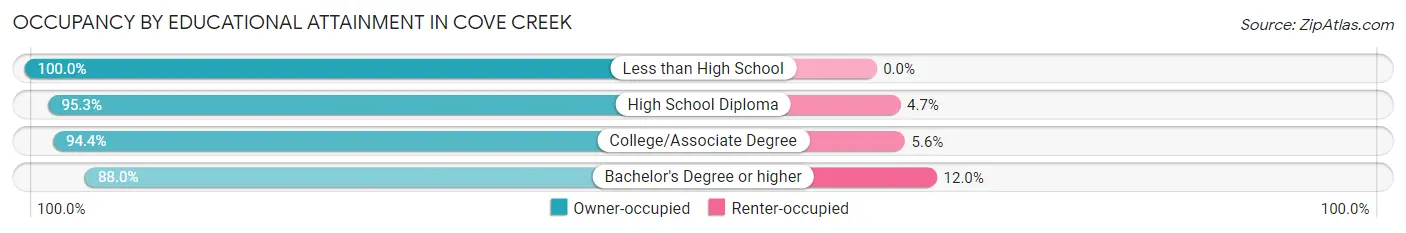
Occupancy by Educational Attainment in Cove Creek
| Household Size | Owner-occupied | Renter-occupied |
| Less than High School | 32 (100.0%) | 0 (0.0%) |
| High School Diploma | 181 (95.3%) | 9 (4.7%) |
| College/Associate Degree | 184 (94.4%) | 11 (5.6%) |
| Bachelor's Degree or higher | 147 (88.0%) | 20 (12.0%) |
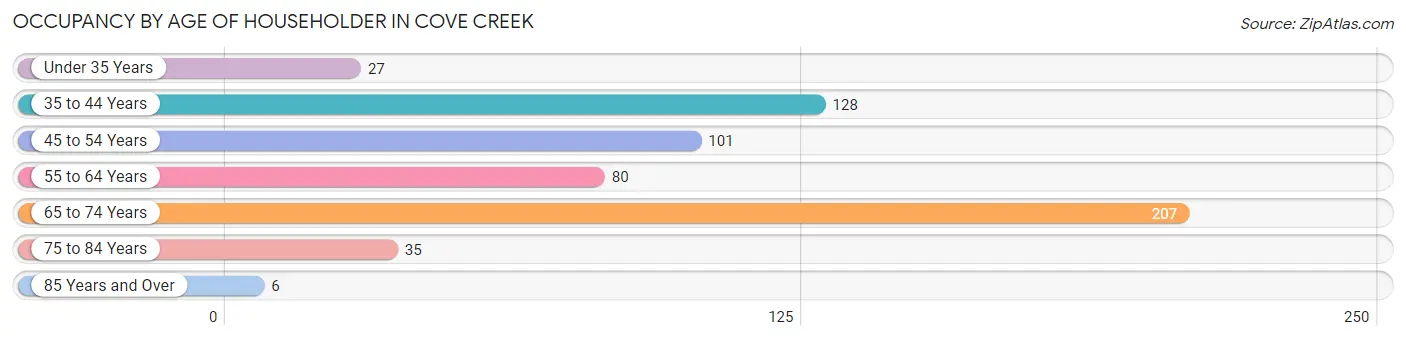
Occupancy by Age of Householder in Cove Creek
| Age Bracket | # Households | % Households |
| Under 35 Years | 27 | 4.6% |
| 35 to 44 Years | 128 | 21.9% |
| 45 to 54 Years | 101 | 17.3% |
| 55 to 64 Years | 80 | 13.7% |
| 65 to 74 Years | 207 | 35.4% |
| 75 to 84 Years | 35 | 6.0% |
| 85 Years and Over | 6 | 1.0% |
| Total | 584 | 100.0% |
Housing Finances in Cove Creek
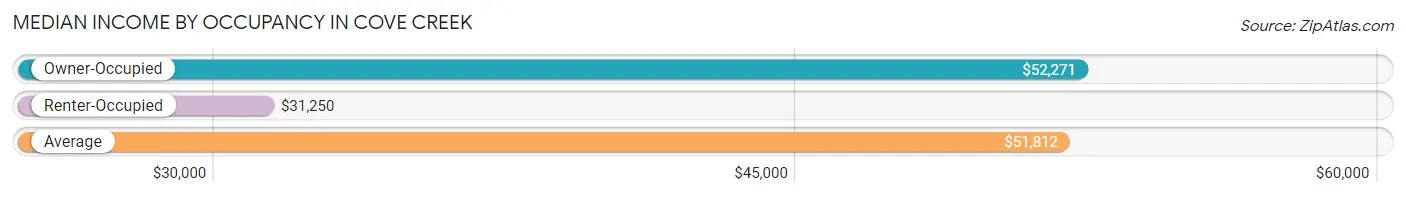
Median Income by Occupancy in Cove Creek
| Occupancy Type | # Households | Median Income |
| Owner-Occupied | 544 (93.1%) | $52,271 |
| Renter-Occupied | 40 (6.9%) | $31,250 |
| Average | 584 (100.0%) | $51,812 |
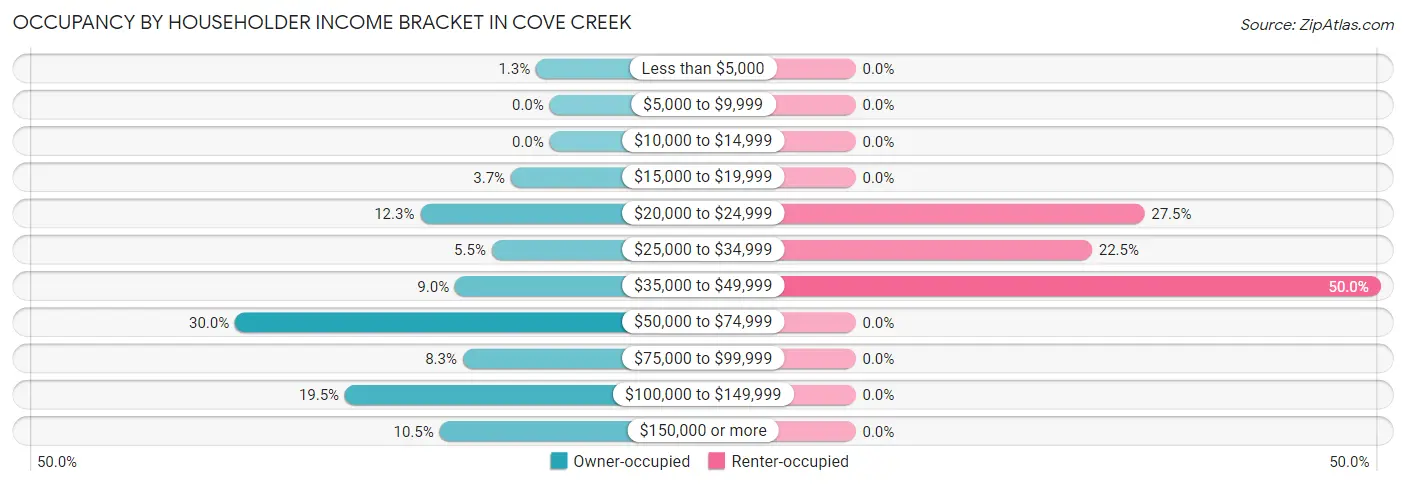
Occupancy by Householder Income Bracket in Cove Creek
| Income Bracket | Owner-occupied | Renter-occupied |
| Less than $5,000 | 7 (1.3%) | 0 (0.0%) |
| $5,000 to $9,999 | 0 (0.0%) | 0 (0.0%) |
| $10,000 to $14,999 | 0 (0.0%) | 0 (0.0%) |
| $15,000 to $19,999 | 20 (3.7%) | 0 (0.0%) |
| $20,000 to $24,999 | 67 (12.3%) | 11 (27.5%) |
| $25,000 to $34,999 | 30 (5.5%) | 9 (22.5%) |
| $35,000 to $49,999 | 49 (9.0%) | 20 (50.0%) |
| $50,000 to $74,999 | 163 (30.0%) | 0 (0.0%) |
| $75,000 to $99,999 | 45 (8.3%) | 0 (0.0%) |
| $100,000 to $149,999 | 106 (19.5%) | 0 (0.0%) |
| $150,000 or more | 57 (10.5%) | 0 (0.0%) |
| Total | 544 (100.0%) | 40 (100.0%) |
Monthly Housing Cost Tiers in Cove Creek
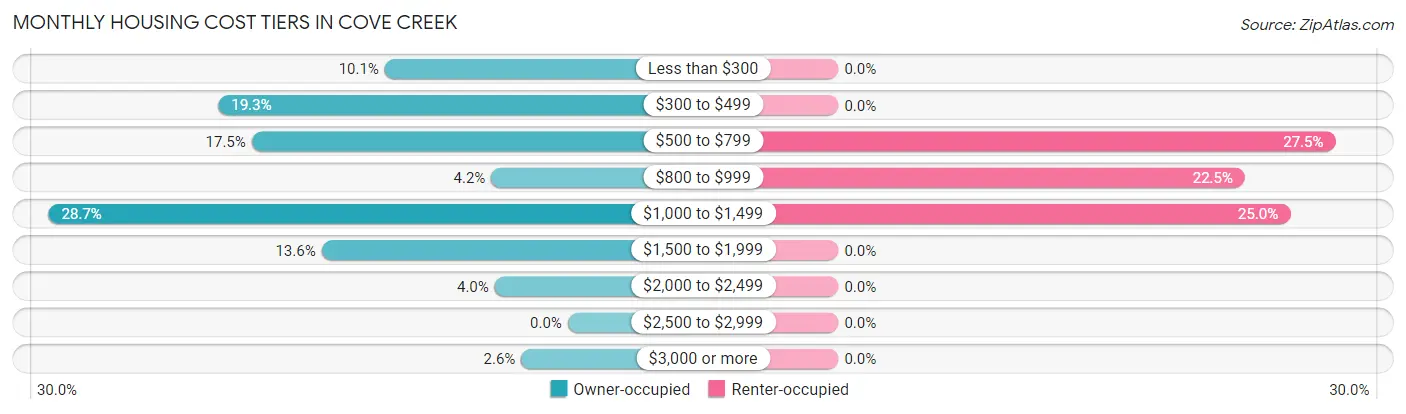
| Monthly Cost | Owner-occupied | Renter-occupied |
| Less than $300 | 55 (10.1%) | 0 (0.0%) |
| $300 to $499 | 105 (19.3%) | 0 (0.0%) |
| $500 to $799 | 95 (17.5%) | 11 (27.5%) |
| $800 to $999 | 23 (4.2%) | 9 (22.5%) |
| $1,000 to $1,499 | 156 (28.7%) | 10 (25.0%) |
| $1,500 to $1,999 | 74 (13.6%) | 0 (0.0%) |
| $2,000 to $2,499 | 22 (4.0%) | 0 (0.0%) |
| $2,500 to $2,999 | 0 (0.0%) | 0 (0.0%) |
| $3,000 or more | 14 (2.6%) | 0 (0.0%) |
| Total | 544 (100.0%) | 40 (100.0%) |
Physical Housing Characteristics in Cove Creek
Housing Structures in Cove Creek
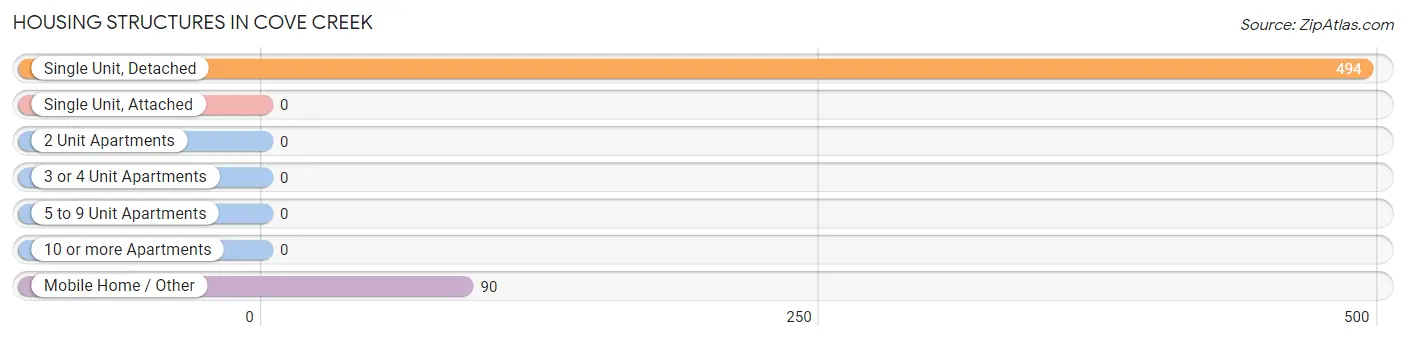
| Structure Type | # Housing Units | % Housing Units |
| Single Unit, Detached | 494 | 84.6% |
| Single Unit, Attached | 0 | 0.0% |
| 2 Unit Apartments | 0 | 0.0% |
| 3 or 4 Unit Apartments | 0 | 0.0% |
| 5 to 9 Unit Apartments | 0 | 0.0% |
| 10 or more Apartments | 0 | 0.0% |
| Mobile Home / Other | 90 | 15.4% |
| Total | 584 | 100.0% |
Housing Structures by Occupancy in Cove Creek
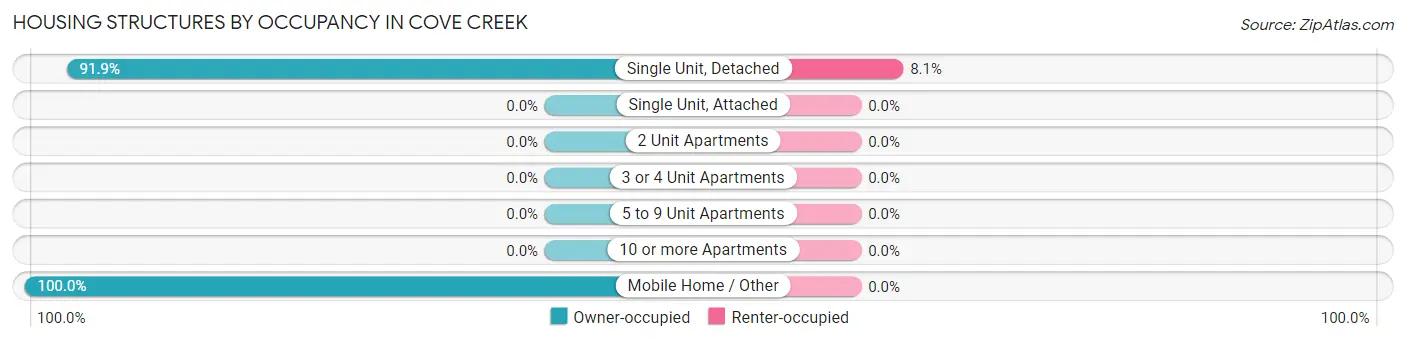
| Structure Type | Owner-occupied | Renter-occupied |
| Single Unit, Detached | 454 (91.9%) | 40 (8.1%) |
| Single Unit, Attached | 0 (0.0%) | 0 (0.0%) |
| 2 Unit Apartments | 0 (0.0%) | 0 (0.0%) |
| 3 or 4 Unit Apartments | 0 (0.0%) | 0 (0.0%) |
| 5 to 9 Unit Apartments | 0 (0.0%) | 0 (0.0%) |
| 10 or more Apartments | 0 (0.0%) | 0 (0.0%) |
| Mobile Home / Other | 90 (100.0%) | 0 (0.0%) |
| Total | 544 (93.1%) | 40 (6.9%) |
Housing Structures by Number of Rooms in Cove Creek
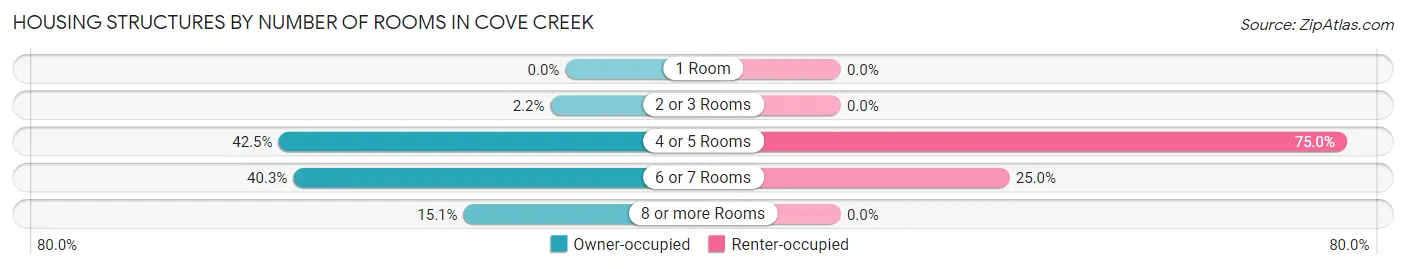
| Number of Rooms | Owner-occupied | Renter-occupied |
| 1 Room | 0 (0.0%) | 0 (0.0%) |
| 2 or 3 Rooms | 12 (2.2%) | 0 (0.0%) |
| 4 or 5 Rooms | 231 (42.5%) | 30 (75.0%) |
| 6 or 7 Rooms | 219 (40.3%) | 10 (25.0%) |
| 8 or more Rooms | 82 (15.1%) | 0 (0.0%) |
| Total | 544 (100.0%) | 40 (100.0%) |
Housing Structure by Heating Type in Cove Creek
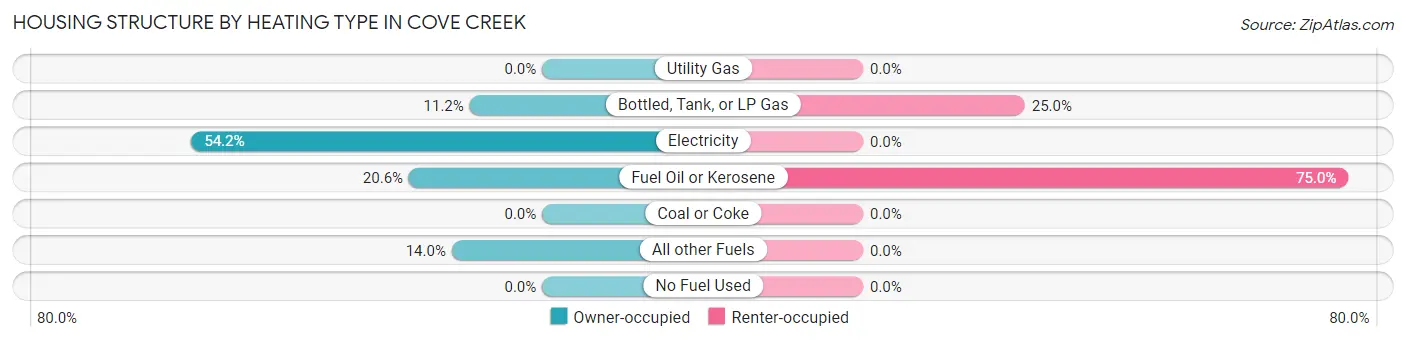
| Heating Type | Owner-occupied | Renter-occupied |
| Utility Gas | 0 (0.0%) | 0 (0.0%) |
| Bottled, Tank, or LP Gas | 61 (11.2%) | 10 (25.0%) |
| Electricity | 295 (54.2%) | 0 (0.0%) |
| Fuel Oil or Kerosene | 112 (20.6%) | 30 (75.0%) |
| Coal or Coke | 0 (0.0%) | 0 (0.0%) |
| All other Fuels | 76 (14.0%) | 0 (0.0%) |
| No Fuel Used | 0 (0.0%) | 0 (0.0%) |
| Total | 544 (100.0%) | 40 (100.0%) |
Household Vehicle Usage in Cove Creek
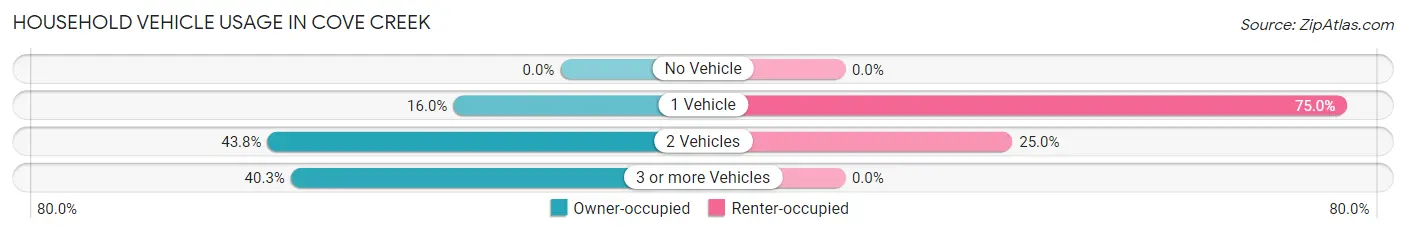
| Vehicles per Household | Owner-occupied | Renter-occupied |
| No Vehicle | 0 (0.0%) | 0 (0.0%) |
| 1 Vehicle | 87 (16.0%) | 30 (75.0%) |
| 2 Vehicles | 238 (43.8%) | 10 (25.0%) |
| 3 or more Vehicles | 219 (40.3%) | 0 (0.0%) |
| Total | 544 (100.0%) | 40 (100.0%) |
Real Estate & Mortgages in Cove Creek
Real Estate and Mortgage Overview in Cove Creek
| Characteristic | Without Mortgage | With Mortgage |
| Housing Units | 168 | 376 |
| Median Property Value | $143,400 | $249,500 |
| Median Household Income | $29,286 | $52 |
| Monthly Housing Costs | $334 | $14 |
| Real Estate Taxes | $926 | $0 |
Property Value by Mortgage Status in Cove Creek
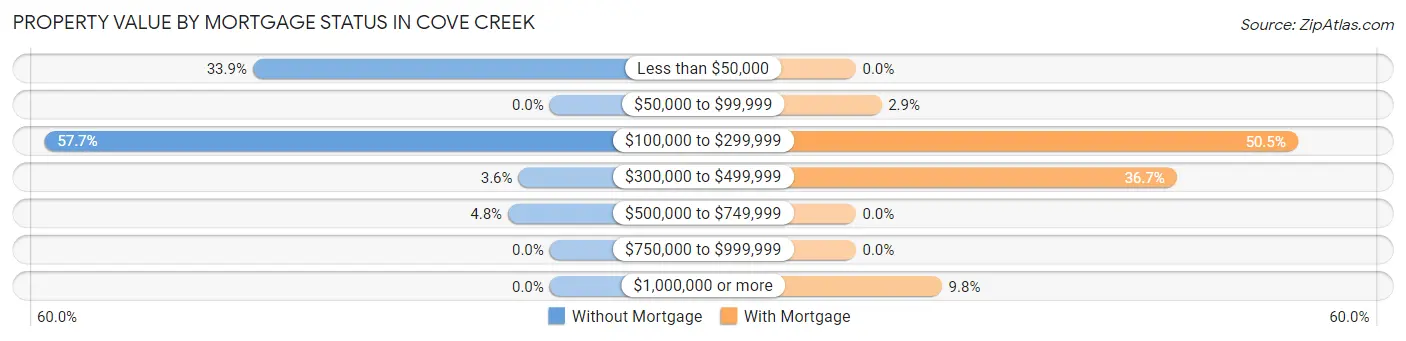
| Property Value | Without Mortgage | With Mortgage |
| Less than $50,000 | 57 (33.9%) | 0 (0.0%) |
| $50,000 to $99,999 | 0 (0.0%) | 11 (2.9%) |
| $100,000 to $299,999 | 97 (57.7%) | 190 (50.5%) |
| $300,000 to $499,999 | 6 (3.6%) | 138 (36.7%) |
| $500,000 to $749,999 | 8 (4.8%) | 0 (0.0%) |
| $750,000 to $999,999 | 0 (0.0%) | 0 (0.0%) |
| $1,000,000 or more | 0 (0.0%) | 37 (9.8%) |
| Total | 168 (100.0%) | 376 (100.0%) |
Household Income by Mortgage Status in Cove Creek
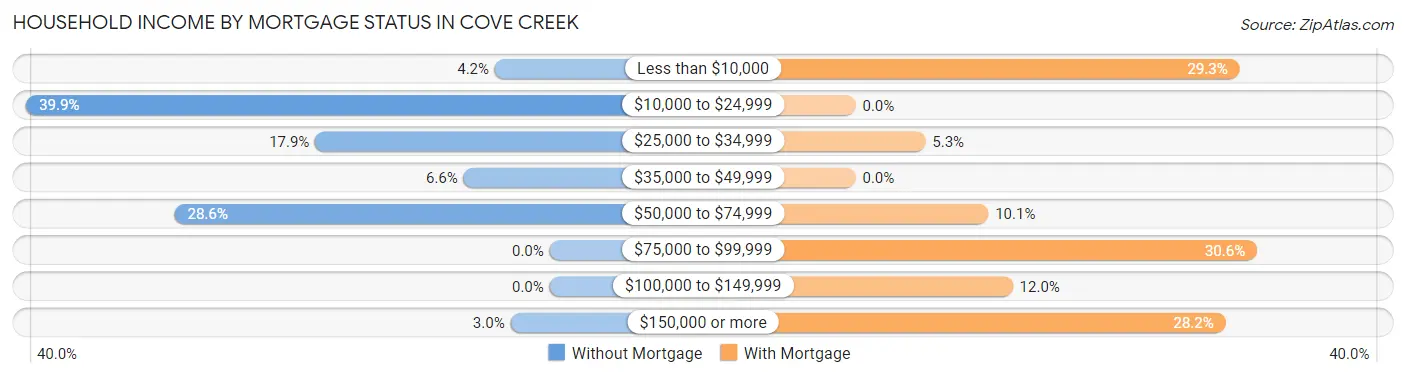
| Household Income | Without Mortgage | With Mortgage |
| Less than $10,000 | 7 (4.2%) | 110 (29.3%) |
| $10,000 to $24,999 | 67 (39.9%) | 0 (0.0%) |
| $25,000 to $34,999 | 30 (17.9%) | 20 (5.3%) |
| $35,000 to $49,999 | 11 (6.6%) | 0 (0.0%) |
| $50,000 to $74,999 | 48 (28.6%) | 38 (10.1%) |
| $75,000 to $99,999 | 0 (0.0%) | 115 (30.6%) |
| $100,000 to $149,999 | 0 (0.0%) | 45 (12.0%) |
| $150,000 or more | 5 (3.0%) | 106 (28.2%) |
| Total | 168 (100.0%) | 376 (100.0%) |
Property Value to Household Income Ratio in Cove Creek
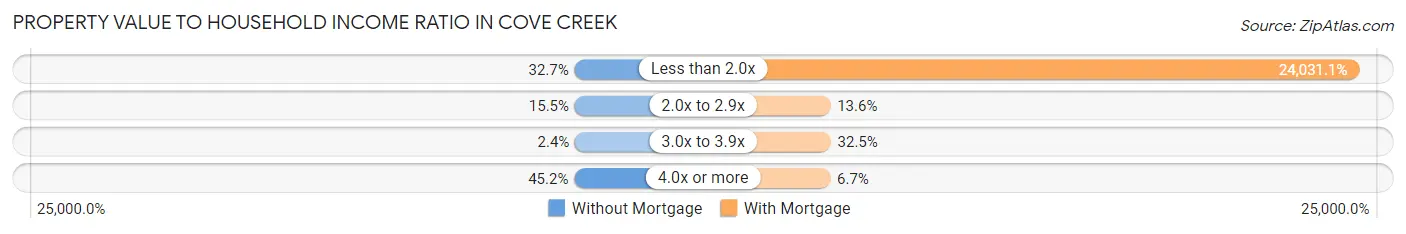
| Value-to-Income Ratio | Without Mortgage | With Mortgage |
| Less than 2.0x | 55 (32.7%) | 90,357 (24,031.1%) |
| 2.0x to 2.9x | 26 (15.5%) | 51 (13.6%) |
| 3.0x to 3.9x | 4 (2.4%) | 122 (32.5%) |
| 4.0x or more | 76 (45.2%) | 25 (6.7%) |
| Total | 168 (100.0%) | 376 (100.0%) |
Real Estate Taxes by Mortgage Status in Cove Creek
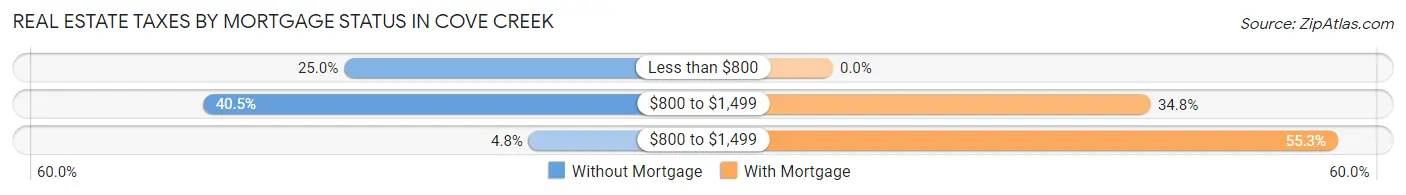
| Property Taxes | Without Mortgage | With Mortgage |
| Less than $800 | 42 (25.0%) | 0 (0.0%) |
| $800 to $1,499 | 68 (40.5%) | 131 (34.8%) |
| $800 to $1,499 | 8 (4.8%) | 208 (55.3%) |
| Total | 168 (100.0%) | 376 (100.0%) |
Health & Disability in Cove Creek
Health Insurance Coverage by Age in Cove Creek
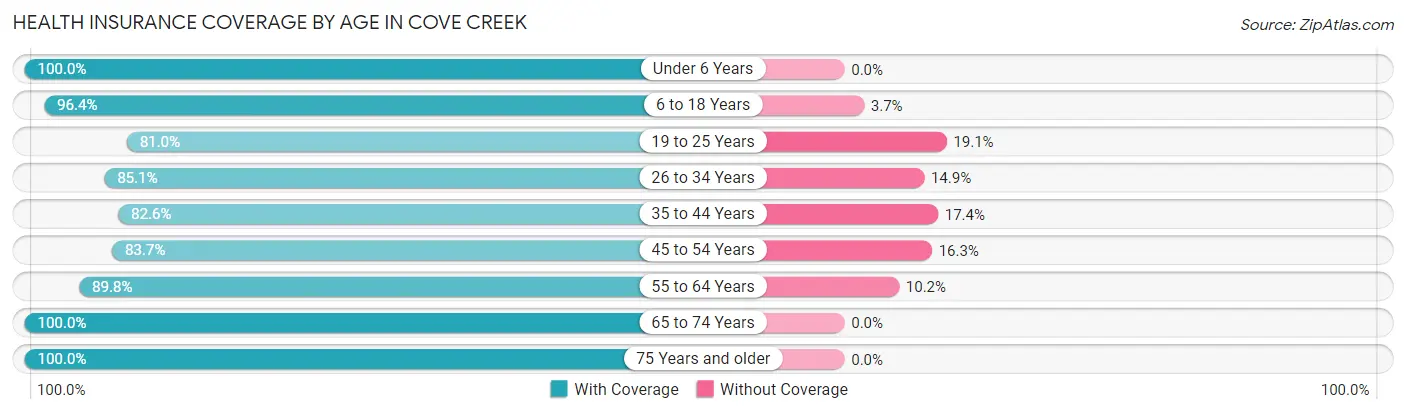
| Age Bracket | With Coverage | Without Coverage |
| Under 6 Years | 73 (100.0%) | 0 (0.0%) |
| 6 to 18 Years | 132 (96.4%) | 5 (3.6%) |
| 19 to 25 Years | 34 (80.9%) | 8 (19.1%) |
| 26 to 34 Years | 63 (85.1%) | 11 (14.9%) |
| 35 to 44 Years | 199 (82.6%) | 42 (17.4%) |
| 45 to 54 Years | 154 (83.7%) | 30 (16.3%) |
| 55 to 64 Years | 159 (89.8%) | 18 (10.2%) |
| 65 to 74 Years | 365 (100.0%) | 0 (0.0%) |
| 75 Years and older | 61 (100.0%) | 0 (0.0%) |
| Total | 1,240 (91.6%) | 114 (8.4%) |
Health Insurance Coverage by Citizenship Status in Cove Creek
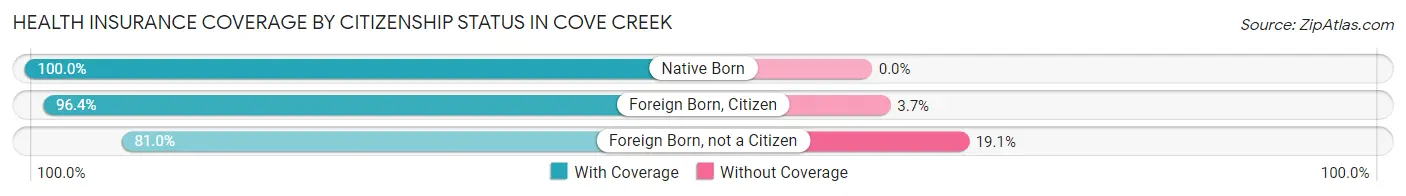
| Citizenship Status | With Coverage | Without Coverage |
| Native Born | 73 (100.0%) | 0 (0.0%) |
| Foreign Born, Citizen | 132 (96.4%) | 5 (3.6%) |
| Foreign Born, not a Citizen | 34 (80.9%) | 8 (19.1%) |
Health Insurance Coverage by Household Income in Cove Creek
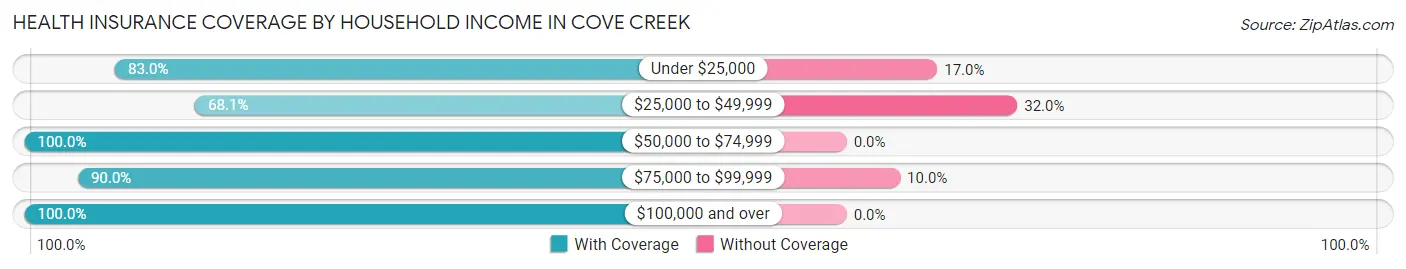
| Household Income | With Coverage | Without Coverage |
| Under $25,000 | 93 (83.0%) | 19 (17.0%) |
| $25,000 to $49,999 | 164 (68.0%) | 77 (32.0%) |
| $50,000 to $74,999 | 368 (100.0%) | 0 (0.0%) |
| $75,000 to $99,999 | 162 (90.0%) | 18 (10.0%) |
| $100,000 and over | 453 (100.0%) | 0 (0.0%) |
Public vs Private Health Insurance Coverage by Age in Cove Creek
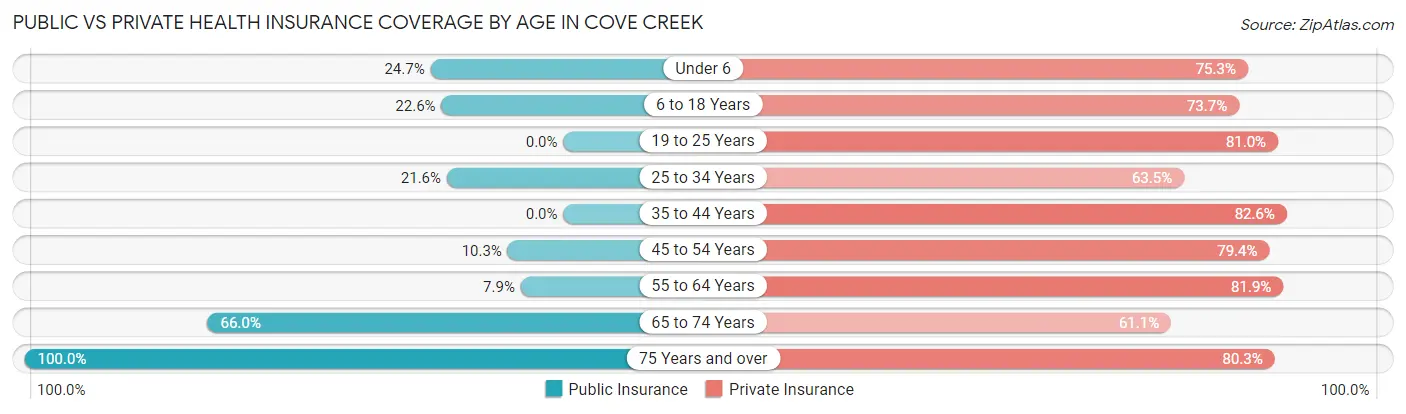
| Age Bracket | Public Insurance | Private Insurance |
| Under 6 | 18 (24.7%) | 55 (75.3%) |
| 6 to 18 Years | 31 (22.6%) | 101 (73.7%) |
| 19 to 25 Years | 0 (0.0%) | 34 (80.9%) |
| 25 to 34 Years | 16 (21.6%) | 47 (63.5%) |
| 35 to 44 Years | 0 (0.0%) | 199 (82.6%) |
| 45 to 54 Years | 19 (10.3%) | 146 (79.3%) |
| 55 to 64 Years | 14 (7.9%) | 145 (81.9%) |
| 65 to 74 Years | 241 (66.0%) | 223 (61.1%) |
| 75 Years and over | 61 (100.0%) | 49 (80.3%) |
| Total | 400 (29.5%) | 999 (73.8%) |
Disability Status by Sex by Age in Cove Creek
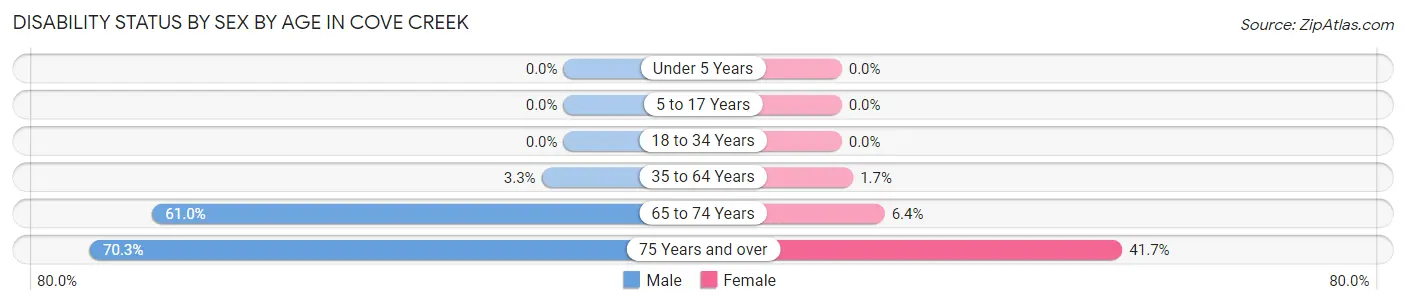
| Age Bracket | Male | Female |
| Under 5 Years | 0 (0.0%) | 0 (0.0%) |
| 5 to 17 Years | 0 (0.0%) | 0 (0.0%) |
| 18 to 34 Years | 0 (0.0%) | 0 (0.0%) |
| 35 to 64 Years | 10 (3.3%) | 5 (1.7%) |
| 65 to 74 Years | 108 (61.0%) | 12 (6.4%) |
| 75 Years and over | 26 (70.3%) | 10 (41.7%) |
Disability Class by Sex by Age in Cove Creek
Disability Class: Hearing Difficulty
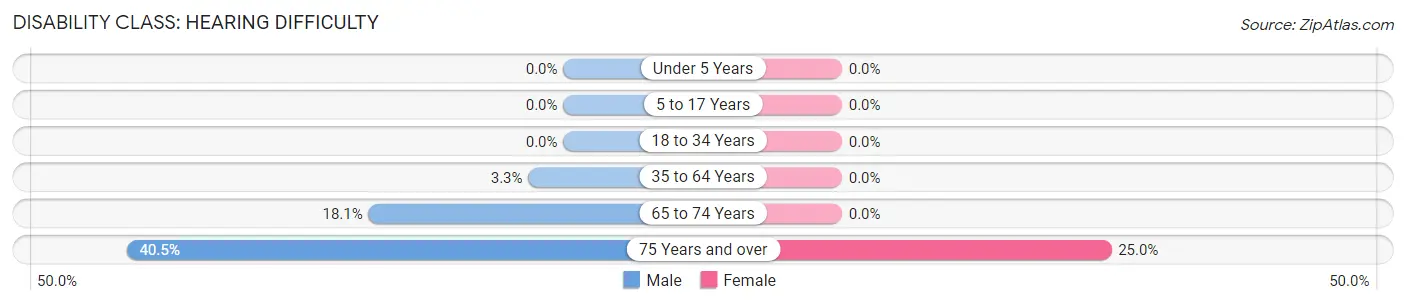
| Age Bracket | Male | Female |
| Under 5 Years | 0 (0.0%) | 0 (0.0%) |
| 5 to 17 Years | 0 (0.0%) | 0 (0.0%) |
| 18 to 34 Years | 0 (0.0%) | 0 (0.0%) |
| 35 to 64 Years | 10 (3.3%) | 0 (0.0%) |
| 65 to 74 Years | 32 (18.1%) | 0 (0.0%) |
| 75 Years and over | 15 (40.5%) | 6 (25.0%) |
Disability Class: Vision Difficulty
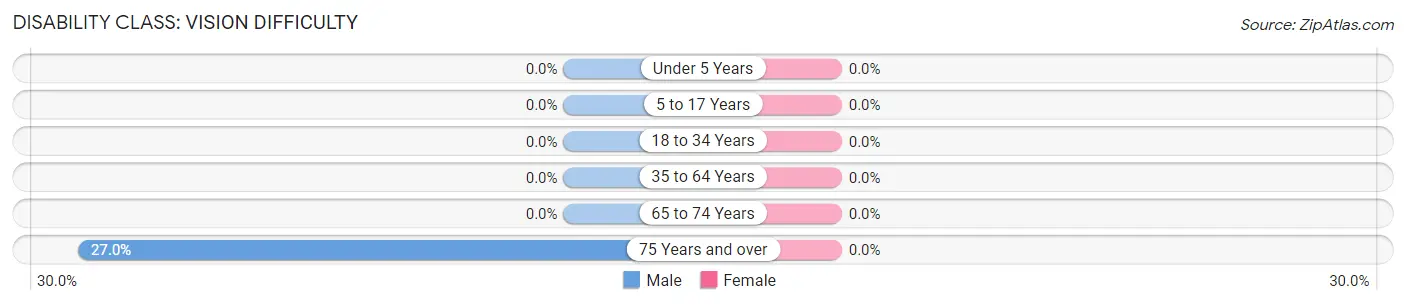
| Age Bracket | Male | Female |
| Under 5 Years | 0 (0.0%) | 0 (0.0%) |
| 5 to 17 Years | 0 (0.0%) | 0 (0.0%) |
| 18 to 34 Years | 0 (0.0%) | 0 (0.0%) |
| 35 to 64 Years | 0 (0.0%) | 0 (0.0%) |
| 65 to 74 Years | 0 (0.0%) | 0 (0.0%) |
| 75 Years and over | 10 (27.0%) | 0 (0.0%) |
Disability Class: Cognitive Difficulty
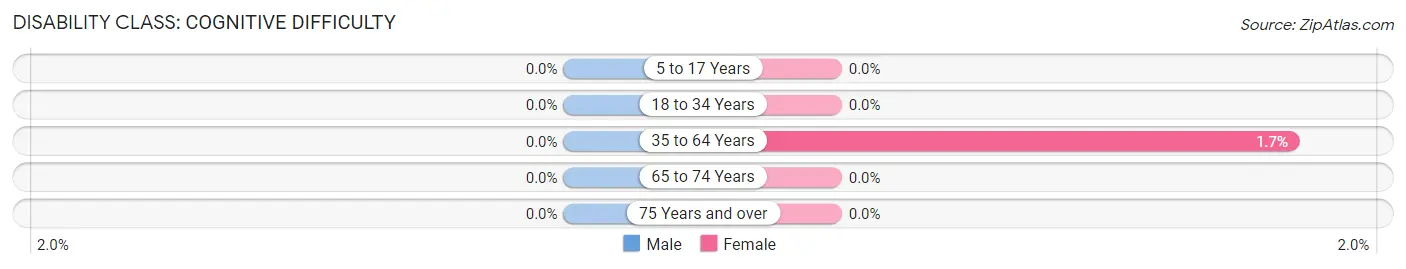
| Age Bracket | Male | Female |
| 5 to 17 Years | 0 (0.0%) | 0 (0.0%) |
| 18 to 34 Years | 0 (0.0%) | 0 (0.0%) |
| 35 to 64 Years | 0 (0.0%) | 5 (1.7%) |
| 65 to 74 Years | 0 (0.0%) | 0 (0.0%) |
| 75 Years and over | 0 (0.0%) | 0 (0.0%) |
Disability Class: Ambulatory Difficulty
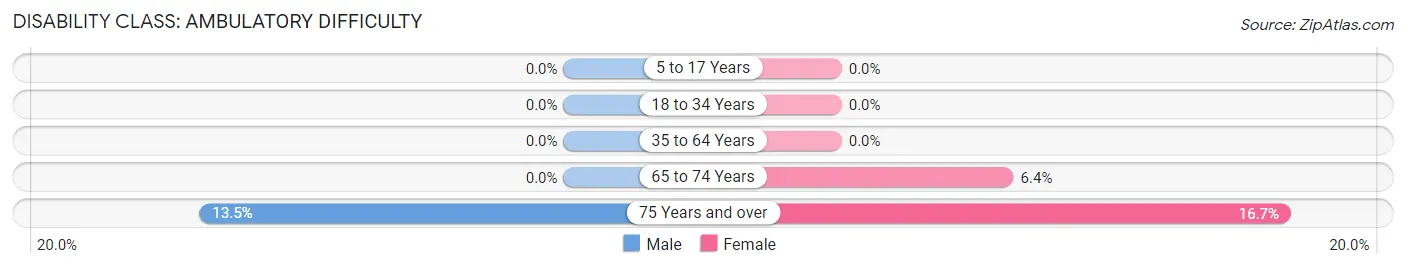
| Age Bracket | Male | Female |
| 5 to 17 Years | 0 (0.0%) | 0 (0.0%) |
| 18 to 34 Years | 0 (0.0%) | 0 (0.0%) |
| 35 to 64 Years | 0 (0.0%) | 0 (0.0%) |
| 65 to 74 Years | 0 (0.0%) | 12 (6.4%) |
| 75 Years and over | 5 (13.5%) | 4 (16.7%) |
Disability Class: Self-Care Difficulty
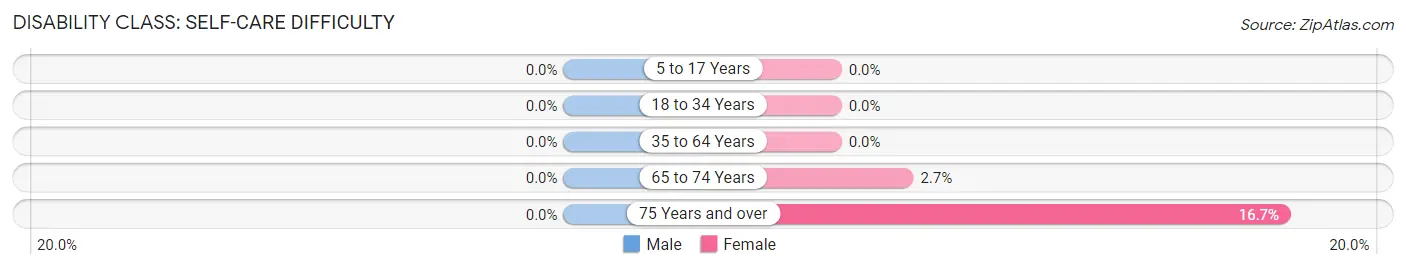
| Age Bracket | Male | Female |
| 5 to 17 Years | 0 (0.0%) | 0 (0.0%) |
| 18 to 34 Years | 0 (0.0%) | 0 (0.0%) |
| 35 to 64 Years | 0 (0.0%) | 0 (0.0%) |
| 65 to 74 Years | 0 (0.0%) | 5 (2.7%) |
| 75 Years and over | 0 (0.0%) | 4 (16.7%) |
Technology Access in Cove Creek
Computing Device Access in Cove Creek
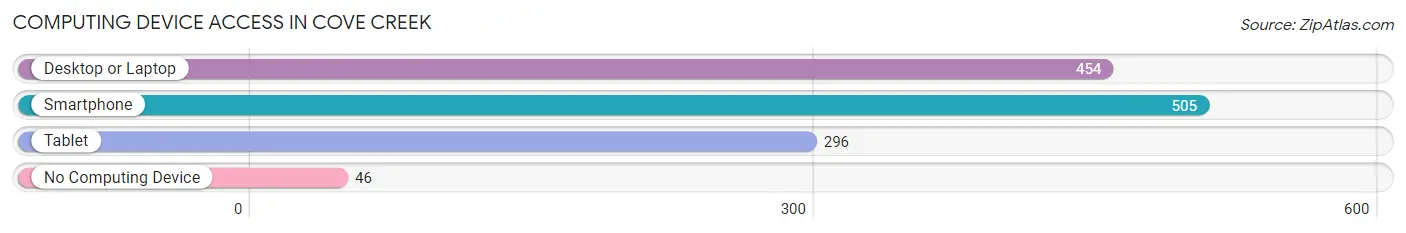
| Device Type | # Households | % Households |
| Desktop or Laptop | 454 | 77.7% |
| Smartphone | 505 | 86.5% |
| Tablet | 296 | 50.7% |
| No Computing Device | 46 | 7.9% |
| Total | 584 | 100.0% |
Internet Access in Cove Creek
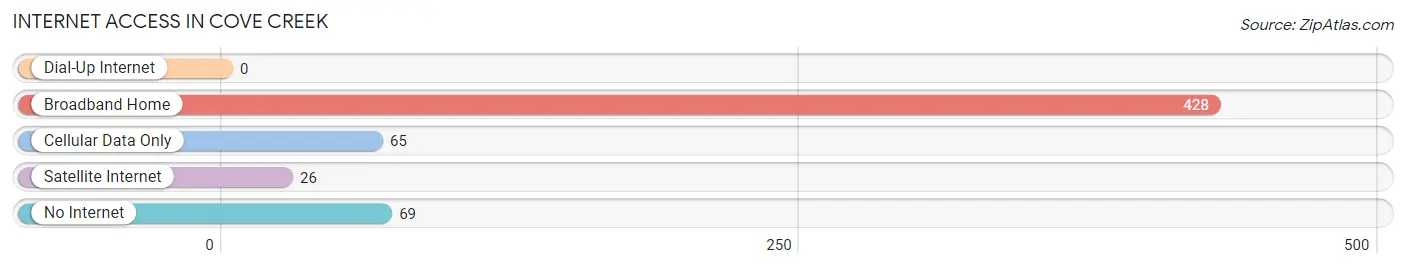
| Internet Type | # Households | % Households |
| Dial-Up Internet | 0 | 0.0% |
| Broadband Home | 428 | 73.3% |
| Cellular Data Only | 65 | 11.1% |
| Satellite Internet | 26 | 4.4% |
| No Internet | 69 | 11.8% |
| Total | 584 | 100.0% |
Cove Creek Summary
Cove Creek is a small unincorporated community located in the Blue Ridge Mountains of North Carolina. It is situated in the northwestern corner of Watauga County, near the Tennessee border. The community is located along the banks of Cove Creek, a tributary of the Watauga River.
History
The area that is now Cove Creek was first settled in the late 1700s by a group of settlers from the nearby town of Boone. The settlers were attracted to the area by its abundance of natural resources, including timber, game, and fertile soil. The community was originally known as “Cove”, and the creek that runs through the area was named after the settlement.
In the early 1800s, the area was home to a small community of farmers and loggers. The community was largely self-sufficient, relying on the resources of the surrounding area for sustenance. The community was also home to a small school, which served the local children until the early 1900s.
In the late 1800s, the area began to experience a period of growth and development. The construction of the East Tennessee and Western North Carolina Railroad in the late 1800s brought increased economic activity to the area. The railroad provided access to markets in larger cities, allowing the local farmers to sell their produce and timber.
The community of Cove Creek was officially established in the early 1900s. The town was named after the creek that runs through the area, and the post office was established in 1906.
Geography
Cove Creek is located in the northwestern corner of Watauga County, near the Tennessee border. The community is situated along the banks of Cove Creek, a tributary of the Watauga River. The area is characterized by rolling hills and lush forests. The elevation of the area ranges from 1,500 to 2,000 feet above sea level.
The climate of the area is temperate, with mild winters and warm summers. The average annual temperature is around 55 degrees Fahrenheit. The average annual precipitation is around 45 inches.
Economy
The economy of Cove Creek is largely based on agriculture and forestry. The area is home to several small farms, which produce a variety of crops, including corn, soybeans, and hay. The area is also home to several timber companies, which harvest the area’s abundant forests.
In addition to agriculture and forestry, the area is home to several small businesses, including restaurants, stores, and service providers. The area is also home to several tourist attractions, including the nearby Grandfather Mountain State Park.
Demographics
As of the 2010 census, the population of Cove Creek was 1,093. The racial makeup of the area was 97.3% White, 0.7% African American, 0.3% Native American, 0.2% Asian, and 1.5% from other races. The median household income was $35,000, and the median home value was $150,000.
Conclusion
Cove Creek is a small unincorporated community located in the Blue Ridge Mountains of North Carolina. The area is characterized by rolling hills and lush forests, and the economy is largely based on agriculture and forestry. The population of the area is around 1,093, and the median household income is around $35,000. The area is home to several tourist attractions, including the nearby Grandfather Mountain State Park.
Common Questions
What is Per Capita Income in Cove Creek?
Per Capita income in Cove Creek is $36,203.
What is the Median Family Income in Cove Creek?
Median Family Income in Cove Creek is $72,177.
What is the Median Household income in Cove Creek?
Median Household Income in Cove Creek is $51,812.
What is Income or Wage Gap in Cove Creek?
Income or Wage Gap in Cove Creek is 48.8%.
Women in Cove Creek earn 51.2 cents for every dollar earned by a man.
What is Inequality or Gini Index in Cove Creek?
Inequality or Gini Index in Cove Creek is 0.43.
What is the Total Population of Cove Creek?
Total Population of Cove Creek is 1,354.
What is the Total Male Population of Cove Creek?
Total Male Population of Cove Creek is 720.
What is the Total Female Population of Cove Creek?
Total Female Population of Cove Creek is 634.
What is the Ratio of Males per 100 Females in Cove Creek?
There are 113.56 Males per 100 Females in Cove Creek.
What is the Ratio of Females per 100 Males in Cove Creek?
There are 88.06 Females per 100 Males in Cove Creek.
What is the Median Population Age in Cove Creek?
Median Population Age in Cove Creek is 52.5 Years.
What is the Average Family Size in Cove Creek
Average Family Size in Cove Creek is 2.7 People.
What is the Average Household Size in Cove Creek
Average Household Size in Cove Creek is 2.3 People.
How Large is the Labor Force in Cove Creek?
There are 907 People in the Labor Forcein in Cove Creek.
What is the Percentage of People in the Labor Force in Cove Creek?
74.4% of People are in the Labor Force in Cove Creek.
What is the Unemployment Rate in Cove Creek?
Unemployment Rate in Cove Creek is 1.1%.