Cliffside, NC Map & Demographics
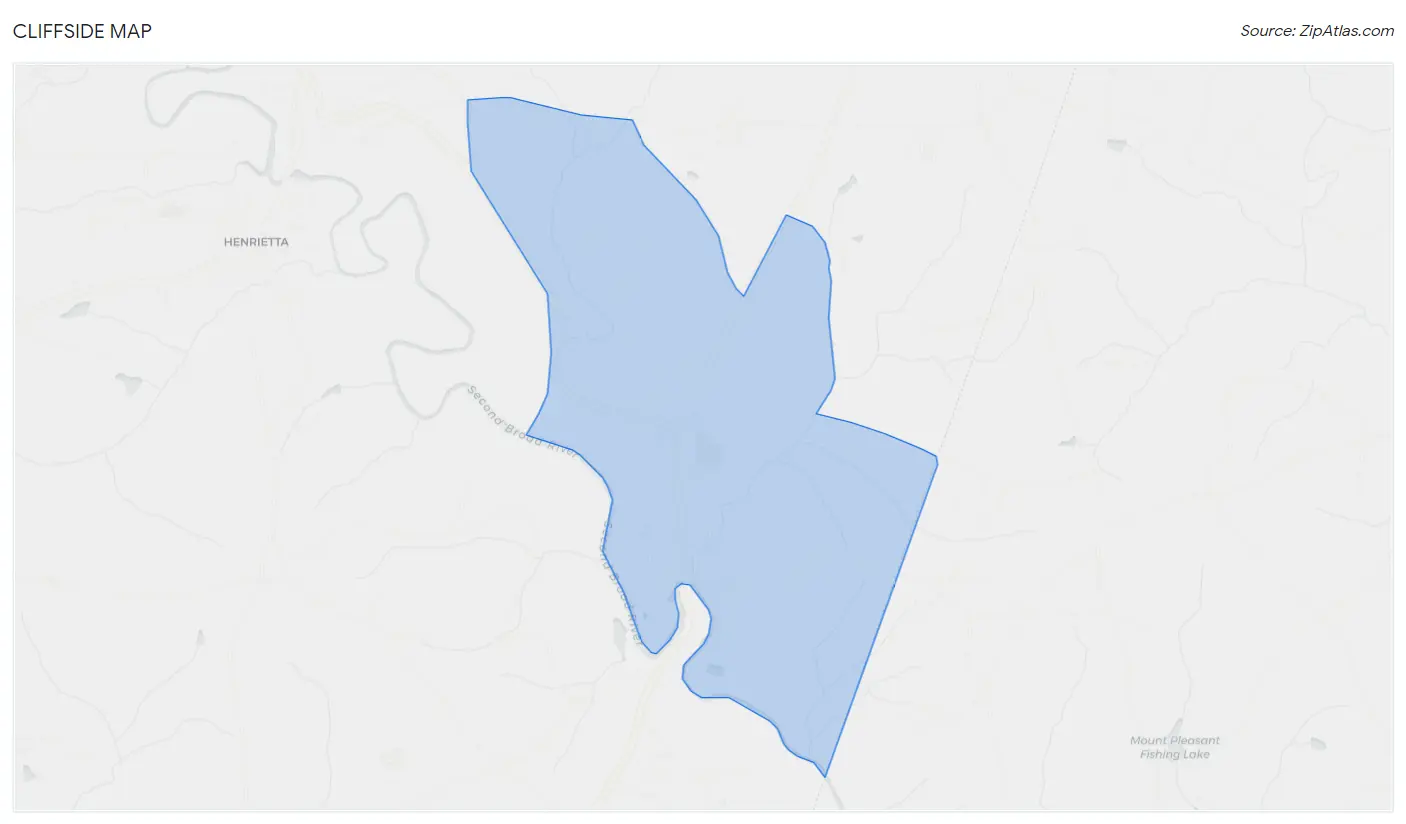
Cliffside Map
Cliffside Overview
$23,826
PER CAPITA INCOME
$34,111
AVG HOUSEHOLD INCOME
0.36
INEQUALITY / GINI INDEX
424
TOTAL POPULATION
287
MALE POPULATION
137
FEMALE POPULATION
209.49
MALES / 100 FEMALES
47.74
FEMALES / 100 MALES
52.4
MEDIAN AGE
2.7
AVG FAMILY SIZE
2.0
AVG HOUSEHOLD SIZE
87
LABOR FORCE [ PEOPLE ]
20.7%
PERCENT IN LABOR FORCE
Cliffside Zip Codes
Cliffside Area Codes
Income in Cliffside
Income Overview in Cliffside
| Characteristic | Number | Measure |
| Per Capita Income | 424 | $23,826 |
| Median Family Income | 121 | $0 |
| Mean Family Income | 121 | $53,941 |
| Median Household Income | 215 | $34,111 |
| Mean Household Income | 215 | $47,895 |
| Income Deficit | 121 | $0 |
| Wage / Income Gap (%) | 424 | 0.00% |
| Wage / Income Gap ($) | 424 | 100.00¢ per $1 |
| Gini / Inequality Index | 424 | 0.36 |
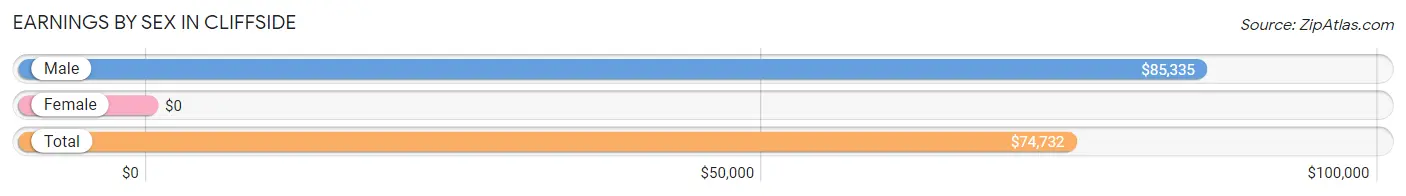
Earnings by Sex in Cliffside
| Sex | Number | Average Earnings |
| Male | 73 (83.9%) | $85,335 |
| Female | 14 (16.1%) | $0 |
| Total | 87 (100.0%) | $74,732 |
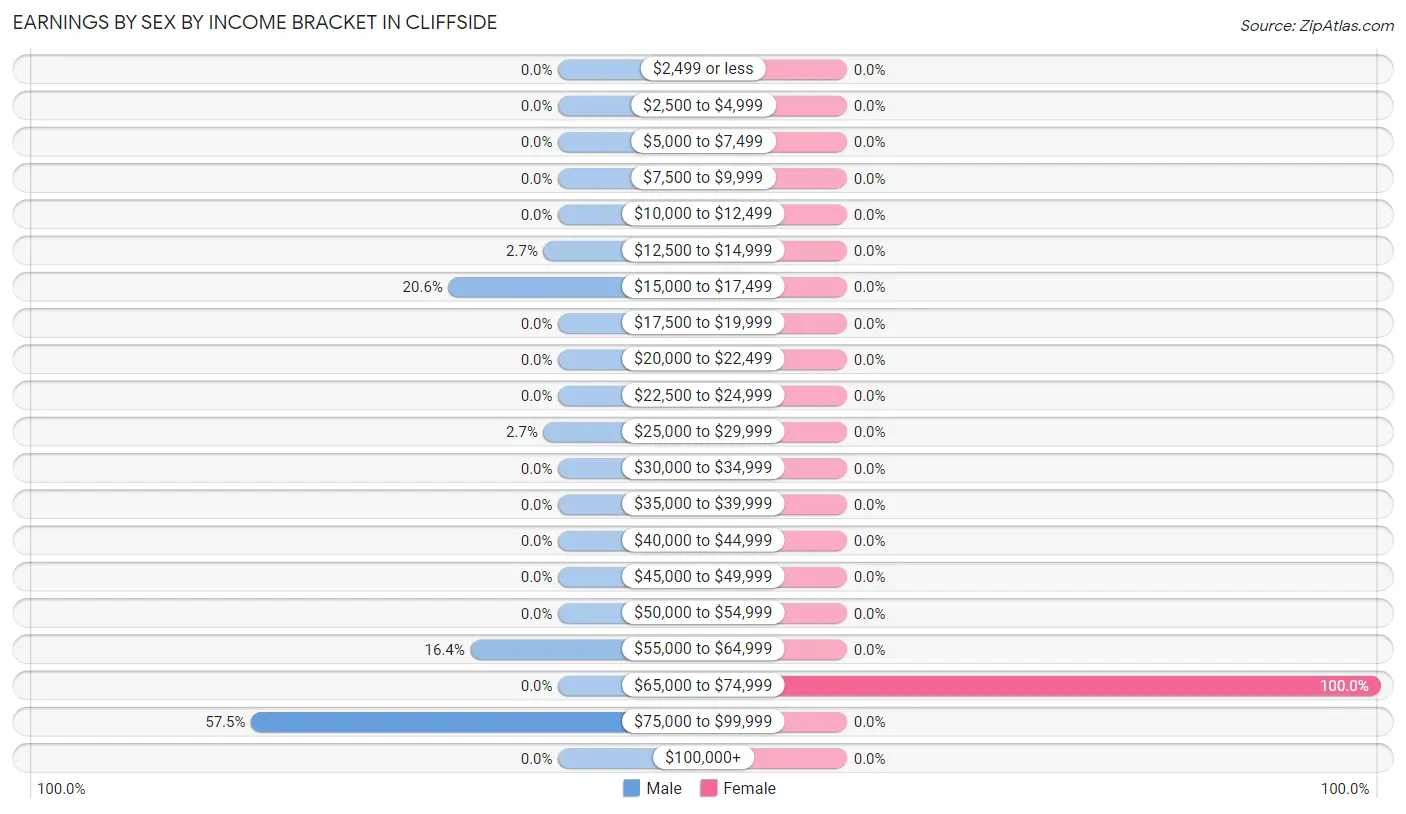
Earnings by Sex by Income Bracket in Cliffside
The most common earnings brackets in Cliffside are $75,000 to $99,999 for men (42 | 57.5%) and $65,000 to $74,999 for women (14 | 100.0%).
| Income | Male | Female |
| $2,499 or less | 0 (0.0%) | 0 (0.0%) |
| $2,500 to $4,999 | 0 (0.0%) | 0 (0.0%) |
| $5,000 to $7,499 | 0 (0.0%) | 0 (0.0%) |
| $7,500 to $9,999 | 0 (0.0%) | 0 (0.0%) |
| $10,000 to $12,499 | 0 (0.0%) | 0 (0.0%) |
| $12,500 to $14,999 | 2 (2.7%) | 0 (0.0%) |
| $15,000 to $17,499 | 15 (20.5%) | 0 (0.0%) |
| $17,500 to $19,999 | 0 (0.0%) | 0 (0.0%) |
| $20,000 to $22,499 | 0 (0.0%) | 0 (0.0%) |
| $22,500 to $24,999 | 0 (0.0%) | 0 (0.0%) |
| $25,000 to $29,999 | 2 (2.7%) | 0 (0.0%) |
| $30,000 to $34,999 | 0 (0.0%) | 0 (0.0%) |
| $35,000 to $39,999 | 0 (0.0%) | 0 (0.0%) |
| $40,000 to $44,999 | 0 (0.0%) | 0 (0.0%) |
| $45,000 to $49,999 | 0 (0.0%) | 0 (0.0%) |
| $50,000 to $54,999 | 0 (0.0%) | 0 (0.0%) |
| $55,000 to $64,999 | 12 (16.4%) | 0 (0.0%) |
| $65,000 to $74,999 | 0 (0.0%) | 14 (100.0%) |
| $75,000 to $99,999 | 42 (57.5%) | 0 (0.0%) |
| $100,000+ | 0 (0.0%) | 0 (0.0%) |
| Total | 73 (100.0%) | 14 (100.0%) |
Earnings by Sex by Educational Attainment in Cliffside
| Educational Attainment | Male Income | Female Income |
| Less than High School | - | - |
| High School Diploma | - | - |
| College or Associate's Degree | - | - |
| Bachelor's Degree | - | - |
| Graduate Degree | - | - |
| Total | $85,396 | $0 |
Family Income in Cliffside
Family Income Brackets in Cliffside
According to the Cliffside family income data, there are 52 families falling into the $25,000 to $34,999 income range, which is the most common income bracket and makes up 43.0% of all families.
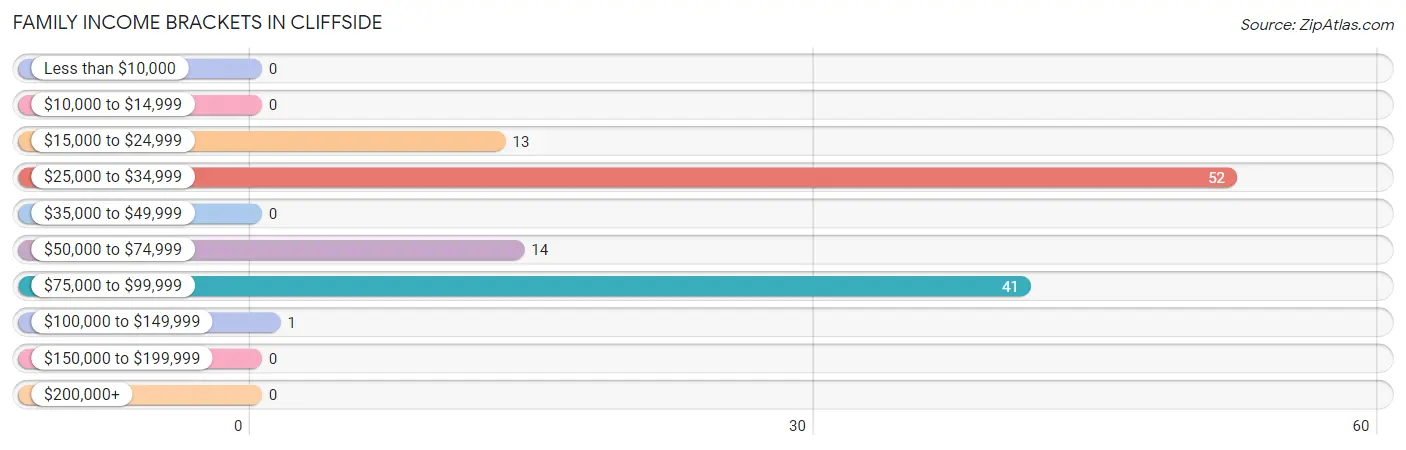
| Income Bracket | # Families | % Families |
| Less than $10,000 | 0 | 0.0% |
| $10,000 to $14,999 | 0 | 0.0% |
| $15,000 to $24,999 | 13 | 10.7% |
| $25,000 to $34,999 | 52 | 43.0% |
| $35,000 to $49,999 | 0 | 0.0% |
| $50,000 to $74,999 | 14 | 11.6% |
| $75,000 to $99,999 | 41 | 33.9% |
| $100,000 to $149,999 | 1 | 0.8% |
| $150,000 to $199,999 | 0 | 0.0% |
| $200,000+ | 0 | 0.0% |
Family Income by Famaliy Size in Cliffside
2-person families (79 | 65.3%) account for the highest median family income in Cliffside with $33,774 per family, while 2-person families (79 | 65.3%) have the highest median income of $16,887 per family member.
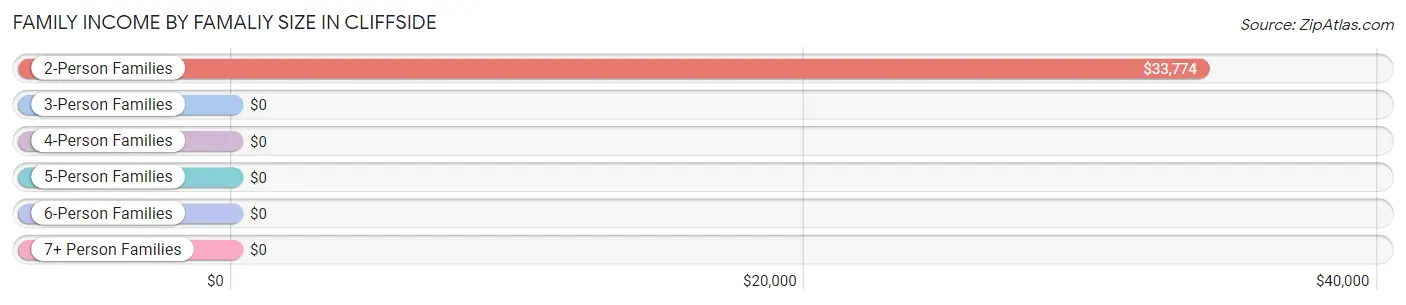
| Income Bracket | # Families | Median Income |
| 2-Person Families | 79 (65.3%) | $33,774 |
| 3-Person Families | 0 (0.0%) | $0 |
| 4-Person Families | 42 (34.7%) | $0 |
| 5-Person Families | 0 (0.0%) | $0 |
| 6-Person Families | 0 (0.0%) | $0 |
| 7+ Person Families | 0 (0.0%) | $0 |
| Total | 121 (100.0%) | $0 |
Family Income by Number of Earners in Cliffside
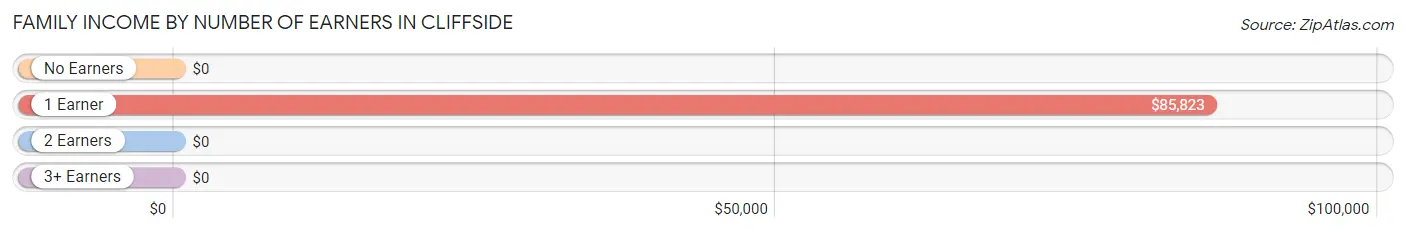
| Number of Earners | # Families | Median Income |
| No Earners | 65 (53.7%) | $0 |
| 1 Earner | 55 (45.5%) | $85,823 |
| 2 Earners | 1 (0.8%) | $0 |
| 3+ Earners | 0 (0.0%) | $0 |
| Total | 121 (100.0%) | $0 |
Household Income in Cliffside
Household Income Brackets in Cliffside
With 74 households falling in the category, the $15,000 to $24,999 income range is the most frequent in Cliffside, accounting for 34.4% of all households.
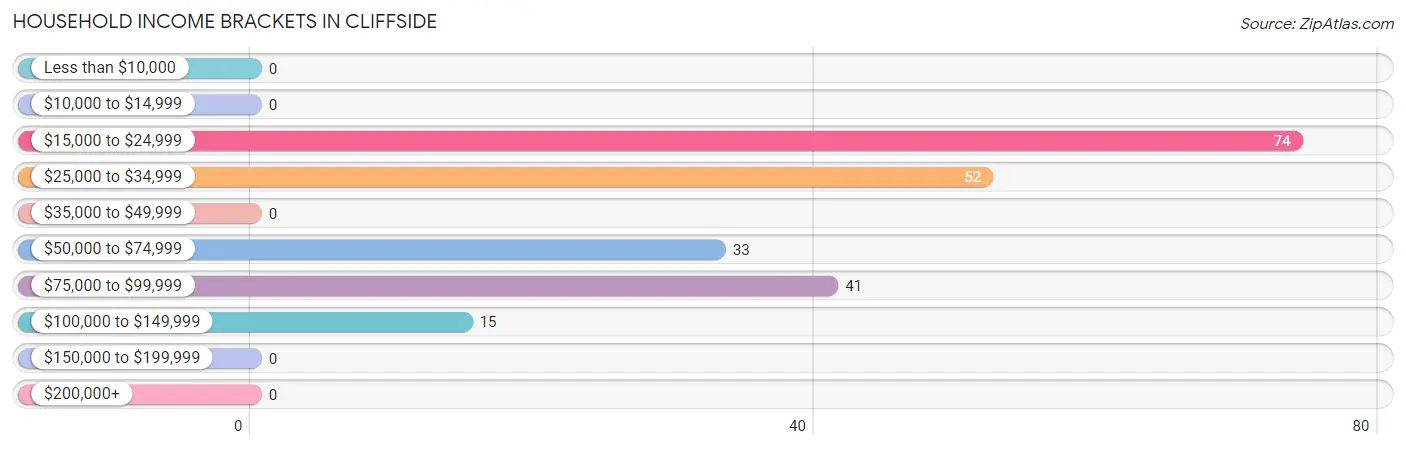
| Income Bracket | # Households | % Households |
| Less than $10,000 | 0 | 0.0% |
| $10,000 to $14,999 | 0 | 0.0% |
| $15,000 to $24,999 | 74 | 34.4% |
| $25,000 to $34,999 | 52 | 24.2% |
| $35,000 to $49,999 | 0 | 0.0% |
| $50,000 to $74,999 | 33 | 15.3% |
| $75,000 to $99,999 | 41 | 19.1% |
| $100,000 to $149,999 | 15 | 7.0% |
| $150,000 to $199,999 | 0 | 0.0% |
| $200,000+ | 0 | 0.0% |
Household Income by Householder Age in Cliffside
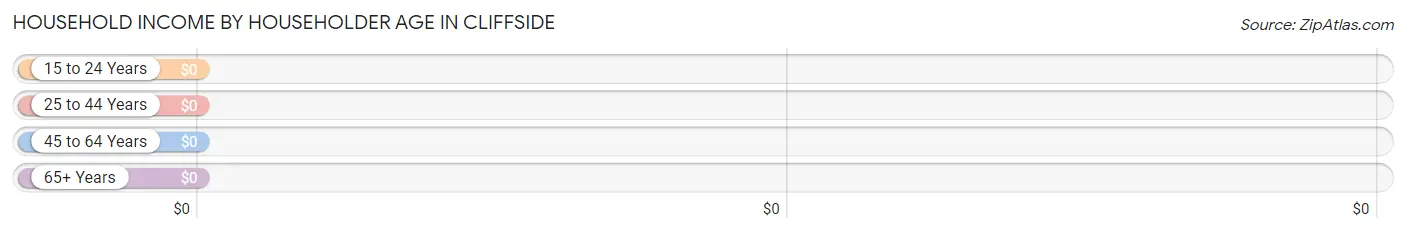
| Income Bracket | # Households | Median Income |
| 15 to 24 Years | 0 (0.0%) | $0 |
| 25 to 44 Years | 14 (6.5%) | $0 |
| 45 to 64 Years | 167 (77.7%) | $0 |
| 65+ Years | 34 (15.8%) | $0 |
| Total | 215 (100.0%) | $34,111 |
Poverty in Cliffside
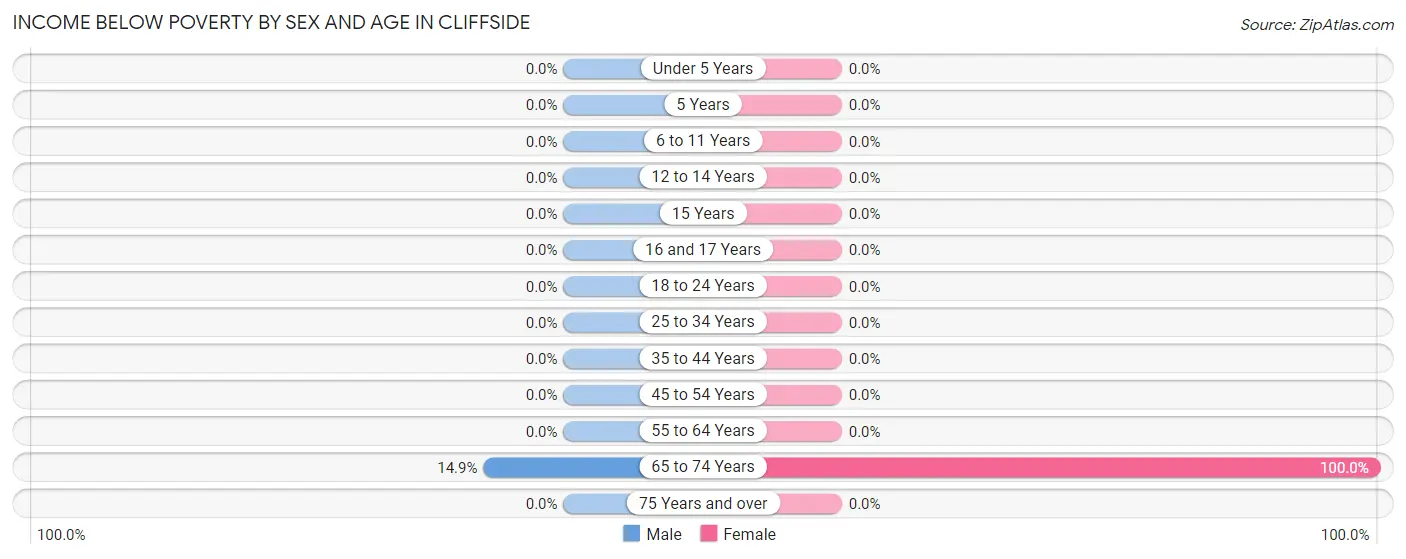
Income Below Poverty by Sex and Age in Cliffside
With 3.8% poverty level for males and 9.5% for females among the residents of Cliffside, 65 to 74 year old males and 65 to 74 year old females are the most vulnerable to poverty, with 11 males (14.9%) and 13 females (100.0%) in their respective age groups living below the poverty level.
| Age Bracket | Male | Female |
| Under 5 Years | 0 (0.0%) | 0 (0.0%) |
| 5 Years | 0 (0.0%) | 0 (0.0%) |
| 6 to 11 Years | 0 (0.0%) | 0 (0.0%) |
| 12 to 14 Years | 0 (0.0%) | 0 (0.0%) |
| 15 Years | 0 (0.0%) | 0 (0.0%) |
| 16 and 17 Years | 0 (0.0%) | 0 (0.0%) |
| 18 to 24 Years | 0 (0.0%) | 0 (0.0%) |
| 25 to 34 Years | 0 (0.0%) | 0 (0.0%) |
| 35 to 44 Years | 0 (0.0%) | 0 (0.0%) |
| 45 to 54 Years | 0 (0.0%) | 0 (0.0%) |
| 55 to 64 Years | 0 (0.0%) | 0 (0.0%) |
| 65 to 74 Years | 11 (14.9%) | 13 (100.0%) |
| 75 Years and over | 0 (0.0%) | 0 (0.0%) |
| Total | 11 (3.8%) | 13 (9.5%) |
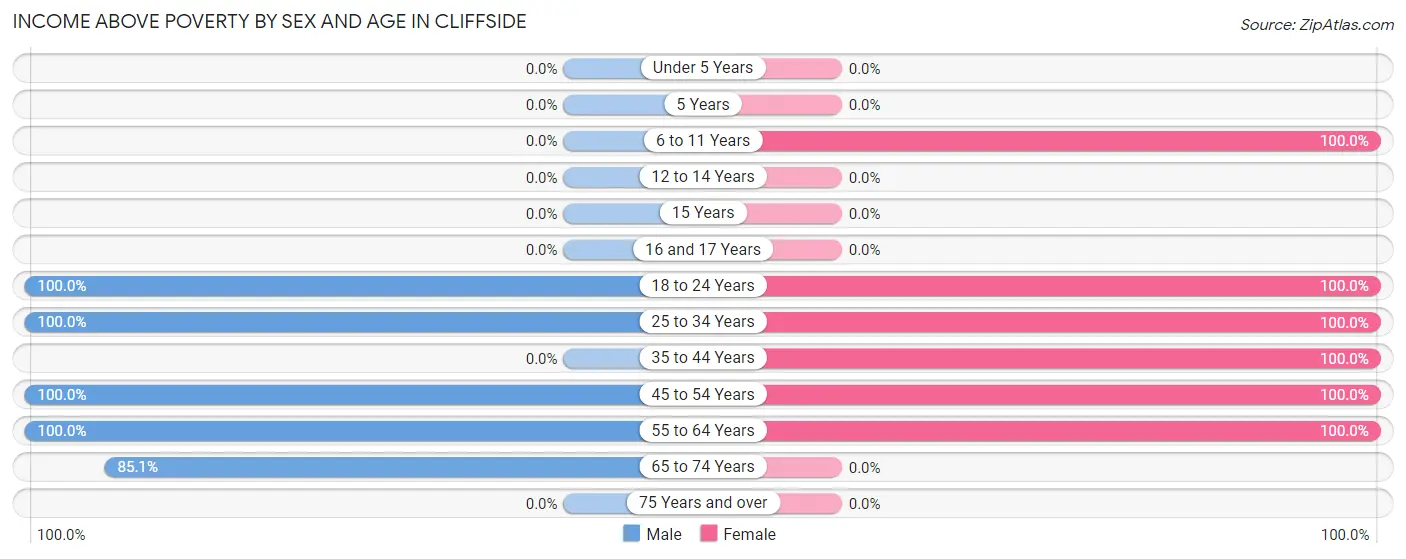
Income Above Poverty by Sex and Age in Cliffside
According to the poverty statistics in Cliffside, males aged 18 to 24 years and females aged 6 to 11 years are the age groups that are most secure financially, with 100.0% of males and 100.0% of females in these age groups living above the poverty line.
| Age Bracket | Male | Female |
| Under 5 Years | 0 (0.0%) | 0 (0.0%) |
| 5 Years | 0 (0.0%) | 0 (0.0%) |
| 6 to 11 Years | 0 (0.0%) | 3 (100.0%) |
| 12 to 14 Years | 0 (0.0%) | 0 (0.0%) |
| 15 Years | 0 (0.0%) | 0 (0.0%) |
| 16 and 17 Years | 0 (0.0%) | 0 (0.0%) |
| 18 to 24 Years | 49 (100.0%) | 42 (100.0%) |
| 25 to 34 Years | 49 (100.0%) | 2 (100.0%) |
| 35 to 44 Years | 0 (0.0%) | 13 (100.0%) |
| 45 to 54 Years | 69 (100.0%) | 52 (100.0%) |
| 55 to 64 Years | 46 (100.0%) | 12 (100.0%) |
| 65 to 74 Years | 63 (85.1%) | 0 (0.0%) |
| 75 Years and over | 0 (0.0%) | 0 (0.0%) |
| Total | 276 (96.2%) | 124 (90.5%) |
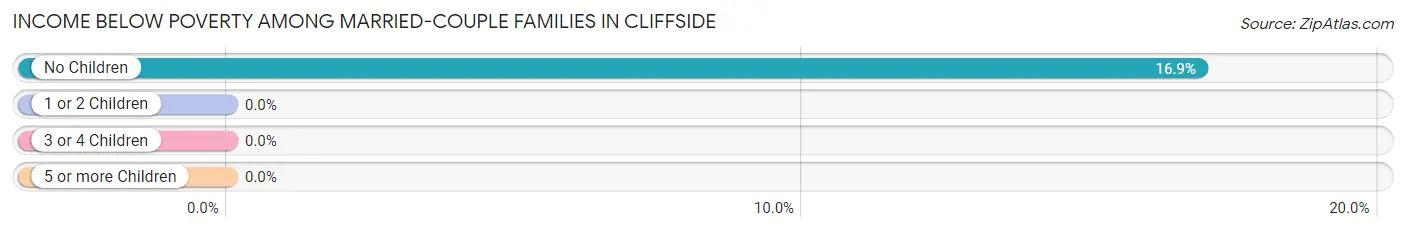
Income Below Poverty Among Married-Couple Families in Cliffside
The poverty statistics for married-couple families in Cliffside show that 16.7% or 13 of the total 78 families live below the poverty line. Families with no children have the highest poverty rate of 16.9%, comprising of 13 families. On the other hand, families with 1 or 2 children have the lowest poverty rate of 0.0%, which includes 0 families.
| Children | Above Poverty | Below Poverty |
| No Children | 64 (83.1%) | 13 (16.9%) |
| 1 or 2 Children | 1 (100.0%) | 0 (0.0%) |
| 3 or 4 Children | 0 (0.0%) | 0 (0.0%) |
| 5 or more Children | 0 (0.0%) | 0 (0.0%) |
| Total | 65 (83.3%) | 13 (16.7%) |
Income Below Poverty Among Single-Parent Households in Cliffside
| Children | Single Father | Single Mother |
| No Children | 0 (0.0%) | 0 (0.0%) |
| 1 or 2 Children | 0 (0.0%) | 0 (0.0%) |
| 3 or 4 Children | 0 (0.0%) | 0 (0.0%) |
| 5 or more Children | 0 (0.0%) | 0 (0.0%) |
| Total | 0 (0.0%) | 0 (0.0%) |
Income Below Poverty Among Married-Couple vs Single-Parent Households in Cliffside
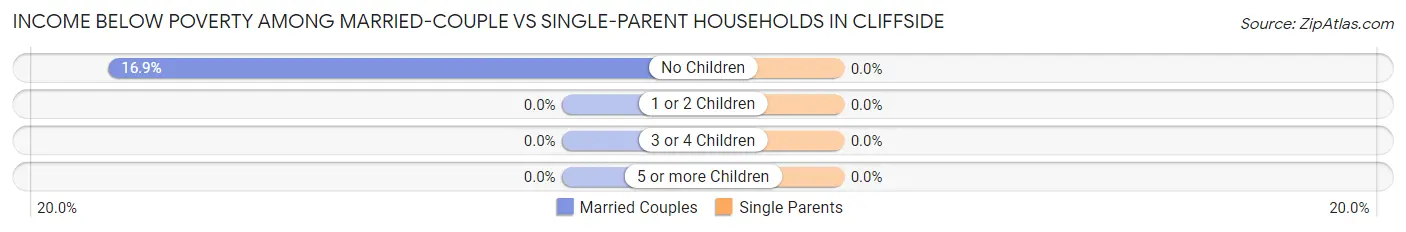
| Children | Married-Couple Families | Single-Parent Households |
| No Children | 13 (16.9%) | 0 (0.0%) |
| 1 or 2 Children | 0 (0.0%) | 0 (0.0%) |
| 3 or 4 Children | 0 (0.0%) | 0 (0.0%) |
| 5 or more Children | 0 (0.0%) | 0 (0.0%) |
| Total | 13 (16.7%) | 0 (0.0%) |
Race in Cliffside
The most populous races in Cliffside are White / Caucasian (378 | 89.1%), and Black / African American (46 | 10.8%).
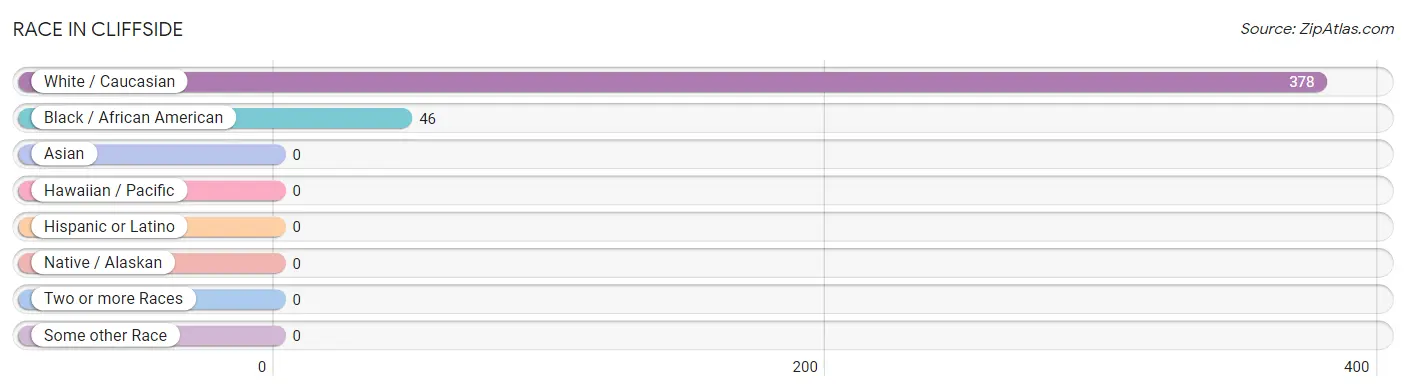
| Race | # Population | % Population |
| Asian | 0 | 0.0% |
| Black / African American | 46 | 10.8% |
| Hawaiian / Pacific | 0 | 0.0% |
| Hispanic or Latino | 0 | 0.0% |
| Native / Alaskan | 0 | 0.0% |
| White / Caucasian | 378 | 89.1% |
| Two or more Races | 0 | 0.0% |
| Some other Race | 0 | 0.0% |
| Total | 424 | 100.0% |
Ancestry in Cliffside
The most populous ancestries reported in Cliffside are American (265 | 62.5%), English (57 | 13.4%), Welsh (13 | 3.1%), and German (11 | 2.6%), together accounting for 81.6% of all Cliffside residents.
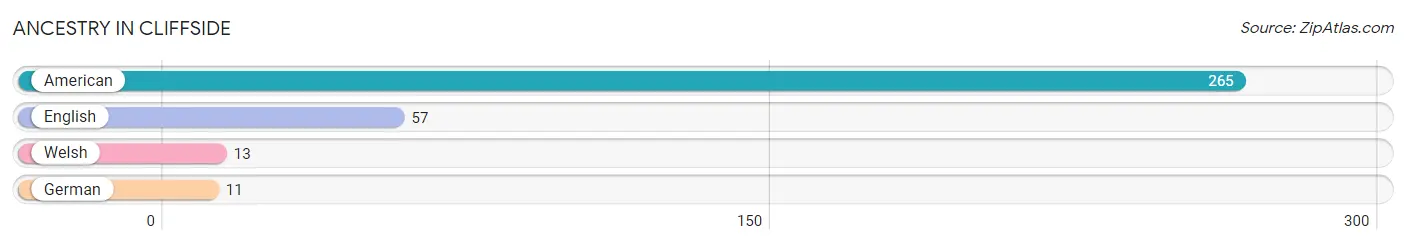
| Ancestry | # Population | % Population |
| American | 265 | 62.5% |
| English | 57 | 13.4% |
| German | 11 | 2.6% |
| Welsh | 13 | 3.1% | View All 4 Rows |
Immigrants in Cliffside

| Immigration Origin | # Population | % Population | View All 0 Rows |
Sex and Age in Cliffside
Sex and Age in Cliffside
The most populous age groups in Cliffside are 70 to 74 Years (74 | 25.8%) for men and 50 to 54 Years (52 | 38.0%) for women.
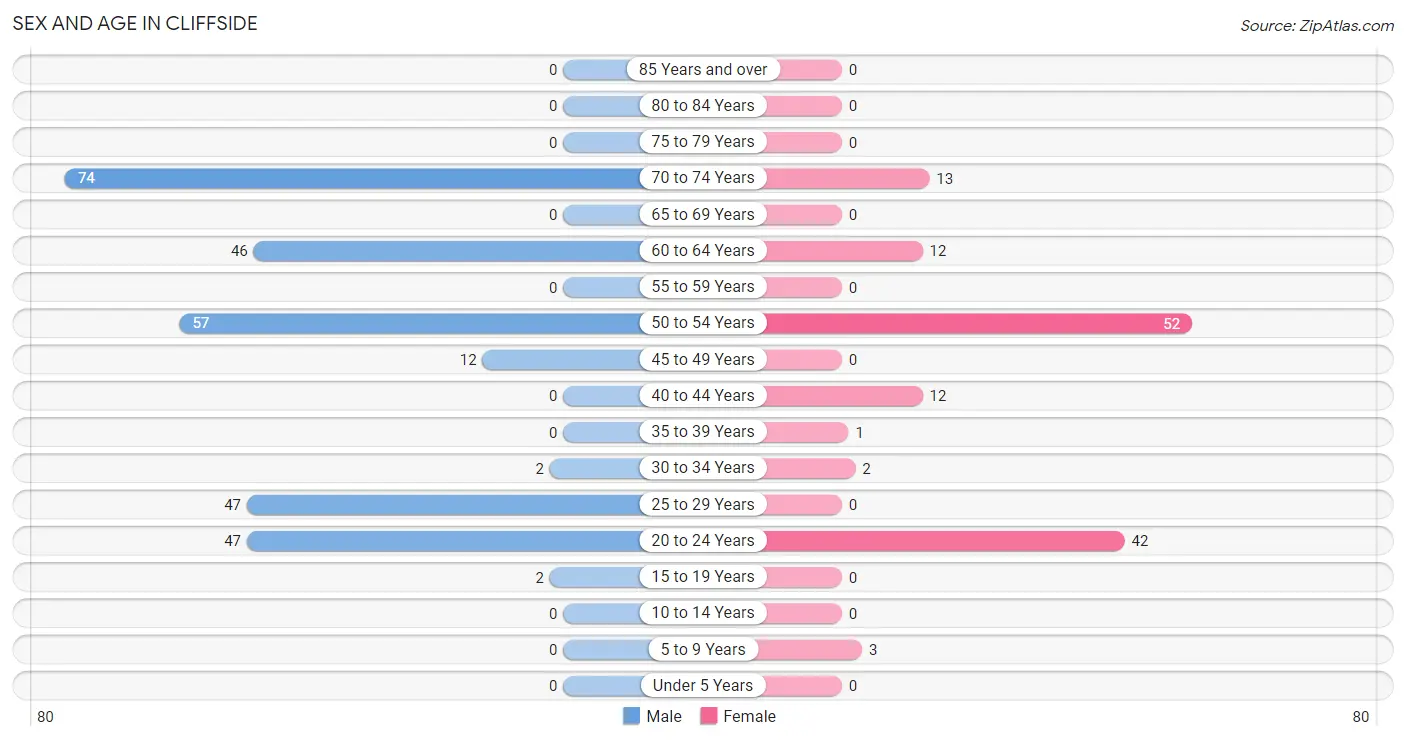
| Age Bracket | Male | Female |
| Under 5 Years | 0 (0.0%) | 0 (0.0%) |
| 5 to 9 Years | 0 (0.0%) | 3 (2.2%) |
| 10 to 14 Years | 0 (0.0%) | 0 (0.0%) |
| 15 to 19 Years | 2 (0.7%) | 0 (0.0%) |
| 20 to 24 Years | 47 (16.4%) | 42 (30.7%) |
| 25 to 29 Years | 47 (16.4%) | 0 (0.0%) |
| 30 to 34 Years | 2 (0.7%) | 2 (1.5%) |
| 35 to 39 Years | 0 (0.0%) | 1 (0.7%) |
| 40 to 44 Years | 0 (0.0%) | 12 (8.8%) |
| 45 to 49 Years | 12 (4.2%) | 0 (0.0%) |
| 50 to 54 Years | 57 (19.9%) | 52 (38.0%) |
| 55 to 59 Years | 0 (0.0%) | 0 (0.0%) |
| 60 to 64 Years | 46 (16.0%) | 12 (8.8%) |
| 65 to 69 Years | 0 (0.0%) | 0 (0.0%) |
| 70 to 74 Years | 74 (25.8%) | 13 (9.5%) |
| 75 to 79 Years | 0 (0.0%) | 0 (0.0%) |
| 80 to 84 Years | 0 (0.0%) | 0 (0.0%) |
| 85 Years and over | 0 (0.0%) | 0 (0.0%) |
| Total | 287 (100.0%) | 137 (100.0%) |
Families and Households in Cliffside
Median Family Size in Cliffside
The median family size in Cliffside is 2.71 persons per family, with single male/father families (41 | 33.9%) accounting for the largest median family size of 4.32 persons per family. On the other hand, married-couple families (78 | 64.5%) represent the smallest median family size with 1.88 persons per family.
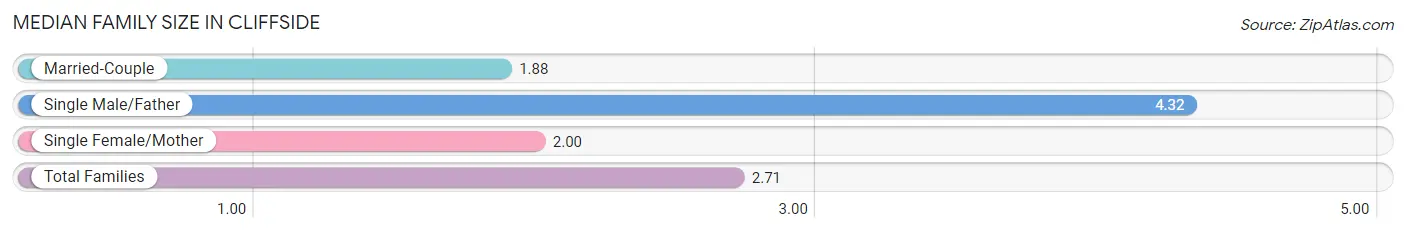
| Family Type | # Families | Family Size |
| Married-Couple | 78 (64.5%) | 1.88 |
| Single Male/Father | 41 (33.9%) | 4.32 |
| Single Female/Mother | 2 (1.7%) | 2.00 |
| Total Families | 121 (100.0%) | 2.71 |
Median Household Size in Cliffside
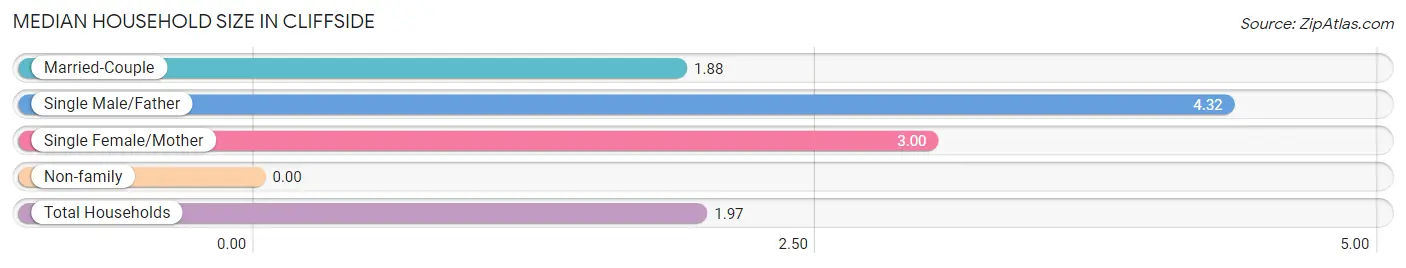
| Household Type | # Households | Household Size |
| Married-Couple | 78 (36.3%) | 1.88 |
| Single Male/Father | 41 (19.1%) | 4.32 |
| Single Female/Mother | 2 (0.9%) | 3.00 |
| Non-family | 94 (43.7%) | - |
| Total Households | 215 (100.0%) | 1.97 |
Household Size by Marriage Status in Cliffside
Out of a total of 215 households in Cliffside, 121 (56.3%) are family households, while 94 (43.7%) are nonfamily households. The most numerous type of family households are 2-person households, comprising 77, and the most common type of nonfamily households are 1-person households, comprising 94.
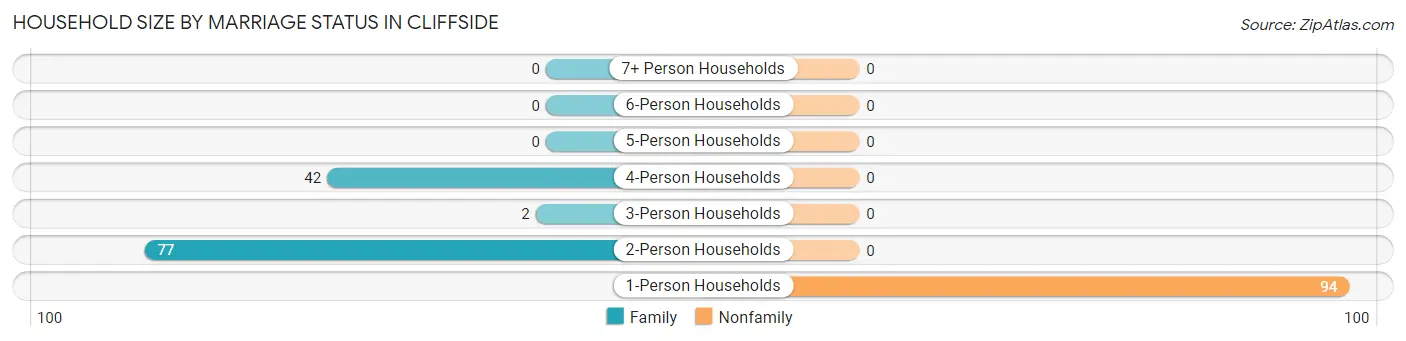
| Household Size | Family Households | Nonfamily Households |
| 1-Person Households | - | 94 (43.7%) |
| 2-Person Households | 77 (35.8%) | 0 (0.0%) |
| 3-Person Households | 2 (0.9%) | 0 (0.0%) |
| 4-Person Households | 42 (19.5%) | 0 (0.0%) |
| 5-Person Households | 0 (0.0%) | 0 (0.0%) |
| 6-Person Households | 0 (0.0%) | 0 (0.0%) |
| 7+ Person Households | 0 (0.0%) | 0 (0.0%) |
| Total | 121 (56.3%) | 94 (43.7%) |
Female Fertility in Cliffside
Fertility by Age in Cliffside
| Age Bracket | Women with Births | Births / 1,000 Women |
| 15 to 19 years | 0 (0.0%) | 0.0 |
| 20 to 34 years | 0 (0.0%) | 0.0 |
| 35 to 50 years | 0 (0.0%) | 0.0 |
| Total | 0 (0.0%) | 0.0 |
Fertility by Age by Marriage Status in Cliffside
| Age Bracket | Married | Unmarried |
| 15 to 19 years | 0 (0.0%) | 0 (0.0%) |
| 20 to 34 years | 0 (0.0%) | 0 (0.0%) |
| 35 to 50 years | 0 (0.0%) | 0 (0.0%) |
| Total | 0 (0.0%) | 0 (0.0%) |
Fertility by Education in Cliffside
| Educational Attainment | Women with Births | Births / 1,000 Women |
| Less than High School | 0 (0.0%) | 0.0 |
| High School Diploma | 0 (0.0%) | 0.0 |
| College or Associate's Degree | 0 (0.0%) | 0.0 |
| Bachelor's Degree | 0 (0.0%) | 0.0 |
| Graduate Degree | 0 (0.0%) | 0.0 |
| Total | 0 (0.0%) | 0.0 |
Fertility by Education by Marriage Status in Cliffside
| Educational Attainment | Married | Unmarried |
| Less than High School | 0 (0.0%) | 0 (0.0%) |
| High School Diploma | 0 (0.0%) | 0 (0.0%) |
| College or Associate's Degree | 0 (0.0%) | 0 (0.0%) |
| Bachelor's Degree | 0 (0.0%) | 0 (0.0%) |
| Graduate Degree | 0 (0.0%) | 0 (0.0%) |
| Total | 0 (0.0%) | 0 (0.0%) |
Employment Characteristics in Cliffside
Employment by Class of Employer in Cliffside
Among the 87 employed individuals in Cliffside, private company employees (74 | 85.1%), local government employees (12 | 13.8%), and self-employed (not incorporated) (1 | 1.1%) make up the most common classes of employment.
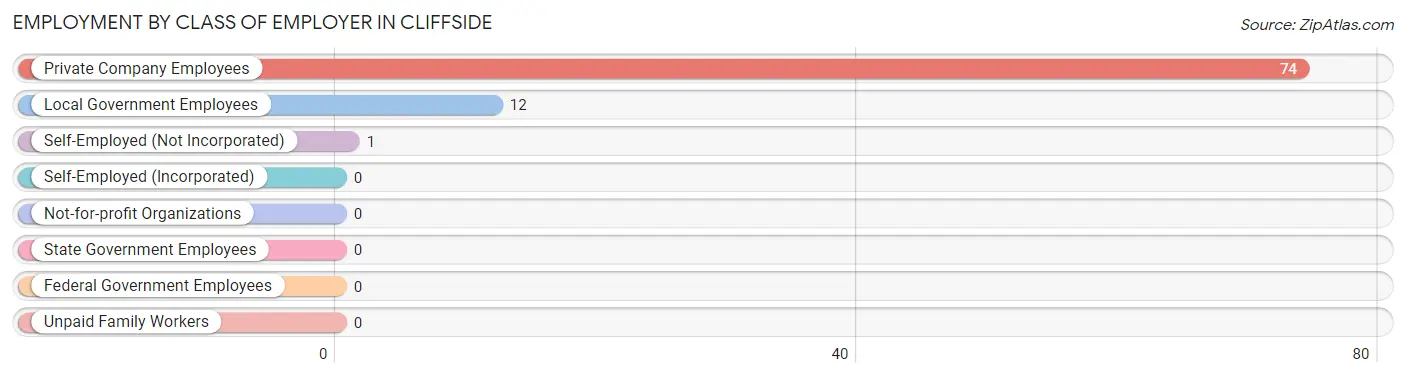
| Employer Class | # Employees | % Employees |
| Private Company Employees | 74 | 85.1% |
| Self-Employed (Incorporated) | 0 | 0.0% |
| Self-Employed (Not Incorporated) | 1 | 1.1% |
| Not-for-profit Organizations | 0 | 0.0% |
| Local Government Employees | 12 | 13.8% |
| State Government Employees | 0 | 0.0% |
| Federal Government Employees | 0 | 0.0% |
| Unpaid Family Workers | 0 | 0.0% |
| Total | 87 | 100.0% |
Employment Status by Age in Cliffside
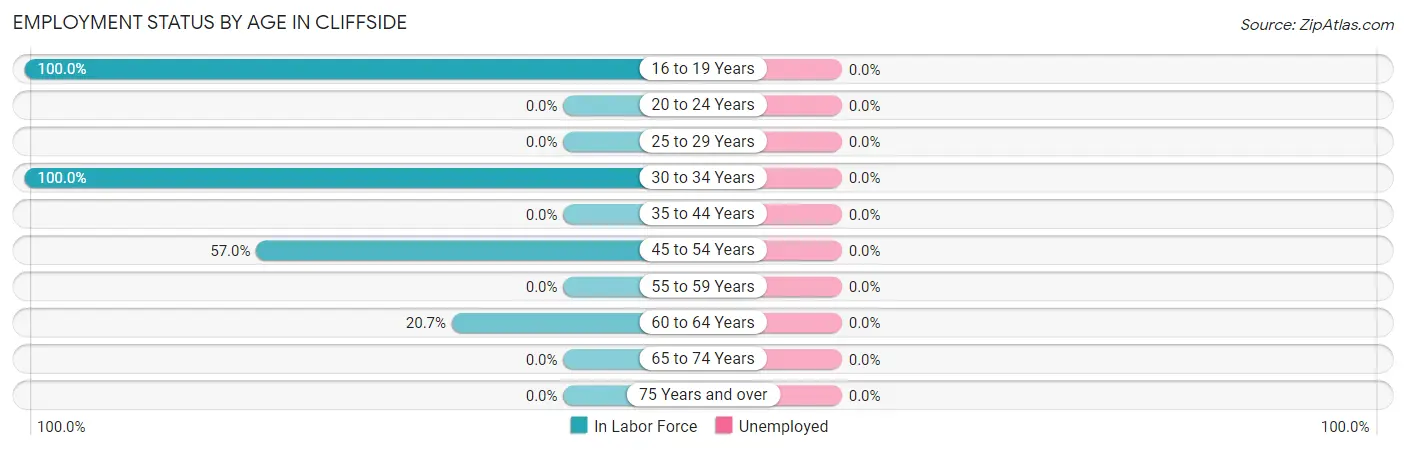
| Age Bracket | In Labor Force | Unemployed |
| 16 to 19 Years | 2 (100.0%) | 0 (0.0%) |
| 20 to 24 Years | 0 (0.0%) | 0 (0.0%) |
| 25 to 29 Years | 0 (0.0%) | 0 (0.0%) |
| 30 to 34 Years | 4 (100.0%) | 0 (0.0%) |
| 35 to 44 Years | 0 (0.0%) | 0 (0.0%) |
| 45 to 54 Years | 69 (57.0%) | 0 (0.0%) |
| 55 to 59 Years | 0 (0.0%) | 0 (0.0%) |
| 60 to 64 Years | 12 (20.7%) | 0 (0.0%) |
| 65 to 74 Years | 0 (0.0%) | 0 (0.0%) |
| 75 Years and over | 0 (0.0%) | 0 (0.0%) |
| Total | 87 (20.7%) | 0 (0.0%) |
Employment Status by Educational Attainment in Cliffside
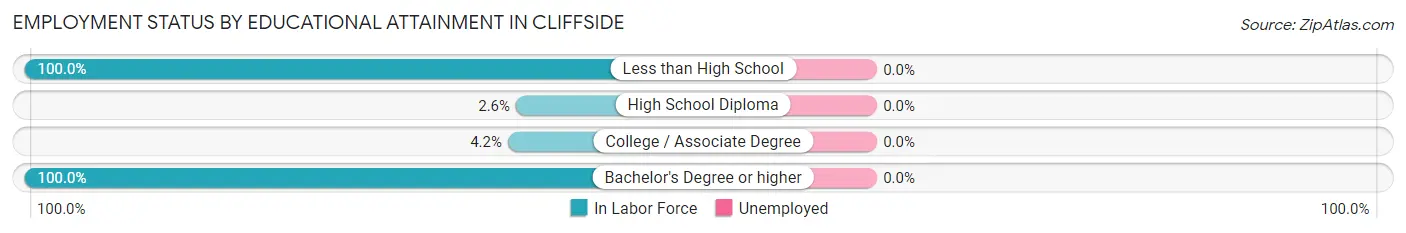
| Educational Attainment | In Labor Force | Unemployed |
| Less than High School | 27 (100.0%) | 0 (0.0%) |
| High School Diploma | 3 (2.6%) | 0 (0.0%) |
| College / Associate Degree | 2 (4.2%) | 0 (0.0%) |
| Bachelor's Degree or higher | 53 (100.0%) | 0 (0.0%) |
| Total | 85 (35.0%) | 0 (0.0%) |
Employment Occupations by Sex in Cliffside
Management, Business, Science and Arts Occupations
The most common Management, Business, Science and Arts occupations in Cliffside are Community & Social Service (12 | 13.8%), Education Instruction & Library (12 | 13.8%), and Health Diagnosing & Treating (2 | 2.3%).
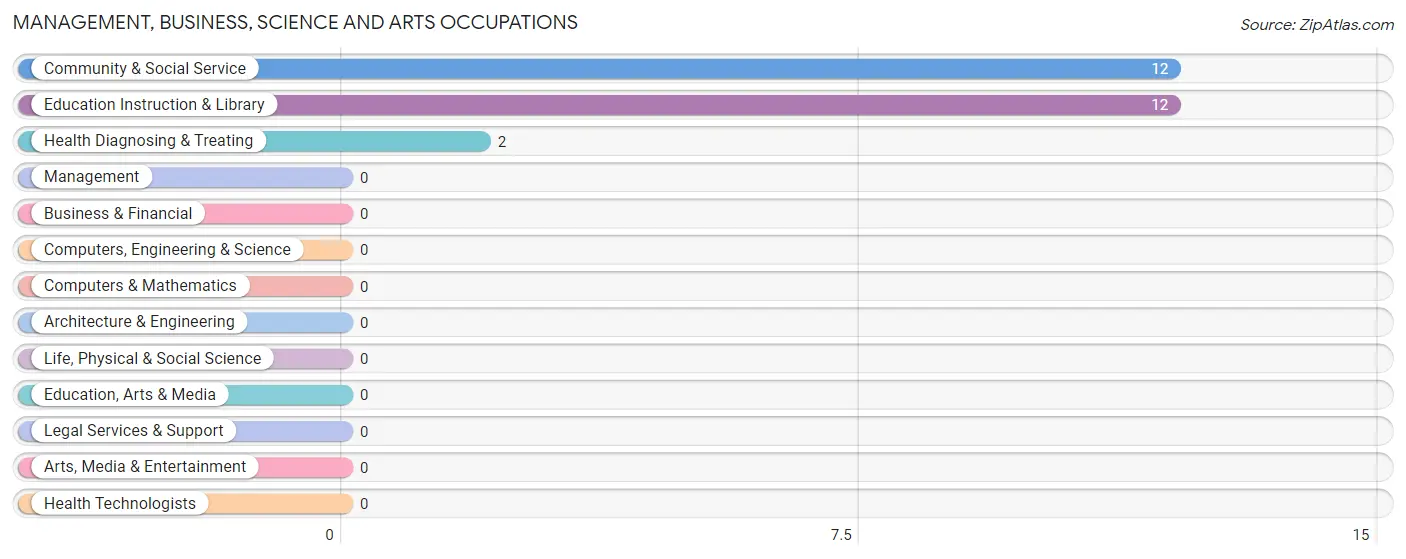
Management, Business, Science and Arts Occupations by Sex
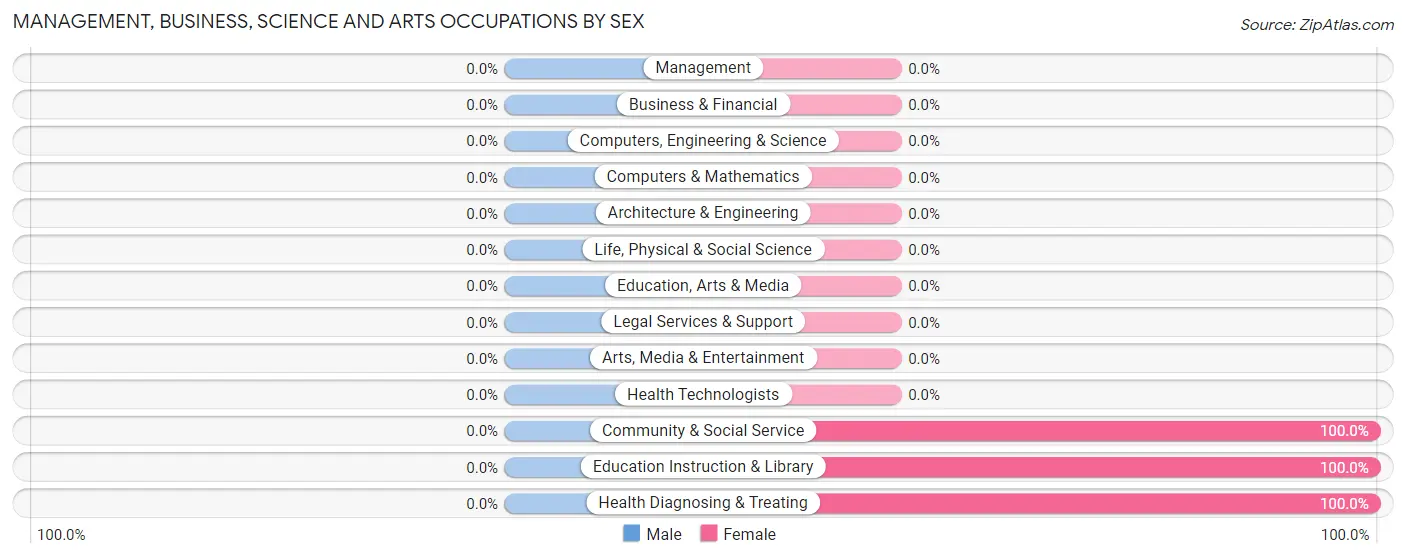
| Occupation | Male | Female |
| Management | 0 (0.0%) | 0 (0.0%) |
| Business & Financial | 0 (0.0%) | 0 (0.0%) |
| Computers, Engineering & Science | 0 (0.0%) | 0 (0.0%) |
| Computers & Mathematics | 0 (0.0%) | 0 (0.0%) |
| Architecture & Engineering | 0 (0.0%) | 0 (0.0%) |
| Life, Physical & Social Science | 0 (0.0%) | 0 (0.0%) |
| Community & Social Service | 0 (0.0%) | 12 (100.0%) |
| Education, Arts & Media | 0 (0.0%) | 0 (0.0%) |
| Legal Services & Support | 0 (0.0%) | 0 (0.0%) |
| Education Instruction & Library | 0 (0.0%) | 12 (100.0%) |
| Arts, Media & Entertainment | 0 (0.0%) | 0 (0.0%) |
| Health Diagnosing & Treating | 0 (0.0%) | 2 (100.0%) |
| Health Technologists | 0 (0.0%) | 0 (0.0%) |
| Total (Category) | 0 (0.0%) | 14 (100.0%) |
| Total (Overall) | 73 (83.9%) | 14 (16.1%) |
Services Occupations
The most common Services occupations in Cliffside are Food Preparation & Serving (15 | 17.2%), and Cleaning & Maintenance (1 | 1.1%).
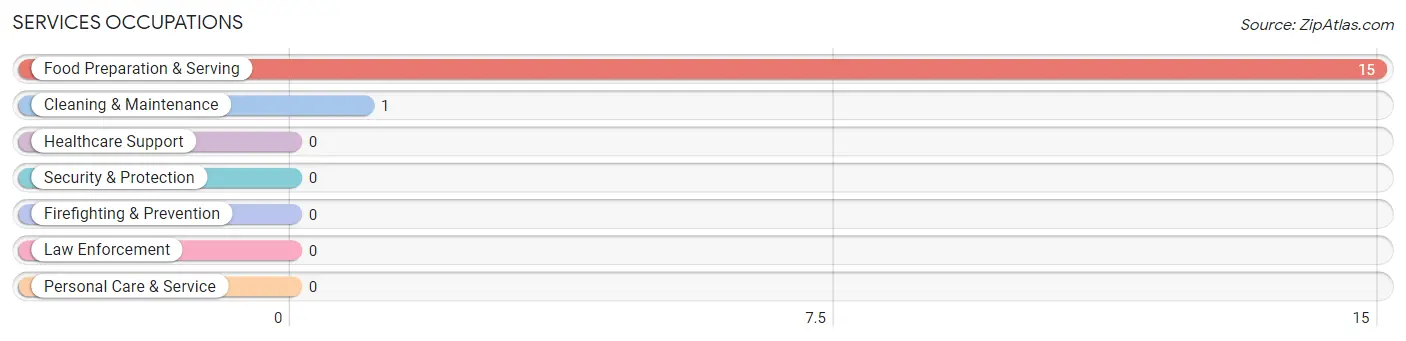
Services Occupations by Sex
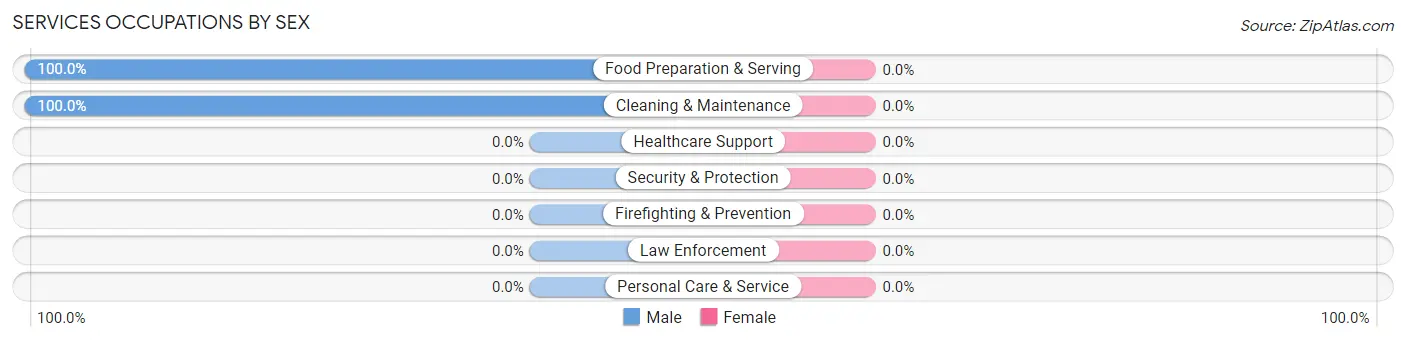
| Occupation | Male | Female |
| Healthcare Support | 0 (0.0%) | 0 (0.0%) |
| Security & Protection | 0 (0.0%) | 0 (0.0%) |
| Firefighting & Prevention | 0 (0.0%) | 0 (0.0%) |
| Law Enforcement | 0 (0.0%) | 0 (0.0%) |
| Food Preparation & Serving | 15 (100.0%) | 0 (0.0%) |
| Cleaning & Maintenance | 1 (100.0%) | 0 (0.0%) |
| Personal Care & Service | 0 (0.0%) | 0 (0.0%) |
| Total (Category) | 16 (100.0%) | 0 (0.0%) |
| Total (Overall) | 73 (83.9%) | 14 (16.1%) |
Sales and Office Occupations
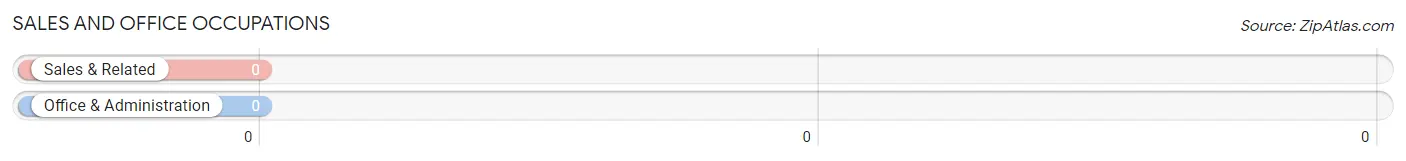
Sales and Office Occupations by Sex
| Occupation | Male | Female |
| Sales & Related | 0 (0.0%) | 0 (0.0%) |
| Office & Administration | 0 (0.0%) | 0 (0.0%) |
| Total (Category) | 0 (0.0%) | 0 (0.0%) |
| Total (Overall) | 73 (83.9%) | 14 (16.1%) |
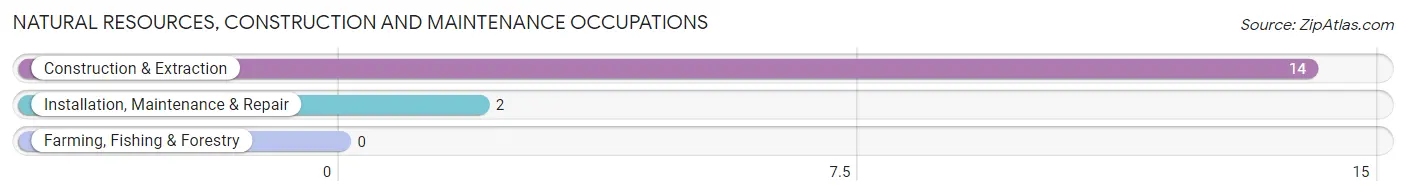
Natural Resources, Construction and Maintenance Occupations
The most common Natural Resources, Construction and Maintenance occupations in Cliffside are Construction & Extraction (14 | 16.1%), and Installation, Maintenance & Repair (2 | 2.3%).
Natural Resources, Construction and Maintenance Occupations by Sex
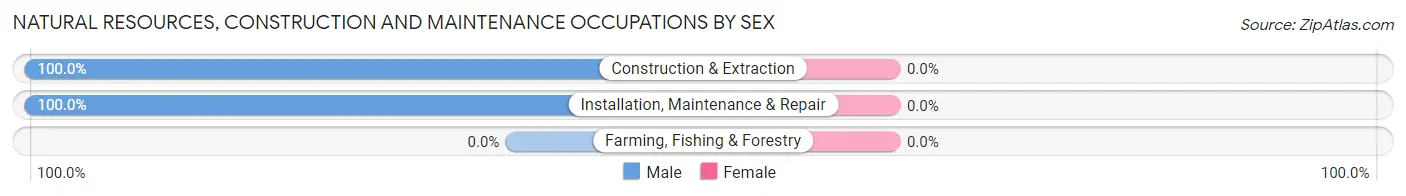
| Occupation | Male | Female |
| Farming, Fishing & Forestry | 0 (0.0%) | 0 (0.0%) |
| Construction & Extraction | 14 (100.0%) | 0 (0.0%) |
| Installation, Maintenance & Repair | 2 (100.0%) | 0 (0.0%) |
| Total (Category) | 16 (100.0%) | 0 (0.0%) |
| Total (Overall) | 73 (83.9%) | 14 (16.1%) |
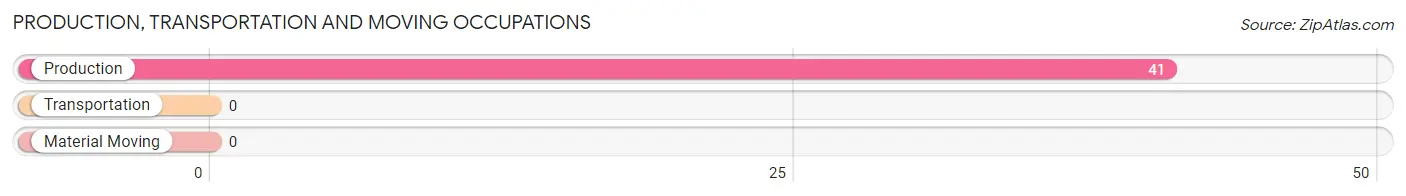
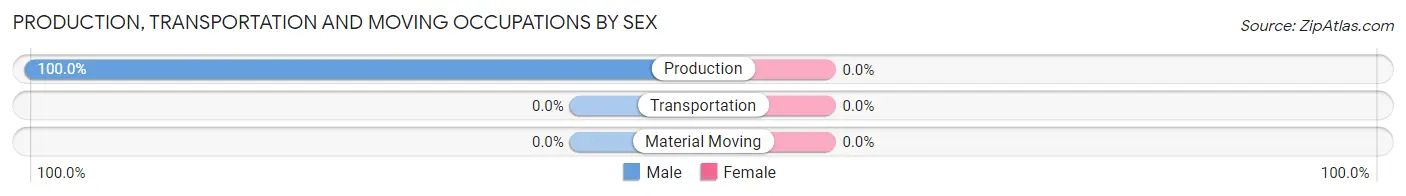
Production, Transportation and Moving Occupations
The most common Production, Transportation and Moving occupations in Cliffside are , and Production (41 | 47.1%).
Production, Transportation and Moving Occupations by Sex
| Occupation | Male | Female |
| Production | 41 (100.0%) | 0 (0.0%) |
| Transportation | 0 (0.0%) | 0 (0.0%) |
| Material Moving | 0 (0.0%) | 0 (0.0%) |
| Total (Category) | 41 (100.0%) | 0 (0.0%) |
| Total (Overall) | 73 (83.9%) | 14 (16.1%) |
Employment Industries by Sex in Cliffside
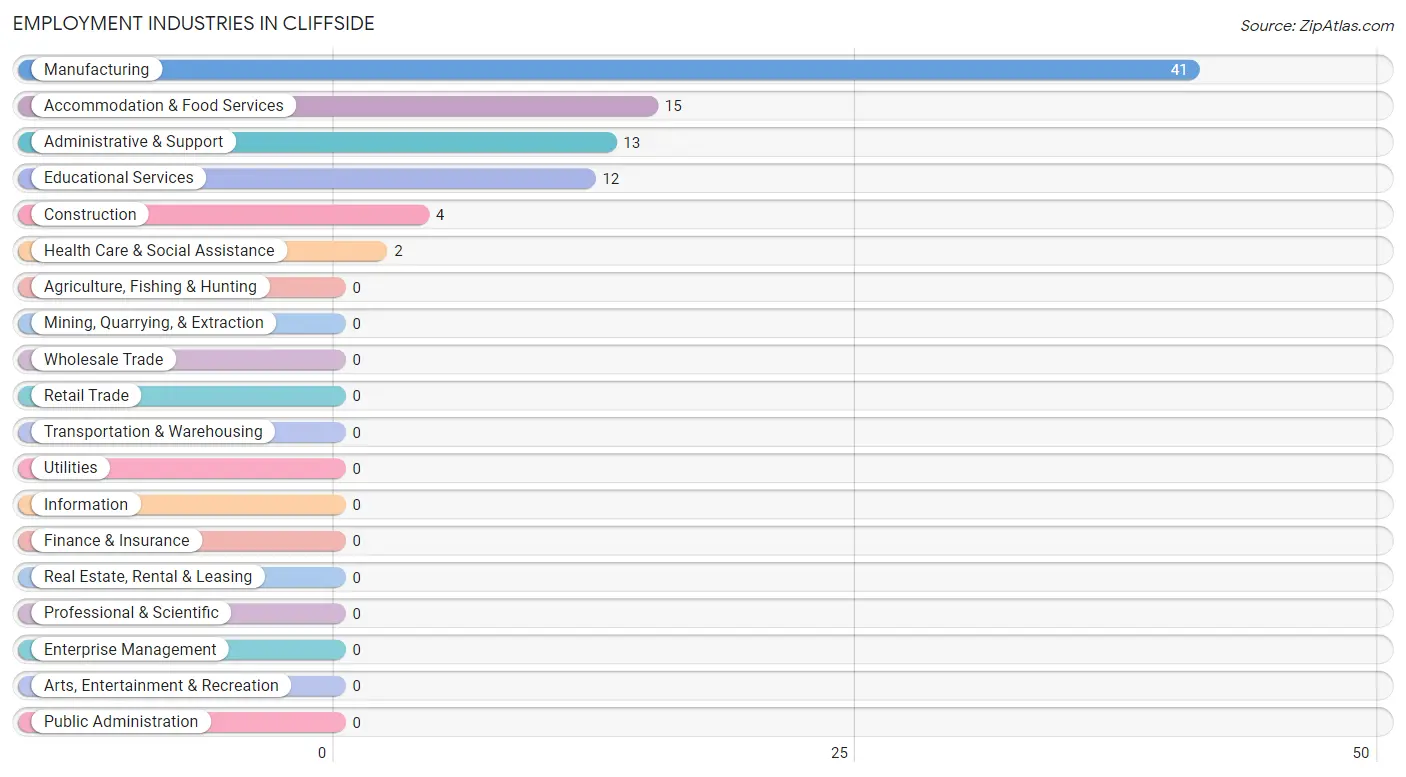
Employment Industries in Cliffside
The major employment industries in Cliffside include Manufacturing (41 | 47.1%), Accommodation & Food Services (15 | 17.2%), Administrative & Support (13 | 14.9%), Educational Services (12 | 13.8%), and Construction (4 | 4.6%).
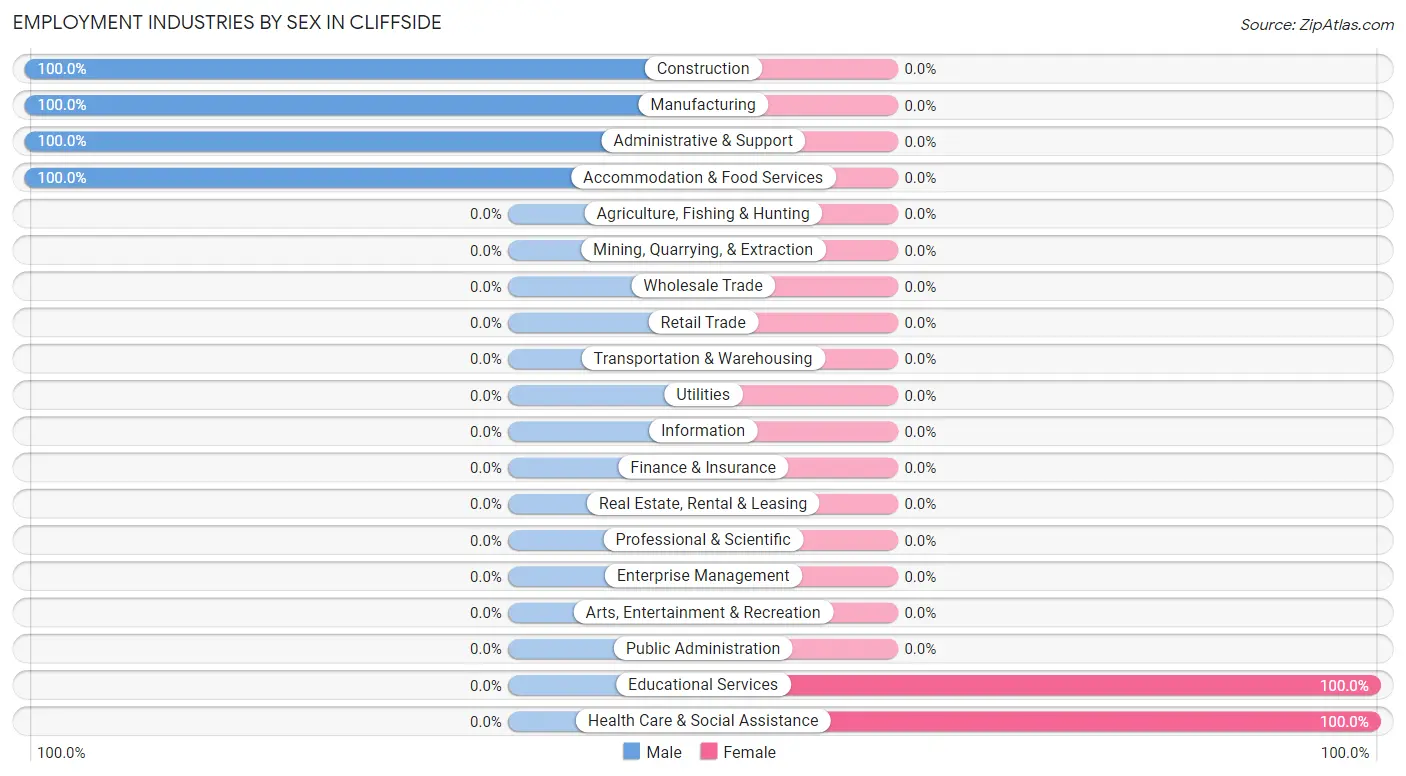
Employment Industries by Sex in Cliffside
The Cliffside industries that see more men than women are Construction (100.0%), Manufacturing (100.0%), and Administrative & Support (100.0%), whereas the industries that tend to have a higher number of women are Educational Services (100.0%), and Health Care & Social Assistance (100.0%).
| Industry | Male | Female |
| Agriculture, Fishing & Hunting | 0 (0.0%) | 0 (0.0%) |
| Mining, Quarrying, & Extraction | 0 (0.0%) | 0 (0.0%) |
| Construction | 4 (100.0%) | 0 (0.0%) |
| Manufacturing | 41 (100.0%) | 0 (0.0%) |
| Wholesale Trade | 0 (0.0%) | 0 (0.0%) |
| Retail Trade | 0 (0.0%) | 0 (0.0%) |
| Transportation & Warehousing | 0 (0.0%) | 0 (0.0%) |
| Utilities | 0 (0.0%) | 0 (0.0%) |
| Information | 0 (0.0%) | 0 (0.0%) |
| Finance & Insurance | 0 (0.0%) | 0 (0.0%) |
| Real Estate, Rental & Leasing | 0 (0.0%) | 0 (0.0%) |
| Professional & Scientific | 0 (0.0%) | 0 (0.0%) |
| Enterprise Management | 0 (0.0%) | 0 (0.0%) |
| Administrative & Support | 13 (100.0%) | 0 (0.0%) |
| Educational Services | 0 (0.0%) | 12 (100.0%) |
| Health Care & Social Assistance | 0 (0.0%) | 2 (100.0%) |
| Arts, Entertainment & Recreation | 0 (0.0%) | 0 (0.0%) |
| Accommodation & Food Services | 15 (100.0%) | 0 (0.0%) |
| Public Administration | 0 (0.0%) | 0 (0.0%) |
| Total | 73 (83.9%) | 14 (16.1%) |
Education in Cliffside
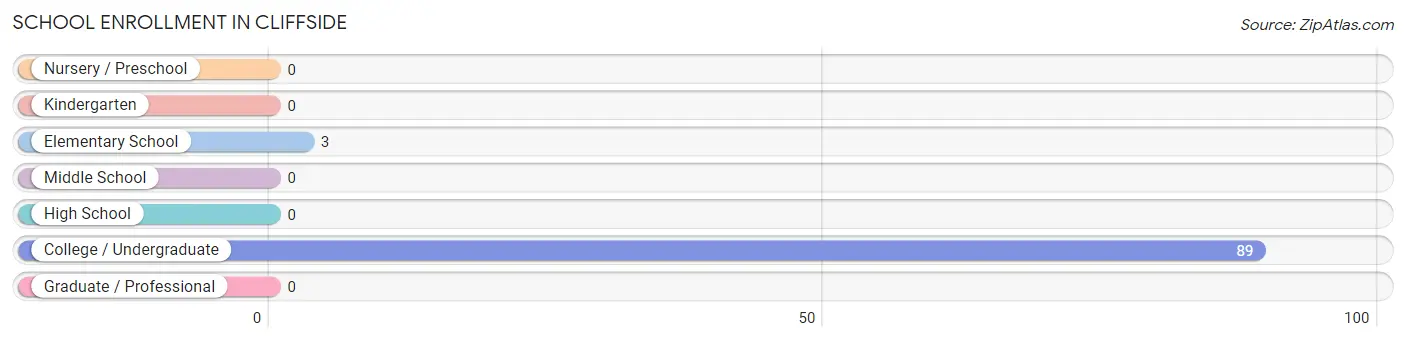
School Enrollment in Cliffside
The most common levels of schooling among the 92 students in Cliffside are college / undergraduate (89 | 96.7%), and elementary school (3 | 3.3%).
| School Level | # Students | % Students |
| Nursery / Preschool | 0 | 0.0% |
| Kindergarten | 0 | 0.0% |
| Elementary School | 3 | 3.3% |
| Middle School | 0 | 0.0% |
| High School | 0 | 0.0% |
| College / Undergraduate | 89 | 96.7% |
| Graduate / Professional | 0 | 0.0% |
| Total | 92 | 100.0% |
School Enrollment by Age by Funding Source in Cliffside
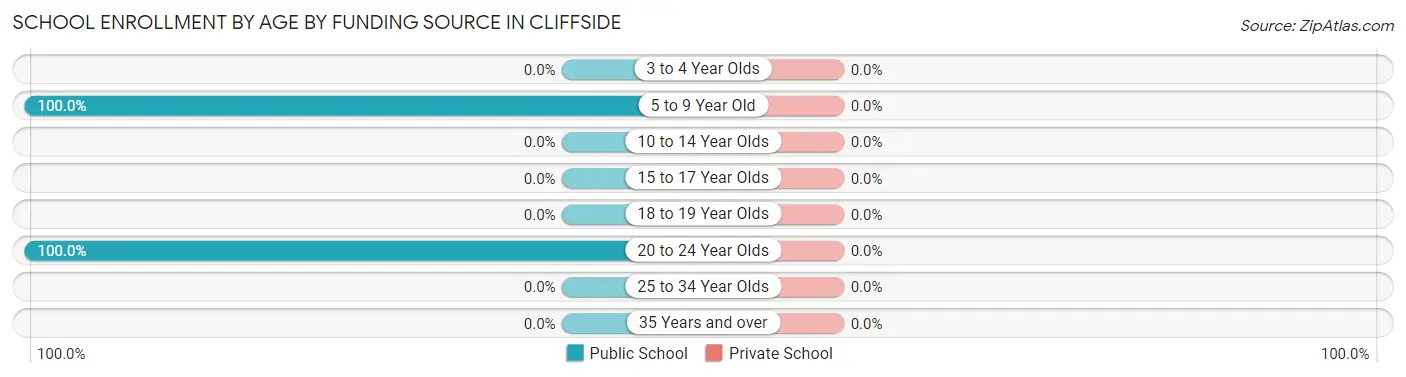
| Age Bracket | Public School | Private School |
| 3 to 4 Year Olds | 0 (0.0%) | 0 (0.0%) |
| 5 to 9 Year Old | 3 (100.0%) | 0 (0.0%) |
| 10 to 14 Year Olds | 0 (0.0%) | 0 (0.0%) |
| 15 to 17 Year Olds | 0 (0.0%) | 0 (0.0%) |
| 18 to 19 Year Olds | 0 (0.0%) | 0 (0.0%) |
| 20 to 24 Year Olds | 89 (100.0%) | 0 (0.0%) |
| 25 to 34 Year Olds | 0 (0.0%) | 0 (0.0%) |
| 35 Years and over | 0 (0.0%) | 0 (0.0%) |
| Total | 92 (100.0%) | 0 (0.0%) |
Educational Attainment by Field of Study in Cliffside
Social sciences (41 | 62.1%), and education (25 | 37.9%) are the most common fields of study among 66 individuals in Cliffside who have obtained a bachelor's degree or higher.
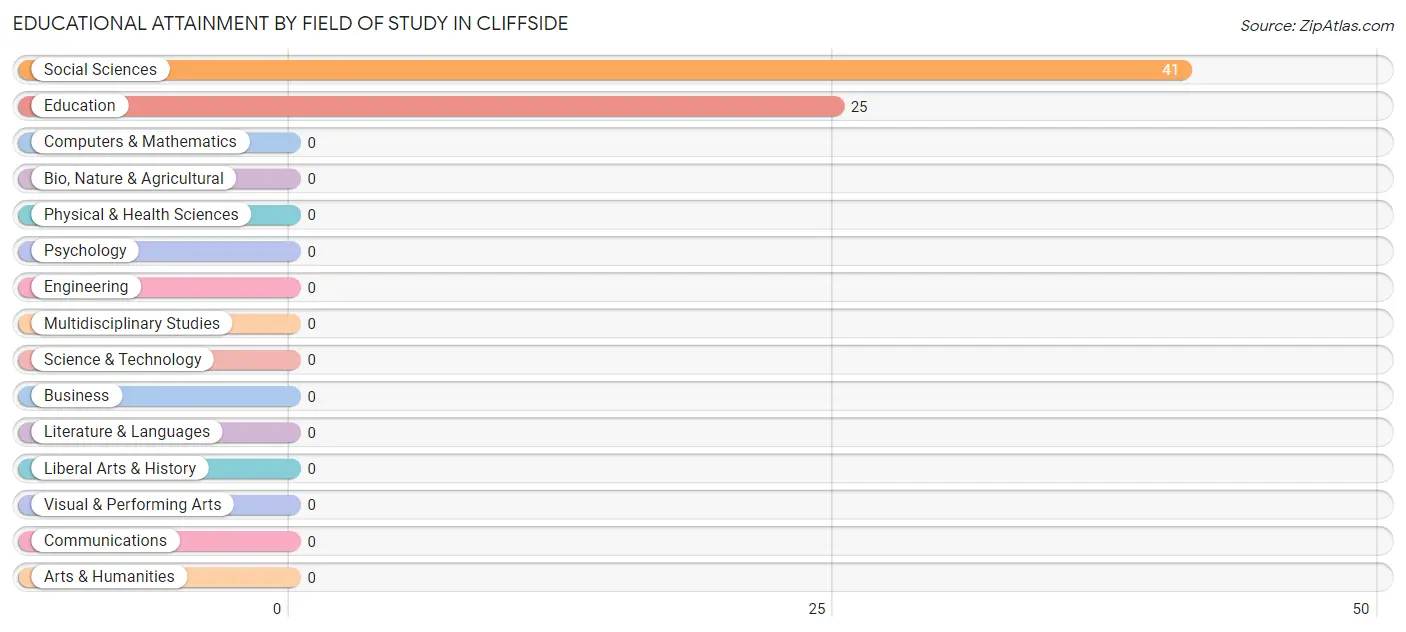
| Field of Study | # Graduates | % Graduates |
| Computers & Mathematics | 0 | 0.0% |
| Bio, Nature & Agricultural | 0 | 0.0% |
| Physical & Health Sciences | 0 | 0.0% |
| Psychology | 0 | 0.0% |
| Social Sciences | 41 | 62.1% |
| Engineering | 0 | 0.0% |
| Multidisciplinary Studies | 0 | 0.0% |
| Science & Technology | 0 | 0.0% |
| Business | 0 | 0.0% |
| Education | 25 | 37.9% |
| Literature & Languages | 0 | 0.0% |
| Liberal Arts & History | 0 | 0.0% |
| Visual & Performing Arts | 0 | 0.0% |
| Communications | 0 | 0.0% |
| Arts & Humanities | 0 | 0.0% |
| Total | 66 | 100.0% |
Transportation & Commute in Cliffside
Vehicle Availability by Sex in Cliffside
The most prevalent vehicle ownership categories in Cliffside are males with 5 or more vehicles (41, accounting for 56.2%) and females with 5 or more vehicles (0, making up 292.9%).
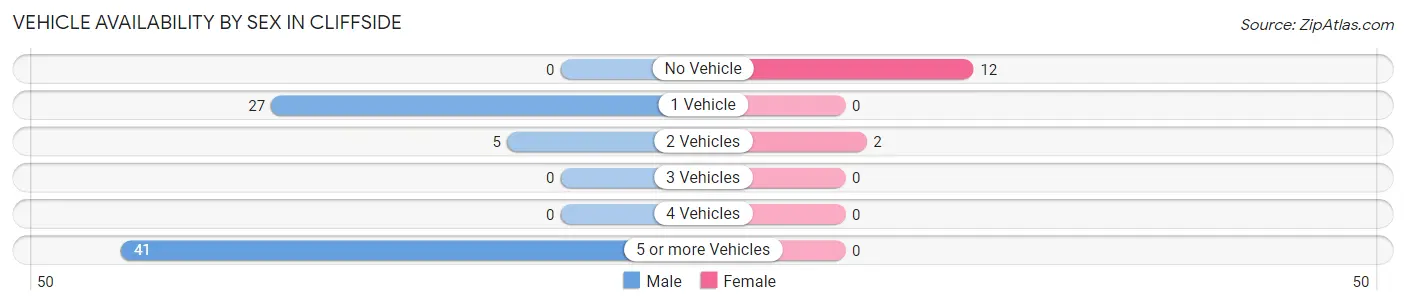
| Vehicles Available | Male | Female |
| No Vehicle | 0 (0.0%) | 12 (85.7%) |
| 1 Vehicle | 27 (37.0%) | 0 (0.0%) |
| 2 Vehicles | 5 (6.9%) | 2 (14.3%) |
| 3 Vehicles | 0 (0.0%) | 0 (0.0%) |
| 4 Vehicles | 0 (0.0%) | 0 (0.0%) |
| 5 or more Vehicles | 41 (56.2%) | 0 (0.0%) |
| Total | 73 (100.0%) | 14 (100.0%) |
Commute Time in Cliffside
The most frequently occuring commute durations in Cliffside are 10 to 14 minutes (56 commuters, 65.1%), 15 to 19 minutes (12 commuters, 14.0%), and 35 to 39 minutes (12 commuters, 14.0%).
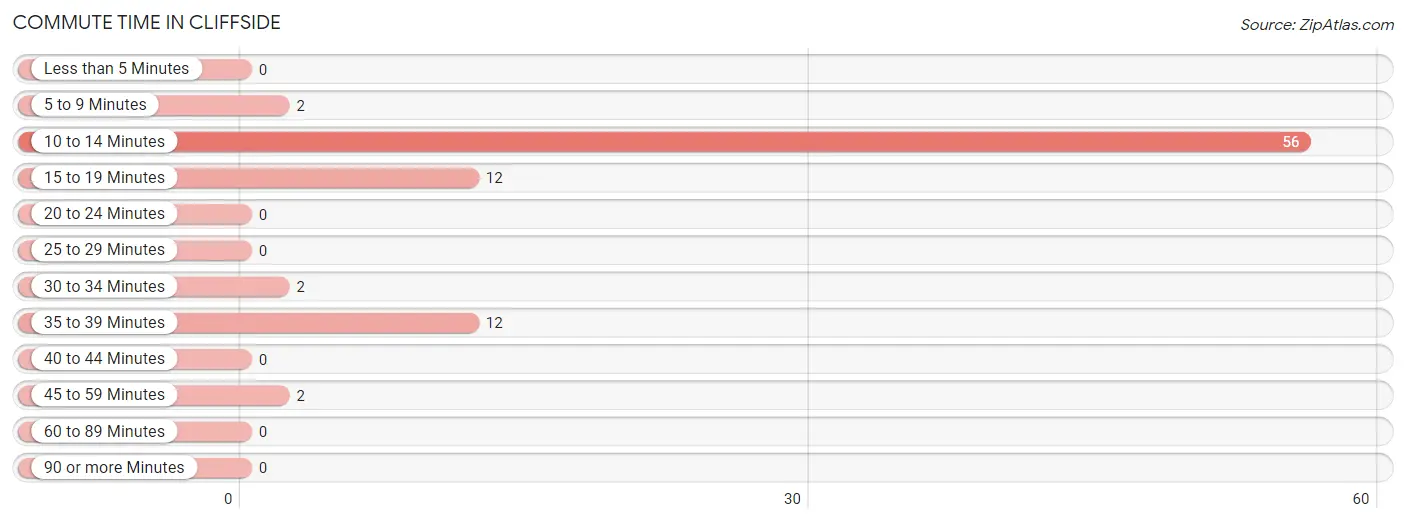
| Commute Time | # Commuters | % Commuters |
| Less than 5 Minutes | 0 | 0.0% |
| 5 to 9 Minutes | 2 | 2.3% |
| 10 to 14 Minutes | 56 | 65.1% |
| 15 to 19 Minutes | 12 | 14.0% |
| 20 to 24 Minutes | 0 | 0.0% |
| 25 to 29 Minutes | 0 | 0.0% |
| 30 to 34 Minutes | 2 | 2.3% |
| 35 to 39 Minutes | 12 | 14.0% |
| 40 to 44 Minutes | 0 | 0.0% |
| 45 to 59 Minutes | 2 | 2.3% |
| 60 to 89 Minutes | 0 | 0.0% |
| 90 or more Minutes | 0 | 0.0% |
Commute Time by Sex in Cliffside
The most common commute times in Cliffside are 10 to 14 minutes (56 commuters, 77.8%) for males and 15 to 19 minutes (12 commuters, 85.7%) for females.
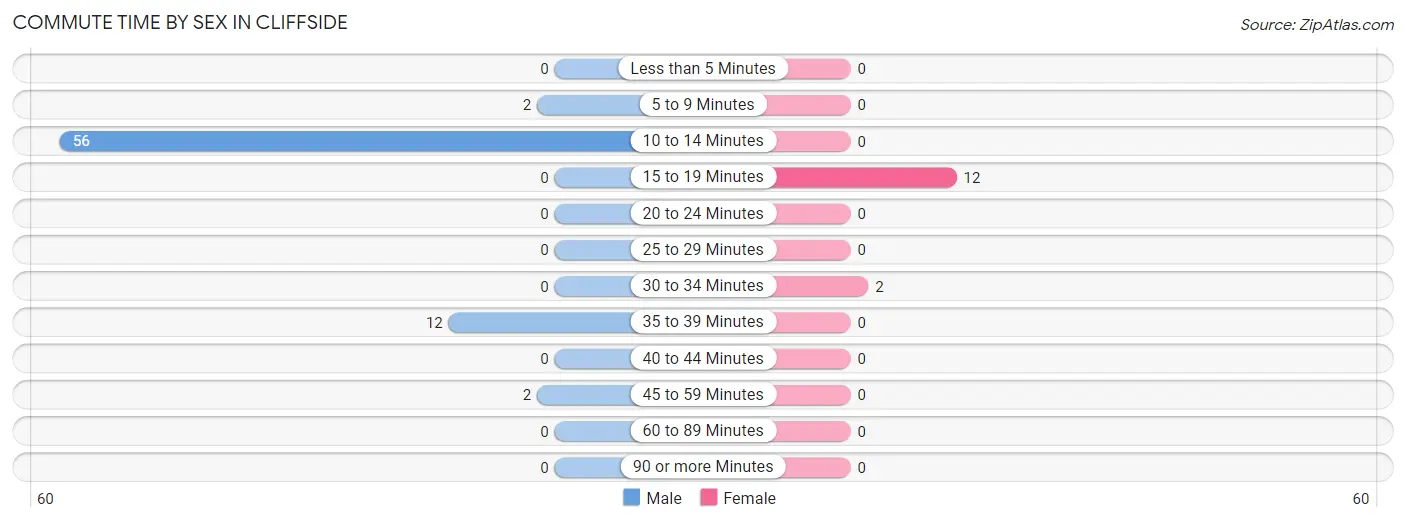
| Commute Time | Male | Female |
| Less than 5 Minutes | 0 (0.0%) | 0 (0.0%) |
| 5 to 9 Minutes | 2 (2.8%) | 0 (0.0%) |
| 10 to 14 Minutes | 56 (77.8%) | 0 (0.0%) |
| 15 to 19 Minutes | 0 (0.0%) | 12 (85.7%) |
| 20 to 24 Minutes | 0 (0.0%) | 0 (0.0%) |
| 25 to 29 Minutes | 0 (0.0%) | 0 (0.0%) |
| 30 to 34 Minutes | 0 (0.0%) | 2 (14.3%) |
| 35 to 39 Minutes | 12 (16.7%) | 0 (0.0%) |
| 40 to 44 Minutes | 0 (0.0%) | 0 (0.0%) |
| 45 to 59 Minutes | 2 (2.8%) | 0 (0.0%) |
| 60 to 89 Minutes | 0 (0.0%) | 0 (0.0%) |
| 90 or more Minutes | 0 (0.0%) | 0 (0.0%) |
Time of Departure to Work by Sex in Cliffside
The most frequent times of departure to work in Cliffside are 12:00 PM to 3:59 PM (41, 56.9%) for males and 6:30 AM to 6:59 AM (12, 85.7%) for females.
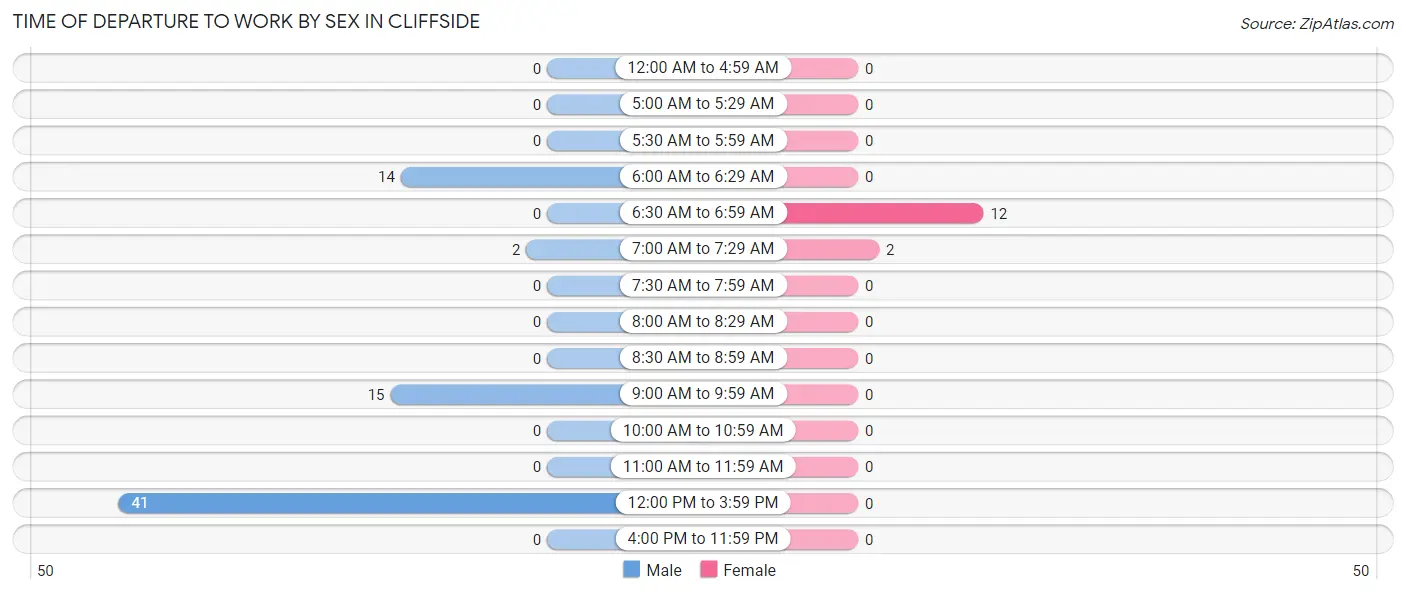
| Time of Departure | Male | Female |
| 12:00 AM to 4:59 AM | 0 (0.0%) | 0 (0.0%) |
| 5:00 AM to 5:29 AM | 0 (0.0%) | 0 (0.0%) |
| 5:30 AM to 5:59 AM | 0 (0.0%) | 0 (0.0%) |
| 6:00 AM to 6:29 AM | 14 (19.4%) | 0 (0.0%) |
| 6:30 AM to 6:59 AM | 0 (0.0%) | 12 (85.7%) |
| 7:00 AM to 7:29 AM | 2 (2.8%) | 2 (14.3%) |
| 7:30 AM to 7:59 AM | 0 (0.0%) | 0 (0.0%) |
| 8:00 AM to 8:29 AM | 0 (0.0%) | 0 (0.0%) |
| 8:30 AM to 8:59 AM | 0 (0.0%) | 0 (0.0%) |
| 9:00 AM to 9:59 AM | 15 (20.8%) | 0 (0.0%) |
| 10:00 AM to 10:59 AM | 0 (0.0%) | 0 (0.0%) |
| 11:00 AM to 11:59 AM | 0 (0.0%) | 0 (0.0%) |
| 12:00 PM to 3:59 PM | 41 (56.9%) | 0 (0.0%) |
| 4:00 PM to 11:59 PM | 0 (0.0%) | 0 (0.0%) |
| Total | 72 (100.0%) | 14 (100.0%) |
Housing Occupancy in Cliffside
Occupancy by Ownership in Cliffside
Of the total 215 dwellings in Cliffside, owner-occupied units account for 182 (84.7%), while renter-occupied units make up 33 (15.3%).
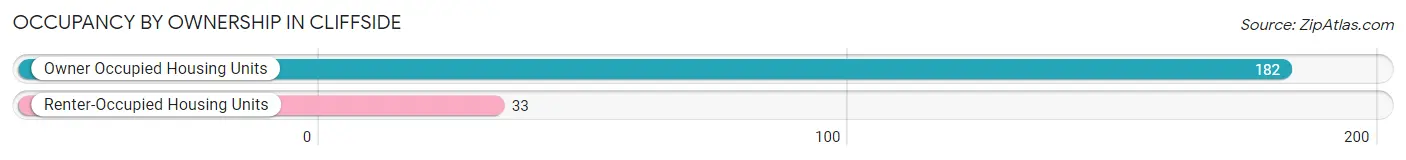
| Occupancy | # Housing Units | % Housing Units |
| Owner Occupied Housing Units | 182 | 84.7% |
| Renter-Occupied Housing Units | 33 | 15.3% |
| Total Occupied Housing Units | 215 | 100.0% |
Occupancy by Household Size in Cliffside
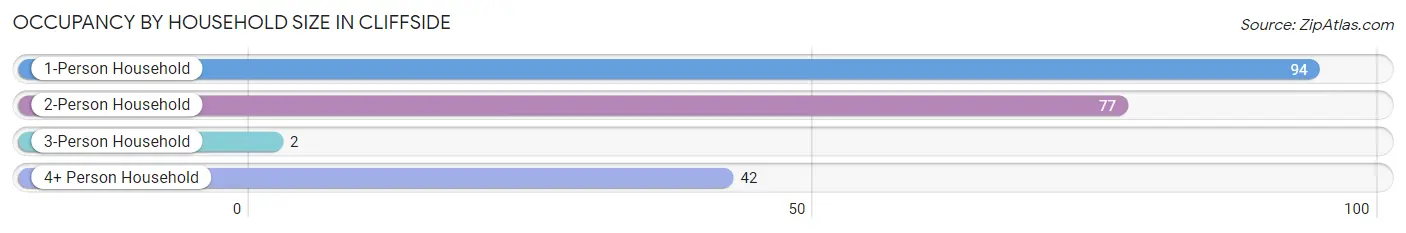
| Household Size | # Housing Units | % Housing Units |
| 1-Person Household | 94 | 43.7% |
| 2-Person Household | 77 | 35.8% |
| 3-Person Household | 2 | 0.9% |
| 4+ Person Household | 42 | 19.5% |
| Total Housing Units | 215 | 100.0% |
Occupancy by Ownership by Household Size in Cliffside
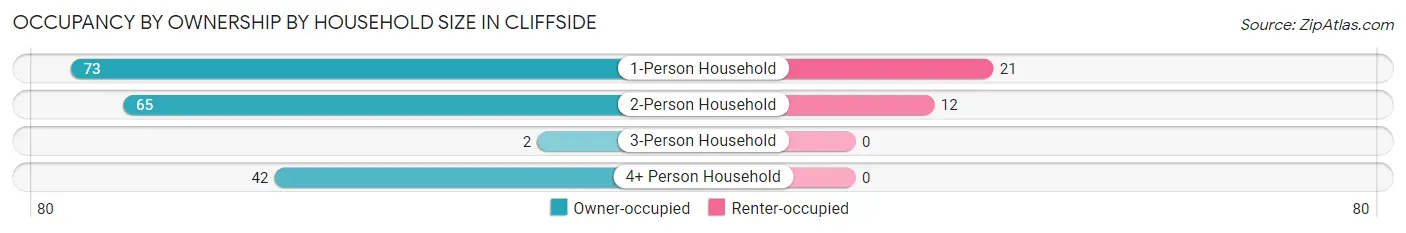
| Household Size | Owner-occupied | Renter-occupied |
| 1-Person Household | 73 (77.7%) | 21 (22.3%) |
| 2-Person Household | 65 (84.4%) | 12 (15.6%) |
| 3-Person Household | 2 (100.0%) | 0 (0.0%) |
| 4+ Person Household | 42 (100.0%) | 0 (0.0%) |
| Total Housing Units | 182 (84.7%) | 33 (15.3%) |
Occupancy by Educational Attainment in Cliffside
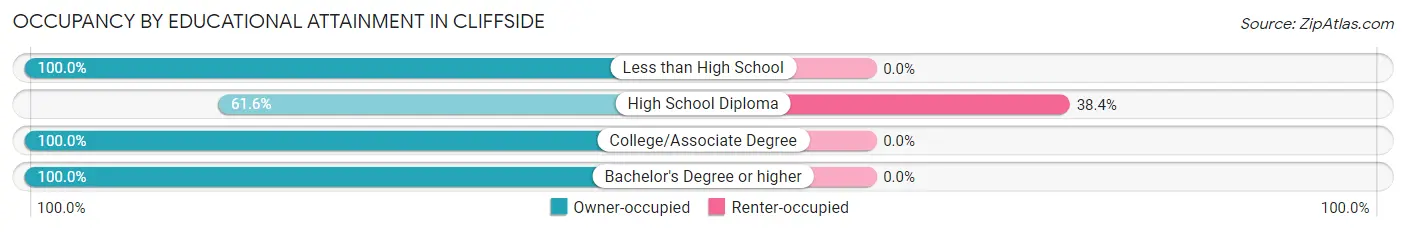
| Household Size | Owner-occupied | Renter-occupied |
| Less than High School | 15 (100.0%) | 0 (0.0%) |
| High School Diploma | 53 (61.6%) | 33 (38.4%) |
| College/Associate Degree | 48 (100.0%) | 0 (0.0%) |
| Bachelor's Degree or higher | 66 (100.0%) | 0 (0.0%) |
Occupancy by Age of Householder in Cliffside
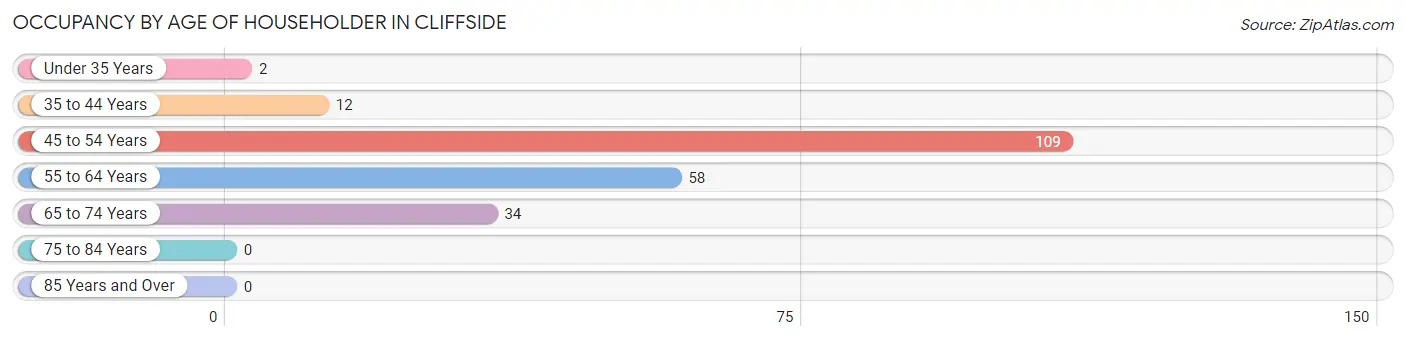
| Age Bracket | # Households | % Households |
| Under 35 Years | 2 | 0.9% |
| 35 to 44 Years | 12 | 5.6% |
| 45 to 54 Years | 109 | 50.7% |
| 55 to 64 Years | 58 | 27.0% |
| 65 to 74 Years | 34 | 15.8% |
| 75 to 84 Years | 0 | 0.0% |
| 85 Years and Over | 0 | 0.0% |
| Total | 215 | 100.0% |
Housing Finances in Cliffside
Median Income by Occupancy in Cliffside
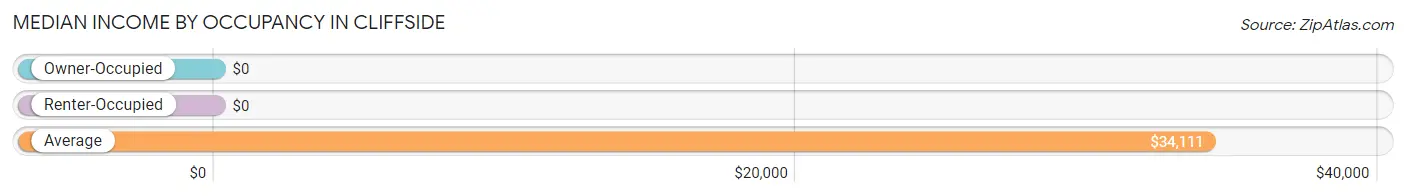
| Occupancy Type | # Households | Median Income |
| Owner-Occupied | 182 (84.7%) | $0 |
| Renter-Occupied | 33 (15.3%) | $0 |
| Average | 215 (100.0%) | $34,111 |
Occupancy by Householder Income Bracket in Cliffside
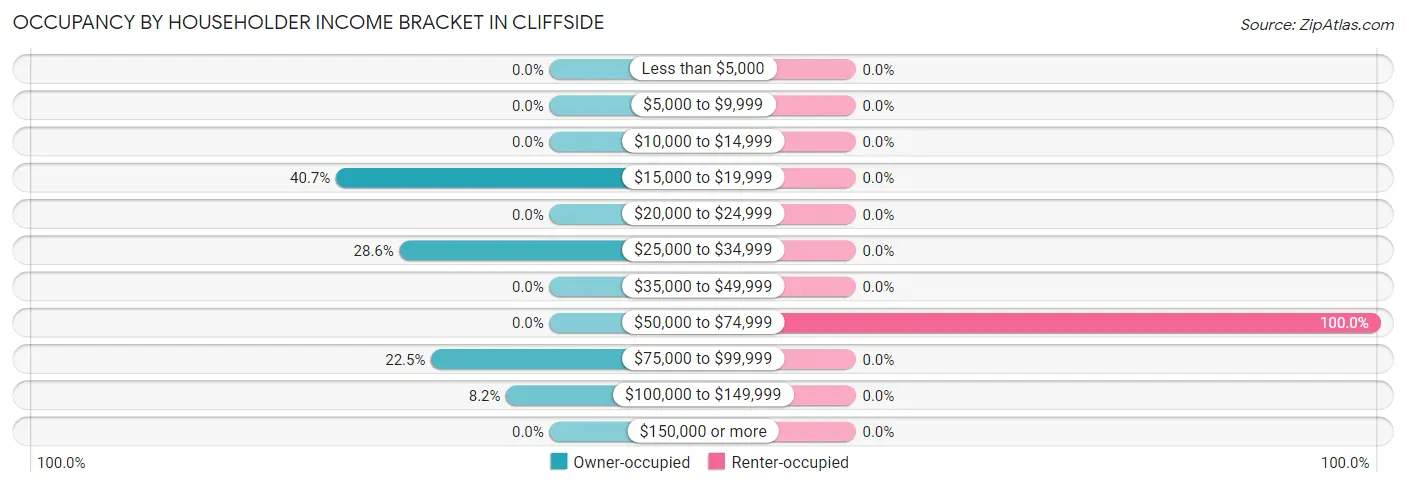
| Income Bracket | Owner-occupied | Renter-occupied |
| Less than $5,000 | 0 (0.0%) | 0 (0.0%) |
| $5,000 to $9,999 | 0 (0.0%) | 0 (0.0%) |
| $10,000 to $14,999 | 0 (0.0%) | 0 (0.0%) |
| $15,000 to $19,999 | 74 (40.7%) | 0 (0.0%) |
| $20,000 to $24,999 | 0 (0.0%) | 0 (0.0%) |
| $25,000 to $34,999 | 52 (28.6%) | 0 (0.0%) |
| $35,000 to $49,999 | 0 (0.0%) | 0 (0.0%) |
| $50,000 to $74,999 | 0 (0.0%) | 33 (100.0%) |
| $75,000 to $99,999 | 41 (22.5%) | 0 (0.0%) |
| $100,000 to $149,999 | 15 (8.2%) | 0 (0.0%) |
| $150,000 or more | 0 (0.0%) | 0 (0.0%) |
| Total | 182 (100.0%) | 33 (100.0%) |
Monthly Housing Cost Tiers in Cliffside
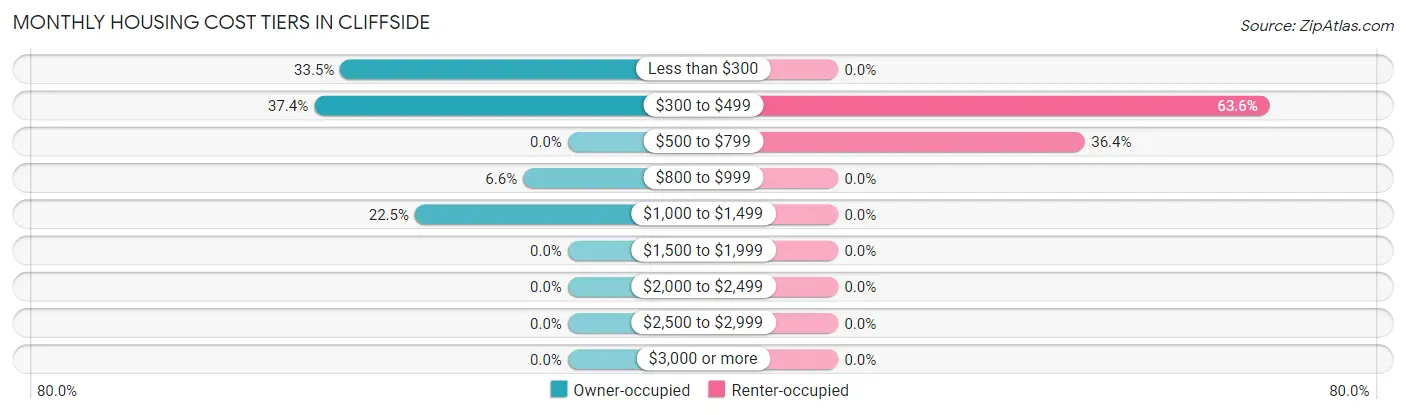
| Monthly Cost | Owner-occupied | Renter-occupied |
| Less than $300 | 61 (33.5%) | 0 (0.0%) |
| $300 to $499 | 68 (37.4%) | 21 (63.6%) |
| $500 to $799 | 0 (0.0%) | 12 (36.4%) |
| $800 to $999 | 12 (6.6%) | 0 (0.0%) |
| $1,000 to $1,499 | 41 (22.5%) | 0 (0.0%) |
| $1,500 to $1,999 | 0 (0.0%) | 0 (0.0%) |
| $2,000 to $2,499 | 0 (0.0%) | 0 (0.0%) |
| $2,500 to $2,999 | 0 (0.0%) | 0 (0.0%) |
| $3,000 or more | 0 (0.0%) | 0 (0.0%) |
| Total | 182 (100.0%) | 33 (100.0%) |
Physical Housing Characteristics in Cliffside
Housing Structures in Cliffside
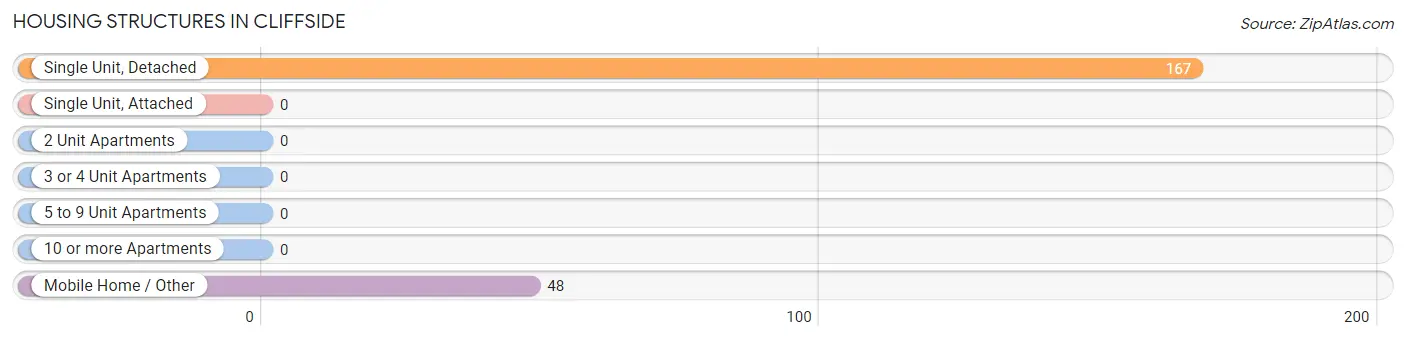
| Structure Type | # Housing Units | % Housing Units |
| Single Unit, Detached | 167 | 77.7% |
| Single Unit, Attached | 0 | 0.0% |
| 2 Unit Apartments | 0 | 0.0% |
| 3 or 4 Unit Apartments | 0 | 0.0% |
| 5 to 9 Unit Apartments | 0 | 0.0% |
| 10 or more Apartments | 0 | 0.0% |
| Mobile Home / Other | 48 | 22.3% |
| Total | 215 | 100.0% |
Housing Structures by Occupancy in Cliffside
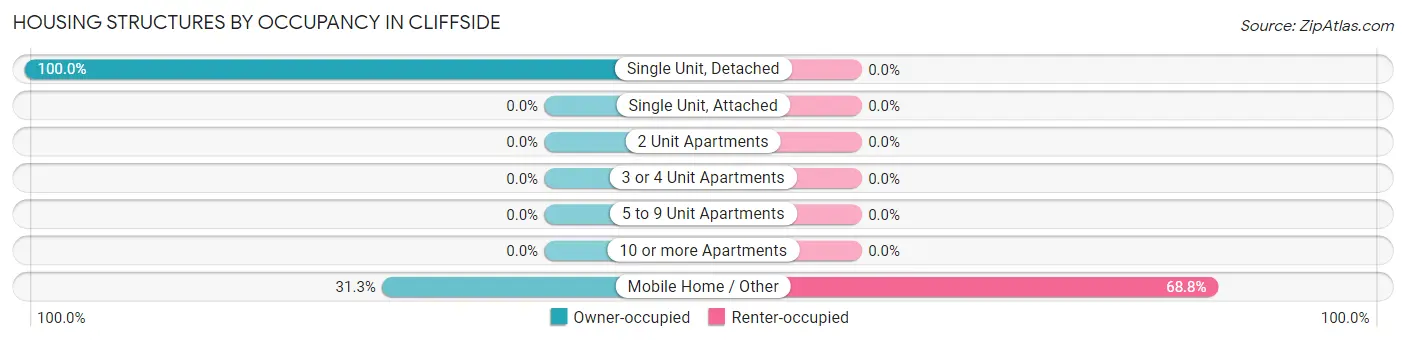
| Structure Type | Owner-occupied | Renter-occupied |
| Single Unit, Detached | 167 (100.0%) | 0 (0.0%) |
| Single Unit, Attached | 0 (0.0%) | 0 (0.0%) |
| 2 Unit Apartments | 0 (0.0%) | 0 (0.0%) |
| 3 or 4 Unit Apartments | 0 (0.0%) | 0 (0.0%) |
| 5 to 9 Unit Apartments | 0 (0.0%) | 0 (0.0%) |
| 10 or more Apartments | 0 (0.0%) | 0 (0.0%) |
| Mobile Home / Other | 15 (31.2%) | 33 (68.8%) |
| Total | 182 (84.7%) | 33 (15.3%) |
Housing Structures by Number of Rooms in Cliffside
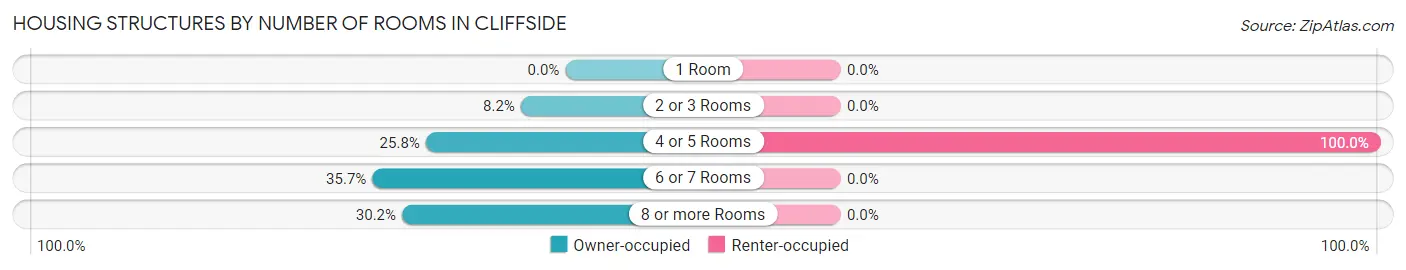
| Number of Rooms | Owner-occupied | Renter-occupied |
| 1 Room | 0 (0.0%) | 0 (0.0%) |
| 2 or 3 Rooms | 15 (8.2%) | 0 (0.0%) |
| 4 or 5 Rooms | 47 (25.8%) | 33 (100.0%) |
| 6 or 7 Rooms | 65 (35.7%) | 0 (0.0%) |
| 8 or more Rooms | 55 (30.2%) | 0 (0.0%) |
| Total | 182 (100.0%) | 33 (100.0%) |
Housing Structure by Heating Type in Cliffside
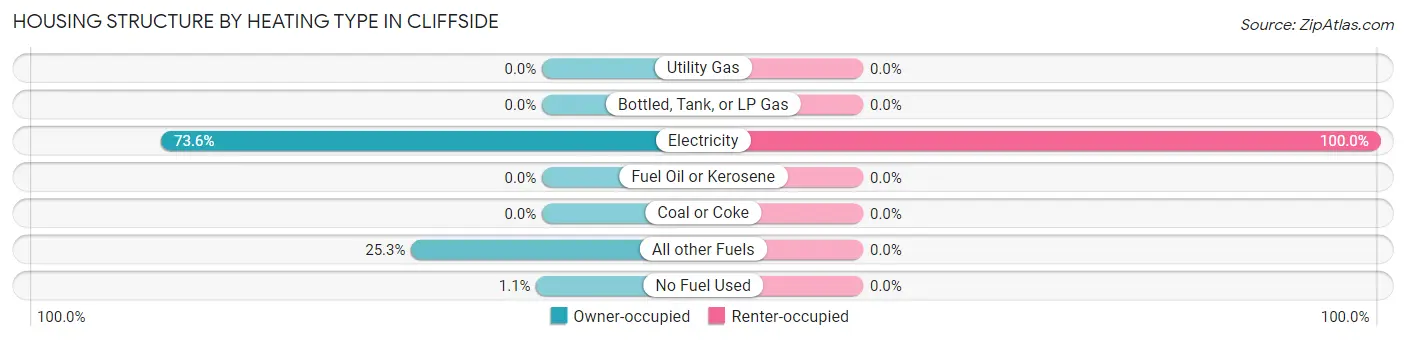
| Heating Type | Owner-occupied | Renter-occupied |
| Utility Gas | 0 (0.0%) | 0 (0.0%) |
| Bottled, Tank, or LP Gas | 0 (0.0%) | 0 (0.0%) |
| Electricity | 134 (73.6%) | 33 (100.0%) |
| Fuel Oil or Kerosene | 0 (0.0%) | 0 (0.0%) |
| Coal or Coke | 0 (0.0%) | 0 (0.0%) |
| All other Fuels | 46 (25.3%) | 0 (0.0%) |
| No Fuel Used | 2 (1.1%) | 0 (0.0%) |
| Total | 182 (100.0%) | 33 (100.0%) |
Household Vehicle Usage in Cliffside
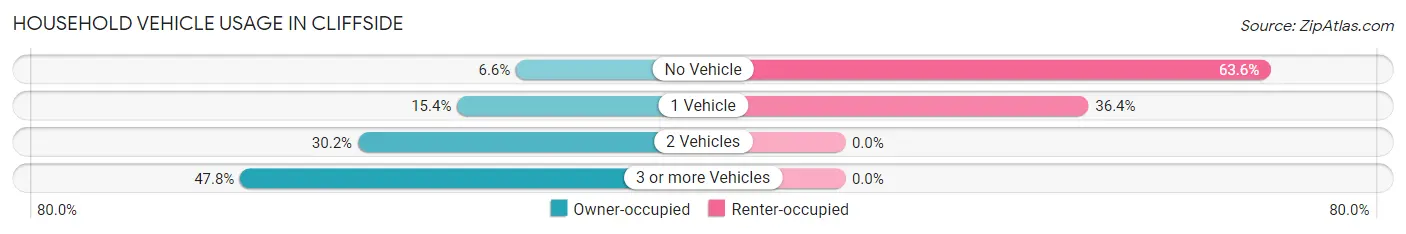
| Vehicles per Household | Owner-occupied | Renter-occupied |
| No Vehicle | 12 (6.6%) | 21 (63.6%) |
| 1 Vehicle | 28 (15.4%) | 12 (36.4%) |
| 2 Vehicles | 55 (30.2%) | 0 (0.0%) |
| 3 or more Vehicles | 87 (47.8%) | 0 (0.0%) |
| Total | 182 (100.0%) | 33 (100.0%) |
Real Estate & Mortgages in Cliffside
Real Estate and Mortgage Overview in Cliffside
| Characteristic | Without Mortgage | With Mortgage |
| Housing Units | 129 | 53 |
| Median Property Value | $50,700 | $0 |
| Median Household Income | - | - |
| Monthly Housing Costs | $303 | $0 |
| Real Estate Taxes | $590 | $0 |
Property Value by Mortgage Status in Cliffside
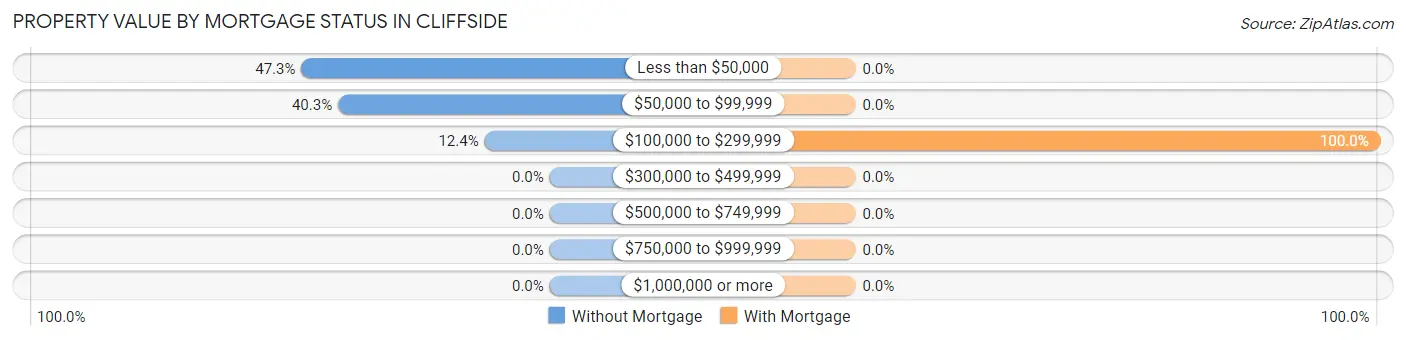
| Property Value | Without Mortgage | With Mortgage |
| Less than $50,000 | 61 (47.3%) | 0 (0.0%) |
| $50,000 to $99,999 | 52 (40.3%) | 0 (0.0%) |
| $100,000 to $299,999 | 16 (12.4%) | 53 (100.0%) |
| $300,000 to $499,999 | 0 (0.0%) | 0 (0.0%) |
| $500,000 to $749,999 | 0 (0.0%) | 0 (0.0%) |
| $750,000 to $999,999 | 0 (0.0%) | 0 (0.0%) |
| $1,000,000 or more | 0 (0.0%) | 0 (0.0%) |
| Total | 129 (100.0%) | 53 (100.0%) |
Household Income by Mortgage Status in Cliffside
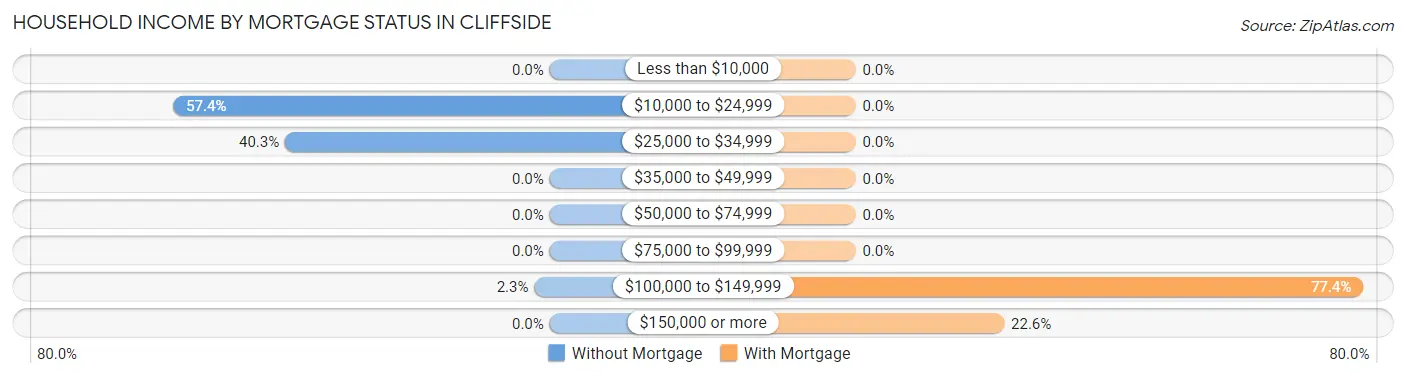
| Household Income | Without Mortgage | With Mortgage |
| Less than $10,000 | 0 (0.0%) | 0 (0.0%) |
| $10,000 to $24,999 | 74 (57.4%) | 0 (0.0%) |
| $25,000 to $34,999 | 52 (40.3%) | 0 (0.0%) |
| $35,000 to $49,999 | 0 (0.0%) | 0 (0.0%) |
| $50,000 to $74,999 | 0 (0.0%) | 0 (0.0%) |
| $75,000 to $99,999 | 0 (0.0%) | 0 (0.0%) |
| $100,000 to $149,999 | 3 (2.3%) | 41 (77.4%) |
| $150,000 or more | 0 (0.0%) | 12 (22.6%) |
| Total | 129 (100.0%) | 53 (100.0%) |
Property Value to Household Income Ratio in Cliffside
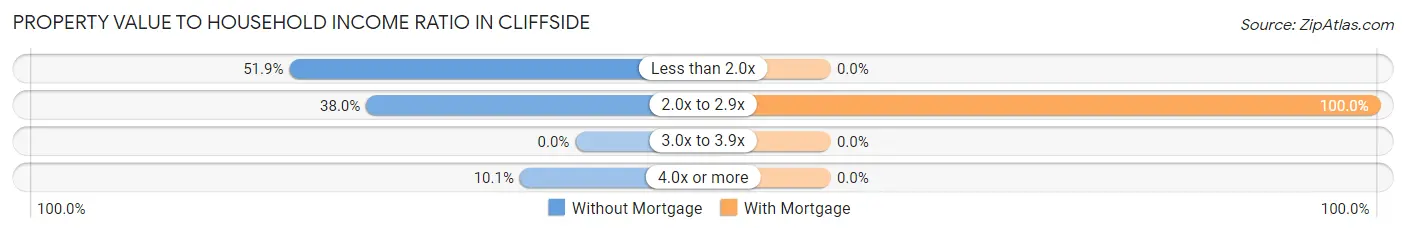
| Value-to-Income Ratio | Without Mortgage | With Mortgage |
| Less than 2.0x | 67 (51.9%) | 0 (0.0%) |
| 2.0x to 2.9x | 49 (38.0%) | 53 (100.0%) |
| 3.0x to 3.9x | 0 (0.0%) | 0 (0.0%) |
| 4.0x or more | 13 (10.1%) | 0 (0.0%) |
| Total | 129 (100.0%) | 53 (100.0%) |
Real Estate Taxes by Mortgage Status in Cliffside
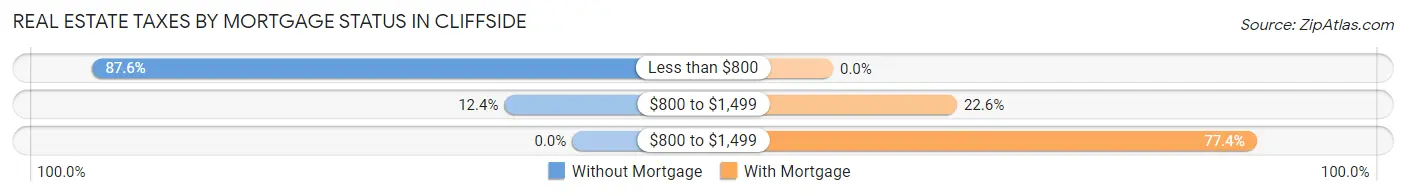
| Property Taxes | Without Mortgage | With Mortgage |
| Less than $800 | 113 (87.6%) | 0 (0.0%) |
| $800 to $1,499 | 16 (12.4%) | 12 (22.6%) |
| $800 to $1,499 | 0 (0.0%) | 41 (77.4%) |
| Total | 129 (100.0%) | 53 (100.0%) |
Health & Disability in Cliffside
Health Insurance Coverage by Age in Cliffside
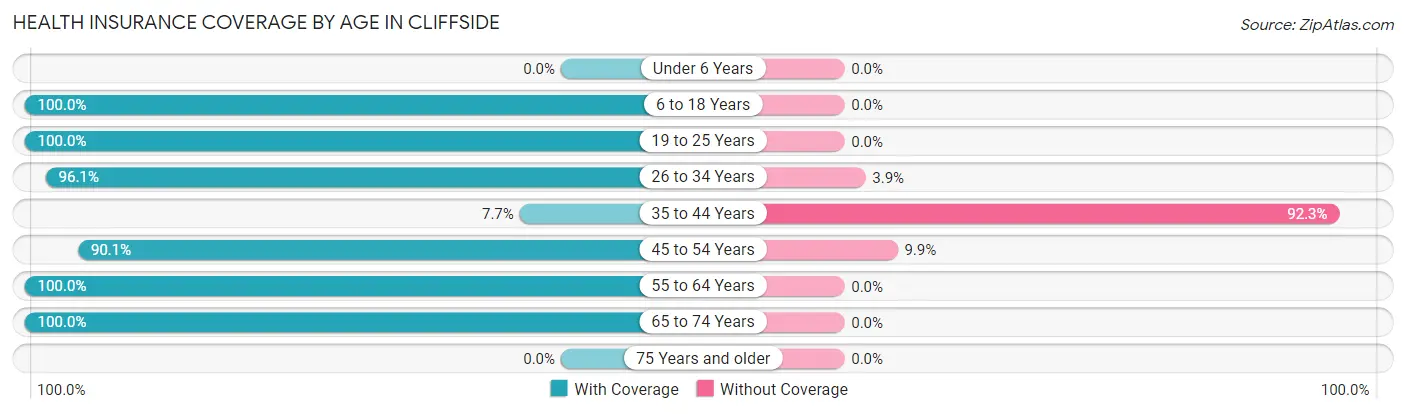
| Age Bracket | With Coverage | Without Coverage |
| Under 6 Years | 0 (0.0%) | 0 (0.0%) |
| 6 to 18 Years | 3 (100.0%) | 0 (0.0%) |
| 19 to 25 Years | 91 (100.0%) | 0 (0.0%) |
| 26 to 34 Years | 49 (96.1%) | 2 (3.9%) |
| 35 to 44 Years | 1 (7.7%) | 12 (92.3%) |
| 45 to 54 Years | 109 (90.1%) | 12 (9.9%) |
| 55 to 64 Years | 58 (100.0%) | 0 (0.0%) |
| 65 to 74 Years | 87 (100.0%) | 0 (0.0%) |
| 75 Years and older | 0 (0.0%) | 0 (0.0%) |
| Total | 398 (93.9%) | 26 (6.1%) |
Health Insurance Coverage by Citizenship Status in Cliffside
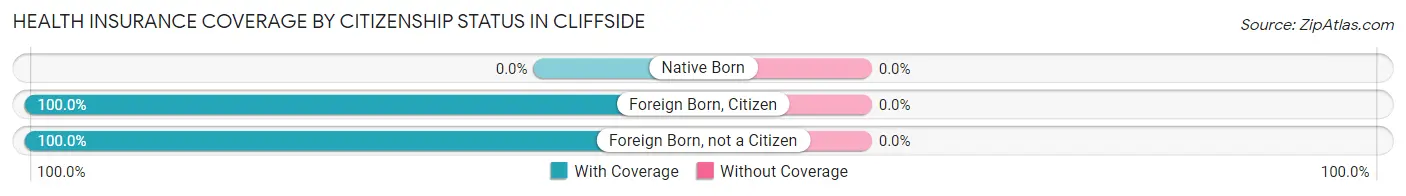
| Citizenship Status | With Coverage | Without Coverage |
| Native Born | 0 (0.0%) | 0 (0.0%) |
| Foreign Born, Citizen | 3 (100.0%) | 0 (0.0%) |
| Foreign Born, not a Citizen | 91 (100.0%) | 0 (0.0%) |
Health Insurance Coverage by Household Income in Cliffside
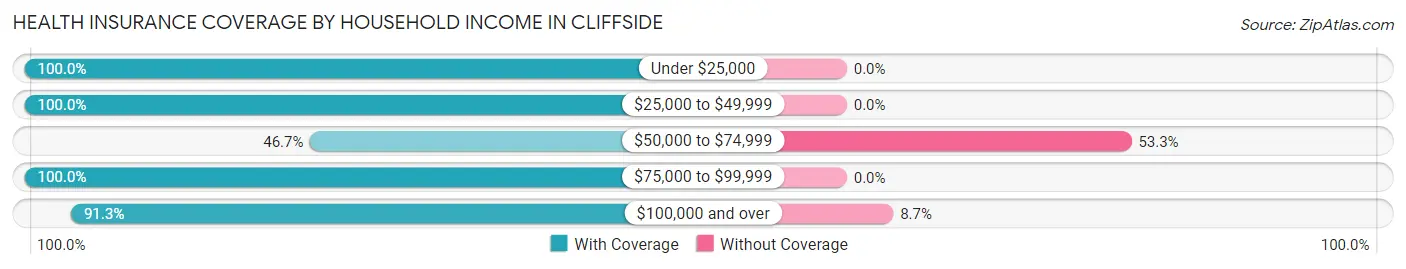
| Household Income | With Coverage | Without Coverage |
| Under $25,000 | 85 (100.0%) | 0 (0.0%) |
| $25,000 to $49,999 | 94 (100.0%) | 0 (0.0%) |
| $50,000 to $74,999 | 21 (46.7%) | 24 (53.3%) |
| $75,000 to $99,999 | 177 (100.0%) | 0 (0.0%) |
| $100,000 and over | 21 (91.3%) | 2 (8.7%) |
Public vs Private Health Insurance Coverage by Age in Cliffside
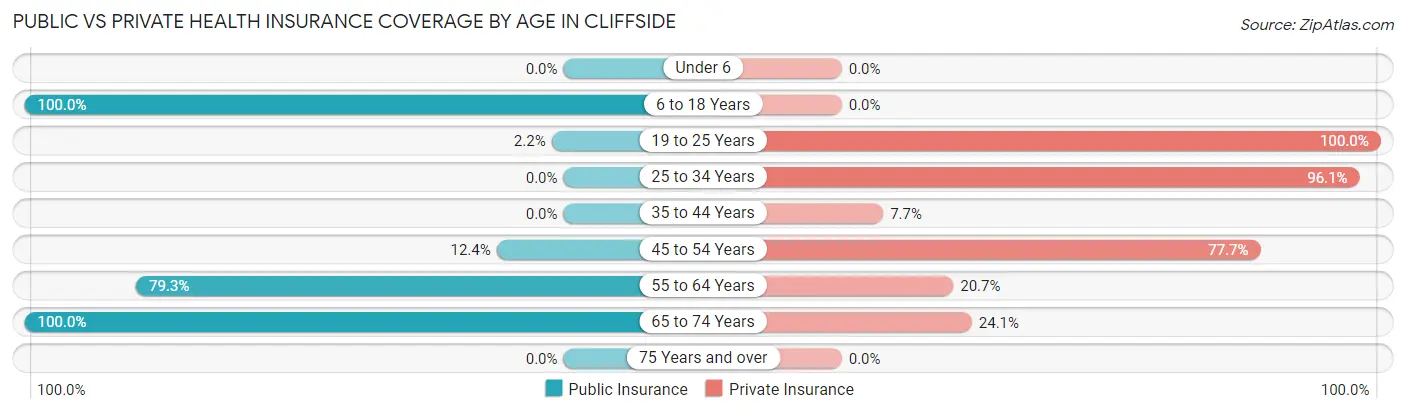
| Age Bracket | Public Insurance | Private Insurance |
| Under 6 | 0 (0.0%) | 0 (0.0%) |
| 6 to 18 Years | 3 (100.0%) | 0 (0.0%) |
| 19 to 25 Years | 2 (2.2%) | 91 (100.0%) |
| 25 to 34 Years | 0 (0.0%) | 49 (96.1%) |
| 35 to 44 Years | 0 (0.0%) | 1 (7.7%) |
| 45 to 54 Years | 15 (12.4%) | 94 (77.7%) |
| 55 to 64 Years | 46 (79.3%) | 12 (20.7%) |
| 65 to 74 Years | 87 (100.0%) | 21 (24.1%) |
| 75 Years and over | 0 (0.0%) | 0 (0.0%) |
| Total | 153 (36.1%) | 268 (63.2%) |
Disability Status by Sex by Age in Cliffside
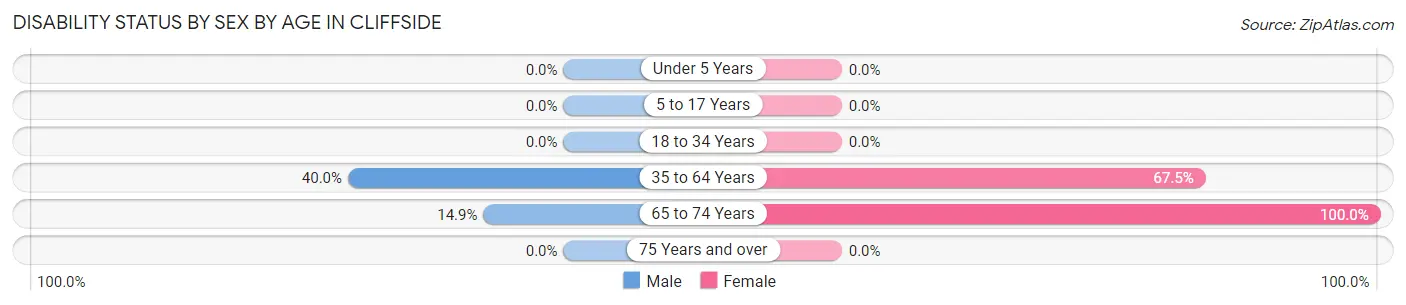
| Age Bracket | Male | Female |
| Under 5 Years | 0 (0.0%) | 0 (0.0%) |
| 5 to 17 Years | 0 (0.0%) | 0 (0.0%) |
| 18 to 34 Years | 0 (0.0%) | 0 (0.0%) |
| 35 to 64 Years | 46 (40.0%) | 52 (67.5%) |
| 65 to 74 Years | 11 (14.9%) | 13 (100.0%) |
| 75 Years and over | 0 (0.0%) | 0 (0.0%) |
Disability Class by Sex by Age in Cliffside
Disability Class: Hearing Difficulty
| Age Bracket | Male | Female |
| Under 5 Years | 0 (0.0%) | 0 (0.0%) |
| 5 to 17 Years | 0 (0.0%) | 0 (0.0%) |
| 18 to 34 Years | 0 (0.0%) | 0 (0.0%) |
| 35 to 64 Years | 0 (0.0%) | 0 (0.0%) |
| 65 to 74 Years | 0 (0.0%) | 0 (0.0%) |
| 75 Years and over | 0 (0.0%) | 0 (0.0%) |
Disability Class: Vision Difficulty
| Age Bracket | Male | Female |
| Under 5 Years | 0 (0.0%) | 0 (0.0%) |
| 5 to 17 Years | 0 (0.0%) | 0 (0.0%) |
| 18 to 34 Years | 0 (0.0%) | 0 (0.0%) |
| 35 to 64 Years | 0 (0.0%) | 0 (0.0%) |
| 65 to 74 Years | 0 (0.0%) | 0 (0.0%) |
| 75 Years and over | 0 (0.0%) | 0 (0.0%) |
Disability Class: Cognitive Difficulty

| Age Bracket | Male | Female |
| 5 to 17 Years | 0 (0.0%) | 0 (0.0%) |
| 18 to 34 Years | 0 (0.0%) | 0 (0.0%) |
| 35 to 64 Years | 0 (0.0%) | 0 (0.0%) |
| 65 to 74 Years | 0 (0.0%) | 0 (0.0%) |
| 75 Years and over | 0 (0.0%) | 0 (0.0%) |
Disability Class: Ambulatory Difficulty
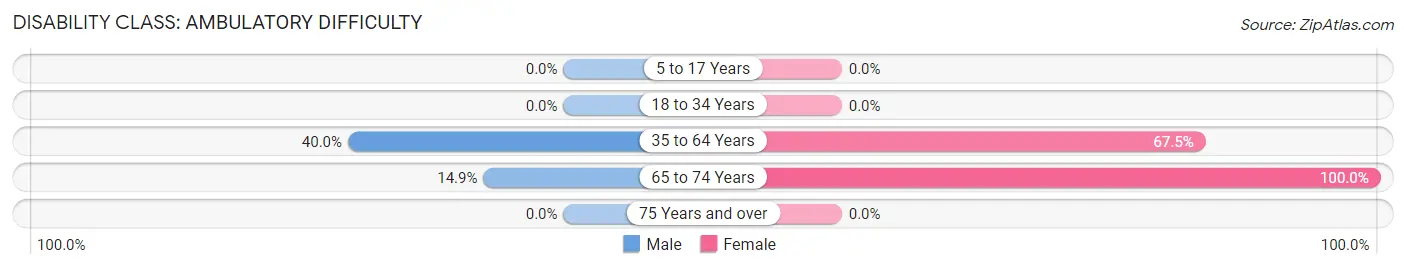
| Age Bracket | Male | Female |
| 5 to 17 Years | 0 (0.0%) | 0 (0.0%) |
| 18 to 34 Years | 0 (0.0%) | 0 (0.0%) |
| 35 to 64 Years | 46 (40.0%) | 52 (67.5%) |
| 65 to 74 Years | 11 (14.9%) | 13 (100.0%) |
| 75 Years and over | 0 (0.0%) | 0 (0.0%) |
Disability Class: Self-Care Difficulty
| Age Bracket | Male | Female |
| 5 to 17 Years | 0 (0.0%) | 0 (0.0%) |
| 18 to 34 Years | 0 (0.0%) | 0 (0.0%) |
| 35 to 64 Years | 0 (0.0%) | 0 (0.0%) |
| 65 to 74 Years | 0 (0.0%) | 0 (0.0%) |
| 75 Years and over | 0 (0.0%) | 0 (0.0%) |
Technology Access in Cliffside
Computing Device Access in Cliffside
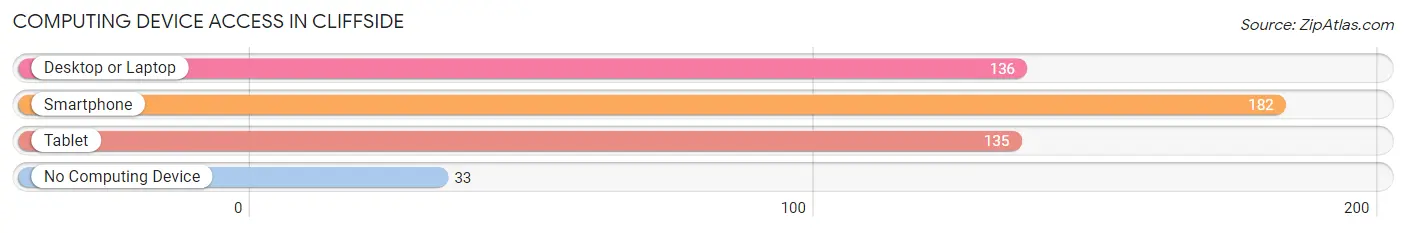
| Device Type | # Households | % Households |
| Desktop or Laptop | 136 | 63.3% |
| Smartphone | 182 | 84.7% |
| Tablet | 135 | 62.8% |
| No Computing Device | 33 | 15.3% |
| Total | 215 | 100.0% |
Internet Access in Cliffside
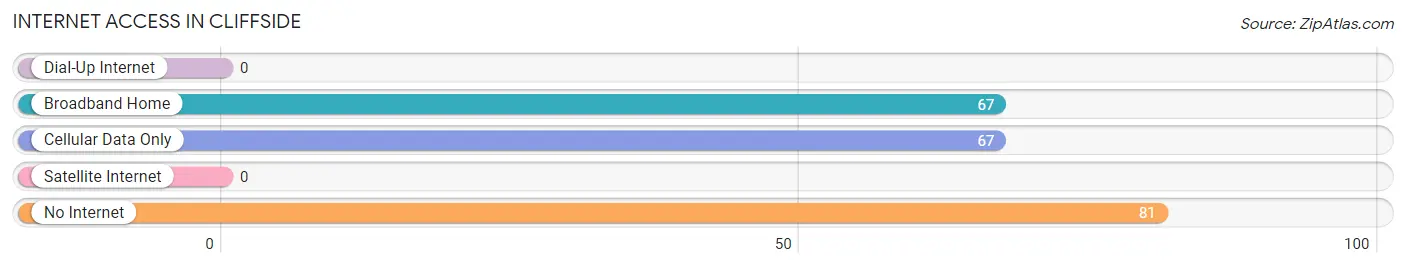
| Internet Type | # Households | % Households |
| Dial-Up Internet | 0 | 0.0% |
| Broadband Home | 67 | 31.2% |
| Cellular Data Only | 67 | 31.2% |
| Satellite Internet | 0 | 0.0% |
| No Internet | 81 | 37.7% |
| Total | 215 | 100.0% |
Cliffside Summary
Cliffside, North Carolina is a small town located in the foothills of the Blue Ridge Mountains in Rutherford County. It is situated along the Broad River, which is a tributary of the Catawba River. The town was founded in 1891 and was originally known as Cliffside Mills. It was named for the cliffs that line the Broad River.
History
Cliffside was founded in 1891 by the Cliffside Manufacturing Company, which was established to produce cotton yarn. The company was owned by the Cliffside family, who had been in the area since the early 1800s. The town was originally known as Cliffside Mills, but the name was changed to Cliffside in 1895.
The town grew rapidly in the early 1900s, and by 1910 it had a population of over 1,000. The Cliffside Manufacturing Company was the largest employer in the area, and it provided jobs for many of the town’s residents. The company also built a number of homes for its employees, which helped to further expand the town.
In the 1920s, the town began to decline as the textile industry moved away from the area. The Cliffside Manufacturing Company closed in 1929, and the town’s population began to decline. However, the town was able to survive due to its proximity to the larger cities of Charlotte and Asheville.
Geography
Cliffside is located in the foothills of the Blue Ridge Mountains in Rutherford County. It is situated along the Broad River, which is a tributary of the Catawba River. The town is located approximately 25 miles east of Asheville and 40 miles west of Charlotte.
The town is surrounded by rolling hills and mountains, and it is known for its scenic beauty. The town is also home to several parks, including Cliffside Park, which offers a variety of outdoor activities.
Economy
Cliffside’s economy is largely based on tourism and agriculture. The town is home to several wineries, and it is a popular destination for wine tours. The town is also home to several small businesses, including restaurants, shops, and art galleries.
The town is also home to several manufacturing companies, including a furniture factory and a textile mill. These companies provide jobs for many of the town’s residents.
Demographics
As of the 2010 census, the population of Cliffside was 1,845. The town is predominantly white, with a small African American population. The median household income is $37,000, and the median home value is $150,000.
The town is served by the Rutherford County School District, which includes two elementary schools, one middle school, and one high school. The town is also home to a branch of Isothermal Community College.
Conclusion
Cliffside, North Carolina is a small town located in the foothills of the Blue Ridge Mountains in Rutherford County. It was founded in 1891 and was originally known as Cliffside Mills. The town’s economy is largely based on tourism and agriculture, and it is home to several wineries and small businesses. The town is predominantly white, with a small African American population. The town is served by the Rutherford County School District, and it is home to a branch of Isothermal Community College.
Common Questions
What is Per Capita Income in Cliffside?
Per Capita income in Cliffside is $23,826.
What is the Median Household income in Cliffside?
Median Household Income in Cliffside is $34,111.
What is Inequality or Gini Index in Cliffside?
Inequality or Gini Index in Cliffside is 0.36.
What is the Total Population of Cliffside?
Total Population of Cliffside is 424.
What is the Total Male Population of Cliffside?
Total Male Population of Cliffside is 287.
What is the Total Female Population of Cliffside?
Total Female Population of Cliffside is 137.
What is the Ratio of Males per 100 Females in Cliffside?
There are 209.49 Males per 100 Females in Cliffside.
What is the Ratio of Females per 100 Males in Cliffside?
There are 47.74 Females per 100 Males in Cliffside.
What is the Median Population Age in Cliffside?
Median Population Age in Cliffside is 52.4 Years.
What is the Average Family Size in Cliffside
Average Family Size in Cliffside is 2.7 People.
What is the Average Household Size in Cliffside
Average Household Size in Cliffside is 2.0 People.
How Large is the Labor Force in Cliffside?
There are 87 People in the Labor Forcein in Cliffside.
What is the Percentage of People in the Labor Force in Cliffside?
20.7% of People are in the Labor Force in Cliffside.