Zip Codes with the Highest Percentage of Population Employed in Food Preparation & Serving in Asheville, NC
RELATED REPORTS & OPTIONS
Food Preparation & Serving
Asheville
Compare Zip Codes
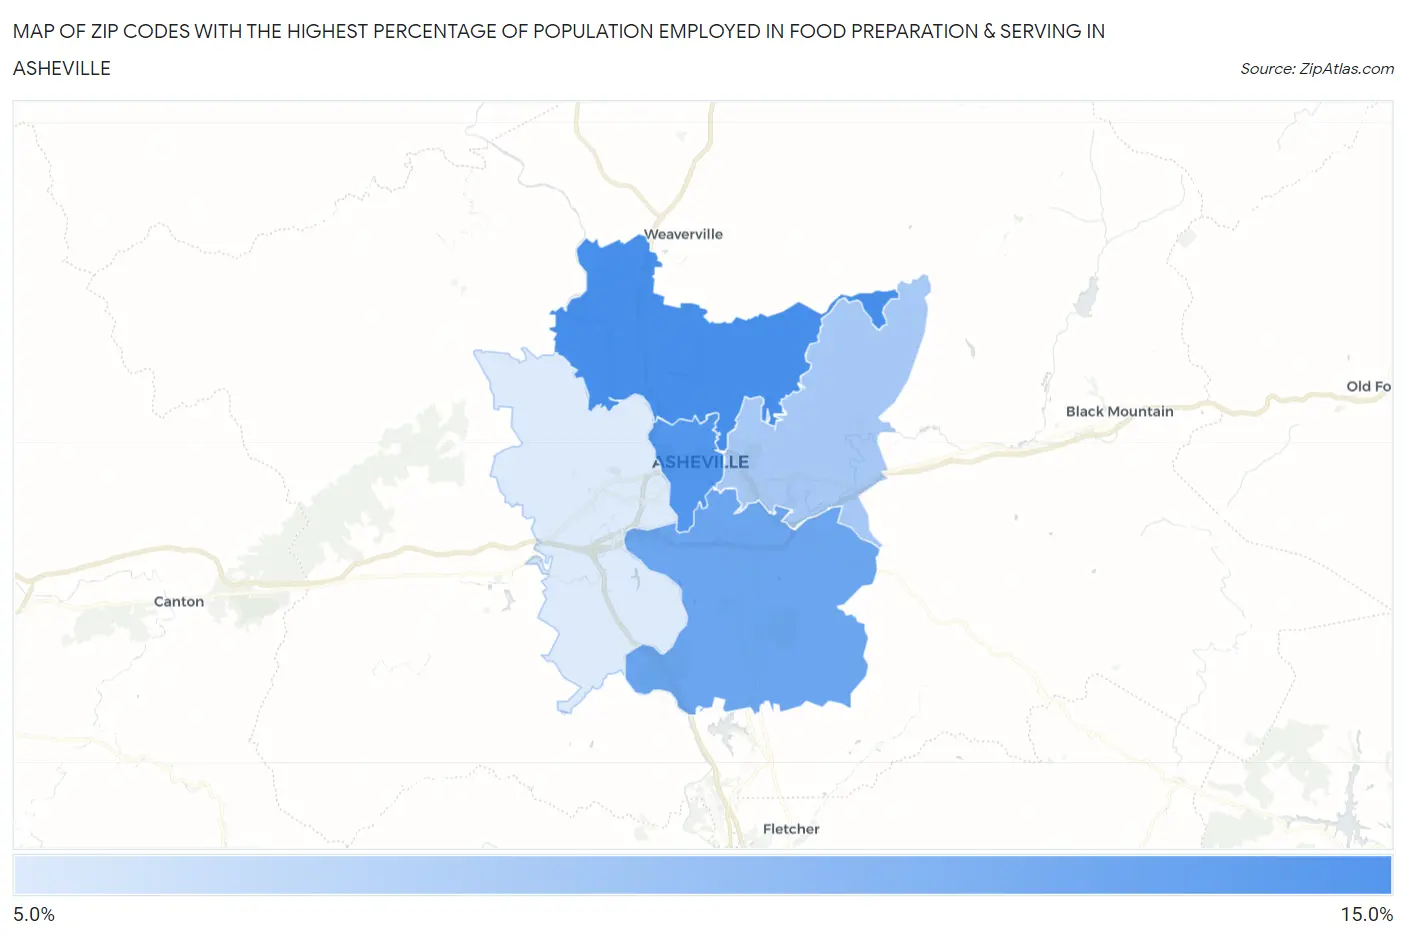
Map of Zip Codes with the Highest Percentage of Population Employed in Food Preparation & Serving in Asheville
8.9%
11.0%
Zip Codes with the Highest Percentage of Population Employed in Food Preparation & Serving in Asheville, NC
| Zip Code | % Employed | vs State | vs National | |
| 1. | 28804 | 11.0% | 5.3%(+5.74)#49 | 5.3%(+5.75)#2,042 |
| 2. | 28801 | 10.9% | 5.3%(+5.57)#51 | 5.3%(+5.58)#2,131 |
| 3. | 28803 | 10.5% | 5.3%(+5.24)#62 | 5.3%(+5.24)#2,309 |
| 4. | 28805 | 9.7% | 5.3%(+4.41)#78 | 5.3%(+4.42)#2,880 |
| 5. | 28806 | 8.9% | 5.3%(+3.66)#99 | 5.3%(+3.66)#3,578 |
1
Common Questions
What are the Top 3 Zip Codes with the Highest Percentage of Population Employed in Food Preparation & Serving in Asheville, NC?
Top 3 Zip Codes with the Highest Percentage of Population Employed in Food Preparation & Serving in Asheville, NC are:
What zip code has the Highest Percentage of Population Employed in Food Preparation & Serving in Asheville, NC?
28804 has the Highest Percentage of Population Employed in Food Preparation & Serving in Asheville, NC with 11.0%.
What is the Percentage of Population Employed in Food Preparation & Serving in Asheville, NC?
Percentage of Population Employed in Food Preparation & Serving in Asheville is 11.4%.
What is the Percentage of Population Employed in Food Preparation & Serving in North Carolina?
Percentage of Population Employed in Food Preparation & Serving in North Carolina is 5.3%.
What is the Percentage of Population Employed in Food Preparation & Serving in the United States?
Percentage of Population Employed in Food Preparation & Serving in the United States is 5.3%.