Hayesville, NC Map & Demographics
Hayesville Map
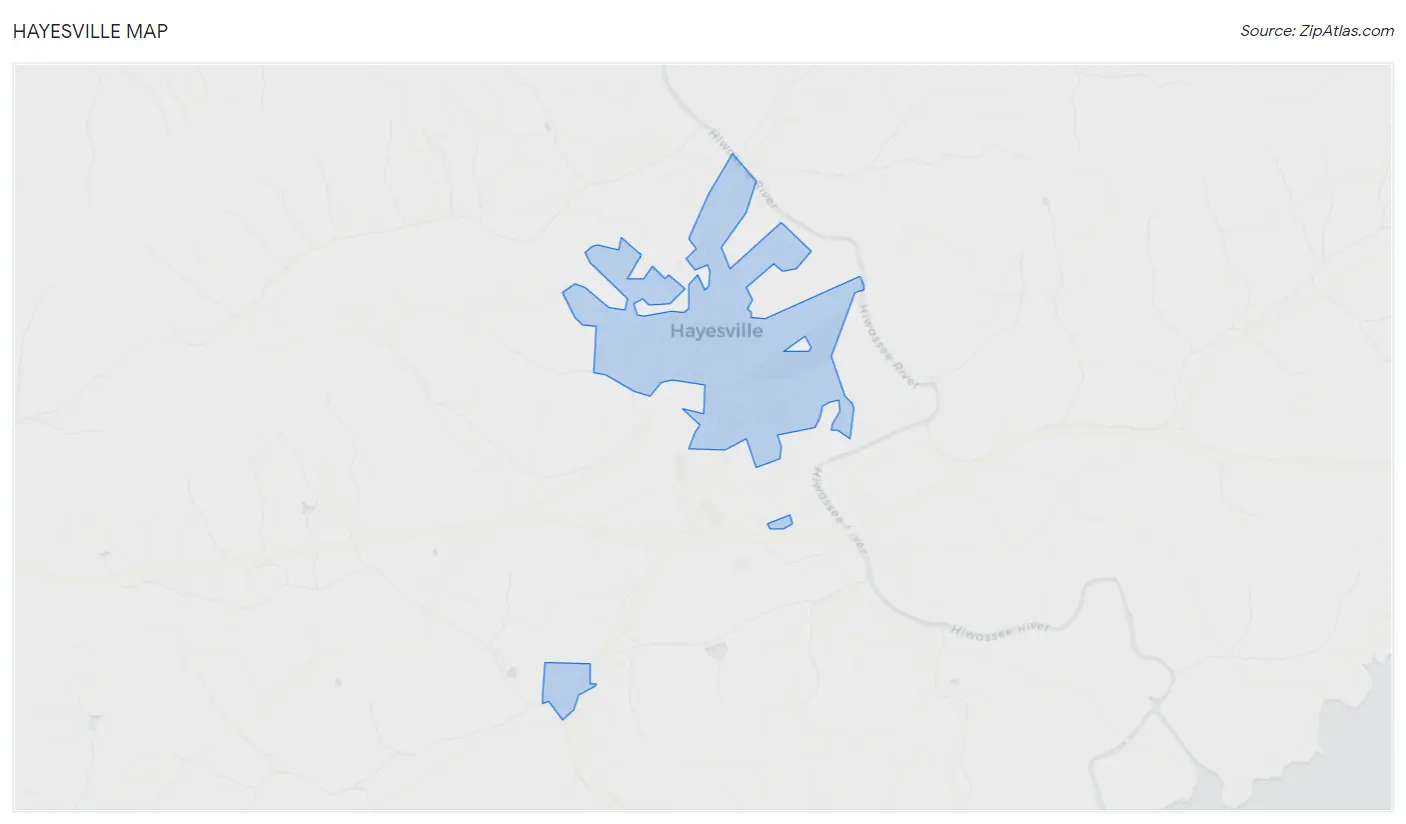
Hayesville Overview
$17,310
PER CAPITA INCOME
$46,806
AVG FAMILY INCOME
0.46
INEQUALITY / GINI INDEX
629
TOTAL POPULATION
303
MALE POPULATION
326
FEMALE POPULATION
92.94
MALES / 100 FEMALES
107.59
FEMALES / 100 MALES
42.5
MEDIAN AGE
2.9
AVG FAMILY SIZE
2.2
AVG HOUSEHOLD SIZE
240
LABOR FORCE [ PEOPLE ]
44.4%
PERCENT IN LABOR FORCE
0.8%
UNEMPLOYMENT RATE
Hayesville Zip Codes
Hayesville Area Codes
Income in Hayesville
Income Overview in Hayesville
| Characteristic | Number | Measure |
| Per Capita Income | 629 | $17,310 |
| Median Family Income | 95 | $46,806 |
| Mean Family Income | 95 | $56,272 |
| Median Household Income | 245 | $0 |
| Mean Household Income | 245 | $39,153 |
| Income Deficit | 95 | $0 |
| Wage / Income Gap (%) | 629 | 0.00% |
| Wage / Income Gap ($) | 629 | 100.00¢ per $1 |
| Gini / Inequality Index | 629 | 0.46 |
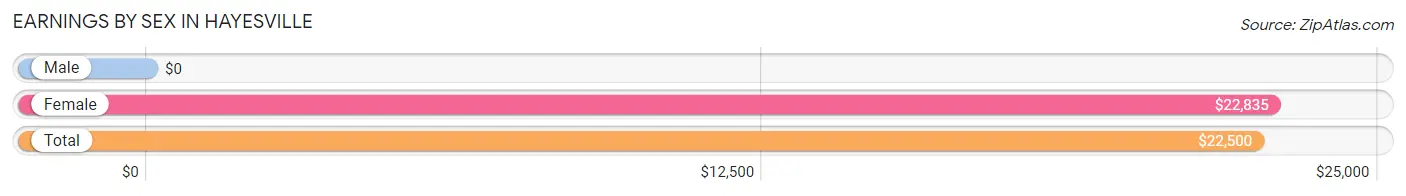
Earnings by Sex in Hayesville
| Sex | Number | Average Earnings |
| Male | 139 (53.0%) | $0 |
| Female | 123 (46.9%) | $22,835 |
| Total | 262 (100.0%) | $22,500 |
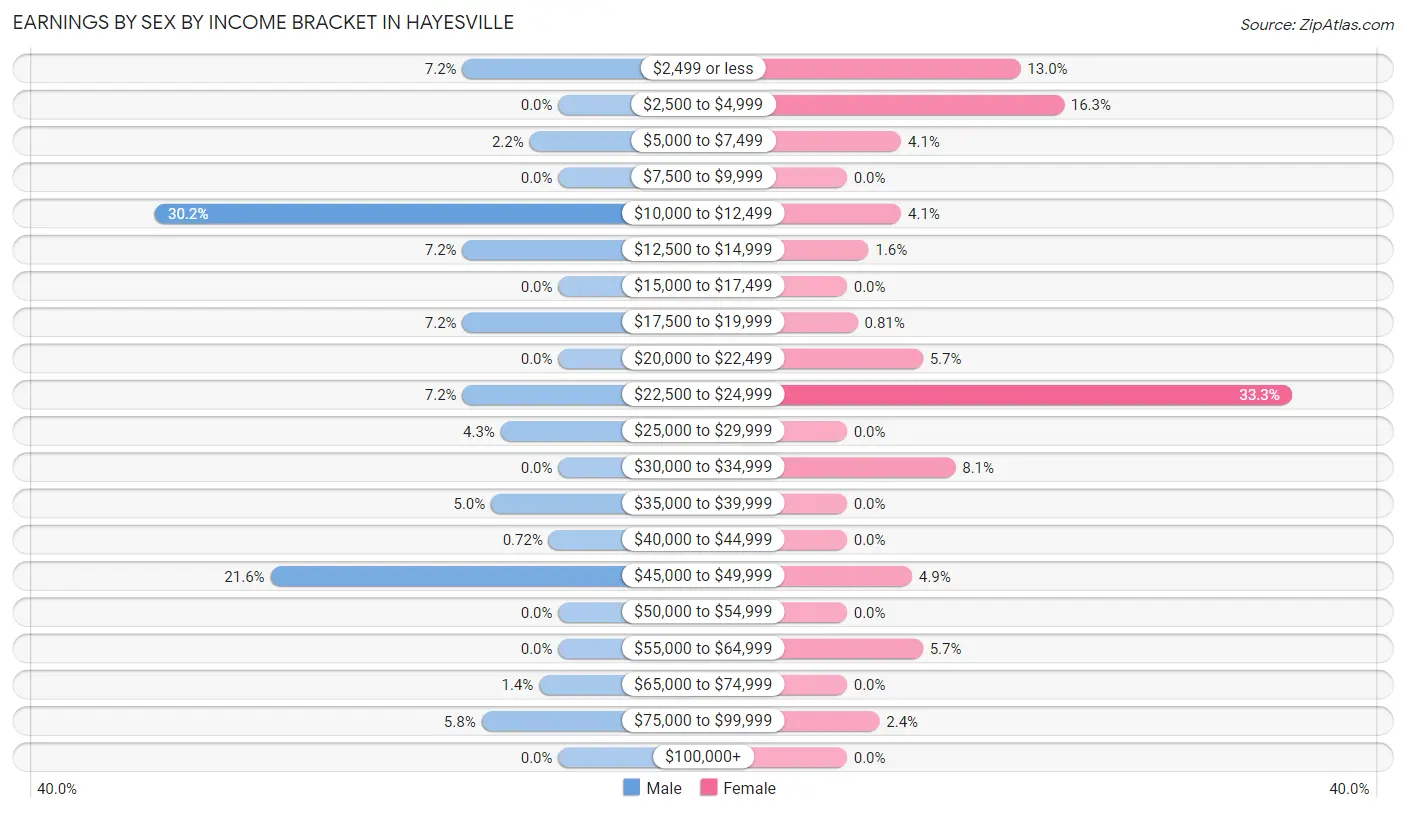
Earnings by Sex by Income Bracket in Hayesville
The most common earnings brackets in Hayesville are $10,000 to $12,499 for men (42 | 30.2%) and $22,500 to $24,999 for women (41 | 33.3%).
| Income | Male | Female |
| $2,499 or less | 10 (7.2%) | 16 (13.0%) |
| $2,500 to $4,999 | 0 (0.0%) | 20 (16.3%) |
| $5,000 to $7,499 | 3 (2.2%) | 5 (4.1%) |
| $7,500 to $9,999 | 0 (0.0%) | 0 (0.0%) |
| $10,000 to $12,499 | 42 (30.2%) | 5 (4.1%) |
| $12,500 to $14,999 | 10 (7.2%) | 2 (1.6%) |
| $15,000 to $17,499 | 0 (0.0%) | 0 (0.0%) |
| $17,500 to $19,999 | 10 (7.2%) | 1 (0.8%) |
| $20,000 to $22,499 | 0 (0.0%) | 7 (5.7%) |
| $22,500 to $24,999 | 10 (7.2%) | 41 (33.3%) |
| $25,000 to $29,999 | 6 (4.3%) | 0 (0.0%) |
| $30,000 to $34,999 | 0 (0.0%) | 10 (8.1%) |
| $35,000 to $39,999 | 7 (5.0%) | 0 (0.0%) |
| $40,000 to $44,999 | 1 (0.7%) | 0 (0.0%) |
| $45,000 to $49,999 | 30 (21.6%) | 6 (4.9%) |
| $50,000 to $54,999 | 0 (0.0%) | 0 (0.0%) |
| $55,000 to $64,999 | 0 (0.0%) | 7 (5.7%) |
| $65,000 to $74,999 | 2 (1.4%) | 0 (0.0%) |
| $75,000 to $99,999 | 8 (5.8%) | 3 (2.4%) |
| $100,000+ | 0 (0.0%) | 0 (0.0%) |
| Total | 139 (100.0%) | 123 (100.0%) |
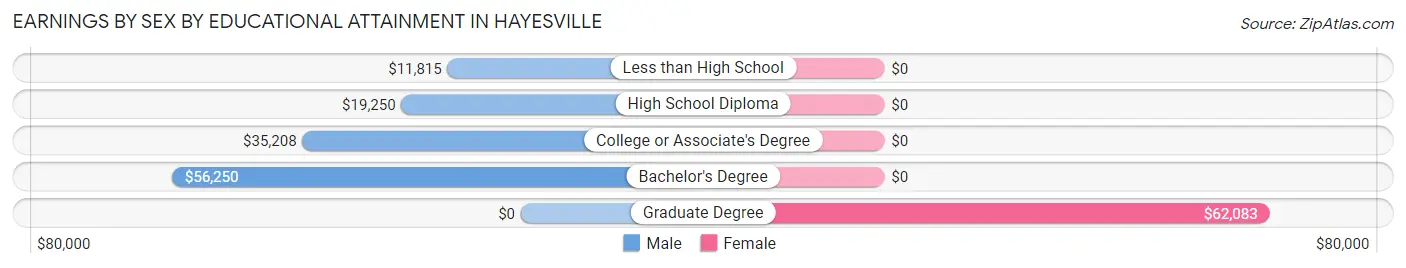
Earnings by Sex by Educational Attainment in Hayesville
| Educational Attainment | Male Income | Female Income |
| Less than High School | $11,815 | $0 |
| High School Diploma | $19,250 | $0 |
| College or Associate's Degree | $35,208 | $0 |
| Bachelor's Degree | $56,250 | $0 |
| Graduate Degree | - | - |
| Total | $14,000 | $0 |
Family Income in Hayesville
Family Income Brackets in Hayesville
According to the Hayesville family income data, there are 21 families falling into the $10,000 to $14,999 income range, which is the most common income bracket and makes up 22.1% of all families.
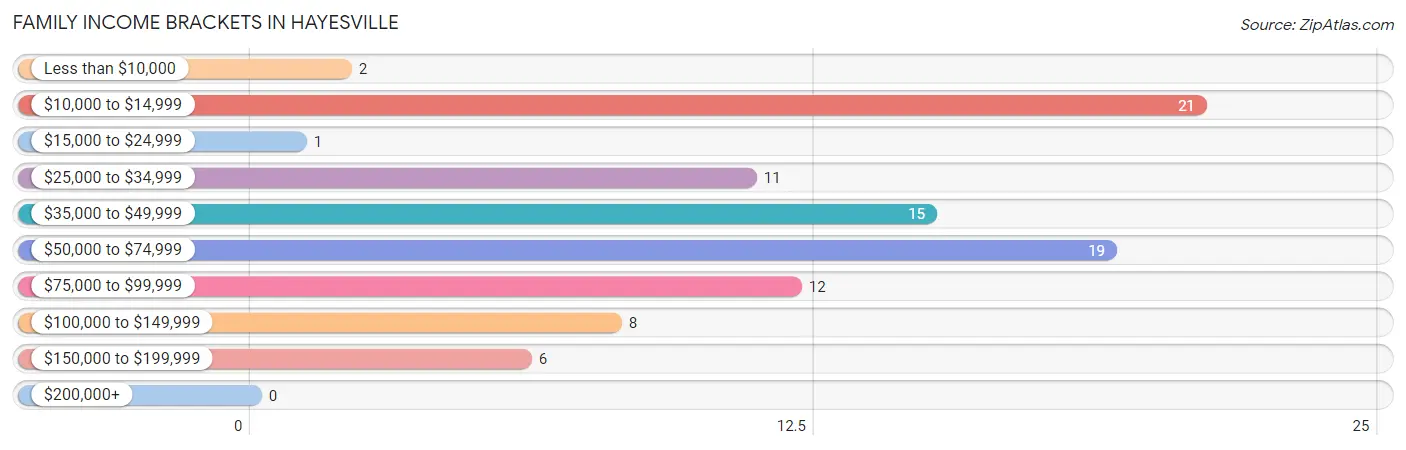
| Income Bracket | # Families | % Families |
| Less than $10,000 | 2 | 2.1% |
| $10,000 to $14,999 | 21 | 22.1% |
| $15,000 to $24,999 | 1 | 1.1% |
| $25,000 to $34,999 | 11 | 11.6% |
| $35,000 to $49,999 | 15 | 15.8% |
| $50,000 to $74,999 | 19 | 20.0% |
| $75,000 to $99,999 | 12 | 12.6% |
| $100,000 to $149,999 | 8 | 8.4% |
| $150,000 to $199,999 | 6 | 6.3% |
| $200,000+ | 0 | 0.0% |
Family Income by Famaliy Size in Hayesville
4-person families (6 | 6.3%) account for the highest median family income in Hayesville with $123,750 per family, while 4-person families (6 | 6.3%) have the highest median income of $30,938 per family member.
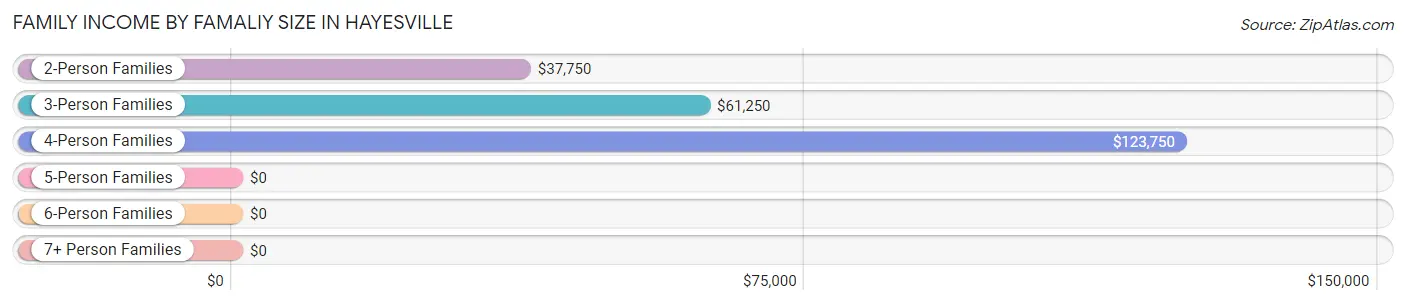
| Income Bracket | # Families | Median Income |
| 2-Person Families | 69 (72.6%) | $37,750 |
| 3-Person Families | 15 (15.8%) | $61,250 |
| 4-Person Families | 6 (6.3%) | $123,750 |
| 5-Person Families | 5 (5.3%) | $0 |
| 6-Person Families | 0 (0.0%) | $0 |
| 7+ Person Families | 0 (0.0%) | $0 |
| Total | 95 (100.0%) | $46,806 |
Family Income by Number of Earners in Hayesville
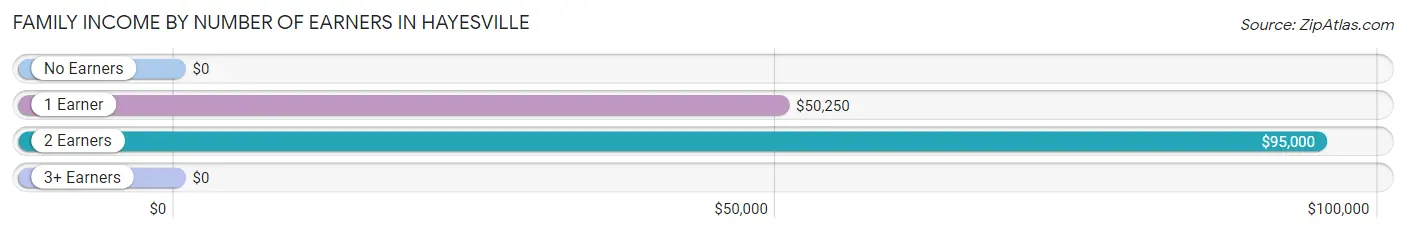
| Number of Earners | # Families | Median Income |
| No Earners | 33 (34.7%) | $0 |
| 1 Earner | 39 (41.0%) | $50,250 |
| 2 Earners | 20 (21.0%) | $95,000 |
| 3+ Earners | 3 (3.2%) | $0 |
| Total | 95 (100.0%) | $46,806 |
Household Income in Hayesville
Household Income Brackets in Hayesville
With 106 households falling in the category, the $10,000 to $14,999 income range is the most frequent in Hayesville, accounting for 43.3% of all households.
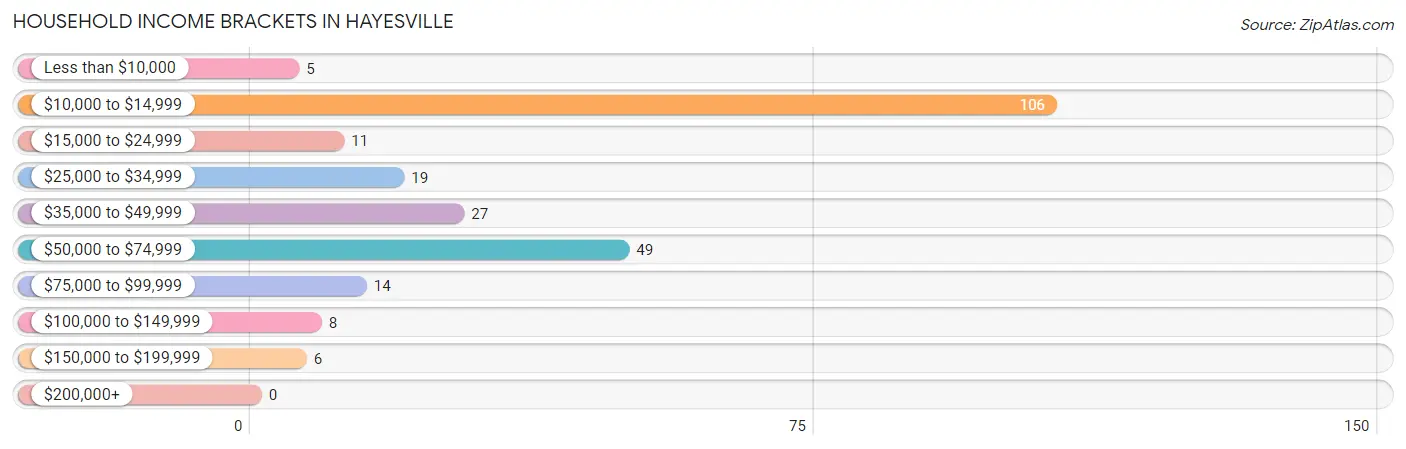
| Income Bracket | # Households | % Households |
| Less than $10,000 | 5 | 2.0% |
| $10,000 to $14,999 | 106 | 43.3% |
| $15,000 to $24,999 | 11 | 4.5% |
| $25,000 to $34,999 | 19 | 7.8% |
| $35,000 to $49,999 | 27 | 11.0% |
| $50,000 to $74,999 | 49 | 20.0% |
| $75,000 to $99,999 | 14 | 5.7% |
| $100,000 to $149,999 | 8 | 3.3% |
| $150,000 to $199,999 | 6 | 2.4% |
| $200,000+ | 0 | 0.0% |
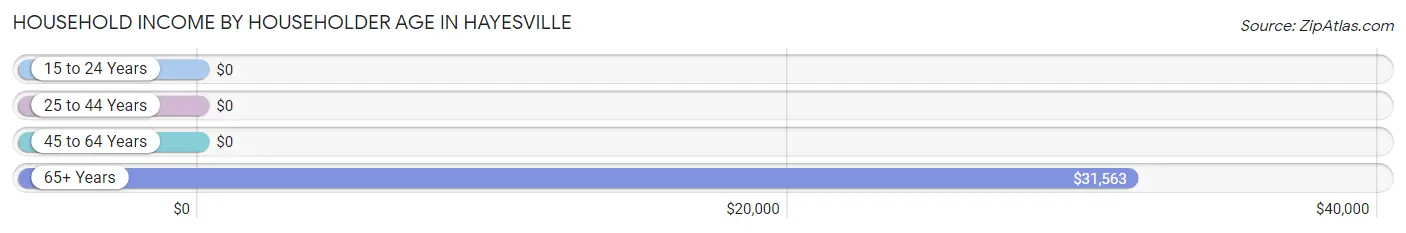
Household Income by Householder Age in Hayesville
The median household income in Hayesville is $0, with the highest median household income of $31,563 found in the 65+ years age bracket for the primary householder. A total of 82 households (33.5%) fall into this category. Meanwhile, the 15 to 24 years age bracket for the primary householder has the lowest median household income of $0, with 25 households (10.2%) in this group.
| Income Bracket | # Households | Median Income |
| 15 to 24 Years | 25 (10.2%) | $0 |
| 25 to 44 Years | 68 (27.8%) | $0 |
| 45 to 64 Years | 70 (28.6%) | $0 |
| 65+ Years | 82 (33.5%) | $31,563 |
| Total | 245 (100.0%) | $0 |
Poverty in Hayesville
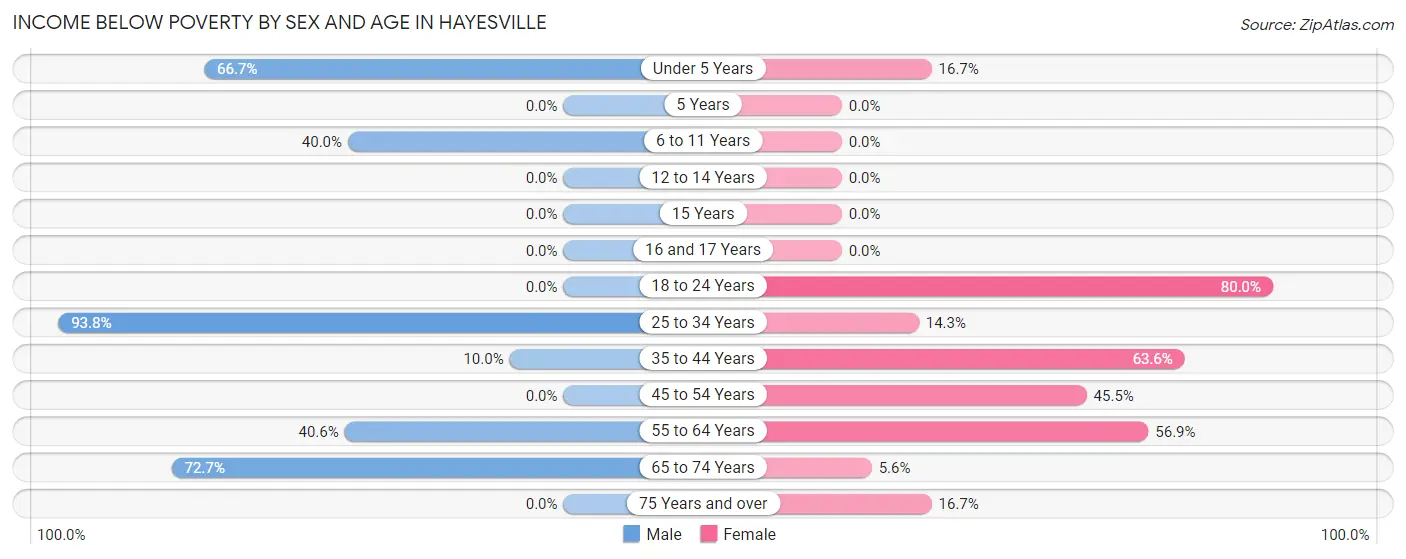
Income Below Poverty by Sex and Age in Hayesville
With 40.8% poverty level for males and 35.8% for females among the residents of Hayesville, 25 to 34 year old males and 18 to 24 year old females are the most vulnerable to poverty, with 45 males (93.8%) and 28 females (80.0%) in their respective age groups living below the poverty level.
| Age Bracket | Male | Female |
| Under 5 Years | 2 (66.7%) | 1 (16.7%) |
| 5 Years | 0 (0.0%) | 0 (0.0%) |
| 6 to 11 Years | 8 (40.0%) | 0 (0.0%) |
| 12 to 14 Years | 0 (0.0%) | 0 (0.0%) |
| 15 Years | 0 (0.0%) | 0 (0.0%) |
| 16 and 17 Years | 0 (0.0%) | 0 (0.0%) |
| 18 to 24 Years | 0 (0.0%) | 28 (80.0%) |
| 25 to 34 Years | 45 (93.8%) | 2 (14.3%) |
| 35 to 44 Years | 2 (10.0%) | 21 (63.6%) |
| 45 to 54 Years | 0 (0.0%) | 5 (45.5%) |
| 55 to 64 Years | 13 (40.6%) | 33 (56.9%) |
| 65 to 74 Years | 32 (72.7%) | 2 (5.6%) |
| 75 Years and over | 0 (0.0%) | 5 (16.7%) |
| Total | 102 (40.8%) | 97 (35.8%) |
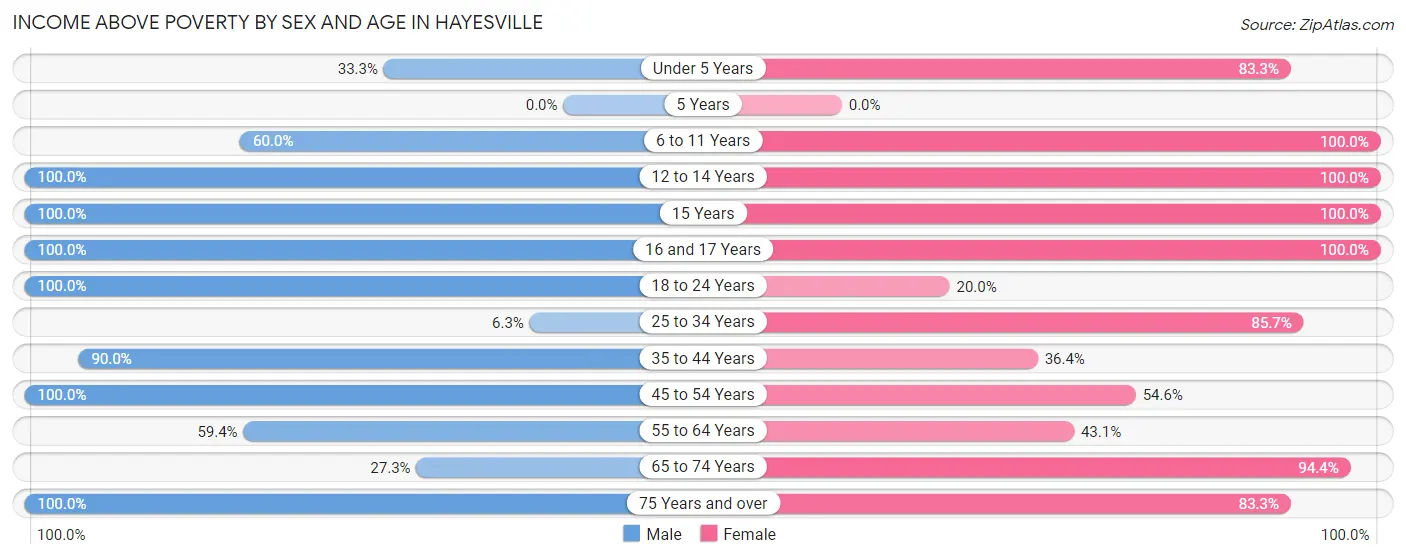
Income Above Poverty by Sex and Age in Hayesville
According to the poverty statistics in Hayesville, males aged 12 to 14 years and females aged 6 to 11 years are the age groups that are most secure financially, with 100.0% of males and 100.0% of females in these age groups living above the poverty line.
| Age Bracket | Male | Female |
| Under 5 Years | 1 (33.3%) | 5 (83.3%) |
| 5 Years | 0 (0.0%) | 0 (0.0%) |
| 6 to 11 Years | 12 (60.0%) | 3 (100.0%) |
| 12 to 14 Years | 7 (100.0%) | 4 (100.0%) |
| 15 Years | 4 (100.0%) | 1 (100.0%) |
| 16 and 17 Years | 7 (100.0%) | 40 (100.0%) |
| 18 to 24 Years | 36 (100.0%) | 7 (20.0%) |
| 25 to 34 Years | 3 (6.2%) | 12 (85.7%) |
| 35 to 44 Years | 18 (90.0%) | 12 (36.4%) |
| 45 to 54 Years | 18 (100.0%) | 6 (54.5%) |
| 55 to 64 Years | 19 (59.4%) | 25 (43.1%) |
| 65 to 74 Years | 12 (27.3%) | 34 (94.4%) |
| 75 Years and over | 11 (100.0%) | 25 (83.3%) |
| Total | 148 (59.2%) | 174 (64.2%) |
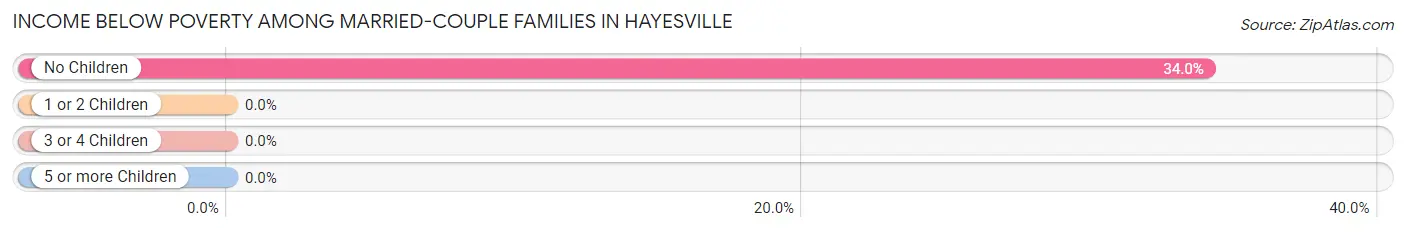
Income Below Poverty Among Married-Couple Families in Hayesville
The poverty statistics for married-couple families in Hayesville show that 26.2% or 16 of the total 61 families live below the poverty line. Families with no children have the highest poverty rate of 34.0%, comprising of 16 families. On the other hand, families with 1 or 2 children have the lowest poverty rate of 0.0%, which includes 0 families.
| Children | Above Poverty | Below Poverty |
| No Children | 31 (66.0%) | 16 (34.0%) |
| 1 or 2 Children | 9 (100.0%) | 0 (0.0%) |
| 3 or 4 Children | 5 (100.0%) | 0 (0.0%) |
| 5 or more Children | 0 (0.0%) | 0 (0.0%) |
| Total | 45 (73.8%) | 16 (26.2%) |
Income Below Poverty Among Single-Parent Households in Hayesville
According to the poverty data in Hayesville, 100.0% or 4 single-father households and 10.0% or 3 single-mother households are living below the poverty line. Among single-father households, those with 1 or 2 children have the highest poverty rate, with 4 households (100.0%) experiencing poverty. Likewise, among single-mother households, those with 1 or 2 children have the highest poverty rate, with 3 households (42.9%) falling below the poverty line.
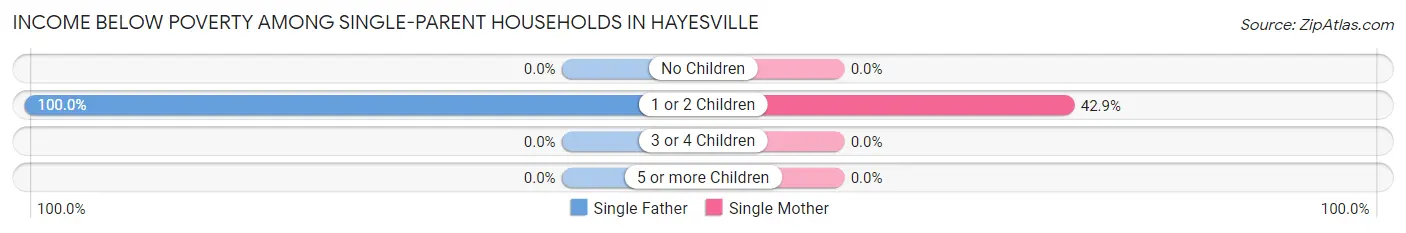
| Children | Single Father | Single Mother |
| No Children | 0 (0.0%) | 0 (0.0%) |
| 1 or 2 Children | 4 (100.0%) | 3 (42.9%) |
| 3 or 4 Children | 0 (0.0%) | 0 (0.0%) |
| 5 or more Children | 0 (0.0%) | 0 (0.0%) |
| Total | 4 (100.0%) | 3 (10.0%) |
Income Below Poverty Among Married-Couple vs Single-Parent Households in Hayesville
The poverty data for Hayesville shows that 16 of the married-couple family households (26.2%) and 7 of the single-parent households (20.6%) are living below the poverty level. Within the married-couple family households, those with no children have the highest poverty rate, with 16 households (34.0%) falling below the poverty line. Among the single-parent households, those with 1 or 2 children have the highest poverty rate, with 7 household (63.6%) living below poverty.
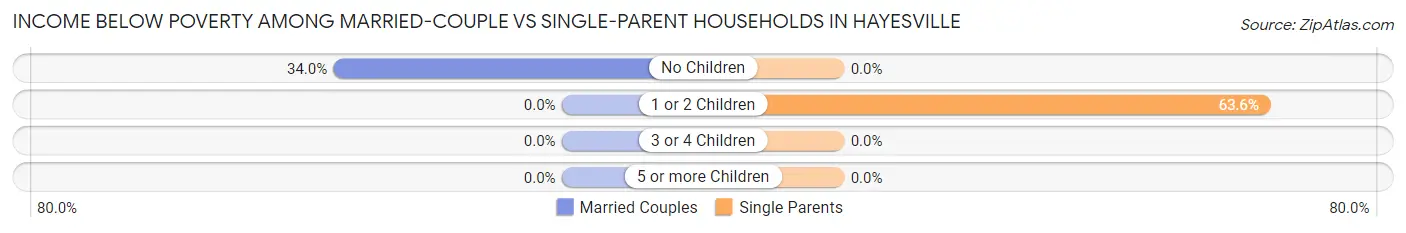
| Children | Married-Couple Families | Single-Parent Households |
| No Children | 16 (34.0%) | 0 (0.0%) |
| 1 or 2 Children | 0 (0.0%) | 7 (63.6%) |
| 3 or 4 Children | 0 (0.0%) | 0 (0.0%) |
| 5 or more Children | 0 (0.0%) | 0 (0.0%) |
| Total | 16 (26.2%) | 7 (20.6%) |
Race in Hayesville
The most populous races in Hayesville are White / Caucasian (568 | 90.3%), Hispanic or Latino (52 | 8.3%), and Two or more Races (29 | 4.6%).
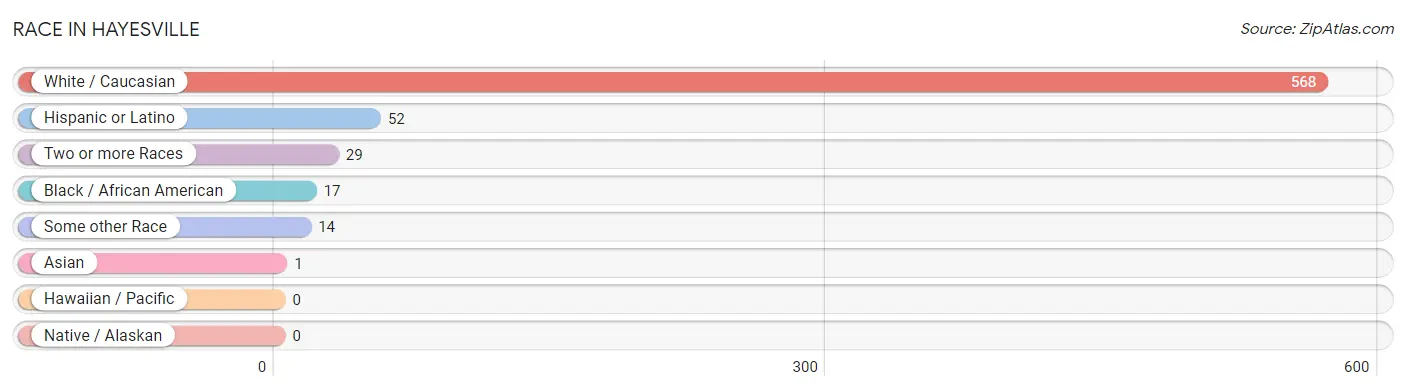
| Race | # Population | % Population |
| Asian | 1 | 0.2% |
| Black / African American | 17 | 2.7% |
| Hawaiian / Pacific | 0 | 0.0% |
| Hispanic or Latino | 52 | 8.3% |
| Native / Alaskan | 0 | 0.0% |
| White / Caucasian | 568 | 90.3% |
| Two or more Races | 29 | 4.6% |
| Some other Race | 14 | 2.2% |
| Total | 629 | 100.0% |
Ancestry in Hayesville
The most populous ancestries reported in Hayesville are American (59 | 9.4%), German (57 | 9.1%), Irish (57 | 9.1%), English (49 | 7.8%), and Mexican (35 | 5.6%), together accounting for 40.8% of all Hayesville residents.
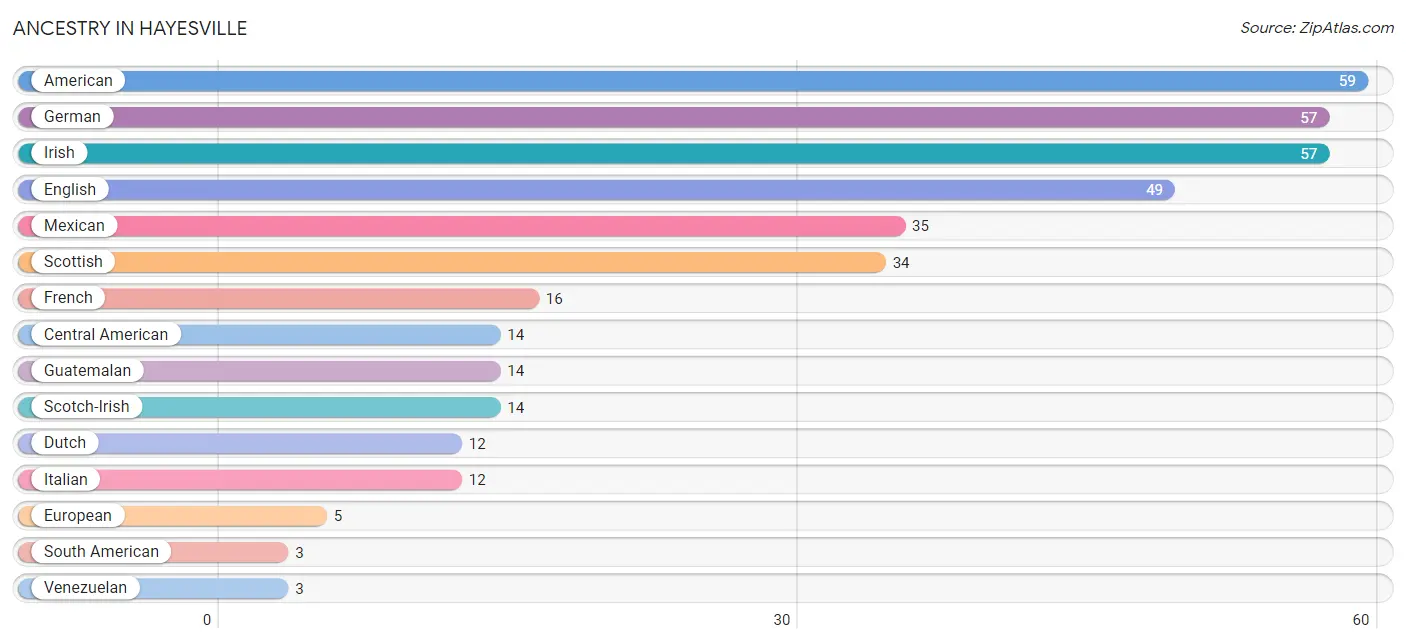
| Ancestry | # Population | % Population |
| American | 59 | 9.4% |
| Canadian | 2 | 0.3% |
| Central American | 14 | 2.2% |
| Cherokee | 2 | 0.3% |
| Dutch | 12 | 1.9% |
| English | 49 | 7.8% |
| European | 5 | 0.8% |
| Finnish | 2 | 0.3% |
| French | 16 | 2.5% |
| German | 57 | 9.1% |
| Guatemalan | 14 | 2.2% |
| Hungarian | 2 | 0.3% |
| Irish | 57 | 9.1% |
| Italian | 12 | 1.9% |
| Mexican | 35 | 5.6% |
| Nigerian | 2 | 0.3% |
| Scotch-Irish | 14 | 2.2% |
| Scottish | 34 | 5.4% |
| South American | 3 | 0.5% |
| Subsaharan African | 2 | 0.3% |
| Thai | 1 | 0.2% |
| Venezuelan | 3 | 0.5% | View All 22 Rows |
Immigrants in Hayesville
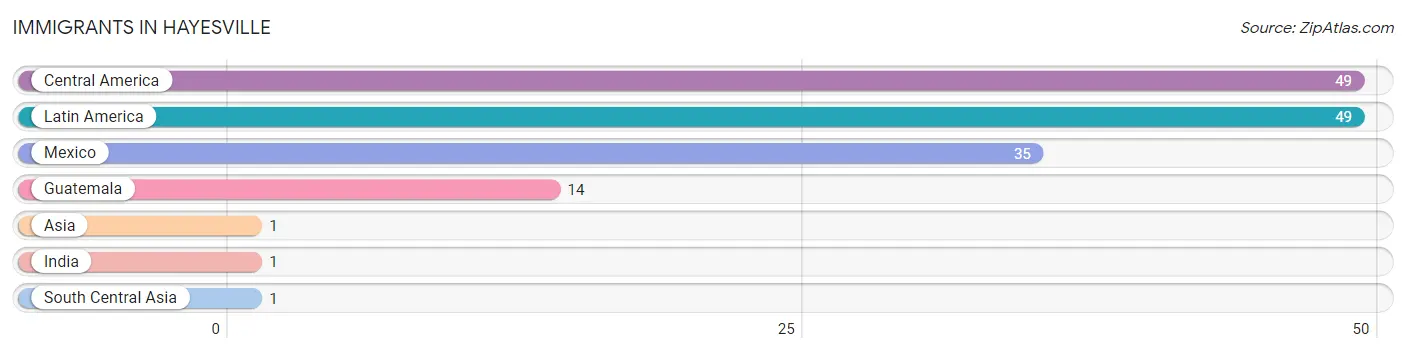
The most numerous immigrant groups reported in Hayesville came from Central America (49 | 7.8%), Latin America (49 | 7.8%), Mexico (35 | 5.6%), Guatemala (14 | 2.2%), and Asia (1 | 0.2%), together accounting for 23.5% of all Hayesville residents.
| Immigration Origin | # Population | % Population |
| Asia | 1 | 0.2% |
| Central America | 49 | 7.8% |
| Guatemala | 14 | 2.2% |
| India | 1 | 0.2% |
| Latin America | 49 | 7.8% |
| Mexico | 35 | 5.6% |
| South Central Asia | 1 | 0.2% | View All 7 Rows |
Sex and Age in Hayesville
Sex and Age in Hayesville
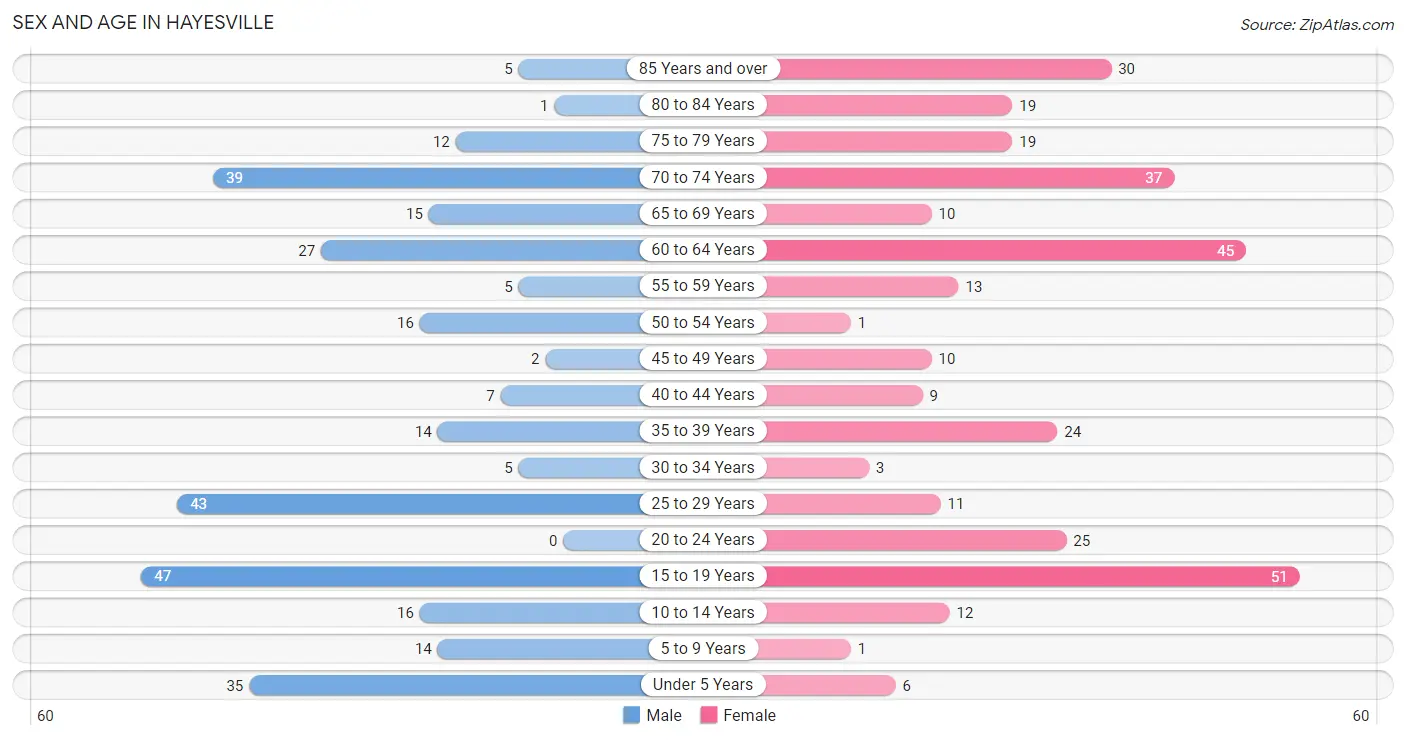
The most populous age groups in Hayesville are 15 to 19 Years (47 | 15.5%) for men and 15 to 19 Years (51 | 15.6%) for women.
| Age Bracket | Male | Female |
| Under 5 Years | 35 (11.6%) | 6 (1.8%) |
| 5 to 9 Years | 14 (4.6%) | 1 (0.3%) |
| 10 to 14 Years | 16 (5.3%) | 12 (3.7%) |
| 15 to 19 Years | 47 (15.5%) | 51 (15.6%) |
| 20 to 24 Years | 0 (0.0%) | 25 (7.7%) |
| 25 to 29 Years | 43 (14.2%) | 11 (3.4%) |
| 30 to 34 Years | 5 (1.7%) | 3 (0.9%) |
| 35 to 39 Years | 14 (4.6%) | 24 (7.4%) |
| 40 to 44 Years | 7 (2.3%) | 9 (2.8%) |
| 45 to 49 Years | 2 (0.7%) | 10 (3.1%) |
| 50 to 54 Years | 16 (5.3%) | 1 (0.3%) |
| 55 to 59 Years | 5 (1.7%) | 13 (4.0%) |
| 60 to 64 Years | 27 (8.9%) | 45 (13.8%) |
| 65 to 69 Years | 15 (5.0%) | 10 (3.1%) |
| 70 to 74 Years | 39 (12.9%) | 37 (11.4%) |
| 75 to 79 Years | 12 (4.0%) | 19 (5.8%) |
| 80 to 84 Years | 1 (0.3%) | 19 (5.8%) |
| 85 Years and over | 5 (1.7%) | 30 (9.2%) |
| Total | 303 (100.0%) | 326 (100.0%) |
Families and Households in Hayesville
Median Family Size in Hayesville
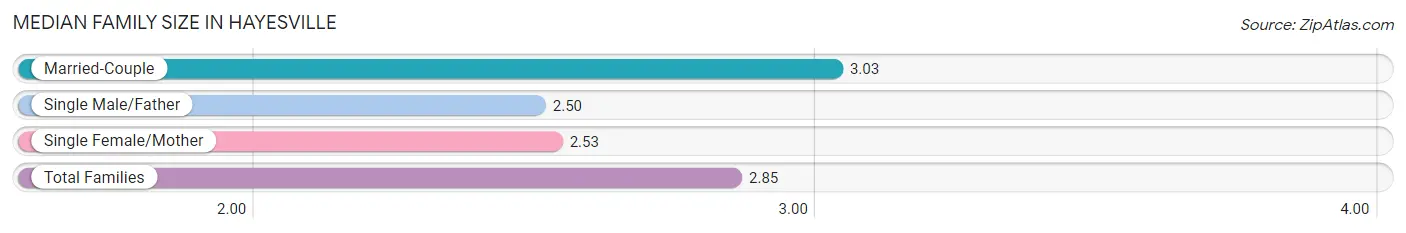
The median family size in Hayesville is 2.85 persons per family, with married-couple families (61 | 64.2%) accounting for the largest median family size of 3.03 persons per family. On the other hand, single male/father families (4 | 4.2%) represent the smallest median family size with 2.50 persons per family.
| Family Type | # Families | Family Size |
| Married-Couple | 61 (64.2%) | 3.03 |
| Single Male/Father | 4 (4.2%) | 2.50 |
| Single Female/Mother | 30 (31.6%) | 2.53 |
| Total Families | 95 (100.0%) | 2.85 |
Median Household Size in Hayesville
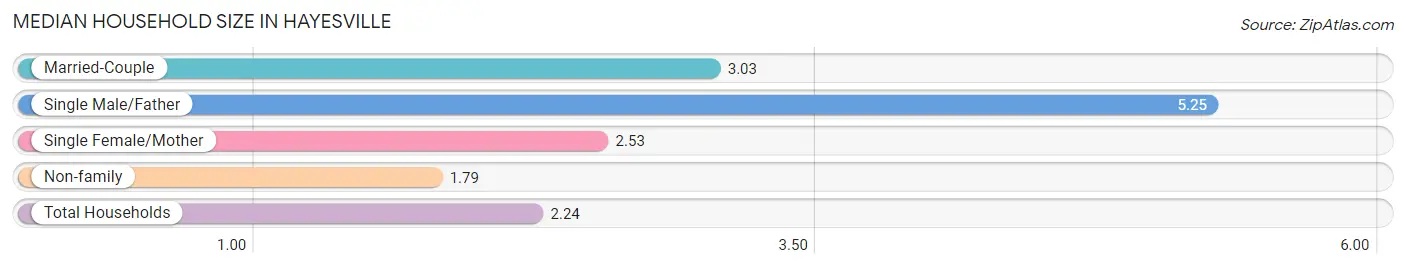
The median household size in Hayesville is 2.24 persons per household, with single male/father households (4 | 1.6%) accounting for the largest median household size of 5.25 persons per household. non-family households (150 | 61.2%) represent the smallest median household size with 1.79 persons per household.
| Household Type | # Households | Household Size |
| Married-Couple | 61 (24.9%) | 3.03 |
| Single Male/Father | 4 (1.6%) | 5.25 |
| Single Female/Mother | 30 (12.2%) | 2.53 |
| Non-family | 150 (61.2%) | 1.79 |
| Total Households | 245 (100.0%) | 2.24 |
Household Size by Marriage Status in Hayesville
Out of a total of 245 households in Hayesville, 95 (38.8%) are family households, while 150 (61.2%) are nonfamily households. The most numerous type of family households are 2-person households, comprising 67, and the most common type of nonfamily households are 1-person households, comprising 120.
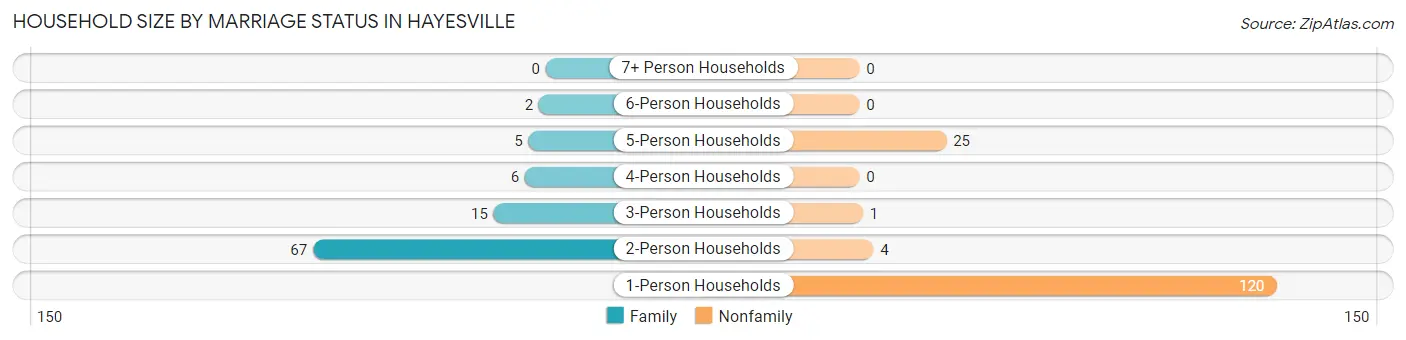
| Household Size | Family Households | Nonfamily Households |
| 1-Person Households | - | 120 (49.0%) |
| 2-Person Households | 67 (27.4%) | 4 (1.6%) |
| 3-Person Households | 15 (6.1%) | 1 (0.4%) |
| 4-Person Households | 6 (2.5%) | 0 (0.0%) |
| 5-Person Households | 5 (2.0%) | 25 (10.2%) |
| 6-Person Households | 2 (0.8%) | 0 (0.0%) |
| 7+ Person Households | 0 (0.0%) | 0 (0.0%) |
| Total | 95 (38.8%) | 150 (61.2%) |
Female Fertility in Hayesville
Fertility by Age in Hayesville
| Age Bracket | Women with Births | Births / 1,000 Women |
| 15 to 19 years | 0 (0.0%) | 0.0 |
| 20 to 34 years | 0 (0.0%) | 0.0 |
| 35 to 50 years | 0 (0.0%) | 0.0 |
| Total | 0 (0.0%) | 0.0 |
Fertility by Age by Marriage Status in Hayesville
| Age Bracket | Married | Unmarried |
| 15 to 19 years | 0 (0.0%) | 0 (0.0%) |
| 20 to 34 years | 0 (0.0%) | 0 (0.0%) |
| 35 to 50 years | 0 (0.0%) | 0 (0.0%) |
| Total | 0 (0.0%) | 0 (0.0%) |
Fertility by Education in Hayesville
| Educational Attainment | Women with Births | Births / 1,000 Women |
| Less than High School | 0 (0.0%) | 0.0 |
| High School Diploma | 0 (0.0%) | 0.0 |
| College or Associate's Degree | 0 (0.0%) | 0.0 |
| Bachelor's Degree | 0 (0.0%) | 0.0 |
| Graduate Degree | 0 (0.0%) | 0.0 |
| Total | 0 (0.0%) | 0.0 |
Fertility by Education by Marriage Status in Hayesville
| Educational Attainment | Married | Unmarried |
| Less than High School | 0 (0.0%) | 0 (0.0%) |
| High School Diploma | 0 (0.0%) | 0 (0.0%) |
| College or Associate's Degree | 0 (0.0%) | 0 (0.0%) |
| Bachelor's Degree | 0 (0.0%) | 0 (0.0%) |
| Graduate Degree | 0 (0.0%) | 0 (0.0%) |
| Total | 0 (0.0%) | 0 (0.0%) |
Employment Characteristics in Hayesville
Employment by Class of Employer in Hayesville
Among the 236 employed individuals in Hayesville, private company employees (197 | 83.5%), not-for-profit organizations (14 | 5.9%), and state government employees (9 | 3.8%) make up the most common classes of employment.
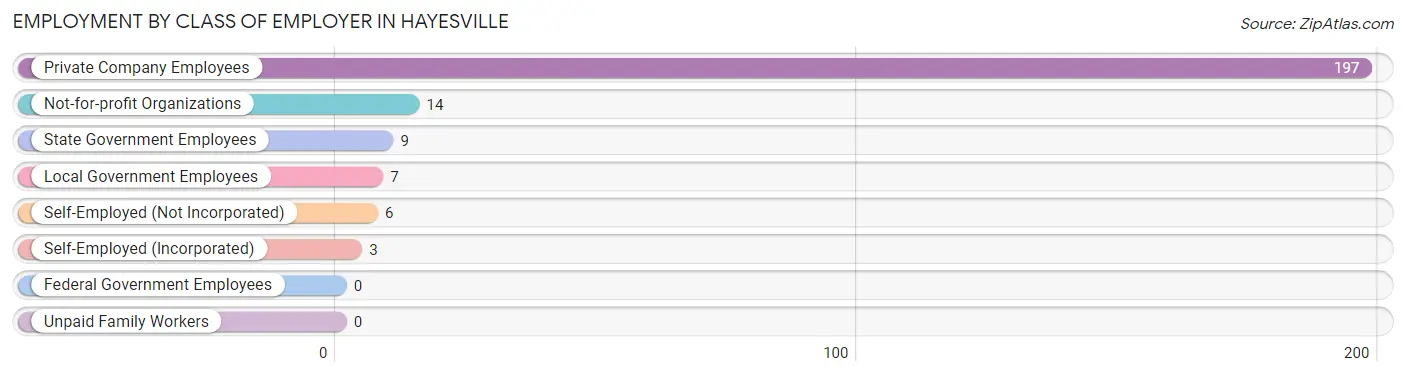
| Employer Class | # Employees | % Employees |
| Private Company Employees | 197 | 83.5% |
| Self-Employed (Incorporated) | 3 | 1.3% |
| Self-Employed (Not Incorporated) | 6 | 2.5% |
| Not-for-profit Organizations | 14 | 5.9% |
| Local Government Employees | 7 | 3.0% |
| State Government Employees | 9 | 3.8% |
| Federal Government Employees | 0 | 0.0% |
| Unpaid Family Workers | 0 | 0.0% |
| Total | 236 | 100.0% |
Employment Status by Age in Hayesville
According to the labor force statistics for Hayesville, out of the total population over 16 years of age (540), 44.4% or 240 individuals are in the labor force, with 0.8% or 2 of them unemployed. The age group with the highest labor force participation rate is 30 to 34 years, with 100.0% or 8 individuals in the labor force. Within the labor force, the 35 to 44 years age range has the highest percentage of unemployed individuals, with 4.1% or 2 of them being unemployed.
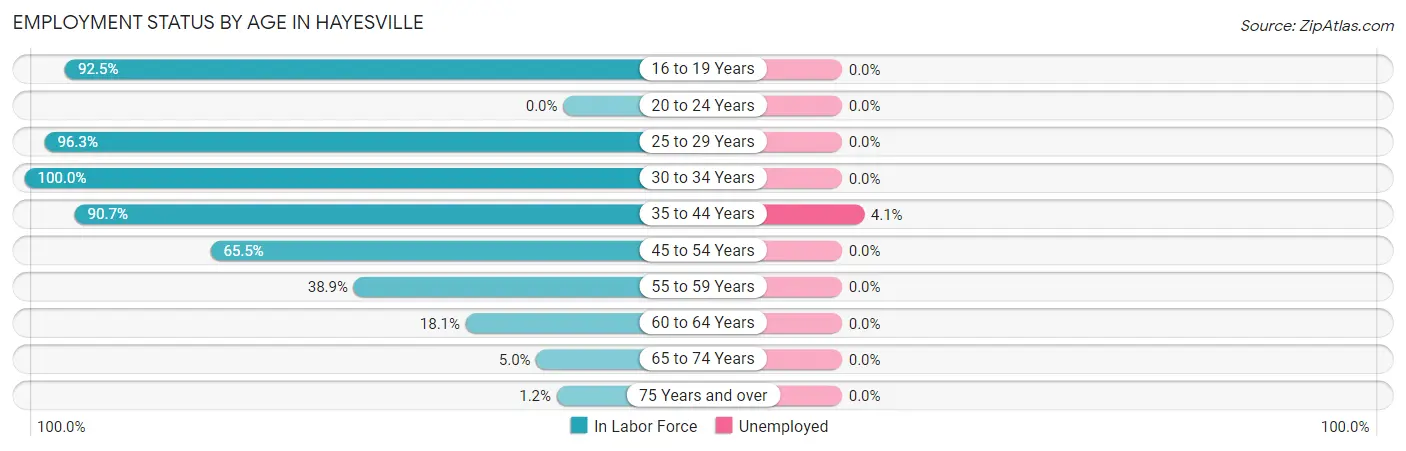
| Age Bracket | In Labor Force | Unemployed |
| 16 to 19 Years | 86 (92.5%) | 0 (0.0%) |
| 20 to 24 Years | 0 (0.0%) | 0 (0.0%) |
| 25 to 29 Years | 52 (96.3%) | 0 (0.0%) |
| 30 to 34 Years | 8 (100.0%) | 0 (0.0%) |
| 35 to 44 Years | 49 (90.7%) | 2 (4.1%) |
| 45 to 54 Years | 19 (65.5%) | 0 (0.0%) |
| 55 to 59 Years | 7 (38.9%) | 0 (0.0%) |
| 60 to 64 Years | 13 (18.1%) | 0 (0.0%) |
| 65 to 74 Years | 5 (5.0%) | 0 (0.0%) |
| 75 Years and over | 1 (1.2%) | 0 (0.0%) |
| Total | 240 (44.4%) | 2 (0.8%) |
Employment Status by Educational Attainment in Hayesville
According to labor force statistics for Hayesville, 63.0% of individuals (148) out of the total population between 25 and 64 years of age (235) are in the labor force, with 1.4% or 2 of them being unemployed. The group with the highest labor force participation rate are those with the educational attainment of high school diploma, with 75.0% or 36 individuals in the labor force. Within the labor force, individuals with less than high school education have the highest percentage of unemployment, with 4.4% or 2 of them being unemployed.
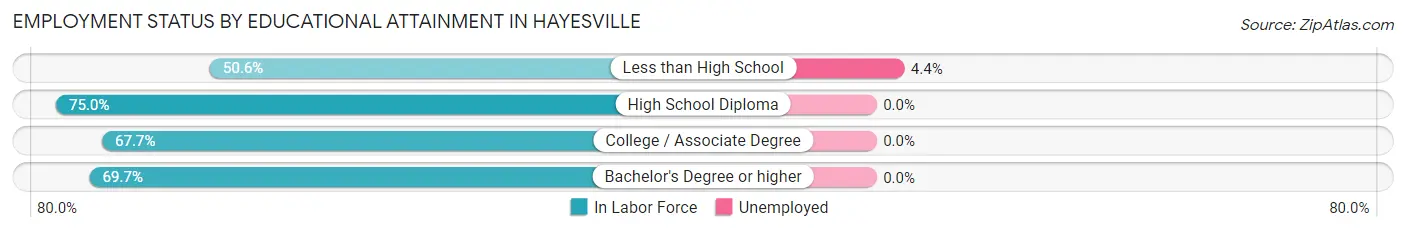
| Educational Attainment | In Labor Force | Unemployed |
| Less than High School | 45 (50.6%) | 4 (4.4%) |
| High School Diploma | 36 (75.0%) | 0 (0.0%) |
| College / Associate Degree | 44 (67.7%) | 0 (0.0%) |
| Bachelor's Degree or higher | 23 (69.7%) | 0 (0.0%) |
| Total | 148 (63.0%) | 3 (1.4%) |
Employment Occupations by Sex in Hayesville
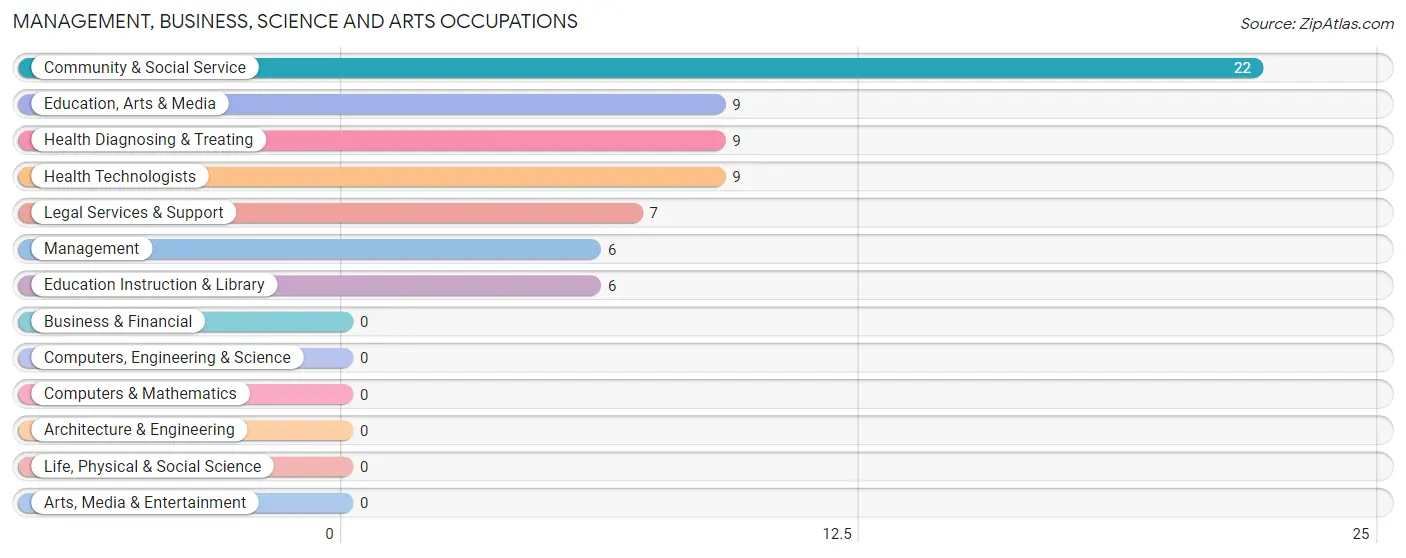
Management, Business, Science and Arts Occupations
The most common Management, Business, Science and Arts occupations in Hayesville are Community & Social Service (22 | 9.2%), Education, Arts & Media (9 | 3.8%), Health Diagnosing & Treating (9 | 3.8%), Health Technologists (9 | 3.8%), and Legal Services & Support (7 | 2.9%).
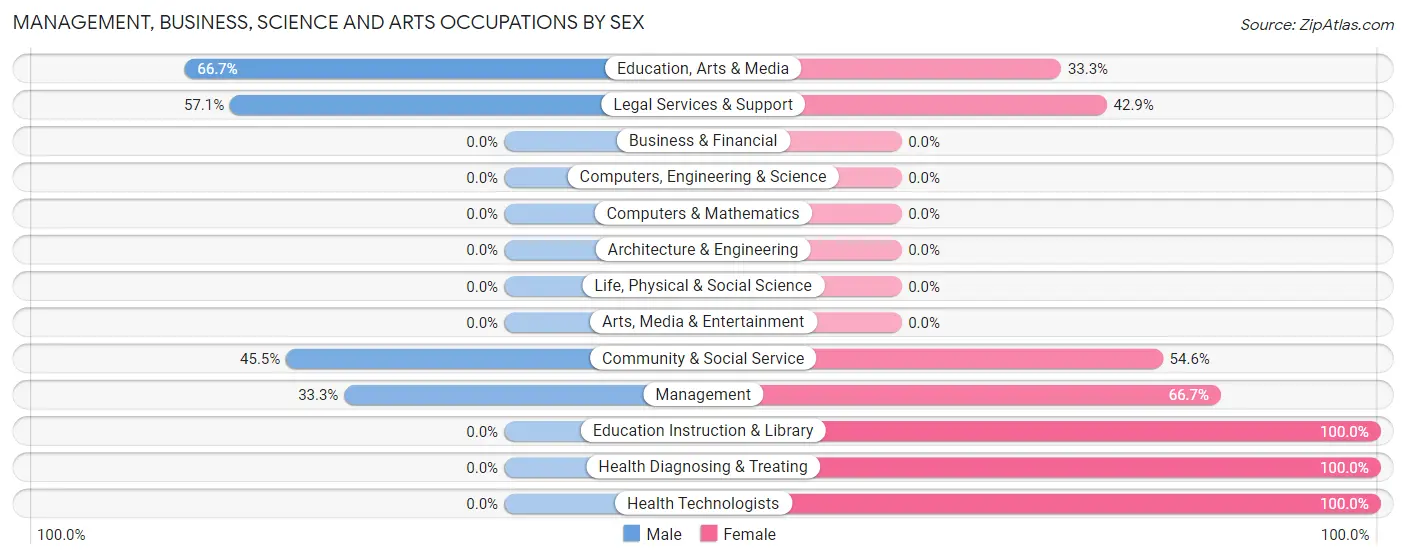
Management, Business, Science and Arts Occupations by Sex
Within the Management, Business, Science and Arts occupations in Hayesville, the most male-oriented occupations are Education, Arts & Media (66.7%), Legal Services & Support (57.1%), and Community & Social Service (45.5%), while the most female-oriented occupations are Education Instruction & Library (100.0%), Health Diagnosing & Treating (100.0%), and Health Technologists (100.0%).
| Occupation | Male | Female |
| Management | 2 (33.3%) | 4 (66.7%) |
| Business & Financial | 0 (0.0%) | 0 (0.0%) |
| Computers, Engineering & Science | 0 (0.0%) | 0 (0.0%) |
| Computers & Mathematics | 0 (0.0%) | 0 (0.0%) |
| Architecture & Engineering | 0 (0.0%) | 0 (0.0%) |
| Life, Physical & Social Science | 0 (0.0%) | 0 (0.0%) |
| Community & Social Service | 10 (45.5%) | 12 (54.5%) |
| Education, Arts & Media | 6 (66.7%) | 3 (33.3%) |
| Legal Services & Support | 4 (57.1%) | 3 (42.9%) |
| Education Instruction & Library | 0 (0.0%) | 6 (100.0%) |
| Arts, Media & Entertainment | 0 (0.0%) | 0 (0.0%) |
| Health Diagnosing & Treating | 0 (0.0%) | 9 (100.0%) |
| Health Technologists | 0 (0.0%) | 9 (100.0%) |
| Total (Category) | 12 (32.4%) | 25 (67.6%) |
| Total (Overall) | 126 (52.9%) | 112 (47.1%) |
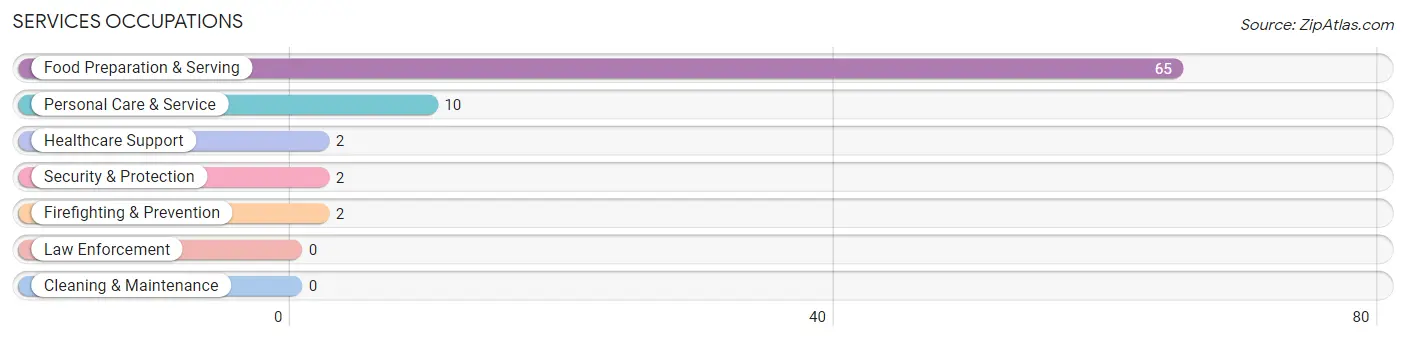
Services Occupations
The most common Services occupations in Hayesville are Food Preparation & Serving (65 | 27.3%), Personal Care & Service (10 | 4.2%), Healthcare Support (2 | 0.8%), Security & Protection (2 | 0.8%), and Firefighting & Prevention (2 | 0.8%).
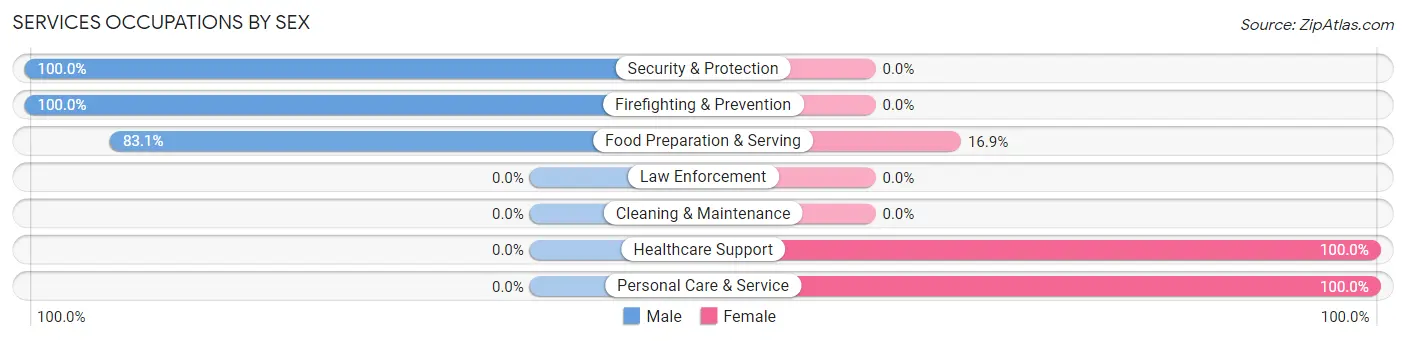
Services Occupations by Sex
Within the Services occupations in Hayesville, the most male-oriented occupations are Security & Protection (100.0%), Firefighting & Prevention (100.0%), and Food Preparation & Serving (83.1%), while the most female-oriented occupations are Healthcare Support (100.0%), Personal Care & Service (100.0%), and Food Preparation & Serving (16.9%).
| Occupation | Male | Female |
| Healthcare Support | 0 (0.0%) | 2 (100.0%) |
| Security & Protection | 2 (100.0%) | 0 (0.0%) |
| Firefighting & Prevention | 2 (100.0%) | 0 (0.0%) |
| Law Enforcement | 0 (0.0%) | 0 (0.0%) |
| Food Preparation & Serving | 54 (83.1%) | 11 (16.9%) |
| Cleaning & Maintenance | 0 (0.0%) | 0 (0.0%) |
| Personal Care & Service | 0 (0.0%) | 10 (100.0%) |
| Total (Category) | 56 (70.9%) | 23 (29.1%) |
| Total (Overall) | 126 (52.9%) | 112 (47.1%) |
Sales and Office Occupations
The most common Sales and Office occupations in Hayesville are Sales & Related (84 | 35.3%), and Office & Administration (9 | 3.8%).
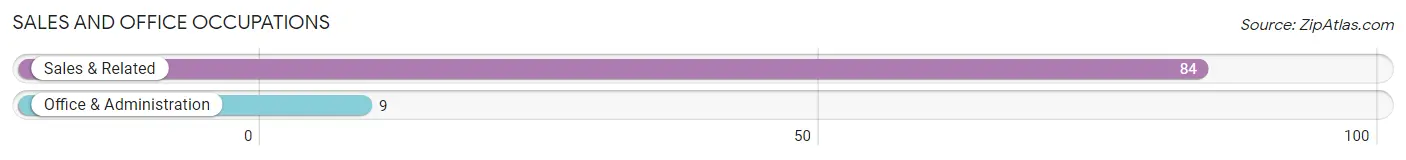
Sales and Office Occupations by Sex
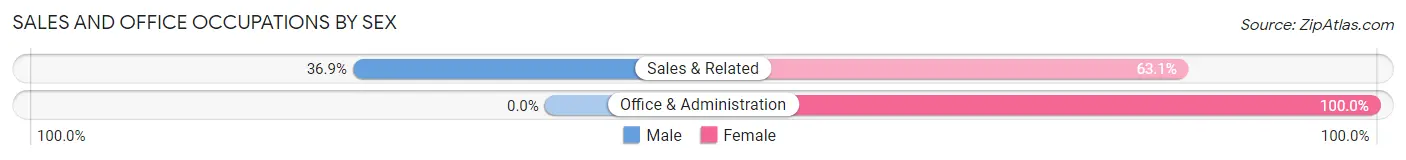
| Occupation | Male | Female |
| Sales & Related | 31 (36.9%) | 53 (63.1%) |
| Office & Administration | 0 (0.0%) | 9 (100.0%) |
| Total (Category) | 31 (33.3%) | 62 (66.7%) |
| Total (Overall) | 126 (52.9%) | 112 (47.1%) |
Natural Resources, Construction and Maintenance Occupations
The most common Natural Resources, Construction and Maintenance occupations in Hayesville are Construction & Extraction (21 | 8.8%), and Installation, Maintenance & Repair (2 | 0.8%).

Natural Resources, Construction and Maintenance Occupations by Sex
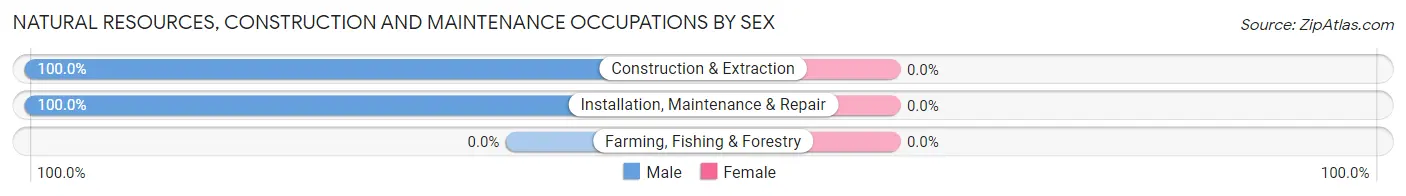
| Occupation | Male | Female |
| Farming, Fishing & Forestry | 0 (0.0%) | 0 (0.0%) |
| Construction & Extraction | 21 (100.0%) | 0 (0.0%) |
| Installation, Maintenance & Repair | 2 (100.0%) | 0 (0.0%) |
| Total (Category) | 23 (100.0%) | 0 (0.0%) |
| Total (Overall) | 126 (52.9%) | 112 (47.1%) |
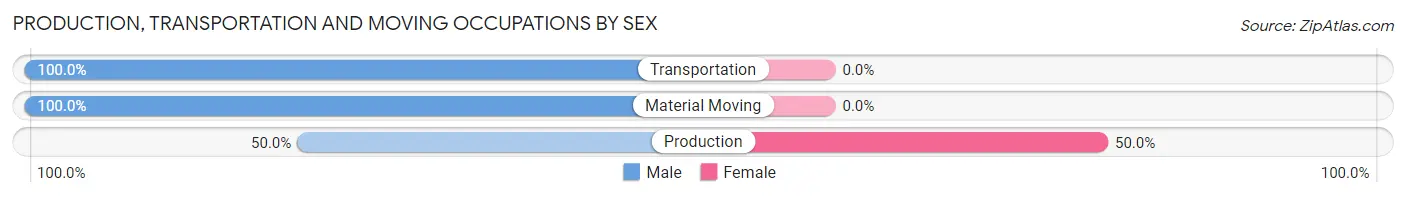
Production, Transportation and Moving Occupations
The most common Production, Transportation and Moving occupations in Hayesville are Production (4 | 1.7%), Transportation (1 | 0.4%), and Material Moving (1 | 0.4%).
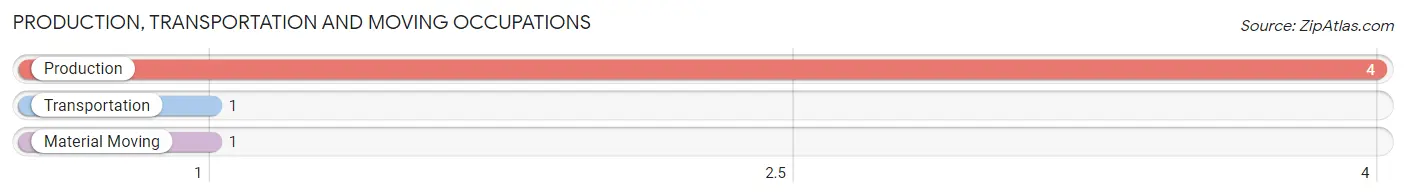
Production, Transportation and Moving Occupations by Sex
| Occupation | Male | Female |
| Production | 2 (50.0%) | 2 (50.0%) |
| Transportation | 1 (100.0%) | 0 (0.0%) |
| Material Moving | 1 (100.0%) | 0 (0.0%) |
| Total (Category) | 4 (66.7%) | 2 (33.3%) |
| Total (Overall) | 126 (52.9%) | 112 (47.1%) |
Employment Industries by Sex in Hayesville
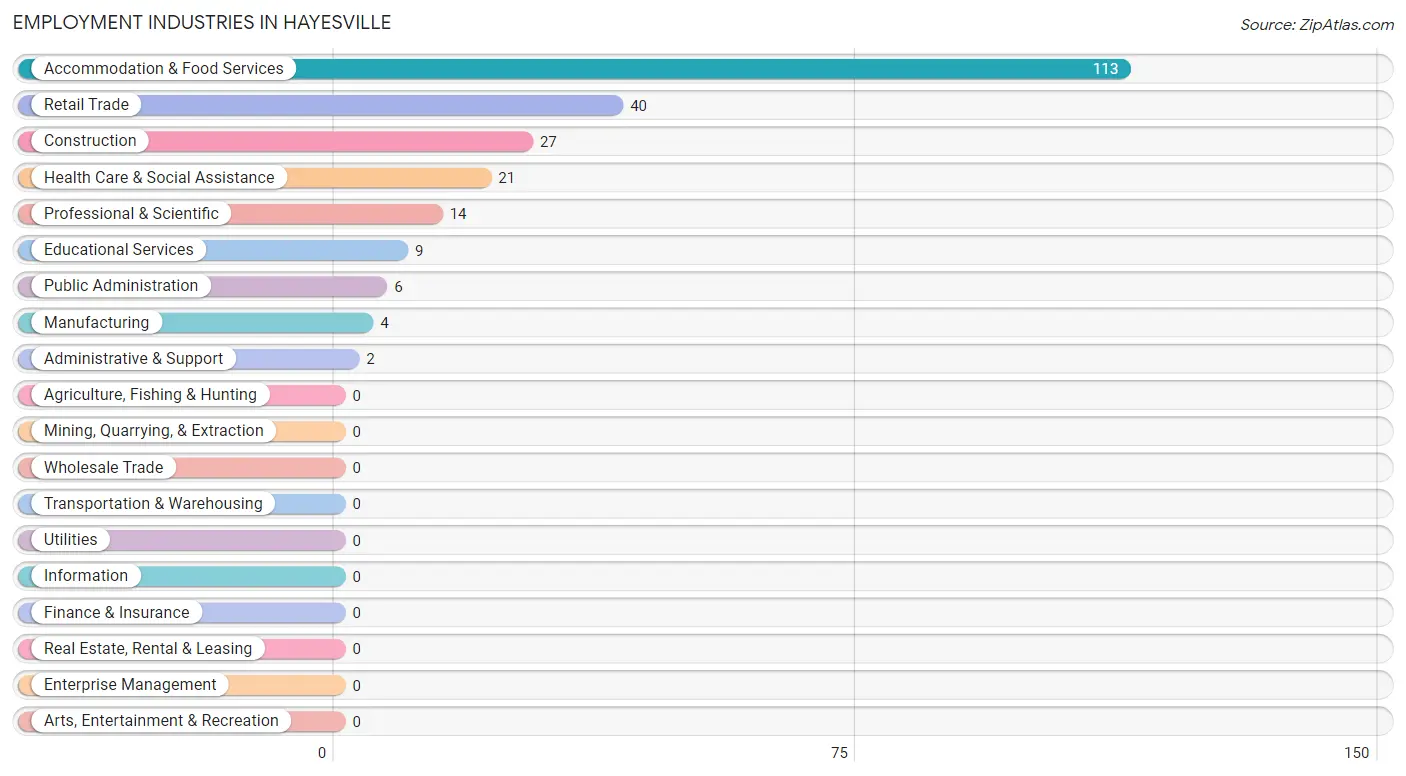
Employment Industries in Hayesville
The major employment industries in Hayesville include Accommodation & Food Services (113 | 47.5%), Retail Trade (40 | 16.8%), Construction (27 | 11.3%), Health Care & Social Assistance (21 | 8.8%), and Professional & Scientific (14 | 5.9%).
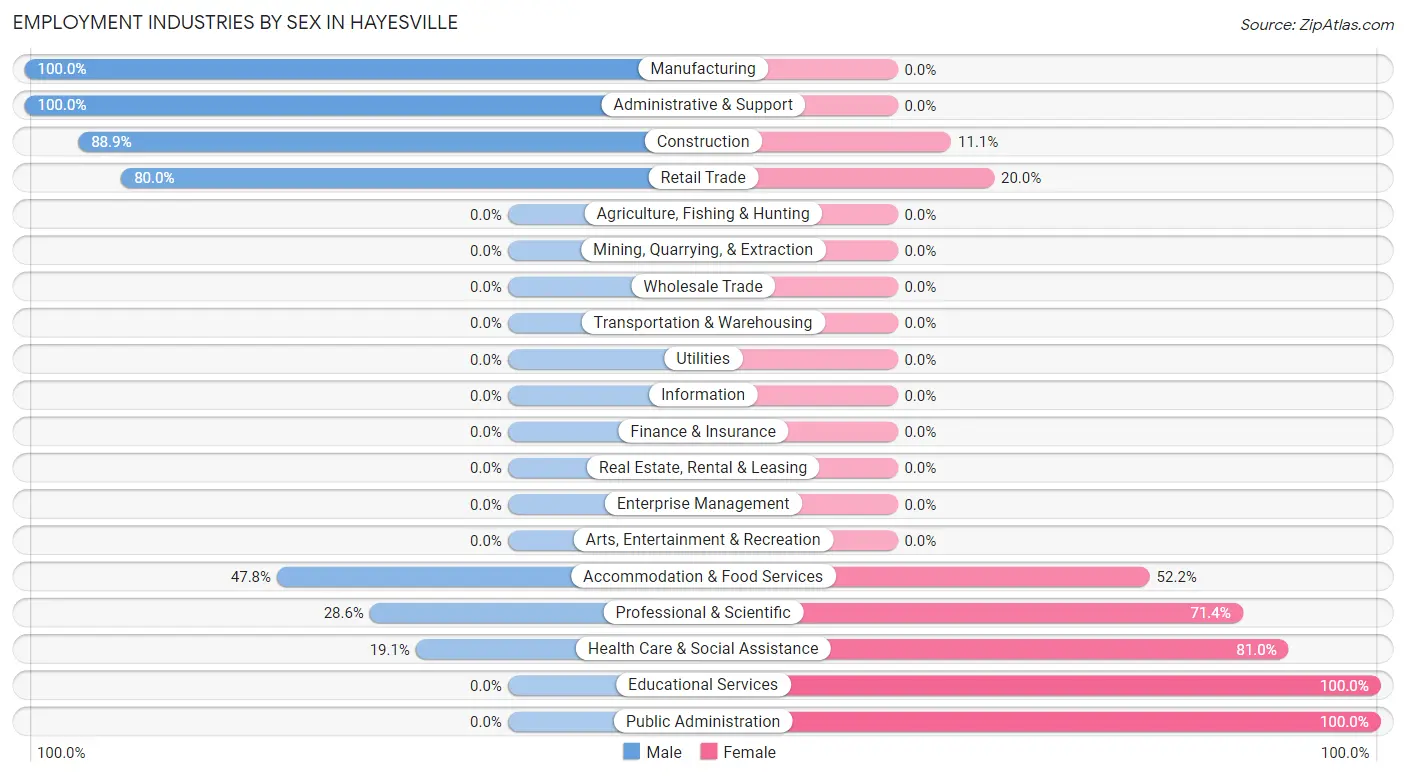
Employment Industries by Sex in Hayesville
The Hayesville industries that see more men than women are Manufacturing (100.0%), Administrative & Support (100.0%), and Construction (88.9%), whereas the industries that tend to have a higher number of women are Educational Services (100.0%), Public Administration (100.0%), and Health Care & Social Assistance (80.9%).
| Industry | Male | Female |
| Agriculture, Fishing & Hunting | 0 (0.0%) | 0 (0.0%) |
| Mining, Quarrying, & Extraction | 0 (0.0%) | 0 (0.0%) |
| Construction | 24 (88.9%) | 3 (11.1%) |
| Manufacturing | 4 (100.0%) | 0 (0.0%) |
| Wholesale Trade | 0 (0.0%) | 0 (0.0%) |
| Retail Trade | 32 (80.0%) | 8 (20.0%) |
| Transportation & Warehousing | 0 (0.0%) | 0 (0.0%) |
| Utilities | 0 (0.0%) | 0 (0.0%) |
| Information | 0 (0.0%) | 0 (0.0%) |
| Finance & Insurance | 0 (0.0%) | 0 (0.0%) |
| Real Estate, Rental & Leasing | 0 (0.0%) | 0 (0.0%) |
| Professional & Scientific | 4 (28.6%) | 10 (71.4%) |
| Enterprise Management | 0 (0.0%) | 0 (0.0%) |
| Administrative & Support | 2 (100.0%) | 0 (0.0%) |
| Educational Services | 0 (0.0%) | 9 (100.0%) |
| Health Care & Social Assistance | 4 (19.1%) | 17 (80.9%) |
| Arts, Entertainment & Recreation | 0 (0.0%) | 0 (0.0%) |
| Accommodation & Food Services | 54 (47.8%) | 59 (52.2%) |
| Public Administration | 0 (0.0%) | 6 (100.0%) |
| Total | 126 (52.9%) | 112 (47.1%) |
Education in Hayesville
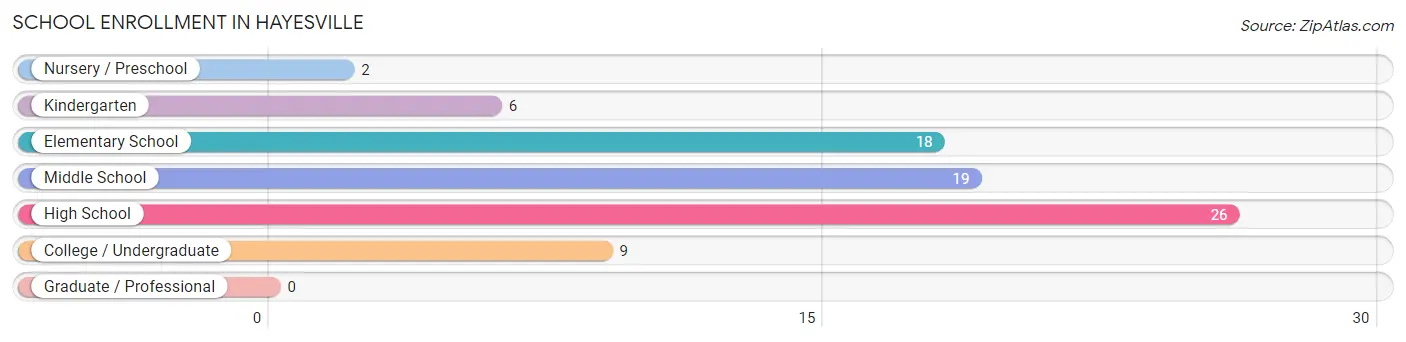
School Enrollment in Hayesville
The most common levels of schooling among the 80 students in Hayesville are high school (26 | 32.5%), middle school (19 | 23.7%), and elementary school (18 | 22.5%).
| School Level | # Students | % Students |
| Nursery / Preschool | 2 | 2.5% |
| Kindergarten | 6 | 7.5% |
| Elementary School | 18 | 22.5% |
| Middle School | 19 | 23.7% |
| High School | 26 | 32.5% |
| College / Undergraduate | 9 | 11.3% |
| Graduate / Professional | 0 | 0.0% |
| Total | 80 | 100.0% |
School Enrollment by Age by Funding Source in Hayesville
Out of a total of 80 students who are enrolled in schools in Hayesville, 5 (6.3%) attend a private institution, while the remaining 75 (93.7%) are enrolled in public schools. The age group of 35 years and over has the highest likelihood of being enrolled in private schools, with 2 (33.3% in the age bracket) enrolled. Conversely, the age group of 3 to 4 year olds has the lowest likelihood of being enrolled in a private school, with 2 (100.0% in the age bracket) attending a public institution.
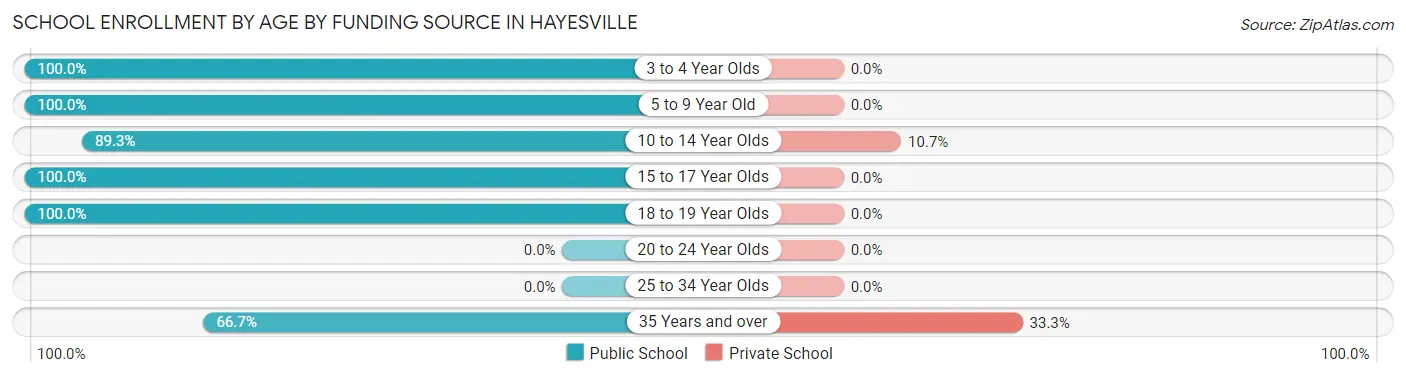
| Age Bracket | Public School | Private School |
| 3 to 4 Year Olds | 2 (100.0%) | 0 (0.0%) |
| 5 to 9 Year Old | 15 (100.0%) | 0 (0.0%) |
| 10 to 14 Year Olds | 25 (89.3%) | 3 (10.7%) |
| 15 to 17 Year Olds | 22 (100.0%) | 0 (0.0%) |
| 18 to 19 Year Olds | 7 (100.0%) | 0 (0.0%) |
| 20 to 24 Year Olds | 0 (0.0%) | 0 (0.0%) |
| 25 to 34 Year Olds | 0 (0.0%) | 0 (0.0%) |
| 35 Years and over | 4 (66.7%) | 2 (33.3%) |
| Total | 75 (93.8%) | 5 (6.3%) |
Educational Attainment by Field of Study in Hayesville
Education (17 | 30.9%), science & technology (11 | 20.0%), arts & humanities (11 | 20.0%), social sciences (7 | 12.7%), and business (4 | 7.3%) are the most common fields of study among 55 individuals in Hayesville who have obtained a bachelor's degree or higher.
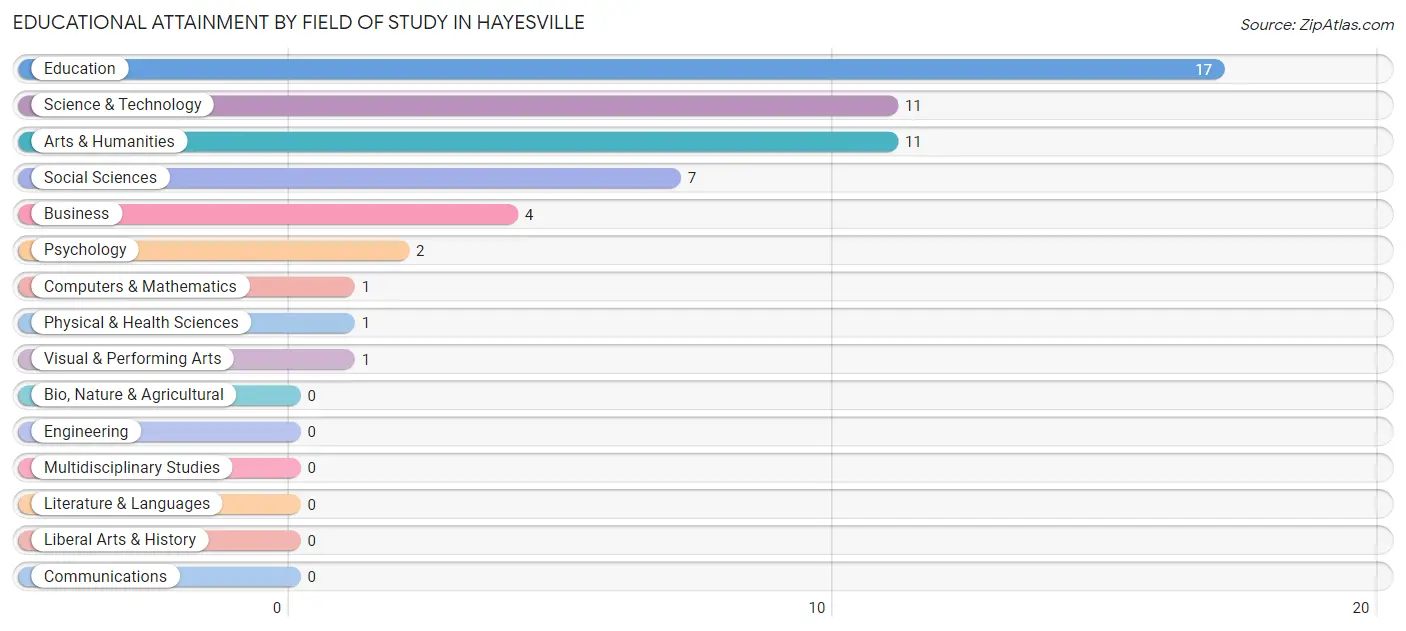
| Field of Study | # Graduates | % Graduates |
| Computers & Mathematics | 1 | 1.8% |
| Bio, Nature & Agricultural | 0 | 0.0% |
| Physical & Health Sciences | 1 | 1.8% |
| Psychology | 2 | 3.6% |
| Social Sciences | 7 | 12.7% |
| Engineering | 0 | 0.0% |
| Multidisciplinary Studies | 0 | 0.0% |
| Science & Technology | 11 | 20.0% |
| Business | 4 | 7.3% |
| Education | 17 | 30.9% |
| Literature & Languages | 0 | 0.0% |
| Liberal Arts & History | 0 | 0.0% |
| Visual & Performing Arts | 1 | 1.8% |
| Communications | 0 | 0.0% |
| Arts & Humanities | 11 | 20.0% |
| Total | 55 | 100.0% |
Transportation & Commute in Hayesville
Vehicle Availability by Sex in Hayesville
The most prevalent vehicle ownership categories in Hayesville are males with 2 vehicles (51, accounting for 40.5%) and females with 2 vehicles (70, making up 47.7%).
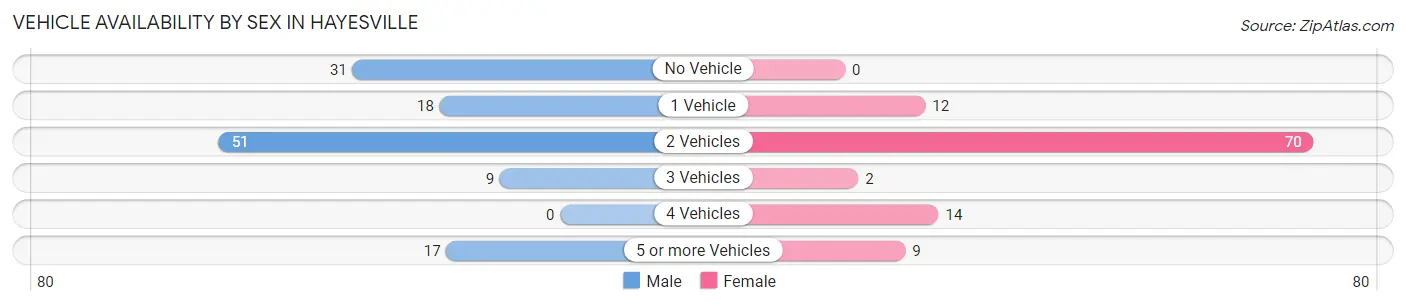
| Vehicles Available | Male | Female |
| No Vehicle | 31 (24.6%) | 0 (0.0%) |
| 1 Vehicle | 18 (14.3%) | 12 (11.2%) |
| 2 Vehicles | 51 (40.5%) | 70 (65.4%) |
| 3 Vehicles | 9 (7.1%) | 2 (1.9%) |
| 4 Vehicles | 0 (0.0%) | 14 (13.1%) |
| 5 or more Vehicles | 17 (13.5%) | 9 (8.4%) |
| Total | 126 (100.0%) | 107 (100.0%) |
Commute Time in Hayesville
The most frequently occuring commute durations in Hayesville are 5 to 9 minutes (66 commuters, 28.7%), 25 to 29 minutes (63 commuters, 27.4%), and 20 to 24 minutes (37 commuters, 16.1%).
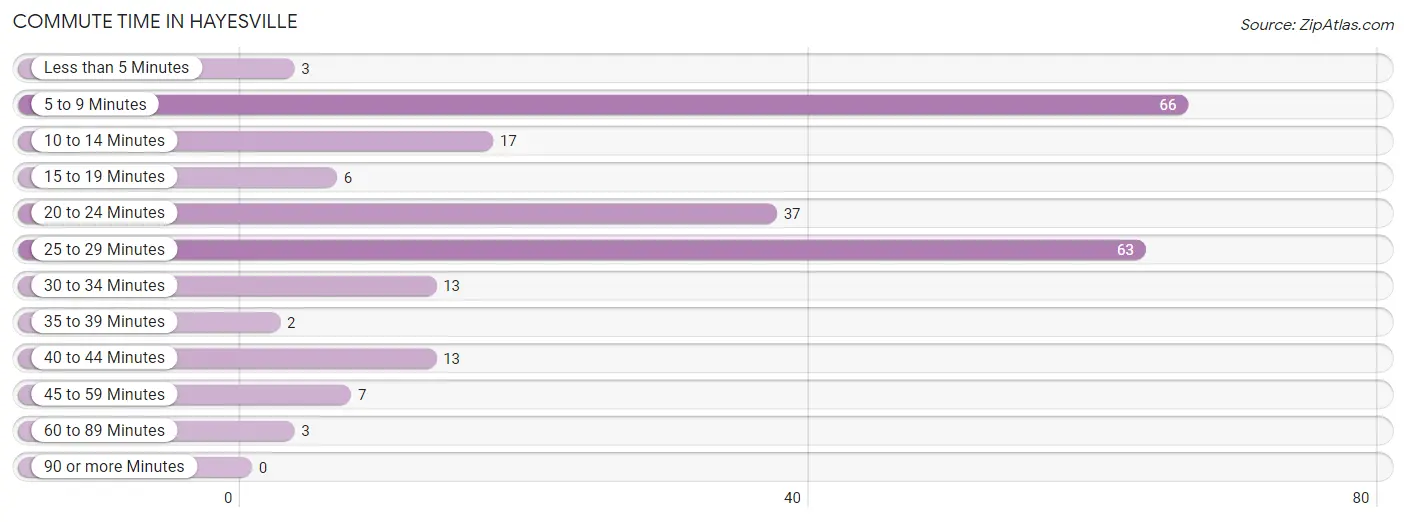
| Commute Time | # Commuters | % Commuters |
| Less than 5 Minutes | 3 | 1.3% |
| 5 to 9 Minutes | 66 | 28.7% |
| 10 to 14 Minutes | 17 | 7.4% |
| 15 to 19 Minutes | 6 | 2.6% |
| 20 to 24 Minutes | 37 | 16.1% |
| 25 to 29 Minutes | 63 | 27.4% |
| 30 to 34 Minutes | 13 | 5.7% |
| 35 to 39 Minutes | 2 | 0.9% |
| 40 to 44 Minutes | 13 | 5.7% |
| 45 to 59 Minutes | 7 | 3.0% |
| 60 to 89 Minutes | 3 | 1.3% |
| 90 or more Minutes | 0 | 0.0% |
Commute Time by Sex in Hayesville
The most common commute times in Hayesville are 20 to 24 minutes (36 commuters, 29.5%) for males and 5 to 9 minutes (43 commuters, 39.8%) for females.
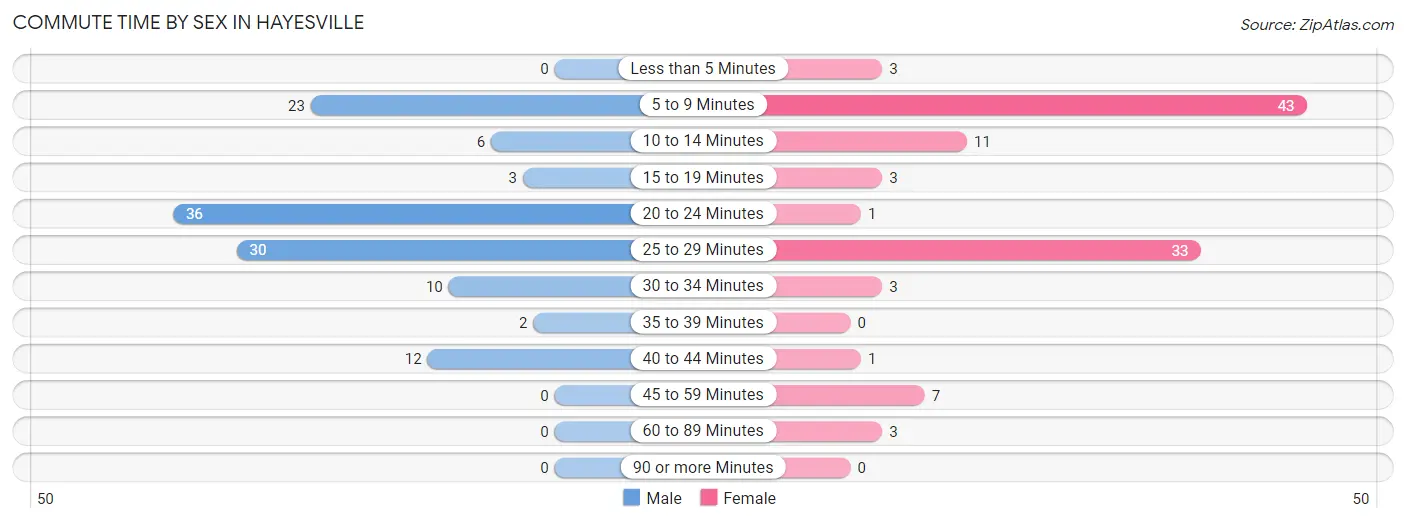
| Commute Time | Male | Female |
| Less than 5 Minutes | 0 (0.0%) | 3 (2.8%) |
| 5 to 9 Minutes | 23 (18.9%) | 43 (39.8%) |
| 10 to 14 Minutes | 6 (4.9%) | 11 (10.2%) |
| 15 to 19 Minutes | 3 (2.5%) | 3 (2.8%) |
| 20 to 24 Minutes | 36 (29.5%) | 1 (0.9%) |
| 25 to 29 Minutes | 30 (24.6%) | 33 (30.6%) |
| 30 to 34 Minutes | 10 (8.2%) | 3 (2.8%) |
| 35 to 39 Minutes | 2 (1.6%) | 0 (0.0%) |
| 40 to 44 Minutes | 12 (9.8%) | 1 (0.9%) |
| 45 to 59 Minutes | 0 (0.0%) | 7 (6.5%) |
| 60 to 89 Minutes | 0 (0.0%) | 3 (2.8%) |
| 90 or more Minutes | 0 (0.0%) | 0 (0.0%) |
Time of Departure to Work by Sex in Hayesville
The most frequent times of departure to work in Hayesville are 11:00 AM to 11:59 AM (33, 27.1%) for males and 10:00 AM to 10:59 AM (33, 30.6%) for females.
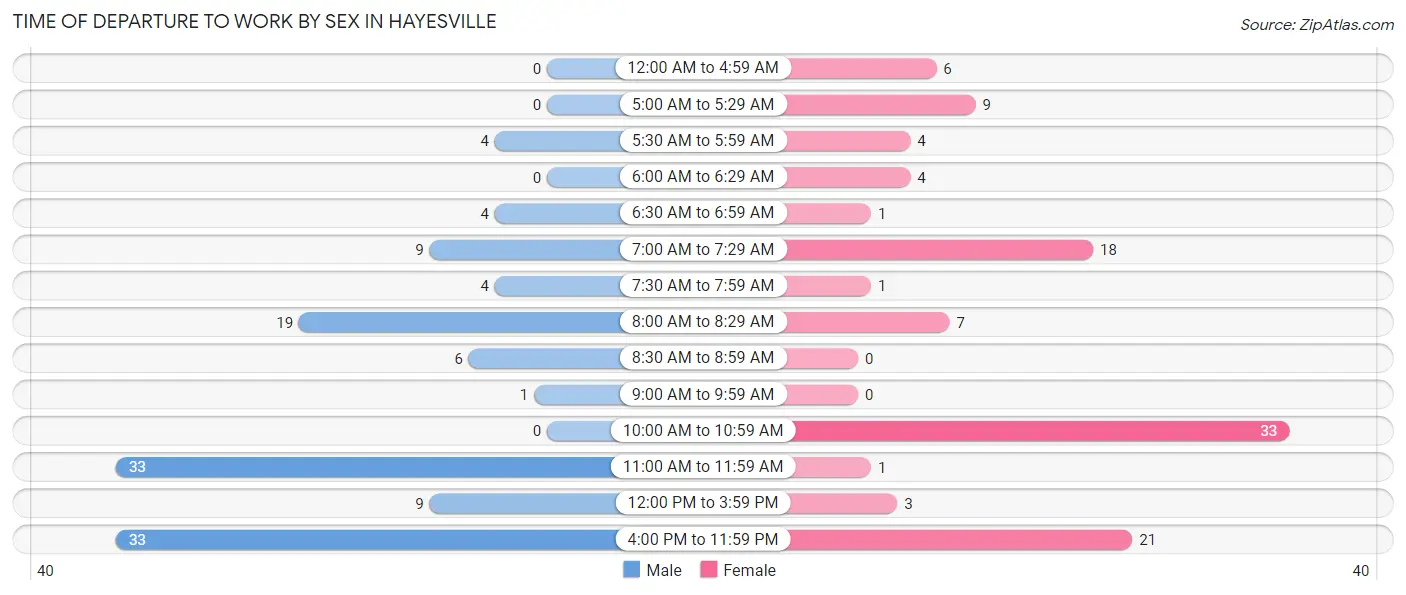
| Time of Departure | Male | Female |
| 12:00 AM to 4:59 AM | 0 (0.0%) | 6 (5.6%) |
| 5:00 AM to 5:29 AM | 0 (0.0%) | 9 (8.3%) |
| 5:30 AM to 5:59 AM | 4 (3.3%) | 4 (3.7%) |
| 6:00 AM to 6:29 AM | 0 (0.0%) | 4 (3.7%) |
| 6:30 AM to 6:59 AM | 4 (3.3%) | 1 (0.9%) |
| 7:00 AM to 7:29 AM | 9 (7.4%) | 18 (16.7%) |
| 7:30 AM to 7:59 AM | 4 (3.3%) | 1 (0.9%) |
| 8:00 AM to 8:29 AM | 19 (15.6%) | 7 (6.5%) |
| 8:30 AM to 8:59 AM | 6 (4.9%) | 0 (0.0%) |
| 9:00 AM to 9:59 AM | 1 (0.8%) | 0 (0.0%) |
| 10:00 AM to 10:59 AM | 0 (0.0%) | 33 (30.6%) |
| 11:00 AM to 11:59 AM | 33 (27.1%) | 1 (0.9%) |
| 12:00 PM to 3:59 PM | 9 (7.4%) | 3 (2.8%) |
| 4:00 PM to 11:59 PM | 33 (27.1%) | 21 (19.4%) |
| Total | 122 (100.0%) | 108 (100.0%) |
Housing Occupancy in Hayesville
Occupancy by Ownership in Hayesville
Of the total 245 dwellings in Hayesville, owner-occupied units account for 99 (40.4%), while renter-occupied units make up 146 (59.6%).
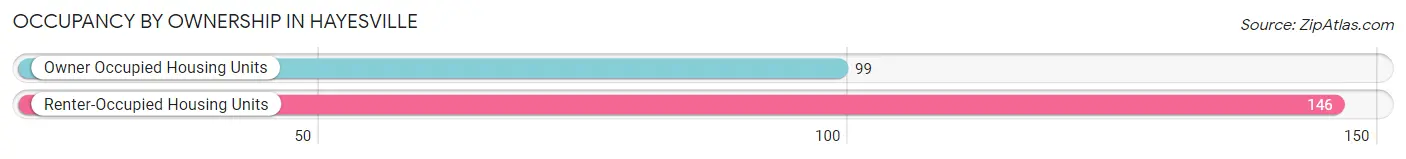
| Occupancy | # Housing Units | % Housing Units |
| Owner Occupied Housing Units | 99 | 40.4% |
| Renter-Occupied Housing Units | 146 | 59.6% |
| Total Occupied Housing Units | 245 | 100.0% |
Occupancy by Household Size in Hayesville
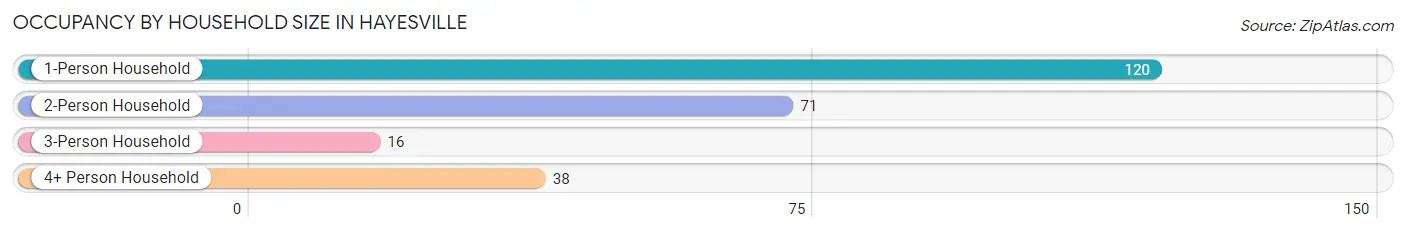
| Household Size | # Housing Units | % Housing Units |
| 1-Person Household | 120 | 49.0% |
| 2-Person Household | 71 | 29.0% |
| 3-Person Household | 16 | 6.5% |
| 4+ Person Household | 38 | 15.5% |
| Total Housing Units | 245 | 100.0% |
Occupancy by Ownership by Household Size in Hayesville
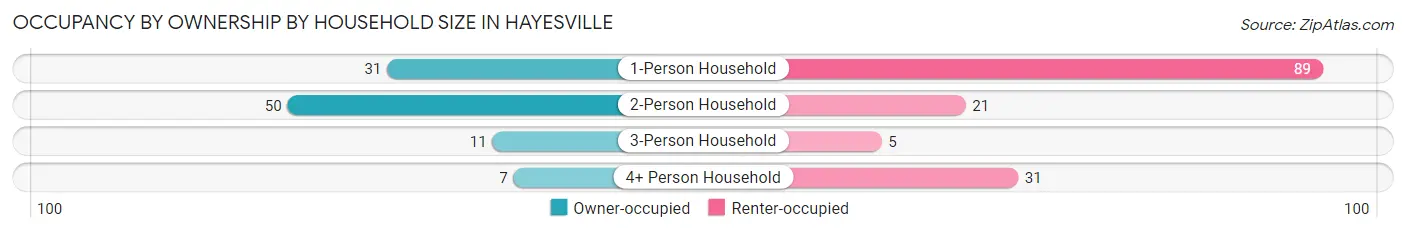
| Household Size | Owner-occupied | Renter-occupied |
| 1-Person Household | 31 (25.8%) | 89 (74.2%) |
| 2-Person Household | 50 (70.4%) | 21 (29.6%) |
| 3-Person Household | 11 (68.8%) | 5 (31.2%) |
| 4+ Person Household | 7 (18.4%) | 31 (81.6%) |
| Total Housing Units | 99 (40.4%) | 146 (59.6%) |
Occupancy by Educational Attainment in Hayesville
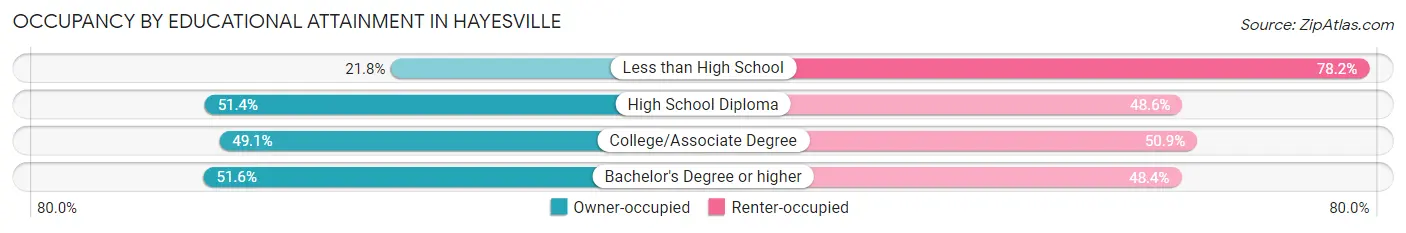
| Household Size | Owner-occupied | Renter-occupied |
| Less than High School | 19 (21.8%) | 68 (78.2%) |
| High School Diploma | 36 (51.4%) | 34 (48.6%) |
| College/Associate Degree | 28 (49.1%) | 29 (50.9%) |
| Bachelor's Degree or higher | 16 (51.6%) | 15 (48.4%) |
Occupancy by Age of Householder in Hayesville
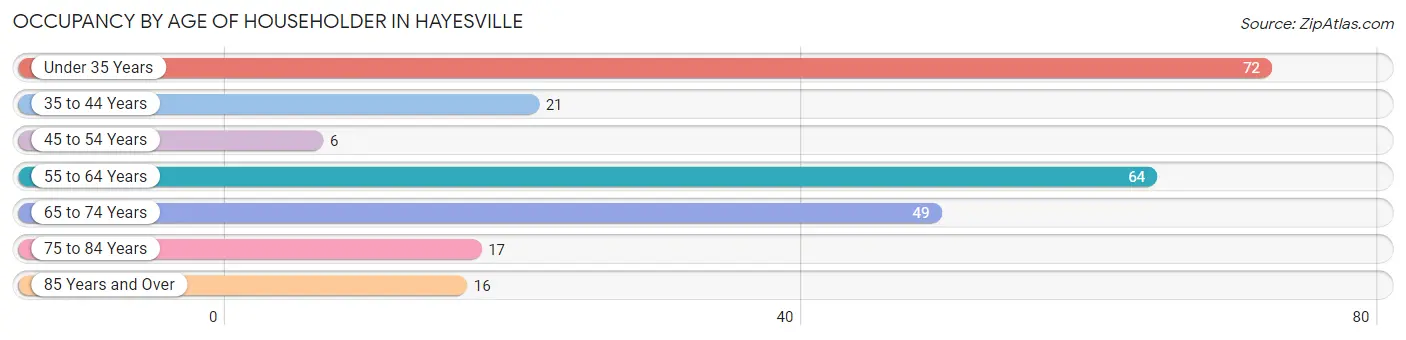
| Age Bracket | # Households | % Households |
| Under 35 Years | 72 | 29.4% |
| 35 to 44 Years | 21 | 8.6% |
| 45 to 54 Years | 6 | 2.5% |
| 55 to 64 Years | 64 | 26.1% |
| 65 to 74 Years | 49 | 20.0% |
| 75 to 84 Years | 17 | 6.9% |
| 85 Years and Over | 16 | 6.5% |
| Total | 245 | 100.0% |
Housing Finances in Hayesville
Median Income by Occupancy in Hayesville
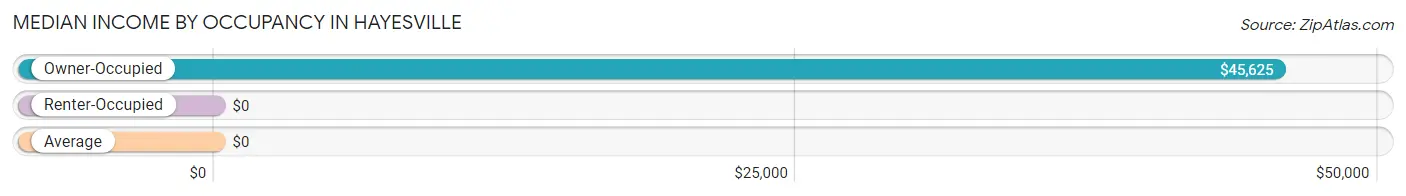
| Occupancy Type | # Households | Median Income |
| Owner-Occupied | 99 (40.4%) | $45,625 |
| Renter-Occupied | 146 (59.6%) | $0 |
| Average | 245 (100.0%) | $0 |
Occupancy by Householder Income Bracket in Hayesville
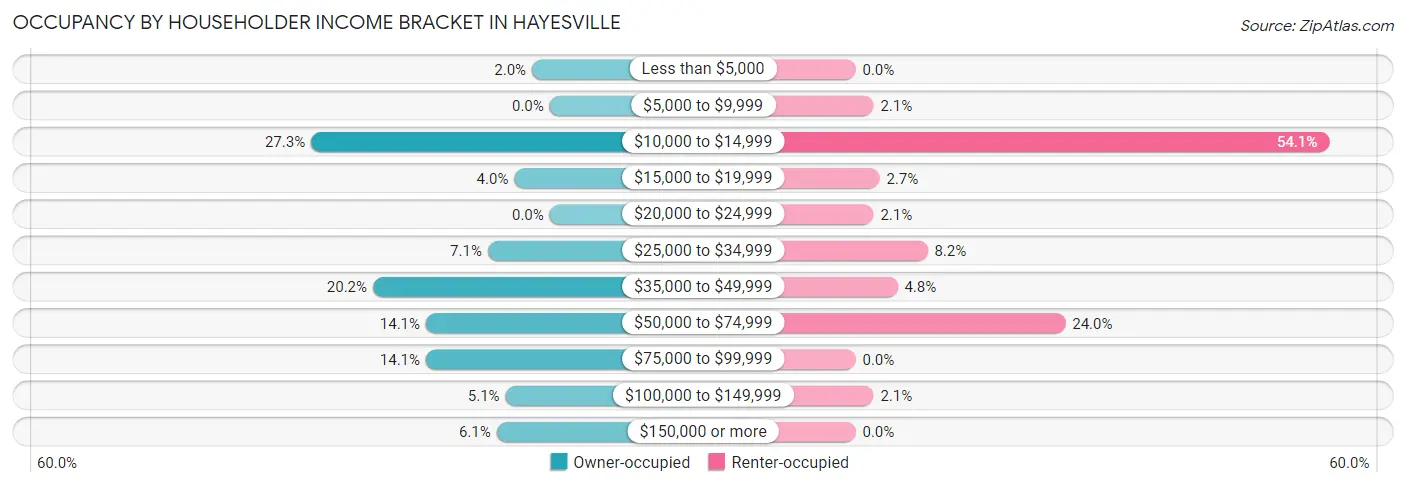
| Income Bracket | Owner-occupied | Renter-occupied |
| Less than $5,000 | 2 (2.0%) | 0 (0.0%) |
| $5,000 to $9,999 | 0 (0.0%) | 3 (2.1%) |
| $10,000 to $14,999 | 27 (27.3%) | 79 (54.1%) |
| $15,000 to $19,999 | 4 (4.0%) | 4 (2.7%) |
| $20,000 to $24,999 | 0 (0.0%) | 3 (2.1%) |
| $25,000 to $34,999 | 7 (7.1%) | 12 (8.2%) |
| $35,000 to $49,999 | 20 (20.2%) | 7 (4.8%) |
| $50,000 to $74,999 | 14 (14.1%) | 35 (24.0%) |
| $75,000 to $99,999 | 14 (14.1%) | 0 (0.0%) |
| $100,000 to $149,999 | 5 (5.1%) | 3 (2.1%) |
| $150,000 or more | 6 (6.1%) | 0 (0.0%) |
| Total | 99 (100.0%) | 146 (100.0%) |
Monthly Housing Cost Tiers in Hayesville
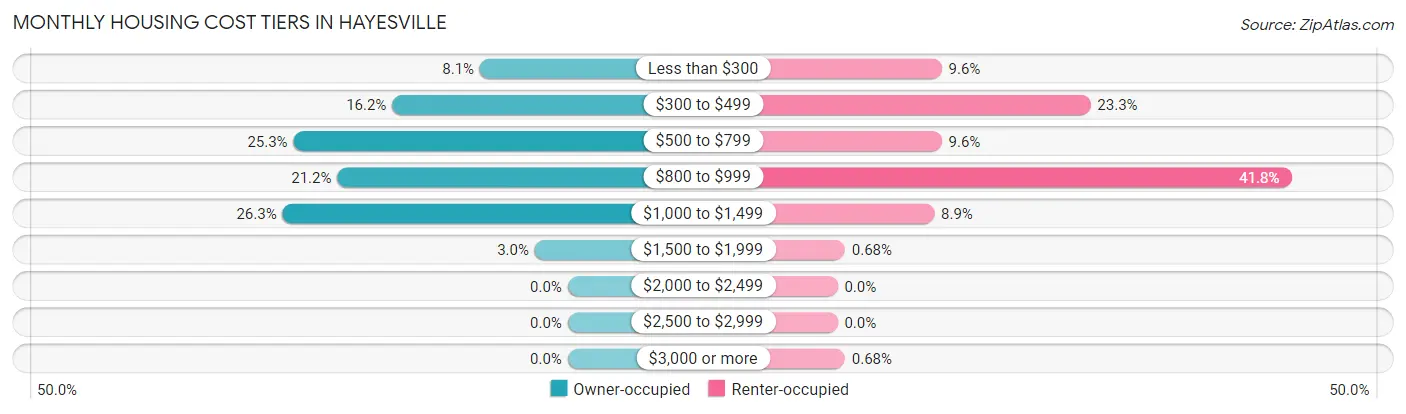
| Monthly Cost | Owner-occupied | Renter-occupied |
| Less than $300 | 8 (8.1%) | 14 (9.6%) |
| $300 to $499 | 16 (16.2%) | 34 (23.3%) |
| $500 to $799 | 25 (25.3%) | 14 (9.6%) |
| $800 to $999 | 21 (21.2%) | 61 (41.8%) |
| $1,000 to $1,499 | 26 (26.3%) | 13 (8.9%) |
| $1,500 to $1,999 | 3 (3.0%) | 1 (0.7%) |
| $2,000 to $2,499 | 0 (0.0%) | 0 (0.0%) |
| $2,500 to $2,999 | 0 (0.0%) | 0 (0.0%) |
| $3,000 or more | 0 (0.0%) | 1 (0.7%) |
| Total | 99 (100.0%) | 146 (100.0%) |
Physical Housing Characteristics in Hayesville
Housing Structures in Hayesville
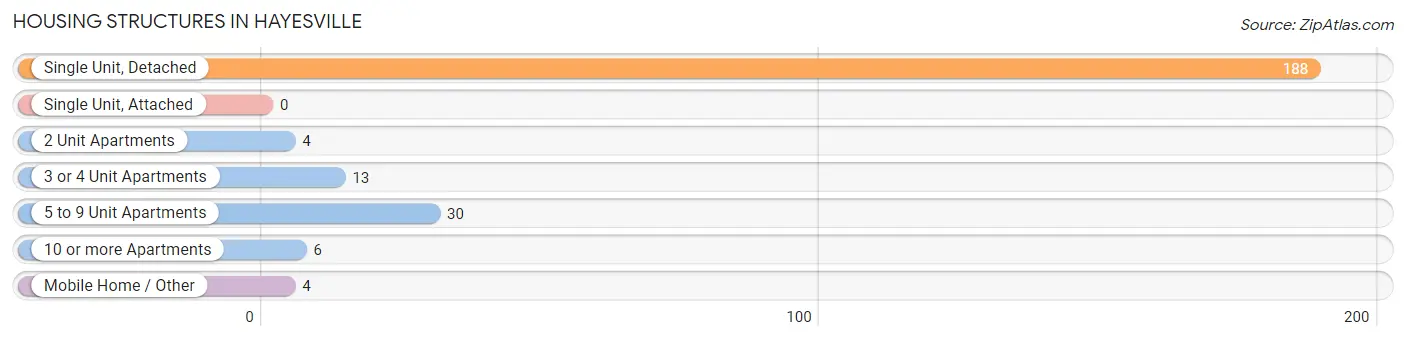
| Structure Type | # Housing Units | % Housing Units |
| Single Unit, Detached | 188 | 76.7% |
| Single Unit, Attached | 0 | 0.0% |
| 2 Unit Apartments | 4 | 1.6% |
| 3 or 4 Unit Apartments | 13 | 5.3% |
| 5 to 9 Unit Apartments | 30 | 12.2% |
| 10 or more Apartments | 6 | 2.5% |
| Mobile Home / Other | 4 | 1.6% |
| Total | 245 | 100.0% |
Housing Structures by Occupancy in Hayesville
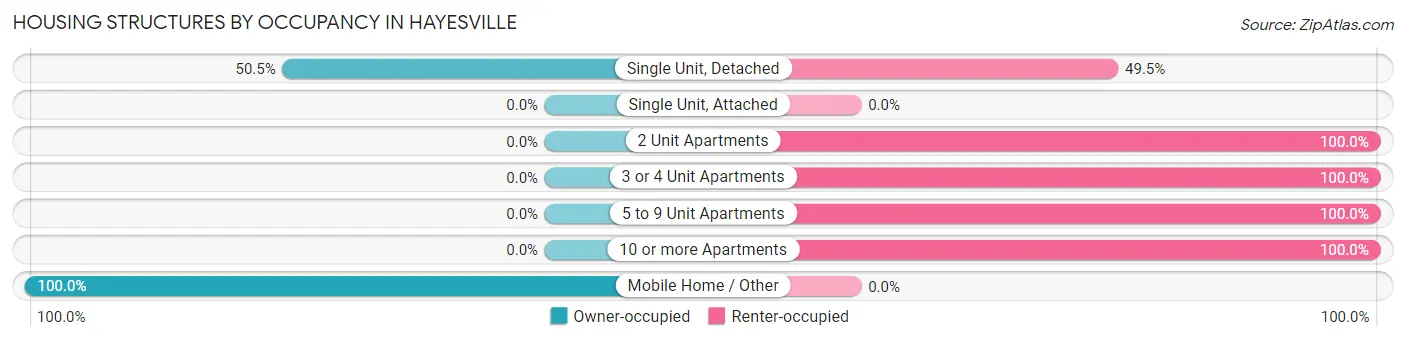
| Structure Type | Owner-occupied | Renter-occupied |
| Single Unit, Detached | 95 (50.5%) | 93 (49.5%) |
| Single Unit, Attached | 0 (0.0%) | 0 (0.0%) |
| 2 Unit Apartments | 0 (0.0%) | 4 (100.0%) |
| 3 or 4 Unit Apartments | 0 (0.0%) | 13 (100.0%) |
| 5 to 9 Unit Apartments | 0 (0.0%) | 30 (100.0%) |
| 10 or more Apartments | 0 (0.0%) | 6 (100.0%) |
| Mobile Home / Other | 4 (100.0%) | 0 (0.0%) |
| Total | 99 (40.4%) | 146 (59.6%) |
Housing Structures by Number of Rooms in Hayesville
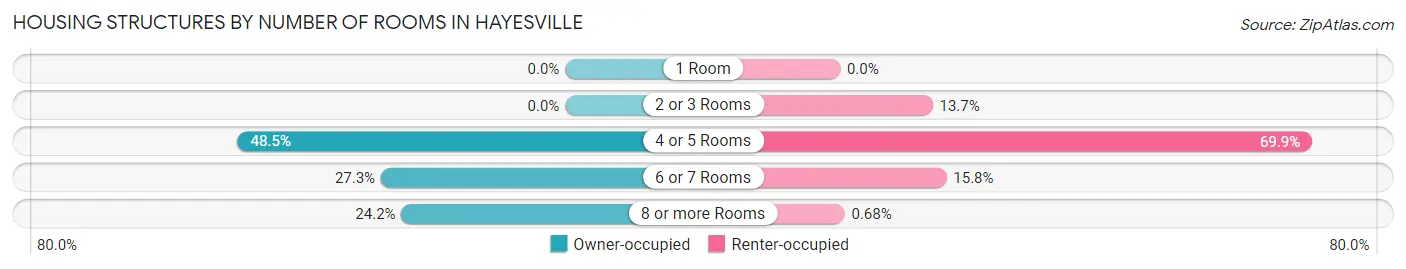
| Number of Rooms | Owner-occupied | Renter-occupied |
| 1 Room | 0 (0.0%) | 0 (0.0%) |
| 2 or 3 Rooms | 0 (0.0%) | 20 (13.7%) |
| 4 or 5 Rooms | 48 (48.5%) | 102 (69.9%) |
| 6 or 7 Rooms | 27 (27.3%) | 23 (15.8%) |
| 8 or more Rooms | 24 (24.2%) | 1 (0.7%) |
| Total | 99 (100.0%) | 146 (100.0%) |
Housing Structure by Heating Type in Hayesville
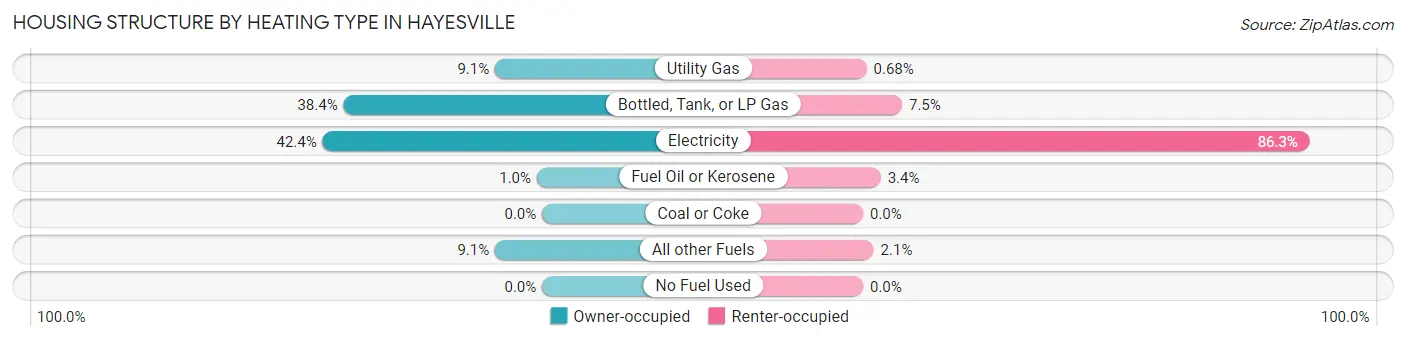
| Heating Type | Owner-occupied | Renter-occupied |
| Utility Gas | 9 (9.1%) | 1 (0.7%) |
| Bottled, Tank, or LP Gas | 38 (38.4%) | 11 (7.5%) |
| Electricity | 42 (42.4%) | 126 (86.3%) |
| Fuel Oil or Kerosene | 1 (1.0%) | 5 (3.4%) |
| Coal or Coke | 0 (0.0%) | 0 (0.0%) |
| All other Fuels | 9 (9.1%) | 3 (2.1%) |
| No Fuel Used | 0 (0.0%) | 0 (0.0%) |
| Total | 99 (100.0%) | 146 (100.0%) |
Household Vehicle Usage in Hayesville
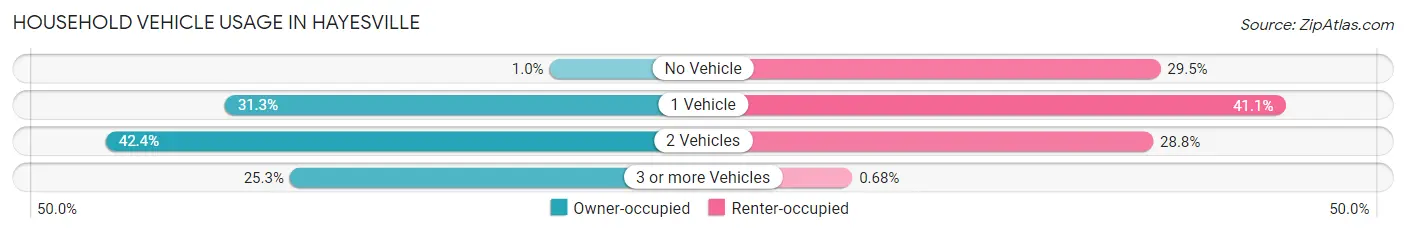
| Vehicles per Household | Owner-occupied | Renter-occupied |
| No Vehicle | 1 (1.0%) | 43 (29.4%) |
| 1 Vehicle | 31 (31.3%) | 60 (41.1%) |
| 2 Vehicles | 42 (42.4%) | 42 (28.8%) |
| 3 or more Vehicles | 25 (25.3%) | 1 (0.7%) |
| Total | 99 (100.0%) | 146 (100.0%) |
Real Estate & Mortgages in Hayesville
Real Estate and Mortgage Overview in Hayesville
| Characteristic | Without Mortgage | With Mortgage |
| Housing Units | 59 | 40 |
| Median Property Value | $212,500 | $190,000 |
| Median Household Income | $45,568 | $2 |
| Monthly Housing Costs | $650 | $0 |
| Real Estate Taxes | $1,295 | $0 |
Property Value by Mortgage Status in Hayesville
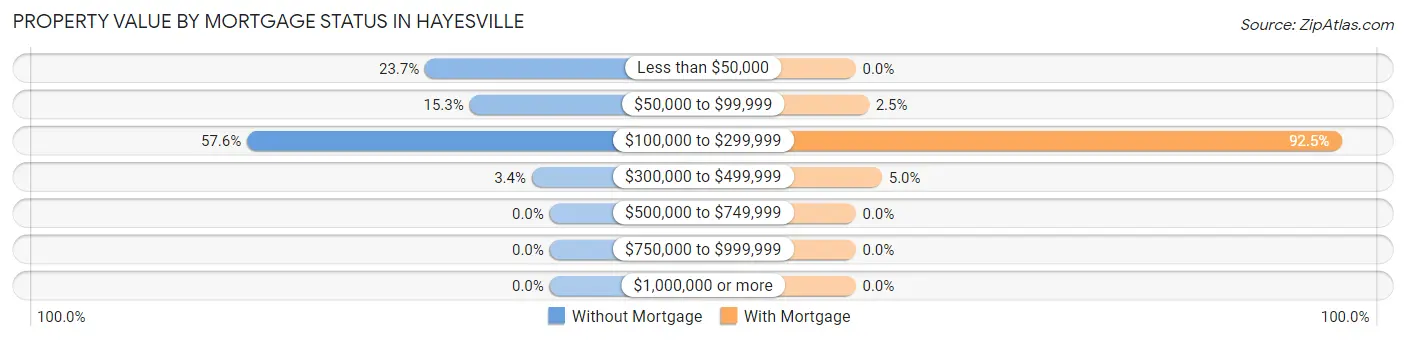
| Property Value | Without Mortgage | With Mortgage |
| Less than $50,000 | 14 (23.7%) | 0 (0.0%) |
| $50,000 to $99,999 | 9 (15.2%) | 1 (2.5%) |
| $100,000 to $299,999 | 34 (57.6%) | 37 (92.5%) |
| $300,000 to $499,999 | 2 (3.4%) | 2 (5.0%) |
| $500,000 to $749,999 | 0 (0.0%) | 0 (0.0%) |
| $750,000 to $999,999 | 0 (0.0%) | 0 (0.0%) |
| $1,000,000 or more | 0 (0.0%) | 0 (0.0%) |
| Total | 59 (100.0%) | 40 (100.0%) |
Household Income by Mortgage Status in Hayesville
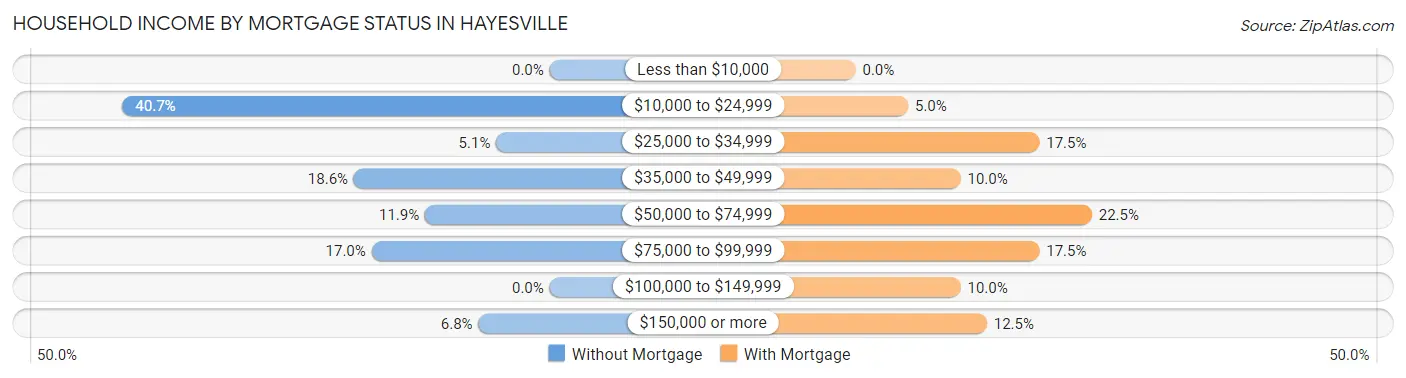
| Household Income | Without Mortgage | With Mortgage |
| Less than $10,000 | 0 (0.0%) | 0 (0.0%) |
| $10,000 to $24,999 | 24 (40.7%) | 2 (5.0%) |
| $25,000 to $34,999 | 3 (5.1%) | 7 (17.5%) |
| $35,000 to $49,999 | 11 (18.6%) | 4 (10.0%) |
| $50,000 to $74,999 | 7 (11.9%) | 9 (22.5%) |
| $75,000 to $99,999 | 10 (17.0%) | 7 (17.5%) |
| $100,000 to $149,999 | 0 (0.0%) | 4 (10.0%) |
| $150,000 or more | 4 (6.8%) | 5 (12.5%) |
| Total | 59 (100.0%) | 40 (100.0%) |
Property Value to Household Income Ratio in Hayesville
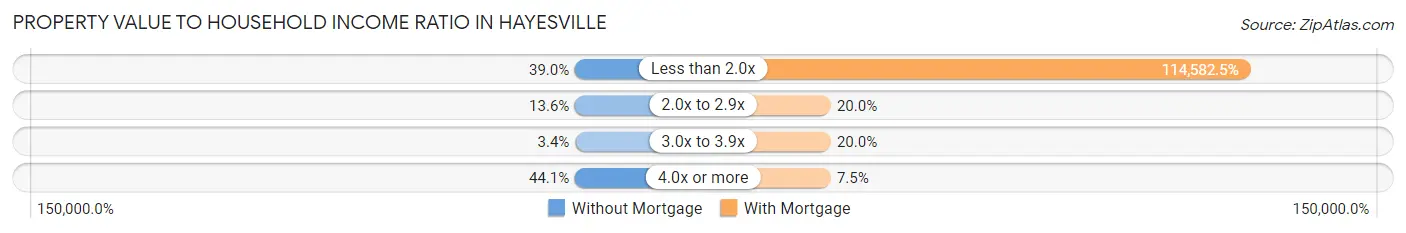
| Value-to-Income Ratio | Without Mortgage | With Mortgage |
| Less than 2.0x | 23 (39.0%) | 45,833 (114,582.5%) |
| 2.0x to 2.9x | 8 (13.6%) | 8 (20.0%) |
| 3.0x to 3.9x | 2 (3.4%) | 8 (20.0%) |
| 4.0x or more | 26 (44.1%) | 3 (7.5%) |
| Total | 59 (100.0%) | 40 (100.0%) |
Real Estate Taxes by Mortgage Status in Hayesville
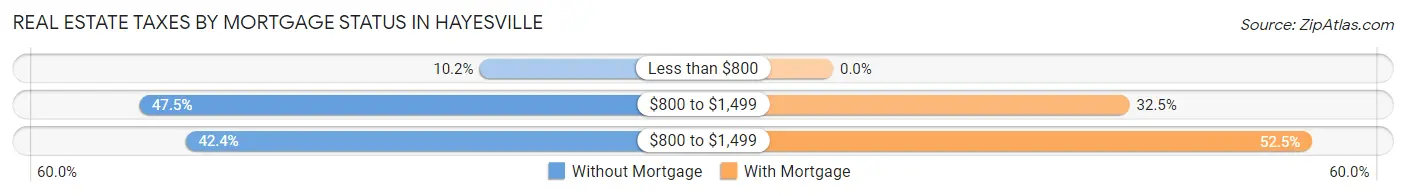
| Property Taxes | Without Mortgage | With Mortgage |
| Less than $800 | 6 (10.2%) | 0 (0.0%) |
| $800 to $1,499 | 28 (47.5%) | 13 (32.5%) |
| $800 to $1,499 | 25 (42.4%) | 21 (52.5%) |
| Total | 59 (100.0%) | 40 (100.0%) |
Health & Disability in Hayesville
Health Insurance Coverage by Age in Hayesville
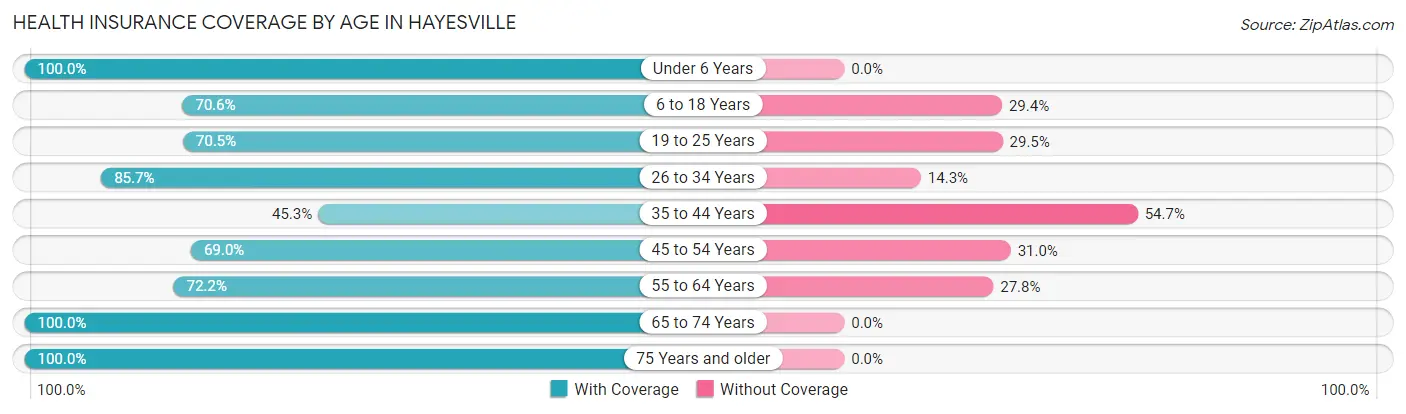
| Age Bracket | With Coverage | Without Coverage |
| Under 6 Years | 41 (100.0%) | 0 (0.0%) |
| 6 to 18 Years | 72 (70.6%) | 30 (29.4%) |
| 19 to 25 Years | 74 (70.5%) | 31 (29.5%) |
| 26 to 34 Years | 18 (85.7%) | 3 (14.3%) |
| 35 to 44 Years | 24 (45.3%) | 29 (54.7%) |
| 45 to 54 Years | 20 (69.0%) | 9 (31.0%) |
| 55 to 64 Years | 65 (72.2%) | 25 (27.8%) |
| 65 to 74 Years | 80 (100.0%) | 0 (0.0%) |
| 75 Years and older | 41 (100.0%) | 0 (0.0%) |
| Total | 435 (77.4%) | 127 (22.6%) |
Health Insurance Coverage by Citizenship Status in Hayesville
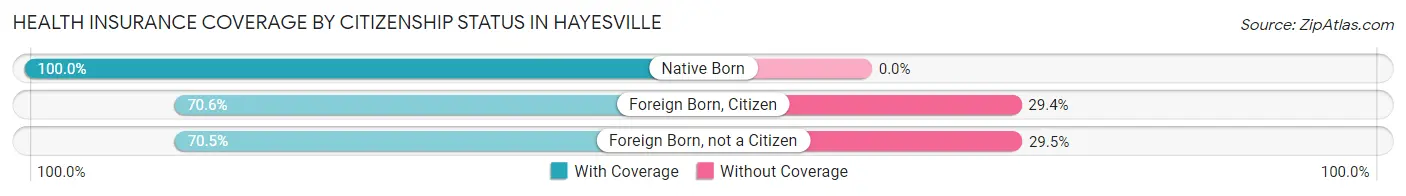
| Citizenship Status | With Coverage | Without Coverage |
| Native Born | 41 (100.0%) | 0 (0.0%) |
| Foreign Born, Citizen | 72 (70.6%) | 30 (29.4%) |
| Foreign Born, not a Citizen | 74 (70.5%) | 31 (29.5%) |
Health Insurance Coverage by Household Income in Hayesville
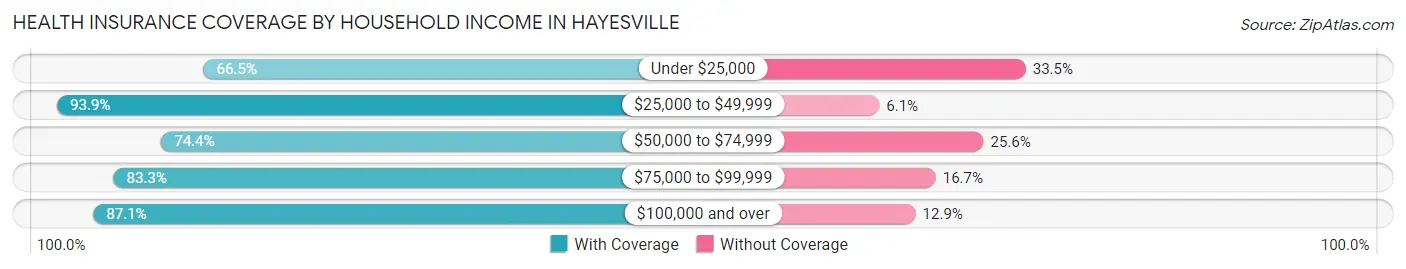
| Household Income | With Coverage | Without Coverage |
| Under $25,000 | 111 (66.5%) | 56 (33.5%) |
| $25,000 to $49,999 | 77 (93.9%) | 5 (6.1%) |
| $50,000 to $74,999 | 151 (74.4%) | 52 (25.6%) |
| $75,000 to $99,999 | 30 (83.3%) | 6 (16.7%) |
| $100,000 and over | 54 (87.1%) | 8 (12.9%) |
Public vs Private Health Insurance Coverage by Age in Hayesville
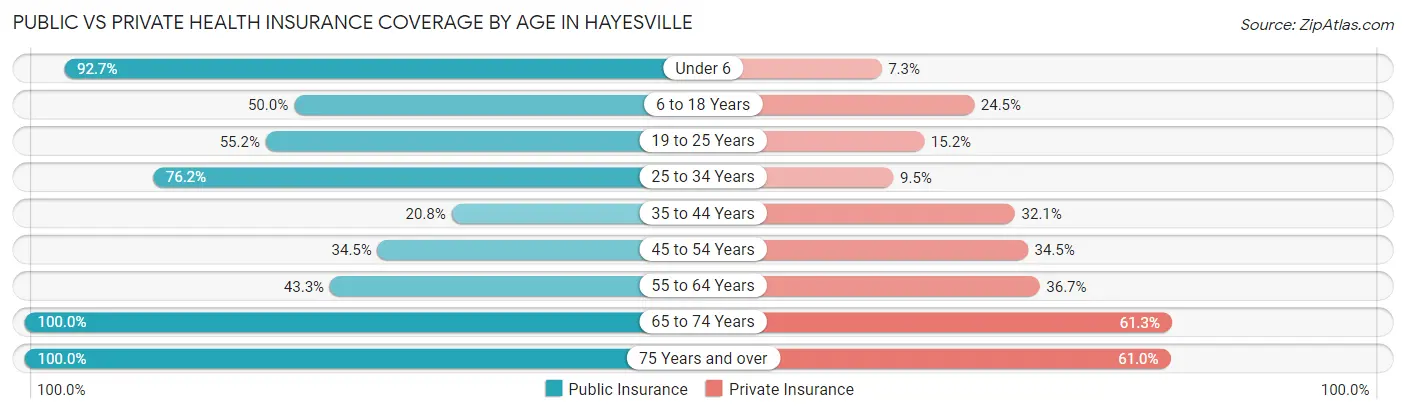
| Age Bracket | Public Insurance | Private Insurance |
| Under 6 | 38 (92.7%) | 3 (7.3%) |
| 6 to 18 Years | 51 (50.0%) | 25 (24.5%) |
| 19 to 25 Years | 58 (55.2%) | 16 (15.2%) |
| 25 to 34 Years | 16 (76.2%) | 2 (9.5%) |
| 35 to 44 Years | 11 (20.7%) | 17 (32.1%) |
| 45 to 54 Years | 10 (34.5%) | 10 (34.5%) |
| 55 to 64 Years | 39 (43.3%) | 33 (36.7%) |
| 65 to 74 Years | 80 (100.0%) | 49 (61.3%) |
| 75 Years and over | 41 (100.0%) | 25 (61.0%) |
| Total | 344 (61.2%) | 180 (32.0%) |
Disability Status by Sex by Age in Hayesville
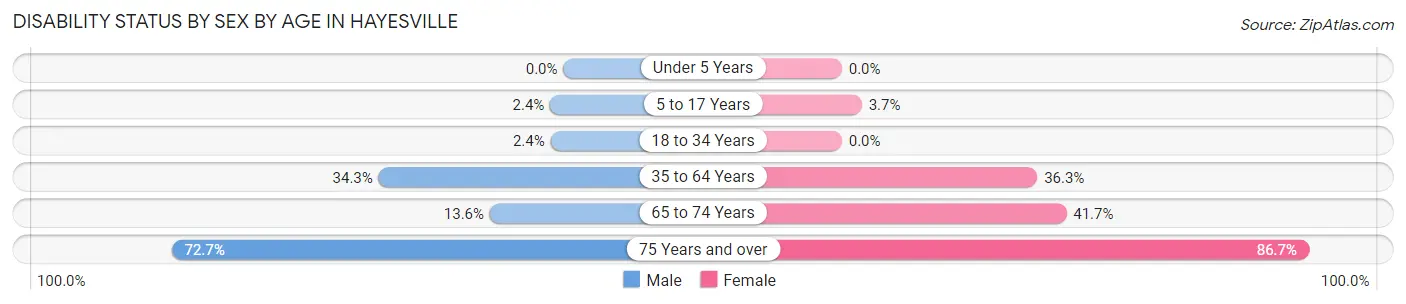
| Age Bracket | Male | Female |
| Under 5 Years | 0 (0.0%) | 0 (0.0%) |
| 5 to 17 Years | 1 (2.4%) | 2 (3.7%) |
| 18 to 34 Years | 2 (2.4%) | 0 (0.0%) |
| 35 to 64 Years | 24 (34.3%) | 37 (36.3%) |
| 65 to 74 Years | 6 (13.6%) | 15 (41.7%) |
| 75 Years and over | 8 (72.7%) | 26 (86.7%) |
Disability Class by Sex by Age in Hayesville
Disability Class: Hearing Difficulty
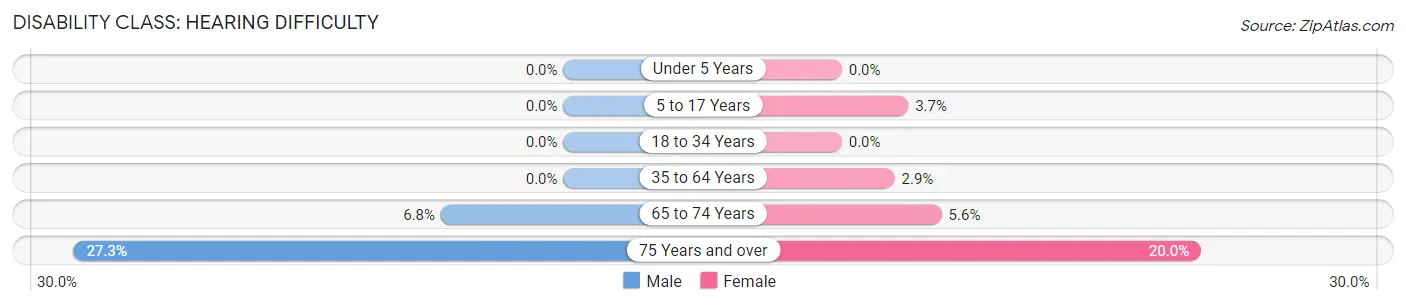
| Age Bracket | Male | Female |
| Under 5 Years | 0 (0.0%) | 0 (0.0%) |
| 5 to 17 Years | 0 (0.0%) | 2 (3.7%) |
| 18 to 34 Years | 0 (0.0%) | 0 (0.0%) |
| 35 to 64 Years | 0 (0.0%) | 3 (2.9%) |
| 65 to 74 Years | 3 (6.8%) | 2 (5.6%) |
| 75 Years and over | 3 (27.3%) | 6 (20.0%) |
Disability Class: Vision Difficulty
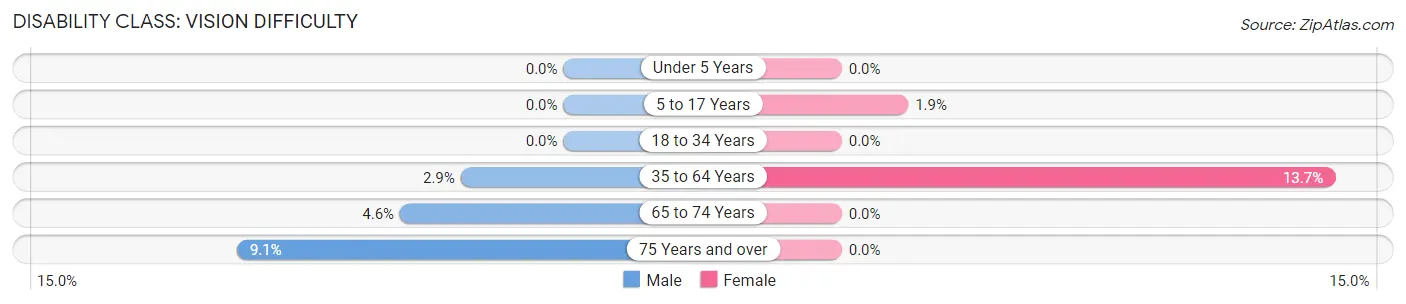
| Age Bracket | Male | Female |
| Under 5 Years | 0 (0.0%) | 0 (0.0%) |
| 5 to 17 Years | 0 (0.0%) | 1 (1.8%) |
| 18 to 34 Years | 0 (0.0%) | 0 (0.0%) |
| 35 to 64 Years | 2 (2.9%) | 14 (13.7%) |
| 65 to 74 Years | 2 (4.5%) | 0 (0.0%) |
| 75 Years and over | 1 (9.1%) | 0 (0.0%) |
Disability Class: Cognitive Difficulty
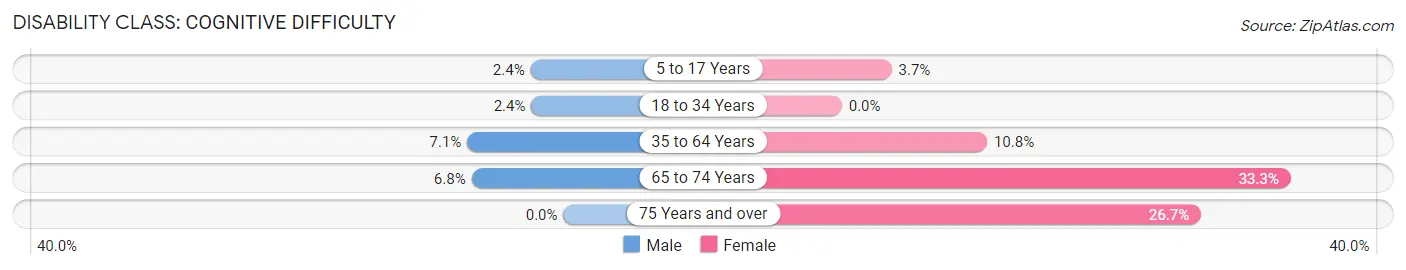
| Age Bracket | Male | Female |
| 5 to 17 Years | 1 (2.4%) | 2 (3.7%) |
| 18 to 34 Years | 2 (2.4%) | 0 (0.0%) |
| 35 to 64 Years | 5 (7.1%) | 11 (10.8%) |
| 65 to 74 Years | 3 (6.8%) | 12 (33.3%) |
| 75 Years and over | 0 (0.0%) | 8 (26.7%) |
Disability Class: Ambulatory Difficulty
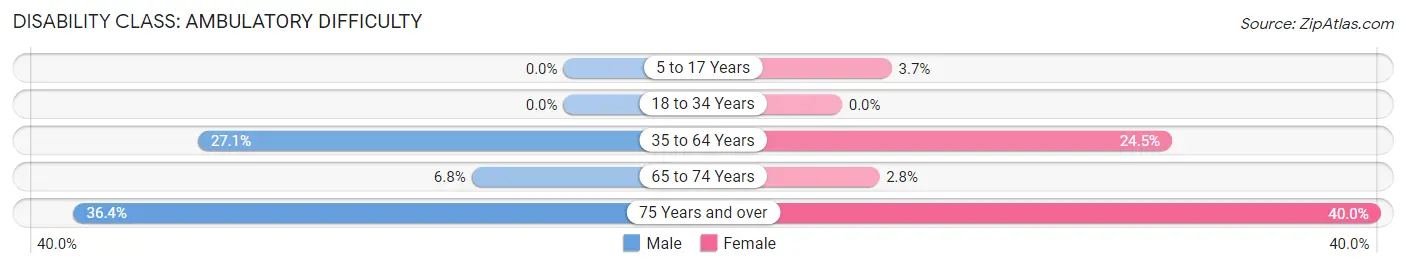
| Age Bracket | Male | Female |
| 5 to 17 Years | 0 (0.0%) | 2 (3.7%) |
| 18 to 34 Years | 0 (0.0%) | 0 (0.0%) |
| 35 to 64 Years | 19 (27.1%) | 25 (24.5%) |
| 65 to 74 Years | 3 (6.8%) | 1 (2.8%) |
| 75 Years and over | 4 (36.4%) | 12 (40.0%) |
Disability Class: Self-Care Difficulty

| Age Bracket | Male | Female |
| 5 to 17 Years | 0 (0.0%) | 2 (3.7%) |
| 18 to 34 Years | 0 (0.0%) | 0 (0.0%) |
| 35 to 64 Years | 3 (4.3%) | 11 (10.8%) |
| 65 to 74 Years | 0 (0.0%) | 1 (2.8%) |
| 75 Years and over | 4 (36.4%) | 9 (30.0%) |
Technology Access in Hayesville
Computing Device Access in Hayesville
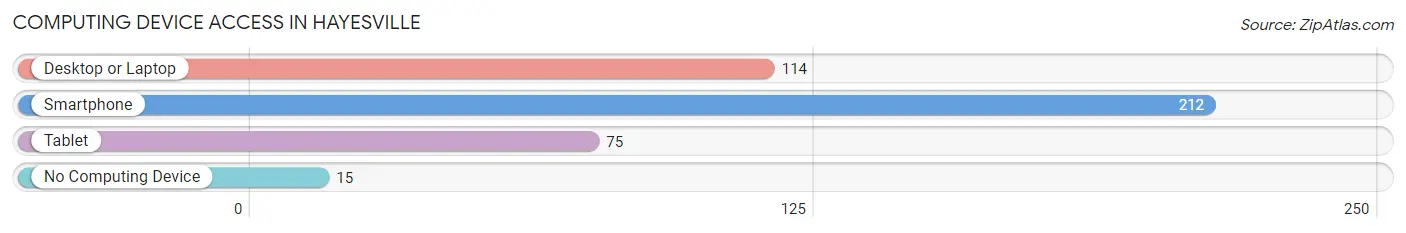
| Device Type | # Households | % Households |
| Desktop or Laptop | 114 | 46.5% |
| Smartphone | 212 | 86.5% |
| Tablet | 75 | 30.6% |
| No Computing Device | 15 | 6.1% |
| Total | 245 | 100.0% |
Internet Access in Hayesville
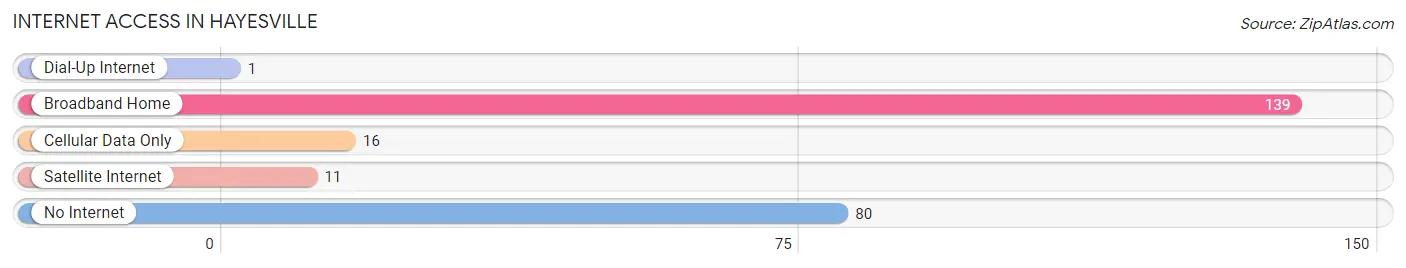
| Internet Type | # Households | % Households |
| Dial-Up Internet | 1 | 0.4% |
| Broadband Home | 139 | 56.7% |
| Cellular Data Only | 16 | 6.5% |
| Satellite Internet | 11 | 4.5% |
| No Internet | 80 | 32.7% |
| Total | 245 | 100.0% |
Hayesville Summary
Hayesville, NC is a small town located in the southwestern corner of Clay County, North Carolina. It is situated in the foothills of the Appalachian Mountains, and is surrounded by the Nantahala National Forest. The town has a population of approximately 1,000 people, and is the county seat of Clay County.
History
The area that is now Hayesville was first settled in the late 1700s by settlers from the nearby Cherokee Nation. The town was originally known as “Horse Creek”, and was later renamed “Hayesville” in honor of the first postmaster, William Hay. The town was officially incorporated in 1872.
In the late 1800s, Hayesville was a bustling center of commerce and industry. The town was home to several sawmills, gristmills, and a tannery. The town also had a thriving agricultural industry, with farmers growing corn, wheat, and other crops.
In the early 1900s, Hayesville began to experience a decline in its economy. The sawmills and gristmills closed, and the tannery moved away. The town’s population began to decline as well, and by the 1950s, the population had dropped to just over 500 people.
In the late 20th century, Hayesville began to experience a resurgence in its economy. The town was designated as a “Main Street Community” in the 1980s, and the downtown area was revitalized. The town also began to attract tourists, and the population began to grow again.
Geography
Hayesville is located in the southwestern corner of Clay County, North Carolina. The town is situated in the foothills of the Appalachian Mountains, and is surrounded by the Nantahala National Forest. The town is located at an elevation of 1,400 feet above sea level.
The town is located at the intersection of US Highway 64 and NC Highway 175. The nearest major cities are Asheville, North Carolina (90 miles away) and Atlanta, Georgia (150 miles away).
Economy
The economy of Hayesville is largely based on tourism. The town is home to several bed and breakfasts, restaurants, and shops. The town also hosts several festivals and events throughout the year, including the Clay County Fair and the Hayesville Harvest Festival.
The town is also home to several small businesses, including a hardware store, a grocery store, and a pharmacy. The town is also home to a branch of the Clay County Public Library.
Demographics
As of the 2010 census, the population of Hayesville was 1,000 people. The racial makeup of the town was 97.2% White, 0.7% African American, 0.3% Native American, 0.3% Asian, and 1.5% from other races.
The median household income in Hayesville was $30,000, and the median family income was $35,000. The per capita income in the town was $17,000. The poverty rate in the town was 17.3%.
Conclusion
Hayesville, NC is a small town located in the southwestern corner of Clay County, North Carolina. The town has a population of approximately 1,000 people, and is the county seat of Clay County. The town’s economy is largely based on tourism, and the town is home to several bed and breakfasts, restaurants, and shops. The town also hosts several festivals and events throughout the year. The racial makeup of the town is 97.2% White, 0.7% African American, 0.3% Native American, 0.3% Asian, and 1.5% from other races. The median household income in Hayesville was $30,000, and the median family income was $35,000. The per capita income in the town was $17,000. The poverty rate in the town was 17.3%.
Common Questions
What is Per Capita Income in Hayesville?
Per Capita income in Hayesville is $17,310.
What is the Median Family Income in Hayesville?
Median Family Income in Hayesville is $46,806.
What is Inequality or Gini Index in Hayesville?
Inequality or Gini Index in Hayesville is 0.46.
What is the Total Population of Hayesville?
Total Population of Hayesville is 629.
What is the Total Male Population of Hayesville?
Total Male Population of Hayesville is 303.
What is the Total Female Population of Hayesville?
Total Female Population of Hayesville is 326.
What is the Ratio of Males per 100 Females in Hayesville?
There are 92.94 Males per 100 Females in Hayesville.
What is the Ratio of Females per 100 Males in Hayesville?
There are 107.59 Females per 100 Males in Hayesville.
What is the Median Population Age in Hayesville?
Median Population Age in Hayesville is 42.5 Years.
What is the Average Family Size in Hayesville
Average Family Size in Hayesville is 2.9 People.
What is the Average Household Size in Hayesville
Average Household Size in Hayesville is 2.2 People.
How Large is the Labor Force in Hayesville?
There are 240 People in the Labor Forcein in Hayesville.
What is the Percentage of People in the Labor Force in Hayesville?
44.4% of People are in the Labor Force in Hayesville.
What is the Unemployment Rate in Hayesville?
Unemployment Rate in Hayesville is 0.8%.