Rosman, NC Map & Demographics
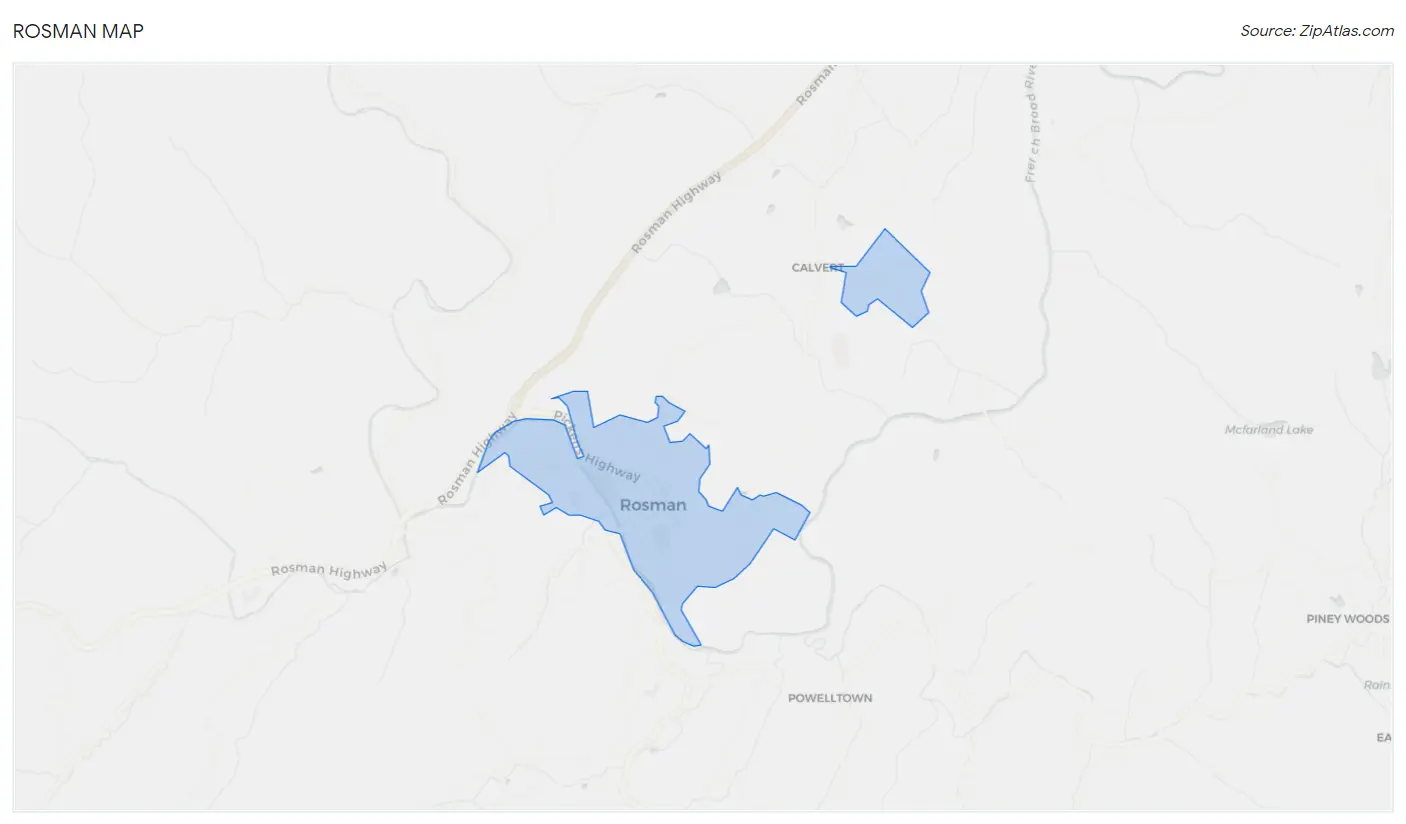
Rosman Map
Rosman Overview
$27,736
PER CAPITA INCOME
$46,250
AVG FAMILY INCOME
$50,437
AVG HOUSEHOLD INCOME
22.7%
WAGE / INCOME GAP [ % ]
77.3¢/ $1
WAGE / INCOME GAP [ $ ]
0.28
INEQUALITY / GINI INDEX
642
TOTAL POPULATION
288
MALE POPULATION
354
FEMALE POPULATION
81.36
MALES / 100 FEMALES
122.92
FEMALES / 100 MALES
41.4
MEDIAN AGE
2.7
AVG FAMILY SIZE
1.8
AVG HOUSEHOLD SIZE
277
LABOR FORCE [ PEOPLE ]
51.5%
PERCENT IN LABOR FORCE
3.6%
UNEMPLOYMENT RATE
Rosman Zip Codes
Rosman Area Codes
Income in Rosman
Income Overview in Rosman
Per Capita Income in Rosman is $27,736, while median incomes of families and households are $46,250 and $50,437 respectively.
| Characteristic | Number | Measure |
| Per Capita Income | 642 | $27,736 |
| Median Family Income | 130 | $46,250 |
| Mean Family Income | 130 | $50,444 |
| Median Household Income | 364 | $50,437 |
| Mean Household Income | 364 | $46,353 |
| Income Deficit | 130 | $0 |
| Wage / Income Gap (%) | 642 | 22.70% |
| Wage / Income Gap ($) | 642 | 77.30¢ per $1 |
| Gini / Inequality Index | 642 | 0.28 |
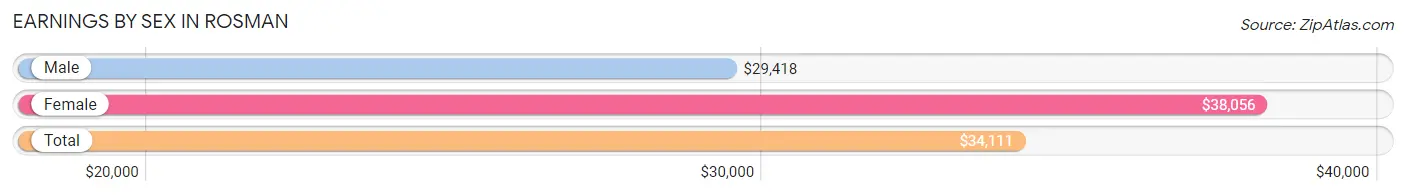
Earnings by Sex in Rosman
Average Earnings in Rosman are $34,111, $29,418 for men and $38,056 for women, a difference of 22.7%.
| Sex | Number | Average Earnings |
| Male | 179 (42.3%) | $29,418 |
| Female | 244 (57.7%) | $38,056 |
| Total | 423 (100.0%) | $34,111 |
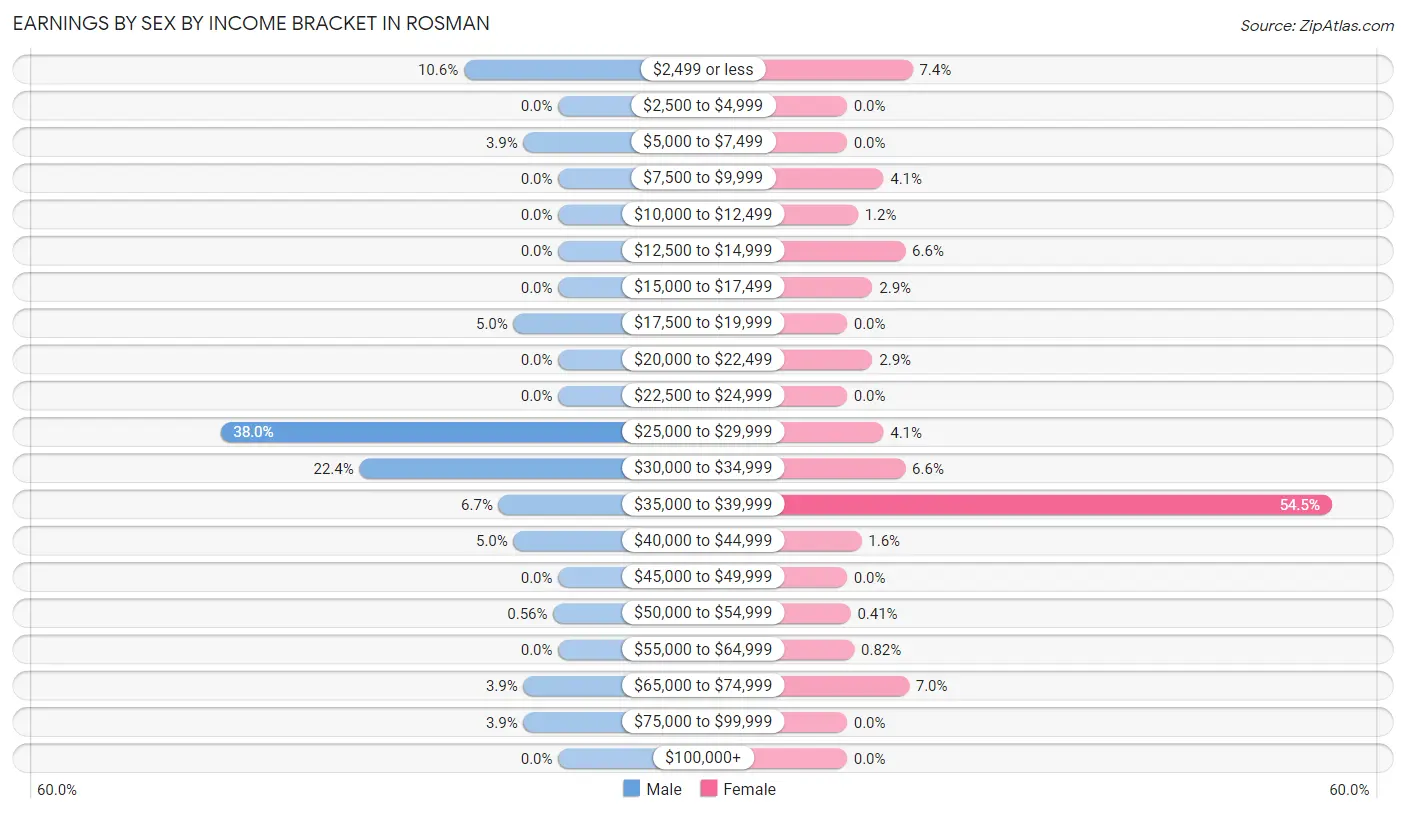
Earnings by Sex by Income Bracket in Rosman
The most common earnings brackets in Rosman are $25,000 to $29,999 for men (68 | 38.0%) and $35,000 to $39,999 for women (133 | 54.5%).
| Income | Male | Female |
| $2,499 or less | 19 (10.6%) | 18 (7.4%) |
| $2,500 to $4,999 | 0 (0.0%) | 0 (0.0%) |
| $5,000 to $7,499 | 7 (3.9%) | 0 (0.0%) |
| $7,500 to $9,999 | 0 (0.0%) | 10 (4.1%) |
| $10,000 to $12,499 | 0 (0.0%) | 3 (1.2%) |
| $12,500 to $14,999 | 0 (0.0%) | 16 (6.6%) |
| $15,000 to $17,499 | 0 (0.0%) | 7 (2.9%) |
| $17,500 to $19,999 | 9 (5.0%) | 0 (0.0%) |
| $20,000 to $22,499 | 0 (0.0%) | 7 (2.9%) |
| $22,500 to $24,999 | 0 (0.0%) | 0 (0.0%) |
| $25,000 to $29,999 | 68 (38.0%) | 10 (4.1%) |
| $30,000 to $34,999 | 40 (22.4%) | 16 (6.6%) |
| $35,000 to $39,999 | 12 (6.7%) | 133 (54.5%) |
| $40,000 to $44,999 | 9 (5.0%) | 4 (1.6%) |
| $45,000 to $49,999 | 0 (0.0%) | 0 (0.0%) |
| $50,000 to $54,999 | 1 (0.6%) | 1 (0.4%) |
| $55,000 to $64,999 | 0 (0.0%) | 2 (0.8%) |
| $65,000 to $74,999 | 7 (3.9%) | 17 (7.0%) |
| $75,000 to $99,999 | 7 (3.9%) | 0 (0.0%) |
| $100,000+ | 0 (0.0%) | 0 (0.0%) |
| Total | 179 (100.0%) | 244 (100.0%) |
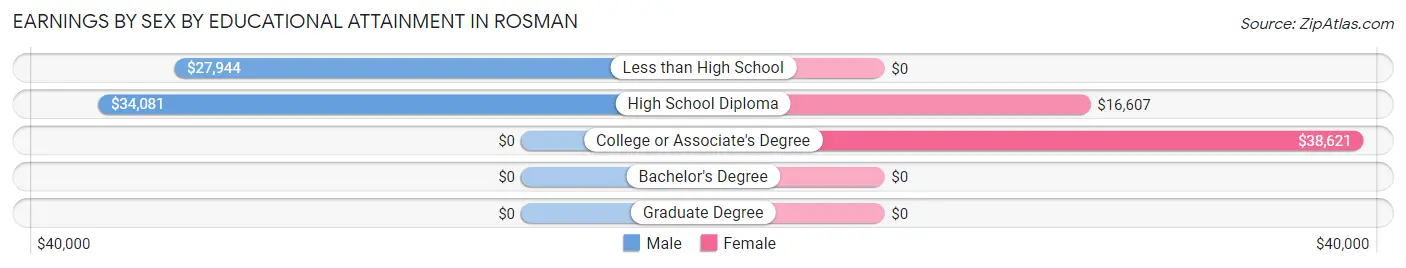
Earnings by Sex by Educational Attainment in Rosman
Average earnings in Rosman are $29,569 for men and $38,155 for women, a difference of 22.5%. Men with an educational attainment of high school diploma enjoy the highest average annual earnings of $34,081, while those with less than high school education earn the least with $27,944. Women with an educational attainment of college or associate's degree earn the most with the average annual earnings of $38,621, while those with high school diploma education have the smallest earnings of $16,607.
| Educational Attainment | Male Income | Female Income |
| Less than High School | $27,944 | $0 |
| High School Diploma | $34,081 | $16,607 |
| College or Associate's Degree | - | - |
| Bachelor's Degree | - | - |
| Graduate Degree | - | - |
| Total | $29,569 | $38,155 |
Family Income in Rosman
Family Income Brackets in Rosman
According to the Rosman family income data, there are 34 families falling into the $15,000 to $24,999 income range, which is the most common income bracket and makes up 26.2% of all families.
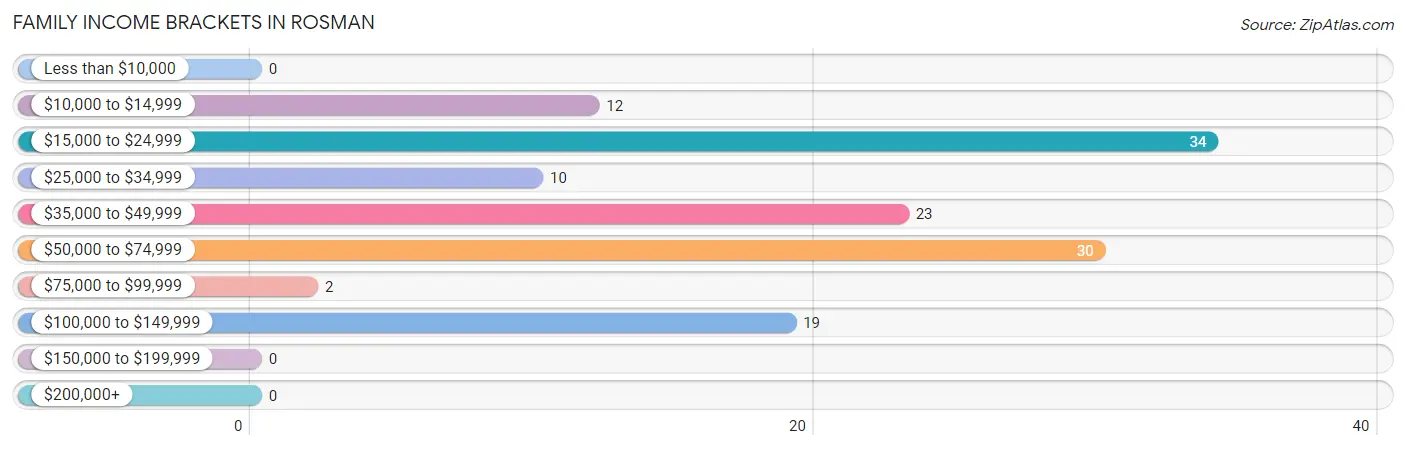
| Income Bracket | # Families | % Families |
| Less than $10,000 | 0 | 0.0% |
| $10,000 to $14,999 | 12 | 9.2% |
| $15,000 to $24,999 | 34 | 26.2% |
| $25,000 to $34,999 | 10 | 7.7% |
| $35,000 to $49,999 | 23 | 17.7% |
| $50,000 to $74,999 | 30 | 23.1% |
| $75,000 to $99,999 | 2 | 1.5% |
| $100,000 to $149,999 | 19 | 14.6% |
| $150,000 to $199,999 | 0 | 0.0% |
| $200,000+ | 0 | 0.0% |
Family Income by Famaliy Size in Rosman
2-person families (84 | 64.6%) account for the highest median family income in Rosman with $44,375 per family, while 2-person families (84 | 64.6%) have the highest median income of $22,188 per family member.
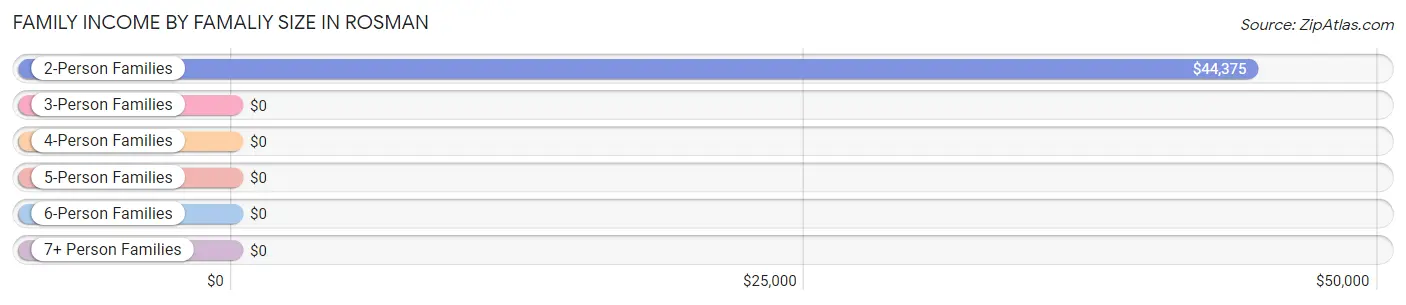
| Income Bracket | # Families | Median Income |
| 2-Person Families | 84 (64.6%) | $44,375 |
| 3-Person Families | 22 (16.9%) | $0 |
| 4-Person Families | 18 (13.9%) | $0 |
| 5-Person Families | 6 (4.6%) | $0 |
| 6-Person Families | 0 (0.0%) | $0 |
| 7+ Person Families | 0 (0.0%) | $0 |
| Total | 130 (100.0%) | $46,250 |
Family Income by Number of Earners in Rosman
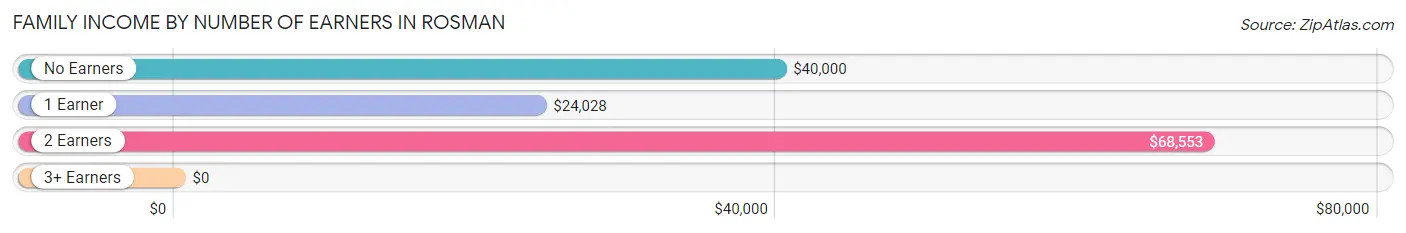
| Number of Earners | # Families | Median Income |
| No Earners | 12 (9.2%) | $40,000 |
| 1 Earner | 70 (53.8%) | $24,028 |
| 2 Earners | 36 (27.7%) | $68,553 |
| 3+ Earners | 12 (9.2%) | $0 |
| Total | 130 (100.0%) | $46,250 |
Household Income in Rosman
Household Income Brackets in Rosman
With 179 households falling in the category, the $50,000 to $74,999 income range is the most frequent in Rosman, accounting for 49.2% of all households.
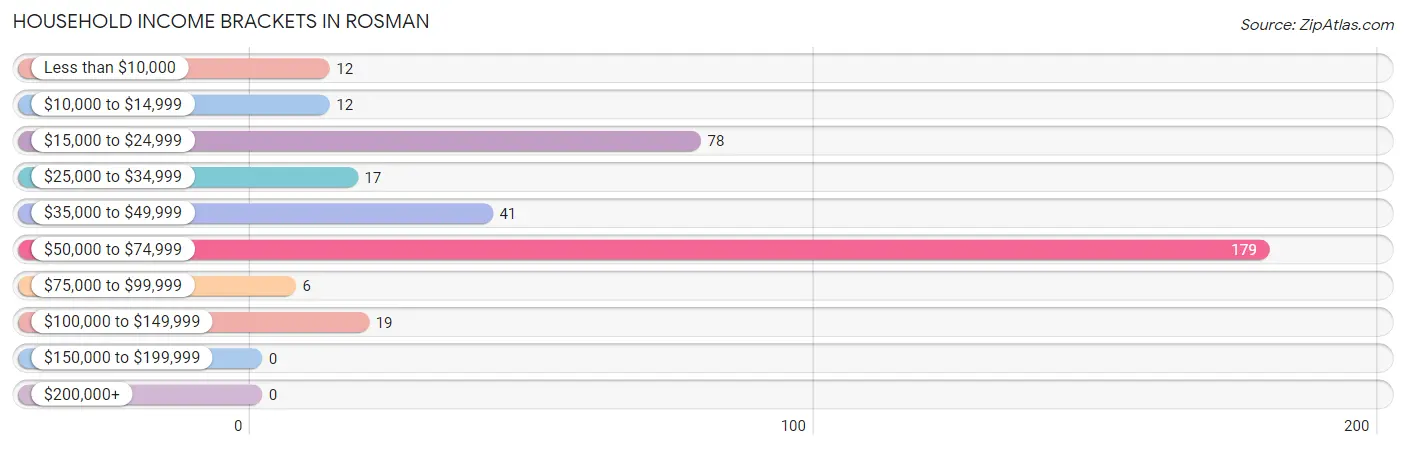
| Income Bracket | # Households | % Households |
| Less than $10,000 | 12 | 3.3% |
| $10,000 to $14,999 | 12 | 3.3% |
| $15,000 to $24,999 | 78 | 21.4% |
| $25,000 to $34,999 | 17 | 4.7% |
| $35,000 to $49,999 | 41 | 11.3% |
| $50,000 to $74,999 | 179 | 49.2% |
| $75,000 to $99,999 | 6 | 1.6% |
| $100,000 to $149,999 | 19 | 5.2% |
| $150,000 to $199,999 | 0 | 0.0% |
| $200,000+ | 0 | 0.0% |
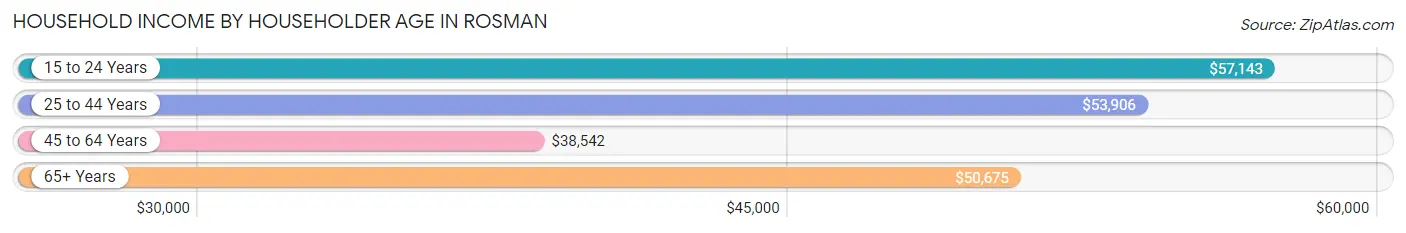
Household Income by Householder Age in Rosman
The median household income in Rosman is $50,437, with the highest median household income of $57,143 found in the 15 to 24 years age bracket for the primary householder. A total of 12 households (3.3%) fall into this category. Meanwhile, the 45 to 64 years age bracket for the primary householder has the lowest median household income of $38,542, with 97 households (26.7%) in this group.
| Income Bracket | # Households | Median Income |
| 15 to 24 Years | 12 (3.3%) | $57,143 |
| 25 to 44 Years | 71 (19.5%) | $53,906 |
| 45 to 64 Years | 97 (26.7%) | $38,542 |
| 65+ Years | 184 (50.5%) | $50,675 |
| Total | 364 (100.0%) | $50,437 |
Poverty in Rosman
Income Below Poverty by Sex and Age in Rosman
With 20.5% poverty level for males and 12.1% for females among the residents of Rosman, 55 to 64 year old males and 12 to 14 year old females are the most vulnerable to poverty, with 4 males (100.0%) and 3 females (100.0%) in their respective age groups living below the poverty level.
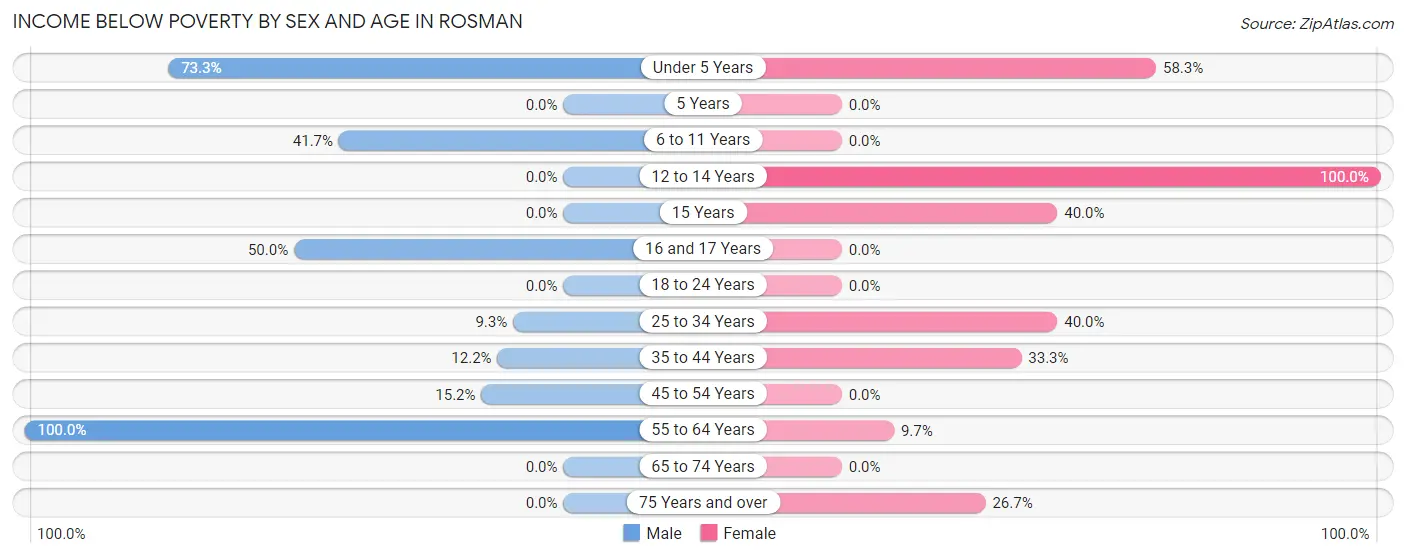
| Age Bracket | Male | Female |
| Under 5 Years | 11 (73.3%) | 7 (58.3%) |
| 5 Years | 0 (0.0%) | 0 (0.0%) |
| 6 to 11 Years | 15 (41.7%) | 0 (0.0%) |
| 12 to 14 Years | 0 (0.0%) | 3 (100.0%) |
| 15 Years | 0 (0.0%) | 2 (40.0%) |
| 16 and 17 Years | 9 (50.0%) | 0 (0.0%) |
| 18 to 24 Years | 0 (0.0%) | 0 (0.0%) |
| 25 to 34 Years | 7 (9.3%) | 10 (40.0%) |
| 35 to 44 Years | 6 (12.2%) | 10 (33.3%) |
| 45 to 54 Years | 7 (15.2%) | 0 (0.0%) |
| 55 to 64 Years | 4 (100.0%) | 3 (9.7%) |
| 65 to 74 Years | 0 (0.0%) | 0 (0.0%) |
| 75 Years and over | 0 (0.0%) | 8 (26.7%) |
| Total | 59 (20.5%) | 43 (12.1%) |
Income Above Poverty by Sex and Age in Rosman
According to the poverty statistics in Rosman, males aged 5 years and females aged 6 to 11 years are the age groups that are most secure financially, with 100.0% of males and 100.0% of females in these age groups living above the poverty line.
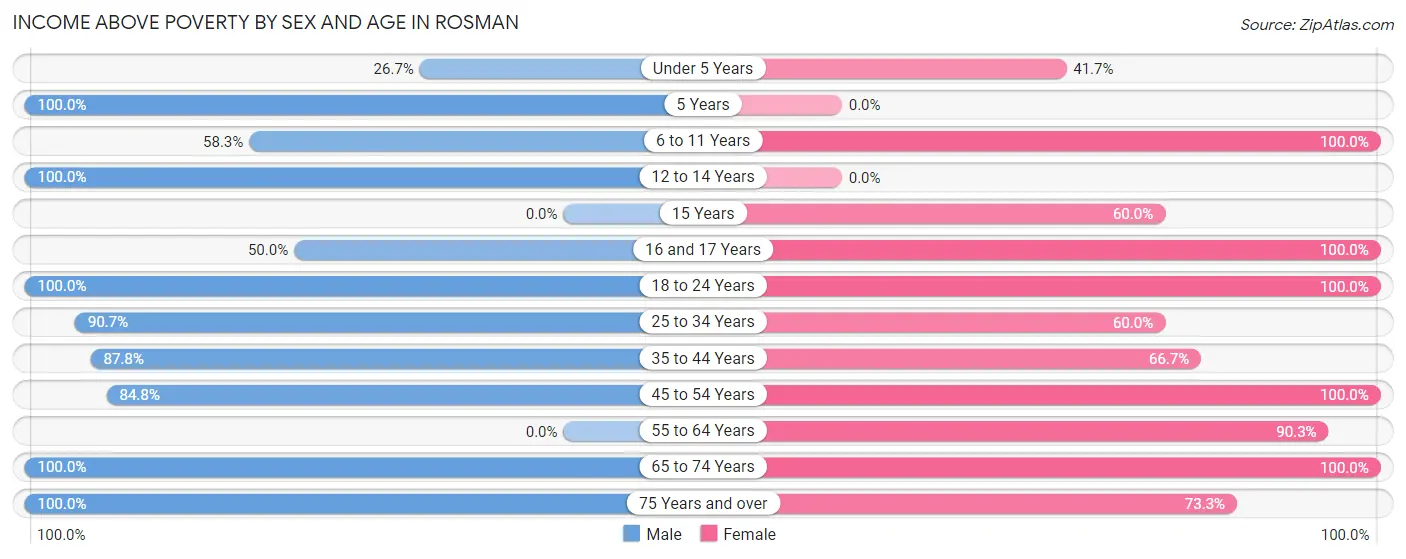
| Age Bracket | Male | Female |
| Under 5 Years | 4 (26.7%) | 5 (41.7%) |
| 5 Years | 1 (100.0%) | 0 (0.0%) |
| 6 to 11 Years | 21 (58.3%) | 31 (100.0%) |
| 12 to 14 Years | 1 (100.0%) | 0 (0.0%) |
| 15 Years | 0 (0.0%) | 3 (60.0%) |
| 16 and 17 Years | 9 (50.0%) | 10 (100.0%) |
| 18 to 24 Years | 16 (100.0%) | 12 (100.0%) |
| 25 to 34 Years | 68 (90.7%) | 15 (60.0%) |
| 35 to 44 Years | 43 (87.8%) | 20 (66.7%) |
| 45 to 54 Years | 39 (84.8%) | 27 (100.0%) |
| 55 to 64 Years | 0 (0.0%) | 28 (90.3%) |
| 65 to 74 Years | 11 (100.0%) | 138 (100.0%) |
| 75 Years and over | 16 (100.0%) | 22 (73.3%) |
| Total | 229 (79.5%) | 311 (87.8%) |
Income Below Poverty Among Married-Couple Families in Rosman
The poverty statistics for married-couple families in Rosman show that 4.6% or 2 of the total 43 families live below the poverty line. Families with no children have the highest poverty rate of 8.0%, comprising of 2 families. On the other hand, families with 1 or 2 children have the lowest poverty rate of 0.0%, which includes 0 families.
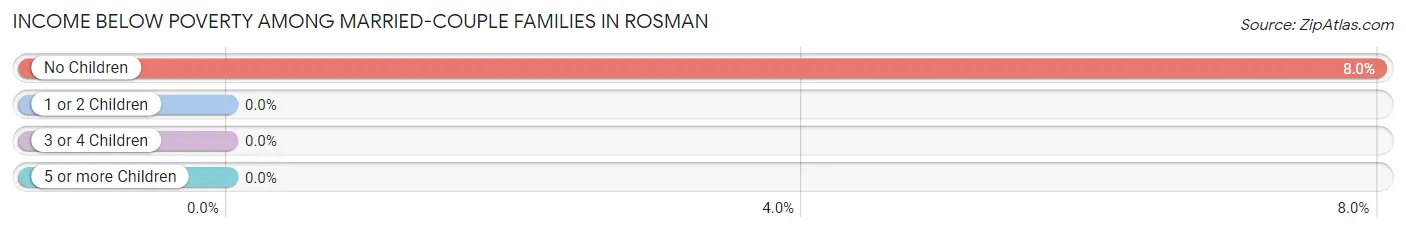
| Children | Above Poverty | Below Poverty |
| No Children | 23 (92.0%) | 2 (8.0%) |
| 1 or 2 Children | 12 (100.0%) | 0 (0.0%) |
| 3 or 4 Children | 6 (100.0%) | 0 (0.0%) |
| 5 or more Children | 0 (0.0%) | 0 (0.0%) |
| Total | 41 (95.4%) | 2 (4.6%) |
Income Below Poverty Among Single-Parent Households in Rosman
According to the poverty data in Rosman, 25.9% or 7 single-father households and 33.3% or 20 single-mother households are living below the poverty line. Among single-father households, those with 1 or 2 children have the highest poverty rate, with 7 households (63.6%) experiencing poverty. Likewise, among single-mother households, those with 3 or 4 children have the highest poverty rate, with 3 households (100.0%) falling below the poverty line.
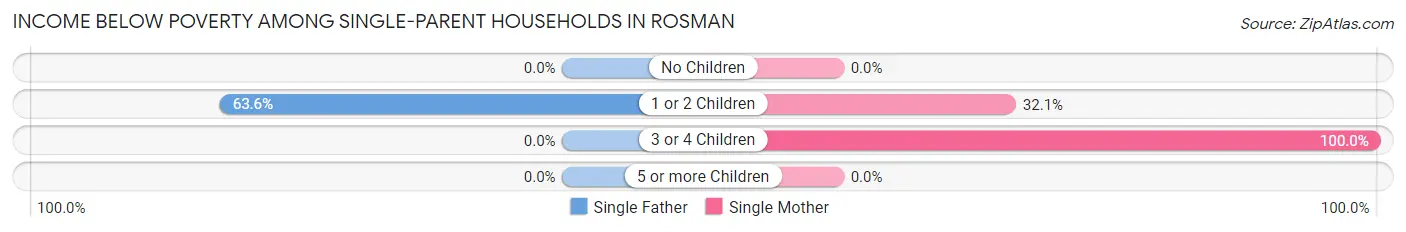
| Children | Single Father | Single Mother |
| No Children | 0 (0.0%) | 0 (0.0%) |
| 1 or 2 Children | 7 (63.6%) | 17 (32.1%) |
| 3 or 4 Children | 0 (0.0%) | 3 (100.0%) |
| 5 or more Children | 0 (0.0%) | 0 (0.0%) |
| Total | 7 (25.9%) | 20 (33.3%) |
Income Below Poverty Among Married-Couple vs Single-Parent Households in Rosman
The poverty data for Rosman shows that 2 of the married-couple family households (4.6%) and 27 of the single-parent households (31.0%) are living below the poverty level. Within the married-couple family households, those with no children have the highest poverty rate, with 2 households (8.0%) falling below the poverty line. Among the single-parent households, those with 3 or 4 children have the highest poverty rate, with 3 household (100.0%) living below poverty.
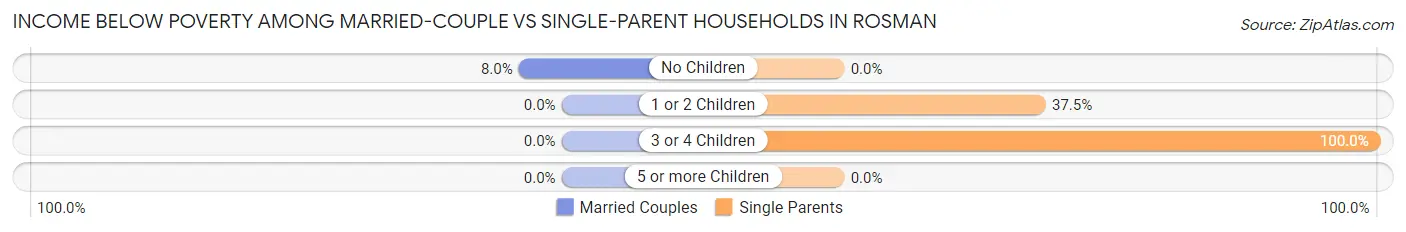
| Children | Married-Couple Families | Single-Parent Households |
| No Children | 2 (8.0%) | 0 (0.0%) |
| 1 or 2 Children | 0 (0.0%) | 24 (37.5%) |
| 3 or 4 Children | 0 (0.0%) | 3 (100.0%) |
| 5 or more Children | 0 (0.0%) | 0 (0.0%) |
| Total | 2 (4.6%) | 27 (31.0%) |
Race in Rosman
The most populous races in Rosman are White / Caucasian (609 | 94.9%), Hispanic or Latino (73 | 11.4%), and Some other Race (20 | 3.1%).
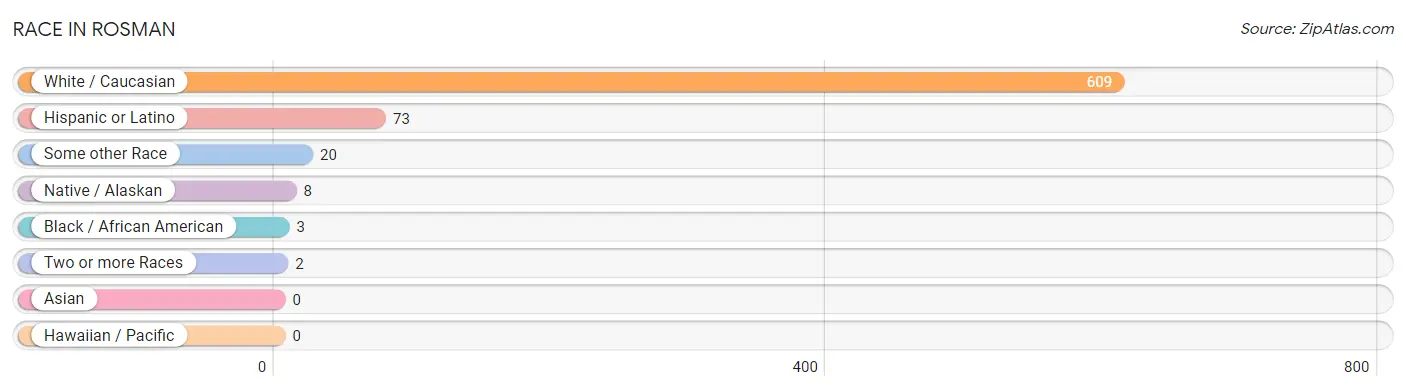
| Race | # Population | % Population |
| Asian | 0 | 0.0% |
| Black / African American | 3 | 0.5% |
| Hawaiian / Pacific | 0 | 0.0% |
| Hispanic or Latino | 73 | 11.4% |
| Native / Alaskan | 8 | 1.3% |
| White / Caucasian | 609 | 94.9% |
| Two or more Races | 2 | 0.3% |
| Some other Race | 20 | 3.1% |
| Total | 642 | 100.0% |
Ancestry in Rosman
The most populous ancestries reported in Rosman are Irish (194 | 30.2%), American (152 | 23.7%), Mexican (73 | 11.4%), Scotch-Irish (47 | 7.3%), and German (41 | 6.4%), together accounting for 79.0% of all Rosman residents.
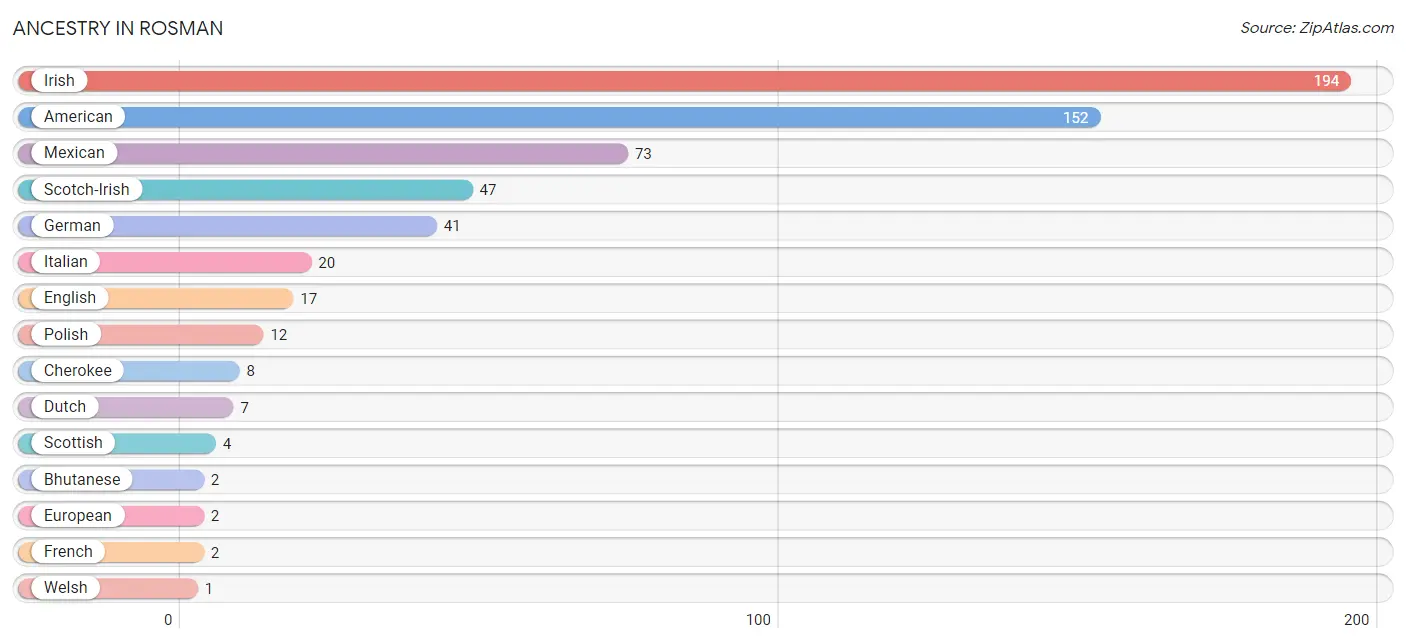
| Ancestry | # Population | % Population |
| American | 152 | 23.7% |
| Bhutanese | 2 | 0.3% |
| Cherokee | 8 | 1.3% |
| Dutch | 7 | 1.1% |
| English | 17 | 2.6% |
| European | 2 | 0.3% |
| French | 2 | 0.3% |
| German | 41 | 6.4% |
| Irish | 194 | 30.2% |
| Italian | 20 | 3.1% |
| Mexican | 73 | 11.4% |
| Polish | 12 | 1.9% |
| Scotch-Irish | 47 | 7.3% |
| Scottish | 4 | 0.6% |
| Welsh | 1 | 0.2% | View All 15 Rows |
Immigrants in Rosman
The most numerous immigrant groups reported in Rosman came from Central America (73 | 11.4%), Latin America (73 | 11.4%), and Mexico (73 | 11.4%), together accounting for 34.1% of all Rosman residents.
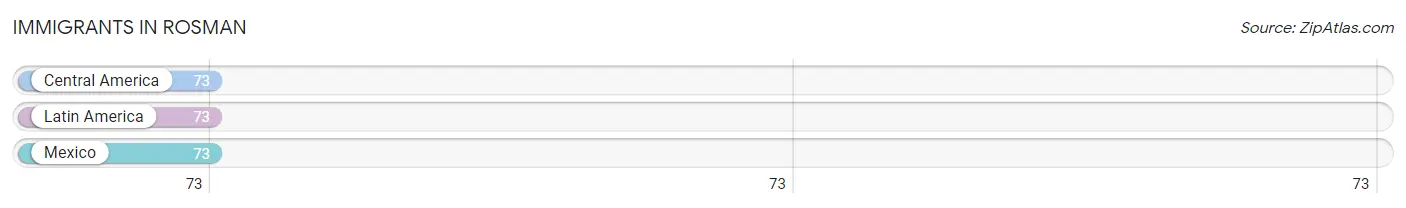
| Immigration Origin | # Population | % Population |
| Central America | 73 | 11.4% |
| Latin America | 73 | 11.4% |
| Mexico | 73 | 11.4% | View All 3 Rows |
Sex and Age in Rosman
Sex and Age in Rosman
The most populous age groups in Rosman are 30 to 34 Years (41 | 14.2%) for men and 70 to 74 Years (134 | 37.9%) for women.
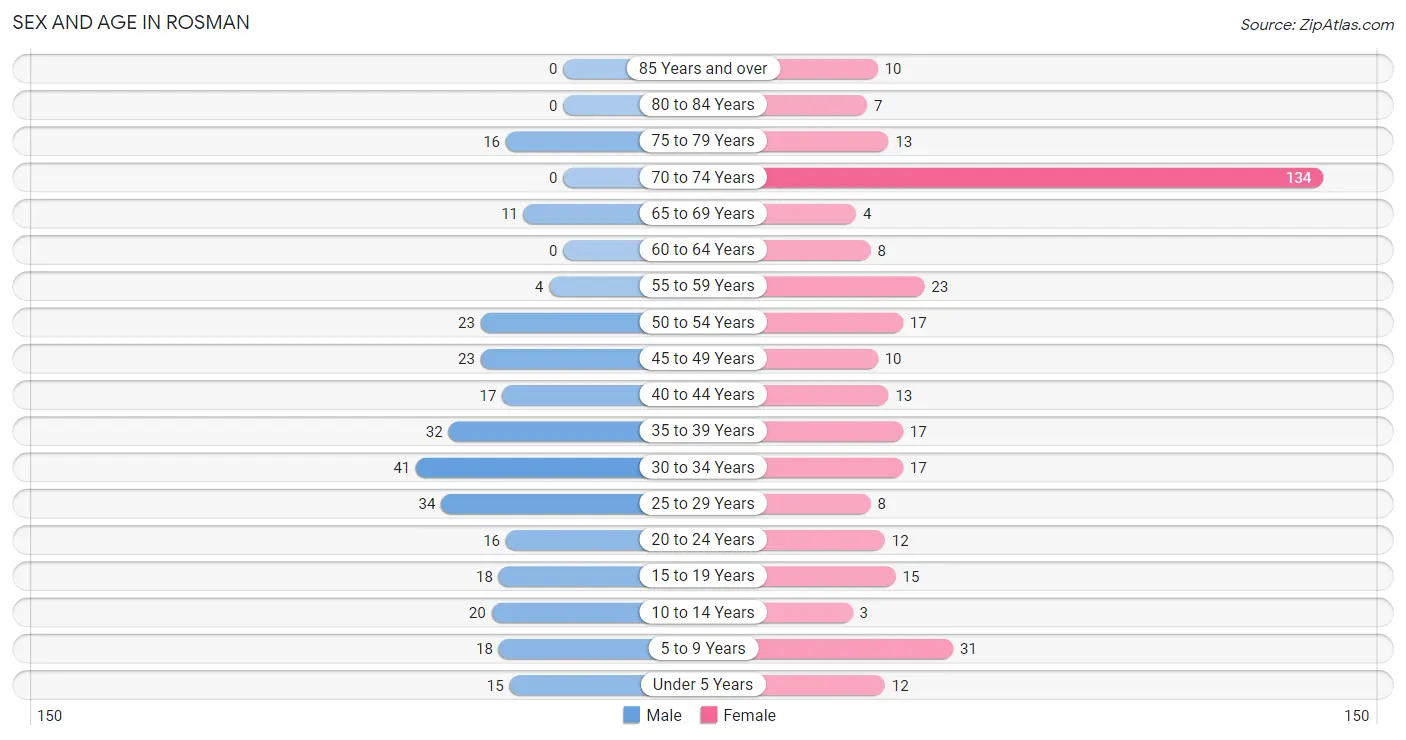
| Age Bracket | Male | Female |
| Under 5 Years | 15 (5.2%) | 12 (3.4%) |
| 5 to 9 Years | 18 (6.2%) | 31 (8.8%) |
| 10 to 14 Years | 20 (6.9%) | 3 (0.9%) |
| 15 to 19 Years | 18 (6.2%) | 15 (4.2%) |
| 20 to 24 Years | 16 (5.6%) | 12 (3.4%) |
| 25 to 29 Years | 34 (11.8%) | 8 (2.3%) |
| 30 to 34 Years | 41 (14.2%) | 17 (4.8%) |
| 35 to 39 Years | 32 (11.1%) | 17 (4.8%) |
| 40 to 44 Years | 17 (5.9%) | 13 (3.7%) |
| 45 to 49 Years | 23 (8.0%) | 10 (2.8%) |
| 50 to 54 Years | 23 (8.0%) | 17 (4.8%) |
| 55 to 59 Years | 4 (1.4%) | 23 (6.5%) |
| 60 to 64 Years | 0 (0.0%) | 8 (2.3%) |
| 65 to 69 Years | 11 (3.8%) | 4 (1.1%) |
| 70 to 74 Years | 0 (0.0%) | 134 (37.9%) |
| 75 to 79 Years | 16 (5.6%) | 13 (3.7%) |
| 80 to 84 Years | 0 (0.0%) | 7 (2.0%) |
| 85 Years and over | 0 (0.0%) | 10 (2.8%) |
| Total | 288 (100.0%) | 354 (100.0%) |
Families and Households in Rosman
Median Family Size in Rosman
The median family size in Rosman is 2.74 persons per family, with married-couple families (43 | 33.1%) accounting for the largest median family size of 3.51 persons per family. On the other hand, single male/father families (27 | 20.8%) represent the smallest median family size with 2.19 persons per family.
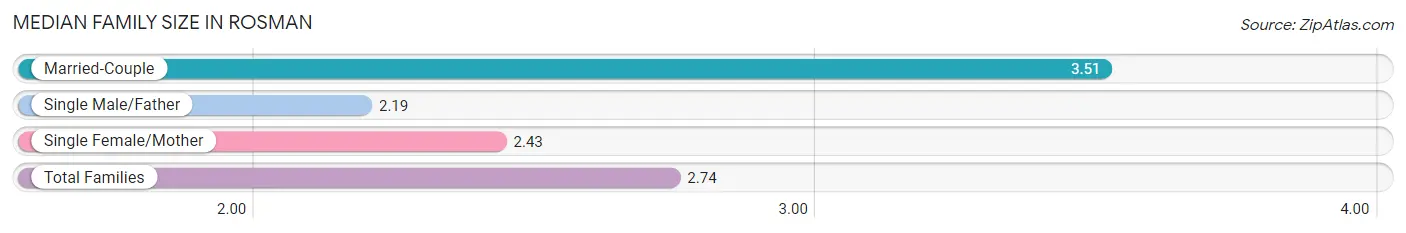
| Family Type | # Families | Family Size |
| Married-Couple | 43 (33.1%) | 3.51 |
| Single Male/Father | 27 (20.8%) | 2.19 |
| Single Female/Mother | 60 (46.2%) | 2.43 |
| Total Families | 130 (100.0%) | 2.74 |
Median Household Size in Rosman
The median household size in Rosman is 1.76 persons per household, with married-couple households (43 | 11.8%) accounting for the largest median household size of 3.79 persons per household. non-family households (234 | 64.3%) represent the smallest median household size with 1.12 persons per household.
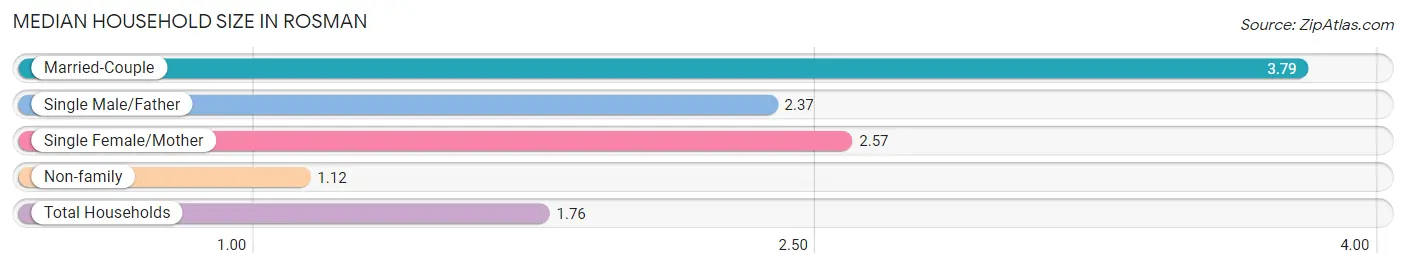
| Household Type | # Households | Household Size |
| Married-Couple | 43 (11.8%) | 3.79 |
| Single Male/Father | 27 (7.4%) | 2.37 |
| Single Female/Mother | 60 (16.5%) | 2.57 |
| Non-family | 234 (64.3%) | 1.12 |
| Total Households | 364 (100.0%) | 1.76 |
Household Size by Marriage Status in Rosman
Out of a total of 364 households in Rosman, 130 (35.7%) are family households, while 234 (64.3%) are nonfamily households. The most numerous type of family households are 2-person households, comprising 83, and the most common type of nonfamily households are 1-person households, comprising 219.
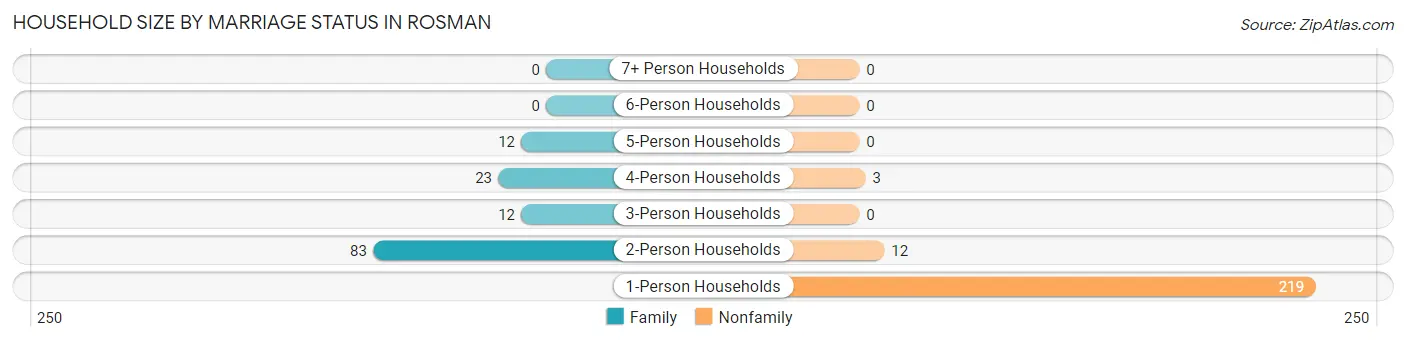
| Household Size | Family Households | Nonfamily Households |
| 1-Person Households | - | 219 (60.2%) |
| 2-Person Households | 83 (22.8%) | 12 (3.3%) |
| 3-Person Households | 12 (3.3%) | 0 (0.0%) |
| 4-Person Households | 23 (6.3%) | 3 (0.8%) |
| 5-Person Households | 12 (3.3%) | 0 (0.0%) |
| 6-Person Households | 0 (0.0%) | 0 (0.0%) |
| 7+ Person Households | 0 (0.0%) | 0 (0.0%) |
| Total | 130 (35.7%) | 234 (64.3%) |
Female Fertility in Rosman
Fertility by Age in Rosman
Average fertility rate in Rosman is 100.0 births per 1,000 women. Women in the age bracket of 20 to 34 years have the highest fertility rate with 270.0 births per 1,000 women. Women in the age bracket of 20 to 34 years acount for 100.0% of all women with births.
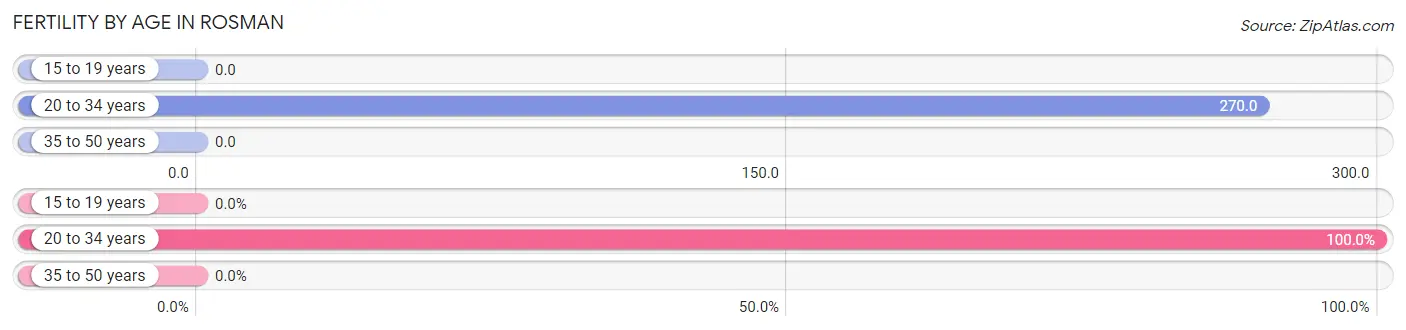
| Age Bracket | Women with Births | Births / 1,000 Women |
| 15 to 19 years | 0 (0.0%) | 0.0 |
| 20 to 34 years | 10 (100.0%) | 270.0 |
| 35 to 50 years | 0 (0.0%) | 0.0 |
| Total | 10 (100.0%) | 100.0 |
Fertility by Age by Marriage Status in Rosman
30.0% of women with births (10) in Rosman are married. The highest percentage of unmarried women with births falls into 20 to 34 years age bracket with 70.0% of them unmarried at the time of birth, while the lowest percentage of unmarried women with births belong to 20 to 34 years age bracket with 70.0% of them unmarried.
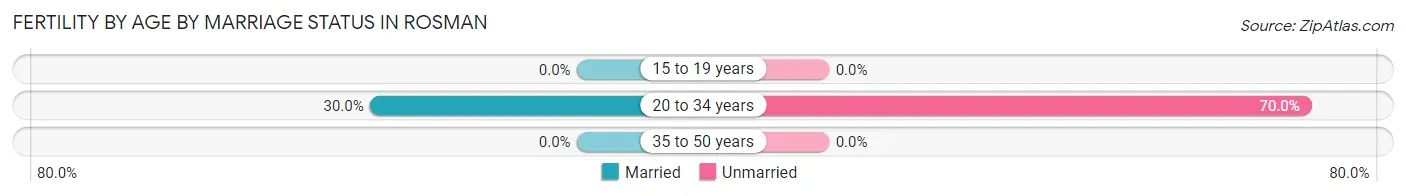
| Age Bracket | Married | Unmarried |
| 15 to 19 years | 0 (0.0%) | 0 (0.0%) |
| 20 to 34 years | 3 (30.0%) | 7 (70.0%) |
| 35 to 50 years | 0 (0.0%) | 0 (0.0%) |
| Total | 3 (30.0%) | 7 (70.0%) |
Fertility by Education in Rosman
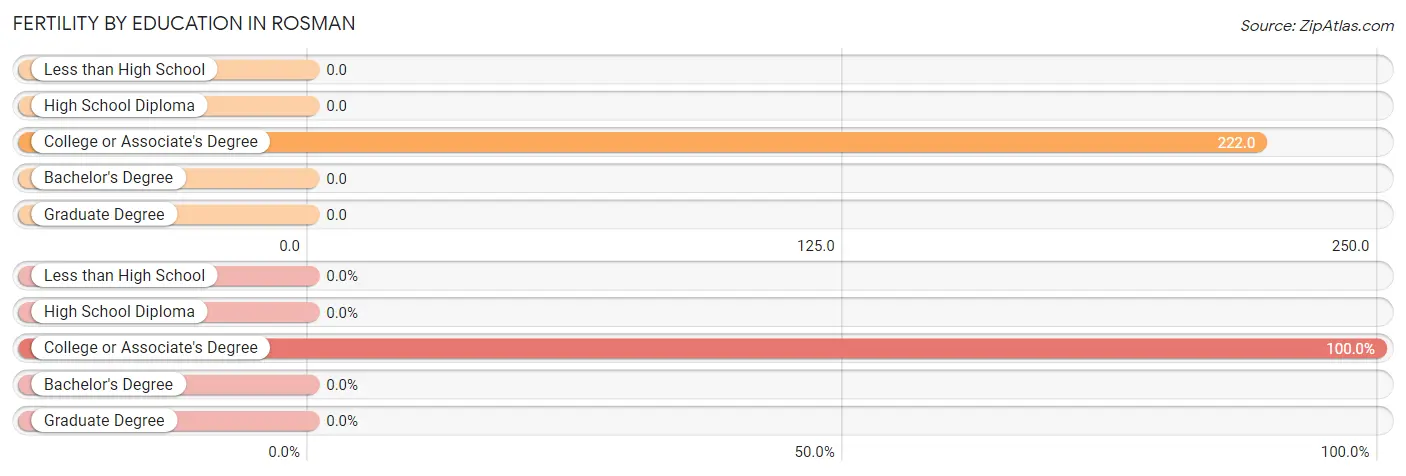
| Educational Attainment | Women with Births | Births / 1,000 Women |
| Less than High School | 0 (0.0%) | 0.0 |
| High School Diploma | 0 (0.0%) | 0.0 |
| College or Associate's Degree | 10 (100.0%) | 222.0 |
| Bachelor's Degree | 0 (0.0%) | 0.0 |
| Graduate Degree | 0 (0.0%) | 0.0 |
| Total | 10 (100.0%) | 100.0 |
Fertility by Education by Marriage Status in Rosman
70.0% of women with births in Rosman are unmarried. Women with the educational attainment of college or associate's degree are most likely to be married with 30.0% of them married at childbirth, while women with the educational attainment of college or associate's degree are least likely to be married with 70.0% of them unmarried at childbirth.
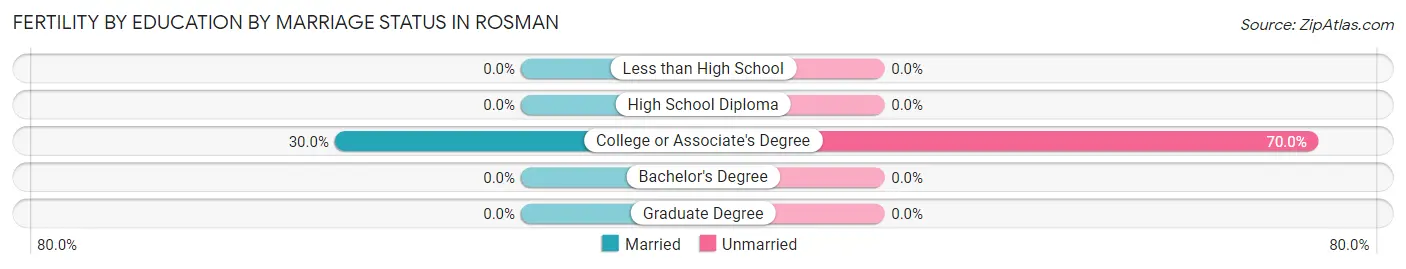
| Educational Attainment | Married | Unmarried |
| Less than High School | 0 (0.0%) | 0 (0.0%) |
| High School Diploma | 0 (0.0%) | 0 (0.0%) |
| College or Associate's Degree | 3 (30.0%) | 7 (70.0%) |
| Bachelor's Degree | 0 (0.0%) | 0 (0.0%) |
| Graduate Degree | 0 (0.0%) | 0 (0.0%) |
| Total | 3 (30.0%) | 7 (70.0%) |
Employment Characteristics in Rosman
Employment by Class of Employer in Rosman
Among the 254 employed individuals in Rosman, private company employees (221 | 87.0%), federal government employees (19 | 7.5%), and state government employees (7 | 2.8%) make up the most common classes of employment.
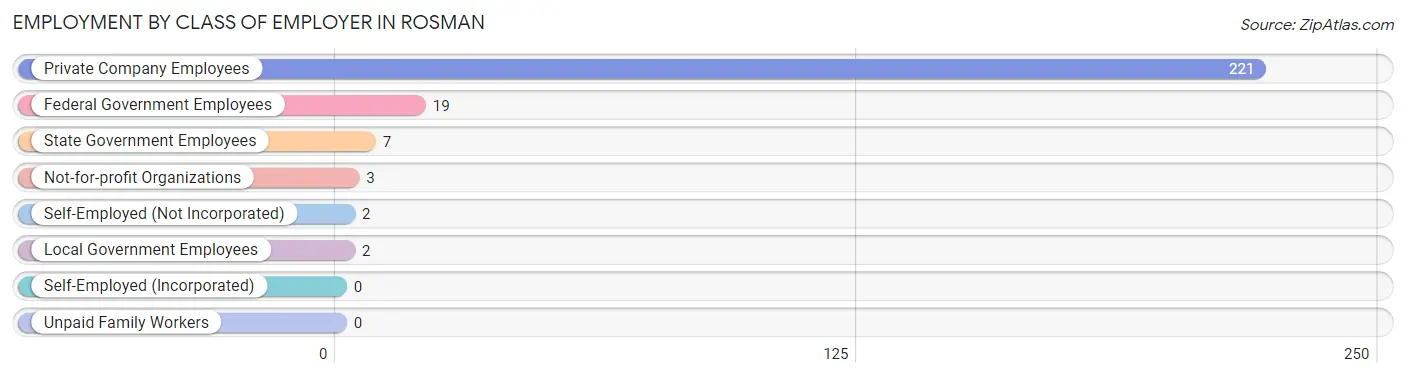
| Employer Class | # Employees | % Employees |
| Private Company Employees | 221 | 87.0% |
| Self-Employed (Incorporated) | 0 | 0.0% |
| Self-Employed (Not Incorporated) | 2 | 0.8% |
| Not-for-profit Organizations | 3 | 1.2% |
| Local Government Employees | 2 | 0.8% |
| State Government Employees | 7 | 2.8% |
| Federal Government Employees | 19 | 7.5% |
| Unpaid Family Workers | 0 | 0.0% |
| Total | 254 | 100.0% |
Employment Status by Age in Rosman
According to the labor force statistics for Rosman, out of the total population over 16 years of age (538), 51.5% or 277 individuals are in the labor force, with 3.6% or 10 of them unemployed. The age group with the highest labor force participation rate is 20 to 24 years, with 100.0% or 28 individuals in the labor force. Within the labor force, the 16 to 19 years age range has the highest percentage of unemployed individuals, with 55.6% or 10 of them being unemployed.
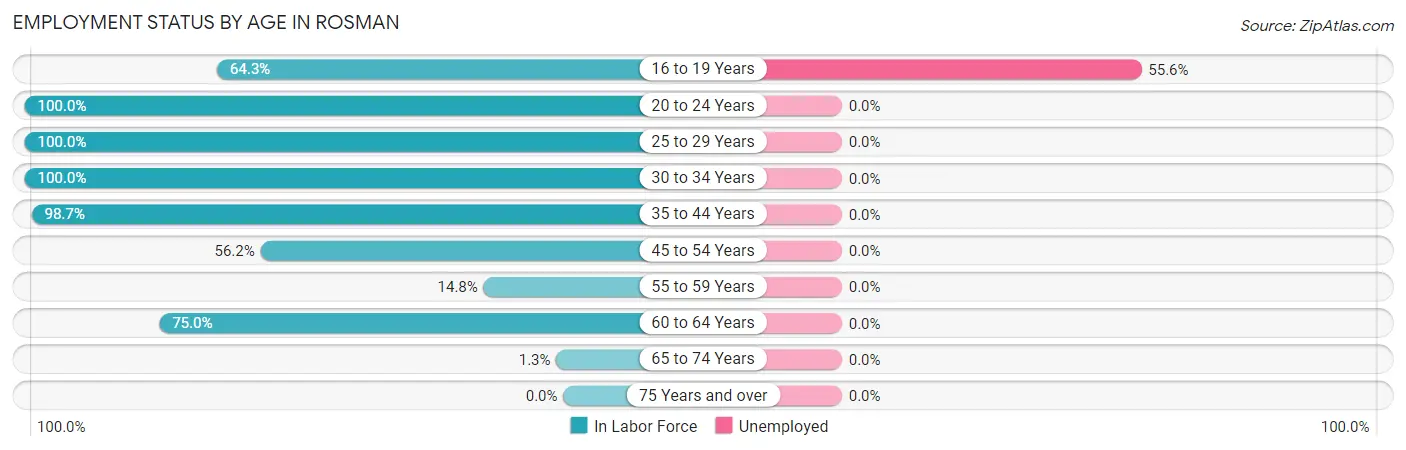
| Age Bracket | In Labor Force | Unemployed |
| 16 to 19 Years | 18 (64.3%) | 10 (55.6%) |
| 20 to 24 Years | 28 (100.0%) | 0 (0.0%) |
| 25 to 29 Years | 42 (100.0%) | 0 (0.0%) |
| 30 to 34 Years | 58 (100.0%) | 0 (0.0%) |
| 35 to 44 Years | 78 (98.7%) | 0 (0.0%) |
| 45 to 54 Years | 41 (56.2%) | 0 (0.0%) |
| 55 to 59 Years | 4 (14.8%) | 0 (0.0%) |
| 60 to 64 Years | 6 (75.0%) | 0 (0.0%) |
| 65 to 74 Years | 2 (1.3%) | 0 (0.0%) |
| 75 Years and over | 0 (0.0%) | 0 (0.0%) |
| Total | 277 (51.5%) | 10 (3.6%) |
Employment Status by Educational Attainment in Rosman
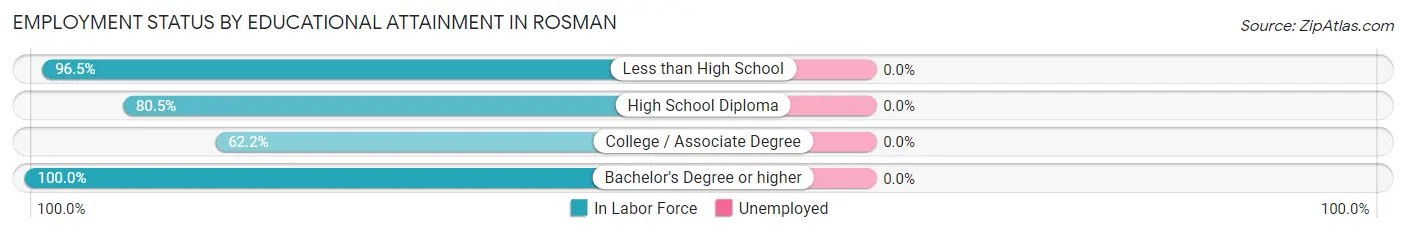
| Educational Attainment | In Labor Force | Unemployed |
| Less than High School | 55 (96.5%) | 0 (0.0%) |
| High School Diploma | 103 (80.5%) | 0 (0.0%) |
| College / Associate Degree | 51 (62.2%) | 0 (0.0%) |
| Bachelor's Degree or higher | 20 (100.0%) | 0 (0.0%) |
| Total | 229 (79.8%) | 0 (0.0%) |
Employment Occupations by Sex in Rosman
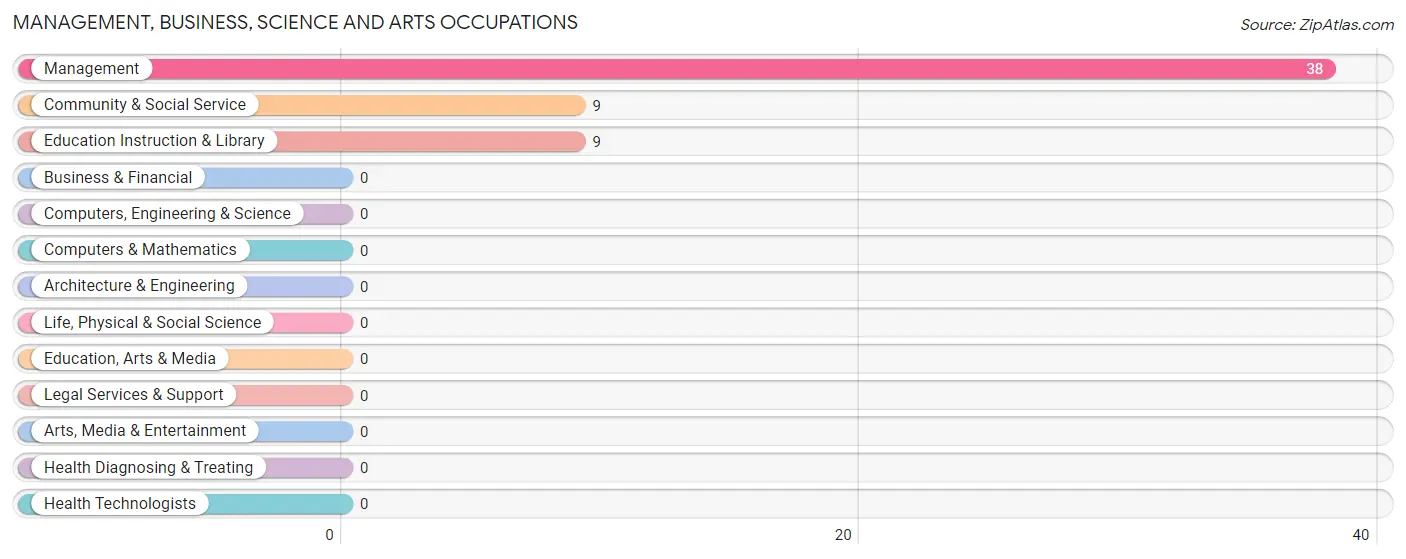
Management, Business, Science and Arts Occupations
The most common Management, Business, Science and Arts occupations in Rosman are Management (38 | 14.2%), Community & Social Service (9 | 3.4%), and Education Instruction & Library (9 | 3.4%).
Management, Business, Science and Arts Occupations by Sex
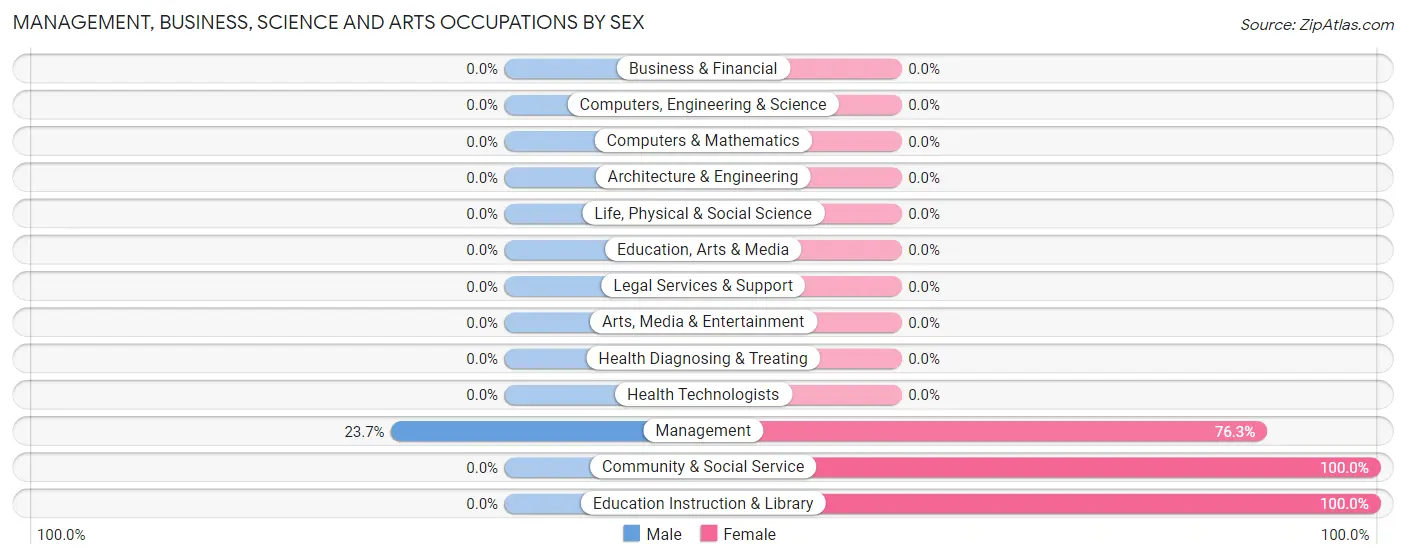
| Occupation | Male | Female |
| Management | 9 (23.7%) | 29 (76.3%) |
| Business & Financial | 0 (0.0%) | 0 (0.0%) |
| Computers, Engineering & Science | 0 (0.0%) | 0 (0.0%) |
| Computers & Mathematics | 0 (0.0%) | 0 (0.0%) |
| Architecture & Engineering | 0 (0.0%) | 0 (0.0%) |
| Life, Physical & Social Science | 0 (0.0%) | 0 (0.0%) |
| Community & Social Service | 0 (0.0%) | 9 (100.0%) |
| Education, Arts & Media | 0 (0.0%) | 0 (0.0%) |
| Legal Services & Support | 0 (0.0%) | 0 (0.0%) |
| Education Instruction & Library | 0 (0.0%) | 9 (100.0%) |
| Arts, Media & Entertainment | 0 (0.0%) | 0 (0.0%) |
| Health Diagnosing & Treating | 0 (0.0%) | 0 (0.0%) |
| Health Technologists | 0 (0.0%) | 0 (0.0%) |
| Total (Category) | 9 (19.2%) | 38 (80.8%) |
| Total (Overall) | 174 (65.2%) | 93 (34.8%) |
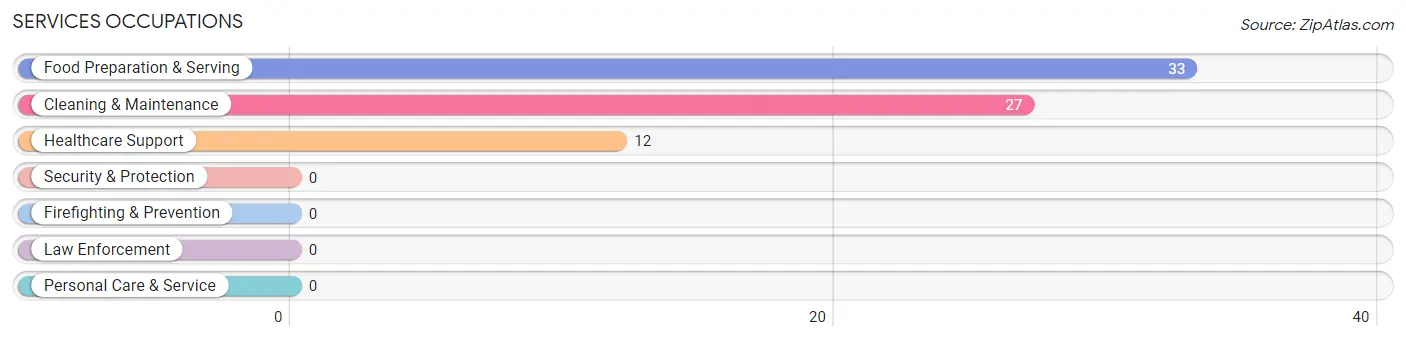
Services Occupations
The most common Services occupations in Rosman are Food Preparation & Serving (33 | 12.4%), Cleaning & Maintenance (27 | 10.1%), and Healthcare Support (12 | 4.5%).
Services Occupations by Sex
Within the Services occupations in Rosman, the most male-oriented occupations are Cleaning & Maintenance (70.4%), and Food Preparation & Serving (54.5%), while the most female-oriented occupations are Healthcare Support (100.0%), Food Preparation & Serving (45.5%), and Cleaning & Maintenance (29.6%).
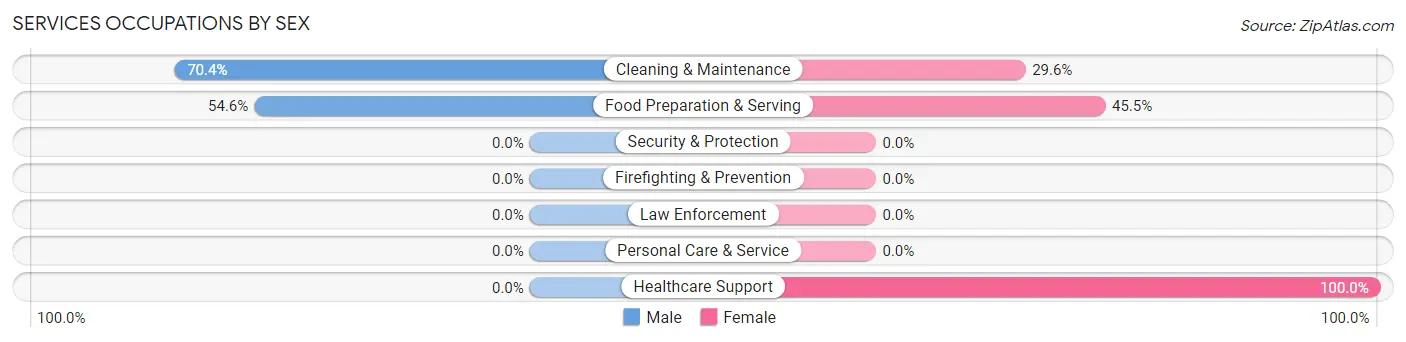
| Occupation | Male | Female |
| Healthcare Support | 0 (0.0%) | 12 (100.0%) |
| Security & Protection | 0 (0.0%) | 0 (0.0%) |
| Firefighting & Prevention | 0 (0.0%) | 0 (0.0%) |
| Law Enforcement | 0 (0.0%) | 0 (0.0%) |
| Food Preparation & Serving | 18 (54.5%) | 15 (45.5%) |
| Cleaning & Maintenance | 19 (70.4%) | 8 (29.6%) |
| Personal Care & Service | 0 (0.0%) | 0 (0.0%) |
| Total (Category) | 37 (51.4%) | 35 (48.6%) |
| Total (Overall) | 174 (65.2%) | 93 (34.8%) |
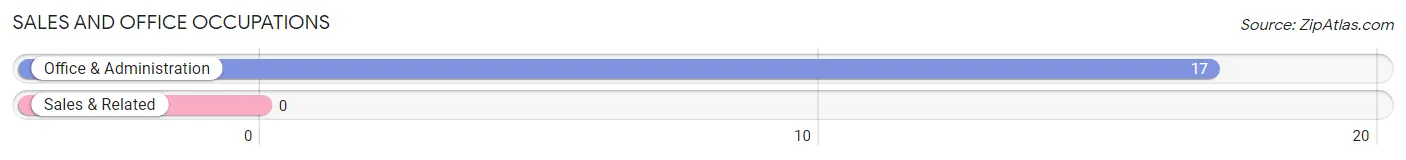
Sales and Office Occupations
The most common Sales and Office occupations in Rosman are , and Office & Administration (17 | 6.4%).
Sales and Office Occupations by Sex
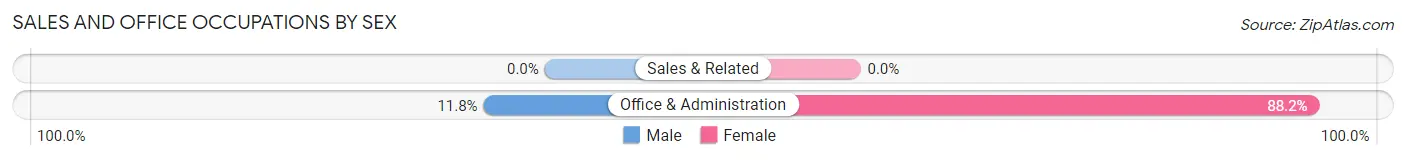
| Occupation | Male | Female |
| Sales & Related | 0 (0.0%) | 0 (0.0%) |
| Office & Administration | 2 (11.8%) | 15 (88.2%) |
| Total (Category) | 2 (11.8%) | 15 (88.2%) |
| Total (Overall) | 174 (65.2%) | 93 (34.8%) |
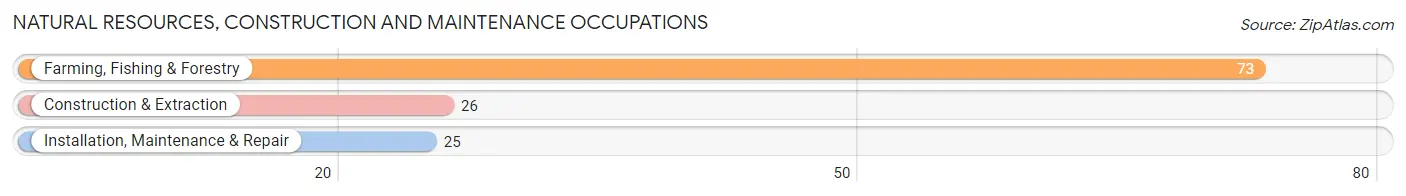
Natural Resources, Construction and Maintenance Occupations
The most common Natural Resources, Construction and Maintenance occupations in Rosman are Farming, Fishing & Forestry (73 | 27.3%), Construction & Extraction (26 | 9.7%), and Installation, Maintenance & Repair (25 | 9.4%).
Natural Resources, Construction and Maintenance Occupations by Sex
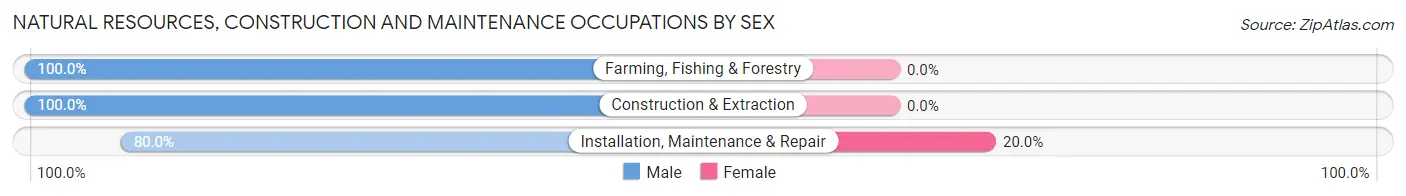
| Occupation | Male | Female |
| Farming, Fishing & Forestry | 73 (100.0%) | 0 (0.0%) |
| Construction & Extraction | 26 (100.0%) | 0 (0.0%) |
| Installation, Maintenance & Repair | 20 (80.0%) | 5 (20.0%) |
| Total (Category) | 119 (96.0%) | 5 (4.0%) |
| Total (Overall) | 174 (65.2%) | 93 (34.8%) |
Production, Transportation and Moving Occupations
The most common Production, Transportation and Moving occupations in Rosman are , and Transportation (7 | 2.6%).
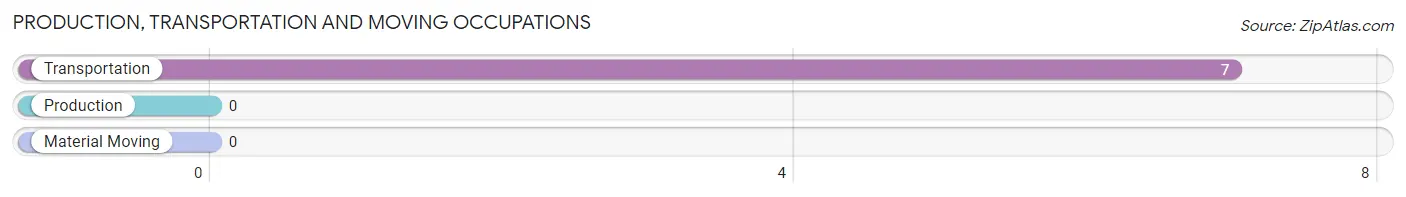
Production, Transportation and Moving Occupations by Sex
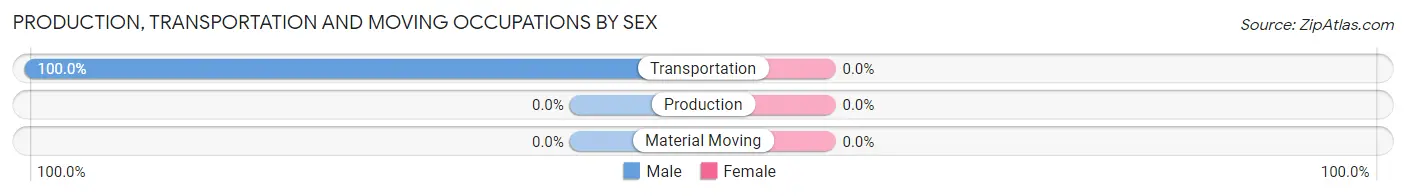
| Occupation | Male | Female |
| Production | 0 (0.0%) | 0 (0.0%) |
| Transportation | 7 (100.0%) | 0 (0.0%) |
| Material Moving | 0 (0.0%) | 0 (0.0%) |
| Total (Category) | 7 (100.0%) | 0 (0.0%) |
| Total (Overall) | 174 (65.2%) | 93 (34.8%) |
Employment Industries by Sex in Rosman
Employment Industries in Rosman
The major employment industries in Rosman include Agriculture, Fishing & Hunting (73 | 27.3%), Health Care & Social Assistance (44 | 16.5%), Accommodation & Food Services (33 | 12.4%), Manufacturing (22 | 8.2%), and Construction (19 | 7.1%).
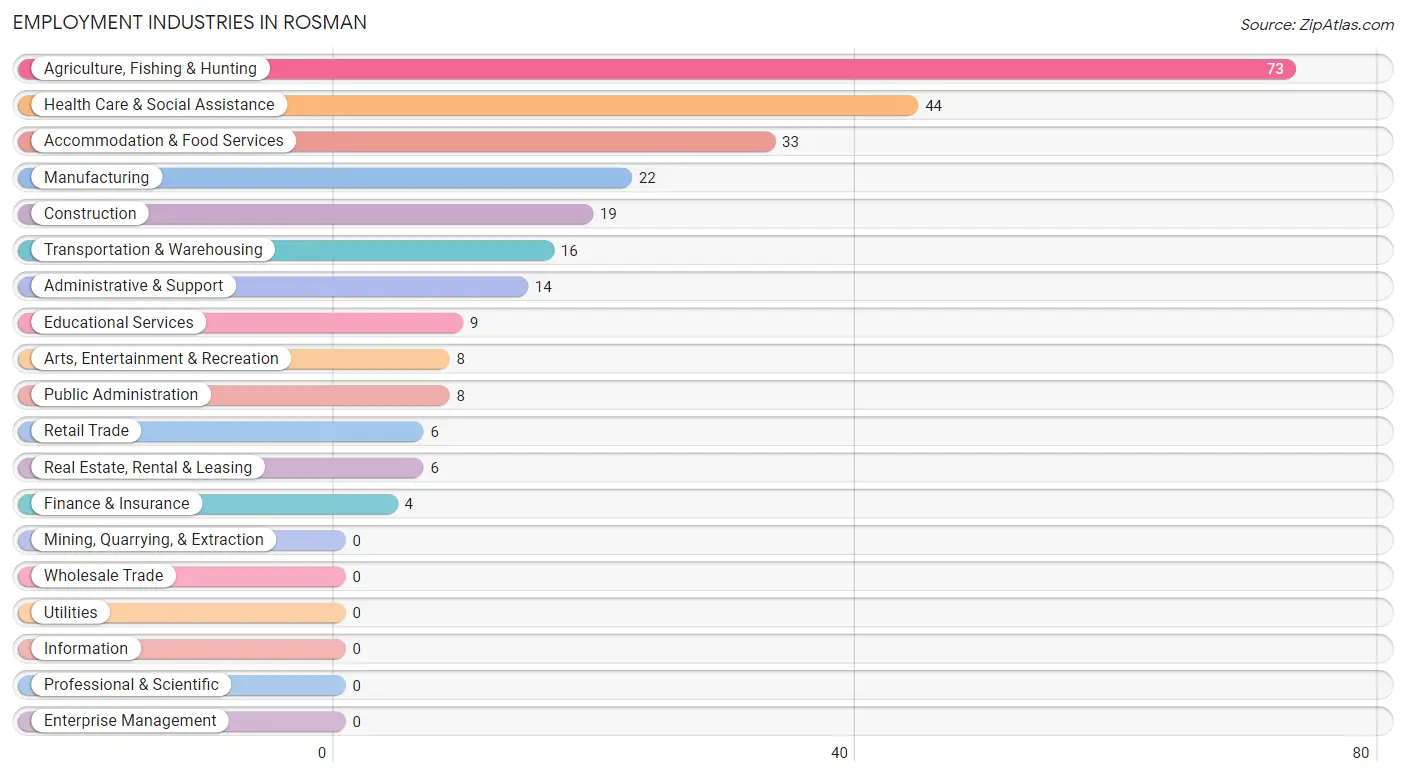
Employment Industries by Sex in Rosman
The Rosman industries that see more men than women are Agriculture, Fishing & Hunting (100.0%), Construction (100.0%), and Retail Trade (100.0%), whereas the industries that tend to have a higher number of women are Finance & Insurance (100.0%), Educational Services (100.0%), and Public Administration (100.0%).
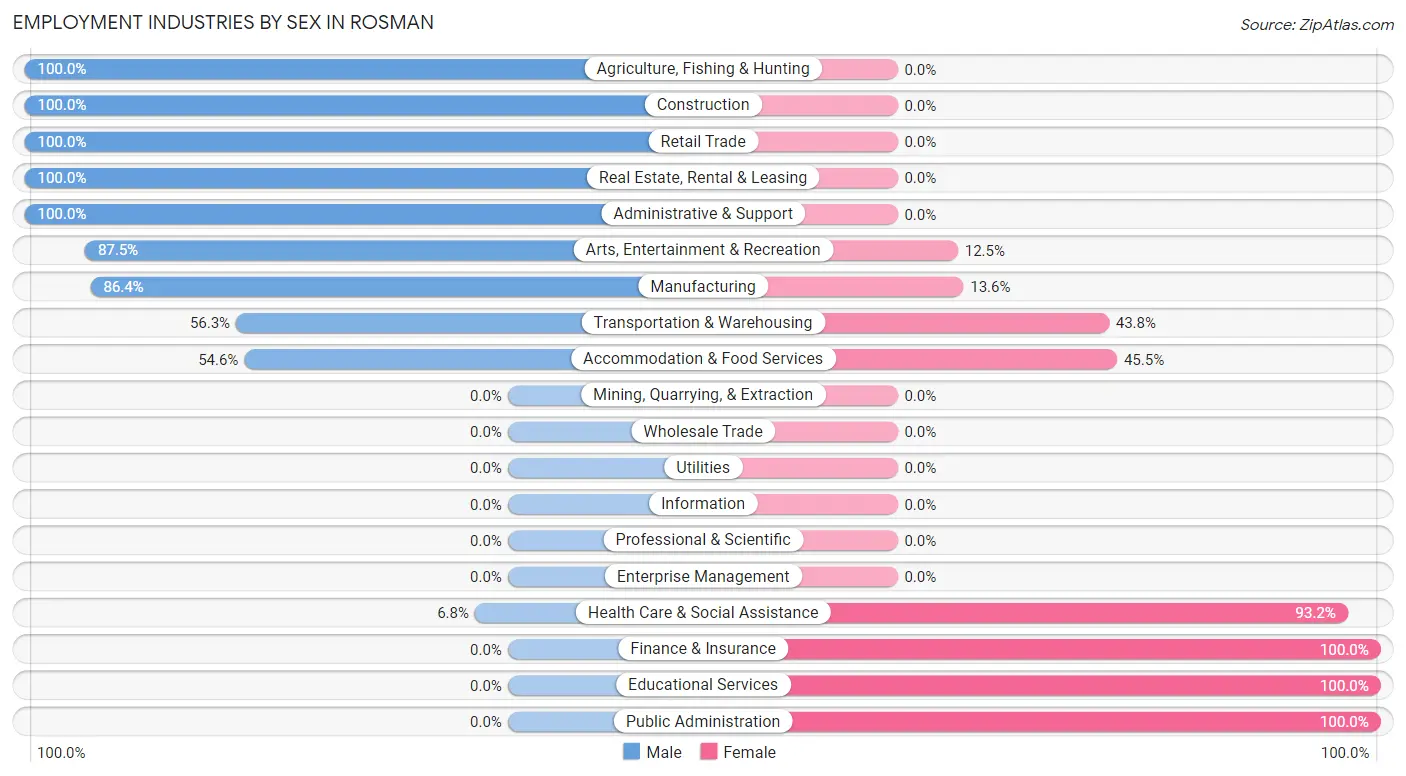
| Industry | Male | Female |
| Agriculture, Fishing & Hunting | 73 (100.0%) | 0 (0.0%) |
| Mining, Quarrying, & Extraction | 0 (0.0%) | 0 (0.0%) |
| Construction | 19 (100.0%) | 0 (0.0%) |
| Manufacturing | 19 (86.4%) | 3 (13.6%) |
| Wholesale Trade | 0 (0.0%) | 0 (0.0%) |
| Retail Trade | 6 (100.0%) | 0 (0.0%) |
| Transportation & Warehousing | 9 (56.2%) | 7 (43.8%) |
| Utilities | 0 (0.0%) | 0 (0.0%) |
| Information | 0 (0.0%) | 0 (0.0%) |
| Finance & Insurance | 0 (0.0%) | 4 (100.0%) |
| Real Estate, Rental & Leasing | 6 (100.0%) | 0 (0.0%) |
| Professional & Scientific | 0 (0.0%) | 0 (0.0%) |
| Enterprise Management | 0 (0.0%) | 0 (0.0%) |
| Administrative & Support | 14 (100.0%) | 0 (0.0%) |
| Educational Services | 0 (0.0%) | 9 (100.0%) |
| Health Care & Social Assistance | 3 (6.8%) | 41 (93.2%) |
| Arts, Entertainment & Recreation | 7 (87.5%) | 1 (12.5%) |
| Accommodation & Food Services | 18 (54.5%) | 15 (45.5%) |
| Public Administration | 0 (0.0%) | 8 (100.0%) |
| Total | 174 (65.2%) | 93 (34.8%) |
Education in Rosman
School Enrollment in Rosman
The most common levels of schooling among the 112 students in Rosman are elementary school (29 | 25.9%), high school (28 | 25.0%), and kindergarten (24 | 21.4%).
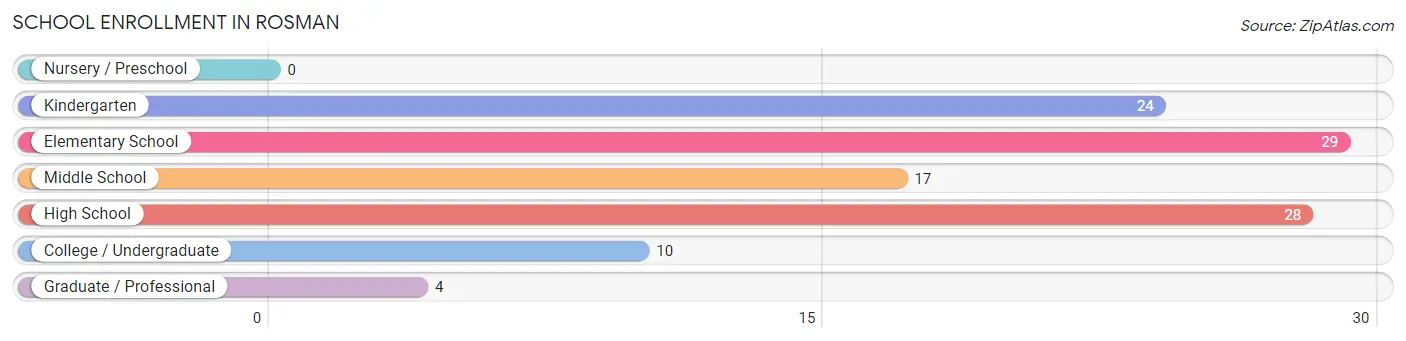
| School Level | # Students | % Students |
| Nursery / Preschool | 0 | 0.0% |
| Kindergarten | 24 | 21.4% |
| Elementary School | 29 | 25.9% |
| Middle School | 17 | 15.2% |
| High School | 28 | 25.0% |
| College / Undergraduate | 10 | 8.9% |
| Graduate / Professional | 4 | 3.6% |
| Total | 112 | 100.0% |
School Enrollment by Age by Funding Source in Rosman
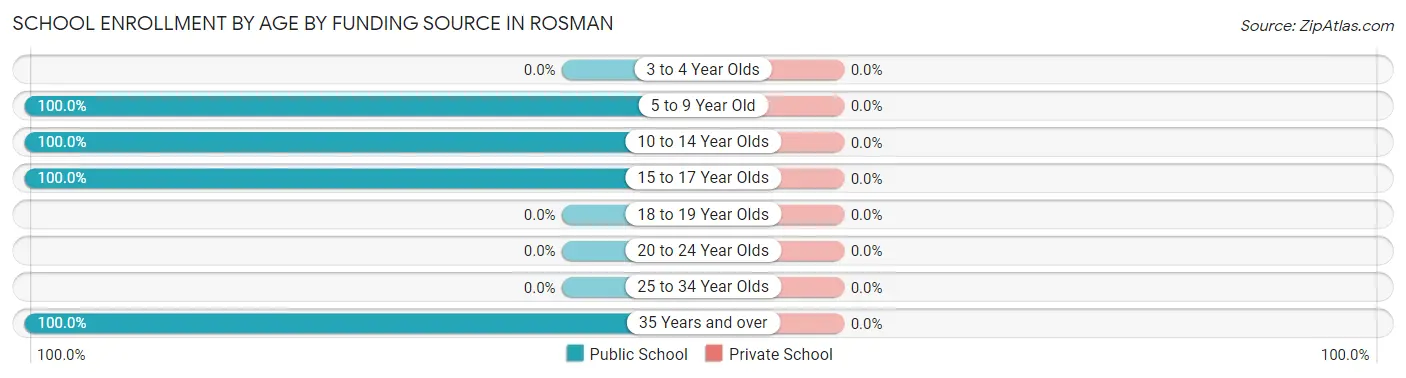
| Age Bracket | Public School | Private School |
| 3 to 4 Year Olds | 0 (0.0%) | 0 (0.0%) |
| 5 to 9 Year Old | 47 (100.0%) | 0 (0.0%) |
| 10 to 14 Year Olds | 23 (100.0%) | 0 (0.0%) |
| 15 to 17 Year Olds | 28 (100.0%) | 0 (0.0%) |
| 18 to 19 Year Olds | 0 (0.0%) | 0 (0.0%) |
| 20 to 24 Year Olds | 0 (0.0%) | 0 (0.0%) |
| 25 to 34 Year Olds | 0 (0.0%) | 0 (0.0%) |
| 35 Years and over | 14 (100.0%) | 0 (0.0%) |
| Total | 112 (100.0%) | 0 (0.0%) |
Educational Attainment by Field of Study in Rosman
Bio, nature & agricultural (16 | 76.2%), business (4 | 19.1%), and education (1 | 4.8%) are the most common fields of study among 21 individuals in Rosman who have obtained a bachelor's degree or higher.
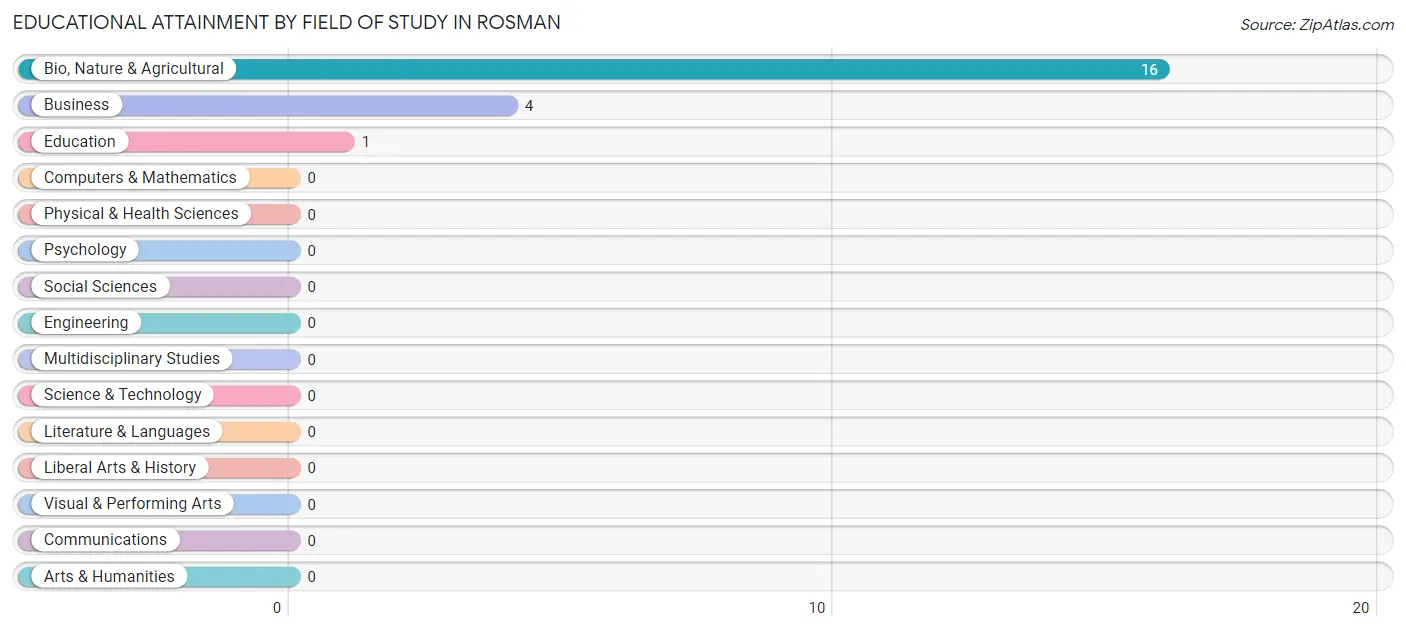
| Field of Study | # Graduates | % Graduates |
| Computers & Mathematics | 0 | 0.0% |
| Bio, Nature & Agricultural | 16 | 76.2% |
| Physical & Health Sciences | 0 | 0.0% |
| Psychology | 0 | 0.0% |
| Social Sciences | 0 | 0.0% |
| Engineering | 0 | 0.0% |
| Multidisciplinary Studies | 0 | 0.0% |
| Science & Technology | 0 | 0.0% |
| Business | 4 | 19.1% |
| Education | 1 | 4.8% |
| Literature & Languages | 0 | 0.0% |
| Liberal Arts & History | 0 | 0.0% |
| Visual & Performing Arts | 0 | 0.0% |
| Communications | 0 | 0.0% |
| Arts & Humanities | 0 | 0.0% |
| Total | 21 | 100.0% |
Transportation & Commute in Rosman
Vehicle Availability by Sex in Rosman
The most prevalent vehicle ownership categories in Rosman are males with 2 vehicles (68, accounting for 40.5%) and females with 2 vehicles (34, making up 79.1%).
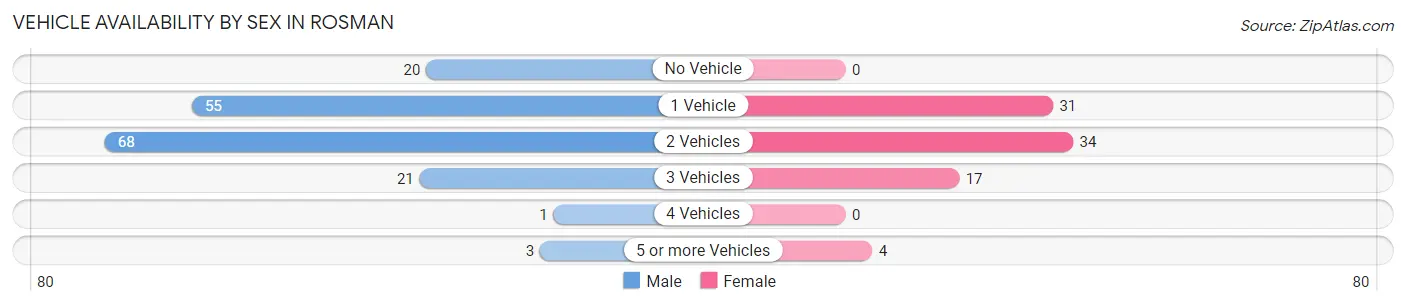
| Vehicles Available | Male | Female |
| No Vehicle | 20 (11.9%) | 0 (0.0%) |
| 1 Vehicle | 55 (32.7%) | 31 (36.0%) |
| 2 Vehicles | 68 (40.5%) | 34 (39.5%) |
| 3 Vehicles | 21 (12.5%) | 17 (19.8%) |
| 4 Vehicles | 1 (0.6%) | 0 (0.0%) |
| 5 or more Vehicles | 3 (1.8%) | 4 (4.6%) |
| Total | 168 (100.0%) | 86 (100.0%) |
Commute Time in Rosman
The most frequently occuring commute durations in Rosman are 15 to 19 minutes (108 commuters, 43.4%), 20 to 24 minutes (49 commuters, 19.7%), and 10 to 14 minutes (27 commuters, 10.8%).
| Commute Time | # Commuters | % Commuters |
| Less than 5 Minutes | 7 | 2.8% |
| 5 to 9 Minutes | 23 | 9.2% |
| 10 to 14 Minutes | 27 | 10.8% |
| 15 to 19 Minutes | 108 | 43.4% |
| 20 to 24 Minutes | 49 | 19.7% |
| 25 to 29 Minutes | 1 | 0.4% |
| 30 to 34 Minutes | 14 | 5.6% |
| 35 to 39 Minutes | 0 | 0.0% |
| 40 to 44 Minutes | 0 | 0.0% |
| 45 to 59 Minutes | 5 | 2.0% |
| 60 to 89 Minutes | 15 | 6.0% |
| 90 or more Minutes | 0 | 0.0% |
Commute Time by Sex in Rosman
The most common commute times in Rosman are 15 to 19 minutes (83 commuters, 49.4%) for males and 15 to 19 minutes (25 commuters, 30.9%) for females.
| Commute Time | Male | Female |
| Less than 5 Minutes | 1 (0.6%) | 6 (7.4%) |
| 5 to 9 Minutes | 16 (9.5%) | 7 (8.6%) |
| 10 to 14 Minutes | 22 (13.1%) | 5 (6.2%) |
| 15 to 19 Minutes | 83 (49.4%) | 25 (30.9%) |
| 20 to 24 Minutes | 24 (14.3%) | 25 (30.9%) |
| 25 to 29 Minutes | 0 (0.0%) | 1 (1.2%) |
| 30 to 34 Minutes | 14 (8.3%) | 0 (0.0%) |
| 35 to 39 Minutes | 0 (0.0%) | 0 (0.0%) |
| 40 to 44 Minutes | 0 (0.0%) | 0 (0.0%) |
| 45 to 59 Minutes | 1 (0.6%) | 4 (4.9%) |
| 60 to 89 Minutes | 7 (4.2%) | 8 (9.9%) |
| 90 or more Minutes | 0 (0.0%) | 0 (0.0%) |
Time of Departure to Work by Sex in Rosman
The most frequent times of departure to work in Rosman are 5:30 AM to 5:59 AM (53, 31.6%) for males and 7:30 AM to 7:59 AM (23, 28.4%) for females.
| Time of Departure | Male | Female |
| 12:00 AM to 4:59 AM | 8 (4.8%) | 0 (0.0%) |
| 5:00 AM to 5:29 AM | 0 (0.0%) | 0 (0.0%) |
| 5:30 AM to 5:59 AM | 53 (31.6%) | 0 (0.0%) |
| 6:00 AM to 6:29 AM | 0 (0.0%) | 0 (0.0%) |
| 6:30 AM to 6:59 AM | 40 (23.8%) | 10 (12.3%) |
| 7:00 AM to 7:29 AM | 34 (20.2%) | 7 (8.6%) |
| 7:30 AM to 7:59 AM | 14 (8.3%) | 23 (28.4%) |
| 8:00 AM to 8:29 AM | 1 (0.6%) | 19 (23.5%) |
| 8:30 AM to 8:59 AM | 0 (0.0%) | 0 (0.0%) |
| 9:00 AM to 9:59 AM | 5 (3.0%) | 0 (0.0%) |
| 10:00 AM to 10:59 AM | 0 (0.0%) | 10 (12.3%) |
| 11:00 AM to 11:59 AM | 0 (0.0%) | 6 (7.4%) |
| 12:00 PM to 3:59 PM | 13 (7.7%) | 6 (7.4%) |
| 4:00 PM to 11:59 PM | 0 (0.0%) | 0 (0.0%) |
| Total | 168 (100.0%) | 81 (100.0%) |
Housing Occupancy in Rosman
Occupancy by Ownership in Rosman
Of the total 364 dwellings in Rosman, owner-occupied units account for 112 (30.8%), while renter-occupied units make up 252 (69.2%).
| Occupancy | # Housing Units | % Housing Units |
| Owner Occupied Housing Units | 112 | 30.8% |
| Renter-Occupied Housing Units | 252 | 69.2% |
| Total Occupied Housing Units | 364 | 100.0% |
Occupancy by Household Size in Rosman
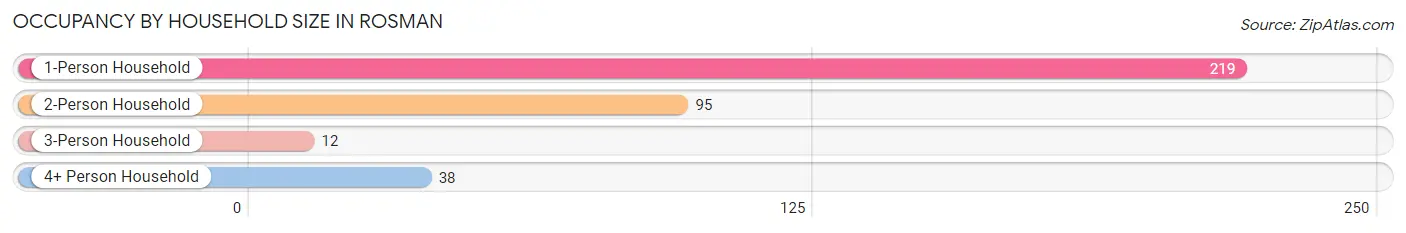
| Household Size | # Housing Units | % Housing Units |
| 1-Person Household | 219 | 60.2% |
| 2-Person Household | 95 | 26.1% |
| 3-Person Household | 12 | 3.3% |
| 4+ Person Household | 38 | 10.4% |
| Total Housing Units | 364 | 100.0% |
Occupancy by Ownership by Household Size in Rosman
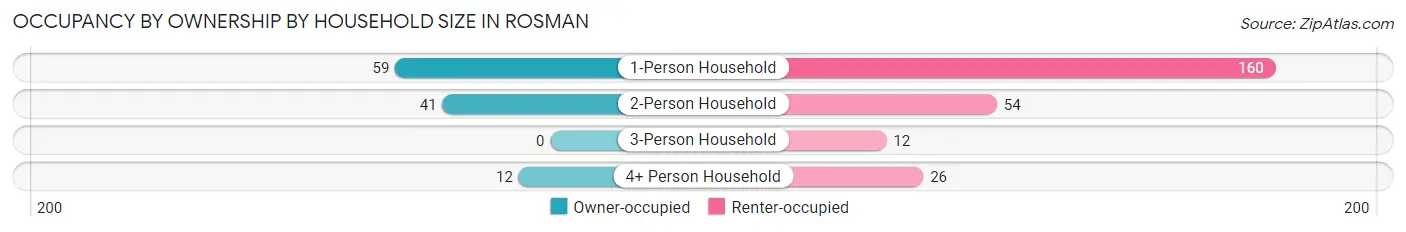
| Household Size | Owner-occupied | Renter-occupied |
| 1-Person Household | 59 (26.9%) | 160 (73.1%) |
| 2-Person Household | 41 (43.2%) | 54 (56.8%) |
| 3-Person Household | 0 (0.0%) | 12 (100.0%) |
| 4+ Person Household | 12 (31.6%) | 26 (68.4%) |
| Total Housing Units | 112 (30.8%) | 252 (69.2%) |
Occupancy by Educational Attainment in Rosman
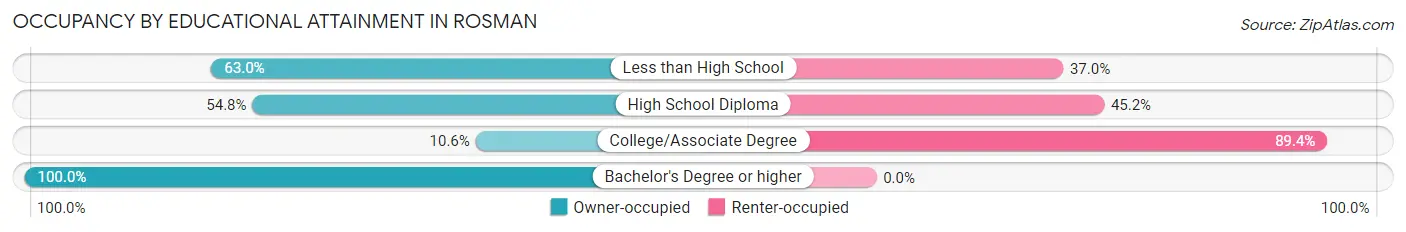
| Household Size | Owner-occupied | Renter-occupied |
| Less than High School | 17 (63.0%) | 10 (37.0%) |
| High School Diploma | 68 (54.8%) | 56 (45.2%) |
| College/Associate Degree | 22 (10.6%) | 186 (89.4%) |
| Bachelor's Degree or higher | 5 (100.0%) | 0 (0.0%) |
Occupancy by Age of Householder in Rosman
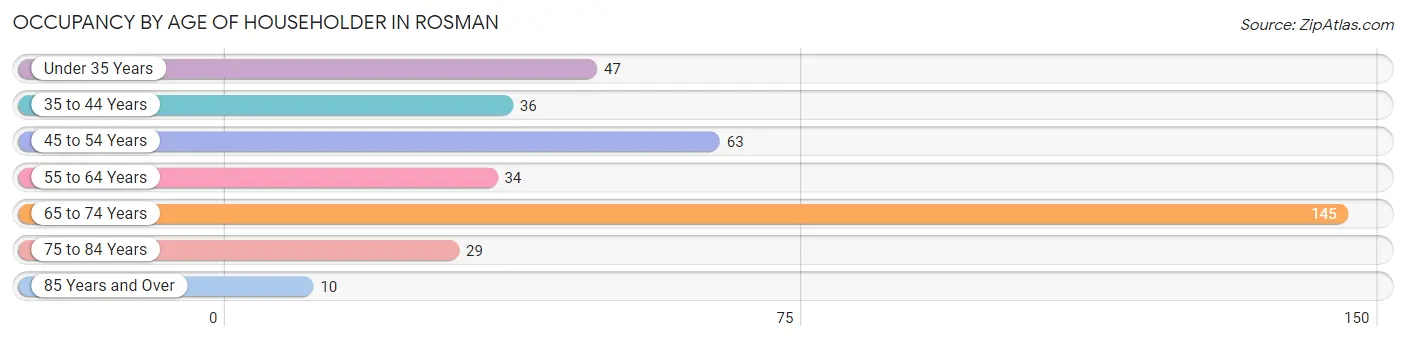
| Age Bracket | # Households | % Households |
| Under 35 Years | 47 | 12.9% |
| 35 to 44 Years | 36 | 9.9% |
| 45 to 54 Years | 63 | 17.3% |
| 55 to 64 Years | 34 | 9.3% |
| 65 to 74 Years | 145 | 39.8% |
| 75 to 84 Years | 29 | 8.0% |
| 85 Years and Over | 10 | 2.8% |
| Total | 364 | 100.0% |
Housing Finances in Rosman
Median Income by Occupancy in Rosman
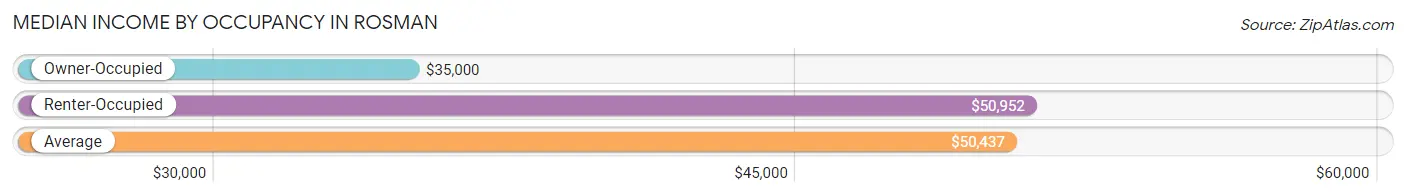
| Occupancy Type | # Households | Median Income |
| Owner-Occupied | 112 (30.8%) | $35,000 |
| Renter-Occupied | 252 (69.2%) | $50,952 |
| Average | 364 (100.0%) | $50,437 |
Occupancy by Householder Income Bracket in Rosman
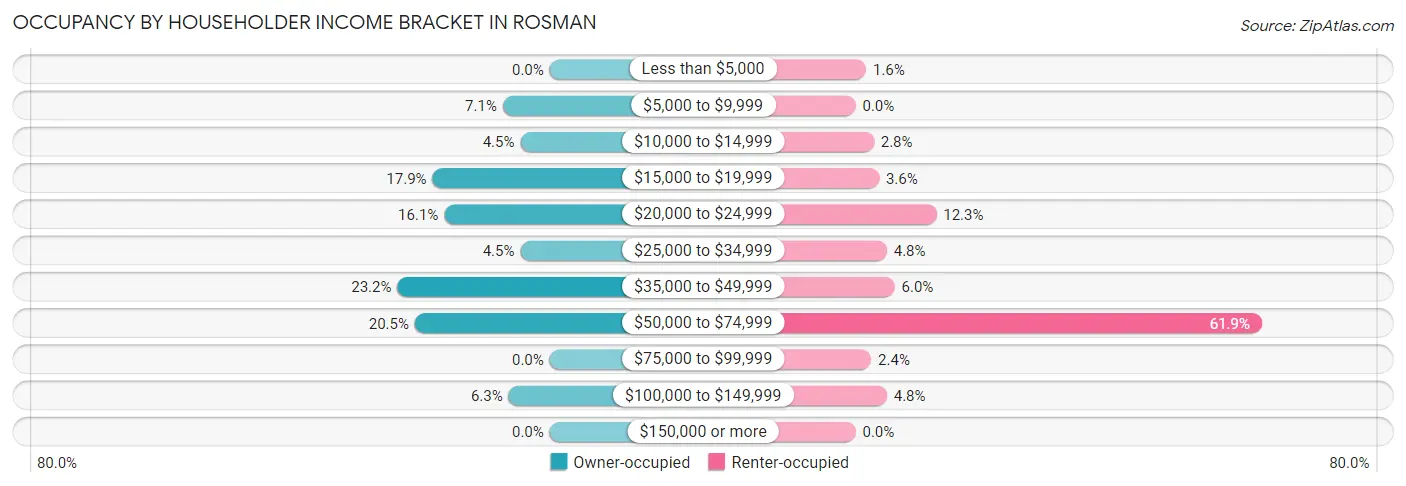
| Income Bracket | Owner-occupied | Renter-occupied |
| Less than $5,000 | 0 (0.0%) | 4 (1.6%) |
| $5,000 to $9,999 | 8 (7.1%) | 0 (0.0%) |
| $10,000 to $14,999 | 5 (4.5%) | 7 (2.8%) |
| $15,000 to $19,999 | 20 (17.9%) | 9 (3.6%) |
| $20,000 to $24,999 | 18 (16.1%) | 31 (12.3%) |
| $25,000 to $34,999 | 5 (4.5%) | 12 (4.8%) |
| $35,000 to $49,999 | 26 (23.2%) | 15 (5.9%) |
| $50,000 to $74,999 | 23 (20.5%) | 156 (61.9%) |
| $75,000 to $99,999 | 0 (0.0%) | 6 (2.4%) |
| $100,000 to $149,999 | 7 (6.2%) | 12 (4.8%) |
| $150,000 or more | 0 (0.0%) | 0 (0.0%) |
| Total | 112 (100.0%) | 252 (100.0%) |
Monthly Housing Cost Tiers in Rosman
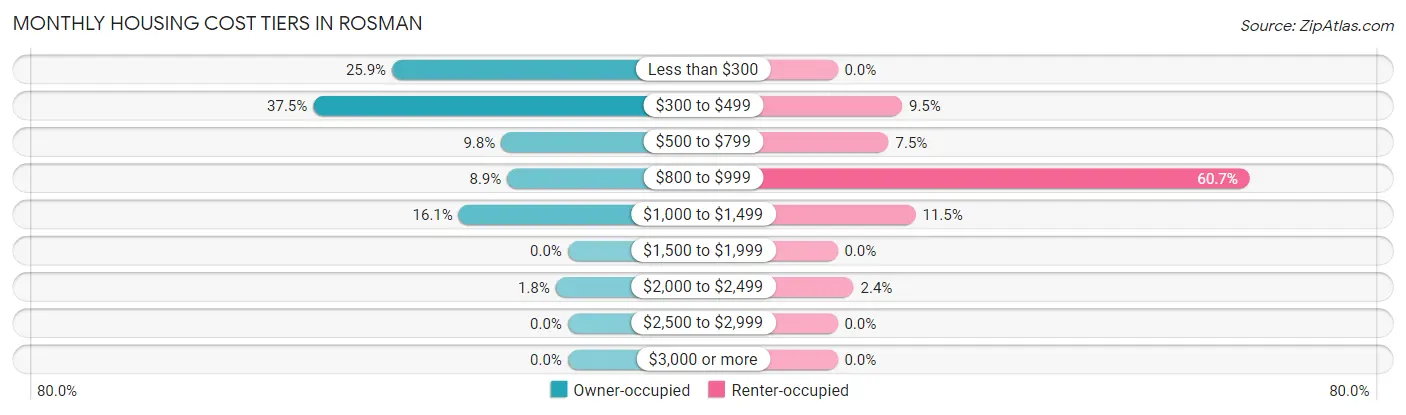
| Monthly Cost | Owner-occupied | Renter-occupied |
| Less than $300 | 29 (25.9%) | 0 (0.0%) |
| $300 to $499 | 42 (37.5%) | 24 (9.5%) |
| $500 to $799 | 11 (9.8%) | 19 (7.5%) |
| $800 to $999 | 10 (8.9%) | 153 (60.7%) |
| $1,000 to $1,499 | 18 (16.1%) | 29 (11.5%) |
| $1,500 to $1,999 | 0 (0.0%) | 0 (0.0%) |
| $2,000 to $2,499 | 2 (1.8%) | 6 (2.4%) |
| $2,500 to $2,999 | 0 (0.0%) | 0 (0.0%) |
| $3,000 or more | 0 (0.0%) | 0 (0.0%) |
| Total | 112 (100.0%) | 252 (100.0%) |
Physical Housing Characteristics in Rosman
Housing Structures in Rosman
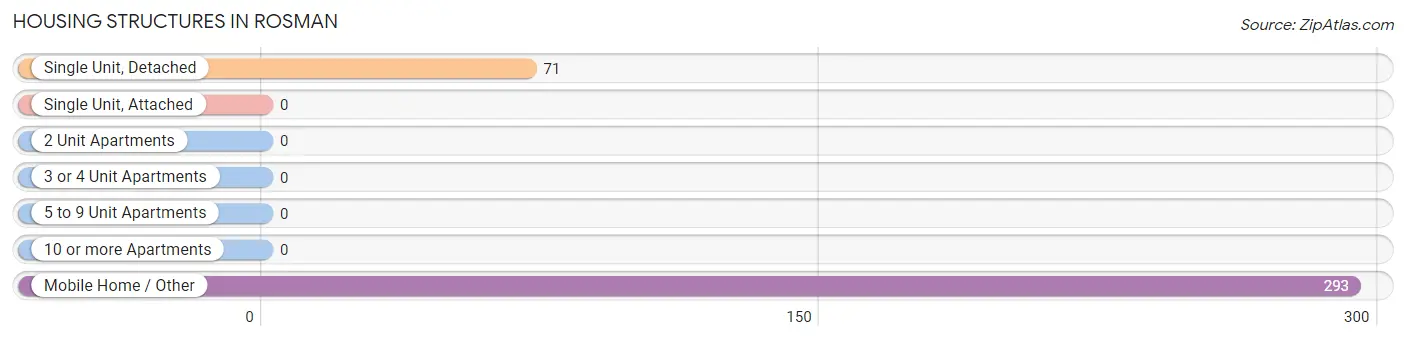
| Structure Type | # Housing Units | % Housing Units |
| Single Unit, Detached | 71 | 19.5% |
| Single Unit, Attached | 0 | 0.0% |
| 2 Unit Apartments | 0 | 0.0% |
| 3 or 4 Unit Apartments | 0 | 0.0% |
| 5 to 9 Unit Apartments | 0 | 0.0% |
| 10 or more Apartments | 0 | 0.0% |
| Mobile Home / Other | 293 | 80.5% |
| Total | 364 | 100.0% |
Housing Structures by Occupancy in Rosman
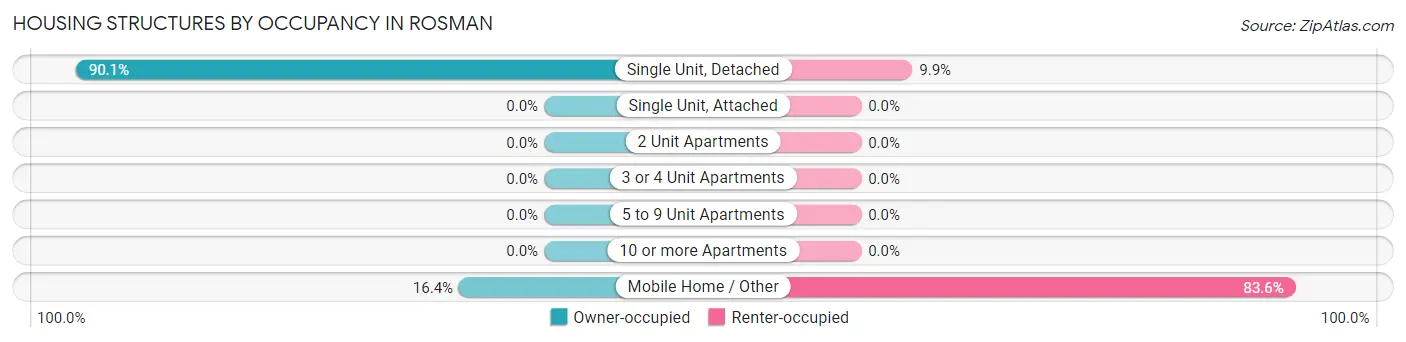
| Structure Type | Owner-occupied | Renter-occupied |
| Single Unit, Detached | 64 (90.1%) | 7 (9.9%) |
| Single Unit, Attached | 0 (0.0%) | 0 (0.0%) |
| 2 Unit Apartments | 0 (0.0%) | 0 (0.0%) |
| 3 or 4 Unit Apartments | 0 (0.0%) | 0 (0.0%) |
| 5 to 9 Unit Apartments | 0 (0.0%) | 0 (0.0%) |
| 10 or more Apartments | 0 (0.0%) | 0 (0.0%) |
| Mobile Home / Other | 48 (16.4%) | 245 (83.6%) |
| Total | 112 (30.8%) | 252 (69.2%) |
Housing Structures by Number of Rooms in Rosman
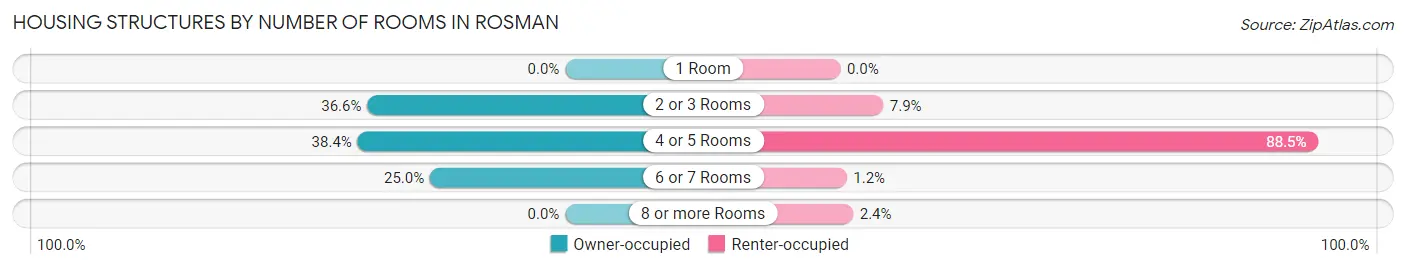
| Number of Rooms | Owner-occupied | Renter-occupied |
| 1 Room | 0 (0.0%) | 0 (0.0%) |
| 2 or 3 Rooms | 41 (36.6%) | 20 (7.9%) |
| 4 or 5 Rooms | 43 (38.4%) | 223 (88.5%) |
| 6 or 7 Rooms | 28 (25.0%) | 3 (1.2%) |
| 8 or more Rooms | 0 (0.0%) | 6 (2.4%) |
| Total | 112 (100.0%) | 252 (100.0%) |
Housing Structure by Heating Type in Rosman
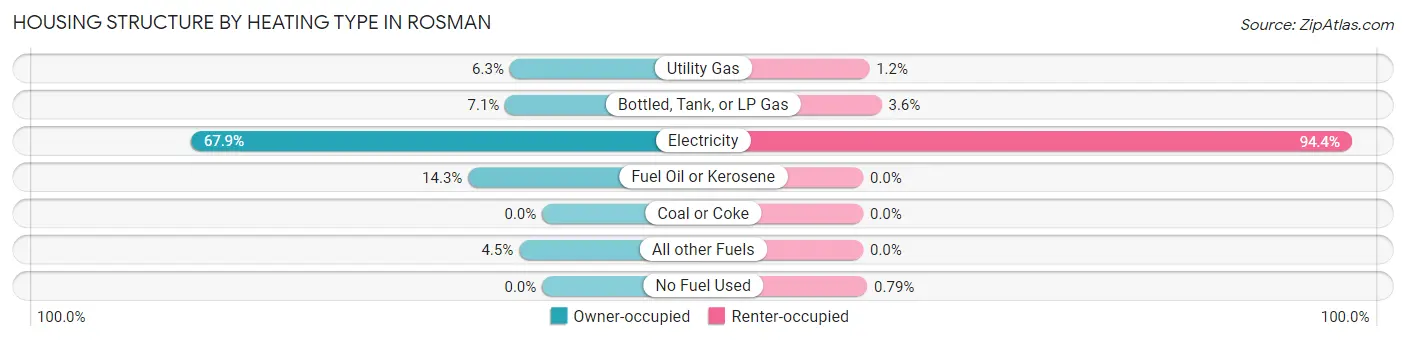
| Heating Type | Owner-occupied | Renter-occupied |
| Utility Gas | 7 (6.2%) | 3 (1.2%) |
| Bottled, Tank, or LP Gas | 8 (7.1%) | 9 (3.6%) |
| Electricity | 76 (67.9%) | 238 (94.4%) |
| Fuel Oil or Kerosene | 16 (14.3%) | 0 (0.0%) |
| Coal or Coke | 0 (0.0%) | 0 (0.0%) |
| All other Fuels | 5 (4.5%) | 0 (0.0%) |
| No Fuel Used | 0 (0.0%) | 2 (0.8%) |
| Total | 112 (100.0%) | 252 (100.0%) |
Household Vehicle Usage in Rosman
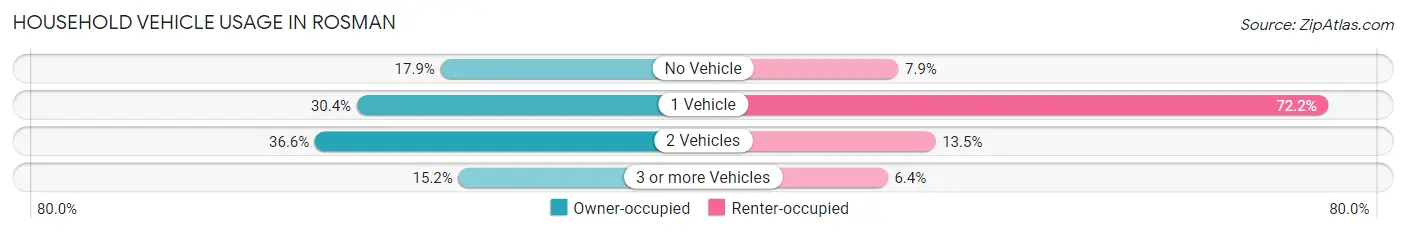
| Vehicles per Household | Owner-occupied | Renter-occupied |
| No Vehicle | 20 (17.9%) | 20 (7.9%) |
| 1 Vehicle | 34 (30.4%) | 182 (72.2%) |
| 2 Vehicles | 41 (36.6%) | 34 (13.5%) |
| 3 or more Vehicles | 17 (15.2%) | 16 (6.4%) |
| Total | 112 (100.0%) | 252 (100.0%) |
Real Estate & Mortgages in Rosman
Real Estate and Mortgage Overview in Rosman
| Characteristic | Without Mortgage | With Mortgage |
| Housing Units | 81 | 31 |
| Median Property Value | $91,900 | $0 |
| Median Household Income | $21,838 | $0 |
| Monthly Housing Costs | $427 | $0 |
| Real Estate Taxes | $700 | $8 |
Property Value by Mortgage Status in Rosman
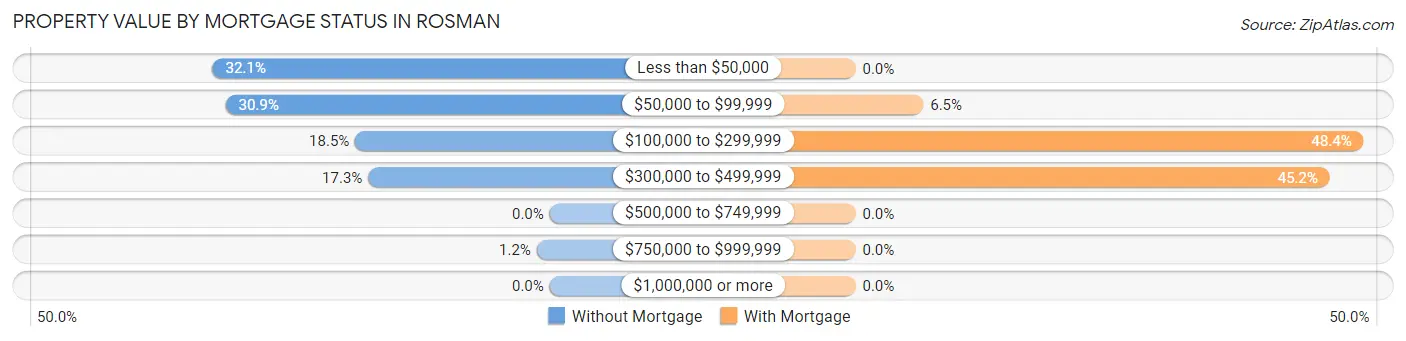
| Property Value | Without Mortgage | With Mortgage |
| Less than $50,000 | 26 (32.1%) | 0 (0.0%) |
| $50,000 to $99,999 | 25 (30.9%) | 2 (6.5%) |
| $100,000 to $299,999 | 15 (18.5%) | 15 (48.4%) |
| $300,000 to $499,999 | 14 (17.3%) | 14 (45.2%) |
| $500,000 to $749,999 | 0 (0.0%) | 0 (0.0%) |
| $750,000 to $999,999 | 1 (1.2%) | 0 (0.0%) |
| $1,000,000 or more | 0 (0.0%) | 0 (0.0%) |
| Total | 81 (100.0%) | 31 (100.0%) |
Household Income by Mortgage Status in Rosman
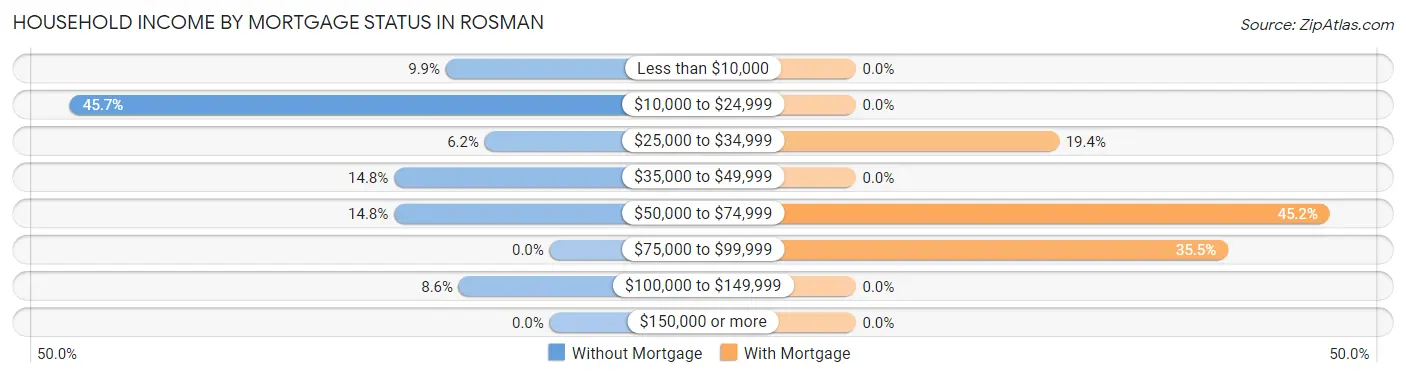
| Household Income | Without Mortgage | With Mortgage |
| Less than $10,000 | 8 (9.9%) | 0 (0.0%) |
| $10,000 to $24,999 | 37 (45.7%) | 0 (0.0%) |
| $25,000 to $34,999 | 5 (6.2%) | 6 (19.4%) |
| $35,000 to $49,999 | 12 (14.8%) | 0 (0.0%) |
| $50,000 to $74,999 | 12 (14.8%) | 14 (45.2%) |
| $75,000 to $99,999 | 0 (0.0%) | 11 (35.5%) |
| $100,000 to $149,999 | 7 (8.6%) | 0 (0.0%) |
| $150,000 or more | 0 (0.0%) | 0 (0.0%) |
| Total | 81 (100.0%) | 31 (100.0%) |
Property Value to Household Income Ratio in Rosman
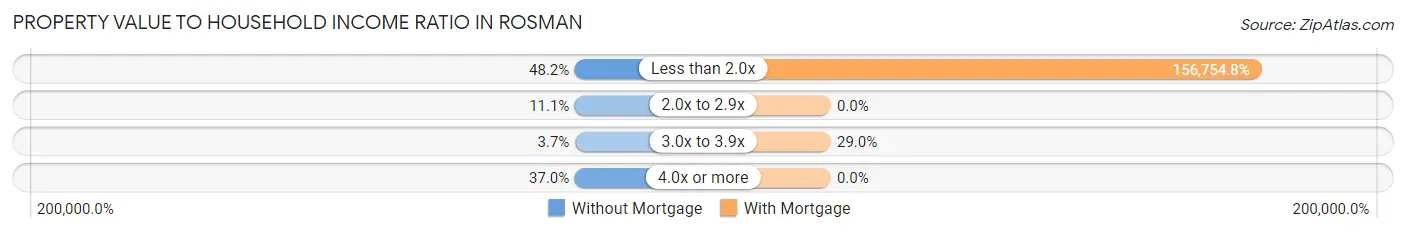
| Value-to-Income Ratio | Without Mortgage | With Mortgage |
| Less than 2.0x | 39 (48.1%) | 48,594 (156,754.8%) |
| 2.0x to 2.9x | 9 (11.1%) | 0 (0.0%) |
| 3.0x to 3.9x | 3 (3.7%) | 9 (29.0%) |
| 4.0x or more | 30 (37.0%) | 0 (0.0%) |
| Total | 81 (100.0%) | 31 (100.0%) |
Real Estate Taxes by Mortgage Status in Rosman
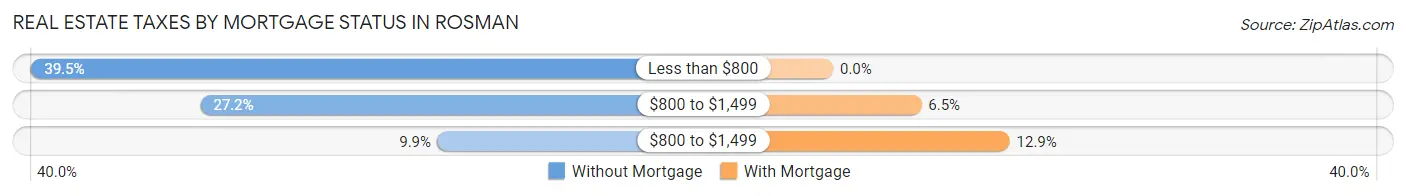
| Property Taxes | Without Mortgage | With Mortgage |
| Less than $800 | 32 (39.5%) | 0 (0.0%) |
| $800 to $1,499 | 22 (27.2%) | 2 (6.5%) |
| $800 to $1,499 | 8 (9.9%) | 4 (12.9%) |
| Total | 81 (100.0%) | 31 (100.0%) |
Health & Disability in Rosman
Health Insurance Coverage by Age in Rosman
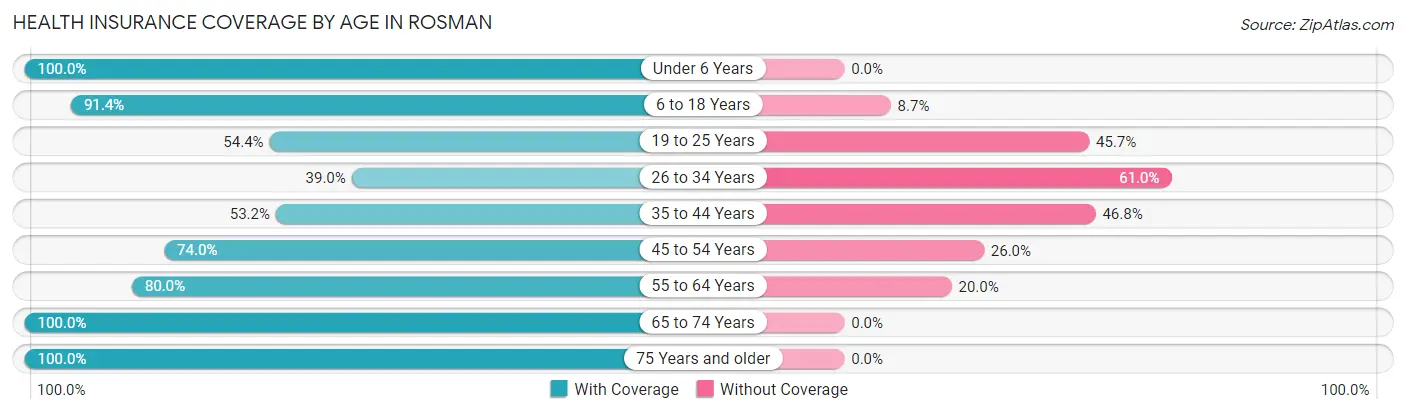
| Age Bracket | With Coverage | Without Coverage |
| Under 6 Years | 28 (100.0%) | 0 (0.0%) |
| 6 to 18 Years | 95 (91.3%) | 9 (8.6%) |
| 19 to 25 Years | 25 (54.3%) | 21 (45.7%) |
| 26 to 34 Years | 32 (39.0%) | 50 (61.0%) |
| 35 to 44 Years | 42 (53.2%) | 37 (46.8%) |
| 45 to 54 Years | 54 (74.0%) | 19 (26.0%) |
| 55 to 64 Years | 28 (80.0%) | 7 (20.0%) |
| 65 to 74 Years | 149 (100.0%) | 0 (0.0%) |
| 75 Years and older | 46 (100.0%) | 0 (0.0%) |
| Total | 499 (77.7%) | 143 (22.3%) |
Health Insurance Coverage by Citizenship Status in Rosman
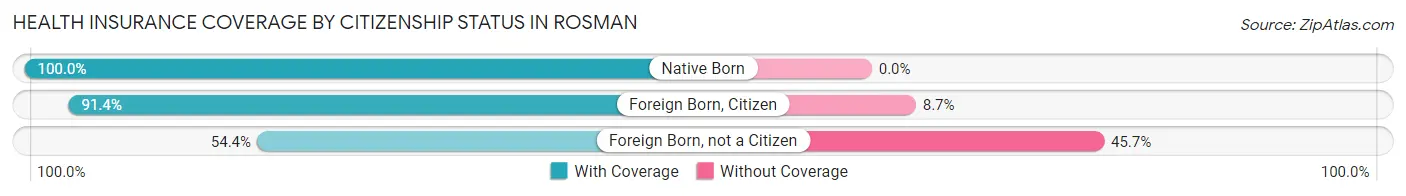
| Citizenship Status | With Coverage | Without Coverage |
| Native Born | 28 (100.0%) | 0 (0.0%) |
| Foreign Born, Citizen | 95 (91.3%) | 9 (8.6%) |
| Foreign Born, not a Citizen | 25 (54.3%) | 21 (45.7%) |
Health Insurance Coverage by Household Income in Rosman
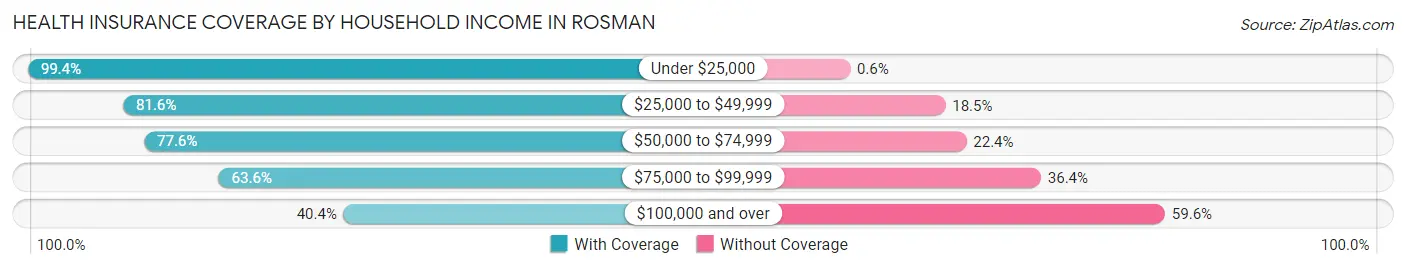
| Household Income | With Coverage | Without Coverage |
| Under $25,000 | 167 (99.4%) | 1 (0.6%) |
| $25,000 to $49,999 | 84 (81.6%) | 19 (18.4%) |
| $50,000 to $74,999 | 194 (77.6%) | 56 (22.4%) |
| $75,000 to $99,999 | 14 (63.6%) | 8 (36.4%) |
| $100,000 and over | 40 (40.4%) | 59 (59.6%) |
Public vs Private Health Insurance Coverage by Age in Rosman
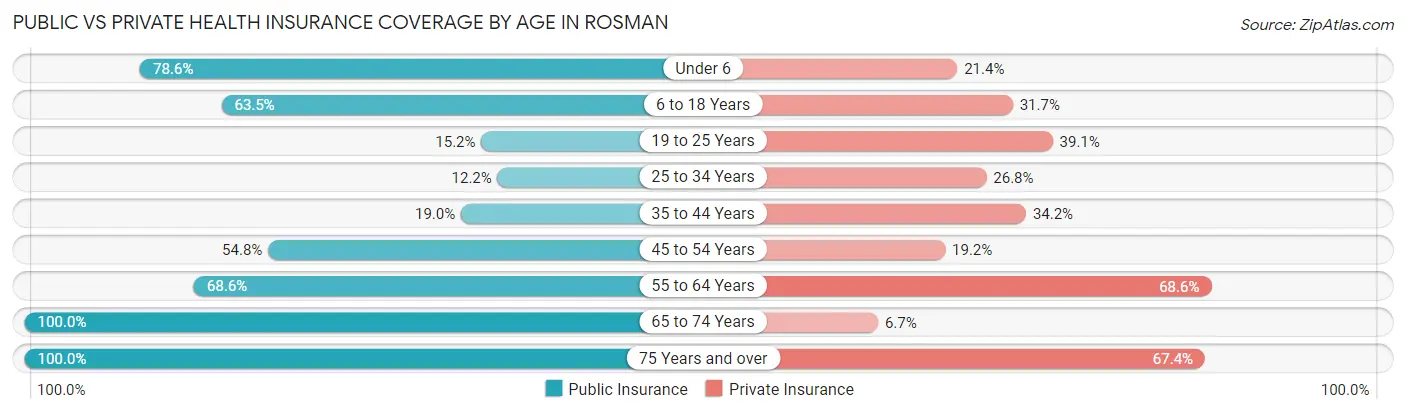
| Age Bracket | Public Insurance | Private Insurance |
| Under 6 | 22 (78.6%) | 6 (21.4%) |
| 6 to 18 Years | 66 (63.5%) | 33 (31.7%) |
| 19 to 25 Years | 7 (15.2%) | 18 (39.1%) |
| 25 to 34 Years | 10 (12.2%) | 22 (26.8%) |
| 35 to 44 Years | 15 (19.0%) | 27 (34.2%) |
| 45 to 54 Years | 40 (54.8%) | 14 (19.2%) |
| 55 to 64 Years | 24 (68.6%) | 24 (68.6%) |
| 65 to 74 Years | 149 (100.0%) | 10 (6.7%) |
| 75 Years and over | 46 (100.0%) | 31 (67.4%) |
| Total | 379 (59.0%) | 185 (28.8%) |
Disability Status by Sex by Age in Rosman
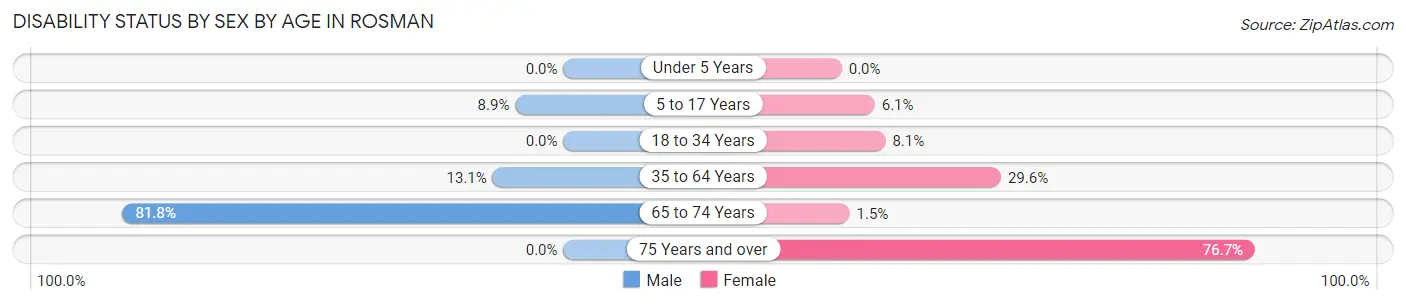
| Age Bracket | Male | Female |
| Under 5 Years | 0 (0.0%) | 0 (0.0%) |
| 5 to 17 Years | 5 (8.9%) | 3 (6.1%) |
| 18 to 34 Years | 0 (0.0%) | 3 (8.1%) |
| 35 to 64 Years | 13 (13.1%) | 26 (29.5%) |
| 65 to 74 Years | 9 (81.8%) | 2 (1.5%) |
| 75 Years and over | 0 (0.0%) | 23 (76.7%) |
Disability Class by Sex by Age in Rosman
Disability Class: Hearing Difficulty
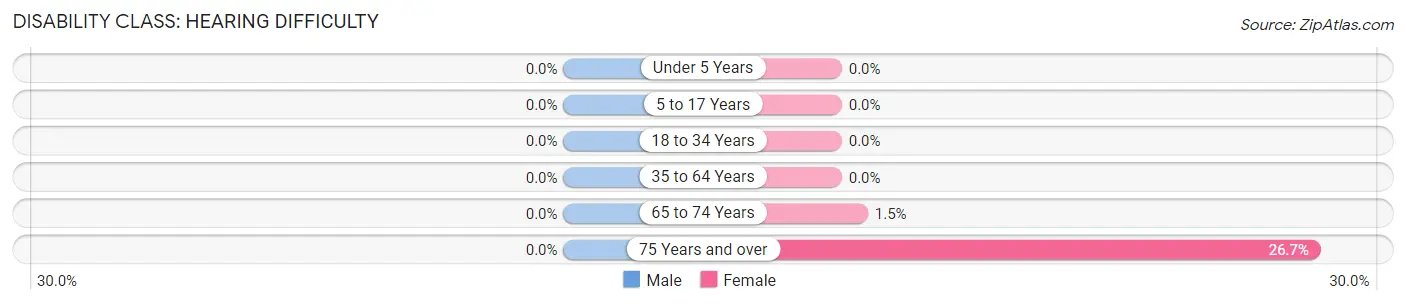
| Age Bracket | Male | Female |
| Under 5 Years | 0 (0.0%) | 0 (0.0%) |
| 5 to 17 Years | 0 (0.0%) | 0 (0.0%) |
| 18 to 34 Years | 0 (0.0%) | 0 (0.0%) |
| 35 to 64 Years | 0 (0.0%) | 0 (0.0%) |
| 65 to 74 Years | 0 (0.0%) | 2 (1.5%) |
| 75 Years and over | 0 (0.0%) | 8 (26.7%) |
Disability Class: Vision Difficulty
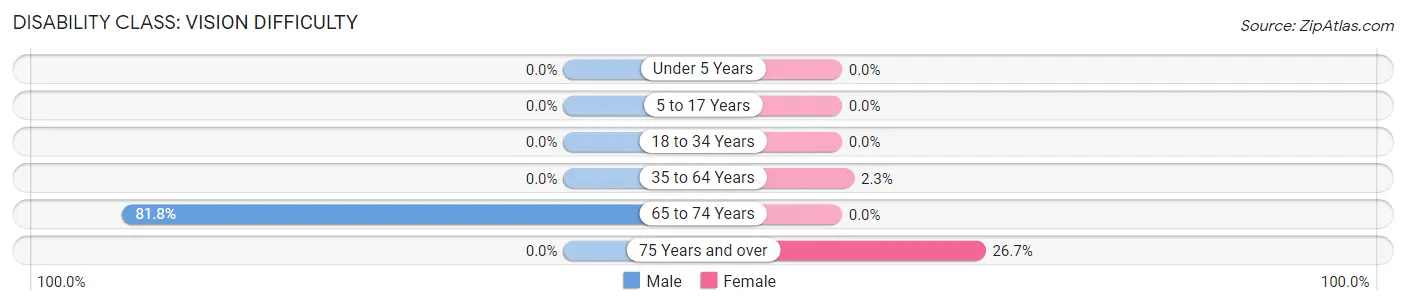
| Age Bracket | Male | Female |
| Under 5 Years | 0 (0.0%) | 0 (0.0%) |
| 5 to 17 Years | 0 (0.0%) | 0 (0.0%) |
| 18 to 34 Years | 0 (0.0%) | 0 (0.0%) |
| 35 to 64 Years | 0 (0.0%) | 2 (2.3%) |
| 65 to 74 Years | 9 (81.8%) | 0 (0.0%) |
| 75 Years and over | 0 (0.0%) | 8 (26.7%) |
Disability Class: Cognitive Difficulty
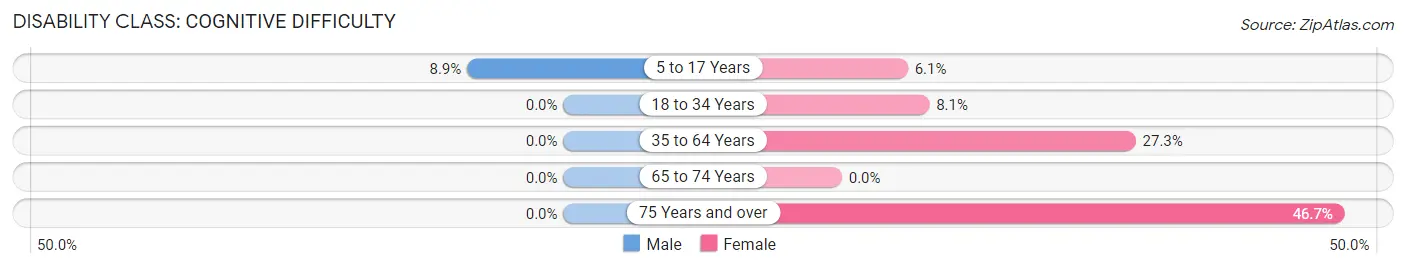
| Age Bracket | Male | Female |
| 5 to 17 Years | 5 (8.9%) | 3 (6.1%) |
| 18 to 34 Years | 0 (0.0%) | 3 (8.1%) |
| 35 to 64 Years | 0 (0.0%) | 24 (27.3%) |
| 65 to 74 Years | 0 (0.0%) | 0 (0.0%) |
| 75 Years and over | 0 (0.0%) | 14 (46.7%) |
Disability Class: Ambulatory Difficulty
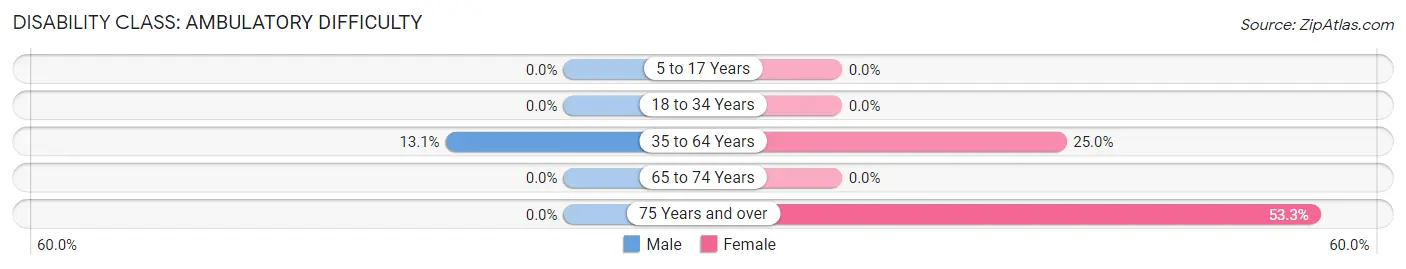
| Age Bracket | Male | Female |
| 5 to 17 Years | 0 (0.0%) | 0 (0.0%) |
| 18 to 34 Years | 0 (0.0%) | 0 (0.0%) |
| 35 to 64 Years | 13 (13.1%) | 22 (25.0%) |
| 65 to 74 Years | 0 (0.0%) | 0 (0.0%) |
| 75 Years and over | 0 (0.0%) | 16 (53.3%) |
Disability Class: Self-Care Difficulty
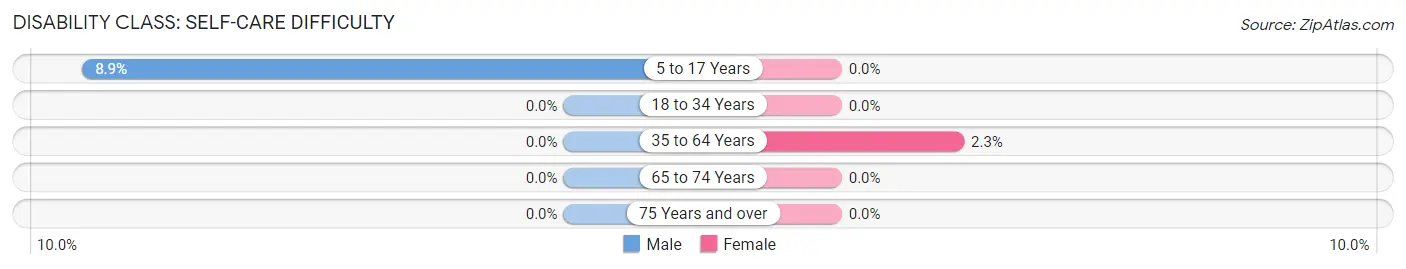
| Age Bracket | Male | Female |
| 5 to 17 Years | 5 (8.9%) | 0 (0.0%) |
| 18 to 34 Years | 0 (0.0%) | 0 (0.0%) |
| 35 to 64 Years | 0 (0.0%) | 2 (2.3%) |
| 65 to 74 Years | 0 (0.0%) | 0 (0.0%) |
| 75 Years and over | 0 (0.0%) | 0 (0.0%) |
Technology Access in Rosman
Computing Device Access in Rosman
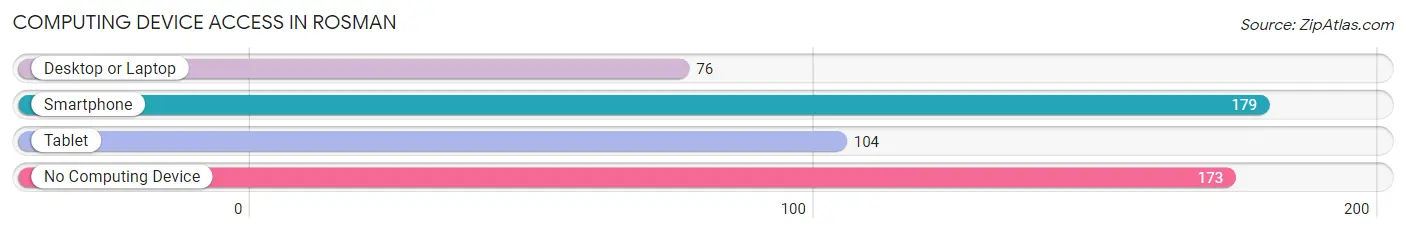
| Device Type | # Households | % Households |
| Desktop or Laptop | 76 | 20.9% |
| Smartphone | 179 | 49.2% |
| Tablet | 104 | 28.6% |
| No Computing Device | 173 | 47.5% |
| Total | 364 | 100.0% |
Internet Access in Rosman
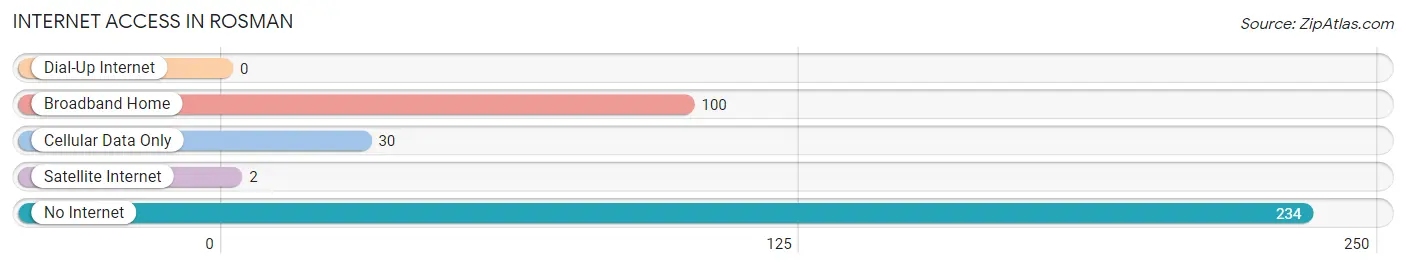
| Internet Type | # Households | % Households |
| Dial-Up Internet | 0 | 0.0% |
| Broadband Home | 100 | 27.5% |
| Cellular Data Only | 30 | 8.2% |
| Satellite Internet | 2 | 0.5% |
| No Internet | 234 | 64.3% |
| Total | 364 | 100.0% |
Rosman Summary
Rosman is a small town located in Transylvania County, North Carolina. It is situated in the Blue Ridge Mountains, and is part of the Appalachian region. The town was founded in 1875 and is named after the Rosman family, who were early settlers in the area. The population of Rosman was estimated to be 845 in 2019.
Geography
Rosman is located in the Blue Ridge Mountains of western North Carolina. The town is situated in the French Broad River Valley, and is surrounded by the Pisgah National Forest. The town is located at an elevation of 2,000 feet, and is approximately 25 miles from Asheville. The climate in Rosman is mild, with temperatures ranging from the mid-30s in the winter to the mid-80s in the summer.
Economy
The economy of Rosman is largely based on tourism and agriculture. The town is home to several tourist attractions, including the Pisgah National Forest, the Blue Ridge Parkway, and the Great Smoky Mountains National Park. The town is also home to several wineries, breweries, and distilleries. Agriculture is also an important part of the local economy, with the town being home to several farms and orchards.
Demographics
The population of Rosman was estimated to be 845 in 2019. The town is predominantly white, with the majority of the population being of European descent. The median household income in Rosman is $37,000, and the median home value is $150,000. The town has a low unemployment rate, and the poverty rate is below the national average.
Conclusion
Rosman is a small town located in Transylvania County, North Carolina. It is situated in the Blue Ridge Mountains, and is part of the Appalachian region. The town was founded in 1875 and is named after the Rosman family, who were early settlers in the area. The economy of Rosman is largely based on tourism and agriculture, and the population of the town was estimated to be 845 in 2019. The town is predominantly white, with the majority of the population being of European descent. The median household income in Rosman is $37,000, and the median home value is $150,000. The town has a low unemployment rate, and the poverty rate is below the national average.
Common Questions
What is Per Capita Income in Rosman?
Per Capita income in Rosman is $27,736.
What is the Median Family Income in Rosman?
Median Family Income in Rosman is $46,250.
What is the Median Household income in Rosman?
Median Household Income in Rosman is $50,437.
What is Income or Wage Gap in Rosman?
Income or Wage Gap in Rosman is 22.7%.
Women in Rosman earn 77.3 cents for every dollar earned by a man.
What is Inequality or Gini Index in Rosman?
Inequality or Gini Index in Rosman is 0.28.
What is the Total Population of Rosman?
Total Population of Rosman is 642.
What is the Total Male Population of Rosman?
Total Male Population of Rosman is 288.
What is the Total Female Population of Rosman?
Total Female Population of Rosman is 354.
What is the Ratio of Males per 100 Females in Rosman?
There are 81.36 Males per 100 Females in Rosman.
What is the Ratio of Females per 100 Males in Rosman?
There are 122.92 Females per 100 Males in Rosman.
What is the Median Population Age in Rosman?
Median Population Age in Rosman is 41.4 Years.
What is the Average Family Size in Rosman
Average Family Size in Rosman is 2.7 People.
What is the Average Household Size in Rosman
Average Household Size in Rosman is 1.8 People.
How Large is the Labor Force in Rosman?
There are 277 People in the Labor Forcein in Rosman.
What is the Percentage of People in the Labor Force in Rosman?
51.5% of People are in the Labor Force in Rosman.
What is the Unemployment Rate in Rosman?
Unemployment Rate in Rosman is 3.6%.