Princeville, NC Map & Demographics
Princeville Map
Princeville Overview
$19,444
PER CAPITA INCOME
$57,013
AVG FAMILY INCOME
$50,938
AVG HOUSEHOLD INCOME
13.6%
WAGE / INCOME GAP [ % ]
86.4¢/ $1
WAGE / INCOME GAP [ $ ]
0.39
INEQUALITY / GINI INDEX
1,630
TOTAL POPULATION
665
MALE POPULATION
965
FEMALE POPULATION
68.91
MALES / 100 FEMALES
145.11
FEMALES / 100 MALES
39.8
MEDIAN AGE
3.7
AVG FAMILY SIZE
2.8
AVG HOUSEHOLD SIZE
711
LABOR FORCE [ PEOPLE ]
56.3%
PERCENT IN LABOR FORCE
11.4%
UNEMPLOYMENT RATE
Princeville Area Codes
Income in Princeville
Income Overview in Princeville
Per Capita Income in Princeville is $19,444, while median incomes of families and households are $57,013 and $50,938 respectively.
| Characteristic | Number | Measure |
| Per Capita Income | 1,630 | $19,444 |
| Median Family Income | 365 | $57,013 |
| Mean Family Income | 365 | $60,557 |
| Median Household Income | 591 | $50,938 |
| Mean Household Income | 591 | $56,594 |
| Income Deficit | 365 | $0 |
| Wage / Income Gap (%) | 1,630 | 13.56% |
| Wage / Income Gap ($) | 1,630 | 86.44¢ per $1 |
| Gini / Inequality Index | 1,630 | 0.39 |
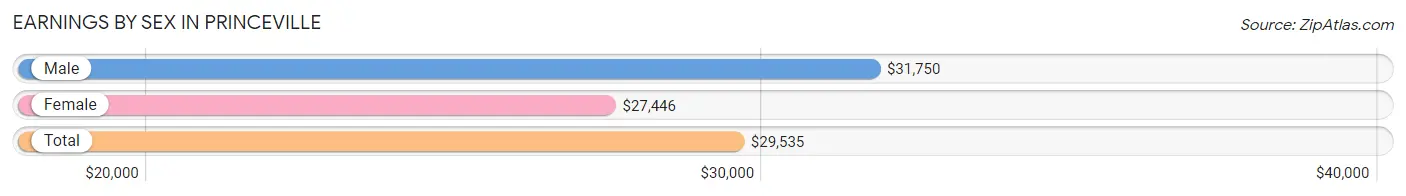
Earnings by Sex in Princeville
Average Earnings in Princeville are $29,535, $31,750 for men and $27,446 for women, a difference of 13.6%.
| Sex | Number | Average Earnings |
| Male | 347 (47.4%) | $31,750 |
| Female | 385 (52.6%) | $27,446 |
| Total | 732 (100.0%) | $29,535 |
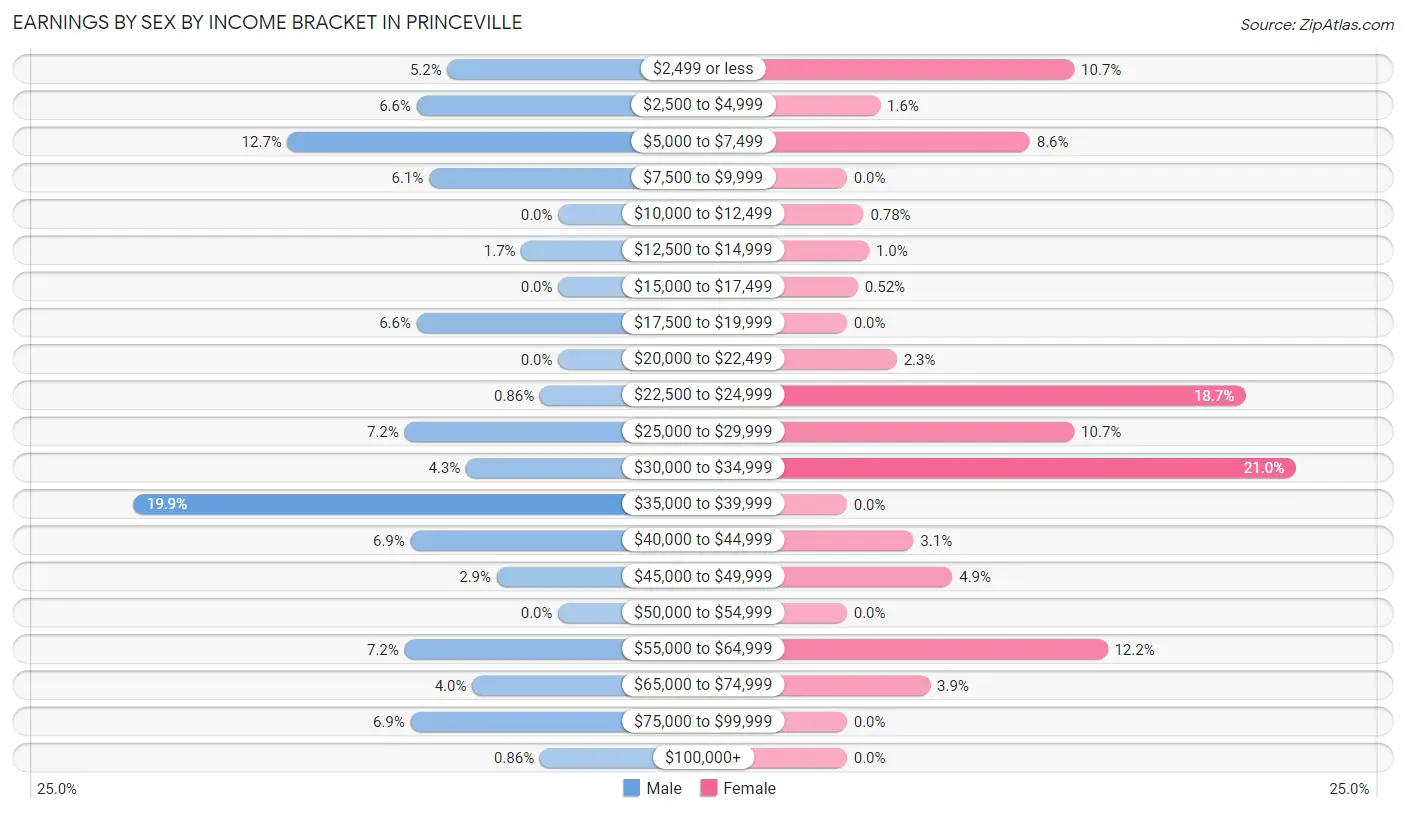
Earnings by Sex by Income Bracket in Princeville
The most common earnings brackets in Princeville are $35,000 to $39,999 for men (69 | 19.9%) and $30,000 to $34,999 for women (81 | 21.0%).
| Income | Male | Female |
| $2,499 or less | 18 (5.2%) | 41 (10.6%) |
| $2,500 to $4,999 | 23 (6.6%) | 6 (1.6%) |
| $5,000 to $7,499 | 44 (12.7%) | 33 (8.6%) |
| $7,500 to $9,999 | 21 (6.0%) | 0 (0.0%) |
| $10,000 to $12,499 | 0 (0.0%) | 3 (0.8%) |
| $12,500 to $14,999 | 6 (1.7%) | 4 (1.0%) |
| $15,000 to $17,499 | 0 (0.0%) | 2 (0.5%) |
| $17,500 to $19,999 | 23 (6.6%) | 0 (0.0%) |
| $20,000 to $22,499 | 0 (0.0%) | 9 (2.3%) |
| $22,500 to $24,999 | 3 (0.9%) | 72 (18.7%) |
| $25,000 to $29,999 | 25 (7.2%) | 41 (10.6%) |
| $30,000 to $34,999 | 15 (4.3%) | 81 (21.0%) |
| $35,000 to $39,999 | 69 (19.9%) | 0 (0.0%) |
| $40,000 to $44,999 | 24 (6.9%) | 12 (3.1%) |
| $45,000 to $49,999 | 10 (2.9%) | 19 (4.9%) |
| $50,000 to $54,999 | 0 (0.0%) | 0 (0.0%) |
| $55,000 to $64,999 | 25 (7.2%) | 47 (12.2%) |
| $65,000 to $74,999 | 14 (4.0%) | 15 (3.9%) |
| $75,000 to $99,999 | 24 (6.9%) | 0 (0.0%) |
| $100,000+ | 3 (0.9%) | 0 (0.0%) |
| Total | 347 (100.0%) | 385 (100.0%) |
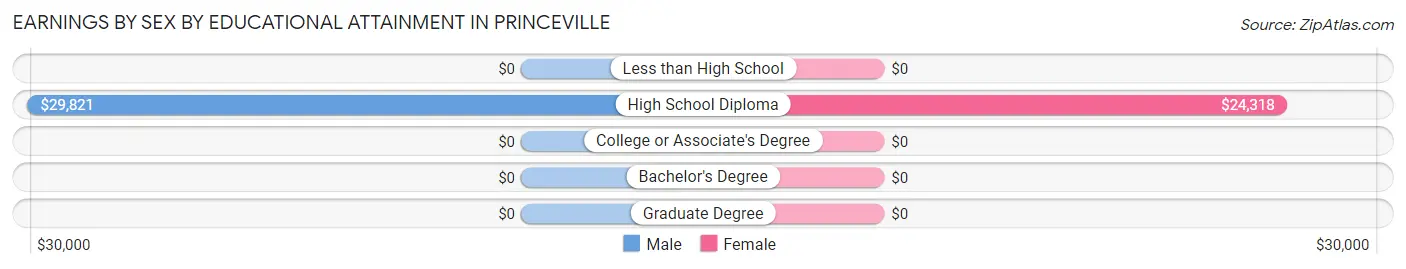
Earnings by Sex by Educational Attainment in Princeville
Average earnings in Princeville are $30,667 for men and $27,847 for women, a difference of 9.2%. Men with an educational attainment of high school diploma enjoy the highest average annual earnings of $29,821, while those with high school diploma education earn the least with $29,821. Women with an educational attainment of high school diploma earn the most with the average annual earnings of $24,318, while those with high school diploma education have the smallest earnings of $24,318.
| Educational Attainment | Male Income | Female Income |
| Less than High School | - | - |
| High School Diploma | $29,821 | $24,318 |
| College or Associate's Degree | - | - |
| Bachelor's Degree | - | - |
| Graduate Degree | - | - |
| Total | $30,667 | $27,847 |
Family Income in Princeville
Family Income Brackets in Princeville
According to the Princeville family income data, there are 110 families falling into the $50,000 to $74,999 income range, which is the most common income bracket and makes up 30.1% of all families.
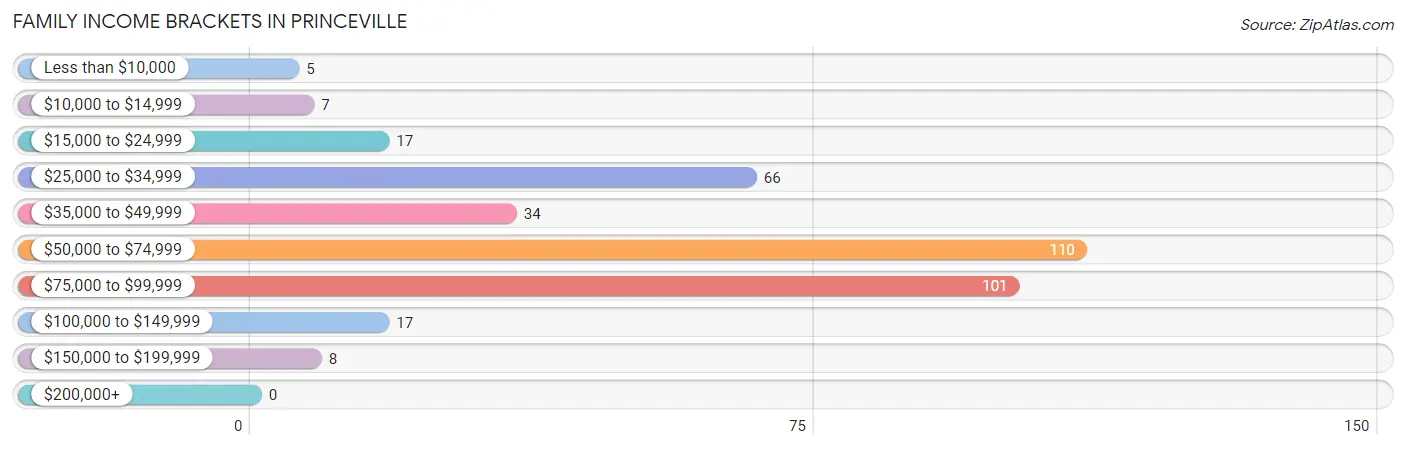
| Income Bracket | # Families | % Families |
| Less than $10,000 | 5 | 1.4% |
| $10,000 to $14,999 | 7 | 1.9% |
| $15,000 to $24,999 | 17 | 4.7% |
| $25,000 to $34,999 | 66 | 18.1% |
| $35,000 to $49,999 | 34 | 9.3% |
| $50,000 to $74,999 | 110 | 30.1% |
| $75,000 to $99,999 | 101 | 27.7% |
| $100,000 to $149,999 | 17 | 4.7% |
| $150,000 to $199,999 | 8 | 2.2% |
| $200,000+ | 0 | 0.0% |
Family Income by Famaliy Size in Princeville
4-person families (55 | 15.1%) account for the highest median family income in Princeville with $83,207 per family, while 2-person families (52 | 14.2%) have the highest median income of $26,666 per family member.
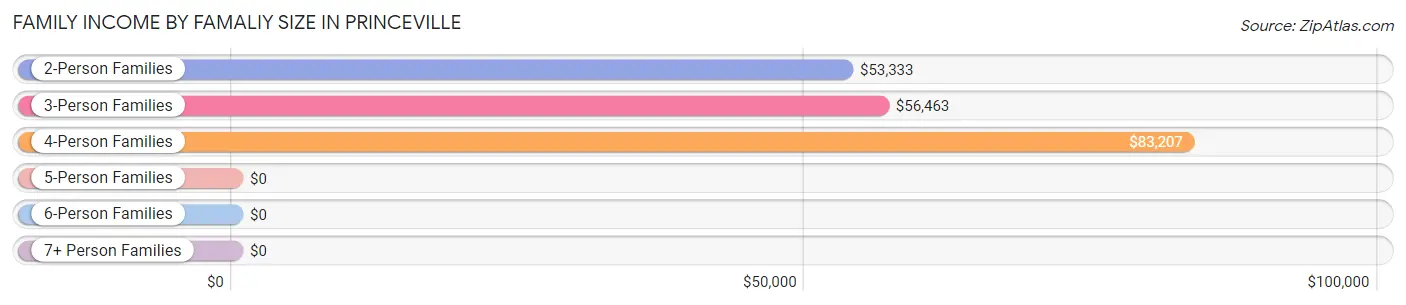
| Income Bracket | # Families | Median Income |
| 2-Person Families | 52 (14.2%) | $53,333 |
| 3-Person Families | 217 (59.5%) | $56,463 |
| 4-Person Families | 55 (15.1%) | $83,207 |
| 5-Person Families | 7 (1.9%) | $0 |
| 6-Person Families | 16 (4.4%) | $0 |
| 7+ Person Families | 18 (4.9%) | $0 |
| Total | 365 (100.0%) | $57,013 |
Family Income by Number of Earners in Princeville
The median family income in Princeville is $57,013, with families comprising 2 earners (47) having the highest median family income of $83,967, while families with no earners (15) have the lowest median family income of $35,250, accounting for 12.9% and 4.1% of families, respectively.
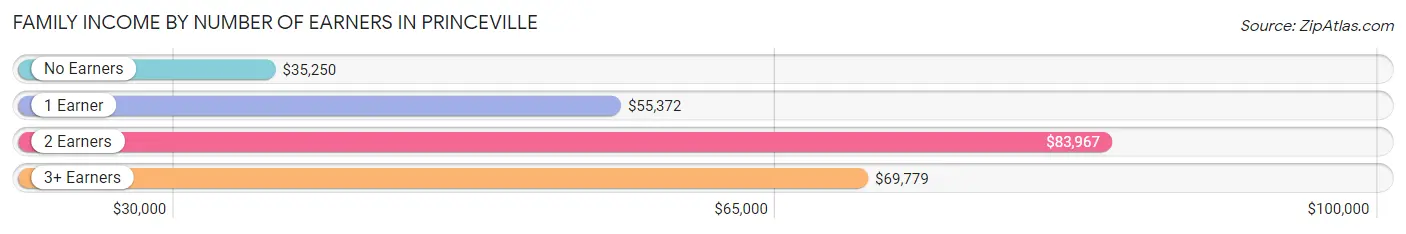
| Number of Earners | # Families | Median Income |
| No Earners | 15 (4.1%) | $35,250 |
| 1 Earner | 248 (67.9%) | $55,372 |
| 2 Earners | 47 (12.9%) | $83,967 |
| 3+ Earners | 55 (15.1%) | $69,779 |
| Total | 365 (100.0%) | $57,013 |
Household Income in Princeville
Household Income Brackets in Princeville
With 126 households falling in the category, the $50,000 to $74,999 income range is the most frequent in Princeville, accounting for 21.3% of all households.
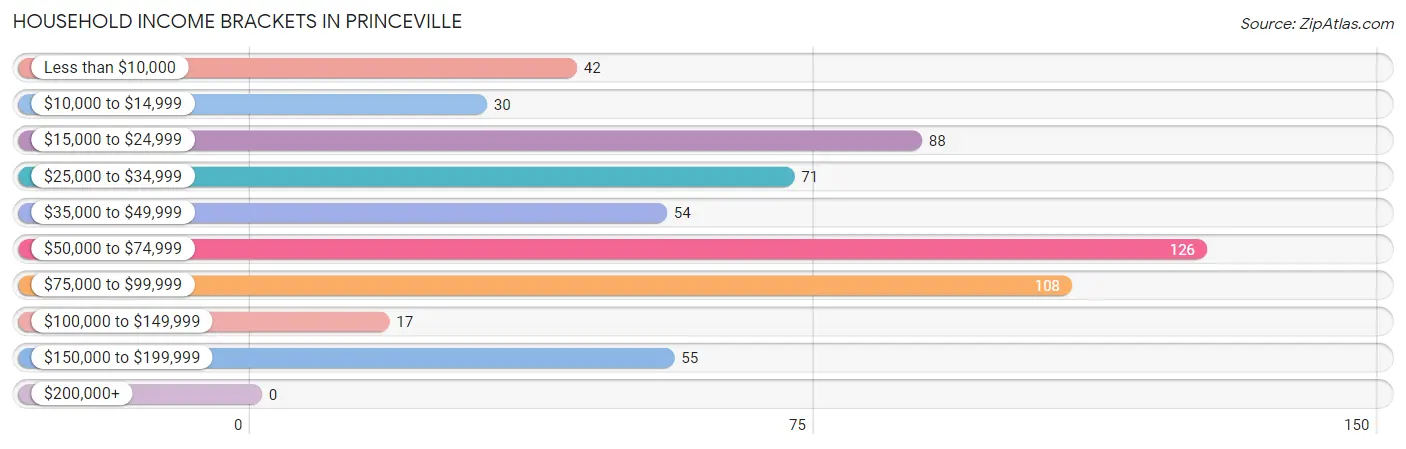
| Income Bracket | # Households | % Households |
| Less than $10,000 | 42 | 7.1% |
| $10,000 to $14,999 | 30 | 5.1% |
| $15,000 to $24,999 | 88 | 14.9% |
| $25,000 to $34,999 | 71 | 12.0% |
| $35,000 to $49,999 | 54 | 9.1% |
| $50,000 to $74,999 | 126 | 21.3% |
| $75,000 to $99,999 | 108 | 18.3% |
| $100,000 to $149,999 | 17 | 2.9% |
| $150,000 to $199,999 | 55 | 9.3% |
| $200,000+ | 0 | 0.0% |
Household Income by Householder Age in Princeville
The median household income in Princeville is $50,938, with the highest median household income of $70,250 found in the 25 to 44 years age bracket for the primary householder. A total of 166 households (28.1%) fall into this category.
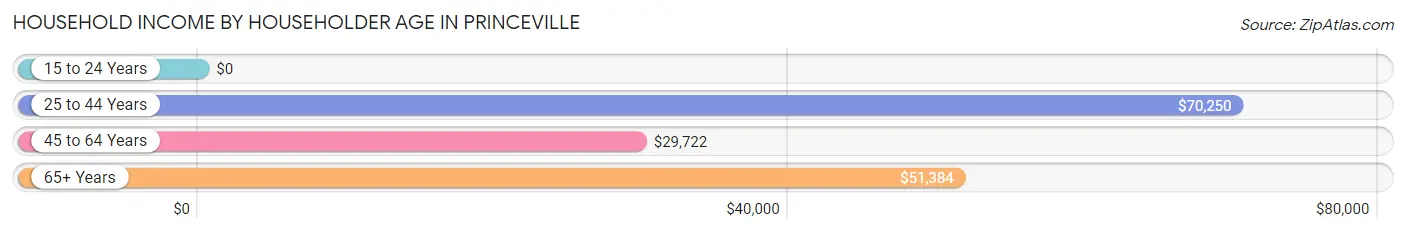
| Income Bracket | # Households | Median Income |
| 15 to 24 Years | 0 (0.0%) | $0 |
| 25 to 44 Years | 166 (28.1%) | $70,250 |
| 45 to 64 Years | 216 (36.5%) | $29,722 |
| 65+ Years | 209 (35.4%) | $51,384 |
| Total | 591 (100.0%) | $50,938 |
Poverty in Princeville
Income Below Poverty by Sex and Age in Princeville
With 18.3% poverty level for males and 20.5% for females among the residents of Princeville, 6 to 11 year old males and 5 year old females are the most vulnerable to poverty, with 30 males (46.2%) and 8 females (100.0%) in their respective age groups living below the poverty level.
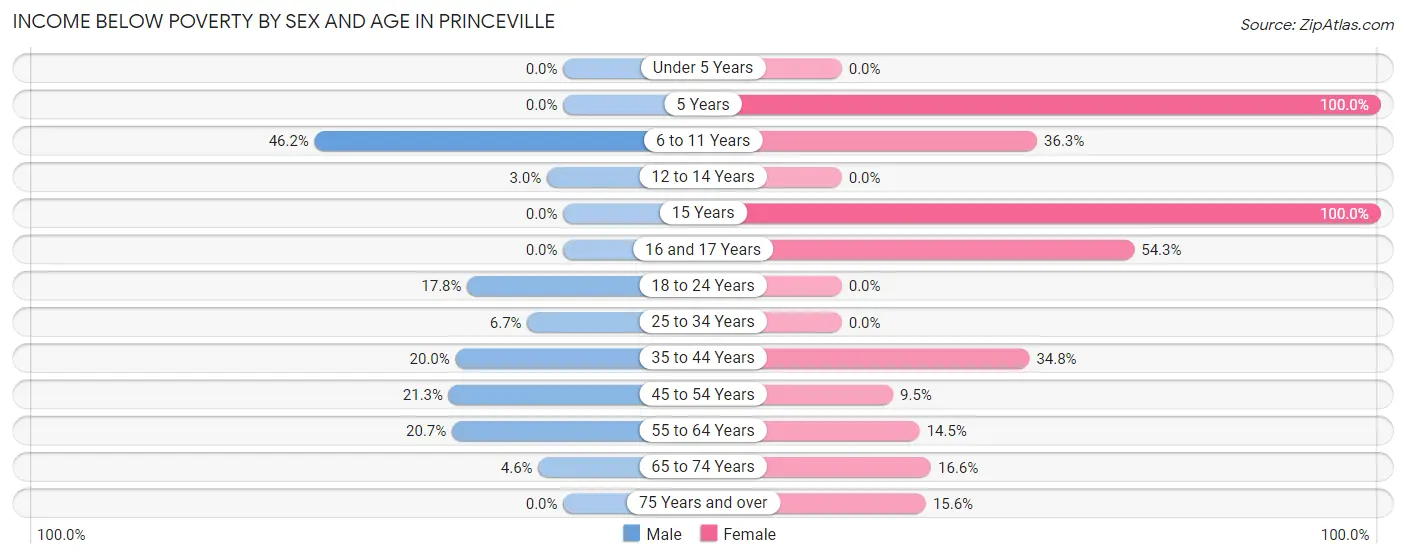
| Age Bracket | Male | Female |
| Under 5 Years | 0 (0.0%) | 0 (0.0%) |
| 5 Years | 0 (0.0%) | 8 (100.0%) |
| 6 to 11 Years | 30 (46.2%) | 58 (36.2%) |
| 12 to 14 Years | 1 (3.0%) | 0 (0.0%) |
| 15 Years | 0 (0.0%) | 7 (100.0%) |
| 16 and 17 Years | 0 (0.0%) | 38 (54.3%) |
| 18 to 24 Years | 18 (17.8%) | 0 (0.0%) |
| 25 to 34 Years | 1 (6.7%) | 0 (0.0%) |
| 35 to 44 Years | 20 (20.0%) | 31 (34.8%) |
| 45 to 54 Years | 17 (21.2%) | 8 (9.5%) |
| 55 to 64 Years | 32 (20.6%) | 12 (14.5%) |
| 65 to 74 Years | 3 (4.6%) | 31 (16.6%) |
| 75 Years and over | 0 (0.0%) | 5 (15.6%) |
| Total | 122 (18.3%) | 198 (20.5%) |
Income Above Poverty by Sex and Age in Princeville
According to the poverty statistics in Princeville, males aged under 5 years and females aged under 5 years are the age groups that are most secure financially, with 100.0% of males and 100.0% of females in these age groups living above the poverty line.
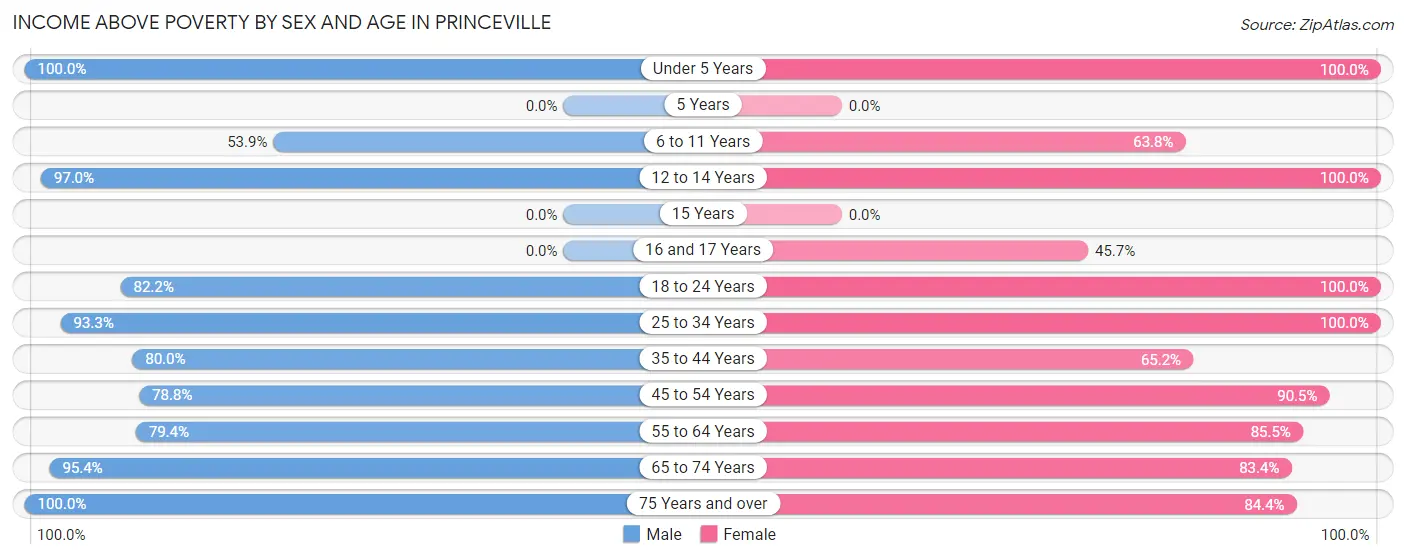
| Age Bracket | Male | Female |
| Under 5 Years | 24 (100.0%) | 32 (100.0%) |
| 5 Years | 0 (0.0%) | 0 (0.0%) |
| 6 to 11 Years | 35 (53.8%) | 102 (63.7%) |
| 12 to 14 Years | 32 (97.0%) | 39 (100.0%) |
| 15 Years | 0 (0.0%) | 0 (0.0%) |
| 16 and 17 Years | 0 (0.0%) | 32 (45.7%) |
| 18 to 24 Years | 83 (82.2%) | 41 (100.0%) |
| 25 to 34 Years | 14 (93.3%) | 133 (100.0%) |
| 35 to 44 Years | 80 (80.0%) | 58 (65.2%) |
| 45 to 54 Years | 63 (78.7%) | 76 (90.5%) |
| 55 to 64 Years | 123 (79.3%) | 71 (85.5%) |
| 65 to 74 Years | 62 (95.4%) | 156 (83.4%) |
| 75 Years and over | 27 (100.0%) | 27 (84.4%) |
| Total | 543 (81.7%) | 767 (79.5%) |
Income Below Poverty Among Married-Couple Families in Princeville
The poverty statistics for married-couple families in Princeville show that 0.7% or 1 of the total 152 families live below the poverty line. Families with 5 or more children have the highest poverty rate of 100.0%, comprising of 1 families. On the other hand, families with no children have the lowest poverty rate of 0.0%, which includes 0 families.
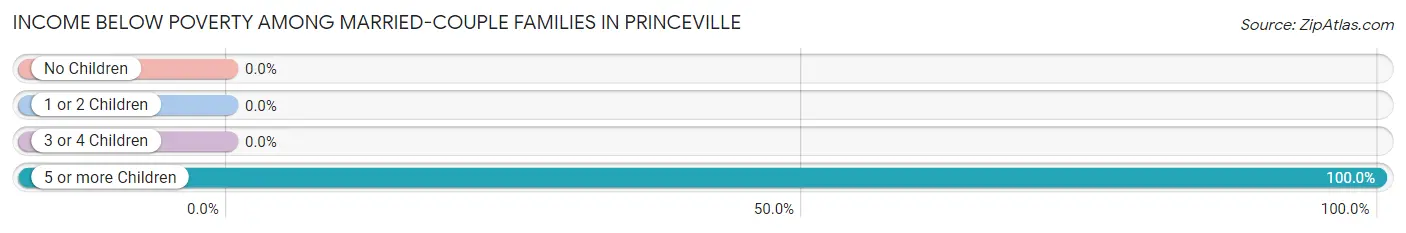
| Children | Above Poverty | Below Poverty |
| No Children | 112 (100.0%) | 0 (0.0%) |
| 1 or 2 Children | 22 (100.0%) | 0 (0.0%) |
| 3 or 4 Children | 17 (100.0%) | 0 (0.0%) |
| 5 or more Children | 0 (0.0%) | 1 (100.0%) |
| Total | 151 (99.3%) | 1 (0.7%) |
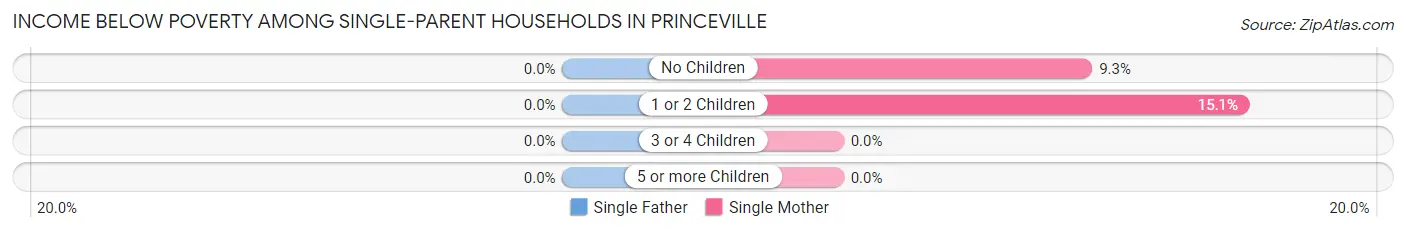
Income Below Poverty Among Single-Parent Households in Princeville
| Children | Single Father | Single Mother |
| No Children | 0 (0.0%) | 5 (9.3%) |
| 1 or 2 Children | 0 (0.0%) | 23 (15.1%) |
| 3 or 4 Children | 0 (0.0%) | 0 (0.0%) |
| 5 or more Children | 0 (0.0%) | 0 (0.0%) |
| Total | 0 (0.0%) | 28 (13.6%) |
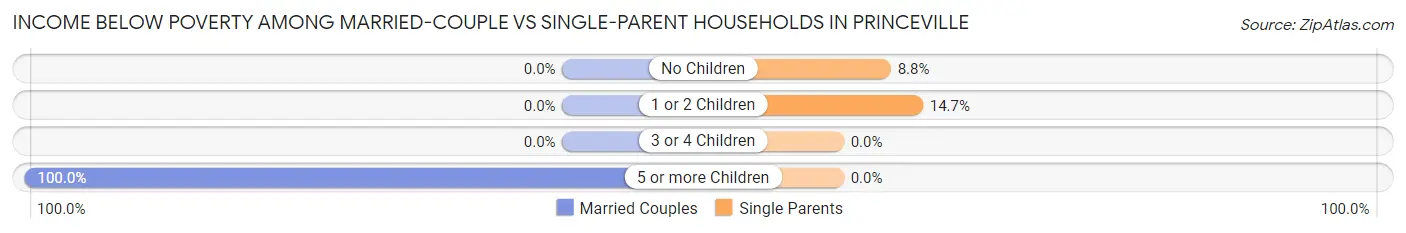
Income Below Poverty Among Married-Couple vs Single-Parent Households in Princeville
The poverty data for Princeville shows that 1 of the married-couple family households (0.7%) and 28 of the single-parent households (13.2%) are living below the poverty level. Within the married-couple family households, those with 5 or more children have the highest poverty rate, with 1 households (100.0%) falling below the poverty line. Among the single-parent households, those with 1 or 2 children have the highest poverty rate, with 23 household (14.7%) living below poverty.
| Children | Married-Couple Families | Single-Parent Households |
| No Children | 0 (0.0%) | 5 (8.8%) |
| 1 or 2 Children | 0 (0.0%) | 23 (14.7%) |
| 3 or 4 Children | 0 (0.0%) | 0 (0.0%) |
| 5 or more Children | 1 (100.0%) | 0 (0.0%) |
| Total | 1 (0.7%) | 28 (13.2%) |
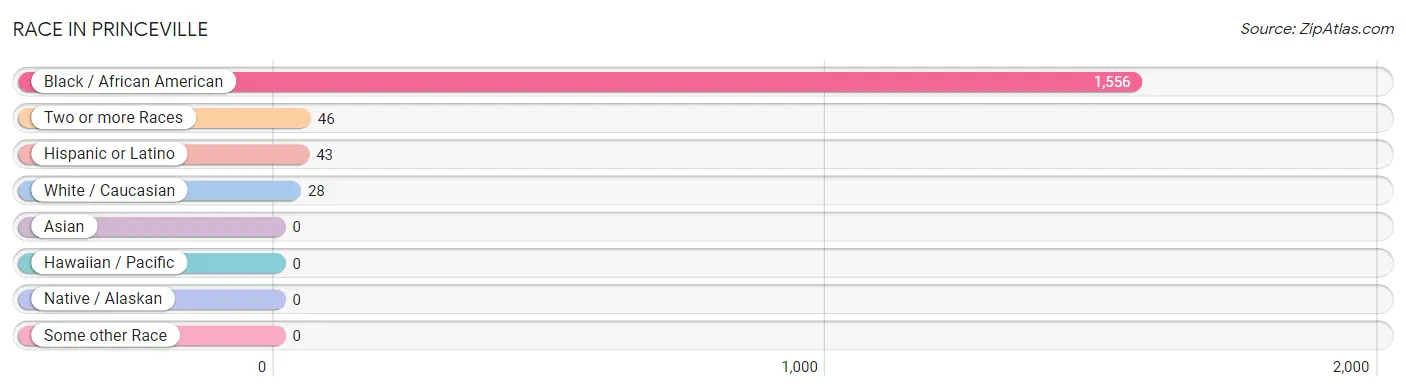
Race in Princeville
The most populous races in Princeville are Black / African American (1,556 | 95.5%), Two or more Races (46 | 2.8%), and Hispanic or Latino (43 | 2.6%).
| Race | # Population | % Population |
| Asian | 0 | 0.0% |
| Black / African American | 1,556 | 95.5% |
| Hawaiian / Pacific | 0 | 0.0% |
| Hispanic or Latino | 43 | 2.6% |
| Native / Alaskan | 0 | 0.0% |
| White / Caucasian | 28 | 1.7% |
| Two or more Races | 46 | 2.8% |
| Some other Race | 0 | 0.0% |
| Total | 1,630 | 100.0% |
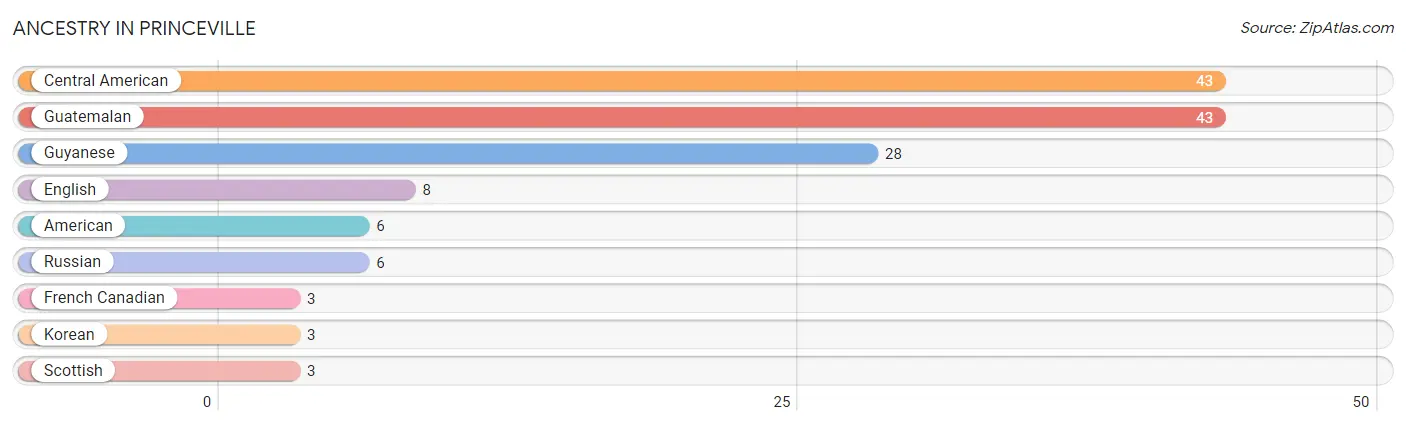
Ancestry in Princeville
The most populous ancestries reported in Princeville are Central American (43 | 2.6%), Guatemalan (43 | 2.6%), Guyanese (28 | 1.7%), English (8 | 0.5%), and American (6 | 0.4%), together accounting for 7.9% of all Princeville residents.
| Ancestry | # Population | % Population |
| American | 6 | 0.4% |
| Central American | 43 | 2.6% |
| English | 8 | 0.5% |
| French Canadian | 3 | 0.2% |
| Guatemalan | 43 | 2.6% |
| Guyanese | 28 | 1.7% |
| Korean | 3 | 0.2% |
| Russian | 6 | 0.4% |
| Scottish | 3 | 0.2% | View All 9 Rows |
Immigrants in Princeville
The most numerous immigrant groups reported in Princeville came from England (1 | 0.1%), Europe (1 | 0.1%), and Northern Europe (1 | 0.1%), together accounting for 0.2% of all Princeville residents.

| Immigration Origin | # Population | % Population |
| England | 1 | 0.1% |
| Europe | 1 | 0.1% |
| Northern Europe | 1 | 0.1% | View All 3 Rows |
Sex and Age in Princeville
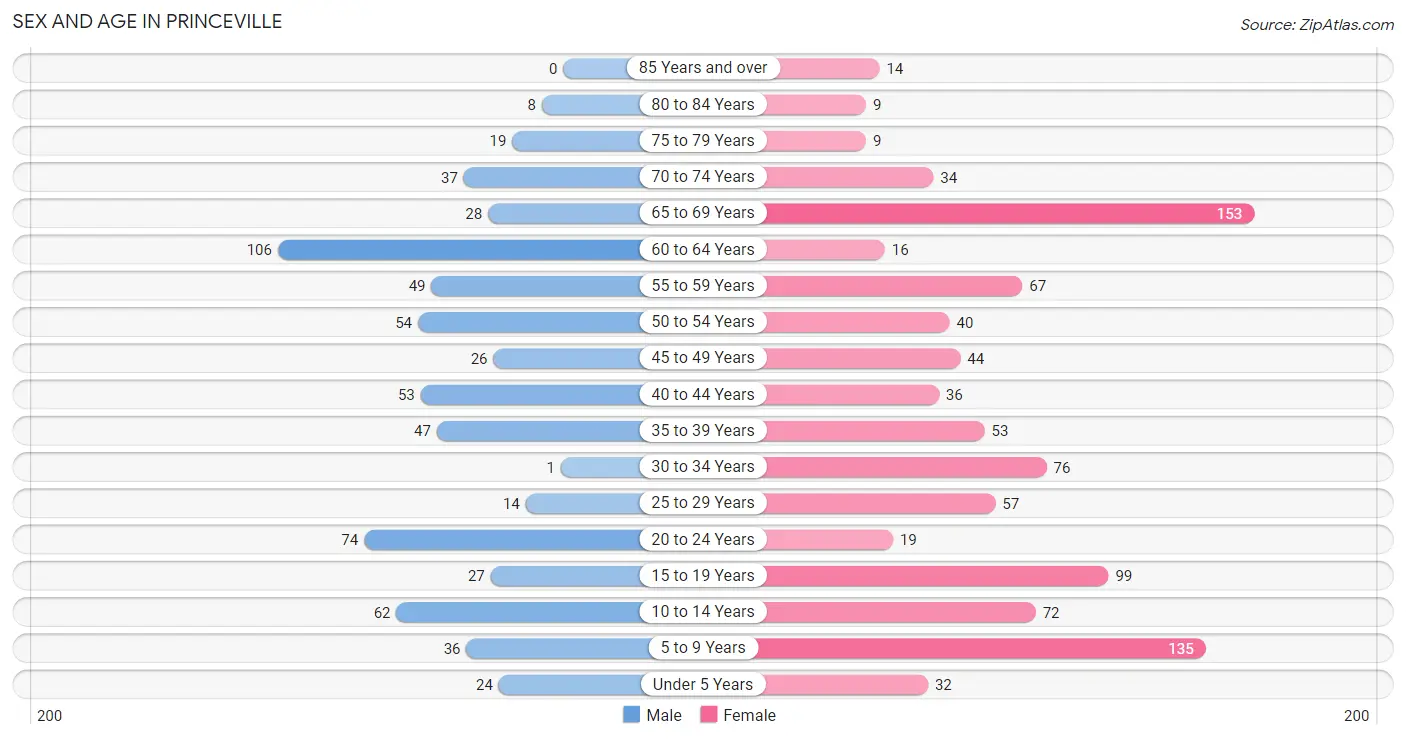
Sex and Age in Princeville
The most populous age groups in Princeville are 60 to 64 Years (106 | 15.9%) for men and 65 to 69 Years (153 | 15.9%) for women.
| Age Bracket | Male | Female |
| Under 5 Years | 24 (3.6%) | 32 (3.3%) |
| 5 to 9 Years | 36 (5.4%) | 135 (14.0%) |
| 10 to 14 Years | 62 (9.3%) | 72 (7.5%) |
| 15 to 19 Years | 27 (4.1%) | 99 (10.3%) |
| 20 to 24 Years | 74 (11.1%) | 19 (2.0%) |
| 25 to 29 Years | 14 (2.1%) | 57 (5.9%) |
| 30 to 34 Years | 1 (0.2%) | 76 (7.9%) |
| 35 to 39 Years | 47 (7.1%) | 53 (5.5%) |
| 40 to 44 Years | 53 (8.0%) | 36 (3.7%) |
| 45 to 49 Years | 26 (3.9%) | 44 (4.6%) |
| 50 to 54 Years | 54 (8.1%) | 40 (4.2%) |
| 55 to 59 Years | 49 (7.4%) | 67 (6.9%) |
| 60 to 64 Years | 106 (15.9%) | 16 (1.7%) |
| 65 to 69 Years | 28 (4.2%) | 153 (15.9%) |
| 70 to 74 Years | 37 (5.6%) | 34 (3.5%) |
| 75 to 79 Years | 19 (2.9%) | 9 (0.9%) |
| 80 to 84 Years | 8 (1.2%) | 9 (0.9%) |
| 85 Years and over | 0 (0.0%) | 14 (1.5%) |
| Total | 665 (100.0%) | 965 (100.0%) |
Families and Households in Princeville
Median Family Size in Princeville
The median family size in Princeville is 3.66 persons per family, with single female/mother families (206 | 56.4%) accounting for the largest median family size of 3.84 persons per family. On the other hand, single male/father families (7 | 1.9%) represent the smallest median family size with 2.14 persons per family.
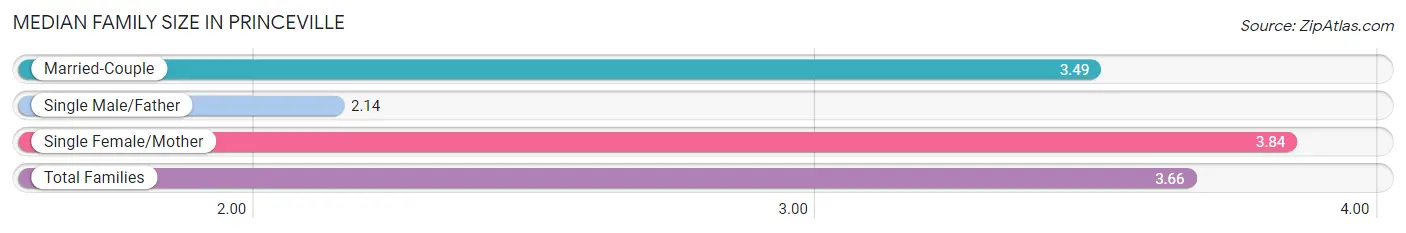
| Family Type | # Families | Family Size |
| Married-Couple | 152 (41.6%) | 3.49 |
| Single Male/Father | 7 (1.9%) | 2.14 |
| Single Female/Mother | 206 (56.4%) | 3.84 |
| Total Families | 365 (100.0%) | 3.66 |
Median Household Size in Princeville
The median household size in Princeville is 2.75 persons per household, with single female/mother households (206 | 34.9%) accounting for the largest median household size of 4.09 persons per household. non-family households (226 | 38.2%) represent the smallest median household size with 1.01 persons per household.
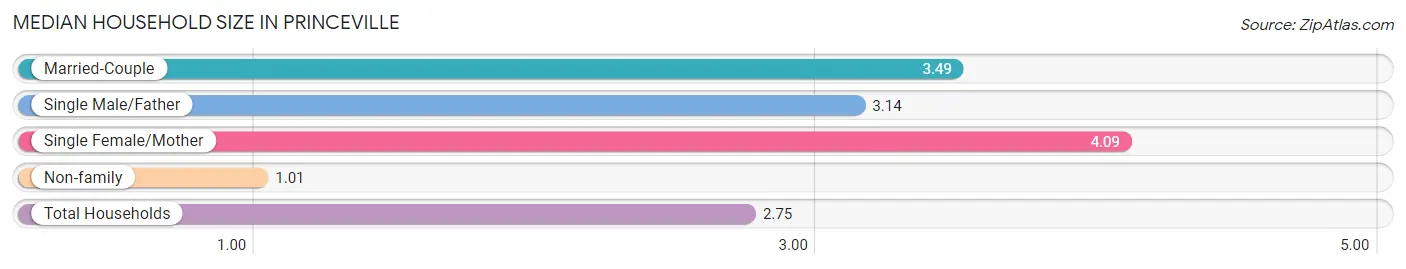
| Household Type | # Households | Household Size |
| Married-Couple | 152 (25.7%) | 3.49 |
| Single Male/Father | 7 (1.2%) | 3.14 |
| Single Female/Mother | 206 (34.9%) | 4.09 |
| Non-family | 226 (38.2%) | 1.01 |
| Total Households | 591 (100.0%) | 2.75 |
Household Size by Marriage Status in Princeville
Out of a total of 591 households in Princeville, 365 (61.8%) are family households, while 226 (38.2%) are nonfamily households. The most numerous type of family households are 4-person households, comprising 146, and the most common type of nonfamily households are 1-person households, comprising 223.
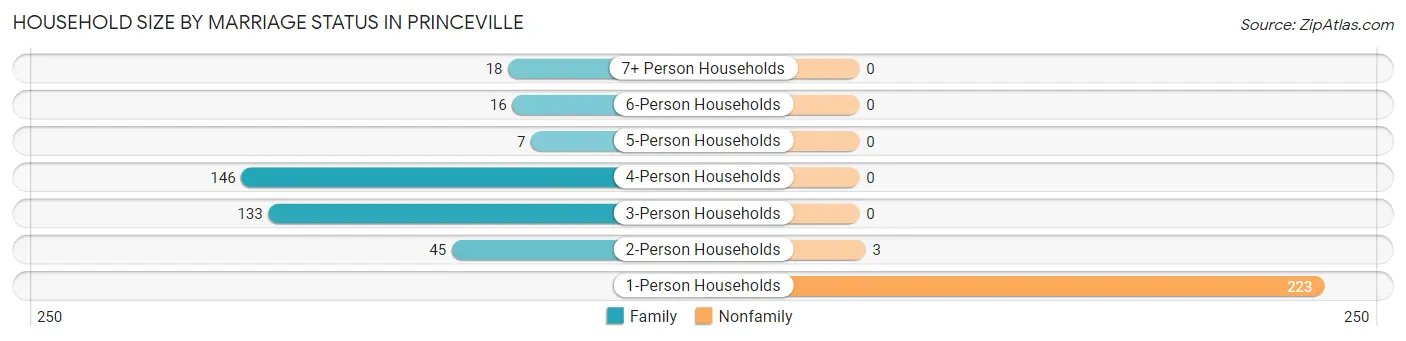
| Household Size | Family Households | Nonfamily Households |
| 1-Person Households | - | 223 (37.7%) |
| 2-Person Households | 45 (7.6%) | 3 (0.5%) |
| 3-Person Households | 133 (22.5%) | 0 (0.0%) |
| 4-Person Households | 146 (24.7%) | 0 (0.0%) |
| 5-Person Households | 7 (1.2%) | 0 (0.0%) |
| 6-Person Households | 16 (2.7%) | 0 (0.0%) |
| 7+ Person Households | 18 (3.0%) | 0 (0.0%) |
| Total | 365 (61.8%) | 226 (38.2%) |
Female Fertility in Princeville
Fertility by Age in Princeville
Average fertility rate in Princeville is 118.0 births per 1,000 women. Women in the age bracket of 20 to 34 years have the highest fertility rate with 309.0 births per 1,000 women. Women in the age bracket of 20 to 34 years acount for 100.0% of all women with births.
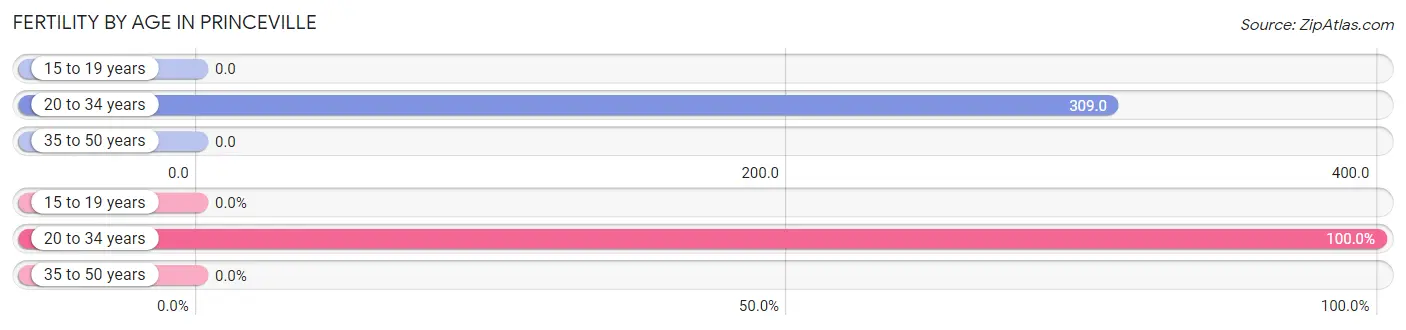
| Age Bracket | Women with Births | Births / 1,000 Women |
| 15 to 19 years | 0 (0.0%) | 0.0 |
| 20 to 34 years | 47 (100.0%) | 309.0 |
| 35 to 50 years | 0 (0.0%) | 0.0 |
| Total | 47 (100.0%) | 118.0 |
Fertility by Age by Marriage Status in Princeville
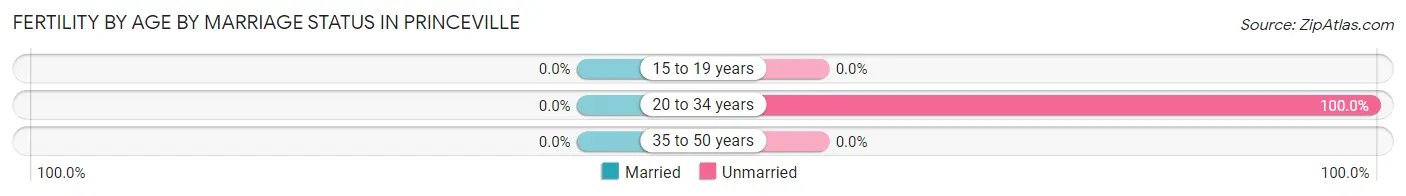
| Age Bracket | Married | Unmarried |
| 15 to 19 years | 0 (0.0%) | 0 (0.0%) |
| 20 to 34 years | 0 (0.0%) | 47 (100.0%) |
| 35 to 50 years | 0 (0.0%) | 0 (0.0%) |
| Total | 0 (0.0%) | 47 (100.0%) |
Fertility by Education in Princeville
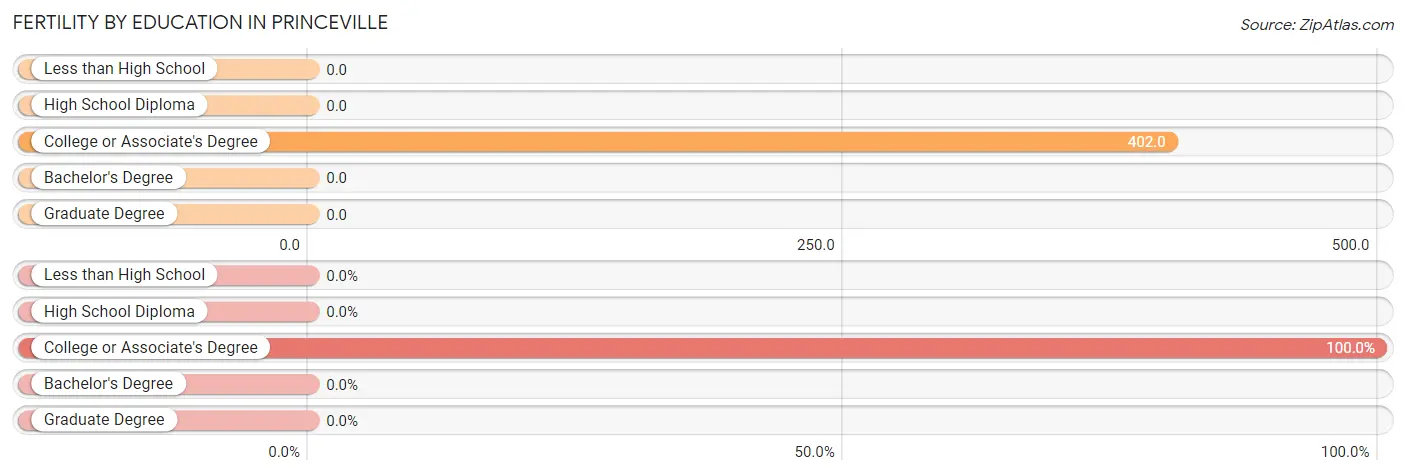
| Educational Attainment | Women with Births | Births / 1,000 Women |
| Less than High School | 0 (0.0%) | 0.0 |
| High School Diploma | 0 (0.0%) | 0.0 |
| College or Associate's Degree | 47 (100.0%) | 402.0 |
| Bachelor's Degree | 0 (0.0%) | 0.0 |
| Graduate Degree | 0 (0.0%) | 0.0 |
| Total | 47 (100.0%) | 118.0 |
Fertility by Education by Marriage Status in Princeville
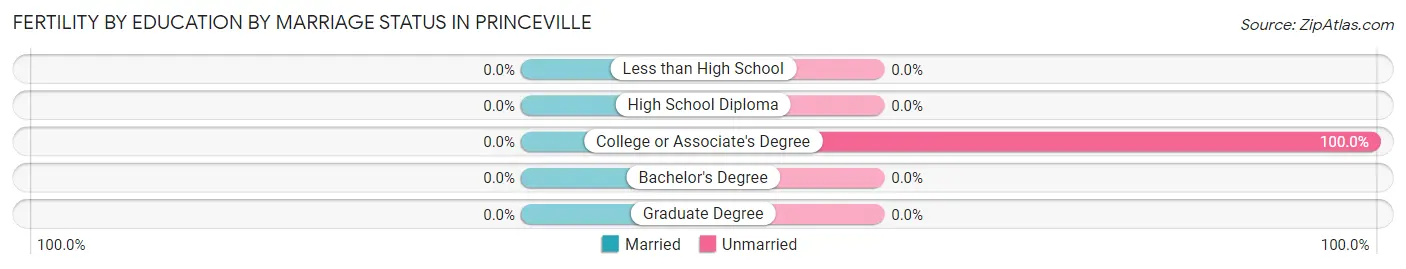
| Educational Attainment | Married | Unmarried |
| Less than High School | 0 (0.0%) | 0 (0.0%) |
| High School Diploma | 0 (0.0%) | 0 (0.0%) |
| College or Associate's Degree | 0 (0.0%) | 47 (100.0%) |
| Bachelor's Degree | 0 (0.0%) | 0 (0.0%) |
| Graduate Degree | 0 (0.0%) | 0 (0.0%) |
| Total | 0 (0.0%) | 47 (100.0%) |
Employment Characteristics in Princeville
Employment by Class of Employer in Princeville
Among the 623 employed individuals in Princeville, private company employees (542 | 87.0%), local government employees (37 | 5.9%), and self-employed (incorporated) (24 | 3.8%) make up the most common classes of employment.
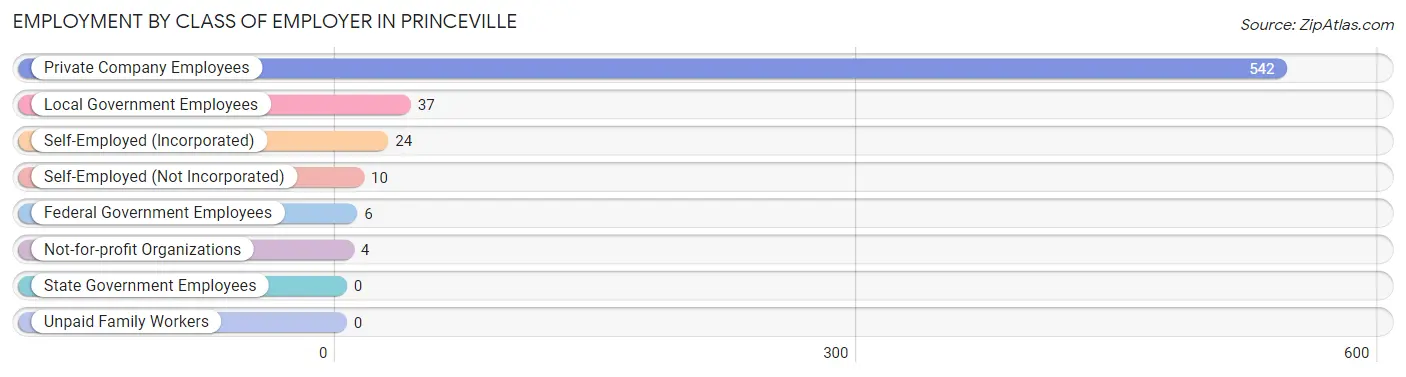
| Employer Class | # Employees | % Employees |
| Private Company Employees | 542 | 87.0% |
| Self-Employed (Incorporated) | 24 | 3.8% |
| Self-Employed (Not Incorporated) | 10 | 1.6% |
| Not-for-profit Organizations | 4 | 0.6% |
| Local Government Employees | 37 | 5.9% |
| State Government Employees | 0 | 0.0% |
| Federal Government Employees | 6 | 1.0% |
| Unpaid Family Workers | 0 | 0.0% |
| Total | 623 | 100.0% |
Employment Status by Age in Princeville
According to the labor force statistics for Princeville, out of the total population over 16 years of age (1,262), 56.3% or 711 individuals are in the labor force, with 11.4% or 81 of them unemployed. The age group with the highest labor force participation rate is 20 to 24 years, with 100.0% or 93 individuals in the labor force. Within the labor force, the 20 to 24 years age range has the highest percentage of unemployed individuals, with 38.7% or 36 of them being unemployed.
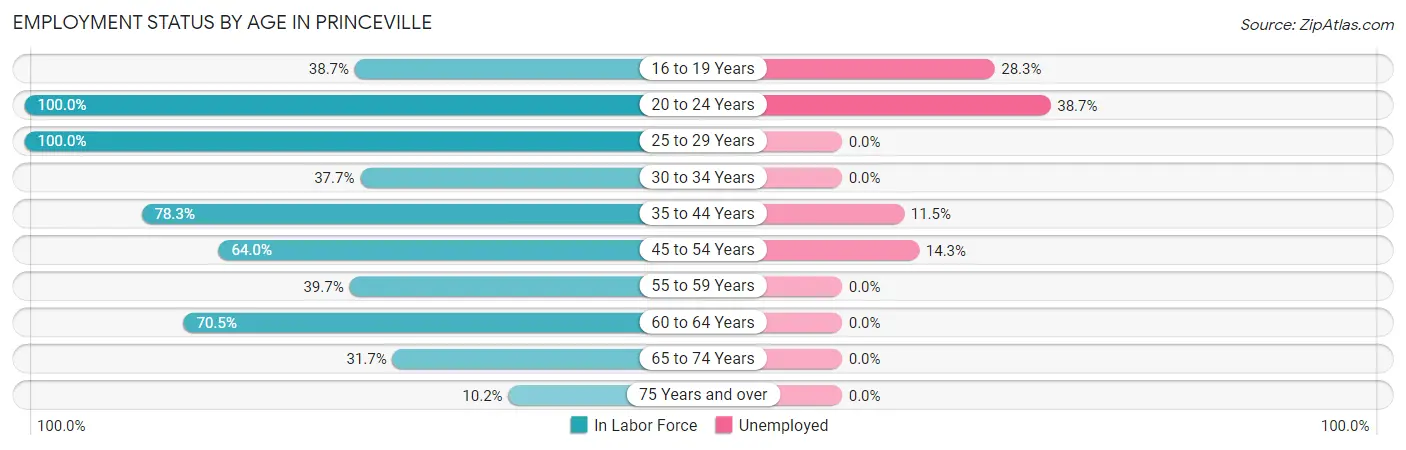
| Age Bracket | In Labor Force | Unemployed |
| 16 to 19 Years | 46 (38.7%) | 13 (28.3%) |
| 20 to 24 Years | 93 (100.0%) | 36 (38.7%) |
| 25 to 29 Years | 71 (100.0%) | 0 (0.0%) |
| 30 to 34 Years | 29 (37.7%) | 0 (0.0%) |
| 35 to 44 Years | 148 (78.3%) | 17 (11.5%) |
| 45 to 54 Years | 105 (64.0%) | 15 (14.3%) |
| 55 to 59 Years | 46 (39.7%) | 0 (0.0%) |
| 60 to 64 Years | 86 (70.5%) | 0 (0.0%) |
| 65 to 74 Years | 80 (31.7%) | 0 (0.0%) |
| 75 Years and over | 6 (10.2%) | 0 (0.0%) |
| Total | 711 (56.3%) | 81 (11.4%) |
Employment Status by Educational Attainment in Princeville
According to labor force statistics for Princeville, 65.6% of individuals (485) out of the total population between 25 and 64 years of age (739) are in the labor force, with 6.6% or 32 of them being unemployed. The group with the highest labor force participation rate are those with the educational attainment of high school diploma, with 72.0% or 216 individuals in the labor force. Within the labor force, individuals with less than high school education have the highest percentage of unemployment, with 21.9% or 14 of them being unemployed.
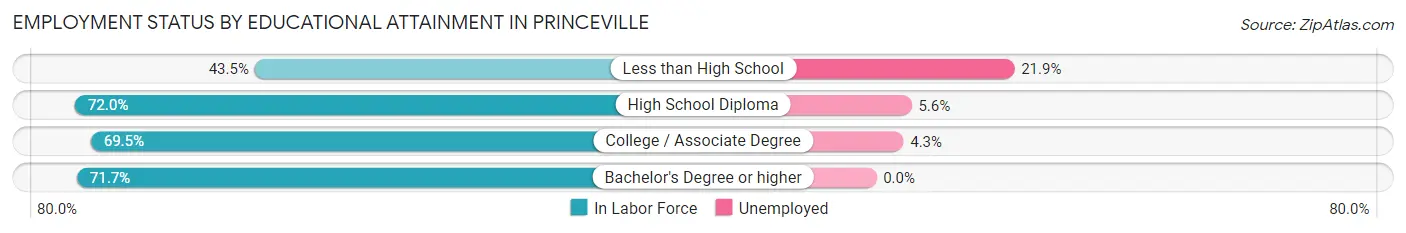
| Educational Attainment | In Labor Force | Unemployed |
| Less than High School | 64 (43.5%) | 32 (21.9%) |
| High School Diploma | 216 (72.0%) | 17 (5.6%) |
| College / Associate Degree | 139 (69.5%) | 9 (4.3%) |
| Bachelor's Degree or higher | 66 (71.7%) | 0 (0.0%) |
| Total | 485 (65.6%) | 49 (6.6%) |
Employment Occupations by Sex in Princeville
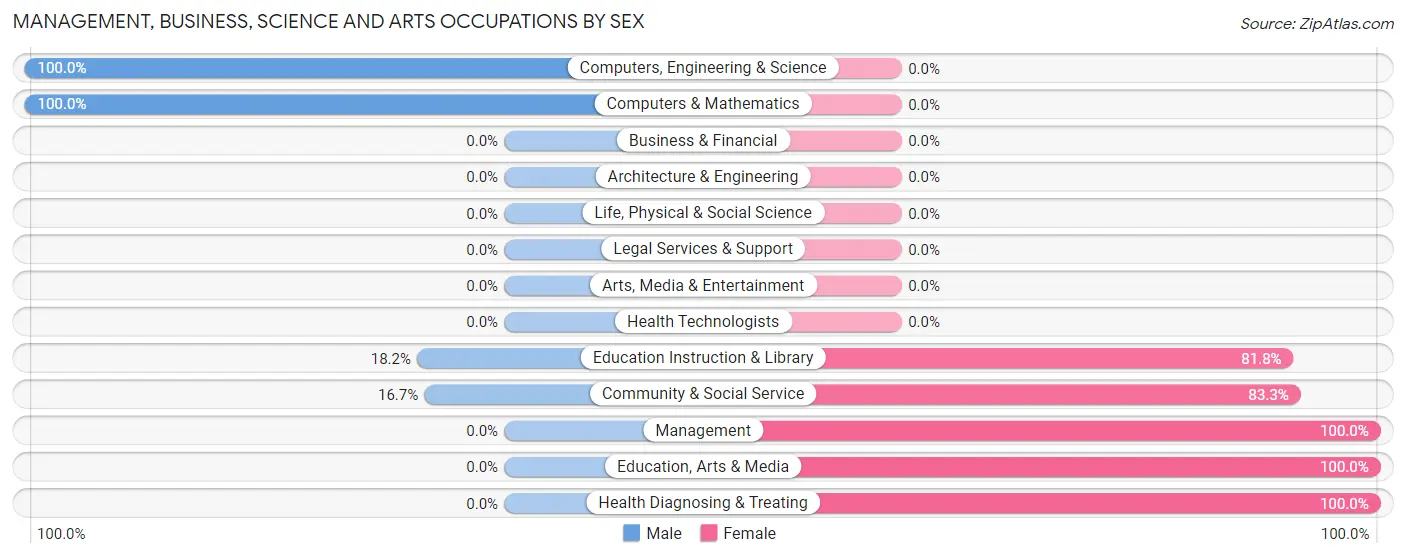
Management, Business, Science and Arts Occupations
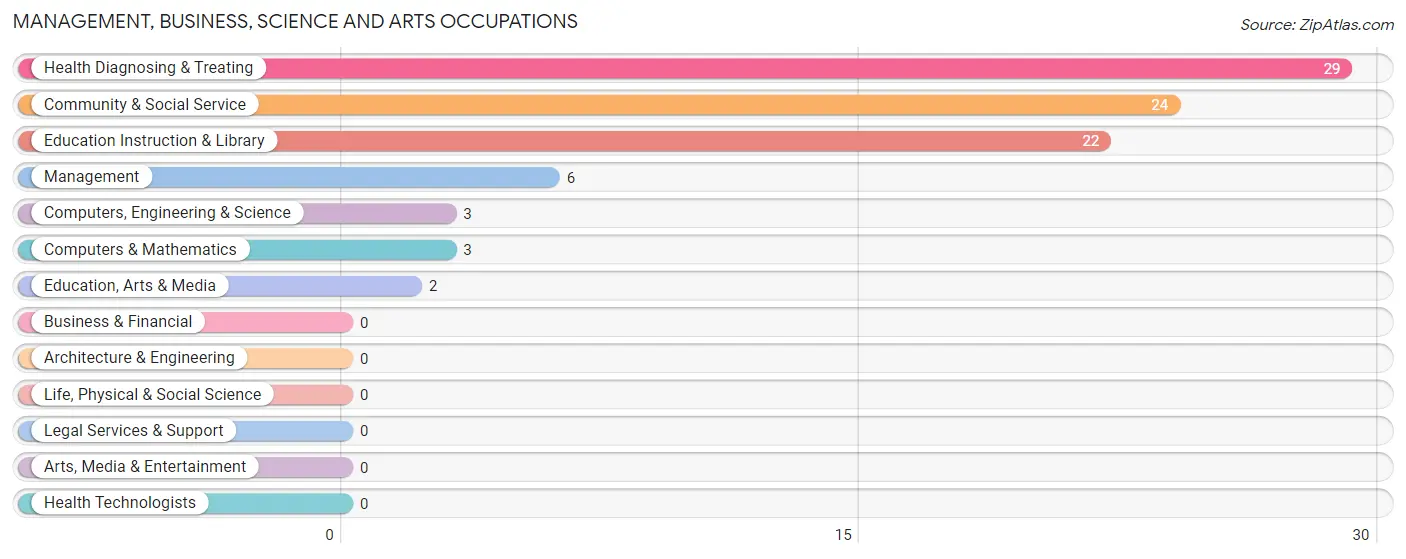
The most common Management, Business, Science and Arts occupations in Princeville are Health Diagnosing & Treating (29 | 4.6%), Community & Social Service (24 | 3.8%), Education Instruction & Library (22 | 3.5%), Management (6 | 0.9%), and Computers, Engineering & Science (3 | 0.5%).
Management, Business, Science and Arts Occupations by Sex
Within the Management, Business, Science and Arts occupations in Princeville, the most male-oriented occupations are Computers, Engineering & Science (100.0%), Computers & Mathematics (100.0%), and Education Instruction & Library (18.2%), while the most female-oriented occupations are Management (100.0%), Education, Arts & Media (100.0%), and Health Diagnosing & Treating (100.0%).
| Occupation | Male | Female |
| Management | 0 (0.0%) | 6 (100.0%) |
| Business & Financial | 0 (0.0%) | 0 (0.0%) |
| Computers, Engineering & Science | 3 (100.0%) | 0 (0.0%) |
| Computers & Mathematics | 3 (100.0%) | 0 (0.0%) |
| Architecture & Engineering | 0 (0.0%) | 0 (0.0%) |
| Life, Physical & Social Science | 0 (0.0%) | 0 (0.0%) |
| Community & Social Service | 4 (16.7%) | 20 (83.3%) |
| Education, Arts & Media | 0 (0.0%) | 2 (100.0%) |
| Legal Services & Support | 0 (0.0%) | 0 (0.0%) |
| Education Instruction & Library | 4 (18.2%) | 18 (81.8%) |
| Arts, Media & Entertainment | 0 (0.0%) | 0 (0.0%) |
| Health Diagnosing & Treating | 0 (0.0%) | 29 (100.0%) |
| Health Technologists | 0 (0.0%) | 0 (0.0%) |
| Total (Category) | 7 (11.3%) | 55 (88.7%) |
| Total (Overall) | 317 (50.4%) | 312 (49.6%) |
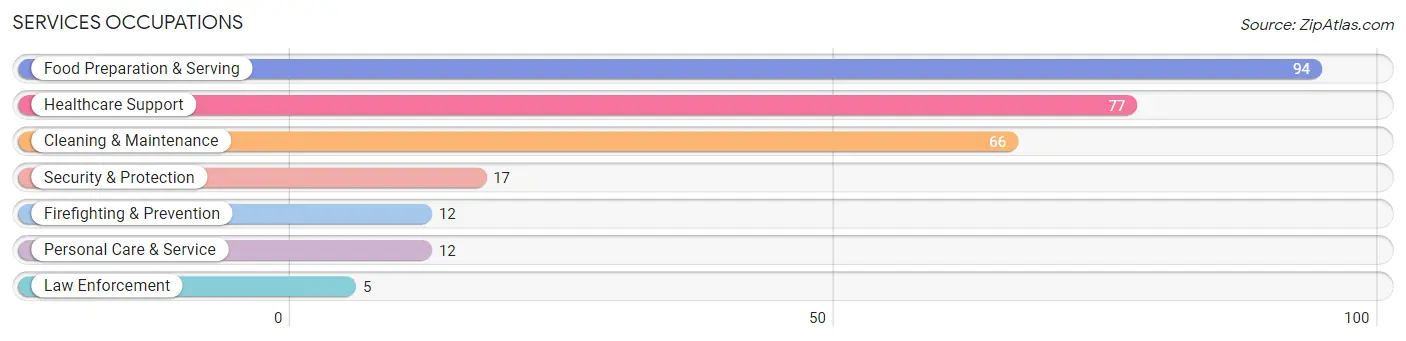
Services Occupations
The most common Services occupations in Princeville are Food Preparation & Serving (94 | 14.9%), Healthcare Support (77 | 12.2%), Cleaning & Maintenance (66 | 10.5%), Security & Protection (17 | 2.7%), and Firefighting & Prevention (12 | 1.9%).
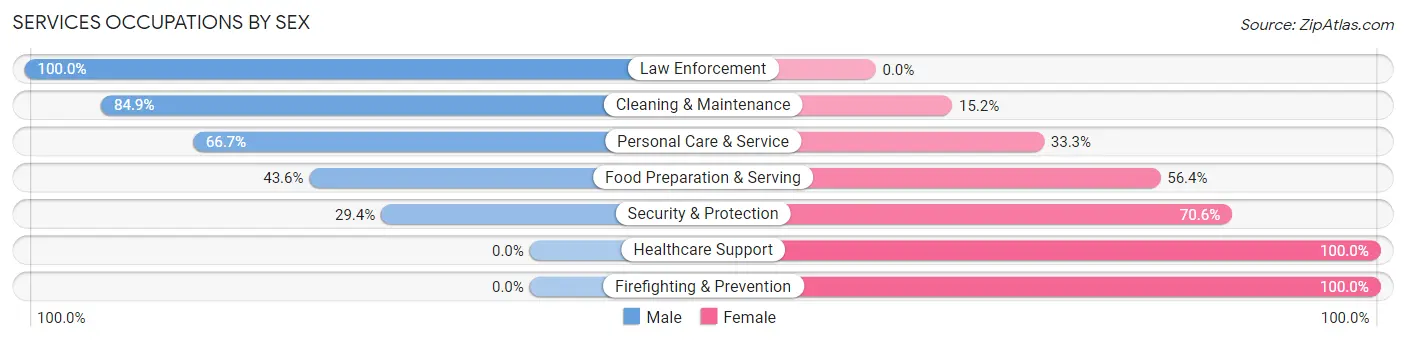
Services Occupations by Sex
Within the Services occupations in Princeville, the most male-oriented occupations are Law Enforcement (100.0%), Cleaning & Maintenance (84.9%), and Personal Care & Service (66.7%), while the most female-oriented occupations are Healthcare Support (100.0%), Firefighting & Prevention (100.0%), and Security & Protection (70.6%).
| Occupation | Male | Female |
| Healthcare Support | 0 (0.0%) | 77 (100.0%) |
| Security & Protection | 5 (29.4%) | 12 (70.6%) |
| Firefighting & Prevention | 0 (0.0%) | 12 (100.0%) |
| Law Enforcement | 5 (100.0%) | 0 (0.0%) |
| Food Preparation & Serving | 41 (43.6%) | 53 (56.4%) |
| Cleaning & Maintenance | 56 (84.9%) | 10 (15.1%) |
| Personal Care & Service | 8 (66.7%) | 4 (33.3%) |
| Total (Category) | 110 (41.3%) | 156 (58.7%) |
| Total (Overall) | 317 (50.4%) | 312 (49.6%) |
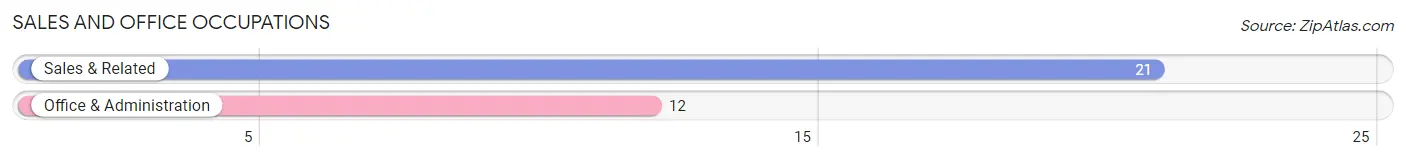
Sales and Office Occupations
The most common Sales and Office occupations in Princeville are Sales & Related (21 | 3.3%), and Office & Administration (12 | 1.9%).
Sales and Office Occupations by Sex
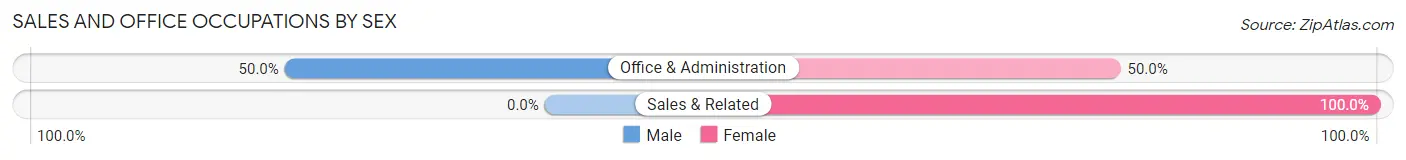
| Occupation | Male | Female |
| Sales & Related | 0 (0.0%) | 21 (100.0%) |
| Office & Administration | 6 (50.0%) | 6 (50.0%) |
| Total (Category) | 6 (18.2%) | 27 (81.8%) |
| Total (Overall) | 317 (50.4%) | 312 (49.6%) |
Natural Resources, Construction and Maintenance Occupations
The most common Natural Resources, Construction and Maintenance occupations in Princeville are , and Construction & Extraction (26 | 4.1%).

Natural Resources, Construction and Maintenance Occupations by Sex

| Occupation | Male | Female |
| Farming, Fishing & Forestry | 0 (0.0%) | 0 (0.0%) |
| Construction & Extraction | 26 (100.0%) | 0 (0.0%) |
| Installation, Maintenance & Repair | 0 (0.0%) | 0 (0.0%) |
| Total (Category) | 26 (100.0%) | 0 (0.0%) |
| Total (Overall) | 317 (50.4%) | 312 (49.6%) |
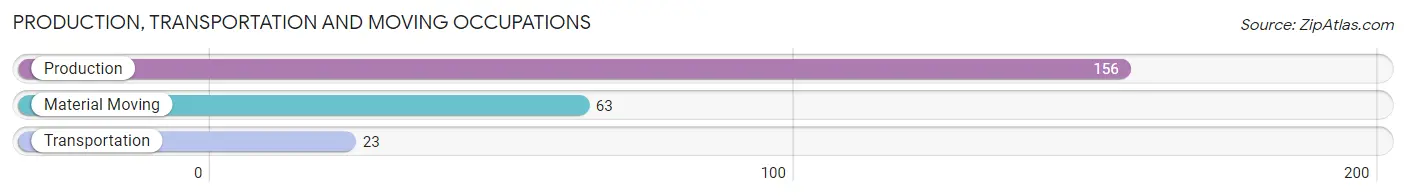
Production, Transportation and Moving Occupations
The most common Production, Transportation and Moving occupations in Princeville are Production (156 | 24.8%), Material Moving (63 | 10.0%), and Transportation (23 | 3.7%).
Production, Transportation and Moving Occupations by Sex
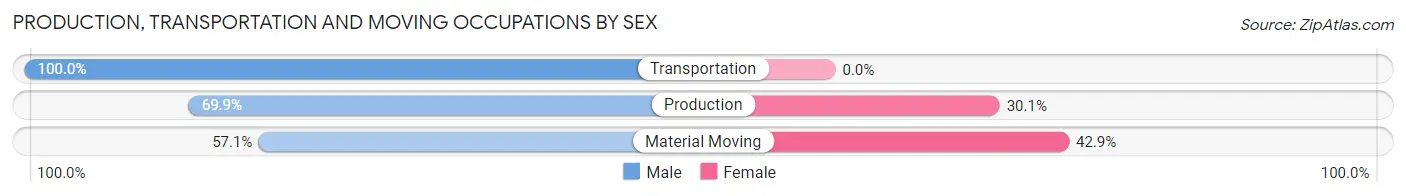
| Occupation | Male | Female |
| Production | 109 (69.9%) | 47 (30.1%) |
| Transportation | 23 (100.0%) | 0 (0.0%) |
| Material Moving | 36 (57.1%) | 27 (42.9%) |
| Total (Category) | 168 (69.4%) | 74 (30.6%) |
| Total (Overall) | 317 (50.4%) | 312 (49.6%) |
Employment Industries by Sex in Princeville
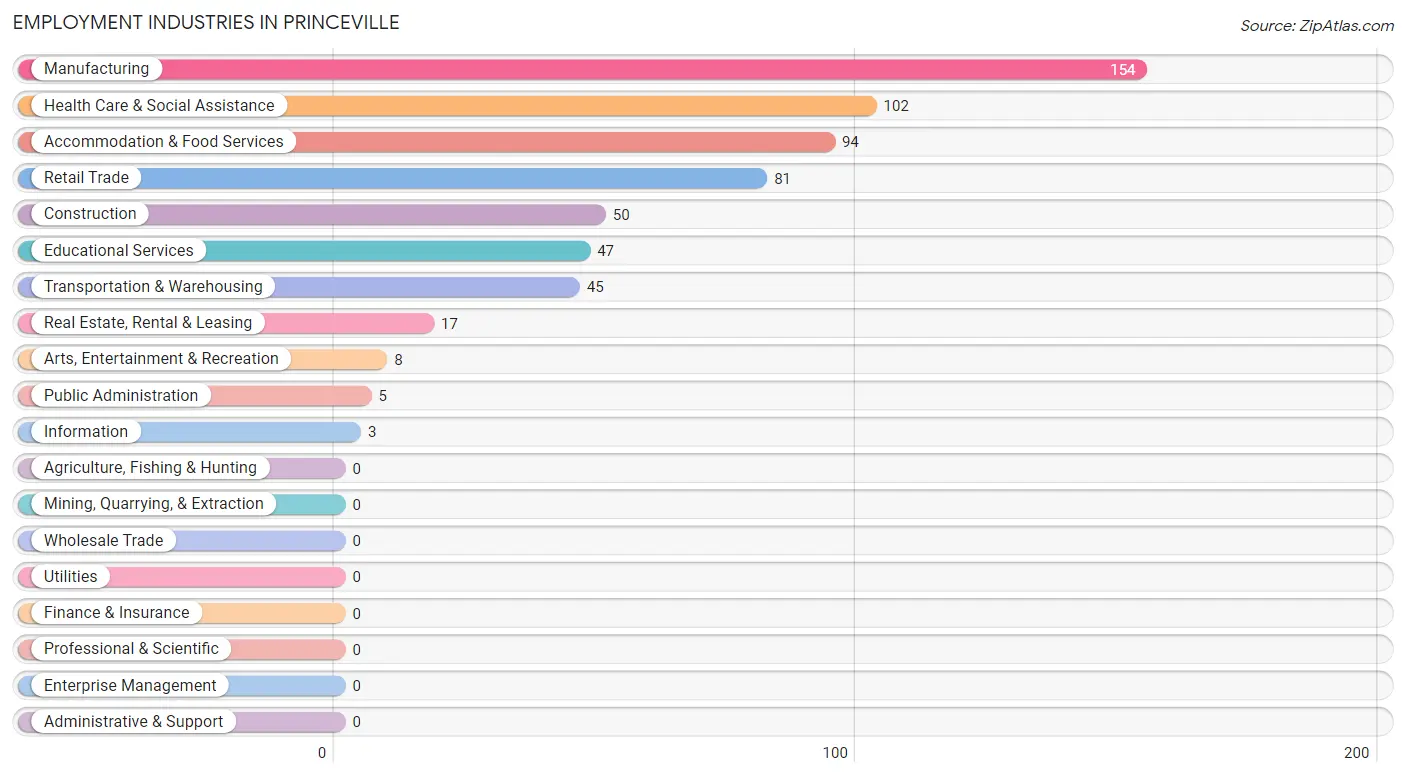
Employment Industries in Princeville
The major employment industries in Princeville include Manufacturing (154 | 24.5%), Health Care & Social Assistance (102 | 16.2%), Accommodation & Food Services (94 | 14.9%), Retail Trade (81 | 12.9%), and Construction (50 | 8.0%).
Employment Industries by Sex in Princeville
The Princeville industries that see more men than women are Construction (100.0%), Information (100.0%), and Arts, Entertainment & Recreation (100.0%), whereas the industries that tend to have a higher number of women are Retail Trade (92.6%), Health Care & Social Assistance (82.4%), and Accommodation & Food Services (56.4%).
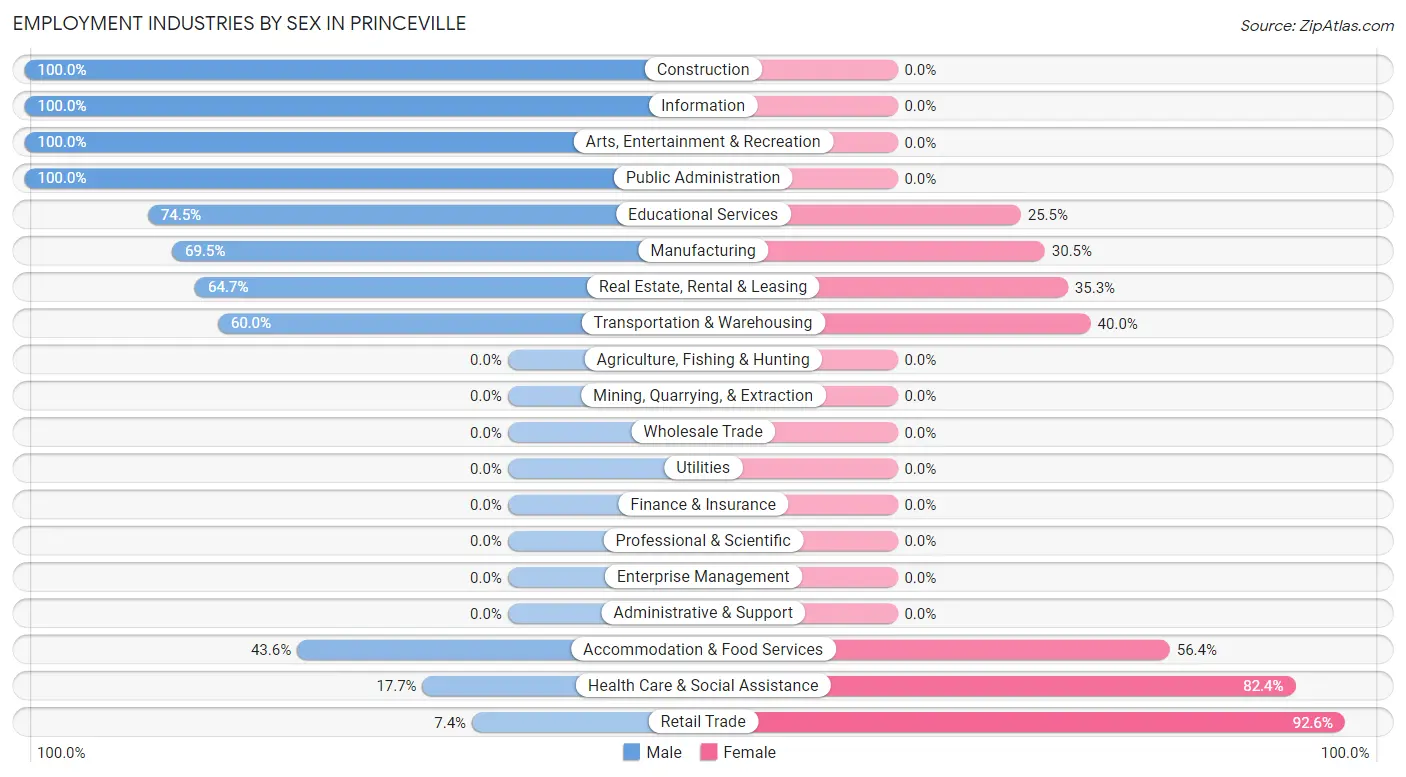
| Industry | Male | Female |
| Agriculture, Fishing & Hunting | 0 (0.0%) | 0 (0.0%) |
| Mining, Quarrying, & Extraction | 0 (0.0%) | 0 (0.0%) |
| Construction | 50 (100.0%) | 0 (0.0%) |
| Manufacturing | 107 (69.5%) | 47 (30.5%) |
| Wholesale Trade | 0 (0.0%) | 0 (0.0%) |
| Retail Trade | 6 (7.4%) | 75 (92.6%) |
| Transportation & Warehousing | 27 (60.0%) | 18 (40.0%) |
| Utilities | 0 (0.0%) | 0 (0.0%) |
| Information | 3 (100.0%) | 0 (0.0%) |
| Finance & Insurance | 0 (0.0%) | 0 (0.0%) |
| Real Estate, Rental & Leasing | 11 (64.7%) | 6 (35.3%) |
| Professional & Scientific | 0 (0.0%) | 0 (0.0%) |
| Enterprise Management | 0 (0.0%) | 0 (0.0%) |
| Administrative & Support | 0 (0.0%) | 0 (0.0%) |
| Educational Services | 35 (74.5%) | 12 (25.5%) |
| Health Care & Social Assistance | 18 (17.6%) | 84 (82.4%) |
| Arts, Entertainment & Recreation | 8 (100.0%) | 0 (0.0%) |
| Accommodation & Food Services | 41 (43.6%) | 53 (56.4%) |
| Public Administration | 5 (100.0%) | 0 (0.0%) |
| Total | 317 (50.4%) | 312 (49.6%) |
Education in Princeville
School Enrollment in Princeville
The most common levels of schooling among the 459 students in Princeville are middle school (170 | 37.0%), elementary school (118 | 25.7%), and high school (94 | 20.5%).
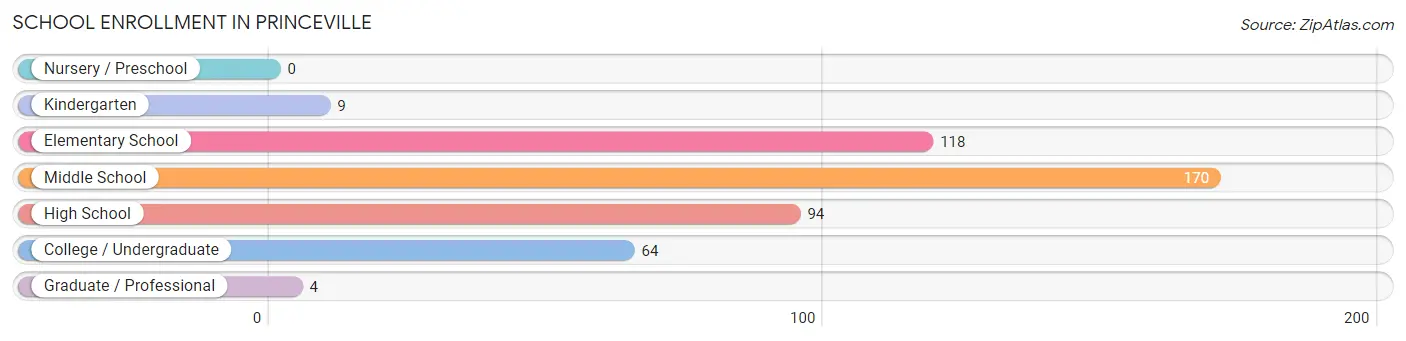
| School Level | # Students | % Students |
| Nursery / Preschool | 0 | 0.0% |
| Kindergarten | 9 | 2.0% |
| Elementary School | 118 | 25.7% |
| Middle School | 170 | 37.0% |
| High School | 94 | 20.5% |
| College / Undergraduate | 64 | 13.9% |
| Graduate / Professional | 4 | 0.9% |
| Total | 459 | 100.0% |
School Enrollment by Age by Funding Source in Princeville
Out of a total of 459 students who are enrolled in schools in Princeville, 29 (6.3%) attend a private institution, while the remaining 430 (93.7%) are enrolled in public schools. The age group of 5 to 9 year old has the highest likelihood of being enrolled in private schools, with 23 (13.5% in the age bracket) enrolled. Conversely, the age group of 10 to 14 year olds has the lowest likelihood of being enrolled in a private school, with 134 (100.0% in the age bracket) attending a public institution.
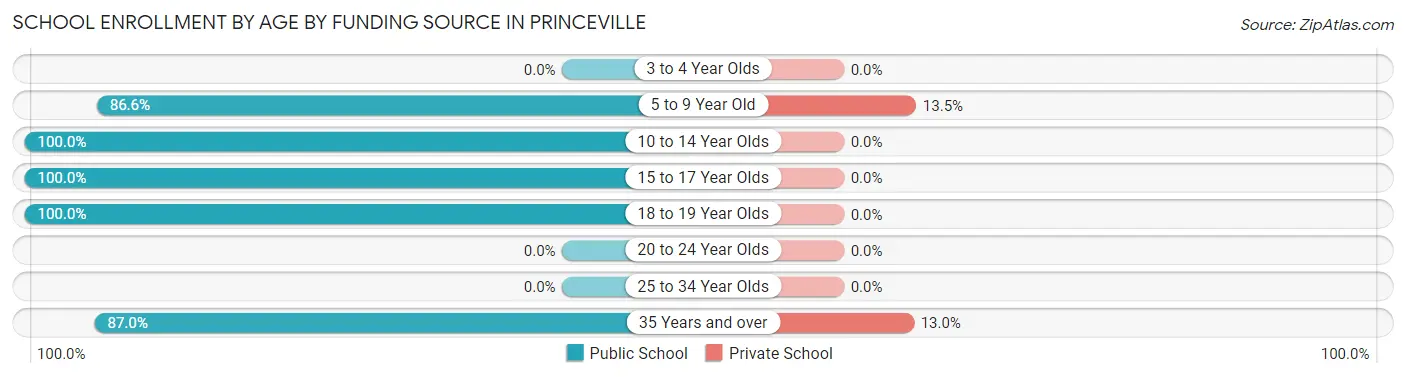
| Age Bracket | Public School | Private School |
| 3 to 4 Year Olds | 0 (0.0%) | 0 (0.0%) |
| 5 to 9 Year Old | 148 (86.6%) | 23 (13.5%) |
| 10 to 14 Year Olds | 134 (100.0%) | 0 (0.0%) |
| 15 to 17 Year Olds | 77 (100.0%) | 0 (0.0%) |
| 18 to 19 Year Olds | 31 (100.0%) | 0 (0.0%) |
| 20 to 24 Year Olds | 0 (0.0%) | 0 (0.0%) |
| 25 to 34 Year Olds | 0 (0.0%) | 0 (0.0%) |
| 35 Years and over | 40 (87.0%) | 6 (13.0%) |
| Total | 430 (93.7%) | 29 (6.3%) |
Educational Attainment by Field of Study in Princeville
Business (43 | 36.7%), social sciences (27 | 23.1%), education (24 | 20.5%), science & technology (11 | 9.4%), and literature & languages (5 | 4.3%) are the most common fields of study among 117 individuals in Princeville who have obtained a bachelor's degree or higher.
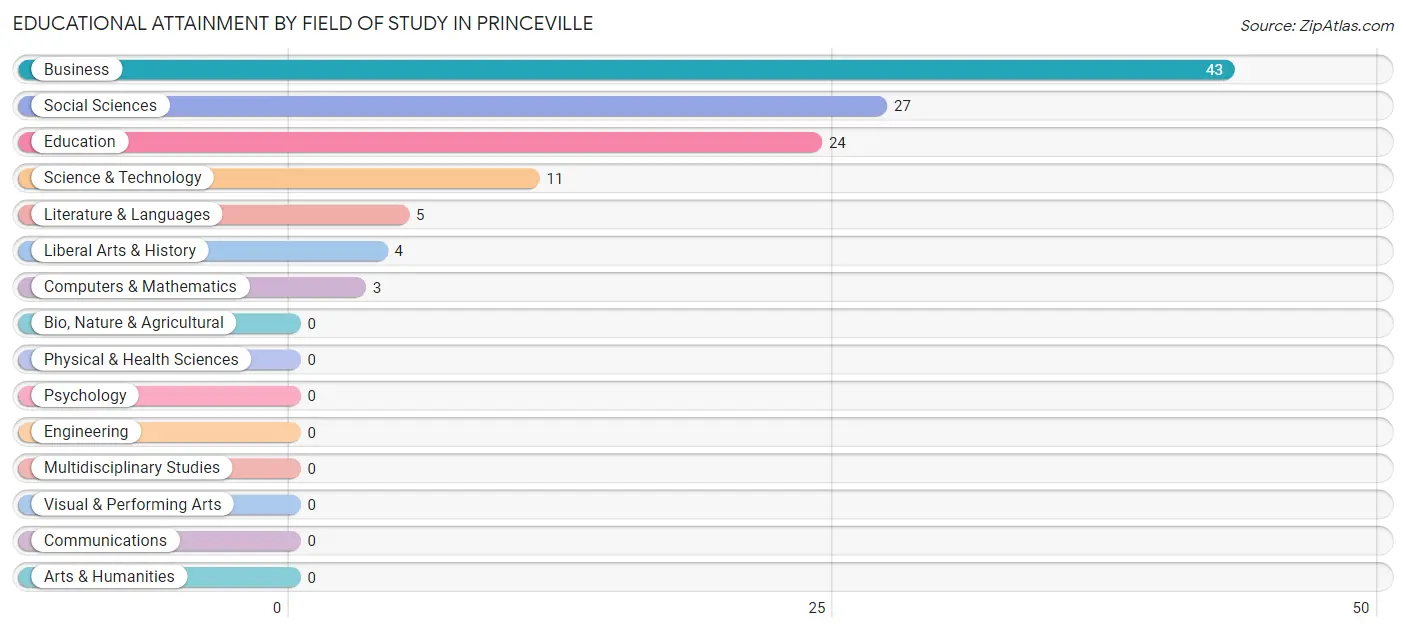
| Field of Study | # Graduates | % Graduates |
| Computers & Mathematics | 3 | 2.6% |
| Bio, Nature & Agricultural | 0 | 0.0% |
| Physical & Health Sciences | 0 | 0.0% |
| Psychology | 0 | 0.0% |
| Social Sciences | 27 | 23.1% |
| Engineering | 0 | 0.0% |
| Multidisciplinary Studies | 0 | 0.0% |
| Science & Technology | 11 | 9.4% |
| Business | 43 | 36.7% |
| Education | 24 | 20.5% |
| Literature & Languages | 5 | 4.3% |
| Liberal Arts & History | 4 | 3.4% |
| Visual & Performing Arts | 0 | 0.0% |
| Communications | 0 | 0.0% |
| Arts & Humanities | 0 | 0.0% |
| Total | 117 | 100.0% |
Transportation & Commute in Princeville
Vehicle Availability by Sex in Princeville
The most prevalent vehicle ownership categories in Princeville are males with 1 vehicle (126, accounting for 39.8%) and females with 1 vehicle (61, making up 41.4%).
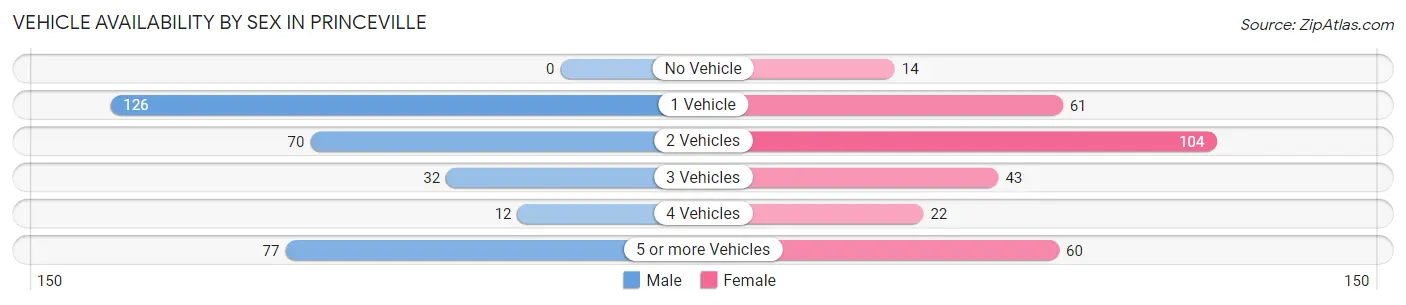
| Vehicles Available | Male | Female |
| No Vehicle | 0 (0.0%) | 14 (4.6%) |
| 1 Vehicle | 126 (39.8%) | 61 (20.1%) |
| 2 Vehicles | 70 (22.1%) | 104 (34.2%) |
| 3 Vehicles | 32 (10.1%) | 43 (14.1%) |
| 4 Vehicles | 12 (3.8%) | 22 (7.2%) |
| 5 or more Vehicles | 77 (24.3%) | 60 (19.7%) |
| Total | 317 (100.0%) | 304 (100.0%) |
Commute Time in Princeville
The most frequently occuring commute durations in Princeville are 15 to 19 minutes (163 commuters, 26.3%), 5 to 9 minutes (156 commuters, 25.1%), and 10 to 14 minutes (122 commuters, 19.7%).
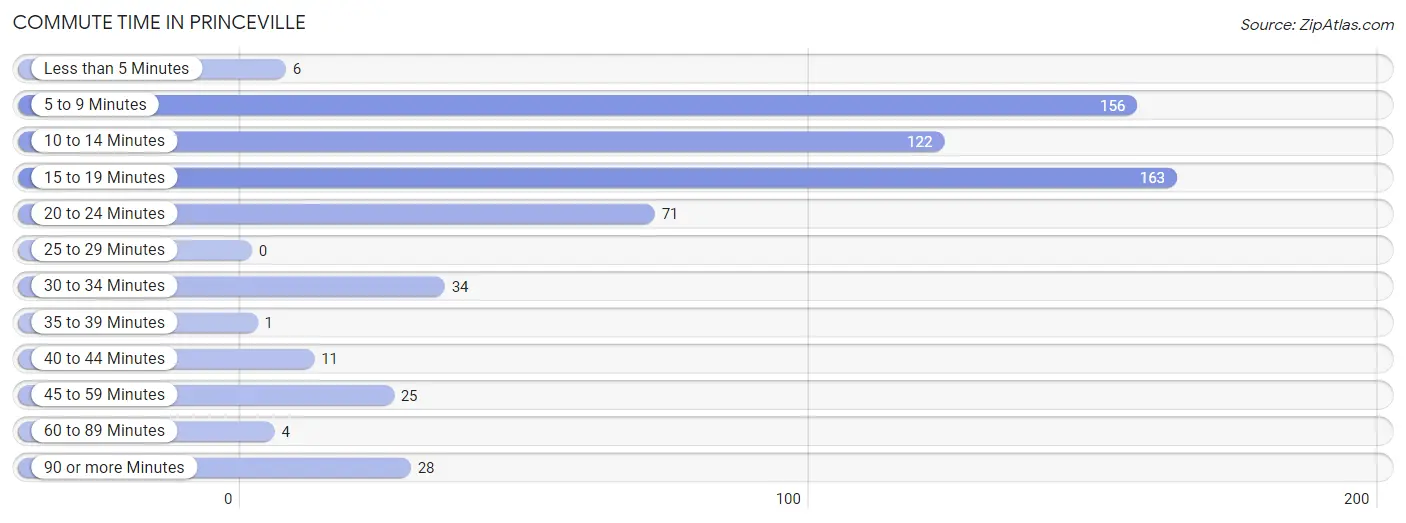
| Commute Time | # Commuters | % Commuters |
| Less than 5 Minutes | 6 | 1.0% |
| 5 to 9 Minutes | 156 | 25.1% |
| 10 to 14 Minutes | 122 | 19.7% |
| 15 to 19 Minutes | 163 | 26.3% |
| 20 to 24 Minutes | 71 | 11.4% |
| 25 to 29 Minutes | 0 | 0.0% |
| 30 to 34 Minutes | 34 | 5.5% |
| 35 to 39 Minutes | 1 | 0.2% |
| 40 to 44 Minutes | 11 | 1.8% |
| 45 to 59 Minutes | 25 | 4.0% |
| 60 to 89 Minutes | 4 | 0.6% |
| 90 or more Minutes | 28 | 4.5% |
Commute Time by Sex in Princeville
The most common commute times in Princeville are 15 to 19 minutes (115 commuters, 36.3%) for males and 5 to 9 minutes (127 commuters, 41.8%) for females.
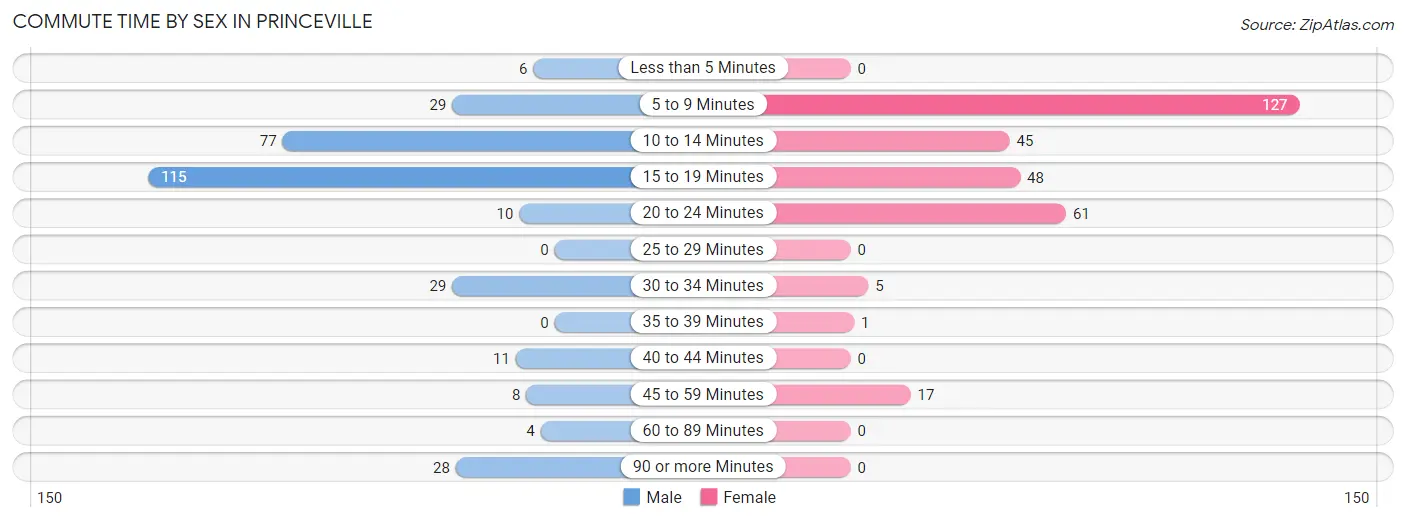
| Commute Time | Male | Female |
| Less than 5 Minutes | 6 (1.9%) | 0 (0.0%) |
| 5 to 9 Minutes | 29 (9.1%) | 127 (41.8%) |
| 10 to 14 Minutes | 77 (24.3%) | 45 (14.8%) |
| 15 to 19 Minutes | 115 (36.3%) | 48 (15.8%) |
| 20 to 24 Minutes | 10 (3.2%) | 61 (20.1%) |
| 25 to 29 Minutes | 0 (0.0%) | 0 (0.0%) |
| 30 to 34 Minutes | 29 (9.1%) | 5 (1.6%) |
| 35 to 39 Minutes | 0 (0.0%) | 1 (0.3%) |
| 40 to 44 Minutes | 11 (3.5%) | 0 (0.0%) |
| 45 to 59 Minutes | 8 (2.5%) | 17 (5.6%) |
| 60 to 89 Minutes | 4 (1.3%) | 0 (0.0%) |
| 90 or more Minutes | 28 (8.8%) | 0 (0.0%) |
Time of Departure to Work by Sex in Princeville
The most frequent times of departure to work in Princeville are 6:00 AM to 6:29 AM (65, 20.5%) for males and 4:00 PM to 11:59 PM (73, 24.0%) for females.
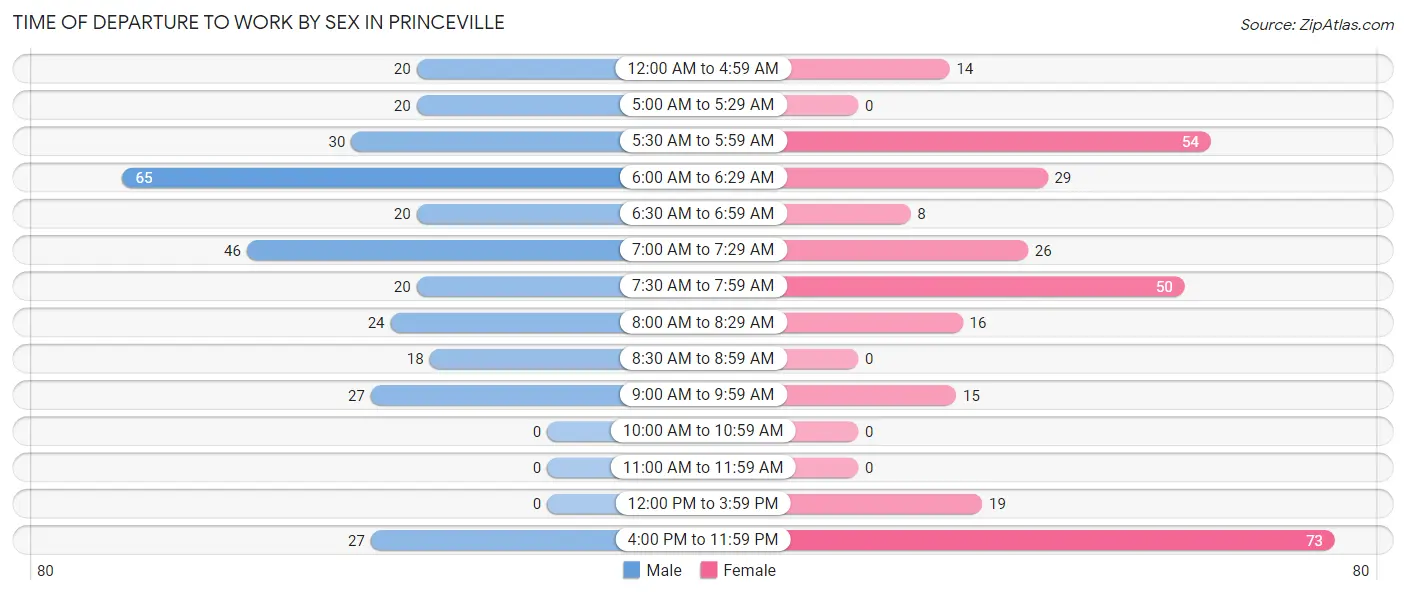
| Time of Departure | Male | Female |
| 12:00 AM to 4:59 AM | 20 (6.3%) | 14 (4.6%) |
| 5:00 AM to 5:29 AM | 20 (6.3%) | 0 (0.0%) |
| 5:30 AM to 5:59 AM | 30 (9.5%) | 54 (17.8%) |
| 6:00 AM to 6:29 AM | 65 (20.5%) | 29 (9.5%) |
| 6:30 AM to 6:59 AM | 20 (6.3%) | 8 (2.6%) |
| 7:00 AM to 7:29 AM | 46 (14.5%) | 26 (8.6%) |
| 7:30 AM to 7:59 AM | 20 (6.3%) | 50 (16.5%) |
| 8:00 AM to 8:29 AM | 24 (7.6%) | 16 (5.3%) |
| 8:30 AM to 8:59 AM | 18 (5.7%) | 0 (0.0%) |
| 9:00 AM to 9:59 AM | 27 (8.5%) | 15 (4.9%) |
| 10:00 AM to 10:59 AM | 0 (0.0%) | 0 (0.0%) |
| 11:00 AM to 11:59 AM | 0 (0.0%) | 0 (0.0%) |
| 12:00 PM to 3:59 PM | 0 (0.0%) | 19 (6.2%) |
| 4:00 PM to 11:59 PM | 27 (8.5%) | 73 (24.0%) |
| Total | 317 (100.0%) | 304 (100.0%) |
Housing Occupancy in Princeville
Occupancy by Ownership in Princeville
Of the total 591 dwellings in Princeville, owner-occupied units account for 368 (62.3%), while renter-occupied units make up 223 (37.7%).
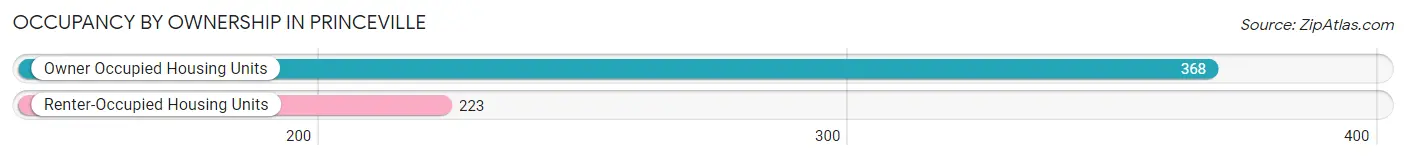
| Occupancy | # Housing Units | % Housing Units |
| Owner Occupied Housing Units | 368 | 62.3% |
| Renter-Occupied Housing Units | 223 | 37.7% |
| Total Occupied Housing Units | 591 | 100.0% |
Occupancy by Household Size in Princeville
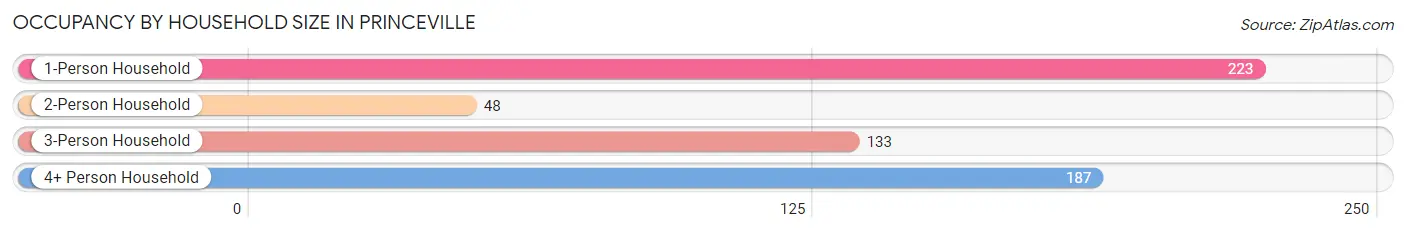
| Household Size | # Housing Units | % Housing Units |
| 1-Person Household | 223 | 37.7% |
| 2-Person Household | 48 | 8.1% |
| 3-Person Household | 133 | 22.5% |
| 4+ Person Household | 187 | 31.6% |
| Total Housing Units | 591 | 100.0% |
Occupancy by Ownership by Household Size in Princeville
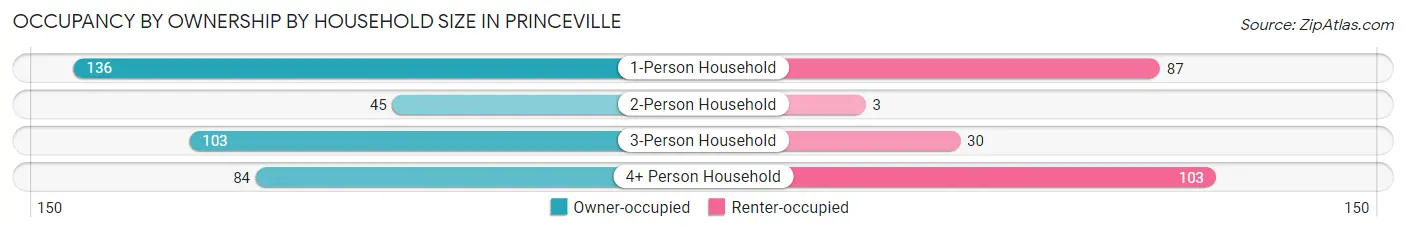
| Household Size | Owner-occupied | Renter-occupied |
| 1-Person Household | 136 (61.0%) | 87 (39.0%) |
| 2-Person Household | 45 (93.8%) | 3 (6.2%) |
| 3-Person Household | 103 (77.4%) | 30 (22.6%) |
| 4+ Person Household | 84 (44.9%) | 103 (55.1%) |
| Total Housing Units | 368 (62.3%) | 223 (37.7%) |
Occupancy by Educational Attainment in Princeville
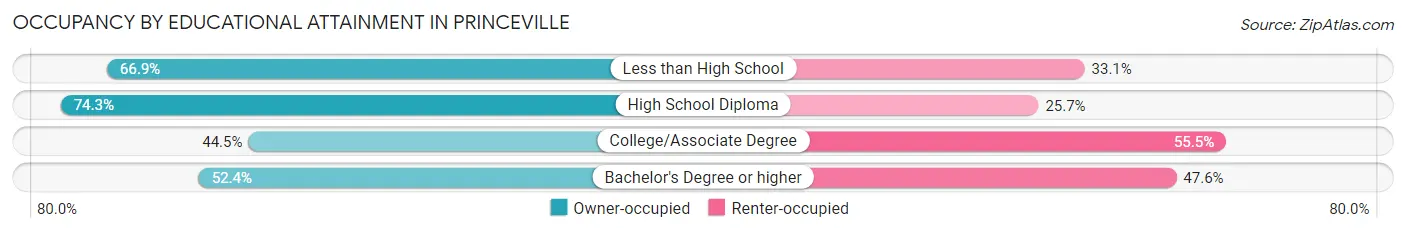
| Household Size | Owner-occupied | Renter-occupied |
| Less than High School | 83 (66.9%) | 41 (33.1%) |
| High School Diploma | 176 (74.3%) | 61 (25.7%) |
| College/Associate Degree | 65 (44.5%) | 81 (55.5%) |
| Bachelor's Degree or higher | 44 (52.4%) | 40 (47.6%) |
Occupancy by Age of Householder in Princeville
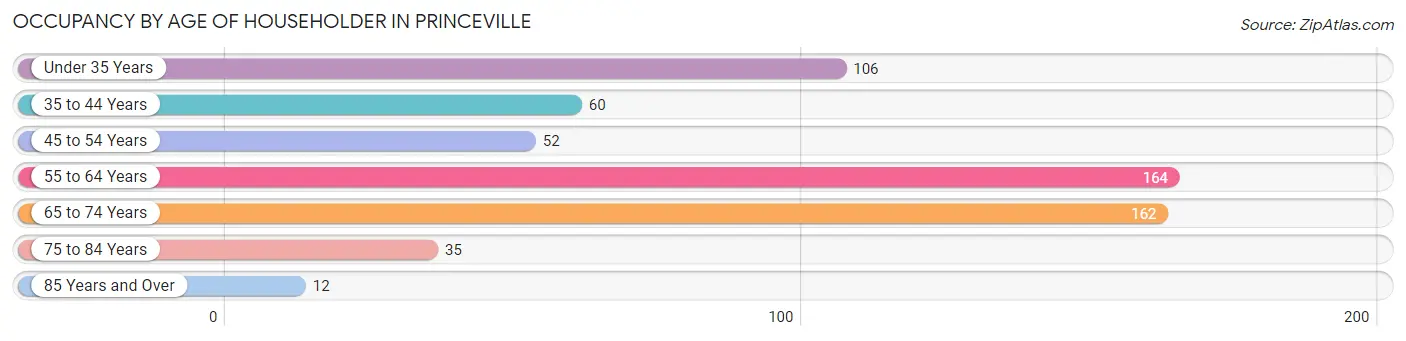
| Age Bracket | # Households | % Households |
| Under 35 Years | 106 | 17.9% |
| 35 to 44 Years | 60 | 10.2% |
| 45 to 54 Years | 52 | 8.8% |
| 55 to 64 Years | 164 | 27.8% |
| 65 to 74 Years | 162 | 27.4% |
| 75 to 84 Years | 35 | 5.9% |
| 85 Years and Over | 12 | 2.0% |
| Total | 591 | 100.0% |
Housing Finances in Princeville
Median Income by Occupancy in Princeville
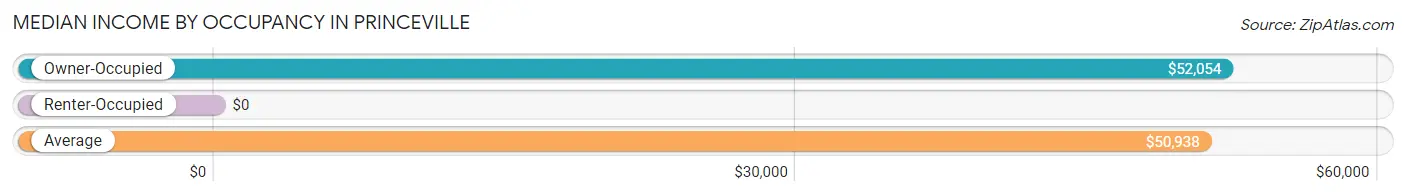
| Occupancy Type | # Households | Median Income |
| Owner-Occupied | 368 (62.3%) | $52,054 |
| Renter-Occupied | 223 (37.7%) | $0 |
| Average | 591 (100.0%) | $50,938 |
Occupancy by Householder Income Bracket in Princeville
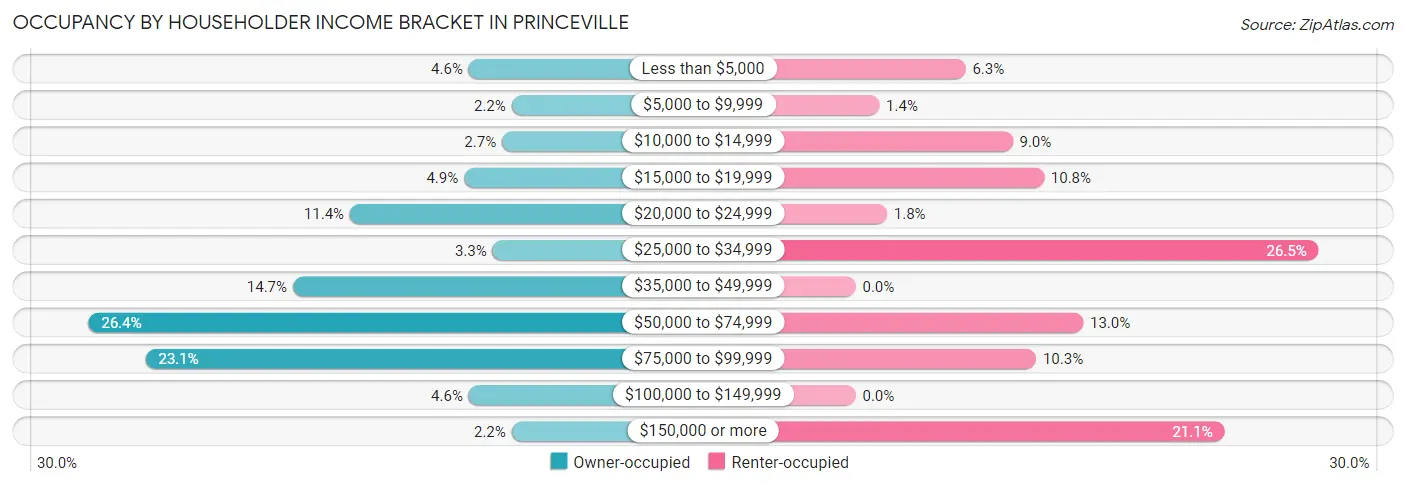
| Income Bracket | Owner-occupied | Renter-occupied |
| Less than $5,000 | 17 (4.6%) | 14 (6.3%) |
| $5,000 to $9,999 | 8 (2.2%) | 3 (1.3%) |
| $10,000 to $14,999 | 10 (2.7%) | 20 (9.0%) |
| $15,000 to $19,999 | 18 (4.9%) | 24 (10.8%) |
| $20,000 to $24,999 | 42 (11.4%) | 4 (1.8%) |
| $25,000 to $34,999 | 12 (3.3%) | 59 (26.5%) |
| $35,000 to $49,999 | 54 (14.7%) | 0 (0.0%) |
| $50,000 to $74,999 | 97 (26.4%) | 29 (13.0%) |
| $75,000 to $99,999 | 85 (23.1%) | 23 (10.3%) |
| $100,000 to $149,999 | 17 (4.6%) | 0 (0.0%) |
| $150,000 or more | 8 (2.2%) | 47 (21.1%) |
| Total | 368 (100.0%) | 223 (100.0%) |
Monthly Housing Cost Tiers in Princeville
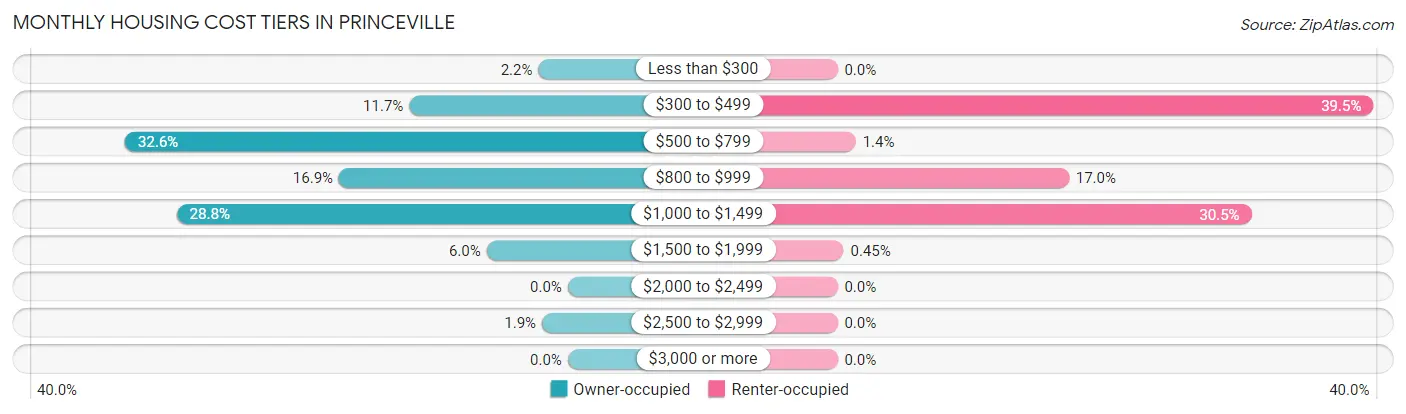
| Monthly Cost | Owner-occupied | Renter-occupied |
| Less than $300 | 8 (2.2%) | 0 (0.0%) |
| $300 to $499 | 43 (11.7%) | 88 (39.5%) |
| $500 to $799 | 120 (32.6%) | 3 (1.3%) |
| $800 to $999 | 62 (16.9%) | 38 (17.0%) |
| $1,000 to $1,499 | 106 (28.8%) | 68 (30.5%) |
| $1,500 to $1,999 | 22 (6.0%) | 1 (0.4%) |
| $2,000 to $2,499 | 0 (0.0%) | 0 (0.0%) |
| $2,500 to $2,999 | 7 (1.9%) | 0 (0.0%) |
| $3,000 or more | 0 (0.0%) | 0 (0.0%) |
| Total | 368 (100.0%) | 223 (100.0%) |
Physical Housing Characteristics in Princeville
Housing Structures in Princeville
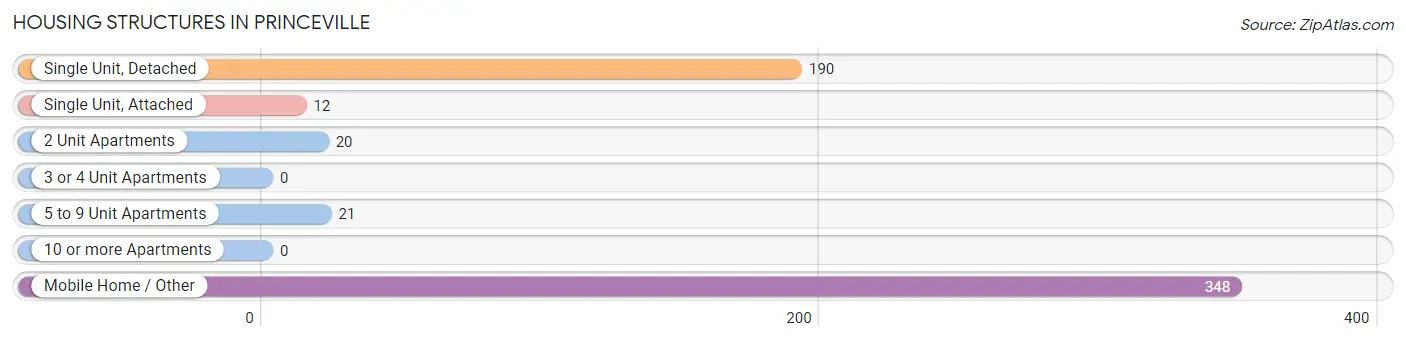
| Structure Type | # Housing Units | % Housing Units |
| Single Unit, Detached | 190 | 32.2% |
| Single Unit, Attached | 12 | 2.0% |
| 2 Unit Apartments | 20 | 3.4% |
| 3 or 4 Unit Apartments | 0 | 0.0% |
| 5 to 9 Unit Apartments | 21 | 3.5% |
| 10 or more Apartments | 0 | 0.0% |
| Mobile Home / Other | 348 | 58.9% |
| Total | 591 | 100.0% |
Housing Structures by Occupancy in Princeville
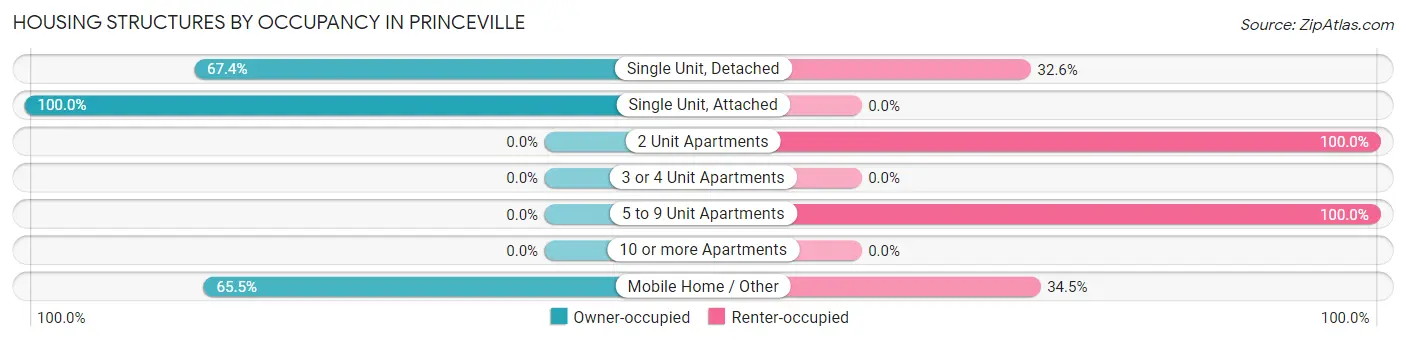
| Structure Type | Owner-occupied | Renter-occupied |
| Single Unit, Detached | 128 (67.4%) | 62 (32.6%) |
| Single Unit, Attached | 12 (100.0%) | 0 (0.0%) |
| 2 Unit Apartments | 0 (0.0%) | 20 (100.0%) |
| 3 or 4 Unit Apartments | 0 (0.0%) | 0 (0.0%) |
| 5 to 9 Unit Apartments | 0 (0.0%) | 21 (100.0%) |
| 10 or more Apartments | 0 (0.0%) | 0 (0.0%) |
| Mobile Home / Other | 228 (65.5%) | 120 (34.5%) |
| Total | 368 (62.3%) | 223 (37.7%) |
Housing Structures by Number of Rooms in Princeville
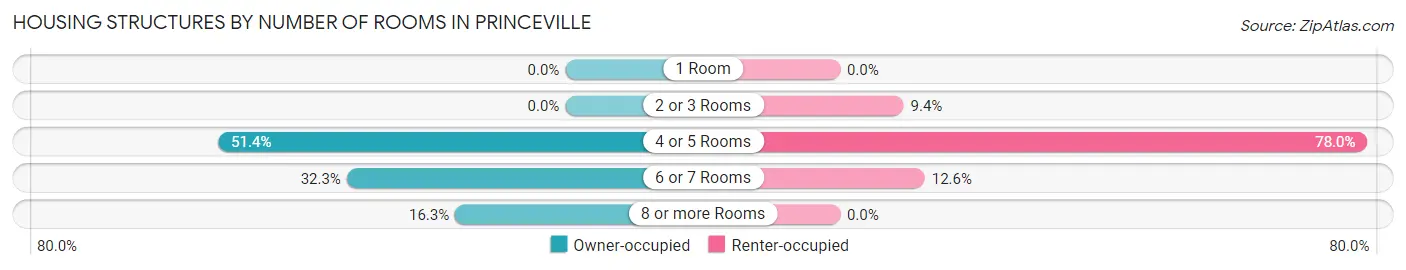
| Number of Rooms | Owner-occupied | Renter-occupied |
| 1 Room | 0 (0.0%) | 0 (0.0%) |
| 2 or 3 Rooms | 0 (0.0%) | 21 (9.4%) |
| 4 or 5 Rooms | 189 (51.4%) | 174 (78.0%) |
| 6 or 7 Rooms | 119 (32.3%) | 28 (12.6%) |
| 8 or more Rooms | 60 (16.3%) | 0 (0.0%) |
| Total | 368 (100.0%) | 223 (100.0%) |
Housing Structure by Heating Type in Princeville
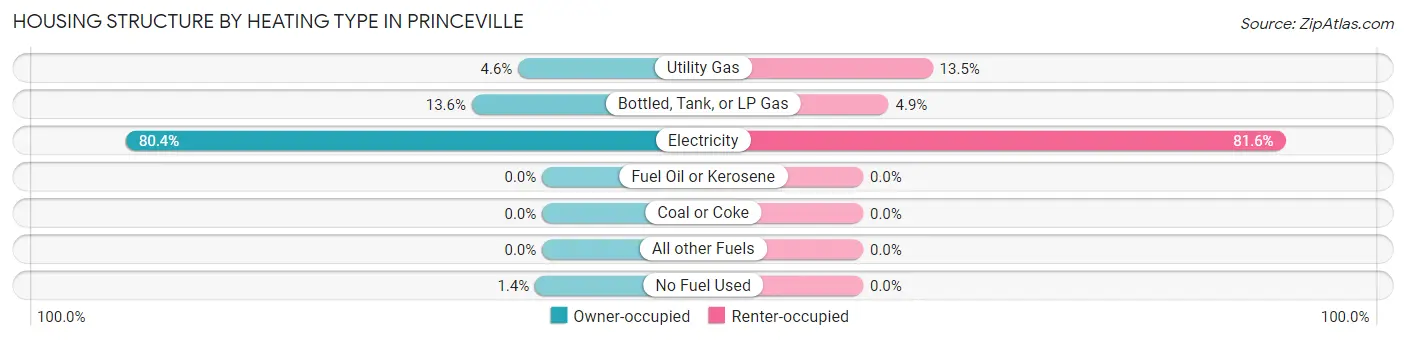
| Heating Type | Owner-occupied | Renter-occupied |
| Utility Gas | 17 (4.6%) | 30 (13.5%) |
| Bottled, Tank, or LP Gas | 50 (13.6%) | 11 (4.9%) |
| Electricity | 296 (80.4%) | 182 (81.6%) |
| Fuel Oil or Kerosene | 0 (0.0%) | 0 (0.0%) |
| Coal or Coke | 0 (0.0%) | 0 (0.0%) |
| All other Fuels | 0 (0.0%) | 0 (0.0%) |
| No Fuel Used | 5 (1.4%) | 0 (0.0%) |
| Total | 368 (100.0%) | 223 (100.0%) |
Household Vehicle Usage in Princeville
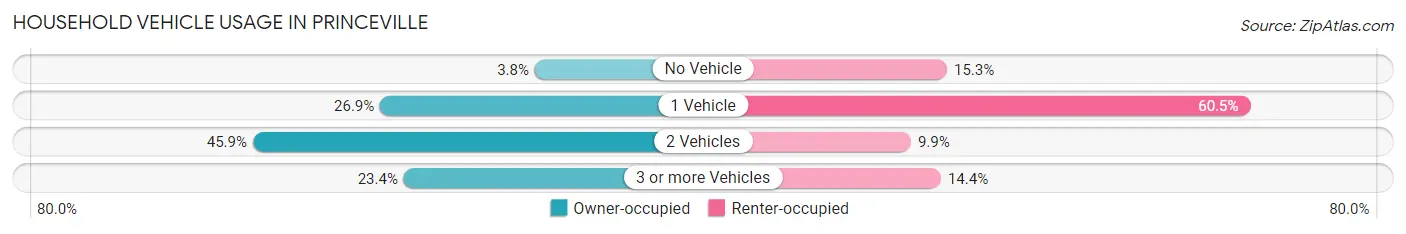
| Vehicles per Household | Owner-occupied | Renter-occupied |
| No Vehicle | 14 (3.8%) | 34 (15.2%) |
| 1 Vehicle | 99 (26.9%) | 135 (60.5%) |
| 2 Vehicles | 169 (45.9%) | 22 (9.9%) |
| 3 or more Vehicles | 86 (23.4%) | 32 (14.3%) |
| Total | 368 (100.0%) | 223 (100.0%) |
Real Estate & Mortgages in Princeville
Real Estate and Mortgage Overview in Princeville
| Characteristic | Without Mortgage | With Mortgage |
| Housing Units | 124 | 244 |
| Median Property Value | $80,000 | $113,200 |
| Median Household Income | $51,429 | $3 |
| Monthly Housing Costs | $535 | $0 |
| Real Estate Taxes | $1,119 | $0 |
Property Value by Mortgage Status in Princeville
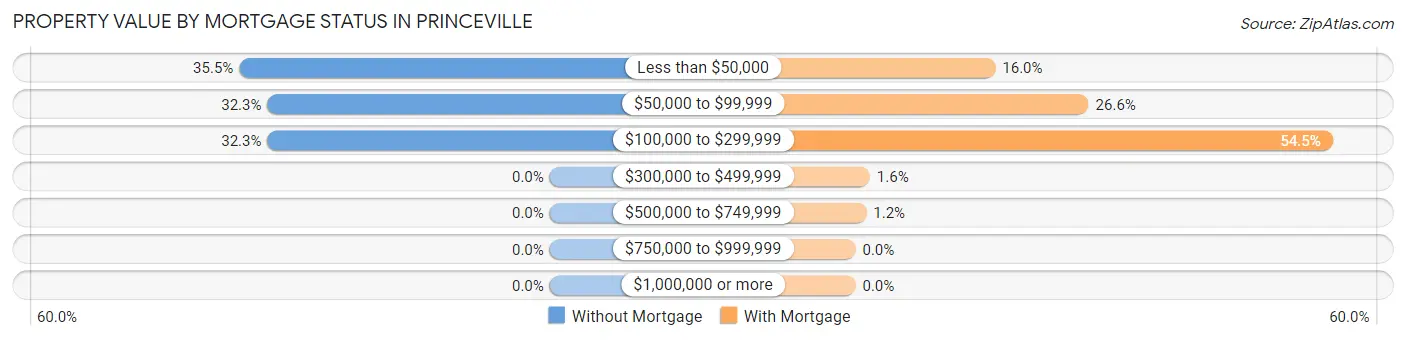
| Property Value | Without Mortgage | With Mortgage |
| Less than $50,000 | 44 (35.5%) | 39 (16.0%) |
| $50,000 to $99,999 | 40 (32.3%) | 65 (26.6%) |
| $100,000 to $299,999 | 40 (32.3%) | 133 (54.5%) |
| $300,000 to $499,999 | 0 (0.0%) | 4 (1.6%) |
| $500,000 to $749,999 | 0 (0.0%) | 3 (1.2%) |
| $750,000 to $999,999 | 0 (0.0%) | 0 (0.0%) |
| $1,000,000 or more | 0 (0.0%) | 0 (0.0%) |
| Total | 124 (100.0%) | 244 (100.0%) |
Household Income by Mortgage Status in Princeville
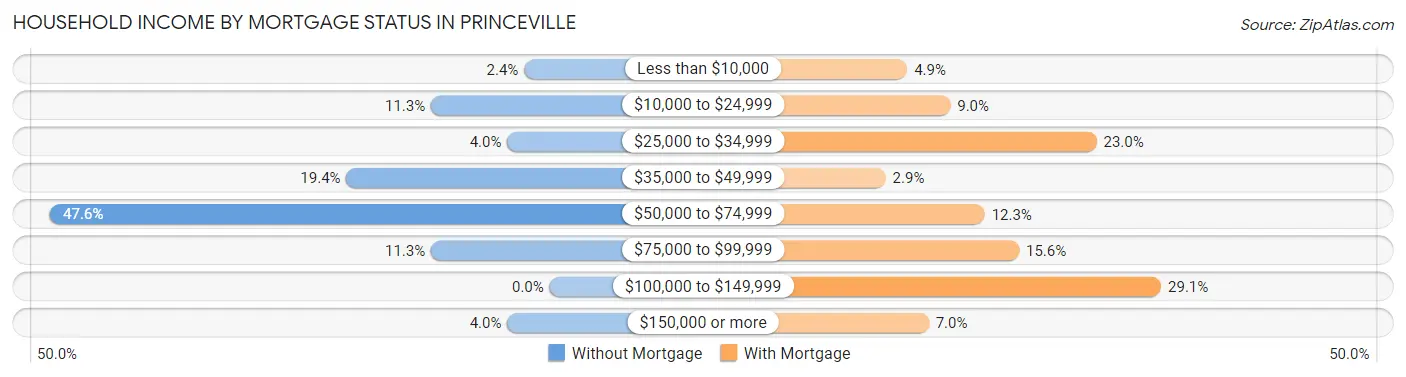
| Household Income | Without Mortgage | With Mortgage |
| Less than $10,000 | 3 (2.4%) | 12 (4.9%) |
| $10,000 to $24,999 | 14 (11.3%) | 22 (9.0%) |
| $25,000 to $34,999 | 5 (4.0%) | 56 (23.0%) |
| $35,000 to $49,999 | 24 (19.4%) | 7 (2.9%) |
| $50,000 to $74,999 | 59 (47.6%) | 30 (12.3%) |
| $75,000 to $99,999 | 14 (11.3%) | 38 (15.6%) |
| $100,000 to $149,999 | 0 (0.0%) | 71 (29.1%) |
| $150,000 or more | 5 (4.0%) | 17 (7.0%) |
| Total | 124 (100.0%) | 244 (100.0%) |
Property Value to Household Income Ratio in Princeville
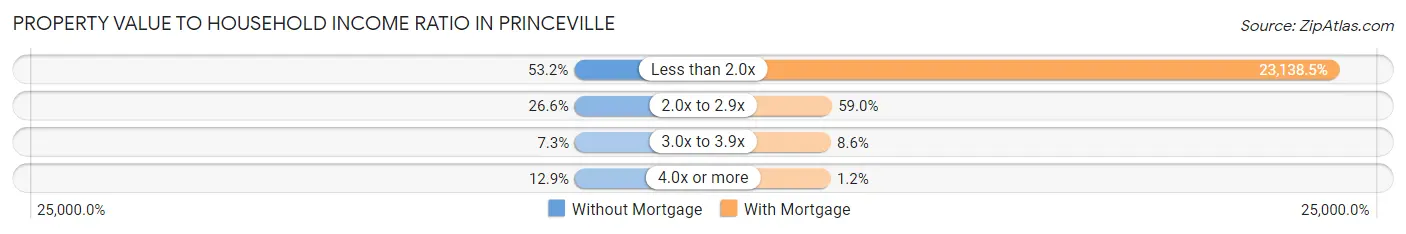
| Value-to-Income Ratio | Without Mortgage | With Mortgage |
| Less than 2.0x | 66 (53.2%) | 56,458 (23,138.5%) |
| 2.0x to 2.9x | 33 (26.6%) | 144 (59.0%) |
| 3.0x to 3.9x | 9 (7.3%) | 21 (8.6%) |
| 4.0x or more | 16 (12.9%) | 3 (1.2%) |
| Total | 124 (100.0%) | 244 (100.0%) |
Real Estate Taxes by Mortgage Status in Princeville
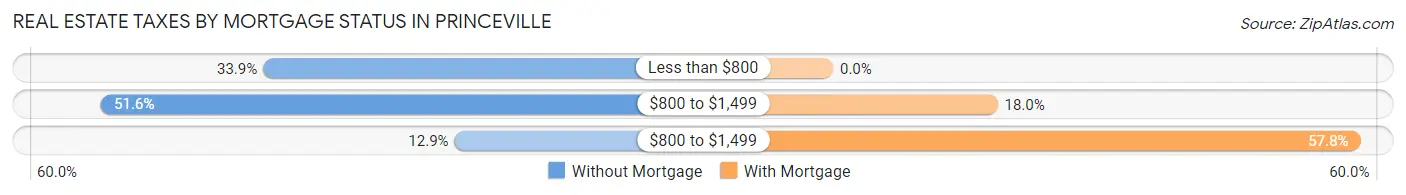
| Property Taxes | Without Mortgage | With Mortgage |
| Less than $800 | 42 (33.9%) | 0 (0.0%) |
| $800 to $1,499 | 64 (51.6%) | 44 (18.0%) |
| $800 to $1,499 | 16 (12.9%) | 141 (57.8%) |
| Total | 124 (100.0%) | 244 (100.0%) |
Health & Disability in Princeville
Health Insurance Coverage by Age in Princeville
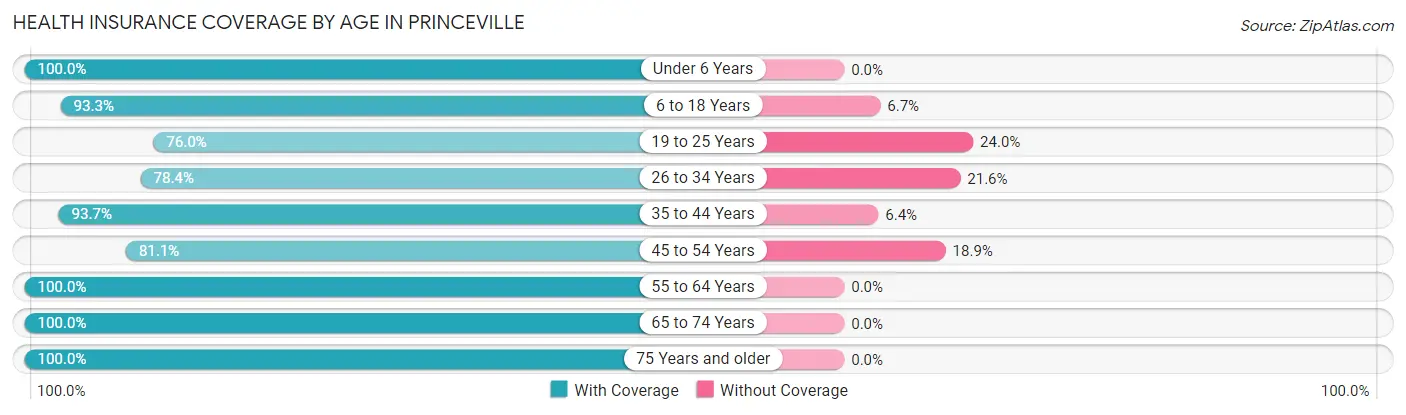
| Age Bracket | With Coverage | Without Coverage |
| Under 6 Years | 64 (100.0%) | 0 (0.0%) |
| 6 to 18 Years | 374 (93.3%) | 27 (6.7%) |
| 19 to 25 Years | 98 (76.0%) | 31 (24.0%) |
| 26 to 34 Years | 105 (78.4%) | 29 (21.6%) |
| 35 to 44 Years | 177 (93.6%) | 12 (6.4%) |
| 45 to 54 Years | 133 (81.1%) | 31 (18.9%) |
| 55 to 64 Years | 238 (100.0%) | 0 (0.0%) |
| 65 to 74 Years | 252 (100.0%) | 0 (0.0%) |
| 75 Years and older | 59 (100.0%) | 0 (0.0%) |
| Total | 1,500 (92.0%) | 130 (8.0%) |
Health Insurance Coverage by Citizenship Status in Princeville
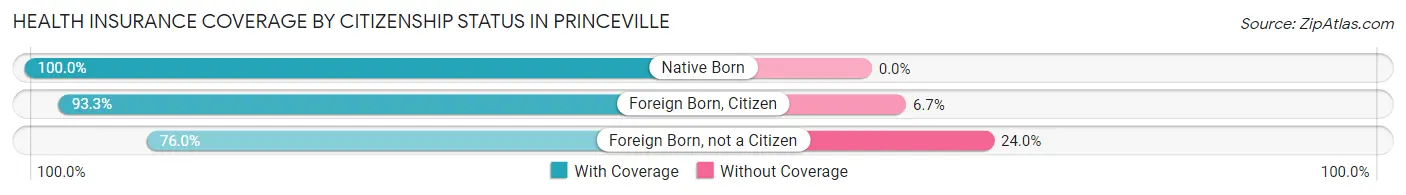
| Citizenship Status | With Coverage | Without Coverage |
| Native Born | 64 (100.0%) | 0 (0.0%) |
| Foreign Born, Citizen | 374 (93.3%) | 27 (6.7%) |
| Foreign Born, not a Citizen | 98 (76.0%) | 31 (24.0%) |
Health Insurance Coverage by Household Income in Princeville
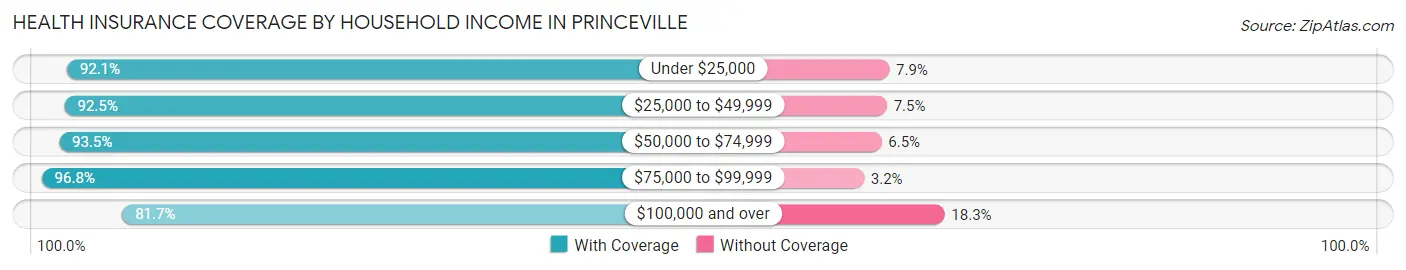
| Household Income | With Coverage | Without Coverage |
| Under $25,000 | 244 (92.1%) | 21 (7.9%) |
| $25,000 to $49,999 | 297 (92.5%) | 24 (7.5%) |
| $50,000 to $74,999 | 419 (93.5%) | 29 (6.5%) |
| $75,000 to $99,999 | 333 (96.8%) | 11 (3.2%) |
| $100,000 and over | 201 (81.7%) | 45 (18.3%) |
Public vs Private Health Insurance Coverage by Age in Princeville
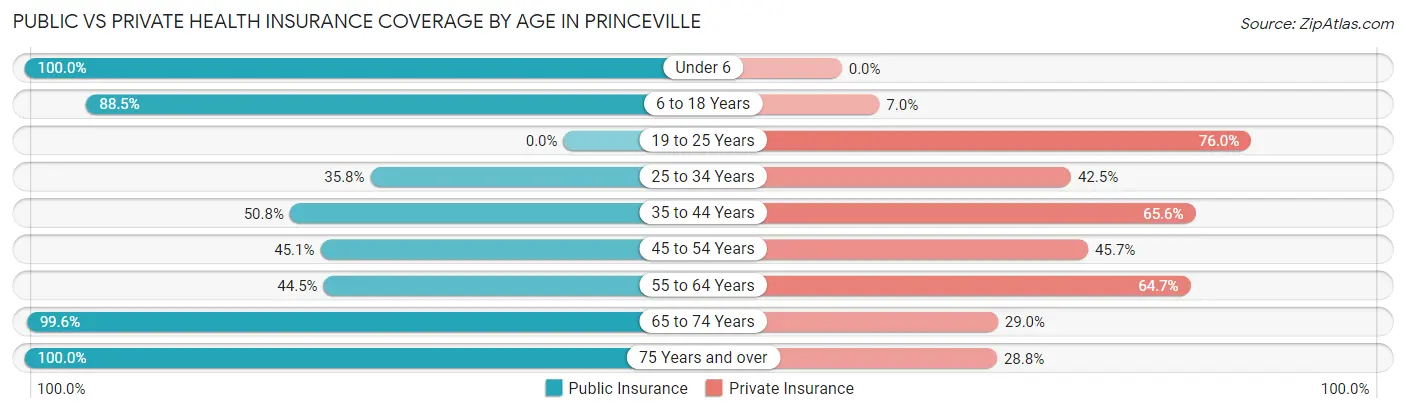
| Age Bracket | Public Insurance | Private Insurance |
| Under 6 | 64 (100.0%) | 0 (0.0%) |
| 6 to 18 Years | 355 (88.5%) | 28 (7.0%) |
| 19 to 25 Years | 0 (0.0%) | 98 (76.0%) |
| 25 to 34 Years | 48 (35.8%) | 57 (42.5%) |
| 35 to 44 Years | 96 (50.8%) | 124 (65.6%) |
| 45 to 54 Years | 74 (45.1%) | 75 (45.7%) |
| 55 to 64 Years | 106 (44.5%) | 154 (64.7%) |
| 65 to 74 Years | 251 (99.6%) | 73 (29.0%) |
| 75 Years and over | 59 (100.0%) | 17 (28.8%) |
| Total | 1,053 (64.6%) | 626 (38.4%) |
Disability Status by Sex by Age in Princeville
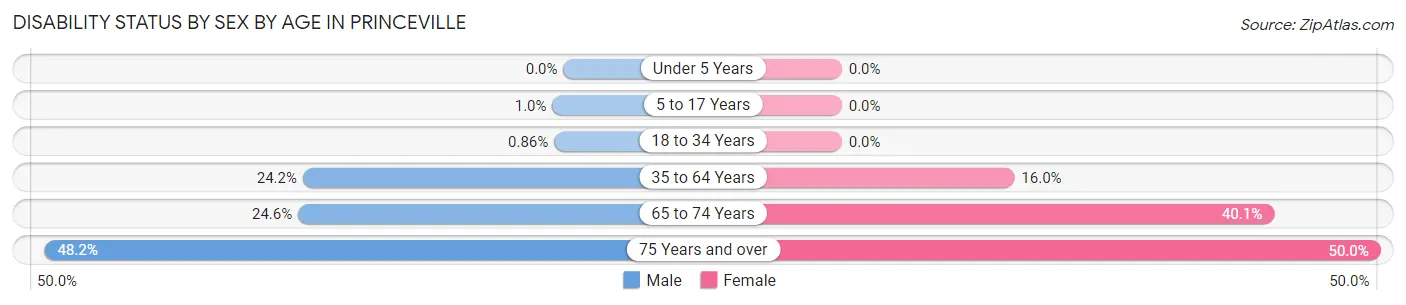
| Age Bracket | Male | Female |
| Under 5 Years | 0 (0.0%) | 0 (0.0%) |
| 5 to 17 Years | 1 (1.0%) | 0 (0.0%) |
| 18 to 34 Years | 1 (0.9%) | 0 (0.0%) |
| 35 to 64 Years | 81 (24.2%) | 41 (16.0%) |
| 65 to 74 Years | 16 (24.6%) | 75 (40.1%) |
| 75 Years and over | 13 (48.1%) | 16 (50.0%) |
Disability Class by Sex by Age in Princeville
Disability Class: Hearing Difficulty
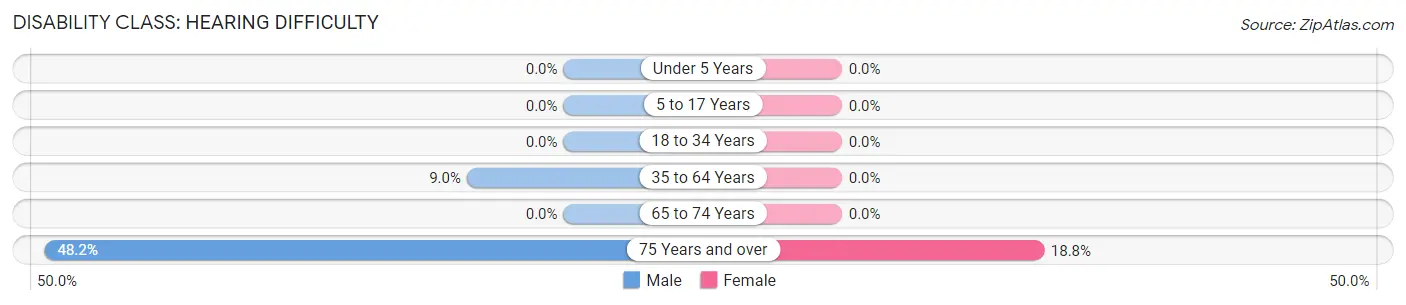
| Age Bracket | Male | Female |
| Under 5 Years | 0 (0.0%) | 0 (0.0%) |
| 5 to 17 Years | 0 (0.0%) | 0 (0.0%) |
| 18 to 34 Years | 0 (0.0%) | 0 (0.0%) |
| 35 to 64 Years | 30 (9.0%) | 0 (0.0%) |
| 65 to 74 Years | 0 (0.0%) | 0 (0.0%) |
| 75 Years and over | 13 (48.1%) | 6 (18.8%) |
Disability Class: Vision Difficulty
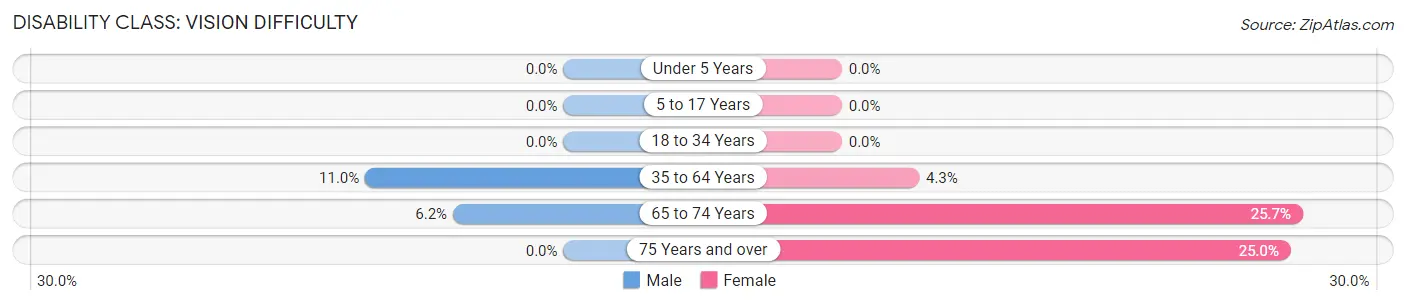
| Age Bracket | Male | Female |
| Under 5 Years | 0 (0.0%) | 0 (0.0%) |
| 5 to 17 Years | 0 (0.0%) | 0 (0.0%) |
| 18 to 34 Years | 0 (0.0%) | 0 (0.0%) |
| 35 to 64 Years | 37 (11.0%) | 11 (4.3%) |
| 65 to 74 Years | 4 (6.1%) | 48 (25.7%) |
| 75 Years and over | 0 (0.0%) | 8 (25.0%) |
Disability Class: Cognitive Difficulty
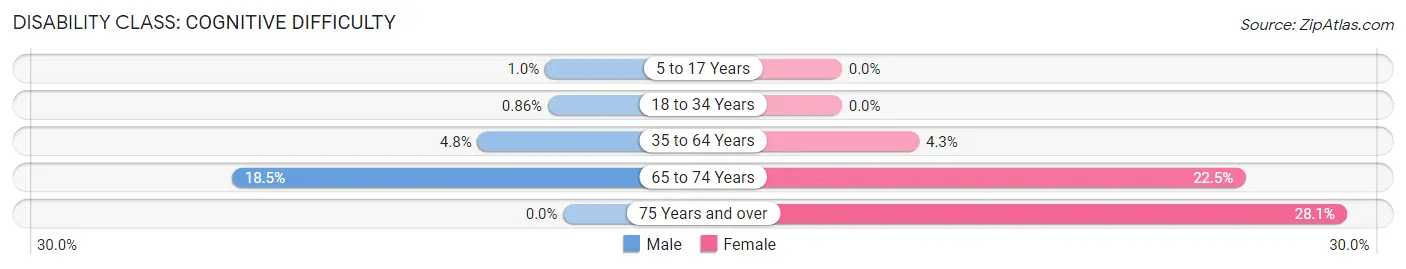
| Age Bracket | Male | Female |
| 5 to 17 Years | 1 (1.0%) | 0 (0.0%) |
| 18 to 34 Years | 1 (0.9%) | 0 (0.0%) |
| 35 to 64 Years | 16 (4.8%) | 11 (4.3%) |
| 65 to 74 Years | 12 (18.5%) | 42 (22.5%) |
| 75 Years and over | 0 (0.0%) | 9 (28.1%) |
Disability Class: Ambulatory Difficulty
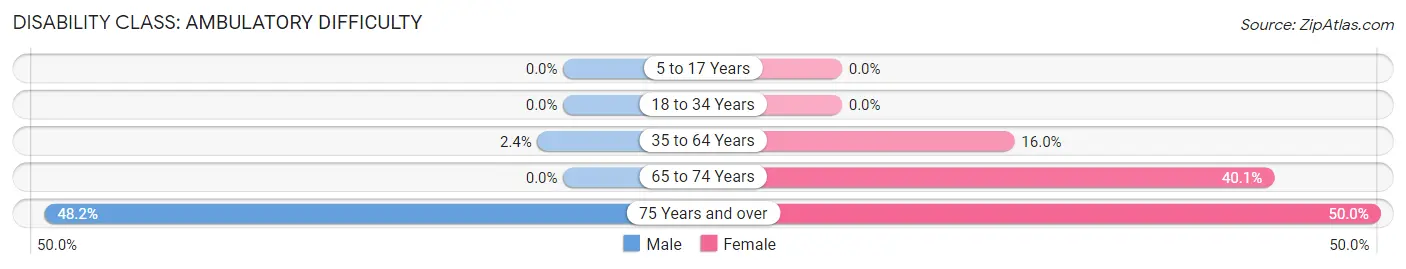
| Age Bracket | Male | Female |
| 5 to 17 Years | 0 (0.0%) | 0 (0.0%) |
| 18 to 34 Years | 0 (0.0%) | 0 (0.0%) |
| 35 to 64 Years | 8 (2.4%) | 41 (16.0%) |
| 65 to 74 Years | 0 (0.0%) | 75 (40.1%) |
| 75 Years and over | 13 (48.1%) | 16 (50.0%) |
Disability Class: Self-Care Difficulty
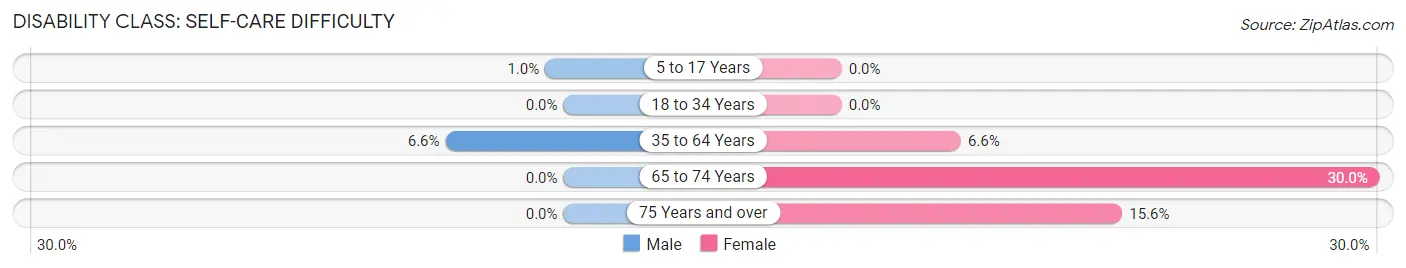
| Age Bracket | Male | Female |
| 5 to 17 Years | 1 (1.0%) | 0 (0.0%) |
| 18 to 34 Years | 0 (0.0%) | 0 (0.0%) |
| 35 to 64 Years | 22 (6.6%) | 17 (6.6%) |
| 65 to 74 Years | 0 (0.0%) | 56 (29.9%) |
| 75 Years and over | 0 (0.0%) | 5 (15.6%) |
Technology Access in Princeville
Computing Device Access in Princeville
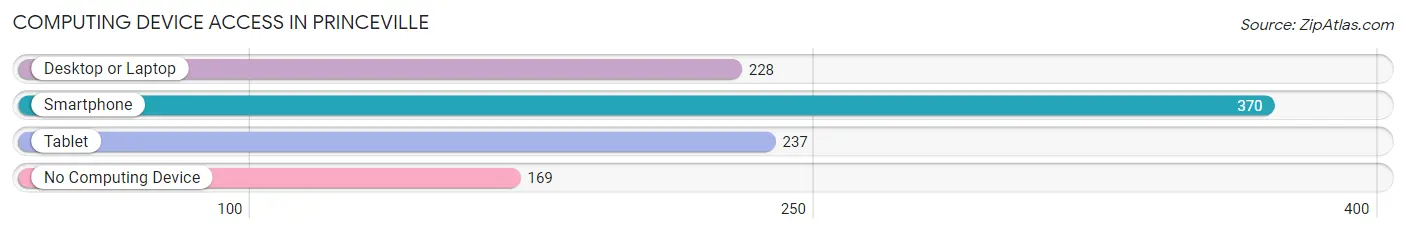
| Device Type | # Households | % Households |
| Desktop or Laptop | 228 | 38.6% |
| Smartphone | 370 | 62.6% |
| Tablet | 237 | 40.1% |
| No Computing Device | 169 | 28.6% |
| Total | 591 | 100.0% |
Internet Access in Princeville
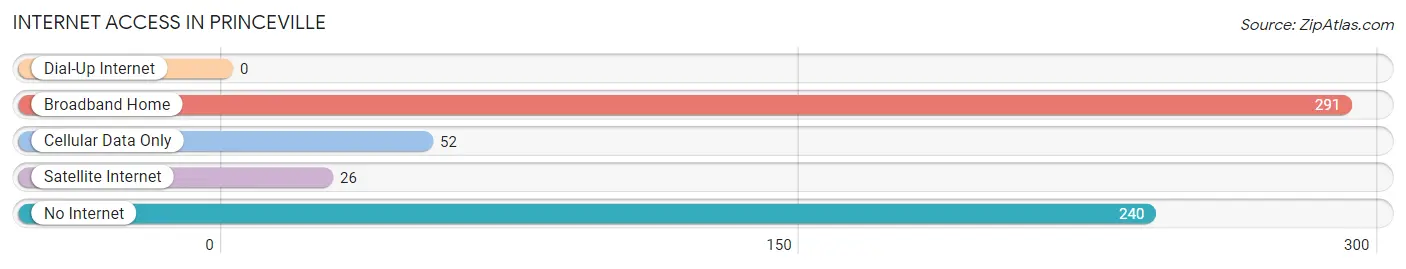
| Internet Type | # Households | % Households |
| Dial-Up Internet | 0 | 0.0% |
| Broadband Home | 291 | 49.2% |
| Cellular Data Only | 52 | 8.8% |
| Satellite Internet | 26 | 4.4% |
| No Internet | 240 | 40.6% |
| Total | 591 | 100.0% |
Princeville Summary
Princeville, North Carolina is a small town located in Edgecombe County, North Carolina. It is the oldest town in the United States incorporated by African Americans. The town was founded in 1865 by former slaves who had been freed by the Emancipation Proclamation. The town was named after Prince Reece, a former slave who had purchased the land from his former master.
Geography
Princeville is located in the Coastal Plain region of North Carolina, approximately 30 miles east of Raleigh. The town is situated on the Tar River, which is a tributary of the Neuse River. The town is surrounded by rolling hills and farmland, and is located near the town of Tarboro. The town has a total area of 1.2 square miles, all of which is land.
History
Princeville was founded in 1865 by former slaves who had been freed by the Emancipation Proclamation. The town was named after Prince Reece, a former slave who had purchased the land from his former master. The town was incorporated in 1885, making it the oldest town in the United States incorporated by African Americans.
In the late 19th century, Princeville was a thriving community with a variety of businesses, churches, and schools. The town was home to a number of prominent African American leaders, including John Merrick, who founded the North Carolina Mutual Life Insurance Company.
In 1999, the town was devastated by Hurricane Floyd, which caused extensive flooding and damage. The town was rebuilt with the help of the Federal Emergency Management Agency (FEMA) and other organizations.
Economy
The economy of Princeville is largely based on agriculture. The town is home to a number of farms, which produce a variety of crops, including corn, soybeans, and cotton. The town is also home to a number of small businesses, including restaurants, convenience stores, and auto repair shops.
Demographics
As of the 2010 census, the population of Princeville was 2,093. The racial makeup of the town was 95.3% African American, 2.7% White, 0.3% Native American, 0.2% Asian, and 1.5% from other races. The median household income was $25,938, and the median family income was $30,938.
Conclusion
Princeville, North Carolina is a small town with a rich history. It was founded in 1865 by former slaves, and is the oldest town in the United States incorporated by African Americans. The town is situated on the Tar River, and is surrounded by rolling hills and farmland. The economy of Princeville is largely based on agriculture, and the town is home to a number of small businesses. As of the 2010 census, the population of Princeville was 2,093, and the racial makeup of the town was 95.3% African American.
Common Questions
What is Per Capita Income in Princeville?
Per Capita income in Princeville is $19,444.
What is the Median Family Income in Princeville?
Median Family Income in Princeville is $57,013.
What is the Median Household income in Princeville?
Median Household Income in Princeville is $50,938.
What is Income or Wage Gap in Princeville?
Income or Wage Gap in Princeville is 13.6%.
Women in Princeville earn 86.4 cents for every dollar earned by a man.
What is Inequality or Gini Index in Princeville?
Inequality or Gini Index in Princeville is 0.39.
What is the Total Population of Princeville?
Total Population of Princeville is 1,630.
What is the Total Male Population of Princeville?
Total Male Population of Princeville is 665.
What is the Total Female Population of Princeville?
Total Female Population of Princeville is 965.
What is the Ratio of Males per 100 Females in Princeville?
There are 68.91 Males per 100 Females in Princeville.
What is the Ratio of Females per 100 Males in Princeville?
There are 145.11 Females per 100 Males in Princeville.
What is the Median Population Age in Princeville?
Median Population Age in Princeville is 39.8 Years.
What is the Average Family Size in Princeville
Average Family Size in Princeville is 3.7 People.
What is the Average Household Size in Princeville
Average Household Size in Princeville is 2.8 People.
How Large is the Labor Force in Princeville?
There are 711 People in the Labor Forcein in Princeville.
What is the Percentage of People in the Labor Force in Princeville?
56.3% of People are in the Labor Force in Princeville.
What is the Unemployment Rate in Princeville?
Unemployment Rate in Princeville is 11.4%.