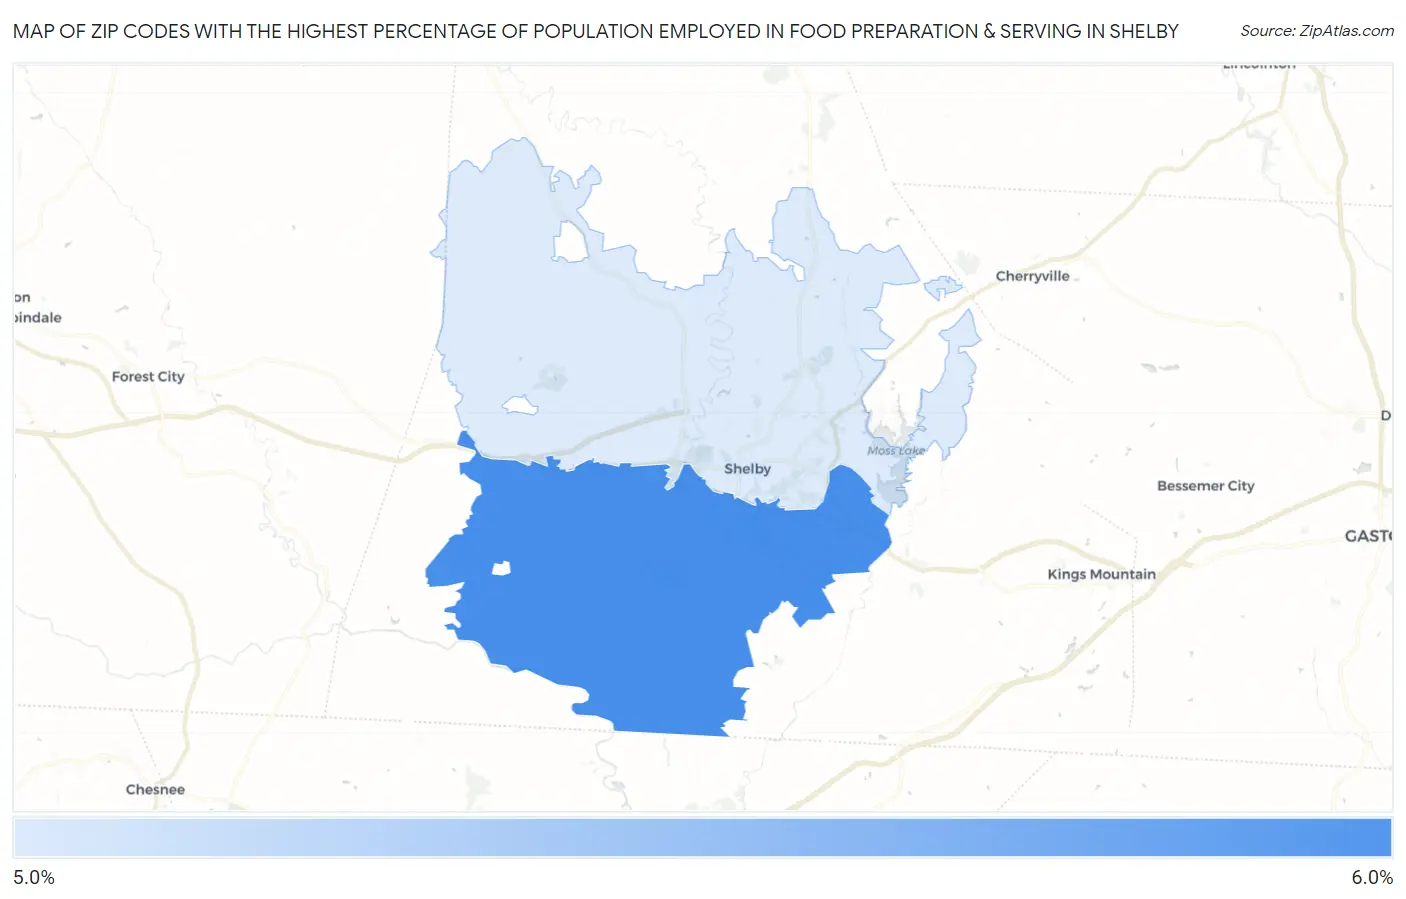
Zip Codes with the Highest Percentage of Population Employed in Food Preparation & Serving in Shelby, NC
RELATED REPORTS & OPTIONS
Food Preparation & Serving
Shelby
Compare Zip Codes
Map of Zip Codes with the Highest Percentage of Population Employed in Food Preparation & Serving in Shelby
5.3%
5.8%
Zip Codes with the Highest Percentage of Population Employed in Food Preparation & Serving in Shelby, NC
| Zip Code | % Employed | vs State | vs National | |
| 1. | 28152 | 5.8% | 5.3%(+0.549)#263 | 5.3%(+0.554)#9,898 |
| 2. | 28150 | 5.3% | 5.3%(+0.032)#327 | 5.3%(+0.037)#11,681 |
1
Common Questions
What are the Top Zip Codes with the Highest Percentage of Population Employed in Food Preparation & Serving in Shelby, NC?
Top Zip Codes with the Highest Percentage of Population Employed in Food Preparation & Serving in Shelby, NC are:
What zip code has the Highest Percentage of Population Employed in Food Preparation & Serving in Shelby, NC?
28152 has the Highest Percentage of Population Employed in Food Preparation & Serving in Shelby, NC with 5.8%.
What is the Percentage of Population Employed in Food Preparation & Serving in Shelby, NC?
Percentage of Population Employed in Food Preparation & Serving in Shelby is 3.7%.
What is the Percentage of Population Employed in Food Preparation & Serving in North Carolina?
Percentage of Population Employed in Food Preparation & Serving in North Carolina is 5.3%.
What is the Percentage of Population Employed in Food Preparation & Serving in the United States?
Percentage of Population Employed in Food Preparation & Serving in the United States is 5.3%.